Embed Size (px)
Citation preview

Domestic Spillovers and Foreign Networks in
Exporting∗
Shibi He†
Volodymyr Lugovskyy‡
July 31, 2018
Abstract
We explore how two separate effects impact an export’s firm’s choice of new
export destinations. The first effect, Domestic Spillovers, occurs when other do-
mestic firms export a good to a given country. The second, Foreign Networks,
refers to links to other countries via a firm’s trading partners. Using data from
Colombian exporting firms, which we matched with data from their Chilean
counterpart importing and exporting firms, from 2007-2016, we show that both
effects matter and that they amplify each other. Together, these effects have
a greater impact on a firm’s choice of new export destinations than geographic
proximity measures, import and export growth, and market size combined. We
further show that Domestic spillovers are relatively more important than Foreign
Networks. This is particularly true for identifying persistent exporters, which ex-
port to a new destination for more than a year.
Keywords: Firm-level, Spillover, Networks, Trade.
JEL Classification Number: F1, L14
∗We thank Felipe Benguria, Emerson Melo, and James Rauch for helpful comments.†Department of Economics, Indiana University, Wylie Hall, 100 S. Woodlawn, Bloomington, IN
47405-7104; e-mail: [email protected]‡Department of Economics, Indiana University, Wylie Hall Rm 301, 100 S. Woodlawn, Blooming-
ton, IN 47405-7104; e-mail: [email protected]
1
1 Introduction
Expanding to new foreign markets is important for export diversification and economic
growth (Hausmann and Rodrik, 2003). However, the expansion process is subject to
sizeable information uncertainty and risk. To alleviate this risk, firms often use three
strategies. First, they study the exports of other domestic firms, which is termed the
Domestic Spillover effect (Greenaway et al., 2004; Silvente and Gimenez, 2007; Koenig
et al., 2010). Second, they leverage their own experiences by employing so-called Se-
quential Exporting strategy (Eaton et al., 2009; Albornoz et al., 2012; Nguyen, 2012).
Third, they look for trading partners who can help them secure new trading partners.
This is the Foreign Export Network effect (Chaney, 2014; He, 2018).
We provide three major contributions to the existing literature on this topic. We are
the first to assess the joint effects of domestic spillovers and foreign networks, while
keeping the sequential exporting effect constant. Previous research studied these ef-
fects in isolation. We also use a finer, firm-to-firm measure of networks, which is more
accurate and better addresses the problem of unobserved correlates than the previously-
used firm-to-country measure of networks. Finally, we explore whether, in addition to
previously explored foreign exporting networks, foreign importing networks and domes-
tic importing networks also have an effect on a firm’s choice of new export destinations.
Our empirical approach is as follows. Using transaction-level data of Colombian ex-
ports from 2007-2016, we first identified 183 Colombian exporting firms that originally
exported only to Chile and later expanded to a new destination. Using Chilean firm
names recorded in the Colombian Exports and Chilean Imports transaction data from
2007-2016, we attempted to match these 183 Colombian firms to their Chilean im-
porting counterparts. We successfully matched 163 Colombian firms and dropped the
remaining 20 unmatched firms. These matches, along with the additional transaction
dataset on Chilean Exports, allowed us to construct two network dummy variables. The
Chilean Exports Network dummy equals one for any destination to which a matched
Chilean firm exports, and equals zero for all other destinations. Similarly, the Chilean
Imports Network dummy is equal to one for all destinations from which the matched
Chilean firm imports, and zero otherwise. Next, we matched Colombian exports and
imports data (using additional Colombian transaction-level Imports data) and con-
structed the Colombian Imports Network dummy for each of the 163 firms. We set
2

this variable to one for all destinations from which a firm imports, and to zero otherwise.
Additionally, for each of the matched 163 Colombian firms, we constructed a Spillover
dummy, equal to one for all destinations for which a product of the expanding firm
was exported by at least one other Colombian firm in the previous year, and zero
otherwise. We also complemented the constructed set of dummies with the standard
control variables used by Chaney (2014), i.e., geographic proximity measures, import
and export growth rates, and market size.
Using the constructed dataset, we employed a dynamic Probit model1 to explore which
factors affect the choice of new export destinations by a Colombian export firm in year
t+ 1, given that in year t it exported only to Chile. This approach allowed us to con-
trol for the sequential exporting effect—by construction, it is exactly the same for all
firms in our sample—and to jointly estimate Domestic Spillover (DS), Foreign Export
Network (FEN), Domestic Import Network, and Foreign Import Network effects at the
firm-to-firm level.
We found that, out of these four, only DS and FEN have statistically significant effects
on the expansion path. Jointly, DS and FEN have a more important effect than all
other factors (including proximity, import and export growth rates, and market size)
combined. While DS has a relatively stronger marginal effect, both DS and FEN have
economically significant effects, which amplify each other. For example, the probability
of choosing the U.S. as the next export destination is only 2.7% if neither of the DS
and FEN effects is present, 8% with the FEN effect only, 15.6% with the DS effect
only, and 31.5% if both FEN and DS effects are present.2
We also found that omitting the Domestic Spillover dummy from the empirical spec-
ification significantly increases the magnitudes of almost all other coefficients in the
Probit specification,3 suggesting a pronounced omitted variables bias. Omitting the
all three Network dummies, on the other hand, has only a marginal effect on all other
coefficients. Thus, the omitted variables bias seems to be a strong concern for omitting
1As we show in the Appendix Table A1, the results are very similar to those obtained with thedynamic Logit model.
2The corresponding numbers are 0.3%, 1.2%, 3.2%, 9.3% for Mexico, 0.3%, 1.4%, 3.6%, 10.2% forHonduras, 0.05%, 0.3%, 0.9%, 3.2% for Ukraine, and 0.1%, 0.4%, 1.2%, 4.2% for Zimbabwe.
3Namely, the FEN coefficient increases by 1.5 times, many other coefficients increase by 2-3 times.
3

the Spillover dummy, but not for omitting the Network dummies.
Most new Colombian export firms are short-lived: Eaton et al. (2007) showed that two-
thirds of them do not survive to the second year. For this reason, we also examined
which factors contribute to persistent export expansion. To this end, we introduced
a new dependent variable, the Survival dummy, which equals one if exports to a new
destination continue for more than a year, and zero otherwise.4 By using the same set
of dependent variables, we found that only the DS has a statistically significant effect
on the Survival. That is, for firms with minimal export networks and only one prior
export country, domestic spillovers is the single and most important factor in persistent
exporting to new destinations. This result re-emphasizes the importance of spillovers
generated by export pioneers for other firms (Hausmann and Rodrik, 2003) and the
fact that pioneers face high risks of failure (Wagner and Zahler, 2015).
We recognize that our results are, at best, representative only for export firms from
developing countries that initially export to only one other (developing) country. At
the same time, the constraints imposed on our sample by the data availability have
certain advantages when examining networks effects. We focused on the exporters with
a minimal FEN—typically consisting of just one Chilean firm. As demonstrated both
theoretically and empirically by Chaney (2014), these firms are least likely to expand,
as their networks are minimal. Thus, showing that the FEN have both statistically
and economically significant effects on expansion path even for the smallest possible
networks provides even stronger support for network theory in this context.
Furthermore, focusing on firms with a single trade partner allowed to downplay ad-
ditional, more complex effects present in larger networks, such as reputation effects,
homophile5, segregation, etc.6 For example, a firm with multiple trading partners is
potentially likely to have a stronger reputation in the eyes of the potential new part-
ners, as multiple trading partners project higher quality and reliability than a firm with
only few partners. Thus, even if a firm meets a new partner without direct involve-
4Similarly to previous studies on export spells of Colombian firms, only one third of new exportexpansions results in the persistent exporting.
5The widely known analog of homophily effect in trade is Linder effect—firms are more likely toexport to countries with the similar income per capita as the one in their own country.
6See, for example, Currarini et al. (2009) and Jackson and Zenou (2015) for a more detaileddescription of these and other additional effects in larger social networks.
4

ment of the existing partner, being a part of the larger network might have facilitated
the match. Focusing on firms with a minimal network allowed us to isolate these effects.
The rest of the paper is organized as follows. Section 2 discusses related literature.
Section 3 provides a detailed data description. Section 4 presents empirical models and
the estimation results. Section 5 provides robustness checks. Section 6 concludes.
2 Related Literature
This paper contributes to several strands of literature. Most directly, it adds to a
large literature on firms’ expansion in international markets. The existing literature
has identified three strategies that firms use to expand into new markets: domestic in-
formation spillover, foreign networks, and sequential exporting.
The literature on domestic spillovers is likely the largest one among the three. It
emphasizes the pool of existing exporters as an important source of information for
other firms (Koenig et al., 2010). Firms tend to learn about profits, requirements,
and challenges in the overseas markets by observing other firms’ exporting experience,
and they tend to imitate the export behavior of the more successful, more experienced
leaders. Clerides et al. (1998), Silvente and Gimenez (2007), Koenig (2009), Koenig
et al. (2010), and Choquette and Meinen (2015) used firm-level data from different
countries to show that a firm’s export decision and/or the volume exported by the firm
are positively affected by their neighboring firms.7 Aitken et al. (1997), Greenaway
et al. (2004), and Kneller and Pisu (2007) identified multinationals as one of the most
important sources of information spillover. Iacovone and Javorcik (2010) used Mexican
export data to show that once a firm begins exporting a new product, other firms will
soon export the same products. Wagner and Zahler (2015) explored detailed data on
new exporters in Chile and found that followers are 40% more likely to enter a product
if a pioneer survives more than one year of exporting that product.
7There is also theoretical and empirical literature on the negative effect of spillovers on firms’export decisions. For example, Ciliberto and Jakel (2017) documented the negative effects of presentcompetitors on foreign market entry, but they only focus on the superstar exporters. Barrios et al.(2003) and Bernard and Jensen (2004) found no evidence of spillover effects on firms’ decisions toexport, but they didn’t address the expansion to new markets for firms that already export.
5

Our contribution to this literature is twofold. First, when examining the spillover ef-
fects, we controlled for other important effects, including network and sequential-export
effects. Second, we were able to rank the magnitude of the spillover effect versus other
effects. We found that for the firms with small exporting networks, the spillover effect
is much more important. Specifically, it has the highest economic significance for the
expansion path, and it is the only statistically significant factor affecting the survival
of exports to a new destinations for more than a year.8 Importantly, omitting the
spillover effect in the empirical specification leads to very pronounced upward biases
of other effect.
The literature on networks and trade dates back to Rauch (1999), who introduced the
idea that informational frictions dampen trade, and that social networks between buy-
ers and sellers help reducing these frictions and promote trade.9 While a more recent
strand of the literature empirically estimates the trade-creating effect of networks using
country-specific case studies,10 it is relatively silent on the expansion path at the firm
level.
Do exporting firms rely on their networks of existing trade partners to search for new
trade partners? This question was first positively answered by Chaney (2014), who
provided the reduced-form evidence of the effect of firm-to-country networks on the
export expansion path of French firms11 and formally modeled the remote search for
new partners through existing trading partners. Building on Chaney (2014)’s work,
we provide an additional test of the effect of networks on trade expansion by using a
finer firm-to-firm measure of networks of Colombian and Chilean firms. We show that
firm-to-firm networks do have a positive effect on the choice of new export destinations
even after controlling for the spillover and sequential-exporting effects. Quantitatively,
we show that a Colombian firm is 0.42% more likely to choose a new export destination
8Other determinants of firm survival in export markets include export sunk and fixed costs, dis-tance, and previous export experience (Bekes and Murakozy, 2012; Impullitti et al., 2013; Albornozet al., 2016; Araujo et al., 2016). Cadot et al. (2013) found evidence of positive spillover effects (i.e.existence of cross-firm externalities) on export survival.
9See also Rauch (2001), Chaney (2016), and Bernard and Moxnes (2018) for excellent surveys onnetworks and trade.
10Rauch and Trindade (2002), Combes et al. (2005), Greaney (2009), Garmendia et al. (2012), andAleksynska and Peri (2014) while using different methodologies and/or datasets, arrive at the sameconclusion that the cultural, social, and business networks can largely facilitate international trade.
11Specifically he showed that firms are more likely to choose a new export destination that is closelyrelated to the network they belong to.
6
if its Chilean trade partners exported to that country in the previous period.
In addition, the firm-to-firm measure allowed us to address the problem of unobserved
correlates highlighted by Muendler and Rauch (2018). According to the network lit-
erature, firms use the ‘base’ markets (i.e., the markets they have already entered) to
search for trading partners in new, geographically close markets. Muendler and Rauch
(2018) argued that, alternatively, these markets might be targeted with higher proba-
bility not necessarily because of the network search from the base markets, but because
they are similar and close to base markets. Empirically, it is difficult to distinguish
between the two channels with the firm-to-country measure of networks. The firm-
to-firm measure of networks helps to resolve this problem, since network search will
be attributed only to those new markets to which only firm’s trading partners export.12
Our paper is also related to a new but flourishing literature that focuses on the firm-
to-firm connections in international trade. The vast majority of world trade flow is
between firms. However, many empirical studies are restricted to aggregated trade,
due to the scarcity of the detailed trade transaction data between firms. Recently,
with the increasing availability of firm-to-firm trade data, the literature has started
to explore the role of the connections between individual exporters and importers.
For example, Rauch and Watson (2004), Antras and Costinot (2011), Petropoulou
(2008), and Chaney (2014) modeled intermediaries as agents that facilitate matching
between exporters and foreign buyers. Benguria (2015) proposed a model to analyze the
sorting and matching between exporting and importing firms and provides empirical
evidence in support of this theory. Other papers have examined the cross-section
and/or evolution of firm-to-firm connections in trade (Eaton et al., 2009; Blum et al.,
2010, 2012; Bernard et al., 2014, 2018; Dragusanu, 2014; Monarch, 2014). We show
that these connections are critical for a firm’s choice of new export destinations.
12Potentially, the problem of unobserved correlates might be present when identifying the spillovereffects. We address it in the robustness checks section.
7
3 Data Description
Our primary data source is the customs records of Colombian and Chilean import
and export transactions between 2007 and 2016.13 A transaction record includes the
firm’s national tax ID number, the product code at Harmonized System (HS) 10-digit
level,14 the value of the transaction in US dollars, the country of destination for export
data, and the country of origin for import data. Importantly, in the Colombian export
data, we also observe the names of foreign importing firms, which allows us to identify
Chilean firms that import from Colombia.15
Dependent Variables: Entry and Survival. Using Colombian transaction-level
export data, we first identified 183 Colombian exporters that originally exported only
to Chile and later expanded to new destinations. Using Chilean firm names recorded in
the Colombian Exports and Chilean Imports transaction data, we successfully matched
163 of these Colombian firms to their Chilean importing counterparts from 2007-2016.16
For these 163 Colombian firms, we define the Entry dummy, Entryi,c,t+1, to be equal to
one if, conditional on exporting only to Chile in year t and to a new destination in year
t+1, it exported to country c, and zero if it did not export to country c. If Entryi,c,t+1,
is equal to one, and firm i exported to country c for longer than one calendar year, we
define the Survival dummy, Survivali,c,t+1, to be equal to one. Survivali,c,t+1 is equal
to zero if new exporting was not shipped to country c, or if exporting to c lasted for
less than one calendar year.
We considered 183 countries as potential new export destinations for matched Colom-
bian firms, which gave us a total of 29,829 (=(163 firms) × (183 countries)) possible
firm-destination combinations. As shown in the first column of Table 1, we found
that Entry dummy equals one for 237 of these combinations, whereas Survival dummy
13The data is obtained from Datamyne, a company that specializes in documenting import andexport transactions in Americas. For more detail please see www.datamyne.com.
14In our paper we need the product dimension only for the Colombian part of the data, which is atHS10.
15The names of these Chilean firms are not standardized in the Colombian exports data. Thereare instances in which the name of the same firm and its address are recorded differently (e.g., usingabbreviations, dots, dashes, extra spaces, etc.). We deal with this problem by standardizing thespelling of the names and by comparing these names to the standardized names of firms in theChilean imports data. The detailed description of cleaning the exporters’ names is provided in theAppendix A.
16We drop the unmatched 20 Colombian exporting firms from our analysis.
8

equals one for only 62 of them. That is, conditional on expanding, a firm that previ-
ously exported only to Chile will export, on average, to 237/163=1.5 new destinations,
but only 26% (=(62/237)×100%) of these expansions will survive for more than one
calendar year.
Export and Import Network Dummies. The matches between Colombian ex-
porting and Chilean importing firms, along with the additional transaction dataset on
Chilean Exports, allowed us to construct two network dummy variables. The Chilean
Export Network dummy, ExpNetworki,c,t, equals one for all firm c’s destinations to
which any of its matched Chilean importing firms exports, and zero otherwise. We
observed that only 73 of these matched Chilean firms exported (on average to 4.9
destinations). As shown in Column 4 of Table 1, this gives us 370 ones and 29,829-
370=29,459 zeros for the Export Network dummy variable.
Similarly, the Chilean Import Network dummy, CHL ImpNetworki,c,t, is equal to
one for all destinations from which the matched Chilean firm imports and zero oth-
erwise. As shown in Column 5 of Table 1, we observe 998 ones and 28,831 zeros for
CHL ImpNetworki,c,t.
In addition, we matched Colombian exports and imports data and constructed the
Colombian Import Network dummy variable, COL ImpNetworki,c,t, for each of the
163 Colombian firms by setting it to one for each country c from which firm i imports
and to zero otherwise. We observed 571 ones and 29,258 zeros for the Colombian Im-
port Network dummy variable (see Column 6 of Table 1).
Domestic Spillover Dummy. For each of the matched 163 Colombian firms, we
constructed a Spillover dummy variable Spilloveri,c,t. For each expanding firm, we first
identified which HS 10-digit product was exported to the new export destination. We
then explored the Colombian transaction-level export data to see if there was any other
Colombian firm exporting the same product to the same destination in the previous
year. If yes, the Spillover dummy for that firm-destination pair, Spilloveri,c,t, was set
to one. If not, it was set to zero. As shown in Column 3 of Table 1, we observe 4,649
ones and 25,180 zeros for the Spillover dummy variable.
9

Other Variables. Following Chaney (2014), we also used six additional variables to
control for geographic proximity, import sources, market size, and export and import
growth.
(i) CHL ExpGrowthi,c,t measures the export growth to country c between years t and
t+ 1 of Chilean firms importing from the Colombian firm i :
CHL ExpGrowthi,c,t ≡∑j∈K
Exportj,c,t+1 − Exportj,c,tExportj,c,t
,
where K is the set of Chilean firms importing from the Colombian firm i.
(ii) Overall ImpGrowthc,t measures country c′s import growth from all other countries
between years t and t+ 1 :
Overall ImpGrowthc,t ≡∑c′
Importc,c′,t+1 − Importc,c′,tImportc,c′,t
The bilateral trade data was obtained from the United Nations Comtrade Database.
(iii)-(v) Using the bilateral distance data, we computed the proximities between Colom-
bia and other countries:
COL proximityc ≡1
DistCOL,c
;
between Chile and other countries:
CHL proximityc ≡1
DistCHL,c
;
and the average proximity of each country from the rest of the world:
Overall proximityc ≡1
N
∑c′
1
Distc′,c,
where N = 183 is the total number of countries in our sample. The data on bilateral
distances (DistCOL,c, DistCHL,c, Distc′,c,) is obtained from CEPII. It is calculated as
the population-weighted average of the distances between the main cities of two coun-
tries.
(vi) The country size of country c in year t, GDPc,t, is measured by its nominal GDP
(in billions of US dollars), obtained from the Penn World Tables.
10
Table 1 presents the summary statistics for each variable we use in the empirical spec-
ifications and Table 2 lists the correlation coefficients between these variables. Table
2 shows that the correlations between any two independent variables are rather low:
the highest correlation coefficients are around 0.3-0.44, and most of them are less than
0.1. The correlations between the dependent and independent variables are also rather
low: the highest ones for both Entry and Survival are with the Spillover dummy: 0.18
and 0.11 respectively.
Graphically, Figure 1 shows the geographic maps for the new destinations that the
Colombian firms expand to, as well as the export destinations of their peer firms
and their matched Chilean trade partners. The intensity of the color represents the
frequencies of exports. We can see that there is an overlap between the Colombian
firms’ new export destinations and the export destinations of their peer firms and
Chilean trade partners, suggesting that exporting firms may rely on both domestic
spillovers and foreign networks when choosing a new export destination.
4 Empirical Model and Estimation Results
In this section, we present the empirical model and explore to what extent firms rely
on domestic spillovers and foreign networks when choosing a new export destination.
Specifically, we use a dynamic Probit model to examine whether, conditional on ex-
panding its exports to a new destination, a Colombian firm i is more likely to choose
country c rather than any other country due to network and domestic spillover effects.
11

Tab
le1:
Sum
mar
ySta
tist
ics
CH
LC
OL
CO
LC
HL
Ove
rall
CH
LO
vera
llE
ntr
ySurv
ival
Spillo
ver
ExpN
etw
ork
ImpN
etw
ork
ImpN
etw
ork
pro
xim
ity
pro
xim
ity
pro
xim
ity
ExpG
row
thIm
pG
row
thG
DP
No.
ofO
bs.
29,8
2923
,790
29,8
2929
,829
29,8
2929
,829
29,8
29a
29,8
29b
29,8
29c
29,8
2929
,829
d29
,829
e
Mea
n0.
0079
0.00
260.
1559
0.01
240.
0335
0.01
910.
1744
0.11
330.
3162
0.02
9338
378.
853.
38×
107
Med
ian
00
00
00
0.09
90.
0841
0.26
780
269.
6993
25.9
426
Std
.Dev
.0.
0888
0.05
10.
3627
0.11
070.
1798
0.13
70.
2064
0.09
80.
2625
2.62
8189
3535
.81.
42×
108
Min
00
00
00
0.05
160.
053
0.09
7-2
.279
3-1
020.
1305
Max
11
11
11
1.36
330.
8645
3.28
3536
9.40
833.
38×
107
1.81×
109
No.
ofon
es23
762
4,64
937
099
857
1P
erce
nt
ofon
es0.
79%
0.26
%15
.59%
1.24
%3.
35%
1.91
%a,b
,cD
ata
on
pro
xim
ity
are
cou
ntr
y-s
pec
ific.
We
have
183
cou
ntr
ies
inou
rsa
mp
le,
an
dea
chof
them
isre
pea
ted
163
tim
esfo
rall
Colo
mb
ian
firm
s.d,e
Data
onOver
all
ImpGrowth
an
dG
DP
are
cou
ntr
y-y
ear-
spec
ific.
We
have
183
(cou
ntr
ies)×
9(y
ears
)=1,6
47
cou
ntr
y-y
ear
com
bin
ati
on
s.E
ach
com
bin
ati
on
isre
pea
ted
for
the
exp
an
din
gC
olo
mb
ian
firm
sin
the
corr
esp
on
din
gyea
r.
Tab
le2:
Cor
rela
tion
Coeffi
cien
tsB
etw
een
Var
iable
s
CH
LC
OL
CO
LC
HL
Ove
rall
CH
LO
vera
llE
ntr
ySurv
ival
Spillo
ver
ExpN
etw
ork
ImpN
etw
ork
ImpN
etw
ork
pro
xim
ity
pro
xim
ity
pro
xim
ity
ExpG
row
thIm
pG
row
thG
DP
Entr
y1
Surv
ival
0.57
1Spillo
ver
0.18
0.11
1E
xpN
etw
ork
0.12
0.03
0.09
1C
HL
ImpN
etw
ork
0.07
0.04
0.12
0.25
1C
OL
ImN
etw
ork
0.05
0.03
0.1
0.11
0.31
1C
OL
pro
xim
ity
0.15
0.08
0.39
0.11
0.00
-0.0
01
CH
Lpro
xim
ity
0.1
0.05
0.27
0.2
0.1
0.01
0.44
1O
vera
llpro
xim
ity
-0.0
4-0
.02
-0.0
7-0
.05
-0.0
5-0
.04
-0.0
3-0
.11
1C
HL
ExpG
row
th0.
060.
000.
010.
110.
030.
05-0
.00
0.00
-0.0
01
Ove
rall
ImpG
row
th-0
.00
-0.0
0-0
.00
-0.0
0-0
.01
-0.0
0-0
.01
-0.0
10.
01-0
.00
1G
DP
0.14
0.1
0.23
0.1
0.32
0.3
-0.0
4-0
.03
-0.0
90.
04-0
.00
1
12

(a) Export destinations of Colombian peer firms
(b) Export destinations of matched Chilean importing firms
(c) New destinations that Colombian firms expand to
Figure 1: Export Maps of Colombian and Chilean Firms
13
Empirical Model. Building on and expending the empirical model of Chaney (2014),
we employ the following specification:
(1) Prob(Entryi,c,t+1 > 0 | observables)
= Φ
(αSpilloveri,c,t
+ β1ExpNetworki,c,t + β2CHL ImpNetworki,c,t + β3COL ImpNetworki,c,t
+ γ1COL proximityc + γ2CHL proximityc + γ3Overall proximityc
+ λ1CHL ExpGrowthi,c,t + λ2Overall ImpGrowthc,t
+ δGDPc,t
),
where
1[Entryi,c,t+1 > 0] is the dependent variable set to 1 if, conditional on entering a
new (other than Chile) country in year t+ 1, firm i enters country c and 0 if not;
α captures the domestic spillover effect among the Colombian firms within the same
HS 10-digit product (α > 0 would indicate that a firm is more likely to choose country
c for its expansion if its peers exported the same product to c in the previous year);
β1, β2, and β3 capture the Foreign Export Network, Foreign Import Network, and
Domestic Import Network effects, respectively (e.g., β1 > 0 would suggest that firm i
has a higher chance to expand to c if its Chilean trading partner exported to c in the
previous year);17
γ1, γ2, and γ3 capture the effects of proximity to Colombia, proximity to Chile, and
overall proximity of country c, respectively (e.g., γ1 would indicate that the probability
of choosing c as the new market increases in its proximity to Colombia);
λ1 captures the effect of the export growth (between years t and t+1) of Chilean
firms which import from the Colombian firm i;
λ2 captures the effect of the average import growth by country c from all other
countries between years t and t+ 1;
δ accounts for the effect of economic size since firms are mechanically more likely
to export to large countries with greater market size.
To examine which of the above-mentioned factors contribute to persistent export ex-
17Similarly, β2 measures the effects of Chilean import network and β3 investigates whether a firmis more likely to export to a country from which it imports.
14
pansion, we also estimate the effect of the same independent variables on the Survival
dummy, which equals one if the exports to a new destination persist for more than a
year, and zero otherwise:
(2) Prob(Survivali,c,t+1 > 0 | observables)
= Φ
(α′Spilloveri,c,t
+ β′1ExpNetworki,c,t + β′2CHL ImpNetworki,c,t + β′3COL ImpNetworki,c,t
+ γ′1COL proximityc + γ′2CHL proximityc + γ′3Overall proximityc
+ λ′1CHL ExpGrowthi,c,t + λ′2Overall ImpGrowthc,t
+ δ′GDPc,t
),
Main Conjectures. Our main focus is on the Spillover and Networks coefficients: α,
β1, β2, and β3. Specifically, we expect the spillover and export network effects to be
significantly positive. If there are other Colombian firms exporting the same product to
a particular country, this implies that consumer preferences, competition intensity, and
other market characteristics of that country are potentially desirable for the Colom-
bian exporters of that product.18 Therefore, the Colombian firm would be more likely
to export to that country as it has a higher chance to succeed there, i.e., α > 0. In
addition, according to the remote search idea in Chaney (2014), a Colombian firm
that has acquired a trade partner in Chile would search for new trade partners, just
like Chilean firms would. Thus, we would expect the Colombian firm to choose a new
export destination, just as its Chilean trade partners, i.e., β1 > 0.
Note that export networks described above are likely to contain detailed information
about products exported by Colombian firms potentially embedded in the exports of
Chilean firms which may have used the original Colombian product as an intermediate.
This type of information is not present through either Colombian or Chilean import
networks. Thus, we expect the import network effects to be either smaller or statisti-
cally insignificant.
All proximity variables were also used in Chaney (2014)’s original specification. Chaney
(2014) expected for coefficients γ1 and γ2 to be positive and statistically significant,
18See, for example, Greenaway et al. (2004), Silvente and Gimenez (2007), Koenig et al. (2010).
15

as firms are expected to be more likely to enter the markets closer to the exporting
country and to the firm’s previous export destinations. Coefficient γ3, on the other
hand, was expected to be negative, as we would expect the level of competition to be
higher in countries that are closer to other countries, making it more difficult to break
into those markets.
At the same time, both Colombian and Chilean proximity variables are positively cor-
related with both Spillover and Export Network dummies, which were not present in
Chaney (2014)’s specification. Similarly, the Overall proximity is negatively correlated
with these dummies. As a result, the presence of the Spillover and Export Network
dummies is likely to decrease the magnitudes of the geographic proximity effects on
the choice of the new export destination.
Finally, the effect of the export growth of Chilean firms that import from Colombian
firm i is expected to have a positive effect on the choice of new export destination. As
motivated by Chaney (2014), the trade flows between the Chilean trade partners and
country c can be used as a proxy for the intensity of their communication. If there is
an export growth from these Chilean trade partners to country c, it implies that the
communication between them increases and the exposure of the exporting firm i rises
and as a result, we would expect the firm to be more likely to enter this new market.
Note that we measure only the export growth of the direct Chilean importers from
a Colombian firm to the third country, whereas Chaney (2014) measured the export
growth of the entire country importing from a French firm to the third country. Thus,
we expect our measure to be more directly linked to the network theory. Again, as
with the geographic proximity effects, the presence of the Spillover and Export Net-
work dummies is likely to dampen the export growth effects.
Results. Table 3 summarizes the estimation results of equations (1) and (2). We
present the estimated marginal effects rather than the coefficients, to aid interpreta-
tion. Columns (1)-(3) present the results for the expansion to new export destinations
and Columns (4)-(6) present the results for the survival of these export expansions.
The results suggest that only the Spillover and Export Network have statistically sig-
nificantly positive effects on a firm’s choice of new export destinations while neither
16

Table 3: Estimated Marginal Effects of Domestic Spillover and Foreign Network
Probability of Entry Probability of Survival
Dependent Variable (1) (2) (3) (4) (5) (6)
Spillover 0.012*** 0.0114*** 0.0058** 0.0057**(0.0036) (0.0035) (0.0028) (0.0028)
ExpNetwork 0.0077** 0.0049** 0.0001 0.00005(0.0032) (0.0018) (0.0008) (0.0002)
CHL ImpNetwork 0.0013 0.0005 0.0007 0.0001(0.0015) (0.0007) (0.0011) (0.0003)
COL ImpNetwork 0.0034 0.0014 0.00005 -0.00002(0.0025) (0.0011) (0.0007) (0.0001)
COL proximity 0.0039*** 0.0105*** 0.0037*** 0.0004 0.0034*** 0.0004(0.0007) (0.0019) (0.0007) (0.0003) (0.0012) (0.0003)
CHL proximity 0.0033*** 0.0074*** 0.0026** 0.0003 0.0026** 0.0002(0.0011) (0.0017) (0.001) (0.0003) (0.0011) (0.0003)
overall proximity -0.0059*** -0.01*** -0.0052*** -0.0008** -0.0037*** -0.0008**(0.0012) (0.0018) (0.0012) (0.0004) (0.0011) (0.0004)
CHL ExpGrowth 0.00004** 0.00004* 0.00003* -1.06×10⁻⁶ -5.87×10⁻⁶ -1.66×10⁻⁶
(0.00002) (0.00003) (0.00002) (0.0000) (0.00001) (0.0000)overall ImpGrowth -7.35×10⁻¹¹ -1.31×10⁻¹⁰ -8.1×10⁻¹¹ -1.69×10⁻¹⁰ -4.75×10⁻¹⁰ -1.65×10⁻¹⁰
(0.0000) (0.0000) (0.0000) (0.0000) (0.0000) (0.0000)GDP 3.23×10⁻¹²*** 7.06×10⁻¹²*** 2.72×10⁻¹²*** 3.84×10⁻¹³ 2.6×10⁻¹²** 3.52×10⁻¹³
(0.0000) (0.0000) (0.0000) (0.0000) (0.0000) (0.0000)Years 2007-2015 2007-2015 2007-2015 2007-2014 2007-2014 2007-2014No. of obs. 29,829a 29,829 29,829 23,790 23,790 23,790R-square 0.3182 0.2682 0.3296 0.2963 0.2045 0.2975
Notes: This table shows the marginal effects for the Probit estimation of equation (1) and (2) for 163 Colombian expandingexporters between 2007 and 2016. Columns (1)-(3) present the results for expansion to new export destinations and Columns(4)-(6) present results for the survival of these export expansions. The marginal effect is calculated as dy/dx at the averagevalue of each x in the sample. dy/dx stands for a discrete change from 0 to 1 when x is a dummy variable. Standard errorsare clustered at the firm level. *** Significant at the 1% level. ** Significant at the 5% level. * Significant at the 10% level.
a The GDP data for Venezuela in 2015 is not available, so we assign the same GDP to Venezuela in 2015 as it had in 2014.The results are robust if we exclude Venezuela from the sample.
of the Import Networks does. On average, a Colombian firm is 1.08% more likely to
export to a new country if at least one other Colombian firm exported the same HS 10-
digit product to that country in the previous period (Spillover), and 0.42% more likely
to choose a new export destination if its Chilean importer exported to that country in
the previous period (Foreign Network).
Our data allow us to provide more direct evidence on the importance of export net-
works for targeting new destinations than the previous literature. Chaney (2014) used
French firm-to-country trade to examine the network effects. He defined a firm’s net-
work of trade partners as the existing portfolio of its export destinations, and showed
that the existing export destinations shape a firm’s future expansions into new markets.
17

Recent empirical and theoretical literature on matching and networks in trade, how-
ever, emphasizes the firm-to-consumer and firm-to-firm matching. That is, exporting
firms connect with only a subset of all consumers and firms in a given location.19 In
line with this literature, exploring firm-to-firm networks which allows us to provide
more direct evidence for network effects. Specifically, we show that a Colombian firm
is more likely to choose a new export destination if its Chilean importing counterpart
has previously been exporting there.
In line with our conjectures, both Colombian and Chilean Import Network effects are
statistically insignificant. Thus, being connected with other countries without infor-
mation embedded in exported products (as in Export Networks) is unlikely to have an
effect on a firm’s choice of its next export destination.
Column 3 of Table 3 indicates that, in the Entry regression, all proximity coefficients
have the expected signs. Furthermore, the comparison of Columns 1 and 2 to Column
3 shows that omitting the Spillover dummy in the empirical specification produces a
very pronounced upward bias in the magnitudes of the coefficients, while omitting the
Network dummies has only a marginal effect on the magnitudes of the coefficients.
According to Column 6 of Table 3, in the presence of the Spillover dummy, none of
the proximity variables affects the probability of survival for more than one year of
exporting to a new destination.
Similarly, the export and import growth coefficients are of the expected sign in the
Entry regression, and their magnitudes increase substantially in the specification with
the omitted Spillover dummy. Neither import nor export growth effects are statistically
significant in the Survival regression (Column 6).
Overall, by comparing the estimated results in Columns (1) and (2) to Column (3), we
found that estimating the Spillover and Foreign Network effects separately would re-
sult in an overestimation of all other effects in our model, which suggests a pronounced
omitted variable bias. It is thus more appropriate and accurate to jointly estimate
19In the context of international trade these ideas have been emphasized and formalized in therecent work of Arkolakis (2010) and Chaney (2014) among others. They also provide detailed reviewsof the relevant network and matching literatures.
18

these effects together.
Economic Significance. Our results show that the spillover and export network ef-
fects are jointly more important than the proximity, export and import growth, and
market size factors combined. To illustrate this point, we compute the fitted probabil-
ity of choosing a particular country as the new export destination under four scenarios:
(i) All other effects for a given country except for Export Network and Spillover effects;
(ii) All other effects for a given country plus Export Network (but not Spillover) effect;
(iii) All other effects for a given country plus Spillover (but not Export Network) effect;
(iv) All other effects for a given country plus Spillover and Export Network effects.
The results are present in Figure 2. The graphs demonstrate several important findings.
First, Colombian firms have much higher chances to expand to North American and
Latin American countries compared to European, Asian, and other countries. Second,
the probability of expanding to a new export destination increases significantly when
either the spillover or the network effects are present. Third, the domestic spillover ef-
fect is stronger than the export network effect. Finally, when both effects are present,
the probability reaches its peak. For example, the probability of choosing the U.S.
as the next export destination is only 2.7% if none of the effects is present, 8% with
the export network effect only, 15.6% with the spillover effect only, and 31.5% if both
export network and spillover effects are present.
Similarly, we compute the fitted probability of surviving more than one year for the
exports to new destinations and present the results in Figure 3. The new exports
to North American and Latin American countries are much more likely to persist for
more than one year, as compared to European, Asian, and other countries. Impor-
tantly, Spillover effects is the only statistically significant one, and its economic effect
is much more pronounced than any other effect, including the Foreign Export Network
effect. Specifically, the export to a new destination is 0.57% more likely to persist for
more than a year if there was another Colombian firm exporting the same product to
that destination in the previous year. This result demonstrates the difficulty in the
persistent exporting to new destinations and re-emphasizes the importance of pioneers
for successful self-discovery (Hausmann and Rodrik, 2003).
19
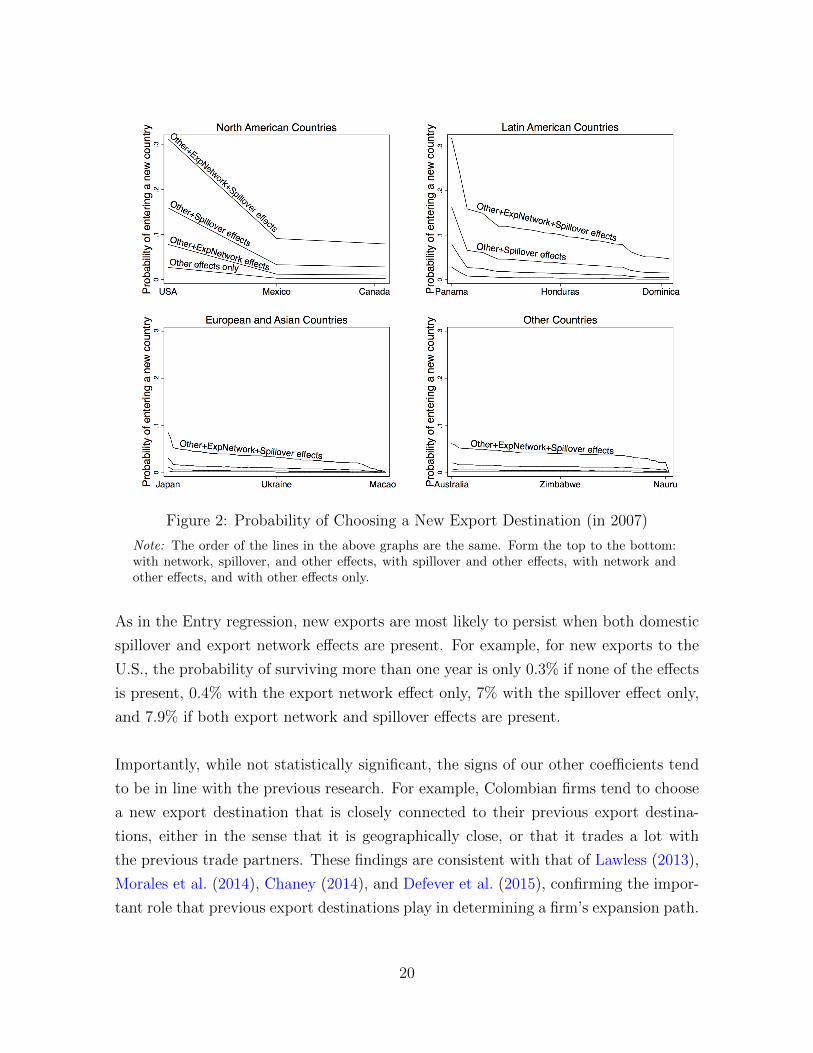
Figure 2: Probability of Choosing a New Export Destination (in 2007)
Note: The order of the lines in the above graphs are the same. Form the top to the bottom:with network, spillover, and other effects, with spillover and other effects, with network andother effects, and with other effects only.
As in the Entry regression, new exports are most likely to persist when both domestic
spillover and export network effects are present. For example, for new exports to the
U.S., the probability of surviving more than one year is only 0.3% if none of the effects
is present, 0.4% with the export network effect only, 7% with the spillover effect only,
and 7.9% if both export network and spillover effects are present.
Importantly, while not statistically significant, the signs of our other coefficients tend
to be in line with the previous research. For example, Colombian firms tend to choose
a new export destination that is closely connected to their previous export destina-
tions, either in the sense that it is geographically close, or that it trades a lot with
the previous trade partners. These findings are consistent with that of Lawless (2013),
Morales et al. (2014), Chaney (2014), and Defever et al. (2015), confirming the impor-
tant role that previous export destinations play in determining a firm’s expansion path.
20
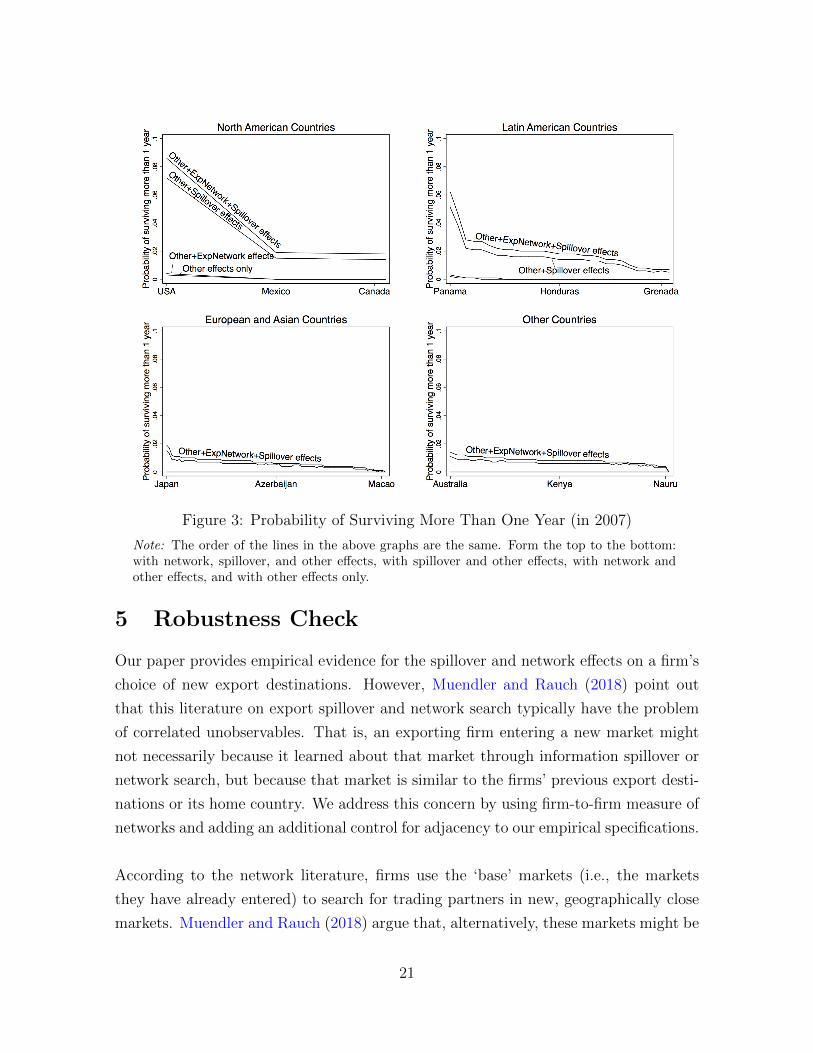
Figure 3: Probability of Surviving More Than One Year (in 2007)
Note: The order of the lines in the above graphs are the same. Form the top to the bottom:with network, spillover, and other effects, with spillover and other effects, with network andother effects, and with other effects only.
5 Robustness Check
Our paper provides empirical evidence for the spillover and network effects on a firm’s
choice of new export destinations. However, Muendler and Rauch (2018) point out
that this literature on export spillover and network search typically have the problem
of correlated unobservables. That is, an exporting firm entering a new market might
not necessarily because it learned about that market through information spillover or
network search, but because that market is similar to the firms’ previous export desti-
nations or its home country. We address this concern by using firm-to-firm measure of
networks and adding an additional control for adjacency to our empirical specifications.
According to the network literature, firms use the ‘base’ markets (i.e., the markets
they have already entered) to search for trading partners in new, geographically close
markets. Muendler and Rauch (2018) argue that, alternatively, these markets might be
21
targeted with higher probability not necessarily because of the ‘network’ search from
the base markets, but because they are similar and close to base markets. Empirically,
it is difficult to distinguish between the two channels when using the firm-to-country
measure of networks. The firm-to-firm measure of networks helps to resolve this prob-
lem, since network search will be attributed only to those new markets to which only
a trading partner rather than the whole base market exports.
The problem still potentially exists for the spillover effect. Firms entering the same
markets as other firms in the same industry might not be caused by the information
spillover, but rather caused by those markets’ similarities or adjacency to the home
country. To address this concern, we modified our empirical specifications by adding
an adjacency dummy variable which controls for the similarity between the new export
destination and Colombia. Following Morales et al. (2014) and Muendler and Rauch
(2018), adjacency is defined in four different ways: shared border, shared official lan-
guage, shared income group (by the World Bank’s classification for calender year 2007),
and shared continent. The results are presented in Table 4. The results are robust both
in terms of significance and the magnitudes, suggesting that firms rely on both domes-
tic spillover and foreign networks when choosing a new export destination, even after
controlling for the similarities between the new export destination and Colombia.
6 Conclusion
This paper explores the effects of domestic spillovers and foreign networks on an ex-
porting firm’s expansion into new foreign markets. By matching Colombian exporting
firms and Chilean importing and exporting firms between 2007 and 2016, we show that
both effects have statistically and economically significant positive effects on a firm’s
choice of new export destinations. Moreover, domestic spillover effects are relatively
more important, particularly for the survival or persistence of a new exporting rela-
tionship.
While there is a large literature focusing on how spillover and network effects impact a
firm’s expansion to new foreign markets, our paper is the first to jointly estimate these
two effects. Thus, we provide a more complete and accurate estimation of these two
effects without severe omitted variable bias. More importantly, the joint estimation
22

Tab
le4:
Est
imat
edM
argi
nal
Eff
ects
ofD
omes
tic
Spillo
ver
and
For
eign
Net
wor
k
Pro
bab
ilit
yof
Entr
yP
robab
ilit
yof
Surv
ival
Con
tigu
ous
Lan
guag
eIn
com
eC
onti
nen
tC
onti
guou
sL
angu
age
Inco
me
Con
tinen
tD
epen
den
tV
aria
ble
(1)
(2)
(3)
(4)
(5)
(6)
(7)
(8)
Adja
cent
0.00
54**
0.00
36**
*0.
0004
-0.0
006
0.00
060.
0008
0.00
01-0
.000
1(0
.002
3)(0
.001
2)(0
.000
3)(0
.000
5)(0
.000
5)(0
.000
5)(0
.000
1)(0
.000
1)Spillo
ver
0.01
23**
*0.
0093
***
0.01
15**
*0.
0121
***
0.00
61**
0.00
45*
0.00
57**
0.00
61**
(0.0
035)
(0.0
032)
(0.0
035)
(0.0
038)
(0.0
028)
(0.0
025)
(0.0
028)
(0.0
029)
ExpN
etw
ork
0.00
48**
*0.
0044
***
0.00
47**
*0.
005*
**0.
0000
20.
0000
30.
0000
40.
0000
5(0
.001
8)(0
.001
7)(0
.001
8)(0
.001
9)(0
.000
2)(0
.000
2)(0
.000
2)(0
.000
2)C
HL
ImpN
etw
ork
0.00
030.
0004
0.00
060.
0005
0.00
010.
0001
0.00
010.
0001
(0.0
007)
(0.0
007)
(0.0
008)
(0.0
007)
(0.0
002)
(0.0
002)
(0.0
003)
(0.0
003)
CO
LIm
pN
etw
ork
0.00
120.
0013
0.00
130.
0014
-0.0
0002
-0.0
0003
-0.0
0001
-0.0
0001
(0.0
011)
(0.0
01)
(0.0
011)
(0.0
011)
(0.0
001)
(0.0
001)
(0.0
001)
(0.0
001)
CO
Lpro
xim
ity
0.00
24**
*0.
0024
***
0.00
37**
*0.
0043
***
0.00
020.
0002
0.00
040.
0005
(0.0
006)
(0.0
005)
(0.0
007)
(0.0
01)
(0.0
002)
(0.0
002)
(0.0
003)
(0.0
003)
CH
Lpro
xim
ity
0.00
3**
0.00
060.
0025
**0.
0035
**0.
0002
-0.0
001
0.00
020.
0004
(0.0
012)
(0.0
009)
(0.0
01)
(0.0
015)
(0.0
003)
(0.0
002)
(0.0
002)
(0.0
004)
over
all
pro
xim
ity
-0.0
03**
-0.0
034*
**-0
.004
8***
-0.0
054*
**-0
.000
5*-0
.000
5*-0
.000
7**
-0.0
008*
*(0
.001
5)(0
.001
2)(0
.001
2)(0
.001
1)(0
.000
3)(0
.000
3)(0
.000
3)(0
.000
4)C
HL
ExpG
row
th0.
0000
3*0.
0000
2*0.
0000
3*0.
0000
3*-1
.62×
10−
6-1
.5×
10−
6-1
.63×
10−
6-1
.57×
10−
6
(0.0
0002
)(0
.000
01)
(0.0
0002
)(0
.000
02)
(0.0
000)
(0.0
000)
(0.0
000)
(0.0
000)
over
all
ImpG
row
th-1
.28×
10−
10
-7.8
4×10−
11
-8.6×
10−
11
-9.4
9×10−
11
-2.9
4×10−
10
-1.3
9×10−
10
-2.2
1×10−
10
-2×
10−
10
(0.0
000)
(0.0
000)
(0.0
000)
(0.0
000)
(0.0
000)
(0.0
000)
(0.0
000)
(0.0
000)
GD
P3.
46×
10−
12**
*3.
18×
10−
12**
*2.
81×
10−
12**
*3.
01×
10−
12**
*4.
2×10−
13**
*4.
46×
10−
13**
*3.
59×
10−
13**
*3.
92×
10−
13**
*(0
.000
0)(0
.000
0)(0
.000
0)(0
.000
0)(0
.000
0)(0
.000
0)(0
.000
0)(0
.000
0)Y
ears
2007
-201
520
07-2
015
2007
-201
520
07-2
015
2007
-201
420
07-2
014
2007
-201
420
07-2
014
No.
ofob
s.29
,829
a29
,829
29,8
2929
,829
23,7
9023
,790
23,7
9023
,790
R-s
quar
e0.
3382
0.33
730.
3302
0.33
030.
3029
0.30
760.
298
0.29
86
Notes:
This
table
show
sth
em
argi
nal
effec
tsfo
rth
eP
robit
esti
mat
ion
ofeq
uat
ion
(1)
and
(2),
afte
rco
ntr
olling
for
the
adja
cency
bet
wee
nth
enew
exp
ort
des
tinati
on
and
Col
ombia
.C
olum
ns
(1)-
(4)
pre
sent
the
resu
lts
for
expan
sion
tonew
exp
ort
des
tinat
ions
and
Col
um
ns
(5)-
(8)
pre
sent
resu
lts
for
the
surv
ival
ofth
ese
exp
ort
expansi
ons.
Fol
low
ing
Mor
ales
etal
.(2
014)
and
Muen
dle
ran
dR
auch
(2018
),adja
cency
isdefi
ned
diff
eren
tly
inea
chco
lum
n:
shar
edb
ord
er,
shar
edoffi
cial
langu
age,
share
din
com
egr
oup
(by
the
Wor
ldB
ank’s
clas
sifica
tion
for
cale
nder
year
2007
),an
dsh
ared
conti
nen
t.T
he
mar
ginal
effec
tis
calc
ula
ted
asdy/dx
atth
eav
erag
eva
lue
of
eachx
inth
esa
mple
.dy/dx
stan
ds
for
adis
cret
ech
ange
from
0to
1w
hen
xis
adum
my
vari
able
.Sta
ndar
der
rors
are
clust
ered
atth
efirm
leve
l.***
Sig
nifi
cant
at
the
1%
leve
l.**
Sig
nifi
cant
atth
e5%
level
.*
Sig
nifi
cant
atth
e10
%le
vel.
aT
he
GD
Pdat
afo
rV
enez
uel
ain
2015
isnot
avai
lable
,so
we
assi
gnth
esa
me
GD
Pto
Ven
ezuel
ain
2015
asit
had
in20
14.
The
resu
lts
are
robust
ifw
eex
clude
Ven
ezuel
afr
omth
esa
mple
.
23
allows us to identify the spillover effect, among all other effects, as the most important
factor influencing a firm’s choice of new export destinations. Additionally, we construct
a new matched exporter-importer dataset to examine the network effects. The finer,
firm-to-firm measures of networks is more accurate and informative than the previously
used firm-to-country measures of networks.
Although this paper provides empirical evidence for the spillover and network effects
in a firm’s expansion to new foreign markets, it is still imperative to formulate a theo-
retical model that substantiates these effects. Moreover, this paper only analyzes the
network and spillover effects on the extensive margin of trade (i.e., the expansion to
new markets) but remains silent on their effects on the intensive margins (i.e. how
much the firm sells to each market). A model for network and spillover effects on the
intensive margin of trade would thus also be interesting. Finally, with the increasing
availability of firm-level trade data, it is possible to check whether the results of this
paper can be generalized to trade between other countries. These questions are left for
future research.
References
Aitken, B., Hanson, G. H., and Harrison, A. E. (1997). Spillovers, foreign investment,
and export behavior. Journal of International Economics, 43(1-2):103–132.
Albornoz, F., Fanelli, S., and Hallak, J. C. (2016). Survival in export markets. Journal
of International Economics, 102:262–281.
Albornoz, F., Pardo, H. F. C., Corcos, G., and Ornelas, E. (2012). Sequential exporting.
Journal of International Economics, 88(1):17–31.
Aleksynska, M. and Peri, G. (2014). Isolating the network effect of immigrants on
trade. The World Economy, 37(3):434–455.
Antras, P. and Costinot, A. (2011). Intermediated trade. The Quarterly Journal of
Economics, 126(3):1319–1374.
Araujo, L., Mion, G., and Ornelas, E. (2016). Institutions and export dynamics.
Journal of International Economics, 98:2–20.
24

Arkolakis, C. (2010). Market penetration costs and the new consumers margin in
international trade. Journal of Political Economy, 118(6):1151–1199.
Barrios, S., Gorg, H., and Strobl, E. (2003). Explaining firms’ export behaviour: R&D,
spillovers and the destination market. Oxford Bulletin of Economics and Statistics,
65(4):475–496.
Bekes, G. and Murakozy, B. (2012). Temporary trade and heterogeneous firms. Journal
of International Economics, 87(2):232–246.
Benguria, F. (2015). The matching and sorting of exporting and importing firms:
Theory and evidence. Univ. of Kentucky, Mimeo.
Bernard, A. B., Bøler, E. A., and Dhingra, S. (2018). Firm-to-firm connections in
Colombian imports. NBER Working Paper No. 24557.
Bernard, A. B. and Jensen, J. B. (2004). Why some firms export. Review of Economics
and Statistics, 86(2):561–569.
Bernard, A. B. and Moxnes, A. (2018). Networks and trade. Annual Review of Eco-
nomics, (0).
Bernard, A. B., Moxnes, A., and Ulltveit-Moe, K. H. (2014). Two-sided heterogeneity
and trade. Review of Economics and Statistics, (0).
Blum, B. S., Claro, S., and Horstmann, I. (2010). Facts and figures on intermediated
trade. American Economic Review, 100(2):419–23.
Blum, B. S., Claro, S., and Horstmann, I. J. (2012). Import intermediaries and trade
costs: Theory and evidence. Unpublished manuscript, Rotman School of Manage-
ment, University of Toronto.
Cadot, O., Iacovone, L., Pierola, M. D., and Rauch, F. (2013). Success and failure of
African exporters. Journal of Development Economics, 101:284–296.
Chaney, T. (2014). The network structure of international trade. The American Eco-
nomic Review, 104(11):3600–3634.
Chaney, T. (2016). Networks in international trade. In The Oxford Handbook of the
Economics of Networks. Oxford University Press.
25
Choquette, E. and Meinen, P. (2015). Export spillovers: Opening the black box. The
World Economy, 38(12):1912–1946.
Ciliberto, F. and Jakel, I. C. (2017). Superstar exporters: An empirical investigation
of strategic interactions in Danish export markets. Univ. of Virginia, Mimeo.
Clerides, S. K., Lach, S., and Tybout, J. R. (1998). Is learning by exporting impor-
tant? Micro-dynamic evidence from Colombia, Mexico, and Morocco. The Quarterly
Journal of Economics, 113(3):903–947.
Combes, P.-P., Lafourcade, M., and Mayer, T. (2005). The trade-creating effects of
business and social networks: Evidence from France. Journal of International Eco-
nomics, 66(1):1–29.
Currarini, S., Jackson, M. O., and Pin, P. (2009). An economic model of friendship:
Homophily, minorities, and segregation. Econometrica, 77(4):1003–1045.
Defever, F., Heid, B., and Larch, M. (2015). Spatial exporters. Journal of International
Economics, 95(1):145–156.
Dragusanu, R. (2014). Firm-to-firm matching along the global supply chain. Harvard
Univ., Mimeo.
Eaton, J., Eslava, M., Krizan, C. J., Kugler, M., and Tybout, J. (2009). A search and
learning model of export dynamics. Penn State Univ., Mimeo.
Eaton, J., Eslava, M., Kugler, M., and Tybout, J. (2007). Export dynamics in Colom-
bia: Firm-level evidence. NBER working paper No.13531.
Garmendia, A., Llano, C., Minondo, A., and Requena, F. (2012). Networks and the
disappearance of the intranational home bias. Economics Letters, 116(2):178–182.
Greaney, T. M. (2009). Measuring network effects on trade: A reexamination. Japan
and the World Economy, 21(3):219–225.
Greenaway, D., Sousa, N., and Wakelin, K. (2004). Do domestic firms learn to export
from multinationals? European Journal of Political Economy, 20(4):1027–1043.
Hausmann, R. and Rodrik, D. (2003). Economic development as self-discovery. Journal
of Development Economics, 72(2):603–633.
26

He, S. (2018). Firms’ entry into foreign markets: A network centrality analysis. Work-
ing paper.
Iacovone, L. and Javorcik, B. S. (2010). Multi-product exporters: Product churning,
uncertainty and export discoveries. The Economic Journal, 120(544):481–499.
Impullitti, G., Irarrazabal, A. A., and Opromolla, L. D. (2013). A theory of entry into
and exit from export markets. Journal of International Economics, 90(1):75–90.
Jackson, M. O. and Zenou, Y. (2015). Games on networks. In Handbook of Game
Theory with Economic Applications, volume 4, pages 95–163. Elsevier.
Kneller, R. and Pisu, M. (2007). Industrial linkages and export spillovers from FDI.
The World Economy, 30(1):105–134.
Koenig, P. (2009). Agglomeration and the export decisions of French firms. Journal
of Urban Economics, 66(3):186–195.
Koenig, P., Mayneris, F., and Poncet, S. (2010). Local export spillovers in France.
European Economic Review, 54(4):622–641.
Lawless, M. (2013). Marginal distance: Does export experience reduce firm trade costs?
Open Economies Review, 24(5):819–841.
Monarch, R. (2014). It’s not you, it’s me: Breakups in US-China trade relationships.
US Census Bureau Center for Economic Studies Paper No.14-08.
Morales, E., Sheu, G., and Zahler, A. (2014). Gravity and extended gravity: Using
moment inequalities to estimate a model of export entry. NBER Working Paper
No.19916.
Muendler, M.-A. and Rauch, J. E. (2018). Do employee spinoffs learn markets from
their parents? Evidence from international trade. European Economic Review,
105(C):159–173.
Nguyen, D. X. (2012). Demand uncertainty: Exporting delays and exporting failures.
Journal of International Economics, 86(2):336–344.
Petropoulou, D. (2008). Information costs, networks and intermediation in interna-
tional trade. University of Oxford, Department of Economics, Discussion Paper 370.
27
Rauch, J. E. (1999). Networks versus markets in international trade. Journal of
International Economics, 48(1):7–35.
Rauch, J. E. (2001). Business and social networks in international trade. Journal of
Economic Literature, pages 1177–1203.
Rauch, J. E. and Trindade, V. (2002). Ethnic Chinese networks in international trade.
Review of Economics and Statistics, 84(1):116–130.
Rauch, J. E. and Watson, J. (2004). Network intermediaries in international trade.
Journal of Economics & Management Strategy, 13(1):69–93.
Silvente, F. R. and Gimenez, J. C. (2007). Information spillovers and the choice of
export destination: A multinomial Logit analysis of Spanish young SMEs. Small
Business Economics, 28(1):69–86.
Wagner, R. and Zahler, A. (2015). New exports from emerging markets: Do followers
benefit from pioneers? Journal of Development Economics, 114:203–223.
28
Appendix
A Technical notes on firm-to-firm matching
Matching Colombian exporting firms to their Chilean trade partners plays a critical
role in estimating foreign network effects in our paper. We managed to do this, as the
Colombian firm-level export data record the name and address of the foreign importing
firm for each transaction. However, the foreign firm name data are very noisy. There are
instances in which the same firm is recorded differently by using various abbreviations,
extra spaces, dashes, dots, and other special signs. To clean and match the importing
firm names, we used the following procedure:
1. We dropped all observations with the missing importing firm names.
2. We eliminated the typical prefixes, suffixes, and abbreviations (e.g., “LTDA”,
“LLC”,“CO.”, “INC”).
3. We eliminated the non alpha numeric characters (e.g., . / ; () @ &).
4. We compared the importing firm names with the standardized firm names recorded
in the Chilean imports data. If the firm names were the same, we accomplished
a match.
5. There are cases where the firm names have slightly different spellings than the
standardized firm names. In these cases, we performed a further match by ad-
dress. Specifically, we searched the address of the standardized firm through
Internet, and compared it with the address recorded in Colombian export data.
If the addresses were the same, we matched the two firms. Otherwise we failed
to match.
29

B Alternative Specification: Logit model
Table A1: Estimated Marginal Effects of Domestic Spillover and Foreign Network
Probability of Entry Probability of Survival
Dependent Variable (1) (2) (3) (4) (5) (6)
Spillover 0.0113*** 0.011*** 0.0057** 0.0057**(0.0037) (0.0035) (0.0028) (0.0028)
ExpNetwork 0.0046** 0.0029*** 0.00002 0.00002(0.0019) (0.001) (0.0005) (0.0001)
CHL ImpNetwork 0.0006 0.0003 0.0004 0.00005(0.0009) (0.0005) (0.0007) (0.0001)
COL ImpNetwork 0.0018 0.0007 0.00001 −8.26× 10⁻⁷
(0.0014) (0.0006) (0.0005) (0.0001)COL proximity 0.0029*** 0.0085*** 0.0029*** 0.0003 0.0028*** 0.0003
(0.0006) (0.0016) (0.0006) (0.0002) (0.001) (0.0002)CHL proximity 0.0024** 0.0066*** 0.002** 0.0002 0.0023** 0.0001
(0.0008) (0.0015) (0.0008) (0.0002) (0.001) (0.0002)overall proximity -0.0058*** -0.0109*** -0.0052*** -0.0007* -0.0039*** -0.0007*
(0.0012) (0.0018) (0.0013) (0.0003) (0.0011) (0.0003)CHL ExpGrowth 0.00003** 0.00003 0.00002* −6.25× 10⁻⁷ −3.51× 10⁻⁶ −8.44× 10⁻⁷
(0.00001) (0.00002) (0.00001) (0.0000) (0.0000) (0.0000)overall ImpGrowth −6.22× 10⁻¹¹ −1.03× 10⁻¹⁰ −6.41× 10⁻¹¹ −7.94× 10⁻¹¹ −2.76× 10⁻¹⁰ −7.86× 10⁻¹¹
(0.0000) (0.0000) (0.0000) (0.0000) (0.0000) (0.0000)GDP 2.12× 10⁻¹²*** 5.2× 10⁻¹²*** 1.89× 10⁻¹²*** 2.1× 10⁻¹³ 1.95× 10⁻¹²** 1.98× 10⁻¹³
(0.0000) (0.0000) (0.0000) (0.0000) (0.0000) (0.0000)Years 2007-2015 2007-2015 2007-2015 2007-2014 2007-2014 2007-2014No. of obs. 29,829 29,829 29,829 23,790 23,790 23,790R-square 0.3134 0.2619 0.3242 0.2979 0.2013 0.2985
Notes: This table shows the marginal effects for the Logit estimation of equation (1) and (2) for 163 Colombian expanding exportersbetween 2007 and 2016. Column (1)-(3) present the results for expansion to new export destinations and Columns (4)-(6) presentresults for the survival of these export expansions. The marginal effect is calculated as dy/dx at the average value of each x in thesample. dy/dx stands for a discrete change from 0 to 1 when x is a dummy variable. Standard errors are clustered at the firm level.*** Significant at the 1% level. ** Significant at the 5% level. * Significant at the 10% level.
30