Embed Size (px)
Citation preview
AUTHORSDavid ClarksonStefan JaecklinKamil Kaczmarski
Financial Services
DOMICILES OF ALTERNATIVE INVESTMENT FUNDS
Copyright © 2014 Oliver Wyman
QUALIFICATIONS, ASSUMPTIONS, AND LIMITING CONDITIONS
Neither Oliver Wyman nor Association of the Luxembourg Fund Industry (ALFI) shall have any liability to any third
party in respect of this report or any actions taken or decisions made as a consequence of the results, advice, or
recommendations set forth herein.
The opinions expressed herein are valid only for the purpose stated herein and as of the date hereof. Information
furnished by others, upon which all or portions of this report are based, is believed to be reliable but has not been
verified. No warranty is given as to the accuracy of such information. Public information and industry and statistical
data are from sources Oliver Wyman and ALFI deem to be reliable; however, no representation as to the accuracy or
completeness of such information is made.
No responsibility is taken for changes in market conditions or laws or regulations and no obligation is assumed to
revise this report to reflect changes, events or conditions, which occur subsequent to the date hereof.
1
1. EXECUTIVE SUMMARY
The following study identifies reasons behind choice of domicile for alternative investment
funds (AIFs) and discusses future trends. The study was commissioned by the Association of
the Luxembourg Fund Industry (ALFI) for their annual conference on Alternative Investments
in Luxembourg.
We estimate that since 2010 the number of AIFs have increased by 10% and assets under
management (AuM) by 13%. The distribution of domiciles remained relatively stable during
this time, but there are a number of clear trends emerging.
The study identifies four main trends in choice of domicile for AIFs
1. Strong growth in European domiciles, fuelled by the introduction of the Alternative Investment Funds Manager Directive (AIFMD)
2. Demand for AIFs under mutual fund structures/UCITS
3. Demand for ‘one-stop-shop’ domiciles and the decreasing appeal of smaller offshore domiciles
4. Successful domiciles maintaining or strengthening their dominant role (Cayman Islands for hedge funds, Delaware for private equity and real estate funds)
Going forward, we expect the demand for regulated AIFs to continue to drive growth in
European onshore domiciles. The traditional demarcation between regulated mutual funds
and non- or less-regulated AIFs are diminishing yet further. AIMFD-compliant vehicles
are expected to become the preferred investment structure for investors looking for a
combination of both a regulated vehicle and full blown alternative investment strategies.
Copyright © 2014 Oliver Wyman
2. INTRODUCTION
This study builds upon the initial Oliver Wyman report from 2011 on Domiciles of Alternative
Investment Funds and continues the discussion around domicile choices. Since the last
report, offshore domiciles have attracted increasing attention from regulatory bodies
and investors, resulting in greater transparency about their role as global fund domiciles.
Nonetheless, the availability of public data remains very limited, increasing reliance on a
variety of (sometimes contradicting) fund databases and interviews with industry experts to
derive robust estimates.
In the following study, we defined AIFs as investment schemes that apply investment
strategies typically not available to traditional mutual fund/UCITS structures. AIFs can be
grouped into three main asset classes: hedge funds, private equity funds, and real estate
funds. In addition, to acknowledge recent market developments in the mutual fund industry,
we look at alternative investment strategies replicated under mutual fund/UCITS structures
in a separate analysis.
To keep the data manageable we have restricted our analysis to jurisdictions in the Americas
and Europe. The study examines those domiciles attracting the largest number of AIFs by
number fund registrations and AuM, as well as key domiciles in the European Union (EU).
These are
• Cayman Islands
• State of Delaware in the United States of America
• Key domiciles in the EU: Luxembourg, Ireland and Malta
• The Channel Islands comprising Jersey, Isle of Man and Guernsey
• Rest of Caribbean Islands: Bermuda and British Virgin Islands (BVI)
3
3. OVERVIEW OF DOMICILES AND TRENDS
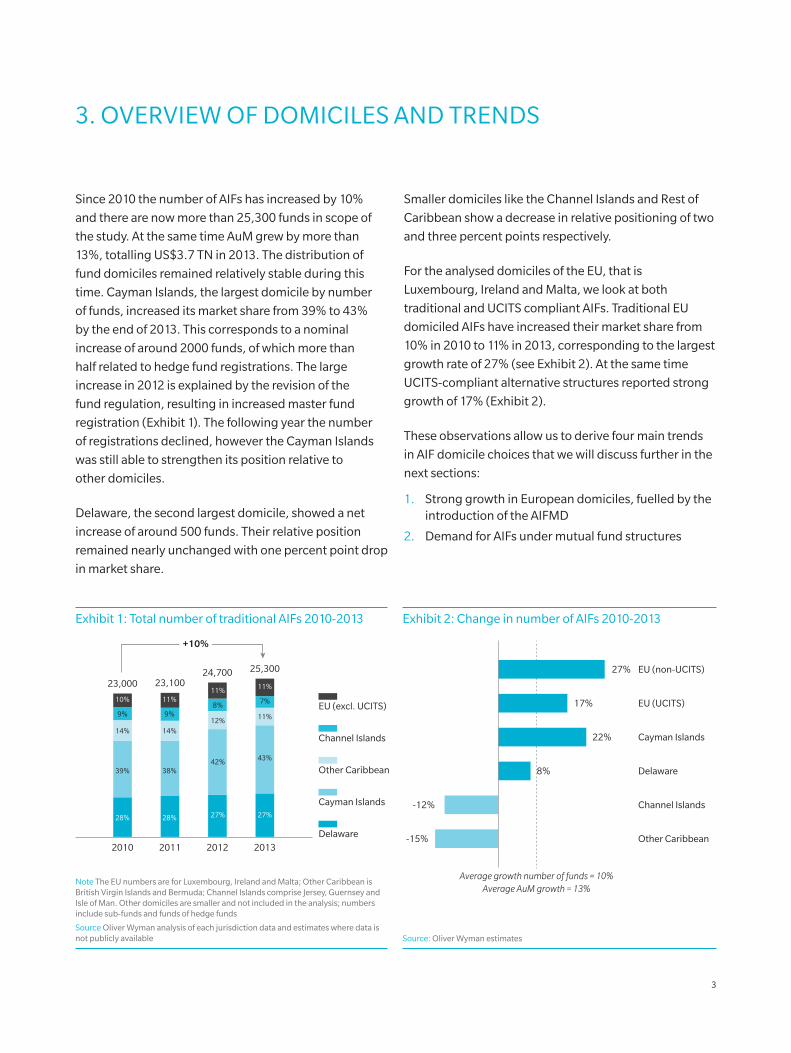
Since 2010 the number of AIFs has increased by 10%
and there are now more than 25,300 funds in scope of
the study. At the same time AuM grew by more than
13%, totalling US$3.7 TN in 2013. The distribution of
fund domiciles remained relatively stable during this
time. Cayman Islands, the largest domicile by number
of funds, increased its market share from 39% to 43%
by the end of 2013. This corresponds to a nominal
increase of around 2000 funds, of which more than
half related to hedge fund registrations. The large
increase in 2012 is explained by the revision of the
fund regulation, resulting in increased master fund
registration (Exhibit 1). The following year the number
of registrations declined, however the Cayman Islands
was still able to strengthen its position relative to
other domiciles.
Delaware, the second largest domicile, showed a net
increase of around 500 funds. Their relative position
remained nearly unchanged with one percent point drop
in market share.
Smaller domiciles like the Channel Islands and Rest of
Caribbean show a decrease in relative positioning of two
and three percent points respectively.
For the analysed domiciles of the EU, that is
Luxembourg, Ireland and Malta, we look at both
traditional and UCITS compliant AIFs. Traditional EU
domiciled AIFs have increased their market share from
10% in 2010 to 11% in 2013, corresponding to the largest
growth rate of 27% (see Exhibit 2). At the same time
UCITS-compliant alternative structures reported strong
growth of 17% (Exhibit 2).
These observations allow us to derive four main trends
in AIF domicile choices that we will discuss further in the
next sections:
1. Strong growth in European domiciles, fuelled by the introduction of the AIFMD
2. Demand for AIFs under mutual fund structures
Exhibit 1: Total number of traditional AIFs 2010-2013
2010 2011 2012 2013
23,000
28%
39%
14%
9%
10%
28%
38%
14%
9%
11%
27%
42%
12%
8%
11%
27%
43%
11%
7%
11%23,10024,700 25,300
Delaware
Cayman Islands
Other Caribbean
Channel Islands
EU (excl. UCITS)
+10%
Note The EU numbers are for Luxembourg, Ireland and Malta; Other Caribbean is British Virgin Islands and Bermuda; Channel Islands comprise Jersey, Guernsey and Isle of Man. Other domiciles are smaller and not included in the analysis; numbers include sub-funds and funds of hedge funds
Source Oliver Wyman analysis of each jurisdiction data and estimates where data is not publicly available
Exhibit 2: Change in number of AIFs 2010-2013
27%
Average growth number of funds = 10%Average AuM growth = 13%
EU (non-UCITS)
Cayman Islands22%
Delaware8%
Channel Islands-12%
Other Caribbean-15%
EU (UCITS)17%
Source: Oliver Wyman estimates
Copyright © 2014 Oliver Wyman
3. Demand for ‘one-stop-shop’ domiciles and decreasing appeal of smaller offshore domiciles
4. Successful domiciles maintaining or strengthening their dominant role (Cayman Islands for hedge hunds, Delaware for private equity and real estate funds)
3.1. STRONG GROWTH IN EUROPEAN DOMICILES
The introduction of AIMFD increased the attractiveness
of European onshore domiciles. Effective since July 2013,
AIFMD defines a regulatory framework for management
and marketing of AIFs in the EU. It introduces new
requirements, among others, authorisation and ongoing
oversight of alternative investment fund manager
(AIFM), the obligatory appointment of an independent
depositary, independent valuation of assets, effective
liquidity and risk management, and increased investor
disclosure requirements. Moreover, the regulation
introduced the EU-wide passporting concept to AIFs
that has previously only been available for UCITS funds.
It allows EU domiciled managers to market authorised
funds across the EU and is expected to replace National
Private Placement in 2018.
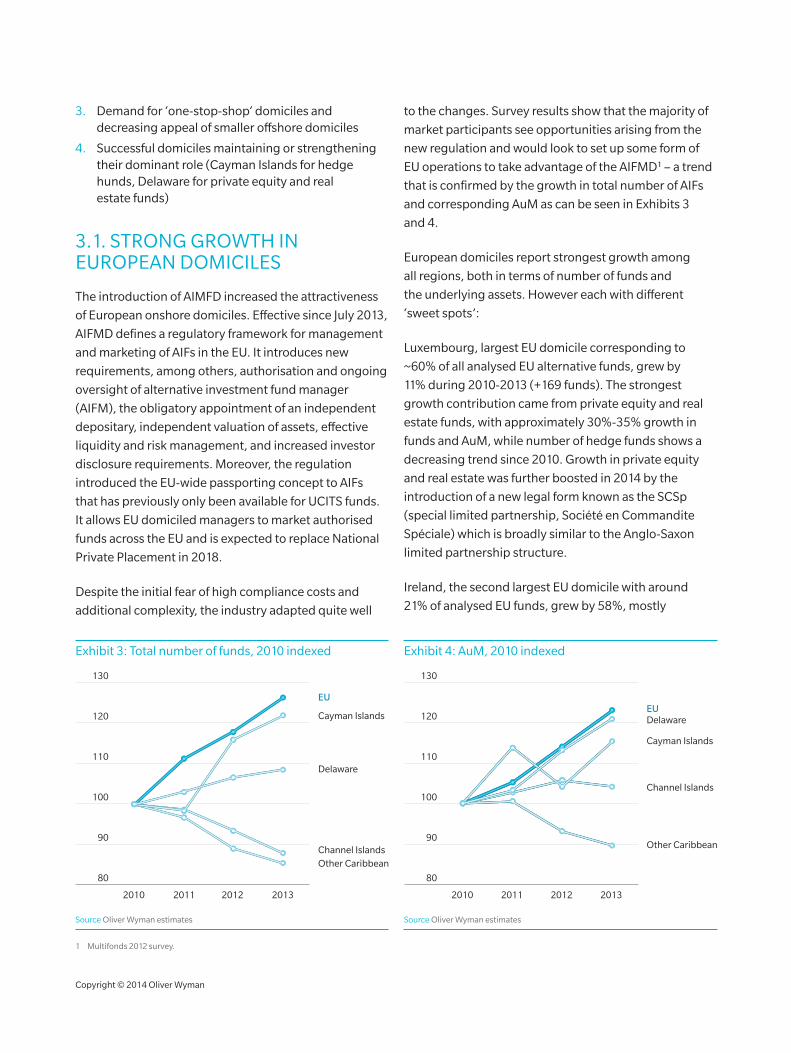
Despite the initial fear of high compliance costs and
additional complexity, the industry adapted quite well
to the changes. Survey results show that the majority of
market participants see opportunities arising from the
new regulation and would look to set up some form of
EU operations to take advantage of the AIFMD1 – a trend
that is confirmed by the growth in total number of AIFs
and corresponding AuM as can be seen in Exhibits 3
and 4.
European domiciles report strongest growth among
all regions, both in terms of number of funds and
the underlying assets. However each with different
‘sweet spots’:
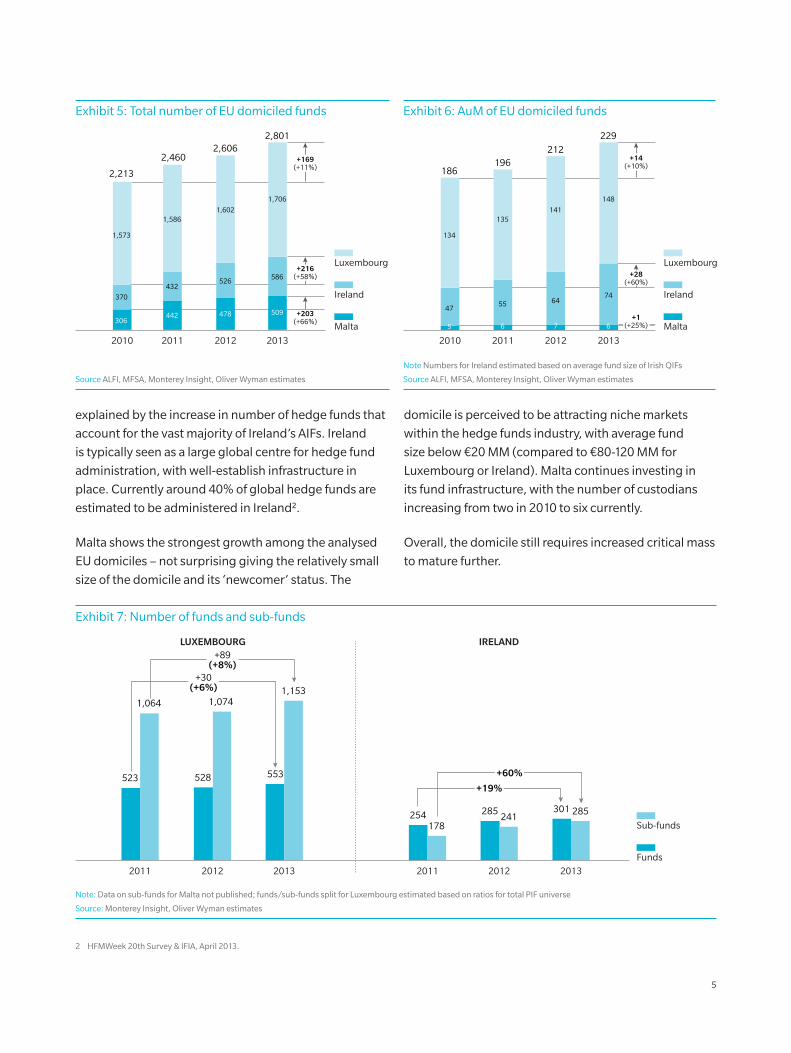
Luxembourg, largest EU domicile corresponding to
~60% of all analysed EU alternative funds, grew by
11% during 2010-2013 (+169 funds). The strongest
growth contribution came from private equity and real
estate funds, with approximately 30%-35% growth in
funds and AuM, while number of hedge funds shows a
decreasing trend since 2010. Growth in private equity
and real estate was further boosted in 2014 by the
introduction of a new legal form known as the SCSp
(special limited partnership, Société en Commandite
Spéciale) which is broadly similar to the Anglo-Saxon
limited partnership structure.
Ireland, the second largest EU domicile with around
21% of analysed EU funds, grew by 58%, mostly
Exhibit 3: Total number of funds, 2010 indexed
100
120
110
90
80
130
2010 20132011 2012
EU
Cayman Islands
Delaware
Channel IslandsOther Caribbean
Source Oliver Wyman estimates
Exhibit 4: AuM, 2010 indexed
100
120
110
90
80
130
2010 2011 2012
EU
Cayman Islands
Delaware
Channel Islands
Other Caribbean
2013
Source Oliver Wyman estimates
1 Multifonds 2012 survey.
5
explained by the increase in number of hedge funds that
account for the vast majority of Ireland’s AIFs. Ireland
is typically seen as a large global centre for hedge fund
administration, with well-establish infrastructure in
place. Currently around 40% of global hedge funds are
estimated to be administered in Ireland2.
Malta shows the strongest growth among the analysed
EU domiciles – not surprising giving the relatively small
size of the domicile and its ‘newcomer’ status. The
domicile is perceived to be attracting niche markets
within the hedge funds industry, with average fund
size below €20 MM (compared to €80-120 MM for
Luxembourg or Ireland). Malta continues investing in
its fund infrastructure, with the number of custodians
increasing from two in 2010 to six currently.
Overall, the domicile still requires increased critical mass
to mature further.
Exhibit 5: Total number of EU domiciled funds
Malta
Ireland
Luxembourg
+203(+66%)
2010
2,213
1,573
370
2012
2,606
1,602
526
478
2011
2,460
1,586
432
442
2013
2,801
1,706
586
509306
+216(+58%)
+169(+11%)
Source ALFI, MFSA, Monterey Insight, Oliver Wyman estimates
Exhibit 6: AuM of EU domiciled funds
Malta
Ireland
Luxembourg
2012
212
141
64
7
2011
196
135
55
6
2013
229
148
74
6
2010
186
134
47
5
+28(+60%)
+14(+10%)
+1(+25%)
Note Numbers for Ireland estimated based on average fund size of Irish QIFs
Source ALFI, MFSA, Monterey Insight, Oliver Wyman estimates
Exhibit 7: Number of funds and sub-funds
2013
301 285
2012
285241
2011
254178
2012
528
1,074
2013
553
1,153
2011
523
1,064
LUXEMBOURG IRELAND
Funds
Sub-funds
+19%
+60%
(+6%)+30
(+8%)+89
Note: Data on sub-funds for Malta not published; funds/sub-funds split for Luxembourg estimated based on ratios for total PIF universe
Source: Monterey Insight, Oliver Wyman estimates
2 HFMWeek 20th Survey & IFIA, April 2013.
Copyright © 2014 Oliver Wyman
Data from Luxembourg and Ireland shows that a large
part of the growth in EU funds has been contributed
by the increasing number of sub-funds, many of them
setup up by offshore fund managers with the aim to co-
domicile in the EU (see Exhibit 7). With the introduction
of the AIFMD, non-EU AIFMs cannot take advantage of
the EU-passport until 2015 unless they manage their
funds from the EU. Moving to the EU is not an attractive
solution for most non-EU AIFMs, especially to the ones
without a sizeable European investor base. Given that
marketing under the National Private Placement rules
can prove costly when targeting multiple European
markets and client solicitation remains under scrutiny
from regulators, many non-EU AIFMs decide to co-
domicile their fund in the EU. Co-domiciliation allows
fund managers the option to keep the original fund
domiciled in the offshore jurisdiction and operate a
regulated parallel fund in the EU at the same time. We
see an increasing number of AIFMD compliant co-
domiciliation arrangements being constructed through
third-party AIFM platforms, where the platform provider
is authorised by an EU Member State regulatory body
and appoints offshore portfolio managers to manage
the sub-fund, or through advisory agreements, where
the EU AIFM takes advice from offshore advisors on
investment decisions.
3.2. DEMAND FOR AIFS UNDER MUTUAL FUNDS STRUCTURES/UCITS
Since its introduction in 2002, UCITS III has become
a cornerstone of European mutual funds regulation,
defining standards in areas of investor protection,
investment regulation and investor disclosure. The
usage of UCITS compliant structures for alternative
investment strategies is estimated to have more than
doubled since 2009 on a global basis. Demand for
transparency and regulation post-crisis increased
the attractiveness of UCITS structures, in particular
in relation of UCITS attractive liquidity terms, public
disclosure requirements and permanent oversight
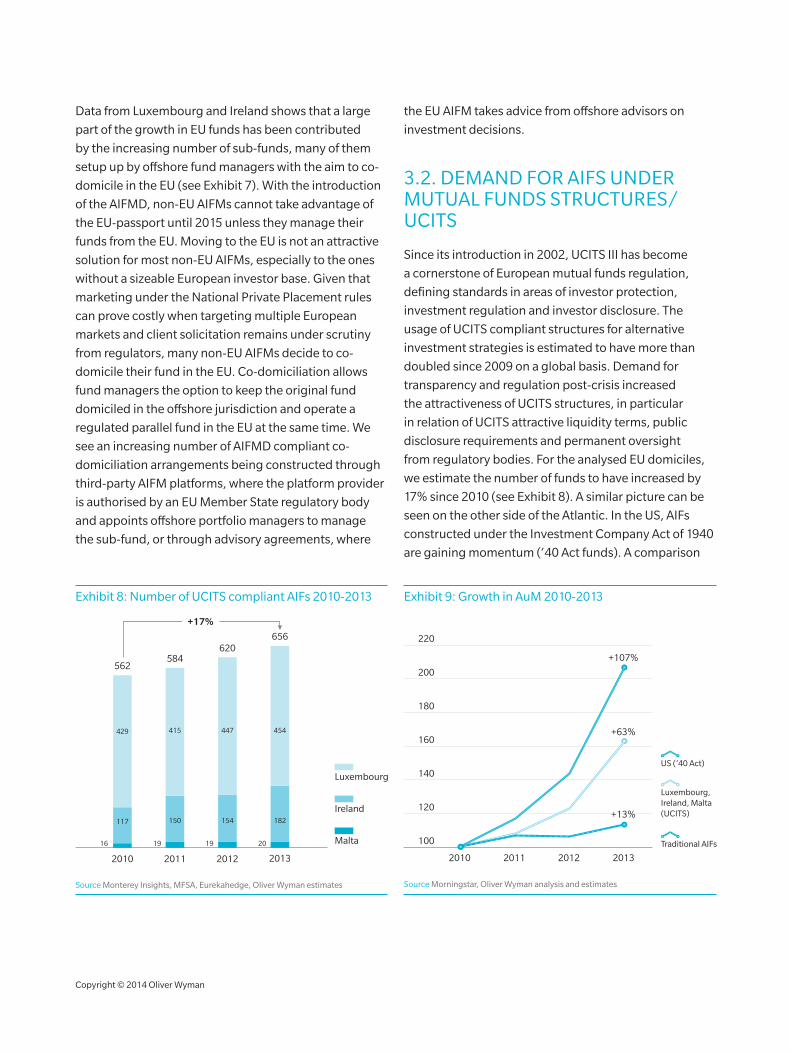
from regulatory bodies. For the analysed EU domiciles,
we estimate the number of funds to have increased by
17% since 2010 (see Exhibit 8). A similar picture can be
seen on the other side of the Atlantic. In the US, AIFs
constructed under the Investment Company Act of 1940
are gaining momentum (‘40 Act funds). A comparison
Exhibit 8: Number of UCITS compliant AIFs 2010-2013
2013
656
Malta
Ireland
Luxembourg
2010
562
429
117
16 19 19 20
2011
584
415
150
415 454
2012
620
447
154 182
+17%
Source Monterey Insights, MFSA, Eurekahedge, Oliver Wyman estimates
Exhibit 9: Growth in AuM 2010-2013
180
100
220
2010 20132011 2012
200
160
140
120
+107%
+63%
+13%
Traditional AIFs
Luxembourg, Ireland, Malta(UCITS)
US (’40 Act)
Source Morningstar, Oliver Wyman analysis and estimates
7
of the AuM growth rates reveals the true magnitude of
that trend (see Exhibit 9). Today, most of the large names
in the hedge fund industry employ a UCITS compliant
structure of their investment strategies in parallel to the
traditional AIFs.
Although most investors welcome the regulation of
UCITS fund structures, it imposes significant investment
restrictions at the same time, for example with regard
to the utilisation of derivatives, leverage or investment
concentration. A significant number of the alternative
UCITS funds try to mimic the performance of the
underlying traditional AIFs by employing solutions
based on usage derivatives (e.g. total return swaps).
Regulators on both sides of the Atlantic realised the
possible risks associated with the replication strategies
and put them under investigation (see for example
ESMA Guideline 2012/832)
Overall, UCITS compliant AIFs resulted from investor
demand for regulated funds, but UCITS imposes
significant limitations that make them not always
favoured, especially by large investors. Typically UCITS
structures that have a smaller asset base, suffer from the
strict investment constraints and risk underperforming
the unconstrained parent fund.
3.3. DEMAND FOR ‘ONE-STOP-SHOP’ DOMICILES
We see domiciles offering ‘one-stop-shop’ solutions to
continue to attract funds at expense of domiciles with
less well developed fund infrastructure. One of the
main criteria of fund managers when choosing the fund
domicile is quality of prevailing fund infrastructure in
the jurisdiction. With the introduction of AIFMD, fund
administration has turned out to be a crucial element of
the regulator’s agenda. Under AIFMD, it is required to
appoint an independent depositary for a fund’s assets,
whose function includes safekeeping of the fund’s assets
(with strict liability for custody of financial instruments,
and best efforts verification of ownership of other
assets), cash monitoring as well as overseeing NAV,
distribution and settlement processes, and compliance
with applicable rules.
The increased regulator pressure is expected to foster
the consolidation among fund depositaries. Based
on a 2013 survey3 among fund administrators and
fund managers, 41% of respondents expect reduced
depositary support for certain geographies. Factual
examples can be seen from Bermuda, Guernsey or the
Isle of Man, where HSBC withdrew local operations.
The example of the Isle of Man shows how vital a
comprehensive fund infrastructure for a domicile can
be – number of funds and AuM tumbled since the
departure of HSBC. Overall, we expect large domiciles to
win the race over smaller domiciles with less developed
fund infrastructures.
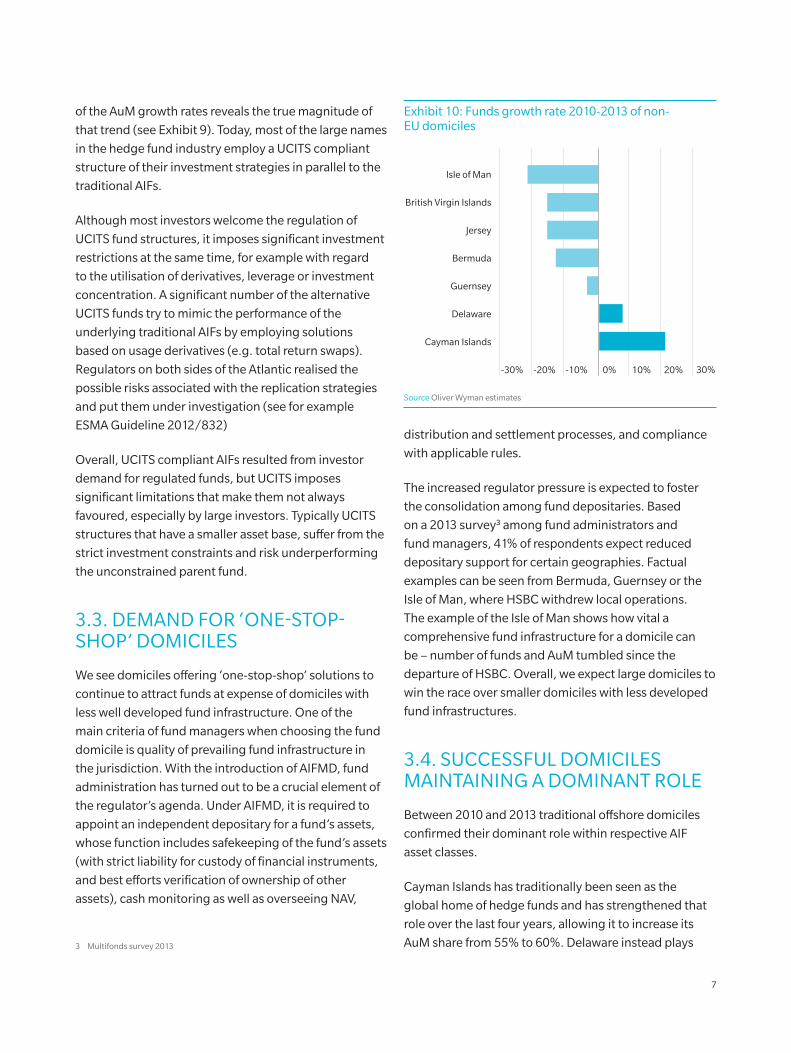
3.4. SUCCESSFUL DOMICILES MAINTAINING A DOMINANT ROLE
Between 2010 and 2013 traditional offshore domiciles
confirmed their dominant role within respective AIF
asset classes.
Cayman Islands has traditionally been seen as the
global home of hedge funds and has strengthened that
role over the last four years, allowing it to increase its
AuM share from 55% to 60%. Delaware instead plays
Exhibit 10: Funds growth rate 2010-2013 of non-EU domiciles
20%10% 30%-10%-20%
Isle of Man
British Virgin Islands
Jersey
Bermuda
Cayman Islands
Guernsey
Delaware
-30% 0%
Source Oliver Wyman estimates
3 Multifonds survey 2013
Copyright © 2014 Oliver Wyman
a dominant position among both, private equity and
real estate funds with nearly 70% of all analysed private
equity and real estate assets domiciled in the US state.
Delaware is an important jurisdiction for US investors
in particular, with some AIF managers having onshore
feeder funds in Delaware for taxable US investors and
an offshore master fund (e.g. on the Cayman Islands) for
non-US taxed investors at the same time. Overall, there
is no clear winner across all asset classes. Instead, there
are asset class dependent elements that decide on the
attractiveness of a domicile – these are discussed in the
following sections.
HEDGE FUNDS
We estimate around 17,700 funds with €2.1 TN AuM
classified as hedge funds. Of this €1.3 TN is currently
domiciled in the Cayman Islands in the form of hedge
funds and funds of hedge funds, confirming the Cayman
Islands dominant role as a global hedge funds domicile.
There are a couple of factors that make the Cayman
Islands so successful. First, they offer a large hedge fund
infrastructure that can supply qualified service providers
(legal counsel, administrators, auditors and directors of
hedge funds) and has a long tradition as hedge funds
jurisdiction with a good reputation among investors.
The domicile is equally popular among US and UK fund
managers, however with UK based fund managers it is
gaining in importance with most inceptions since 2010
coming from UK based hedge funds managers (28%
of all inceptions) – US plays a diminishing role (26%
in 2010, 17% in 2013). In addition, a robust regulatory
regime and no or low entity-level taxation allowed the
Cayman Islands to build a long lasting reputation as a
global hedge funds hub.
Although the Cayman Islands remain dominant on a
global scale, the majority of US hedge funds domicile
in Delaware and British Virgin Islands, making these
domiciles second and third largest respectively of
the analysed hedge funds, both however shrunk
during 2010-2013.
Luxembourg and Ireland are popular among UK
and European fund managers, however Ireland is
experiencing a growing number of registrations from US
fund managers, partly driven by structural changes in
response to the AIMFD.
A similar picture can be seen in Malta, where
traditionally most fund managers come from the
Exhibit 11: Top domicile per asset class by AuM, 2010 vs. 2013 comparison
Cayman Islands
Delaware
Others
HEDGEFUNDS
2010
45%
55%
2013
40%
60%
PRIVATEEQUITY
2010
30%
70%
2013
31%
69%
REALESTATE
2010
40%
60%
2013
33%
67%
Source Oliver Wyman estimates
Exhibit 12: Hedge fund distribution by number of funds and AuM
Cayman Islands
Delaware
BVI
Ireland
Luxembourg
Bermuda
Jersey
Isle of Man
Guernsey
Malta
Number of funds
17,700
53%
15%
12%
4%4%
3%
3%<1% <1%
6%
AuM
€2.1 TN
60%
12%
3%
5%2%
3%
<1%
14%
Note EU numbers for non-UCITS compliant funds only
Source 2013 Oliver Wyman estimates
UK, but the number of US-based fund managers is
steadily increasing.
For the European onshore domiciles in scope,
approximately half of hedge funds are domiciled in
Luxembourg, with the rest split almost evenly between
Ireland and Malta.
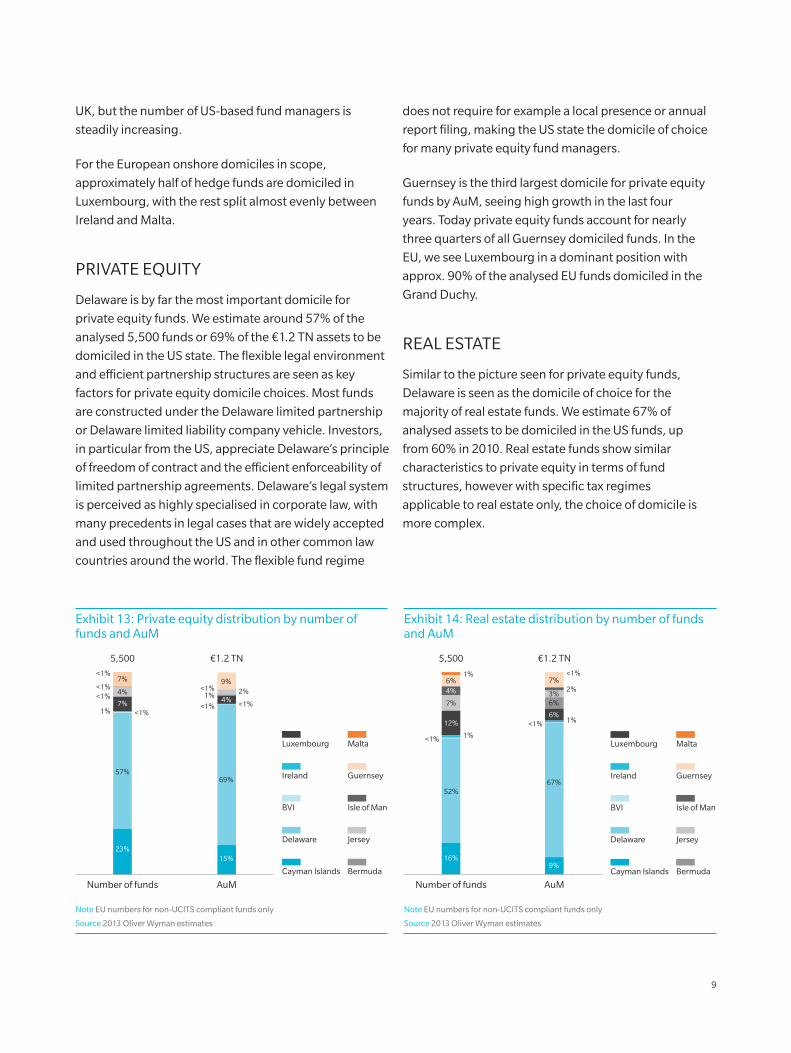
PRIVATE EQUITY
Delaware is by far the most important domicile for
private equity funds. We estimate around 57% of the
analysed 5,500 funds or 69% of the €1.2 TN assets to be
domiciled in the US state. The flexible legal environment
and efficient partnership structures are seen as key
factors for private equity domicile choices. Most funds
are constructed under the Delaware limited partnership
or Delaware limited liability company vehicle. Investors,
in particular from the US, appreciate Delaware’s principle
of freedom of contract and the efficient enforceability of
limited partnership agreements. Delaware’s legal system
is perceived as highly specialised in corporate law, with
many precedents in legal cases that are widely accepted
and used throughout the US and in other common law
countries around the world. The flexible fund regime
does not require for example a local presence or annual
report filing, making the US state the domicile of choice
for many private equity fund managers.
Guernsey is the third largest domicile for private equity
funds by AuM, seeing high growth in the last four
years. Today private equity funds account for nearly
three quarters of all Guernsey domiciled funds. In the
EU, we see Luxembourg in a dominant position with
approx. 90% of the analysed EU funds domiciled in the
Grand Duchy.
REAL ESTATE
Similar to the picture seen for private equity funds,
Delaware is seen as the domicile of choice for the
majority of real estate funds. We estimate 67% of
analysed assets to be domiciled in the US funds, up
from 60% in 2010. Real estate funds show similar
characteristics to private equity in terms of fund
structures, however with specific tax regimes
applicable to real estate only, the choice of domicile is
more complex.
Exhibit 13: Private equity distribution by number of funds and AuM
Number of funds
5,500
23%
AuM
€1.2 TN
Cayman Islands
Delaware
BVI
Ireland
Luxembourg
Bermuda
Jersey
Isle of Man
Guernsey
Malta
15%
57%69%
7%
4%
7% 4%
9%2%
<1%<1%
1%<1%
<1%<1%
<1%
<1%1%
Note EU numbers for non-UCITS compliant funds only
Source 2013 Oliver Wyman estimates
Exhibit 14: Real estate distribution by number of funds and AuM
Number of funds
5,500
16%
AuM
€1.2 TN
Cayman Islands
Delaware
BVI
Ireland
Luxembourg
Bermuda
Jersey
Isle of Man
Guernsey
Malta
9%
12%
4%
6%
52%
7%
6%
67%
6%3%
7%2%
1%
<1%
<1%
<1%
1%
1%
Note EU numbers for non-UCITS compliant funds only
Source 2013 Oliver Wyman estimates
9
Increasing importance of Delaware is also
the result of diminishing role of smaller
domiciles. For example Isle of Man, a
domicile that historically had a strong focus
on real estate funds, faced a challenging
period around 2010 that put asset values
under pressure, triggering a negative
trend from which the domicile did not
recover. In Europe, we see Luxembourg
with the highest share of real estate funds
among analysed European locations with
an estimated 15% of local AIF assets in real
estate and rising. In particular the wide
range of vehicles offered (e.g. SICAF, SICAV,
FCP and newly introduced SCSp) are seen as
suitable choices for real estate funds.
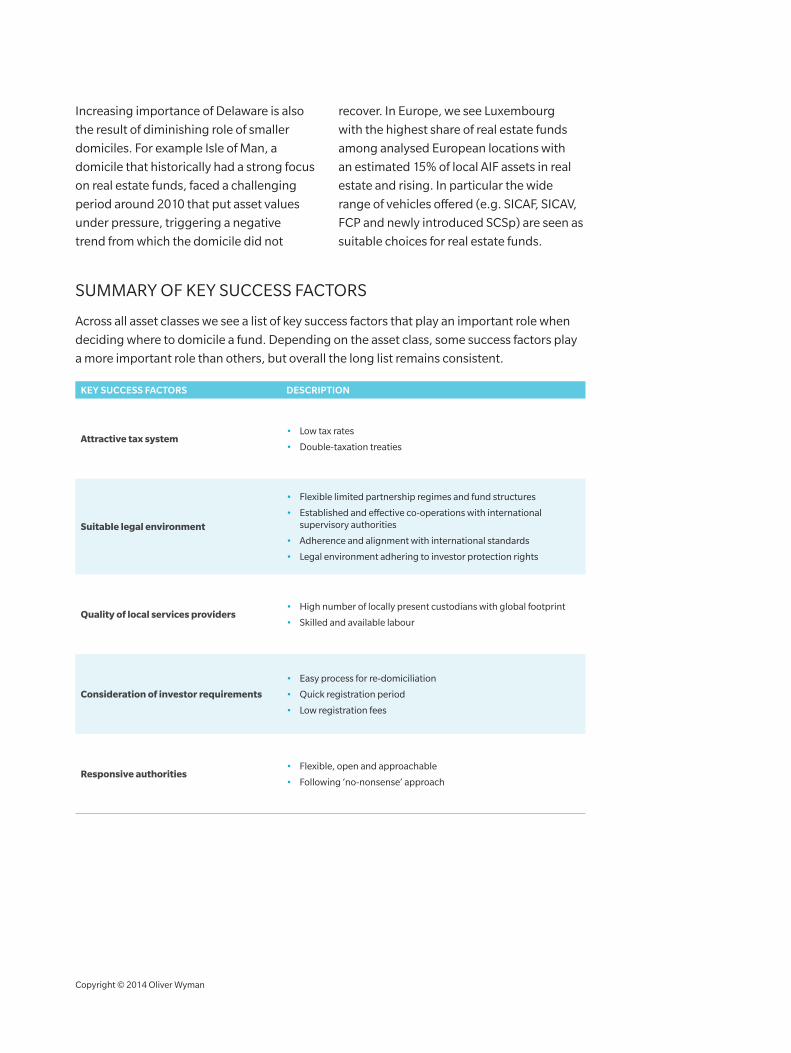
SUMMARY OF KEY SUCCESS FACTORS
Across all asset classes we see a list of key success factors that play an important role when
deciding where to domicile a fund. Depending on the asset class, some success factors play
a more important role than others, but overall the long list remains consistent.
KEY SUCCESS FACTORS DESCRIPTION
Attractive tax system • Low tax rates
• Double-taxation treaties
Suitable legal environment
• Flexible limited partnership regimes and fund structures
• Established and effective co-operations with international supervisory authorities
• Adherence and alignment with international standards
• Legal environment adhering to investor protection rights
Quality of local services providers • High number of locally present custodians with global footprint
• Skilled and available labour
Consideration of investor requirements
• Easy process for re-domiciliation
• Quick registration period
• Low registration fees
Responsive authorities • Flexible, open and approachable
• Following ‘no-nonsense’ approach
Copyright © 2014 Oliver Wyman
4. OUTLOOK
Overall, we expect the demand for regulated AIFs to continue and the boundary between
traditional AIFs and mutual funds to diminish yet further. Given the challenging market
environment for traditional bond and equity investments, we expect investors demand for
alternative investments to remain strong and that they will continue focusing on regulated
vehicles. During the pre-AIMFD period, we saw UCITS compliant structures attracting
significant investor attention in particular from institutional investors demanding regulated
and liquid products. Today, with the introduction of the AIFMD, the market gains access to
a new regulated vehicle that allows participants to structure alternative strategies without
the investment constraints associated with UCITS mutual funds. We therefore expect the
traditional demarcation between regulated mutual funds and non- or less-regulated AIFs to
continue to diminish therefore.
In general, we anticipate the AIFMD will benefit the AIFs industry as a whole. AIFMD
authorisation is not only about legal affairs or compliance, but in the end defines how
fund managers run their business day-to-day. Compliance with the directive signals good
corporate governance and higher investor protection (e.g. asset custody), and increased
transparency (e.g. reporting). We expect AIMFD compliant vehicles to become the preferred
investment regime for investors that look for a combination of both a regulated vehicle and
full blown alternative investment strategies.
11
5. CONCLUSION
In conclusion, we believe most of the existing trends will continue with some of them
even strengthening over the coming years, fuelled by regulatory developments and
investor demand
• The AIFMD increased the attractiveness of European domiciles, a trend we expect to continue with more offshore funds taking advantage of the regulation
• The choices for onshoring remain wide, with expected favouring of co-domiciliation and clone/master-feeder fund structures between offshore and onshore jurisdictions
• Large domiciles expected to maintain their dominant role within respective asset classes
• Increase in importance of well-established fund infrastructure with local presence, as more and more of the regulatory burden is being pushed down along the value chain from fund managers towards infrastructure providers

www.oliverwyman.com
Oliver Wyman is a global leader in management consulting that combines deep industry knowledge with specialised expertise in strategy, operations, risk management, and organisation transformation.
For more information please contact the marketing department by email at [email protected] or by phone at one of the following locations:
EMEA
+44 20 7333 8333
AMERICAS
+1 212 541 8100
ASIA PACIFIC
+65 6510 9700
Copyright © 2014 Oliver Wyman
All rights reserved. This report may not be reproduced or redistributed, in whole or in part, without the written permission of Oliver Wyman and Oliver Wyman accepts no liability whatsoever for the actions of third parties in this respect.
The information and opinions in this report were prepared by Oliver Wyman. This report is not investment advice and should not be relied on for such advice or as a substitute for consultation with professional accountants, tax, legal or financial advisors. Oliver Wyman has made every effort to use reliable, up-to-date and comprehensive information and analysis, but all information is provided without warranty of any kind, express or implied. Oliver Wyman disclaims any responsibility to update the information or conclusions in this report. Oliver Wyman accepts no liability for any loss arising from any action taken or refrained from as a result of information contained in this report or any reports or sources of information referred to herein, or for any consequential, special or similar damages even if advised of the possibility of such damages. The report is not an offer to buy or sell securities or a solicitation of an offer to buy or sell securities. This report may not be sold without the written consent of Oliver Wyman.