Embed Size (px)
Citation preview
HEALTH & CLIMATE CHANGECOUNTRY PROFILE 2020
Small Island Developing States Initiative
Dominica
conTEnTS
1 EXEcUTiVE SUmmaRY
2 KEY REcommEnDaTionS
3 BacKGRoUnD
4 cLimaTE HaZaRDS RELEVanT FoR HEaLTH
8 HEaLTH imPacTS oF cLimaTE cHanGE
11 HEaLTH VULnERaBiLiTY anD aDaPTiVE caPaciTY
14 HEaLTH SEcToR RESPonSE: mEaSURinG PRoGRESS
acknowledgements
This document was developed in collaboration with the Ministry of Health and Social Services, who together with the World Health Organization (WHO), the Pan American Health Organization (PAHO), and the United Nations Framework Convention on Climate Change (UNFCCC) gratefully acknowledge the technical contributions of the people listed below.
Ministry of Health and Social Services Dr David Johnson, Chief Medical OfficerEnvironmental Health Department Sylvester St Ville, Senior Environmental Health Officer and staffDominica Red Cross Sandra Charter-RolleOffice of Disaster Management Fitzroy PascalHealth Information Unit Ghislene PaulNational Centre for Testing Excellence (Bureau of Standards)
Lisa Sandy, Lab Supervisor, Microbiology
Green Climate Fund National Programme Coordinator, Ministry of Planning and Economic Development
Michael Savarin
Climate Resilience Execution Agency of Dominica – CREAD
Colin ScaifeGlen Laville
Pan American Health Organization Caroline Allen, ConsultantAnneke Wilson, Country Program SpecialistKaren Polson-Edwards, Advisor, Climate Change and Environmental Determinants of Health
Financial support for this project was provided by the Norwegian Agency for Development Cooperation (NORAD).
Health and Climate Change Country Profileii
EXEcUTiVE SUmmaRY
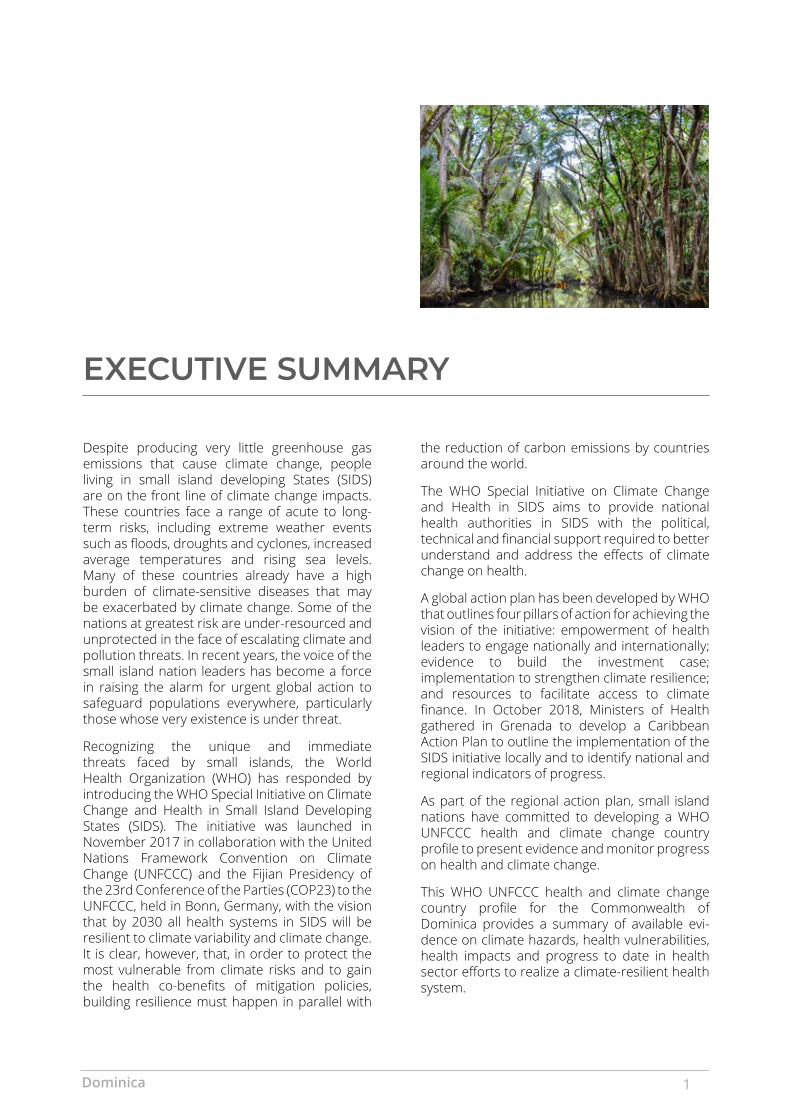
Despite producing very little greenhouse gas emissions that cause climate change, people living in small island developing States (SIDS) are on the front line of climate change impacts. These countries face a range of acute to long-term risks, including extreme weather events such as floods, droughts and cyclones, increased average temperatures and rising sea levels. Many of these countries already have a high burden of climate-sensitive diseases that may be exacerbated by climate change. Some of the nations at greatest risk are under-resourced and unprotected in the face of escalating climate and pollution threats. In recent years, the voice of the small island nation leaders has become a force in raising the alarm for urgent global action to safeguard populations everywhere, particularly those whose very existence is under threat.
Recognizing the unique and immediate threats faced by small islands, the World Health Organization (WHO) has responded by introducing the WHO Special Initiative on Climate Change and Health in Small Island Developing States (SIDS). The initiative was launched in November 2017 in collaboration with the United Nations Framework Convention on Climate Change (UNFCCC) and the Fijian Presidency of the 23rd Conference of the Parties (COP23) to the UNFCCC, held in Bonn, Germany, with the vision that by 2030 all health systems in SIDS will be resilient to climate variability and climate change. It is clear, however, that, in order to protect the most vulnerable from climate risks and to gain the health co-benefits of mitigation policies, building resilience must happen in parallel with
the reduction of carbon emissions by countries around the world.
The WHO Special Initiative on Climate Change and Health in SIDS aims to provide national health authorities in SIDS with the political, technical and financial support required to better understand and address the effects of climate change on health.
A global action plan has been developed by WHO that outlines four pillars of action for achieving the vision of the initiative: empowerment of health leaders to engage nationally and internationally; evidence to build the investment case; implementation to strengthen climate resilience; and resources to facilitate access to climate finance. In October 2018, Ministers of Health gathered in Grenada to develop a Caribbean Action Plan to outline the implementation of the SIDS initiative locally and to identify national and regional indicators of progress.
As part of the regional action plan, small island nations have committed to developing a WHO UNFCCC health and climate change country profile to present evidence and monitor progress on health and climate change.
This WHO UNFCCC health and climate change country profile for the Commonwealth of Dominica provides a summary of available evi-dence on climate hazards, health vulnerabilities, health impacts and progress to date in health sector efforts to realize a climate-resilient health system.
Dominica 1
KEY REcommEnDaTionS
DEVELoP anD imPLEmEnT a HEaLTH anD cLimaTE cHanGE STRaTEGY/PLan FoR Dominica
Develop a national health and climate change plan, including a Health National Adaptation Plan (H-NAP), ensuring that adaptation priorities are specified, health co-benefits from mitigation and adaptation measures are considered, necessary budget requirements are allocated and regular monitoring and review of progress will support its full implementation.
STREnGTHEn inTEGRaTED RiSK SURVEiLLancE anD EaRLY WaRninG SYSTEmS
Expand upon existing health monitoring and surveillance systems, ensuring meteorological information is integrated. Dominica is expected to be affected by a range of health threats due to climate change, including heat stress, nutrition challenges, and mental health and well-being issues, which should be added to existing risk surveillance and early warning systems. The system should have the capacity to measure environmental risk. The purpose will be to develop a comprehensive monitoring and surveillance system, linking climate with health information, permitting early warning and tailored responses to health outcomes of climate change and their environmental determinants. Strengthening of environmental risk measurement will also assist in diagnosis and medical treatment.
aDDRESS BaRRiERS To accESSinG inTERnaTionaL cLimaTE cHanGE FinancE To SUPPoRT HEaLTH aDaPTaTion
No international funding is currently being accessed to aid with health and climate change initiatives. Additional funding would help to further the development and implementation of policies and to expand risk surveillance and early warning systems.
BUiLD cLimaTE-RESiLiEnT HEaLTH caRE FaciLiTiES
Measures can be taken to prevent the potentially devastating impacts of climate change on health service provision, including: conducting hazard assessments; climate-informed planning and costing; strengthening structural safety; climate-resilient storage of medications; contingency planning and back-up systems for essential services (electricity, heating, cooling, ventilation, water supply, sanitation services, waste management and communications); strengthening transport routes and systems; and developing staff capacity to address climate-related risks in communities surrounding health care facilities. A commitment towards low-emission, sustainable practices to improve system stability, promote a healing environment and to mitigate climate change impacts can also be taken.
HEaLTH WoRKFoRcE DEVELoPmEnT
Community resilience can be enhanced by involving them actively in the design of health care facilities and services and, by strengthening their capacity for health care responses. Dominica State College and other national, regional and international educational institutions and technical support agencies should develop capacity in areas such as surveillance and reporting of climate-sensitive health conditions; computerization and dissemination of surveillance, monitoring and evaluation data; sampling and testing of environmental determinants of health; and environmental impact assessment and psychological support following disasters.
1
2
3
4
5
WHo RESoURcES To SUPPoRT acTion on THESE KEY REcommEnDaTionS:https://www.who.int/activities/building-capacity-on-climate-change-human-health/toolkit/
Health and Climate Change Country Profile2
BacKGRoUnD
Dominica is a volcanic island located between the Caribbean Sea and Atlantic Ocean. It has a mountainous terrain, with 90% of Dominica’s population of approximately 71 000 people living along the shore (1–3). Dominica’s natural park system protects much of the island’s biodiversity and rainforests, and promotes eco-tourism. The country is colloquially known as the Nature Island of the Caribbean. Rain-fed agriculture, particularly banana, citrus and coconut production, is a significant proportion of Dominica’s income, accounting for 17% of gross domestic product (GDP) and 14% of employment (2,3). However, despite the fertility of the soil, much of Dominica’s food consumption comes from imports, creating challenges to food security.
Climate change is projected to result in increased temperatures, rising sea levels, changing precipitation patterns, and more extreme weather events. Dominica is particularly vulnerable to climate change because so much of the population lives along the coast and the country’s income is dependent upon agriculture and tourism. Threats to the health of the population include heat stress, food insecurity, vector-borne diseases, salt intrusion of fresh water aquifers, death and injury, and damage to environmental determinants of health from extreme weather events, and loss of marine and terrestrial habitats.
The Government of Dominica is committed to sustainability and established the Environmental Coordinating Unit in 1999. Dominica’s nationally determined contribution (NDC) recognizes the climate risks posed to human health, especially via extreme weather events. The implementation of climate change policies is the joint responsibility of the Ministries of Health and Social Services, and Environment, providing excellent opportunities for maximizing health co-benefits of mitigation and health adaptation actions (4).
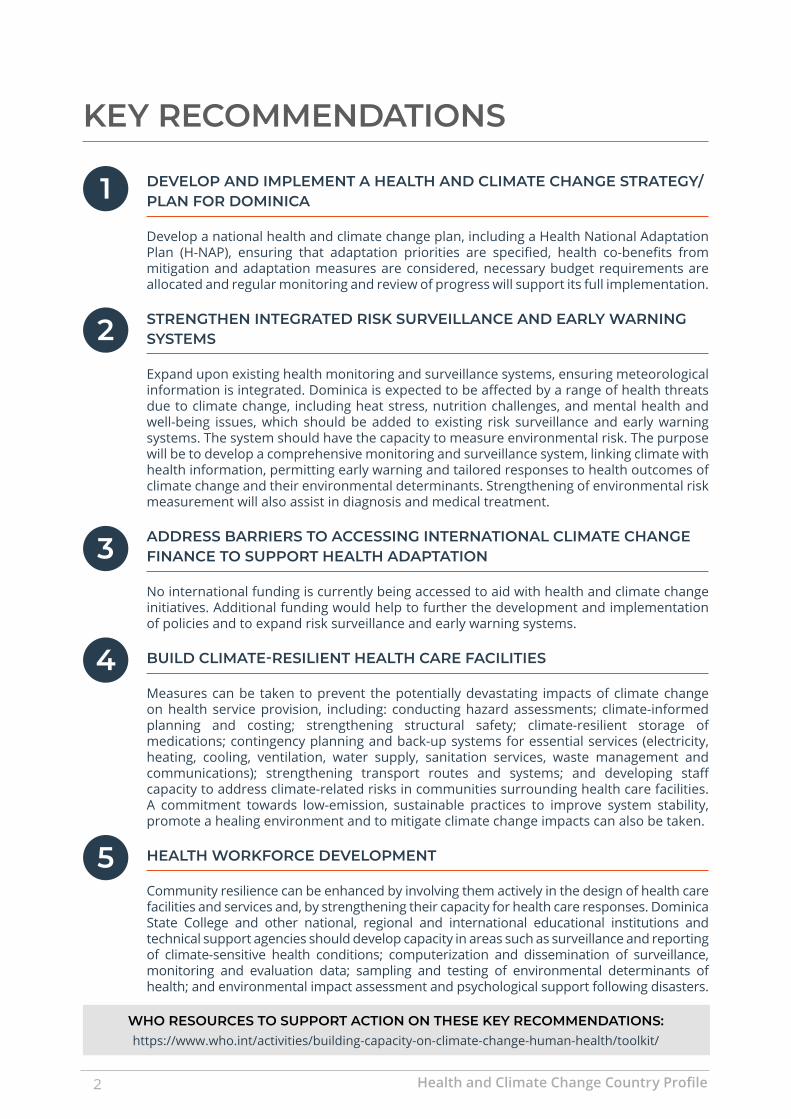
HIGHEST PRIORITY CLIMATE-SENSITIVE HEALTH RISKS FOR DOMINICA
Direct effects
Health impacts of extreme weather events
Heat-related illness
Indirect effects
Water security and safety (including waterborne diseases)
Food security and safety (including malnutrition and foodborne diseases)
Vector-borne diseases
Air pollution
Allergies
Diffuse effects
Mental/psychosocial health
Noncommunicable diseases
Mitigation actions to reduce emissions through sustainable procurement
Mitigation measures to reduce emissions of health facilities
Mitigation measures by coordinating with other sectors
Source: Adapted and updated from the PAHO Health and Climate Country Survey 2017 (5).
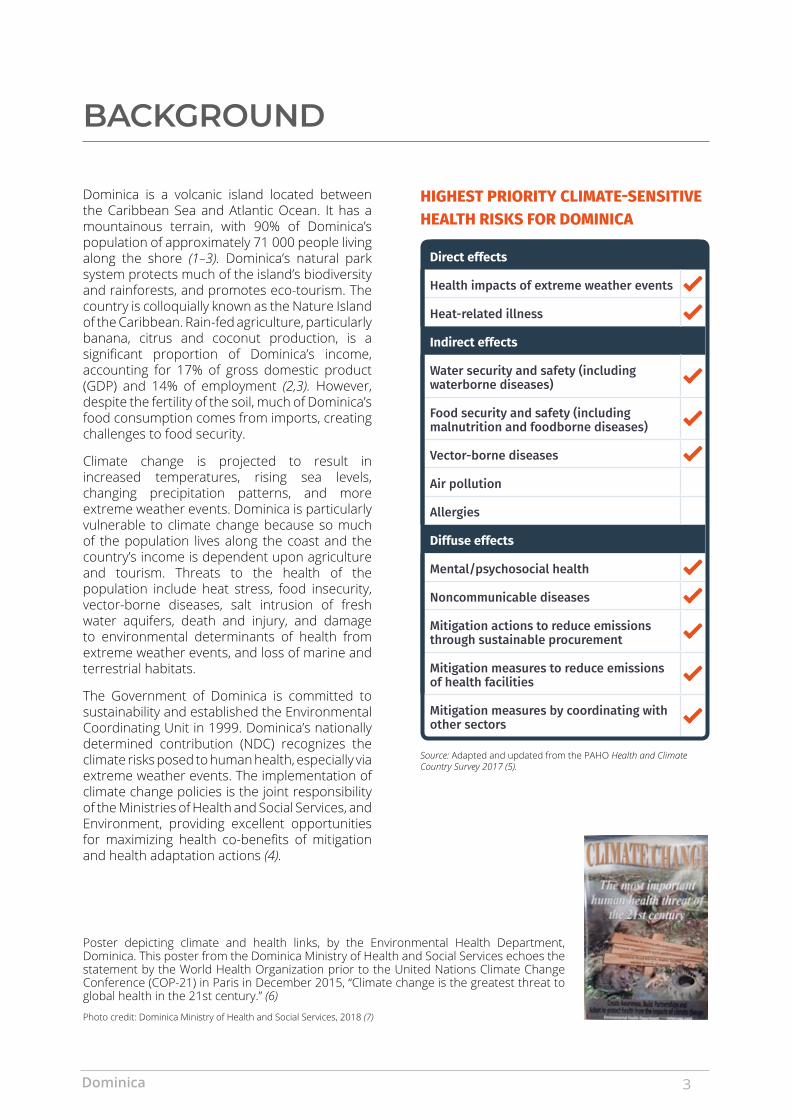
Poster depicting climate and health links, by the Environmental Health Department, Dominica. This poster from the Dominica Ministry of Health and Social Services echoes the statement by the World Health Organization prior to the United Nations Climate Change Conference (COP-21) in Paris in December 2015, “Climate change is the greatest threat to global health in the 21st century.” (6)
Photo credit: Dominica Ministry of Health and Social Services, 2018 (7)
Dominica 3
1900 1950 2000 2050 2100
21
22
23
24
25
26
27
28
1900 1950 2000 2050 2100
0
1000
2000
3000
1900 1950 2000 2050 2100
0
20
40
60
80
100
120
1900 1950 2000 2050 2100
0
20
40
60
YearYear
Year Year
C
Perc
enta
ge o
f hot
day
s (%
)
% to
tal a
nnua
l rai
nfal
l fro
m ve
ry w
et d
ays
Tota
l ann
ual p
pt (m
m)
Mea
n an
nual
tem
p (°
C)
cLimaTE HaZaRDS RELEVanT FoR HEaLTH
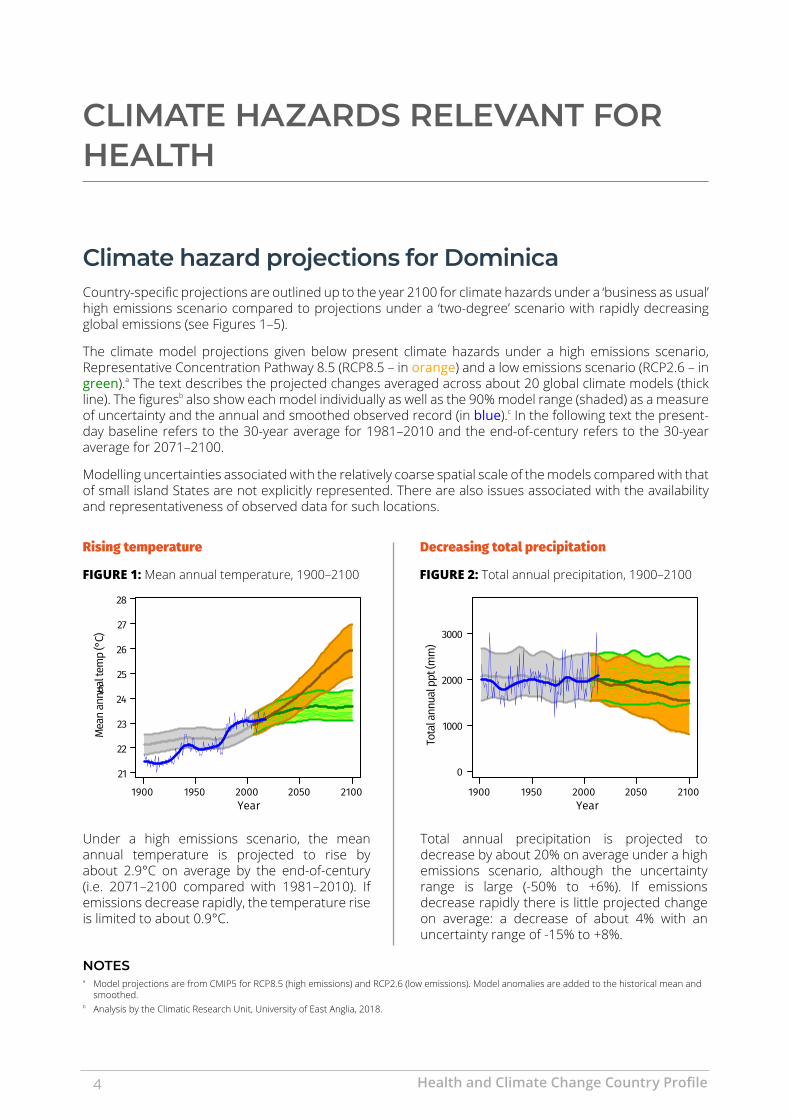
climate hazard projections for DominicaCountry-specific projections are outlined up to the year 2100 for climate hazards under a ‘business as usual’ high emissions scenario compared to projections under a ‘two-degree’ scenario with rapidly decreasing global emissions (see Figures 1–5).
The climate model projections given below present climate hazards under a high emissions scenario, Representative Concentration Pathway 8.5 (RCP8.5 – in orange) and a low emissions scenario (RCP2.6 – in green).a The text describes the projected changes averaged across about 20 global climate models (thick line). The figuresb also show each model individually as well as the 90% model range (shaded) as a measure of uncertainty and the annual and smoothed observed record (in blue).c In the following text the present-day baseline refers to the 30-year average for 1981–2010 and the end-of-century refers to the 30-year average for 2071–2100.
Modelling uncertainties associated with the relatively coarse spatial scale of the models compared with that of small island States are not explicitly represented. There are also issues associated with the availability and representativeness of observed data for such locations.
FIGURE 1: Mean annual temperature, 1900–2100 FIGURE 2: Total annual precipitation, 1900–2100
Under a high emissions scenario, the mean annual temperature is projected to rise by about 2.9°C on average by the end-of-century (i.e. 2071–2100 compared with 1981–2010). If emissions decrease rapidly, the temperature rise is limited to about 0.9°C.
Total annual precipitation is projected to decrease by about 20% on average under a high emissions scenario, although the uncertainty range is large (-50% to +6%). If emissions decrease rapidly there is little projected change on average: a decrease of about 4% with an uncertainty range of -15% to +8%.
Rising temperature Decreasing total precipitation
noTES a Model projections are from CMIP5 for RCP8.5 (high emissions) and RCP2.6 (low emissions). Model anomalies are added to the historical mean and
smoothed.b Analysis by the Climatic Research Unit, University of East Anglia, 2018.
1900 1950 2000 2050 2100
21
22
23
24
25
26
27
28
1900 1950 2000 2050 2100
0
1000
2000
3000
1900 1950 2000 2050 2100
0
20
40
60
80
100
120
1900 1950 2000 2050 2100
0
20
40
60
YearYear
Year Year
C
Perc
enta
ge o
f hot
day
s (%
)
% to
tal a
nnua
l rai
nfal
l fro
m ve
ry w
et d
ays
Tota
l ann
ual p
pt (m
m)
Mea
n an
nual
tem
p (°
C)
Health and Climate Change Country Profile4
c Observed historical record of mean temperature is from CRU-TSv3.26 and total precipitation is from GPCC. Observed historical records of extremes are from JRA55 for temperature and from GPCC-FDD for precipitation.
d A ‘hot day’ (‘hot night’) is a day when maximum (minimum) temperature exceeds the 90th percentile threshold for that time of the year.e The proportion (%) of annual rainfall totals that falls during very wet days, defined as days that are at least as wet as the historically 5% wettest of all days.f SPI is unitless but can be used to categorize different severities of drought (wet): +0.5 to -0.5 near normal conditions; -0.5 to -1.0 slight drought;
-1.0 to -1.5 moderate drought; -1.5 to -2.0 severe drought; below -2.0 extreme drought.
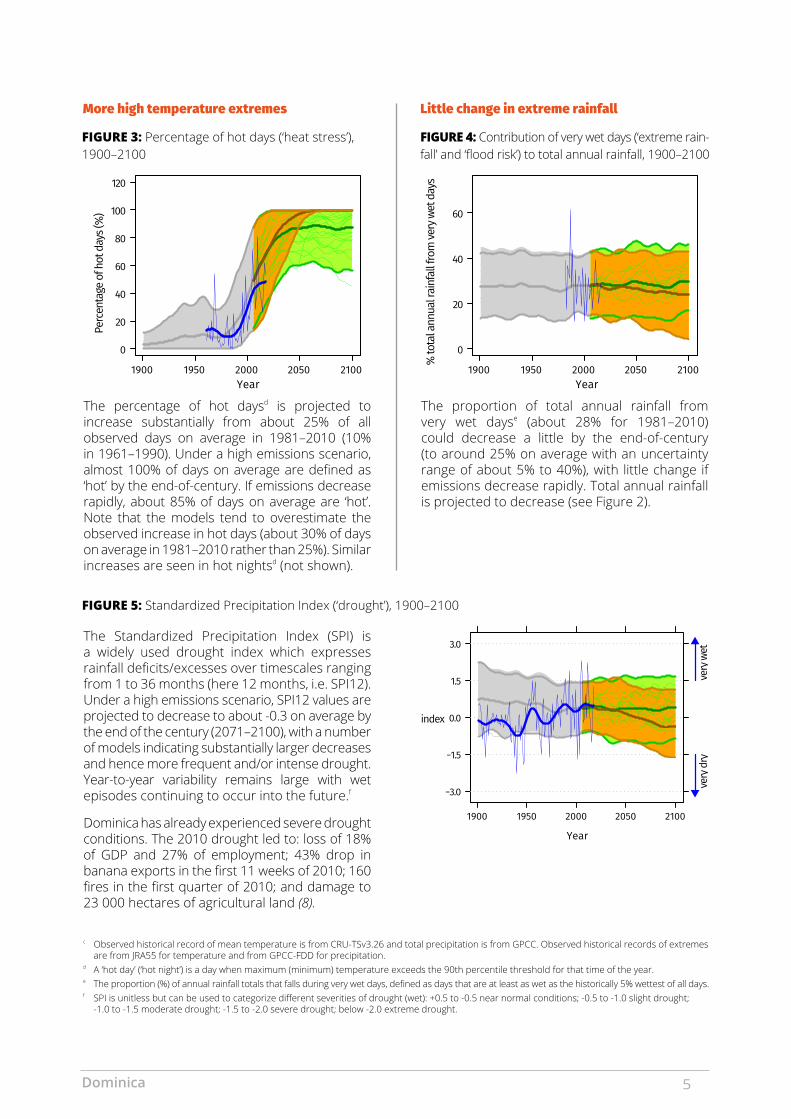
FIGURE 4: Contribution of very wet days (‘extreme rain-fall’ and ‘flood risk’) to total annual rainfall, 1900–2100
FIGURE 3: Percentage of hot days (‘heat stress’), 1900–2100
FIGURE 5: Standardized Precipitation Index (‘drought’), 1900–2100
1900 1950 2000 2050 2100
21
22
23
24
25
26
27
28
1900 1950 2000 2050 2100
0
1000
2000
3000
1900 1950 2000 2050 2100
0
20
40
60
80
100
120
1900 1950 2000 2050 2100
0
20
40
60
YearYear
Year Year
C
Perc
enta
ge o
f hot
day
s (%
)
% to
tal a
nnua
l rai
nfal
l fro
m ve
ry w
et d
ays
Tota
l ann
ual p
pt (m
m)
Mea
n an
nual
tem
p (°
C)
The percentage of hot daysd is projected to increase substantially from about 25% of all observed days on average in 1981–2010 (10% in 1961–1990). Under a high emissions scenario, almost 100% of days on average are defined as ‘hot’ by the end-of-century. If emissions decrease rapidly, about 85% of days on average are ‘hot’. Note that the models tend to overestimate the observed increase in hot days (about 30% of days on average in 1981–2010 rather than 25%). Similar increases are seen in hot nightsd (not shown).
The Standardized Precipitation Index (SPI) is a widely used drought index which expresses rainfall deficits/excesses over timescales ranging from 1 to 36 months (here 12 months, i.e. SPI12). Under a high emissions scenario, SPI12 values are projected to decrease to about -0.3 on average by the end of the century (2071–2100), with a number of models indicating substantially larger decreases and hence more frequent and/or intense drought. Year-to-year variability remains large with wet episodes continuing to occur into the future.f
Dominica has already experienced severe drought conditions. The 2010 drought led to: loss of 18% of GDP and 27% of employment; 43% drop in banana exports in the first 11 weeks of 2010; 160 fires in the first quarter of 2010; and damage to 23 000 hectares of agricultural land (8).
The proportion of total annual rainfall from very wet dayse (about 28% for 1981–2010) could decrease a little by the end-of-century (to around 25% on average with an uncertainty range of about 5% to 40%), with little change if emissions decrease rapidly. Total annual rainfall is projected to decrease (see Figure 2).
More high temperature extremes Little change in extreme rainfall
−3.0
−1.5
0.0
1.5
3.0
very
dr
y
very wet
very dry
index
SPI
Year
1900 1950 2000 2050 2100
very
wet
very
dry
Dominica 5
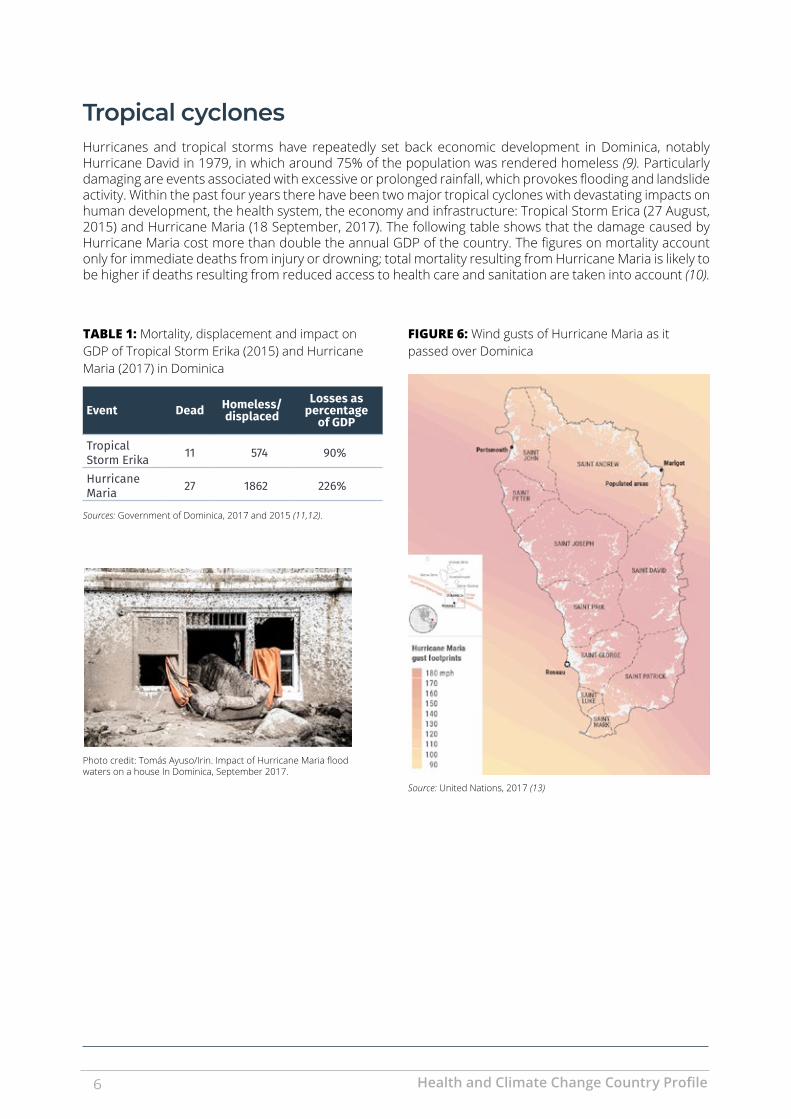
Tropical cyclonesHurricanes and tropical storms have repeatedly set back economic development in Dominica, notably Hurricane David in 1979, in which around 75% of the population was rendered homeless (9). Particularly damaging are events associated with excessive or prolonged rainfall, which provokes flooding and landslide activity. Within the past four years there have been two major tropical cyclones with devastating impacts on human development, the health system, the economy and infrastructure: Tropical Storm Erica (27 August, 2015) and Hurricane Maria (18 September, 2017). The following table shows that the damage caused by Hurricane Maria cost more than double the annual GDP of the country. The figures on mortality account only for immediate deaths from injury or drowning; total mortality resulting from Hurricane Maria is likely to be higher if deaths resulting from reduced access to health care and sanitation are taken into account (10).
Photo credit: Tomás Ayuso/Irin. Impact of Hurricane Maria flood waters on a house In Dominica, September 2017.
Event Dead Homeless/ displaced
Losses as percentage
of GDP
Tropical Storm Erika 11 574 90%
Hurricane Maria 27 1862 226%
Sources: Government of Dominica, 2017 and 2015 (11,12).
TABLE 1: Mortality, displacement and impact on GDP of Tropical Storm Erika (2015) and Hurricane Maria (2017) in Dominica
FIGURE 6: Wind gusts of Hurricane Maria as it passed over Dominica
Source: United Nations, 2017 (13)
Health and Climate Change Country Profile6
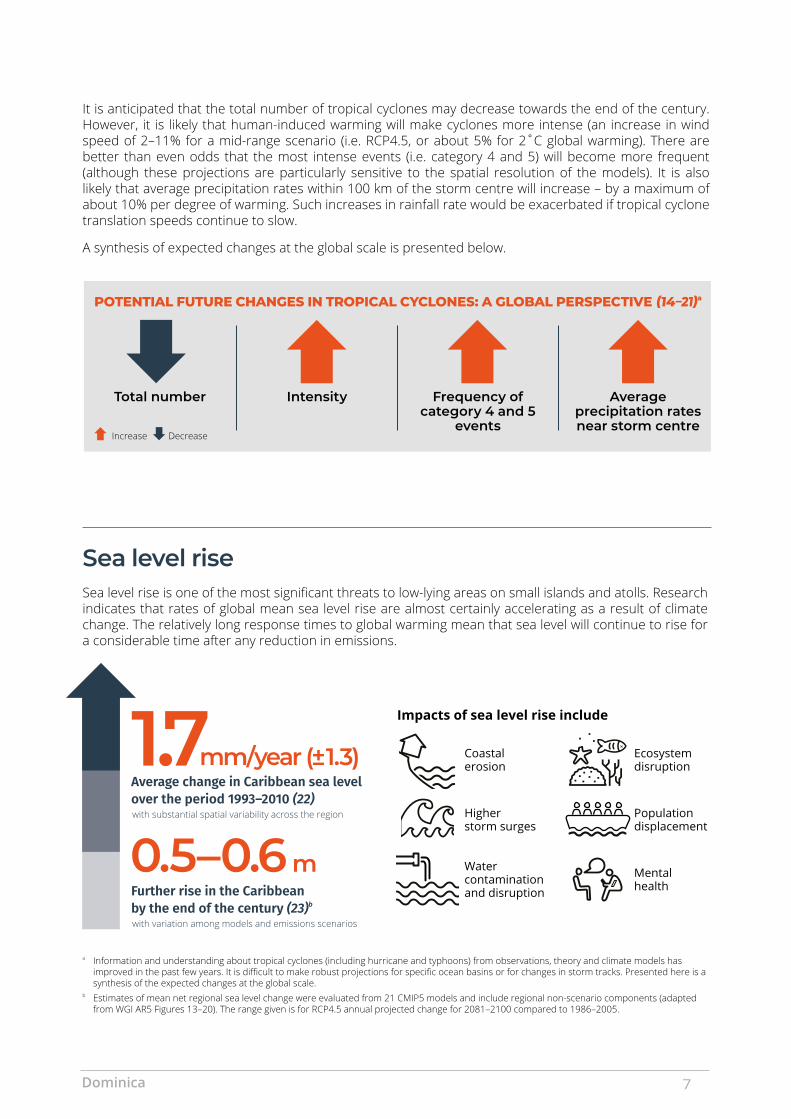
It is anticipated that the total number of tropical cyclones may decrease towards the end of the century. However, it is likely that human-induced warming will make cyclones more intense (an increase in wind speed of 2–11% for a mid-range scenario (i.e. RCP4.5, or about 5% for 2˚C global warming). There are better than even odds that the most intense events (i.e. category 4 and 5) will become more frequent (although these projections are particularly sensitive to the spatial resolution of the models). It is also likely that average precipitation rates within 100 km of the storm centre will increase – by a maximum of about 10% per degree of warming. Such increases in rainfall rate would be exacerbated if tropical cyclone translation speeds continue to slow.
A synthesis of expected changes at the global scale is presented below.
POTENTIAL FUTURE CHANGES IN TROPICAL CYCLONES: A GLOBAL PERSPECTIVE (14–21)a
intensityTotal number Frequency of category 4 and 5
events
average precipitation rates near storm centre
DecreaseIncrease
Sea level riseSea level rise is one of the most significant threats to low-lying areas on small islands and atolls. Research indicates that rates of global mean sea level rise are almost certainly accelerating as a result of climate change. The relatively long response times to global warm ing mean that sea level will continue to rise for a considerable time after any reduction in emis sions.
a Information and understanding about tropical cyclones (including hurricane and typhoons) from observations, theory and climate models has improved in the past few years. It is difficult to make robust projections for specific ocean basins or for changes in storm tracks. Presented here is a synthesis of the expected changes at the global scale.
b Estimates of mean net regional sea level change were evaluated from 21 CMIP5 models and include regional non-scenario components (adapted from WGI AR5 Figures 13–20). The range given is for RCP4.5 annual projected change for 2081–2100 compared to 1986–2005.
Impacts of sea level rise include
Coastal erosion
Ecosystem disruption
Higher storm surges
Population displacement
Water contamination and disruption
Mental health
1.7Average change in Caribbean sea level over the period 1993–2010 (22)
0.5–0.6 mFurther rise in the Caribbean by the end of the century (23)b
with substantial spatial variability across the region
with variation among models and emissions scenarios
mm/year (± 1.3)
Dominica 7
HEaLTH imPacTS oF cLimaTE cHanGE
infectious and vector-borne diseases Some of the world’s most virulent infections are also highly sensitive to climate: temperature, precipitation and humidity have a strong influence on the life-cycles of the vectors and the infectious agents they carry, and influence the transmission of water- and foodborne diseases (24,25).
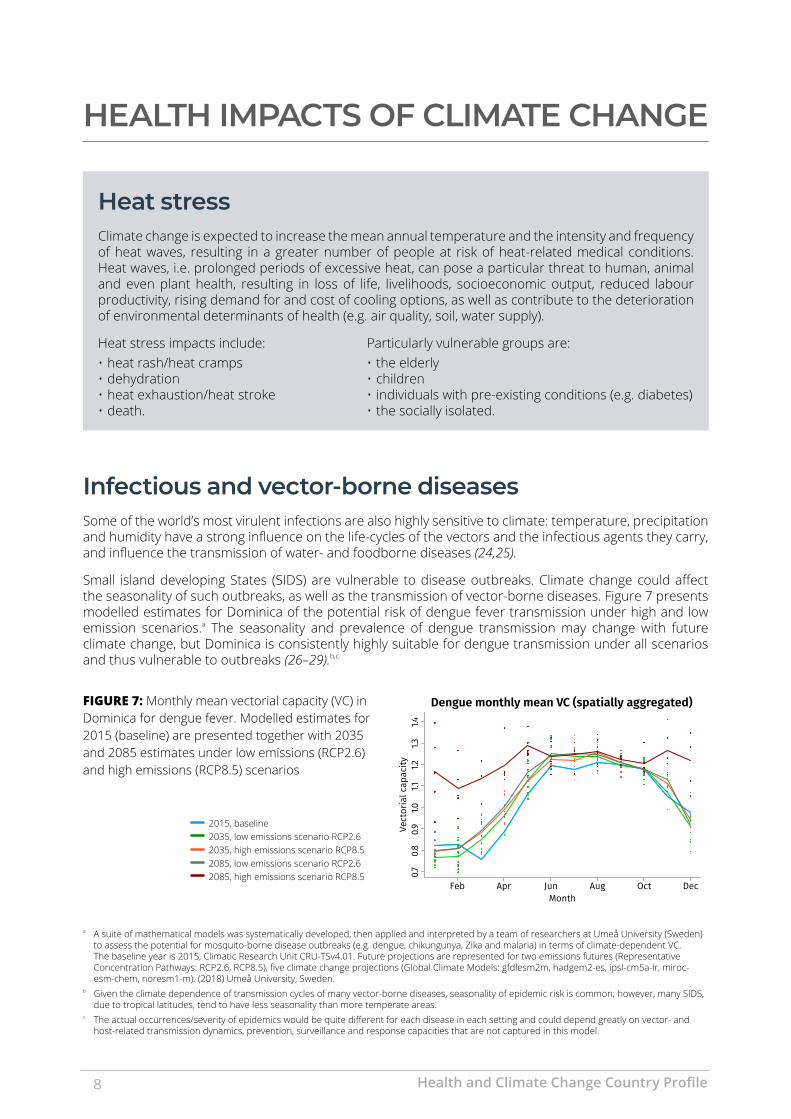
Small island developing States (SIDS) are vulnerable to disease outbreaks. Climate change could affect the seasonality of such outbreaks, as well as the transmission of vector-borne diseases. Figure 7 presents modelled estimates for Dominica of the potential risk of dengue fever transmission under high and low emission scenarios.a The seasonality and prevalence of dengue transmission may change with future climate change, but Dominica is consistently highly suitable for dengue transmission under all scenarios and thus vulnerable to outbreaks (26–29).b,c
Heat stressClimate change is expected to increase the mean annual temperature and the intensity and frequency of heat waves, resulting in a greater number of people at risk of heat-related medical conditions. Heat waves, i.e. prolonged periods of excessive heat, can pose a particular threat to human, animal and even plant health, resulting in loss of life, livelihoods, socioeconomic output, reduced labour productivity, rising demand for and cost of cooling options, as well as contribute to the deterioration of environmental determinants of health (e.g. air quality, soil, water supply).
Heat stress impacts include:• heat rash/heat cramps• dehydration• heat exhaustion/heat stroke• death.
Particularly vulnerable groups are:• the elderly• children• individuals with pre-existing conditions (e.g. diabetes)• the socially isolated.
FIGURE 7: Monthly mean vectorial capacity (VC) in Dominica for dengue fever. Modelled estimates for 2015 (baseline) are presented together with 2035 and 2085 estimates under low emissions (RCP2.6) and high emissions (RCP8.5) scenarios
2015, baseline 2035, low emissions scenario RCP2.6 2035, high emissions scenario RCP8.5 2085, low emissions scenario RCP2.6 2085, high emissions scenario RCP8.5
Vect
oria
l cap
acity
Dengue monthly mean VC (spatially aggregated) Malaria monthly mean VC (spatially aggregrated)
Zika monthly mean VC (spatially aggregrated)Chikungunya monthly mean VC (spatially aggregrated)
Vect
oria
l cap
acity
Vect
oria
l cap
acity
Vect
oria
l cap
acity
Feb Apr Jun Aug Oct DecMonth
Feb Apr Jun Aug Oct DecMonth
Feb Apr Jun Aug Oct DecMonth
Feb Apr Jun Aug Oct DecMonth
1.31.4
1.51.6
1.71.8
1.90.7
0.80.9
1.01.1
1.21.3
1.4
0.40.5
0.60.7
0.80.9
NOT NOT
NOT
0.70.8
0.91.0
1.11.2
1.31.4
a A suite of mathematical models was systematically developed, then applied and interpreted by a team of researchers at Umeå University (Sweden) to assess the potential for mosquito-borne disease outbreaks (e.g. dengue, chikungunya, Zika and malaria) in terms of climate-dependent VC. The baseline year is 2015, Climatic Research Unit CRU-TSv4.01. Future projections are represented for two emissions futures (Representative Concentration Pathways: RCP2.6, RCP8.5), five climate change projections (Global Climate Models: gfdlesm2m, hadgem2-es, ipsl-cm5a-lr, miroc-esm-chem, noresm1-m). (2018) Umeå University, Sweden.
b Given the climate dependence of transmission cycles of many vector-borne diseases, seasonality of epidemic risk is common; however, many SIDS, due to tropical latitudes, tend to have less seasonality than more temperate areas.
c The actual occurrences/severity of epidemics would be quite different for each disease in each setting and could depend greatly on vector- and host-related transmission dynamics, prevention, surveillance and response capacities that are not captured in this model.
Health and Climate Change Country Profile8
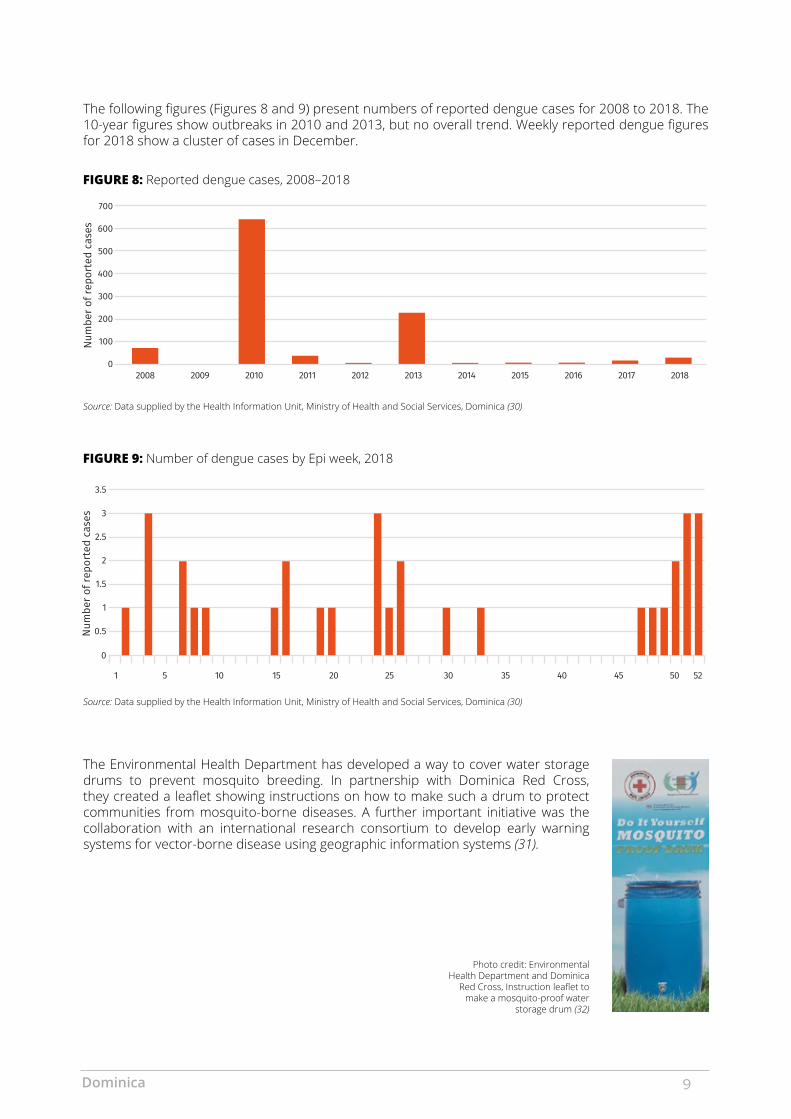
The following figures (Figures 8 and 9) present numbers of reported dengue cases for 2008 to 2018. The 10-year figures show outbreaks in 2010 and 2013, but no overall trend. Weekly reported dengue figures for 2018 show a cluster of cases in December.
The Environmental Health Department has developed a way to cover water storage drums to prevent mosquito breeding. In partnership with Dominica Red Cross, they created a leaflet showing instructions on how to make such a drum to protect communities from mosquito-borne diseases. A further important initiative was the collaboration with an international research consortium to develop early warning systems for vector-borne disease using geographic information systems (31).
FIGURE 8: Reported dengue cases, 2008–2018
FIGURE 9: Number of dengue cases by Epi week, 2018
Source: Data supplied by the Health Information Unit, Ministry of Health and Social Services, Dominica (30)
Source: Data supplied by the Health Information Unit, Ministry of Health and Social Services, Dominica (30)
Photo credit: Environmental Health Department and Dominica
Red Cross, Instruction leaflet to make a mosquito-proof water
storage drum (32)
Num
ber o
f rep
orte
d ca
ses
0
100
200
300
400
500
600
700
2008 2009 2010 2011 2012 2013 2014 2015 2016 2017 2018
Num
ber o
f rep
orte
d ca
ses
(spacers)
1 5 10 15 20 25 30 35 40 45 50 52
0.5
1
1.5
2
2.5
3
3.5
0
Dominica 9

noncommunicable diseases, food and nutrition securitySmall island developing States (SIDS) face distinct challenges that render them particularly vulnerable to the impacts of climate change on food and nutrition security including: small, and widely dispersed, land masses and populations; large rural populations; fragile natural environments and lack of arable land; high vulnerability to climate change, external economic shocks, and natural disasters; high dependence on food imports; dependence on a limited number of economic sectors; and distance from global markets. The majority of SIDS also face a ‘triple-burden’ of malnutrition whereby undernutrition, micronutrient deficiencies and overweight and obesity exist simultaneously within a population, alongside increasing rates of diet-related NCDs.
Climate change is likely to exacerbate the triple-burden of malnutrition and the metabolic and lifestyle risk factors for diet-related NCDs. It is expected to reduce short- and long-term food and nutrition security both directly, through its effects on agriculture and fisheries, and indirectly, by contributing to underlying risk factors such as water insecurity, dependency on imported foods, urbanization and migration, and health service disruption. These impacts represent a significant health risk for SIDS, with their particular susceptibility to climate change impacts and already over-burdened health systems, and this risk is distributed unevenly, with some population groups experiencing greater vulnerability.
In Dominica, temperature rise and changes in weather patterns have impacted the viability of key sectors: agriculture, fisheries and tourism (among others). The drought in 2010 caused massive losses in the agriculture sector. Changing temperatures are altering marine ecology and the viability of fish species. In 2005, a mass coral bleaching event destroyed 75% of the coral colonies in Dominica (8,33). In 2017, Hurricane Maria destroyed most of the foliage, leaving a brown and barren-looking landscape; most agricultural crops were destroyed and reliance on processed food imports grew, increasing susceptibility to noncommunicable diseases as well as generally affecting nutritional quality (34).
NONCOMMUNICABLE DISEASES IN DOMINICA
N/AHealthy life expectancy (2016) (35)
5.2%Adult population considered undernourished (2015–17 3 year average) (36)
28.2%Adult population considered obese (2016) (37)
11.4%Prevalence of diabetes in the adult population (2014) (38)
MOTHER AND CHILD HEALTH
Wasting in children under five years of
age (2018) (40)
iron defi ciency anaemia in
women of repro-ductive age (2016) (39)
Stunting in children under five years of
age (2018) (40)
overweight in children under five years of age (2018)
(40)
2.5% 24.4% 0.5% 3%
Health and Climate Change Country Profile10
HEaLTH VULnERaBiLiTY anD aDaPTiVE caPaciTY
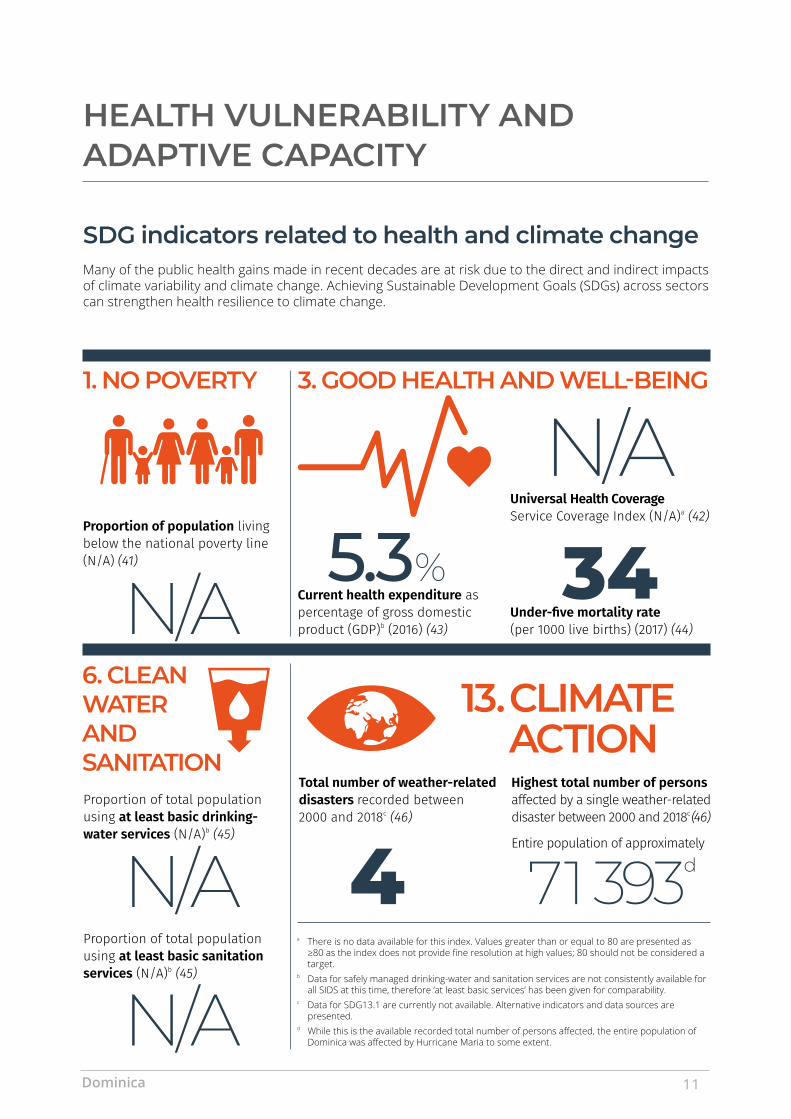
SDG indicators related to health and climate changeMany of the public health gains made in recent decades are at risk due to the direct and indirect impacts of climate variability and climate change. Achieving Sustainable Development Goals (SDGs) across sectors can strengthen health resilience to climate change.
71 393d
Proportion of population living below the national poverty line (N/A) (41)
1. no PoVERTY
N/A
Total number of weather-related disasters recorded between 2000 and 2018c (46)
Highest total number of persons affected by a single weather-related disaster between 2000 and 2018c (46)
Entire population of approximately
4
3. GooD HEaLTH anD WELL-BEinG
Current health expenditure as percentage of gross domestic product (GDP)b (2016) (43)
5.3Under-five mortality rate (per 1000 live births) (2017) (44)
34Universal Health Coverage Service Coverage Index (N/A)a (42)
N/A
Proportion of total population using at least basic drinking-water services (N/A)b (45)
a There is no data available for this index. Values greater than or equal to 80 are presented as ≥80 as the index does not provide fine resolution at high values; 80 should not be considered a target.
b Data for safely managed drinking-water and sanitation services are not consistently available for all SIDS at this time, therefore ‘at least basic services’ has been given for comparability.
c Data for SDG13.1 are currently not available. Alternative indicators and data sources are presented.
d While this is the available recorded total number of persons affected, the entire population of Dominica was affected by Hurricane Maria to some extent.
13. cLimaTE acTion
6. cLEan WaTER anD SaniTaTion
N/AProportion of total population using at least basic sanitation services (N/A)b (45)
N/ADominica 11
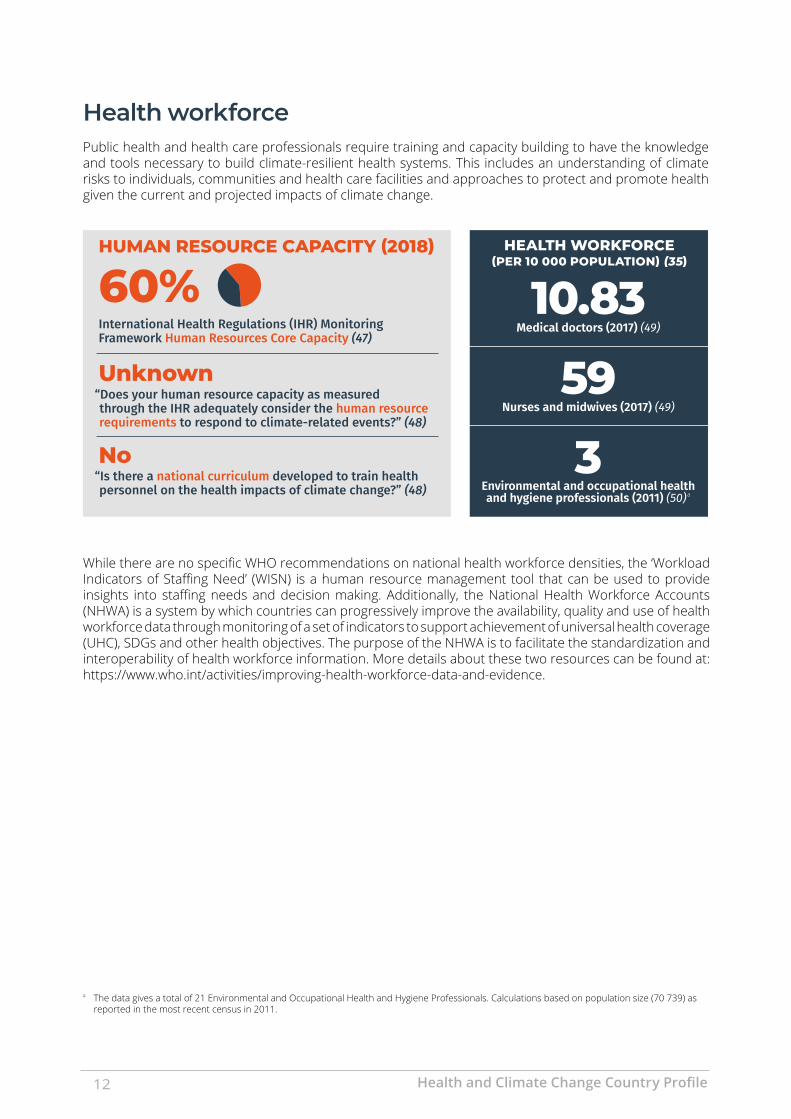
Health workforce Public health and health care professionals require training and capacity building to have the knowledge and tools necessary to build climate-resilient health systems. This includes an understanding of climate risks to individuals, communities and health care facilities and approaches to protect and promote health given the current and projected impacts of climate change.
a The data gives a total of 21 Environmental and Occupational Health and Hygiene Professionals. Calculations based on population size (70 739) as reported in the most recent census in 2011.
International Health Regulations (IHR) Monitoring Framework Human Resources Core Capacity (47)
60%
No
“Does your human resource capacity as measured through the IHR adequately consider the human resource requirements to respond to climate-related events?” (48)
“Is there a national curriculum developed to train health personnel on the health impacts of climate change?” (48)
HUMAN RESOURCE CAPACITY (2018)
Unknown
HEALTH WORKFORCE (PER 10 000 POPULATION) (35)
10.83Medical doctors (2017) (49)
59Nurses and midwives (2017) (49)
3Environmental and occupational health and hygiene professionals (2011) (50)a
While there are no specific WHO recommendations on national health workforce densities, the ‘Workload Indicators of Staffing Need’ (WISN) is a human resource management tool that can be used to provide insights into staffing needs and decision making. Additionally, the National Health Workforce Accounts (NHWA) is a system by which countries can progressively improve the availability, quality and use of health workforce data through monitoring of a set of indicators to support achievement of universal health coverage (UHC), SDGs and other health objectives. The purpose of the NHWA is to facilitate the standardization and interoperability of health workforce information. More details about these two resources can be found at: https://www.who.int/activities/improving-health-workforce-data-and-evidence.
Health and Climate Change Country Profile12
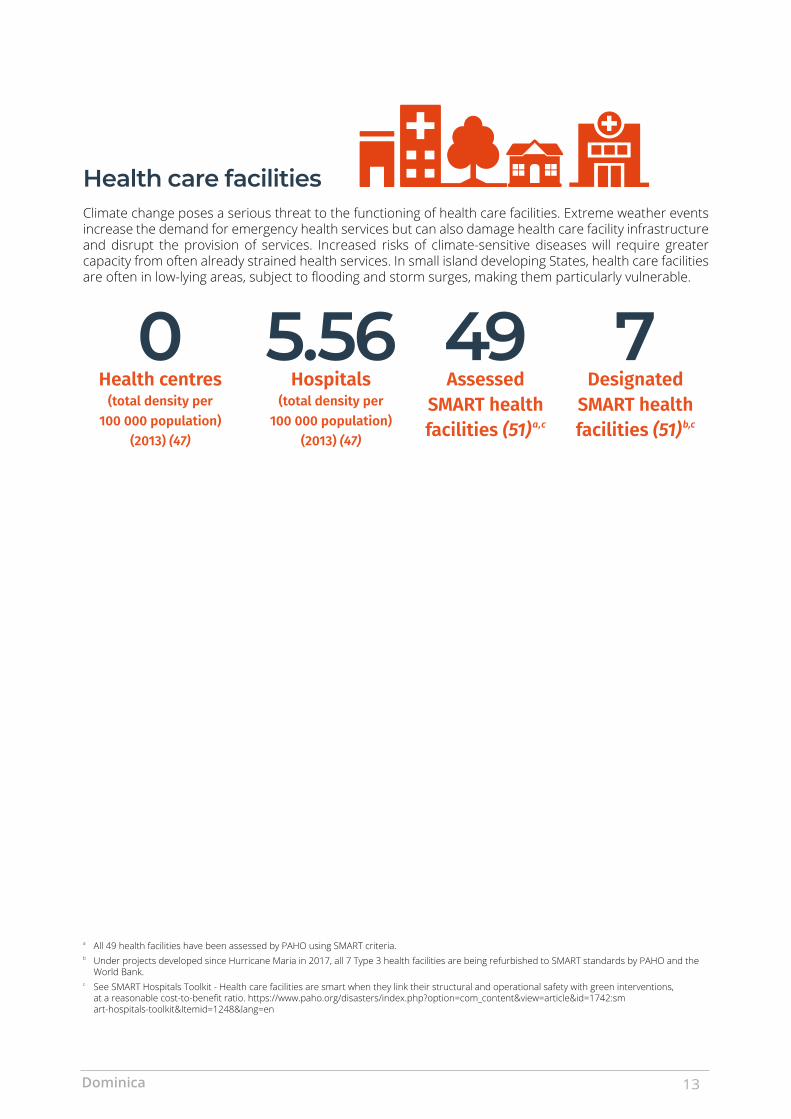
Health care facilitiesClimate change poses a serious threat to the functioning of health care facilities. Extreme weather events increase the demand for emergency health services but can also damage health care facility infrastructure and disrupt the provision of services. Increased risks of climate-sensitive diseases will require greater capacity from often already strained health services. In small island developing States, health care facilities are often in low-lying areas, subject to flooding and storm surges, making them particularly vulnerable.
a All 49 health facilities have been assessed by PAHO using SMART criteria.b Under projects developed since Hurricane Maria in 2017, all 7 Type 3 health facilities are being refurbished to SMART standards by PAHO and the
World Bank.c See SMART Hospitals Toolkit - Health care facilities are smart when they link their structural and operational safety with green interventions,
at a reasonable cost-to-benefit ratio. https://www.paho.org/disasters/index.php?option=com_content&view=article&id=1742:smart-hospitals-toolkit&Itemid=1248&lang=en
0Health centres
(total density per 100 000 population)
(2013) (47)
49Assessed
SMART health facilities (51)a,c
5.56Hospitals
(total density per 100 000 population)
(2013) (47)
7Designated
SMART health facilities (51)b,c
Dominica 13
HEaLTH SEcToR RESPonSE: mEaSURinG PRoGRESS
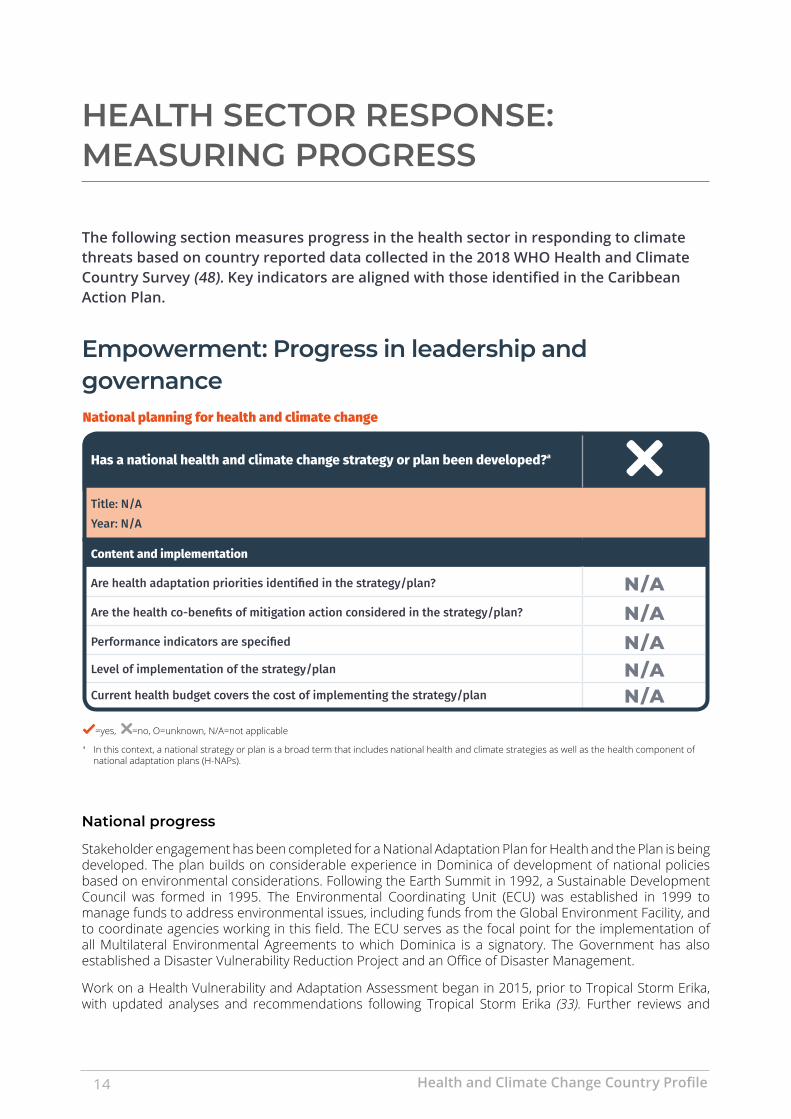
The following section measures progress in the health sector in responding to climate threats based on country reported data collected in the 2018 WHO Health and Climate Country Survey (48). Key indicators are aligned with those identified in the Caribbean Action Plan.
Empowerment: Progress in leadership and governance National planning for health and climate change
Has a national health and climate change strategy or plan been developed?a
Title: N/A Year: N/A
Content and implementation
Are health adaptation priorities identified in the strategy/plan? N/AAre the health co-benefits of mitigation action considered in the strategy/plan? N/APerformance indicators are specified N/ALevel of implementation of the strategy/plan N/ACurrent health budget covers the cost of implementing the strategy/plan N/A=yes, =no, O=unknown, N/A=not applicable
a In this context, a national strategy or plan is a broad term that includes national health and climate strategies as well as the health component of national adaptation plans (H-NAPs).
national progress
Stakeholder engagement has been completed for a National Adaptation Plan for Health and the Plan is being developed. The plan builds on considerable experience in Dominica of development of national policies based on environmental considerations. Following the Earth Summit in 1992, a Sustainable Development Council was formed in 1995. The Environmental Coordinating Unit (ECU) was established in 1999 to manage funds to address environmental issues, including funds from the Global Environment Facility, and to coordinate agencies working in this field. The ECU serves as the focal point for the implementation of all Multilateral Environmental Agreements to which Dominica is a signatory. The Government has also established a Disaster Vulnerability Reduction Project and an Office of Disaster Management.
Work on a Health Vulnerability and Adaptation Assessment began in 2015, prior to Tropical Storm Erika, with updated analyses and recommendations following Tropical Storm Erika (33). Further reviews and
Health and Climate Change Country Profile14
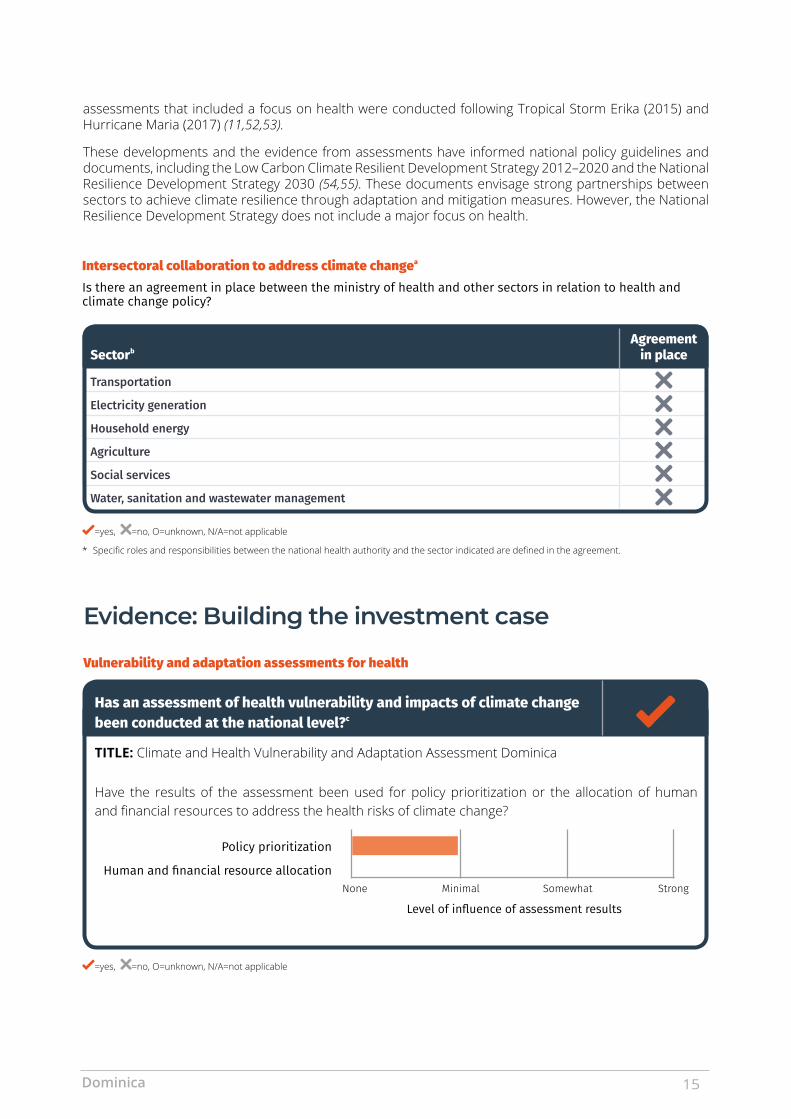
Evidence: Building the investment case
Vulnerability and adaptation assessments for health
Has an assessment of health vulnerability and impacts of climate change been conducted at the national level?c
TITLE: Climate and Health Vulnerability and Adaptation Assessment Dominica
Have the results of the assessment been used for policy prioritization or the allocation of human and financial resources to address the health risks of climate change?
Policy prioritization
Human and financial resource allocation
Level of influence of assessment results
None SomewhatMinimal Strong
=yes, =no, O=unknown, N/A=not applicable
Intersectoral collaboration to address climate changea Is there an agreement in place between the ministry of health and other sectors in relation to health and climate change policy?
SectorbAgreement
in place
Transportation
Electricity generation
Household energy
Agriculture
Social services
Water, sanitation and wastewater management
=yes, =no, O=unknown, N/A=not applicable
* Specific roles and responsibilities between the national health authority and the sector indicated are defined in the agreement.
assessments that included a focus on health were conducted following Tropical Storm Erika (2015) and Hurricane Maria (2017) (11,52,53).
These developments and the evidence from assessments have informed national policy guidelines and documents, including the Low Carbon Climate Resilient Development Strategy 2012–2020 and the National Resilience Development Strategy 2030 (54,55). These documents envisage strong partnerships between sectors to achieve climate resilience through adaptation and mitigation measures. However, the National Resilience Development Strategy does not include a major focus on health.
Dominica 15
33+19+16+10+9+8+5+I
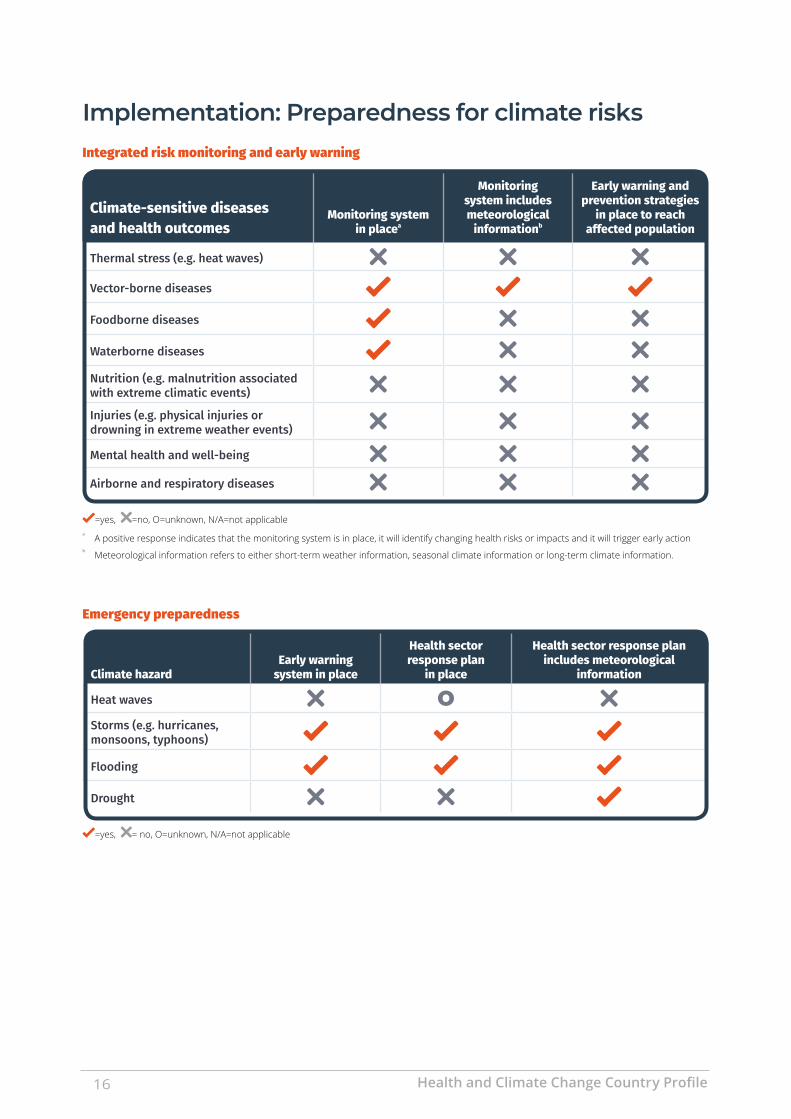
Emergency preparedness
Climate hazardEarly warning
system in place
Health sector response plan
in place
Health sector response plan includes meteorological
information
Heat waves
Storms (e.g. hurricanes, monsoons, typhoons)
Flooding
Drought
=yes, = no, O=unknown, N/A=not applicable
implementation: Preparedness for climate risks Integrated risk monitoring and early warning
Climate-sensitive diseases and health outcomes
Monitoring system in placea
Monitoring system includes meteorological
informationb
Early warning and prevention strategies
in place to reach affected population
Thermal stress (e.g. heat waves)
Vector-borne diseases
Foodborne diseases
Waterborne diseases
Nutrition (e.g. malnutrition associated with extreme climatic events)
Injuries (e.g. physical injuries or drowning in extreme weather events)
Mental health and well-being
Airborne and respiratory diseases
=yes, =no, O=unknown, N/A=not applicablea A positive response indicates that the monitoring system is in place, it will identify changing health risks or impacts and it will trigger early action
b Meteorological information refers to either short-term weather information, seasonal climate information or long-term climate information.
Health and Climate Change Country Profile16
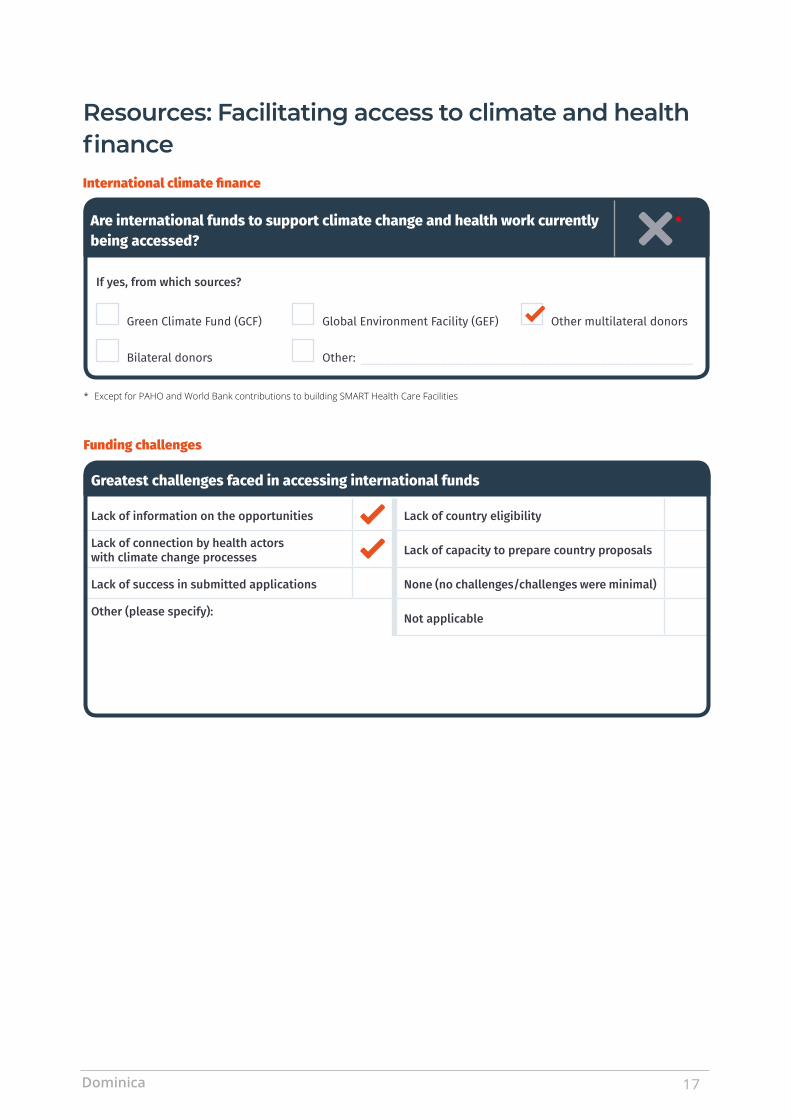
Resources: Facilitating access to climate and health financeInternational climate finance
Are international funds to support climate change and health work currently being accessed?
*
If yes, from which sources?
Green Climate Fund (GCF) Global Environment Facility (GEF) Other multilateral donors
Bilateral donors Other: ______________________________________________________
* Except for PAHO and World Bank contributions to building SMART Health Care Facilities
Funding challenges
Greatest challenges faced in accessing international funds
Lack of information on the opportunities Lack of country eligibility
Lack of connection by health actors with climate change processes Lack of capacity to prepare country proposals
Lack of success in submitted applications None (no challenges/challenges were minimal)
Other (please specify): Not applicable
Dominica 17
REFEREncES1. Population and Housing Census 2011. Roseau: Commonwealth of
Dominica; 2011.2. Climate Change Knowledge Portal: Dominica. Washington DC: World
Bank Group; 2018 (https://climateknowledgeportal.worldbank.org/country/dominica, accessed 21 May 2019).
3. Climate Change Adaptation – Dominica. New York: United Nations Development Programme; 2019 (https://www.adaptation-undp.org/explore/caribbean/dominica, accessed 21 May 2019).
4. Intended Nationally Determined Contribution (INDC) of the Commonwealth of Dominica. Roseau: Government of the Commonwealth of Dominica; 2015.
5. PAHO (2017). Health and Climate Country Survey.6. WHO calls for urgent action to protect health from climate change –
Sign the call. Geneva: World Health Organization; 2015 (https://www.who.int/globalchange/global-campaign/cop21/en/, accessed 24 June 2020).
7. Roseau: Dominica Ministry of Health and Social Services; 2018.8. St. Ville, Berry, Verret M. Dominica Climate Change and
Health Vulnerability and Adaptation Assessment: Key Findings (presentation). Dominica. Roseau: Ministry of Health and the Environment; 2016.
9. Lawrence M. Hurricane David: Preliminary Report; 1979.10. Kishore N, Marqués D, Mahmud A, Kiang MV, Rodriguez I, Fuller A
et al. Mortality in Puerto Rico after Hurricane Maria. New England Journal of Medicine. 379(2):162–170
11. Post-Disaster Needs Assessment: Hurricane Maria, September 18, 2017. Roseau: Ministry of Finance; 2017.
12. Government of the Commonwealth of Dominica; 2015.13. Flash Appeal: Hurricane Maria Dominica. New York: United Nations;
2017.14. Bender et al. Modeled impact of anthropogenic warming on the
frequency of intense Atlantic hurricanes. Science. 2010; 327: 454–458.
15. Christensen JH, Krishna Kumar K, Aldrian E, An S-I, Cavalcanti IFA, de Castro M et al. Climate phenomena and their relevance for future regional climate change. In: Stocker TF, Qin D, Plattner G-K, Tignor M, Allen SK, Boschung J et al., editors. Climate change 2013: the physical science basis. Contribution of Working Group I to the Fifth Assessment Report of the Intergovernmental Panel on Climate Change. Cambridge and New York: Cambridge University Press; 2013.
16. Knutson TR, Sirutis JJ, Zhao M, Tuleya RE, Bender M, Vecchi GA et al. Global projections of intense tropical cyclone activity for the late twenty-first century from dynamical downscaling of CMIP5/RCP4.5 scenarios. J Clim. 2015; 28:7203–24.
17. Kossin JP, Emanuel KA, Vecchi GA. The poleward migration of the location of tropical cyclone maximum intensity. Nature. 2014;509:349–52.
18. Kossin JP. A global slowdown of tropical-cyclone translation speed. Nature. 2018; 558:104–8.
19. Sobel AH, Camargo SJ, Hall TM, Lee CY, Tippett MK, Wing AA. Human influence on tropical cyclone intensity. Science. 2016; 353:242–6.
20. Walsh KJE, McBride JL, Klotzbach PJ, Balachandran S, Camargo SJ, Holland G et al. Tropical cyclones and climate change. WIREs Climate Change. 2016; 7:65–89.
21. Yoshida K, Sugi M, Mizuta R, Murakami H, Ishii M. Future changes in tropical cyclone activity in high-resolution large-ensemble simulations. Geophysical Res. Lett. 2017; 44:9910–17.
22. Torres and Tsimpli. Sea-level trends and interannual variability in the Caribbean Sea. Journal of Geophysical Research: Oceans. 2013; 118(6): 2934–2947.
23. Nurse et al. Small islands. In: Climate Change 2014: Impacts, Adaptation, and Vulnerability. Part B: Regional Aspects. Contribution of Working Group II to the Fifth Assessment Report of the Intergovernmental Panel on Climate Change [Barros et al. (eds.)]. Cambridge University Press; 2014.
24. Atlas of health and climate. Geneva: World Health Organization and World Meteorological Organization; 2012.

WHO/HEP/ECH/CCH/20.01.04
© World Health Organization and the United Nations Framework Convention on Climate Change, 2020
Some rights reserved. This work is available under the CC BY-NC-SA 3.0 IGO licence
All reasonable precautions have been taken by WHO and UNFCCC to verify the information contained in this publication. However, the published material is being distributed without warranty of any kind, either expressed or implied. The responsibility for the interpretation and use of the material lies with the reader. In no event shall WHO and UNFCCC be liable for damages arising from its use.
Most estimates and projections provided in this document have been derived using standard categories and methods to enhance their cross-national comparability. As a result, they should not be regarded as the nationally endorsed statistics of Member States which may have been derived using alternative methodologies. Published official national statistics, if presented, are cited and included in the reference list.
Design by Inís Communication from a concept by N. Duncan Mills
Photos: iStock
25. Quantitative risk assessment of the effects of climate change on selected causes of death, 2030s and 2050s. Hales S, Kovats S, Lloyd S, Campbell-Lendrum D, editors. Geneva: World Health Organization; 2014 (https://apps.who.int/iris/bitstream/handle/10665/134014/9789241507691_eng.pdf?sequence=1, accessed 27 May 2019).
26. Quam, Mikkel B. Imported infections’ importance: global change driving dengue dynamics [dissertation]. Umeå: Umeå University; 2016.
27. Liu-Helmersson J. Climate change, dengue and Aedes mosquitoes: past trends and future scenarios [dissertation]. Umeå: Umeå University; 2018.
28. Liu-Helmersson J, Quam M, Wilder-Smith A, Stenlund H, Ebi K, Massad E et al. Climate change and Aedes vectors: 21st century projections for dengue transmission in Europe. EBioMedicine. 2016; 7:267–77.
29. Rocklöv J, Quam MB, Sudre B, German M, Kraemer MU, Brady O et al. Assessing seasonal risks for the introduction and mosquito borne spread of Zika virus in Europe. EBioMedicine. 2016; 9:250–6.
30. Health Information Unit, Ministry of Health and Social Services, Dominica.
31. Stewart Ibarra, A. M., S. J. Ryan, M. Borbor Cordova, M. Romero, R. Lowe, C. Lippi and C. Carlson. A spatio-temporal modeling framework for Aedes aegypti transmitted diseases in the Caribbean. Bridgetown: Caribbean Institute of Meteorology and Hydrology; 2017.
32. Environmental Health Department and Dominica Red Cross.33. Assessment of Climate Change and Health Vulnerability and
Adaptation in Dominica. Roseau: Dominica Ministry of Health and Social Services; 2016.
34. State of Public Health in the Caribbean Report 2017–2018 Climate and Health: Averting and Responding to an Unfolding Health Crisis. Port of Spain; 2018.
35. Global Health Observatory data repository. Healthy life expectancy (HALE) at birth. Geneva: World Health Organization; 2019 (https://www.who.int/gho/mortality_burden_disease/life_tables/hale/en/, accessed 9 May 2019).
36. The state of food security and nutrition in the world 2018: building climate resilience for food security and nutrition. Rome: Food and Agriculture Organization of the United Nations; 2018 (http://www.fao.org/3/i9553en/i9553en.pdf, accessed 27 May 2019).
37. Global Health Observatory data repository. Prevalence of obesity among adults, BMI ≥30, crude estimates by country. Geneva: World Health Organization; 2017 (http://apps.who.int/gho/data/node.main.BMI30C?lang=en, accessed 9 May 2019).
38. Global report on diabetes. Geneva: World Health Organization; 2016 (https://apps.who.int/iris/bitstream/handle/10665/204871/9789241565257_eng.pdf?sequence=1, accessed 27 May 2019).
39. Global Health Observatory. Prevalence of anaemia in women. Geneva: World Health Organization; 2019 (http://apps.who.int/gho/data/node.main.ANEMIA3?lang=en, accessed 30 May 2019).
40. Data on wasting, stunting and overweight in children under 5 years old. Roseau: Dominica Ministry of Health and Social Services; 2019.
41. Poverty data. Washington DC: World Bank Group; 2019 (https://data.worldbank.org/topic/poverty, accessed 21 March 2019).
42. Global Health Observatory. Universal health coverage portal. Geneva: World Health Organization; 2017 (http://apps.who.int/gho/data/view.main.INDEXOFESSENTIALSERVICECOVERAGEv, accessed 17 May 2019).
43. Global Health Expenditure Database. Geneva: World Health Organization; 2019 (https://apps.who.int/nha/database, accessed 17 May 2019).
44. UN Inter-agency Group for Child Mortality Estimation. Child mortality estimates. New York: United Nations Children’s Fund; 2018 (http://www.childmortality.org,accessed 20 November 2018).
45. WHO/UNICEF Joint Monitoring Programme for Water Supply, Sanitation and Hygiene (JMP). Geneva: World Health Organization/ New York: United Nations Children’s Fund; 2019 (https://washdata.org/data, accessed 1 August 2019).
46. Emergency Events Database (EM-DAT). Louvain: Centre for Research on the Epidemiology of Disasters, Université catholique de Louvain; 2019 (https//www.emdat.be, accessed 25 April 2019).
47. International Health Regulations (2005) Monitoring Framework. State Party Self-Assessment Annual Reporting tool (e-SPAR). Geneva: World Health Organization; 2019 (https://extranet.who.int/e-spar, accessed 9 May 2019).
48. WHO Climate and Health Country Survey as part of the WHO UNFCCC Health and Climate Change Country Profile Initiative. Geneva: World Health Organization; 2018 (https://www.who.int/globalchange/resources/countries/en/).
49. WHO Global Health Workforce Statistics, December 2018 update. Geneva: World Health Organization; 2018 (http://www.who.int/hrh/statistics/hwfstats/, accessed 14 May 2019).
50. Public Service Staff Allocation Estimates, 2018–19.51. Government of Dominica. SMART Facilities.52. National After Action Review of Events relating to the Impact of
Tropical Storm Erika on the Commonwealth of Dominica December 16–17, 2015. Port of Spain: Caribbean Public Health Agency; 2015.
53. Health Sector Report - Rapid Needs Assessment Team (RNAT) response, Post Hurricane Maria. Dominica Sept 20–26 2017. Port of Spain: Caribbean Public Health Agency; 2017.
54. Low Carbon Climate Resilient Development Strategy 2012–2020. Roseau: Government of Dominica; 2012.
55. National Resilient Development Strategy 2030: Building the World’s First Climate Resilient Country – Our Collective Responsibility. Roseau: Government of Dominica; 2018.