Embed Size (px)
Citation preview
Don Hamson Head of Active Australian Equities
CapacityWhen is enough, enough?
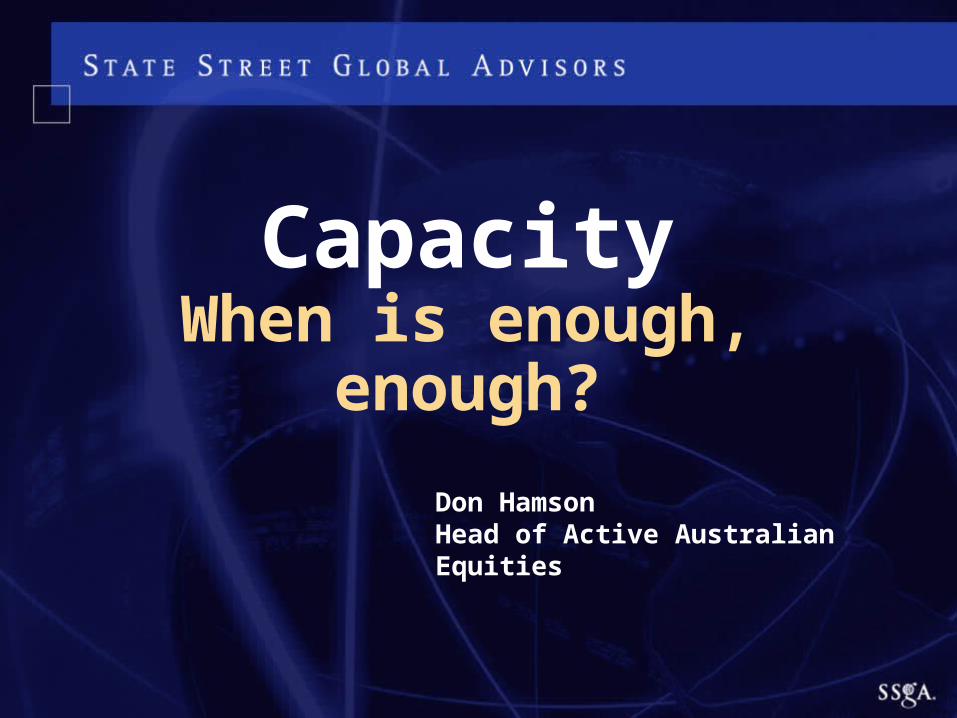
Australian Equities Managers Assets Under Management
As at June 30, 2004
Source: InvestorInfo Limited
0
5,000
10,000
15,000
20,000
25,000
1 4 7 10 13 16 19 22 25 28 31 34 37 40
0%
20%
40%
60%
80%
100%
120%
AUM Managed
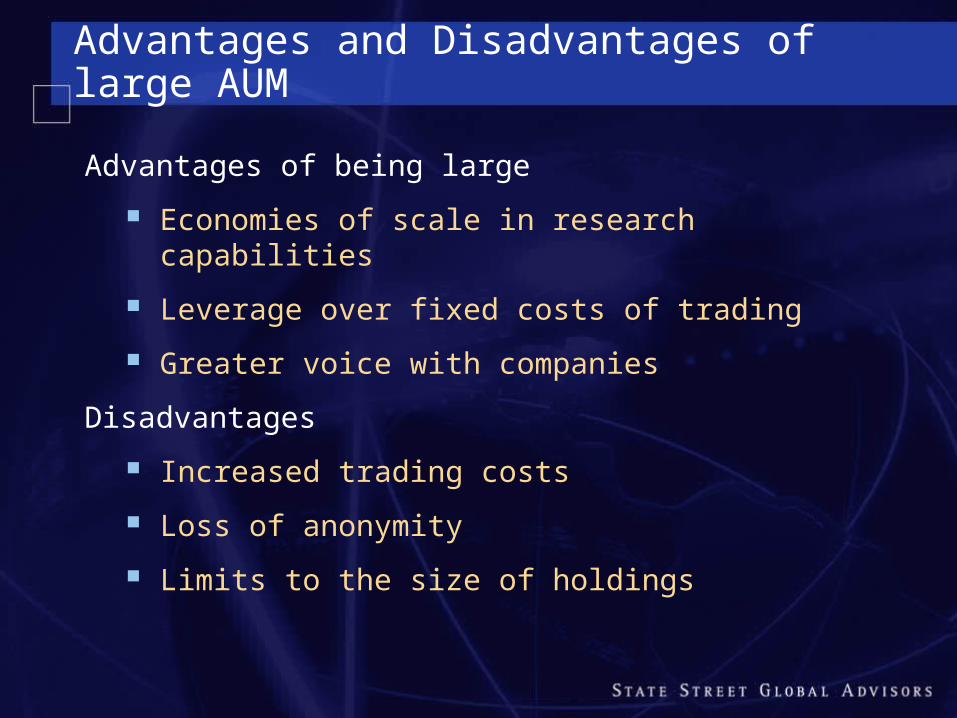
Advantages and Disadvantages of large AUM
Advantages of being large
Economies of scale in research capabilities
Leverage over fixed costs of trading
Greater voice with companies
Disadvantages
Increased trading costs
Loss of anonymity
Limits to the size of holdings
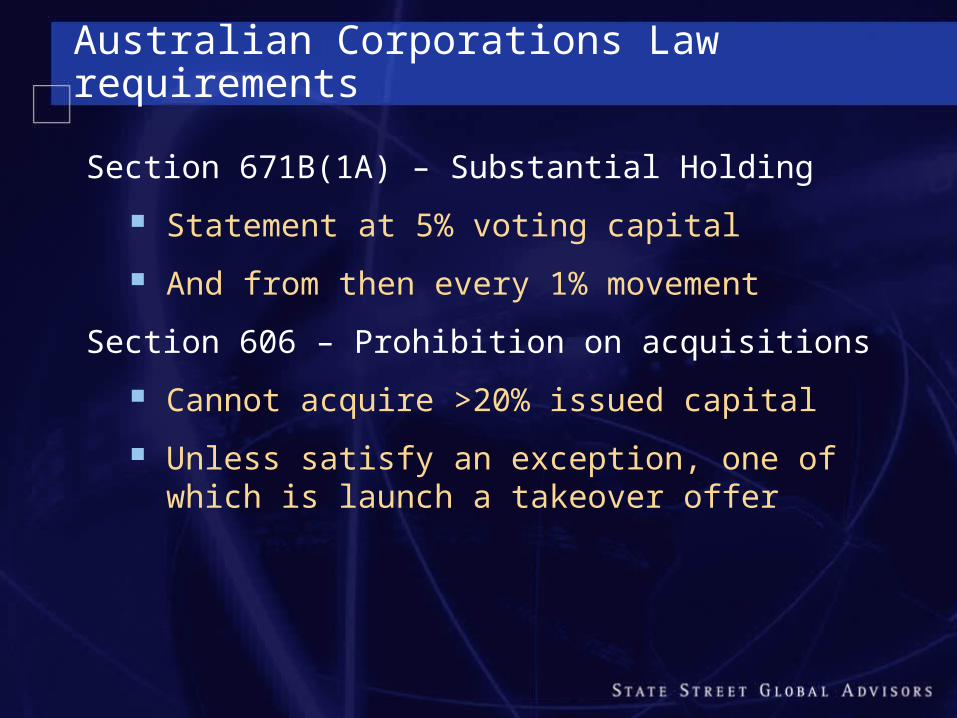
Australian Corporations Law requirements
Section 671B(1A) – Substantial Holding
Statement at 5% voting capital
And from then every 1% movement
Section 606 – Prohibition on acquisitions
Cannot acquire >20% issued capital
Unless satisfy an exception, one of which is launch a takeover offer
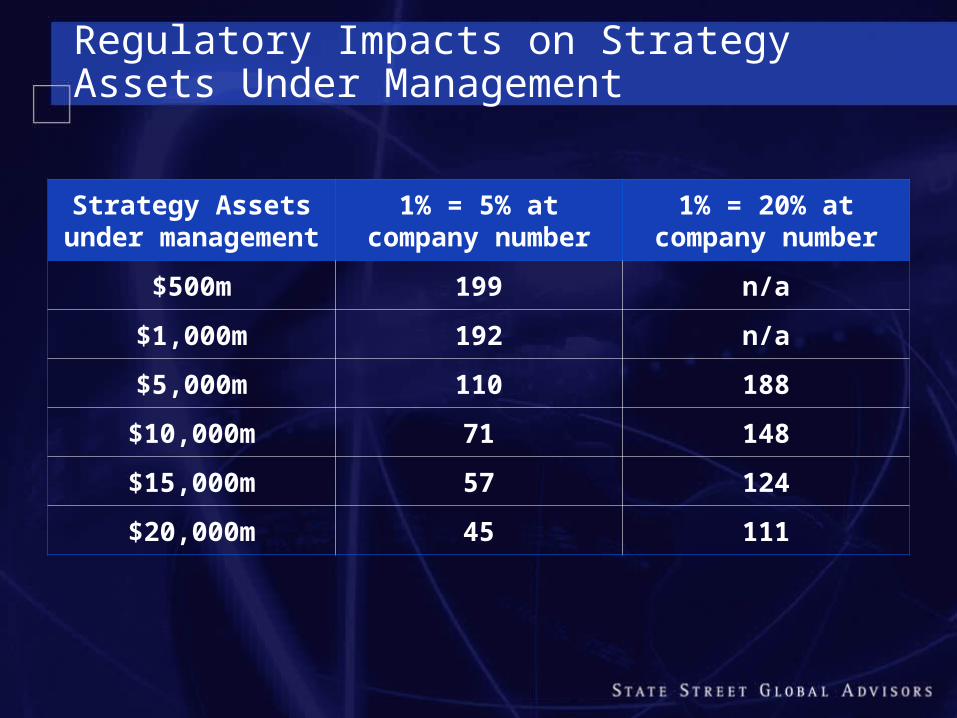
Regulatory Impacts on Strategy Assets Under Management
Strategy Assets under management
1% = 5% at company number
1% = 20% at company number
$500m 199 n/a
$1,000m 192 n/a
$5,000m 110 188
$10,000m 71 148
$15,000m 57 124
$20,000m 45 111
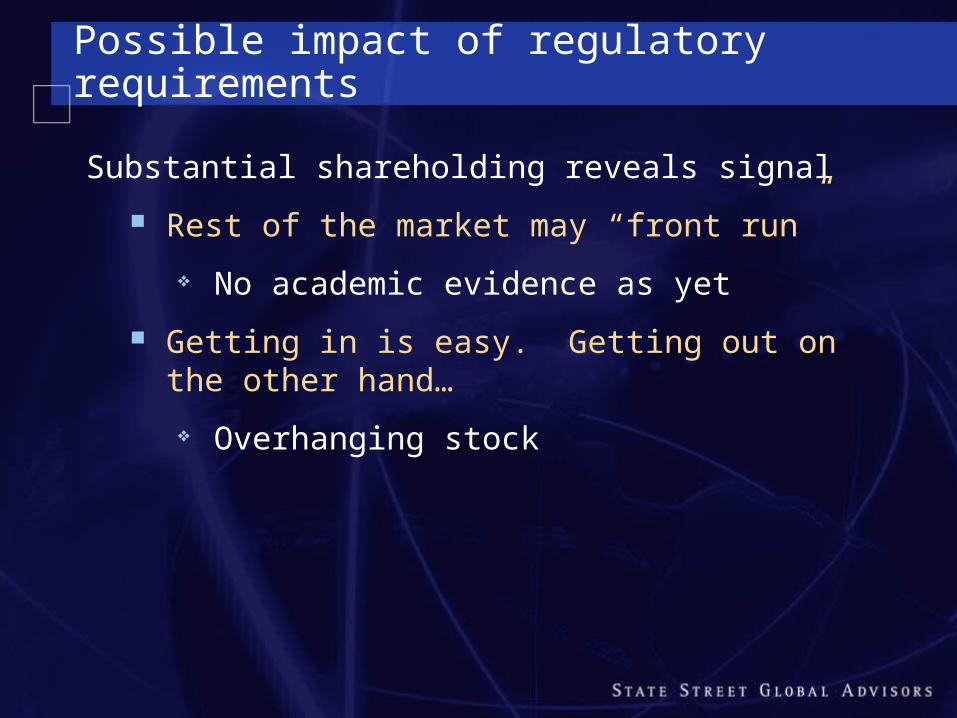
Possible impact of regulatory requirements
Substantial shareholding reveals signal
Rest of the market may “front run”
No academic evidence as yet
Getting in is easy. Getting out on the other hand…
Overhanging stock
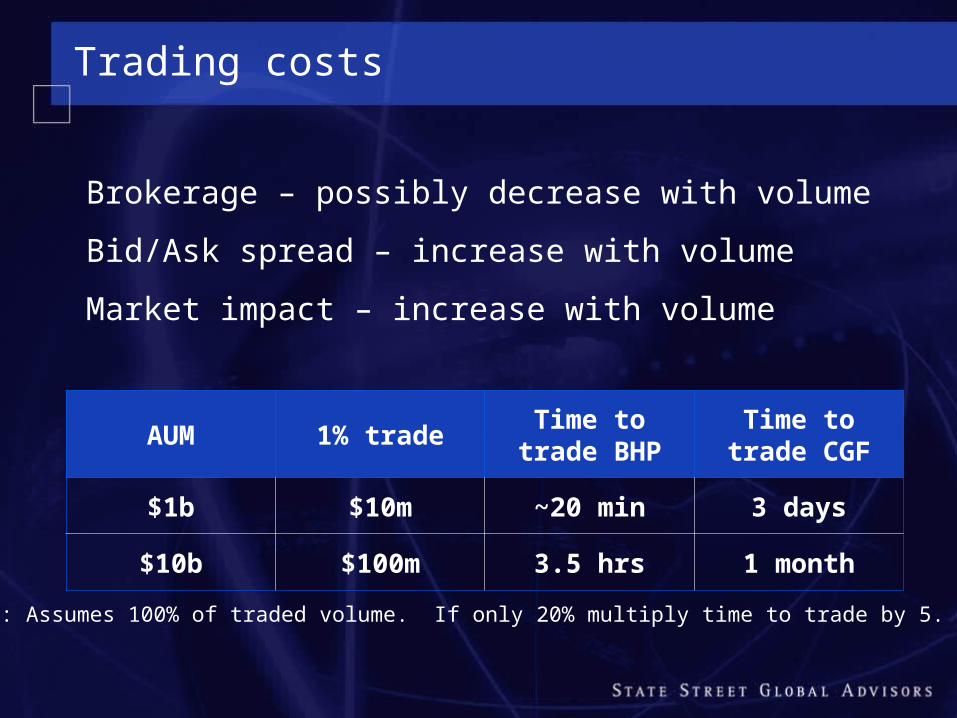
Trading costs
Brokerage – possibly decrease with volume
Bid/Ask spread – increase with volume
Market impact – increase with volume
AUM 1% tradeTime to trade
BHPTime to trade
CGF
$1b $10m ~20 min 3 days
$10b $100m 3.5 hrs 1 month
Note: Assumes 100% of traded volume. If only 20% multiply time to trade by 5.
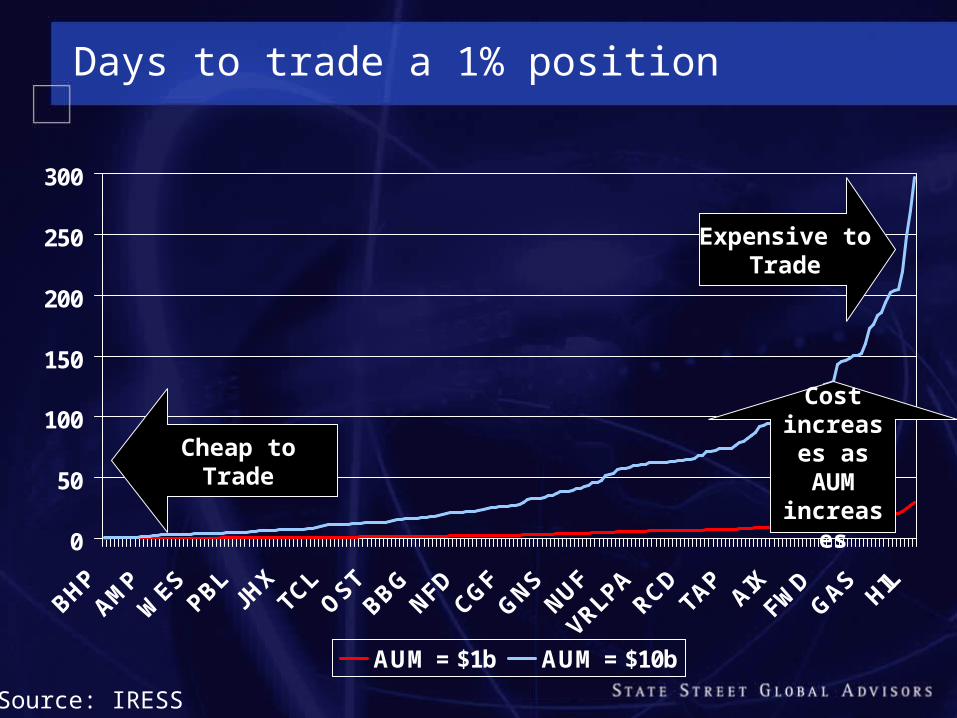
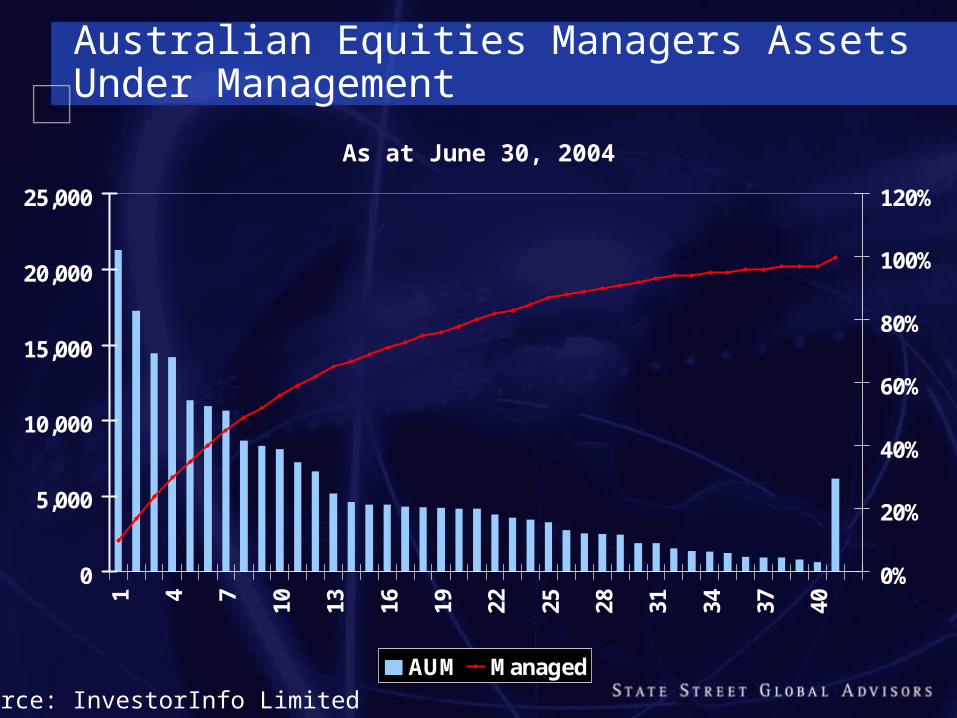
Days to trade a 1% position
0
50
100
150
200
250
300
BHPAM
PW
ESPBL
JHX
TCLO
STBBG
NFDCG
FG
NSNUF
VRLPARCD
TAPAIX
FWD
GAS
HIL
AUM = $1b AUM = $10b
Source: IRESS
Cheap toTrade
Expensive toTrade
Cost increase
s as AUM
increases
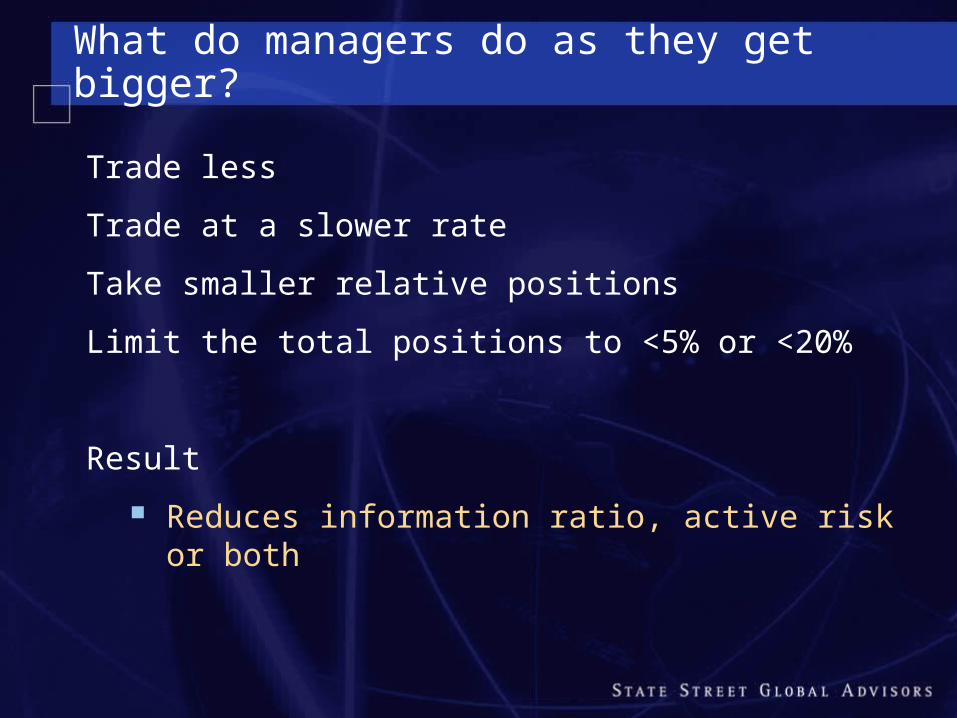
What do managers do as they get bigger?
Trade less
Trade at a slower rate
Take smaller relative positions
Limit the total positions to <5% or <20%
Result
Reduces information ratio, active risk or both
Determining capacity
No fixed method for determining strategy capacity
Two possible definitions
Return based
Wealth based
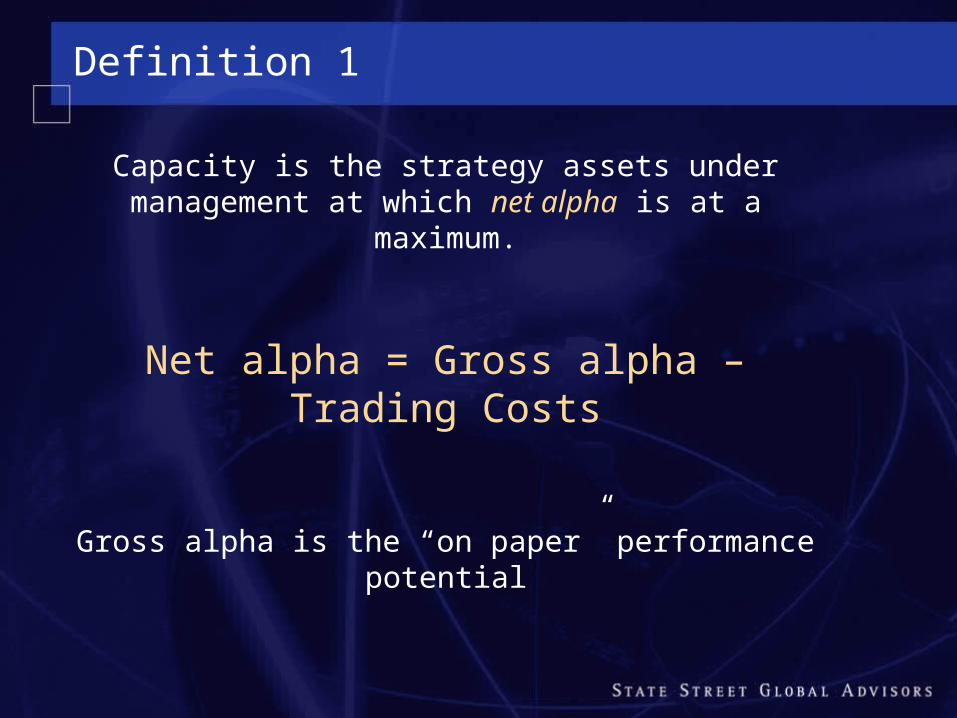
Definition 1
Capacity is the strategy assets under management at which net alpha is at a maximum.
Net alpha = Gross alpha – Trading Costs
Gross alpha is the “on paper” performance potential
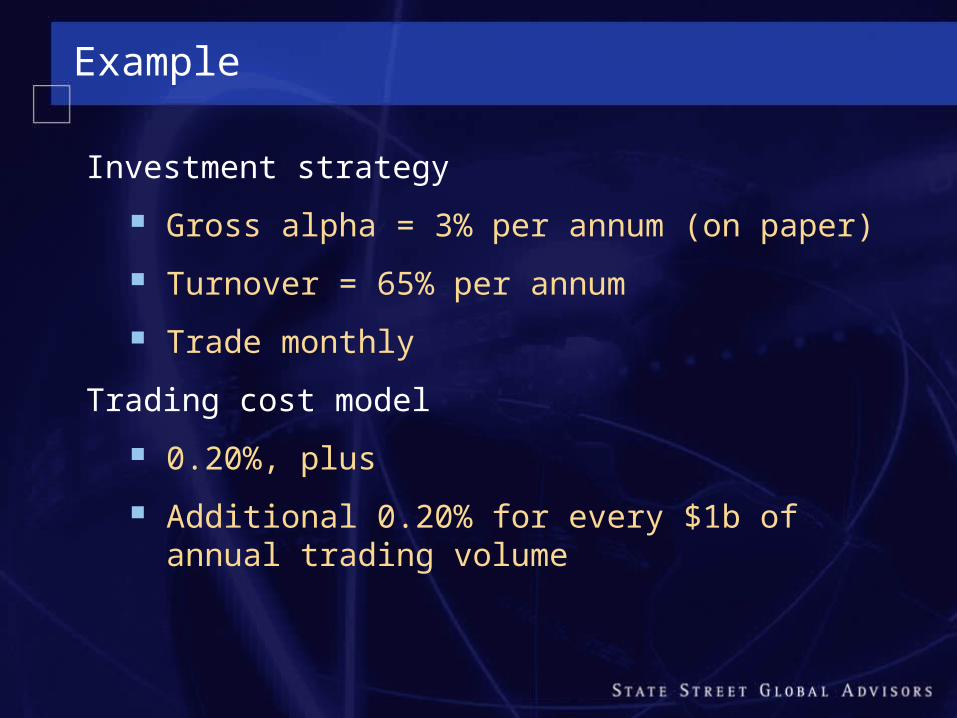
Example
Investment strategy
Gross alpha = 3% per annum (on paper)
Turnover = 65% per annum
Trade monthly
Trading cost model
0.20%, plus
Additional 0.20% for every $1b of annual trading volume
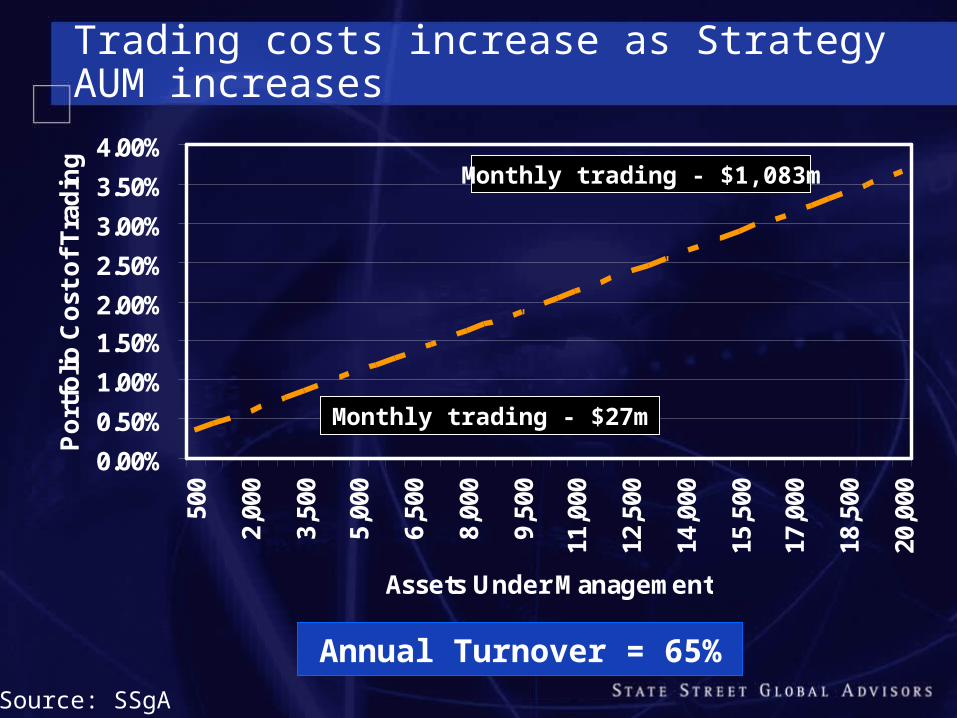
Trading costs increase as Strategy AUM increases
0.00%
0.50%
1.00%
1.50%
2.00%
2.50%
3.00%
3.50%
4.00%
500
2,00
0
3,50
0
5,00
0
6,50
0
8,00
0
9,50
0
11,0
00
12,5
00
14,0
00
15,5
00
17,0
00
18,5
00
20,0
00
Assets Under Management
Po
rtfo
lio C
ost
of
Tra
din
g
Annual Turnover = 65%
Monthly trading - $27m
Monthly trading - $1,083m
Source: SSgA
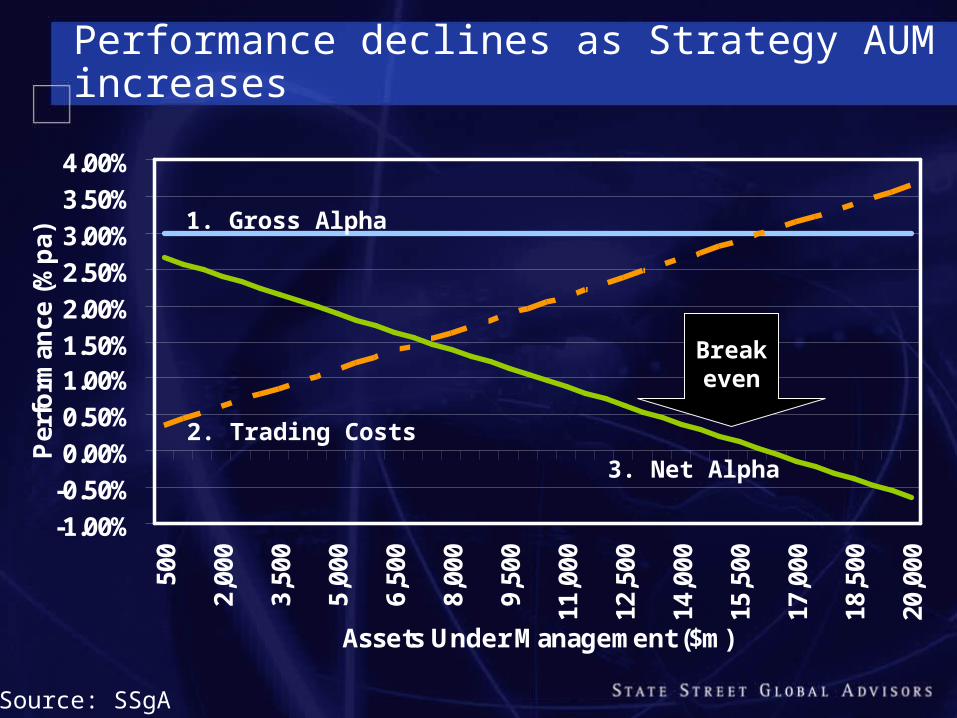
Performance declines as Strategy AUM increases
-1.00%
-0.50%
0.00%
0.50%
1.00%1.50%
2.00%
2.50%
3.00%
3.50%
4.00%50
0
2,00
0
3,50
0
5,00
0
6,50
0
8,00
0
9,50
0
11,0
00
12,5
00
14,0
00
15,5
00
17,0
00
18,5
00
20,0
00
Assets Under Management ($m)
Per
form
ance
(%
pa)
Breakeven
1. Gross Alpha
2. Trading Costs
3. Net Alpha
Source: SSgA
Impact of Strategy AUM on Performance
Costs increase with turnover and AUM
Dependent on the underlying market
Performance impact is one way
Always reduces return
Breakeven point
Beyond which net return is negative
Definition 1: Optimal Capacity
Optimal solution
Don’t manage any assets
Investor perspective
Discourage manager from taking on too many assets
Small assets = Best returns
But Alpha Research Resources Revenue
What fee would a manager charge
Only hire small managers
A large number of small managers
Diversification problems
Identifying enough skillful managers
Definition 2
Capacity is the strategy assets under management at which wealth creation is at a maximum
Wealth = Net Alpha x AUM
Example:
Wealth Created = 2.5% x $1,000b
= $25m
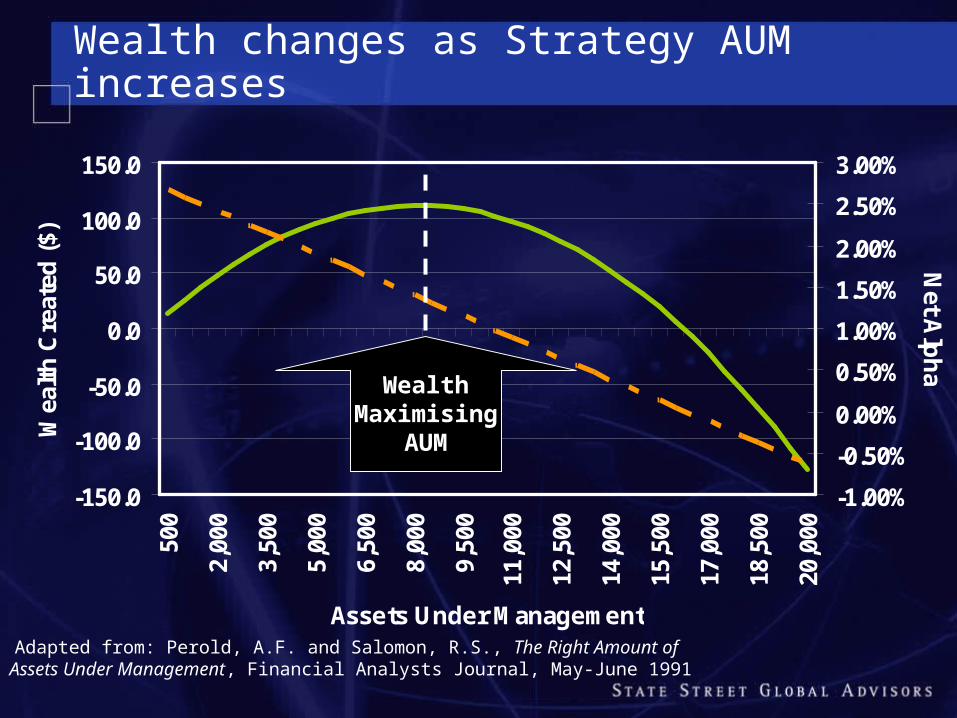
Wealth changes as Strategy AUM increases
-150.0
-100.0
-50.0
0.0
50.0
100.0
150.050
0
2,00
0
3,50
0
5,00
0
6,50
0
8,00
0
9,50
0
11,0
00
12,5
00
14,0
00
15,5
00
17,0
00
18,5
00
20,0
00
Assets Under Management
Wea
lth
Cre
ated
($)
-1.00%
-0.50%
0.00%
0.50%
1.00%
1.50%
2.00%
2.50%
3.00%
Net A
lph
a
Adapted from: Perold, A.F. and Salomon, R.S., The Right Amount of Assets Under Management, Financial Analysts Journal, May-June 1991
WealthMaximising
AUM
Definition 2: Optimal Capacity
Optimal solution
The point at which the wealth creation potential of a strategy is at a maximum
This doesn’t mean that performance is at a maximum
Early investors get the good returns
Performance is diluted at the margin
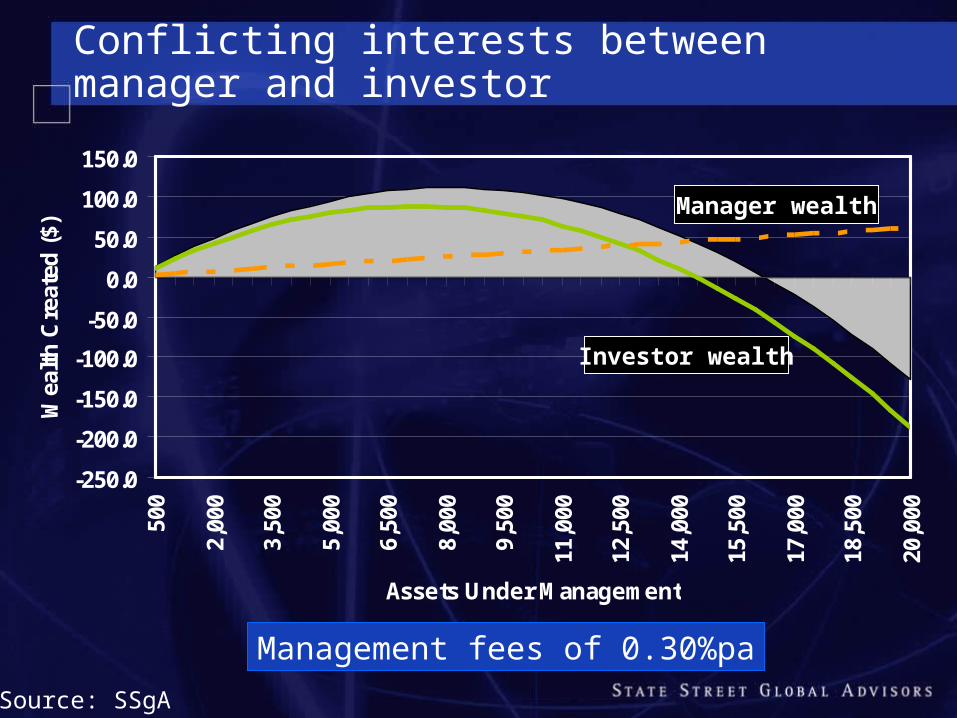
Conflicting interests between manager and investor
Management fees of 0.30%pa
-250.0
-200.0
-150.0
-100.0
-50.0
0.0
50.0
100.0
150.050
0
2,00
0
3,50
0
5,00
0
6,50
0
8,00
0
9,50
0
11,0
00
12,5
00
14,0
00
15,5
00
17,0
00
18,5
00
20,0
00
Assets Under Management
Wea
lth
Cre
ated
($)
Investor wealth
Manager wealth
Source: SSgA
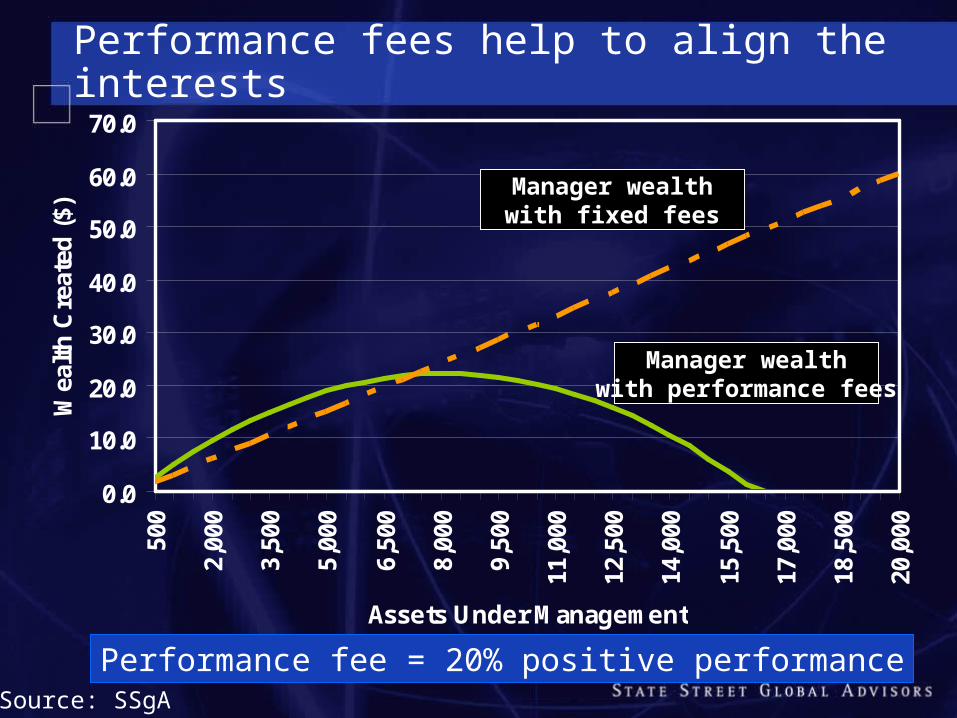
Performance fees help to align the interests
0.0
10.0
20.0
30.0
40.0
50.0
60.0
70.050
0
2,00
0
3,50
0
5,00
0
6,50
0
8,00
0
9,50
0
11,0
00
12,5
00
14,0
00
15,5
00
17,0
00
18,5
00
20,0
00
Assets Under Management
Wea
lth
Cre
ated
($)
Manager wealthwith fixed fees
Manager wealthwith performance fees
Source: SSgA
Performance fee = 20% positive performance
Capacity?
Definition 1
Stay small to keep return
Definition 2
Grow to wealth maximising point
Solution
Somewhere in between
Investor responses to the capacity problem
Demand an analysis of capacity
Implement monitoring procedures for process capacity
Beware the double count
Align interest
Performance fees
Still requires monitoring
The ultimate sanction
The “double count”
Problem
Make a nominal change to the process and call it a different strategy
Determine capacity for the two strategies separately
Solution
Capacity is specific to a set of alphas
Different versions may have different capacity impacts
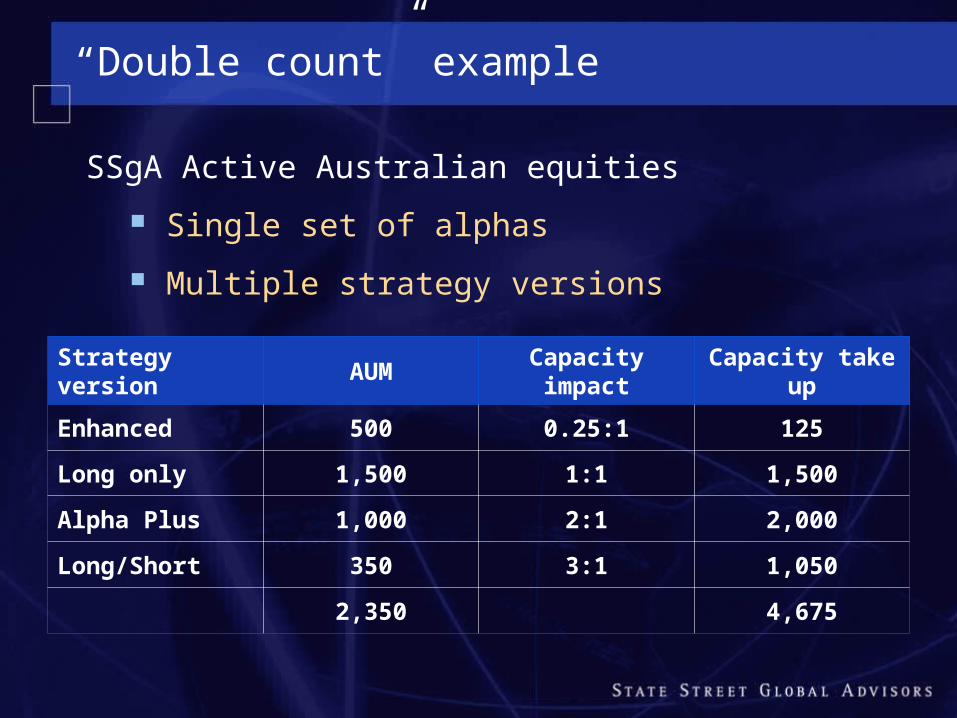
“Double count” example
SSgA Active Australian equities
Single set of alphas
Multiple strategy versions
Strategy version AUM Capacity impact Capacity take up
Enhanced 500 0.25:1 125
Long only 1,500 1:1 1,500
Alpha Plus 1,000 2:1 2,000
Long/Short 350 3:1 1,050
2,350 4,675
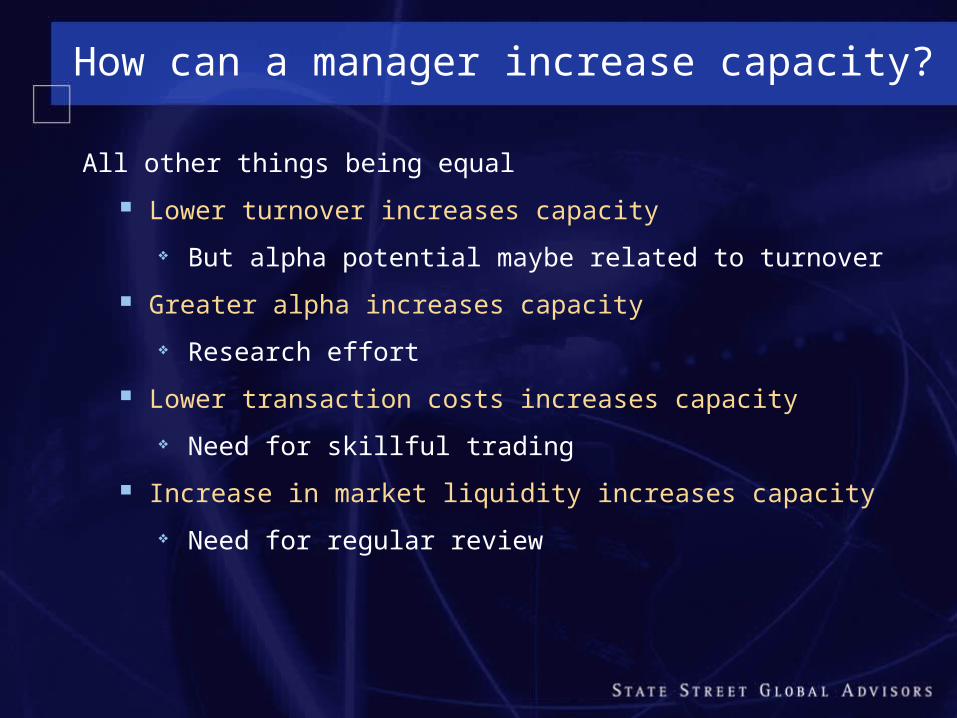
How can a manager increase capacity?
All other things being equal
Lower turnover increases capacity
But alpha potential maybe related to turnover
Greater alpha increases capacity
Research effort
Lower transaction costs increases capacity
Need for skillful trading
Increase in market liquidity increases capacity
Need for regular review
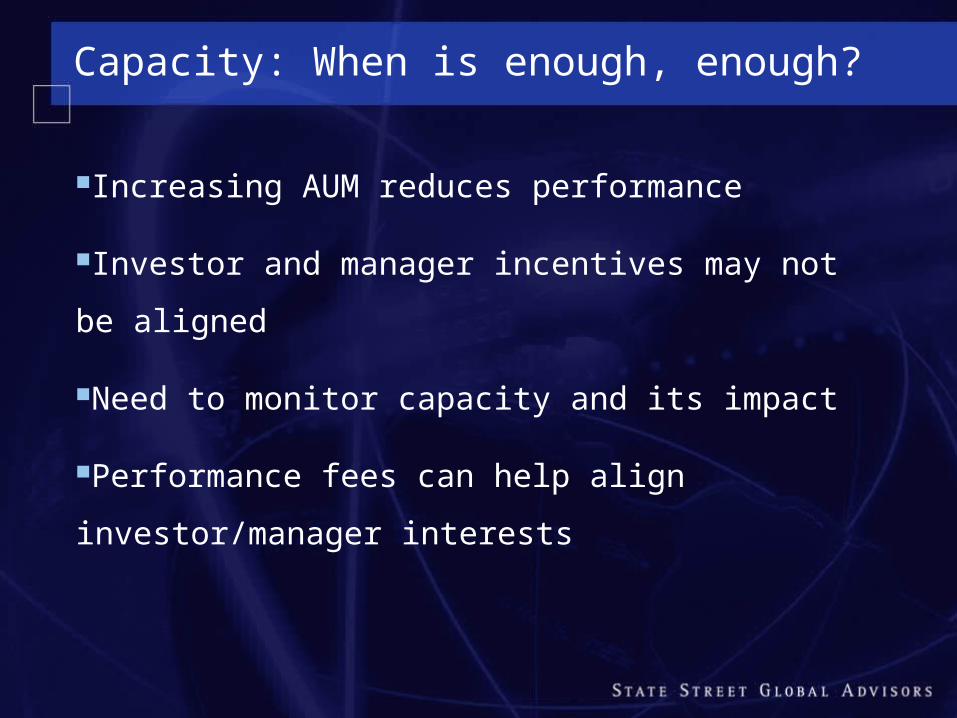
Capacity: When is enough, enough?
Increasing AUM reduces performance
Investor and manager incentives may not be aligned
Need to monitor capacity and its impact
Performance fees can help align investor/manager
interests