Embed Size (px)
Citation preview

1/2
Chairman's Address Annual General Meeting of Shareholders - Melbourne
Thursday, December 1, 2016 at 10.00 am
Donald McGauchie
Today is quite a special day in the history of your company. Nufarm Limited was founded in 1916 as the New Zealand Farmers Fertiliser Company Limited. That company took a 65 percent stake in Nufarm and then bought the balance in 1987, forming the company you own today. It is my pleasure to preside today over the company’s 100th Annual General Meeting. We had a modest start as a public company in New Zealand with a handful of employees. Now, Nufarm provides products and services to farmers in more than 100 countries. Our market value is more than $2 billion. And we employ more than 3,000 people across the globe. When I stood in front of you this time last year, I introduced Greg as your Company’s new CEO and Greg took you through his priorities to reform and build the business.
Greg spoke about the business improvement program which he has been focused on relentlessly
And at a high level he spoke about changes to the strategic direction of the company. One year on, I am pleased to say that significant achievements against these objectives have been delivered and Nufarm has a stronger underlying business. During the year the strategic review was completed along with subsequent changes to Nufarm’s operating model. This has provided the company with a clear way forward, particularly focusing on core crops and core geographies. The reinvigorated management team and its new strategy have already achieved early success and Nufarm is strongly positioned to capitalise on the many opportunities evolving in agriculture globally. A key part of the company’s strategy – the performance improvement program – is tracking ahead of schedule in terms of benefits delivered. I congratulate Greg and the management team on the progress they’ve made so far and I know that there remains much more to do. In a global sense, the timing of these changes has put Nufarm in a very good position. The current global market for crop protection meant lower growth in 2015, when world crop protection markets declined almost 10 percent. Exchange rates had a significant impact on market development in dollar terms, while volume growth was held back by low crop prices and adverse weather conditions in many markets.
For
per
sona
l use
onl
y

2/2
Due to the work put into strengthening the underlying business Nufarm weathered these market conditions very well, with strong underlying EBIT growth. Driven by the current low growth market, over the last two years we have also seen a dramatic change to the potential structure of the global crop protection industry. Five of the top six industry players are currently involved in merger and acquisition processes. Deals include the amalgamation of Monsanto with Bayer; Dow with Dupont; and Chem China with Syngenta. All of these deals are still in the regulatory approval process in key global markets. However, we expect products or portfolios to be divested as these deals progress. This could provide opportunities for Nufarm if we see strategic opportunities that complement our portfolio, fit with our strategy, and are commercially sound. Over the long term we are in an industry with strong growth prospects and favourable macro-economic factors. Of course, we can’t ignore the fact that there will continue to be short-term cyclical trends in commodity prices and currency. The world population is projected to grow to 8.5 billion by 2030. With limited new cropping land available most of the growth in crop production globally is expected to come from higher yields and increased cropping intensity. Nufarm, as a global player in the crop protection industry, has a critical role to play in achieving this increased yield. The future of your company looks strong. I would now like to hand over to Greg to take you through more detail on the company’s performance.
For
per
sona
l use
onl
y

1/6
Managing Director’s Address Annual General Meeting of Shareholders - Melbourne
Thursday, December 1, 2016 at 10.00 am
G A Hunt
Thank you Mr Chairman, and good morning everyone. I would also like to welcome Nufarm shareholders – and others with an interest in the company – to today’s annual general meeting. As the Chairman has noted, this is the 100th AGM of the company and I echo his sentiments in paying tribute to the many employees, executives and Board members who have contributed to our growth and success over that period. This morning I would like to:
Review the 2016 financial results;
Update you on trading conditions in the first quarter of the current financial year; and
Share our strategic priorities that will support our growth aspirations. Let me commence by providing some context to the 2016 financial year results that we released in late September. Due to soft commodity prices and higher than normal distributor inventory, the global crop protection industry contracted by 10% percent in calendar year 2015 and in the 2016 calendar year we have seen some improvement. Despite these challenges, Nufarm generated underlying revenue growth in many parts of our business, and strong EBIT growth at the group level. This performance was largely driven by the excellent progress we have made on the performance improvement program that we announced in early 2015. At that time, we committed to making the changes necessary to improve the long term performance of the business, and to increase shareholder returns. And we announced a target of delivering net benefits of $116 million by July 2018. The 2016 full year results included benefits of $60 million from this program – and this is in addition to the $15 million delivered in the 2015 financial year. Looking at the 2016 financial year in a little more detail, our results were characterised by the following elements:
A strong underlying operational result;
A continued and successful focus on removing inefficient capital from the business, in terms of both net working capital and the divestment of non-core assets.
We also experienced significantly higher financing costs in the form of interest expense and foreign exchange losses, largely attributable to a structural shift in the crop protection market in Brazil; and
The performance improvement program delivering net benefits, at a more rapid rate than originally expected.
For
per
sona
l use
onl
y

2/6
Group revenues were up 2% on the prior year. However, underlying EBIT increased by 21% to almost $287 million and underlying EBITDA of $372 million is $55 million higher in 2016 compared with the previous year. We have seen solid improvement in the quality of our earnings. Gross profit margin was up 160 basis points, driven largely by the benefits arising from the performance improvement program. That, flowed through to the bottom line resulting in a 21% increase in EBIT. Underlying net profit after tax was $108.9 million, down 7.0% on the $117.1 million reported in the prior period. The underlying net profit was impacted by a higher cost of doing business in Latin America, where a structural shift in the market, with customers choosing to be invoiced in local currency coupled with significant currency volatility, resulted in higher interest expense and significant foreign exchange losses. Our reported net profit included the impact of material items, which were largely associated with the changes we are making to improve the business. Net material items included in the 2016 financial year total $99 million pre-tax. The majority of the material items relate to the costs associated with the performance improvement program, totalling $126m. We also sold our interest in the Indian crop protection company Excel Crop Care, resulting in a profit of $27 million. After deducting post tax material items of $81 million, the reported Net Profit After Tax, for the year, was $28 million. Another key objective of our business improvement initiatives has been to more efficiently manage our working capital. At the end of 2014, we set ourselves a target to reach an average net working capital to sales ratio below 40%, by the end of the 2016 financial year. We have met this target and, as a result, we have reduced working capital by approximately $200 million over the last two years. These achievements indicate we are making very good progress on our journey to build a better Nufarm. The strong operating result and the continued focus on capital management resulted in a strong lift in return on funds employed, up from 9.1% in financial year 2014 to 13.1% in the 2016 financial year. We remain committed to our target Return On Funds Employed of 16% by the end of the 2018 financial year. Turning to our segments… In Australia and New Zealand, we generated crop protection sales of $554m, which was down almost 5% on the previous year. The reduction in sales was a result of our decision to focus on lower volume, higher margin products. However, a consequence of this decision was reduced volumes and a detrimental impact on plant recoveries. We are working to improve the volume / price and margin mix during 2017. We have completed the restructuring of our manufacturing operations in Australia and New Zealand, with the closure of three plants now finalized. We have also completed the re-development and investment in our insecticide and fungicide facility at Laverton, here in Victoria. In North America, crop protection sales grew by 11% to $654m. Underlying EBIT improved strongly to $59.3million, up nearly 53% on the prior period.
For
per
sona
l use
onl
y

3/6
The changes we made to our management team and sales structure, coupled with a number of new product launches, enabled us to grow both volume and margin. Following the closure of our Canadian plant, we successfully transitioned that production to our facility in Chicago, with benefits to be realised in Financial Year 2017. These changes give us a more competitive cost base which, combined with important procurement savings, have materially improved the profitability of our business. Our Latin American business also posted an excellent underlying EBIT result. We maintained our market share and achieved margins in line with the prior year, in a market where lower commodity prices put pressure on grower spend. Regional sales were $740.7 million, compared to $706.5 million in the prior year. Underlying EBIT was just over $100 million, up strongly on the $76.7 million reported in 2015. In Brazil, we took a conservative approach to sales growth, given the volatile market conditions. We successfully launched a number of new products during the year, and we have additional product launches to support further sales growth in the current financial year. Importantly, channel inventories of Nufarm product remain at normal levels. Whilst we encountered some challenges in 2016, due to foreign exchange volatility and high interest costs, Nufarm has been able to deliver consistent profits from Brazil in recent years and now has a fundamentally stronger business. Brazil is a strategically important market and the single largest crop protection market in the world. With the potential for further expansion in cropping acres, and an increased investment in technology, we expect to see further growth and opportunities in Brazil. Turning to Europe, sales were up slightly on the prior period. Underlying EBIT at $73 million, was up 13.5% on the prior year. Margin improved as a result of more disciplined selling policies, higher sales of differentiated formulations, the launch of several new products, and the cost-out benefits associated with the changes to our manufacturing platform. The Botlek plant in the Netherlands is now closed and our MCPA production has been successfully moved to our facility in northern England. In Asia, crop protection sales fell by 4% to $148 million due to very dry seasonal conditions in Indonesia. However, underlying EBIT increased 26% to $23million. This improvement was a result of higher sales into stronger margin markets such as Japan and Korea and prudent expense management. And finally to our seeds segment. Sales were lower by 10% at $143 million, and the underlying EBIT contribution fell by a similar percentage to $28.7 million. This was another tough period for seed sales with most industry participants feeling the impact of lower commodity prices. Dry conditions in Australia leading up to both the canola planting period and last year’s summer crop planting window had a material impact on our growth expectations for the year. We did however,
For
per
sona
l use
onl
y

4/6
achieve growth in both our European sunflower business and our global seed treatment sales with the launch of several new products. Our Omega 3 program took major steps forward in 2016. We have advanced our first commercial concept through the technical development phase, and have completed the vast majority of regulatory science studies. Our field trial program has been very successful, confirming full scalability and high Omega 3 expression. In summary, despite the global crop protection market being down, our results for Financial Year 2016 were very positive, and they reinforce our confidence that the changes we are making to the business are delivering significant benefits. Current trading conditions I would now like to update you on trading conditions in the first quarter of the new financial year. Here in Australia, seasonal conditions are better than we have experienced for a number of years with above average rainfall. The outlook for summer cropping remains favourable, with soil moisture at record levels over large parts of the crop growing areas. We are however, seeing some significant price competition impacting margins. The outlook for the winter crop is positive, and with an improved balance between volume and price, and the impact of cost savings, we would expect to see earnings growth at the full year for the ANZ region. Sales and underlying EBIT in Asia in the first quarter were ahead of the same period last year, with improved seasonal conditions in Indonesia the main contributing factor. Our North American business started the year very well. The turf and specialty business had a successful early sales campaign which will contribute to a better first half result. Across the broadacre business, a stronger engagement with our distribution customers puts us in a good position to maintain the momentum that we experienced in 2016. The Brazilian crop protection market is expected to be down in USD dollars, in calendar year 2016. Despite this, increased crop plantings, low Nufarm channel inventories and recent product launches, will deliver a solid performance in Latin America in the first half. Management of credit risk continues to be a major focus. Collections are closely monitored, and are progressing in line with our expectations. Year to date, sales in Europe are in line with the previous period. We have performed well, by focusing on high value products. Further cost reduction opportunities, and new product launches will position the business for another year of growth, assuming normal seasonal conditions. Whilst it is early, our seeds business has had a positive start to the year with improved demand signals from most segments. Like the majority of our markets, earnings in the seeds business are heavily weighted to the second half, and earnings growth will depend on the canola crop in Australia, which – at this point – is looking more positive than last year. Our Omega 3 platform is now reaching a very exciting pre-commercial phase. The regulatory package is planned for submission in early 2017. We expect to make the first commercial volumes available to the market in Financial Year 2019, subject to regulatory approvals.
For
per
sona
l use
onl
y

5/6
Our first half year result is typically dominated by contributions from Australia and Brazil, which are both experiencing competitive market conditions. What is pleasing this year is that we are seeing an improved contribution from our North American business. As a result of this, we are confident that underlying EBIT at the end of January will be ahead of the prior year. This will leave us well placed to deliver solid underlying EBIT growth for the full year. Interest expense and foreign exchange losses are expected to be in line with guidance provided at the full year results release. The first six months of the year always sees a build in working capital, given the timing of major seasons in our global markets. I expect working capital levels at the half to be above the prior year, but the average net working capital to sales percentage to be below that of last year. Our full year expectation is for the average net working capital to sales ratio to be below 40%. We are committed to delivering the remainder of our performance improvement program and are confident of reaching the $116 million in net benefits by the end of financial year 2018. We provided detail on the status of our various improvement projects at the full year and also emphasized the importance of freeing up additional capital to reinvest in the business so that we can retain these benefits over the long term. Before making some comments on our strategic direction, I would like to highlight the priority that is being given to safety within the business. The safety of employees is an overriding priority. It underpins all areas of our operations and we are focused on continuous improvement. We have implemented revised safety rules, including common systems, processes and standards. As these initiatives continue to impact, we have seen our Serious Injury Frequency Rate start to decline. This gives us confidence that our safety initiatives are working. During the 2016 Financial Year, we completed a strategic review of the business, resulting in a clear direction for the company. Our focus is on strengthening Nufarm’s position in key geographic hubs and in our core crop segments within those markets. In other words, we are looking to go deeper into these markets and capitalize on our strengths, rather than a broader approach into many markets, where we do not have a strategic or competitive advantage. Our product portfolio has been reviewed to ensure it is aligned with this focus, and our new investments in product development will also complement this strategy. In addition, as we assess opportunities for acquisitions – some of which may result from the current round of industry consolidation – we will ensure that only those opportunities that meet our strategic objectives are pursued. It is important that we continue to pursue growth opportunities so that we can fully leverage the benefits that are being secured from our performance improvement program. In summary, we will continue to focus on the performance improvement program to deliver the full $116 million in net benefits by the end of Financial Year 2018.
For
per
sona
l use
onl
y

6/6
Over the near term, we will work to recover our market share in Australia by being price competitive in our higher volume commodity products. In Brazil, our focus is on continuing to grow our business whilst managing our exposure to interest expense, foreign exchange and credit risk. In pursuing our growth platform, we will be focused on opportunities that will align with our core crop and market segments. And, we will take advantage of projects that have the potential of adding very significant value to our company, such as our Omega 3 canola opportunity. Let me conclude by acknowledging the positive contribution from Nufarm employee’s around the world over the past 12 months. The company has undergone some significant changes, and it is a testament to the talent, commitment, and loyalty of our employees that they have responded so positively. This gives us considerable confidence that the company is strongly positioned to achieve sustainable growth and improved returns to shareholders. I’ll now hand back to the Chairman.
For
per
sona
l use
onl
y

Nufarm Limited
2016 Annual General Meeting
December 1, 2016 For
per
sona
l use
onl
y

2
Chairman
Mr Donald
McGauchie
2016 Annual General Meeting
For
per
sona
l use
onl
y

3
Managing Director & CEO
Mr Greg Hunt
2016 Annual General Meeting
For
per
sona
l use
onl
y

4
2016 FY in review
Headline results
• Excellent underlying operational result
• Performance improvement program delivering net benefits
• Improvements in networking capital
• A structural shift in the Brazilian crop protection market led to higher interest expense and foreign exchange losses
(A$ millions)
FY16 FY15 Change
Revenue 2,791 2,737 ▲ 2%
Underlying EBIT 287 237 ▲ 21%
Reported NPAT 28 43 ▼ 36%
Underlying NPAT 109 117 ▼ 7%
Average net working
capital/sales 39.9% 41.9% ▼ 200bps
Net debt at 31 July 625 547 ▲ 14%
Full Year dividend 11 cents 10 cents ▲ 10%
ROFE increased from 9.1% in FY14 to 13.1% in FY 2016.
Targeting ROFE of 16% by the 2018 financial year
For
per
sona
l use
onl
y

5
2016 FY in review
Regional summary
Australia/New Zealand
A$(m) FY16 FY15 %
Sales 554.0 582.4 -4.9%
Underlying EBIT 47.0 52.7 -10.8%
Underlying EBITDA 61.8 69.9 -11.6%
Underlying EBITDA
Margin
11.2% 12.0%
Nufarm drivers
• Focus on quality sales
• Lower sales of high volume commodity products
negatively impacted plant recoveries
• Plant closures completed. New insecticide and
fungicide facility commissioned
• Opportunity to fully leverage cost out program via
better balance of higher margin and commodity
products
North America
A$(m) FY16 FY15 %
Sales 653.9 588.7 11.1%
Underlying EBIT 59.3 38.8 52.8%
Underlying EBITDA 76.9 54.5 41.1%
Underlying EBITDA
Margin
11.8% 9.3%
Nufarm drivers
• Revenue growth reflects stronger volumes and
more focused product portfolio
• Better alignment of our marketing programs to the
needs of our channel partners
• Salesforce.com implementation under way
• Calgary plant closed in June – remediation
ongoing
For
per
sona
l use
onl
y

6
2016 FY in review
Regional summary
Latin America
A$(m) FY16 FY15 %
Sales 740.7 706.5 4.8%
Underlying EBIT 100.4 76.7 30.9%
Underlying EBITDA 104.4 79.6 31.2%
Underlying EBITDA
Margin
14.1% 11.3%
Nufarm drivers
• Conservative approach to sales growth, given
volatile conditions
• BRL weakness impacts margins, but procurement
savings reduce the impact
• 'Product on ground' use in line with sales –
channel inventories under control
• FX losses in Brazil exacerbated by switch to BRL
invoicing and cost of hedging USD exposure
• Doubtful debt expense in FY16 at historical levels
(+$9m on prior year)
Europe
A$(m) FY16 FY15 %
Sales 550.4 544.8 1.0%
Underlying EBIT 73.0 64.4 13.4%
Underlying EBITDA 110.3 98.6 11.9%
Underlying EBITDA
Margin
20.0% 18.1%
Nufarm drivers
• Improved margins with better pricing discipline
and focus on high value products
• Investment in sales/marketing in France,
Germany and Poland to support growth
• Successful new product introductions
• Botlek plant closed and efficiency programs
delivering benefits
For
per
sona
l use
onl
y

7
2016 FY in review
Regional summary
Asia
A$(m) FY16 FY15 %
Sales 148.6 155.2 -4.3%
Underlying EBIT 22.8 18.1 26.0%
Underlying EBITDA 26.7 21.7 23.0%
Underlying EBITDA
Margin
18.0% 14.0%
Nufarm drivers
• Maintained share in Indonesia, in very
competitive pricing environment
• Increased higher margin sales into Japan (+36%),
and increased sales into China, Korea and Sri
Lanka
• Prudent expense management helps offset lower
Indonesia contribution
For
per
sona
l use
onl
y

8
2016 FY in review
Segment result
Seed technologies
A$(m) FY16 FY15 %
Sales 143.6 159.6 -10.0%
Underlying EBIT 28.7 31.8 -9.7%
Underlying EBITDA 35.5 37.7 -5.8%
Underlying EBITDA
Margin
24.7% 23.6%
Nufarm drivers
• Maintained share in key market segments
• Restructured business to drive efficiencies
• Strong seed treatment sales of Nuprid 600 in
Europe
• Growth in European sunflower business
• Excellent progress on canola omega-3 program
For
per
sona
l use
onl
y

9
Trading update
Australia/New Zealand
− Good summer cropping conditions providing opportunities to grow sales and increase
market share. The business will be challenged by competitive pricing pressure on key
commodity products.
Asia
− Ahead of prior year with improved seasonal conditions in Indonesia
North America
− Positive start to the year with good early order sales program in T&O, and alignment with
channel partners providing sales opportunities. The major selling period occurs in the
second half, with seasonable conditions looking favourable.
Latin America
− Sales and earnings in line with last year. Appreciating Brazilian Real driving pricing
pressure and delaying grower purchases. Foreign exchange losses in line with guidance.
Europe
− Sales at prior period levels, with further cost reduction opportunities and new product
launches driving earnings growth
Seed Technologies
− Early seed technologies segment sales are in line with last year. Majority of earnings are
generated in the second half.
For
per
sona
l use
onl
y

10
Outlook
Half year EBIT
− Forecasting to be of ahead of prior year on an underlying EBIT basis
Full year EBIT
− Forecasting solid underlying EBIT growth on the prior year
Full year net profit after tax
− Interest and exchange losses are expected to be in line with guidance
given at full year results. Net interest expense to be moderately lower in
FY17. LATAM hedging cost is approximately $1m to $1.5m per month
Net working capital
− Normal working capital build at the half year, but full year average net
working capital to sales ratio below 40%
For
per
sona
l use
onl
y
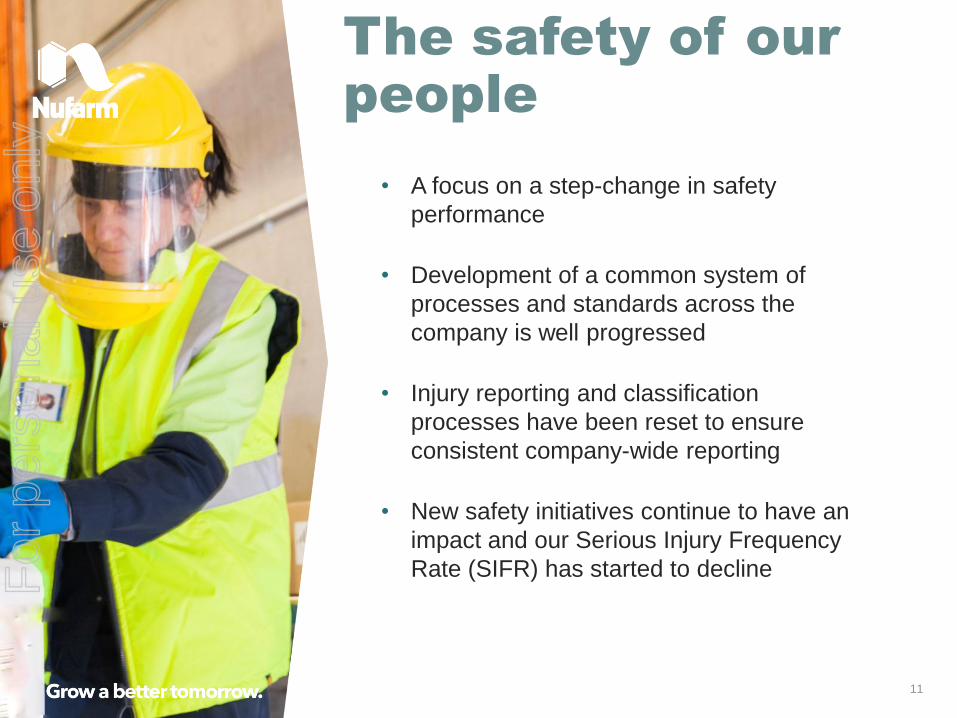
The safety of our
people
11
• A focus on a step-change in safety
performance
• Development of a common system of
processes and standards across the
company is well progressed
• Injury reporting and classification
processes have been reset to ensure
consistent company-wide reporting
• New safety initiatives continue to have an
impact and our Serious Injury Frequency
Rate (SIFR) has started to decline
For
per
sona
l use
onl
y

12
Focus on core
geographies & crops
CEREAL CORN PASTURE,
TURF &
ORNAMENTALS
SOYBEAN TREES, NUTS,
VINES &
VEGETABLES
For
per
sona
l use
onl
y

13
2017 focus areas
• Continue our focus on the performance improvement program to
deliver the full $116m in net benefits by FY18
• In Australia, we will work to recover our market share in higher volume
products while balancing our need to maintain margins
• In Brazil, our focus is on continuing to grow our business while
reducing our exposure to interest and foreign exchange impacts
• In pursuing our growth platform, we will leverage opportunities that
align with our crop and market segments
• Our Omega 3 Canola opportunity has the potential of adding very
significant value to our company For
per
sona
l use
onl
y

For
per
sona
l use
onl
y