Embed Size (px)
Citation preview

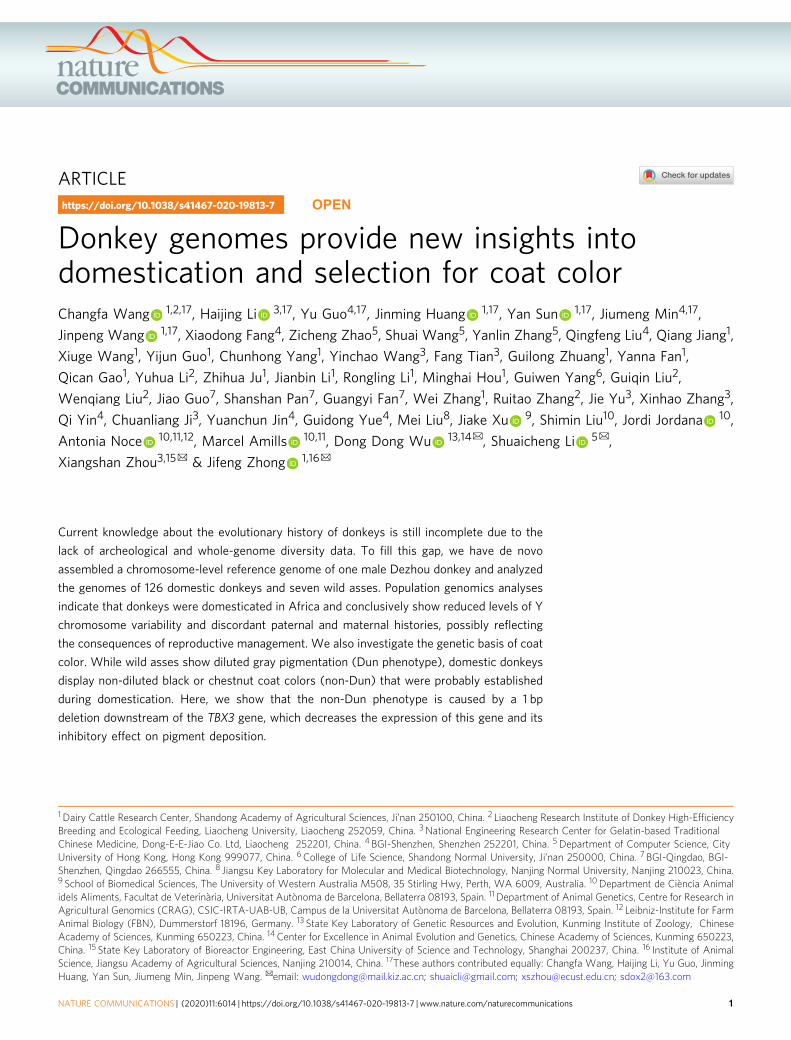
Donkey genomes provide new insights into domestication and selection for coat color
Wang, Changfa; Li, Haijing; Guo, Yu; Huang, Jinming; Sun, Yan; Min, Jiumeng; Wang,Jinpeng; Fang, Xiaodong; Zhao, Zicheng; Wang, Shuai; Zhang, Yanlin; Liu, Qingfeng; Jiang,Qiang; Wang, Xiuge; Guo, Yijun; Yang, Chunhong; Wang, Yinchao; Tian, Fang; Zhuang,Guilong; Fan, Yanna; Gao, Qican; Li, Yuhua; Ju, Zhihua; Li, Jianbin; Li, Rongling; Hou,Minghai; Yang, Guiwen; Liu, Guiqin; Liu, Wenqiang; Guo, Jiao; Pan, Shanshan; Fan,Guangyi; Zhang, Wei; Zhang, Ruitao; Yu, Jie; Zhang, Xinhao; Yin, Qi; Ji, Chuanliang; Jin,Yuanchun; Yue, Guidong; Liu, Mei; Xu, Jiake; Liu, Shimin; Jordana, Jordi; Noce, Antonia;Amills, Marcel; Wu, Dong Dong; Li, Shuaicheng; Zhou, Xiangshan; Zhong, JifengPublished in:Nature Communications
Published: 01/01/2020
Document Version:Final Published version, also known as Publisher’s PDF, Publisher’s Final version or Version of Record
License:CC BY
Publication record in CityU Scholars:Go to record
Published version (DOI):10.1038/s41467-020-19813-7
Publication details:Wang, C., Li, H., Guo, Y., Huang, J., Sun, Y., Min, J., Wang, J., Fang, X., Zhao, Z., Wang, S., Zhang, Y., Liu, Q.,Jiang, Q., Wang, X., Guo, Y., Yang, C., Wang, Y., Tian, F., Zhuang, G., ... Zhong, J. (2020). Donkey genomesprovide new insights into domestication and selection for coat color. Nature Communications, 11, [6014].https://doi.org/10.1038/s41467-020-19813-7
Citing this paperPlease note that where the full-text provided on CityU Scholars is the Post-print version (also known as Accepted AuthorManuscript, Peer-reviewed or Author Final version), it may differ from the Final Published version. When citing, ensure thatyou check and use the publisher's definitive version for pagination and other details.
General rightsCopyright for the publications made accessible via the CityU Scholars portal is retained by the author(s) and/or othercopyright owners and it is a condition of accessing these publications that users recognise and abide by the legalrequirements associated with these rights. Users may not further distribute the material or use it for any profit-making activityor commercial gain.Publisher permissionPermission for previously published items are in accordance with publisher's copyright policies sourced from the SHERPARoMEO database. Links to full text versions (either Published or Post-print) are only available if corresponding publishersallow open access.
ARTICLE
Donkey genomes provide new insights intodomestication and selection for coat colorChangfa Wang 1,2,17, Haijing Li 3,17, Yu Guo4,17, Jinming Huang 1,17, Yan Sun 1,17, Jiumeng Min4,17,
Jinpeng Wang 1,17, Xiaodong Fang4, Zicheng Zhao5, Shuai Wang5, Yanlin Zhang5, Qingfeng Liu4, Qiang Jiang1,
Xiuge Wang1, Yijun Guo1, Chunhong Yang1, Yinchao Wang3, Fang Tian3, Guilong Zhuang1, Yanna Fan1,
Qican Gao1, Yuhua Li2, Zhihua Ju1, Jianbin Li1, Rongling Li1, Minghai Hou1, Guiwen Yang6, Guiqin Liu2,
Wenqiang Liu2, Jiao Guo7, Shanshan Pan7, Guangyi Fan7, Wei Zhang1, Ruitao Zhang2, Jie Yu3, Xinhao Zhang3,
Qi Yin4, Chuanliang Ji3, Yuanchun Jin4, Guidong Yue4, Mei Liu8, Jiake Xu 9, Shimin Liu10, Jordi Jordana 10,
Antonia Noce 10,11,12, Marcel Amills 10,11, Dong Dong Wu 13,14✉, Shuaicheng Li 5✉,
Xiangshan Zhou3,15✉ & Jifeng Zhong 1,16✉
Current knowledge about the evolutionary history of donkeys is still incomplete due to the
lack of archeological and whole-genome diversity data. To fill this gap, we have de novo
assembled a chromosome-level reference genome of one male Dezhou donkey and analyzed
the genomes of 126 domestic donkeys and seven wild asses. Population genomics analyses
indicate that donkeys were domesticated in Africa and conclusively show reduced levels of Y
chromosome variability and discordant paternal and maternal histories, possibly reflecting
the consequences of reproductive management. We also investigate the genetic basis of coat
color. While wild asses show diluted gray pigmentation (Dun phenotype), domestic donkeys
display non-diluted black or chestnut coat colors (non-Dun) that were probably established
during domestication. Here, we show that the non-Dun phenotype is caused by a 1 bp
deletion downstream of the TBX3 gene, which decreases the expression of this gene and its
inhibitory effect on pigment deposition.
https://doi.org/10.1038/s41467-020-19813-7 OPEN
1 Dairy Cattle Research Center, Shandong Academy of Agricultural Sciences, Ji’nan 250100, China. 2 Liaocheng Research Institute of Donkey High-EfficiencyBreeding and Ecological Feeding, Liaocheng University, Liaocheng 252059, China. 3 National Engineering Research Center for Gelatin-based TraditionalChinese Medicine, Dong-E-E-Jiao Co. Ltd, Liaocheng 252201, China. 4 BGI-Shenzhen, Shenzhen 252201, China. 5 Department of Computer Science, CityUniversity of Hong Kong, Hong Kong 999077, China. 6 College of Life Science, Shandong Normal University, Ji’nan 250000, China. 7 BGI-Qingdao, BGI-Shenzhen, Qingdao 266555, China. 8 Jiangsu Key Laboratory for Molecular and Medical Biotechnology, Nanjing Normal University, Nanjing 210023, China.9 School of Biomedical Sciences, The University of Western Australia M508, 35 Stirling Hwy, Perth, WA 6009, Australia. 10 Department de Ciència Animalidels Aliments, Facultat de Veterinària, Universitat Autònoma de Barcelona, Bellaterra 08193, Spain. 11 Department of Animal Genetics, Centre for Research inAgricultural Genomics (CRAG), CSIC-IRTA-UAB-UB, Campus de la Universitat Autònoma de Barcelona, Bellaterra 08193, Spain. 12 Leibniz-Institute for FarmAnimal Biology (FBN), Dummerstorf 18196, Germany. 13 State Key Laboratory of Genetic Resources and Evolution, Kunming Institute of Zoology, ChineseAcademy of Sciences, Kunming 650223, China. 14 Center for Excellence in Animal Evolution and Genetics, Chinese Academy of Sciences, Kunming 650223,China. 15 State Key Laboratory of Bioreactor Engineering, East China University of Science and Technology, Shanghai 200237, China. 16 Institute of AnimalScience, Jiangsu Academy of Agricultural Sciences, Nanjing 210014, China. 17These authors contributed equally: Changfa Wang, Haijing Li, Yu Guo, JinmingHuang, Yan Sun, Jiumeng Min, Jinpeng Wang. ✉email: [email protected]; [email protected]; [email protected]; [email protected]
NATURE COMMUNICATIONS | (2020) 11:6014 | https://doi.org/10.1038/s41467-020-19813-7 | www.nature.com/naturecommunications 1
1234
5678
90():,;

The domestication of donkeys (Equus asinus) and horses(Equus caballus) dramatically enhanced human mobility andsubstantially facilitated the trading of goods between distant
territories. There is a broad consensus that the domestication ofdonkeys began in the tropics or subtropics of Africa1,2, but the exacttiming and precise location of this process remain unknown.Archeological remains of domestic donkeys have been found in theEgyptian predynastic sites of El Omari (6800–6500 years beforepresent, ybp), Maadi (6000–6500 ybp) and Abydos (5000 ybp)3–6.However, the exact timeline of donkey domestication is still unclearsince archeologists have also identified remains from African wildasses and early domestic donkeys, dating to ~8500 ybp6,7, in the siteof Ash Shumah (Yemen). On the other hand, the exact locations ofthe centers of donkey domestication remain controversial. Theidentification of 5000-year-old ass skeletons in the pharaonicmortuary complex of Abydos, with osteological lesions typical ofload carrying, provided evidence that donkeys might have beendomesticated by Egyptian villagers in the Nile Valley2. Alternatively,it has been proposed that pastoralist peoples from the Horn ofAfrica domesticated donkeys as a strategy to cope with the con-sequences of the increasing aridity of the Sahara (7000–6500 ybp).A recent study based on microsatellite data supported this latterhypothesis8.
One of the main limitations to reconstructing the history ofdonkey domestication and dispersal is the lack of archeologicalremains, as well as of additional historical evidence such as rockpaintings, textual records or engravings, particularly in sub-Saharan Africa, where such items are very rare9. One possibleexplanation for this outcome is the low status and prestige ofdonkeys compared with horses and camels9. It is also possiblethat the spread of donkeys was initially slow and scattered,experiencing a substantial enhancement only with the develop-ment of long-distance trade9.
Previous research indicated that the critically endangeredNubian wild ass (Equus africanus africanus) and an extinctrelative of the Somali wild ass (Equus africanus somaliensis)(SOM) might be the wild ancestors of domestic donkeys8.However, these findings relied exclusively on analysis of thevariability of mitochondrial DNA (mtDNA), which representsonly the maternal lineage.
All wild asses including Tibetan kiang (Equus kiang) (KIA),Onager (Equus hemionus onager) (ONA), and Somali wild ass,display a Dun color, which is characterized by a dilution of thepigmentation combined with a few dark-colored body areastermed primitive markings (e.g. dorsal stripe). In contrast, non-Dun coat colors, such as black and chestnut, can be frequentlyseen in domestic donkeys (E. asinus). In horses, the Dun phe-notype is explained by mutations impairing the expression of theTBX3 transcription factor.
In this work, we intend to elucidate the history of donkeydomestication by using a population genomics approach based on
whole-genome sequence data. In addition, we want to investigatethe genetic basis of the non-Dun phenotype and seek to ascertainwhether the same gene is involved in the determination of theDun color in donkeys or if, conversely, the genetic basis of thisancient phenotype is completely different in horses and donkeys.
ResultsGenome assembly and annotation. We constructed a de novoassembly of the donkey genome by using a state-of-the-artapproach combining consensus validation with short reads,contig formation with long reads, and scaffolding by Hi–C(Supplementary Notes 1–4, Supplementary Figs. 1–6, Supple-mentary Tables 1–4, Supplementary Data 1). These combinedtechnologies produced what is, to our knowledge, the mostcontinuous de novo genome assembly of an odd-toed ungulatewith chromosome-length scaffolds (Table 1, SupplementaryTable 4). We also assembled the sex chromosomes of donkey(Supplementary Note 4). Several assessment approaches indicatedthe high quality of our assembly (Supplementary Tables 5–7),which exhibits a 24-fold and 6-fold improvement, in the scaffoldN50, compared to those of the previously published donkeygenomes reported by Huang et al.10. and Renaud et al.11,respectively. This assembly should facilitate the identification offine-scale chromosomal rearrangements between horse anddonkey with the aim of clarifying the evolutionary history ofequine species.
According to our results, repetitive sequences accounted for41.79% of the donkey genome (Supplementary Table 8, Supple-mentary Data 2). A total of 21,983 protein-coding genes wereidentified in the present assembly (see “Methods” section andSupplementary Note 4, Supplementary Tables 9–13). Expressionprofiles of these protein-coding genes in 13 tissues were analyzedvia transcriptome sequencing (Supplementary Figs. 5 and 6,Supplementary Data 3). We calculated the proportion ofprotein-coding genes that are annotated in the horse genome(EquCab2.0)12 but not in our donkey assembly. To do so, weconsidered that each predicted protein-coding gene is representedby a single transcript and vice versa (Supplementary Fig. 7).Approximately 13.2% of the protein-coding genes in our donkeyassembly (2914 genes out of 21,980) could not be assigned to thehorse genome, a proportion that is higher than that published byRenaud et al.11. Moreover, 10.3% of the horse protein-codinggenes (2197 genes out of 21,263) could not be assigned to ourdonkey assembly, a fraction that is lower than that reported byRenaud et al.11. The whole set of protein-coding genes identifiedin our assembly spanned a total of 815.38Mb, which was~33.52% of the whole assembly, while the protein-coding regionsspanned 33.94Mb.
We also performed gene function enrichment analysis forhorse–donkey orthologs, horse-specific genes, and donkey-specific genes (Supplementary Table 14). The horse–donkey
Table 1 Quality metrics for the donkey genome assembly generated in the current work and for other donkey and horse genomeassemblies published in previous studies.
Donkey Horse
This study Renaud et al. (2018) Huang et al. (2015) EquCab3.0 EquCab2.0
Total number of scaffolds 43 9021 2167 4701 9687N50 contigs 7.92Mb 140.3 kb 66.7 kb 4.50Mb 112 kbN50 scaffolds (Mb) 93.37 15.4 3.8 87.23 46.75Coverage 211× 61.2× 42.4× 88.0× 6.8×Total bases (Gb) 2.432 2.320 2.391 2.507 2.475Largest scaffold (Mb) 209.96 84.20 17.06 – –Total number of predicted protein-coding genes 21,983 18,984 23,850 – 20,421
ARTICLE NATURE COMMUNICATIONS | https://doi.org/10.1038/s41467-020-19813-7
2 NATURE COMMUNICATIONS | (2020) 11:6014 | https://doi.org/10.1038/s41467-020-19813-7 | www.nature.com/naturecommunications

orthologs were enriched in protein-binding functions (adjusted P-value= 0.03). In contrast, horse-specific genes were enriched incellular components including organelle part (adjusted P-value=1.12E−11), intracellular organelle part (adjusted P-value= 2.72E−11), intracellular part (adjusted P-value= 1.78E−05), andmitochondrial membrane part (adjusted P-value= 0.014).Immune response (adjusted P-value= 0.0028) and enzymeinhibitor activity (adjusted P-value= 0.01) were enriched in thefunctional and molecular function categories, while donkey-specific genes were not enriched in any cellular, functional, ormolecular categories.
Our chromosome-level donkey assembly has a larger scaffoldN50 than the donkey assembly previously published by Renaudet al.11. To assess the heterozygosity of several representatives ofthe Asinus subgenus, we aligned shotgun sequencing datacorresponding to one SOM, two Asian wild asses (AWAs),including an ONA (E. hemionus onager) and a KIA (E. kiang),and one domestic donkey9,13,14 against our donkey genomeassembly. We found that the SOM was less heterozygous than thedomestic donkey (Supplementary Table 15), which is inaccordance with the findings of Renaud et al.11. Except forONA, the heterozygosity rates obtained in our study for the SOM,KIA, and the domestic donkey (Supplementary Table 15) werehigher than those reported by Renaud et al.11.
Population genetics. We resequenced, with an average coverageof 10.9×, the genomes of 83 domestic donkeys and two Asian wildasses (two E. hemionus and one E. kiang) from nine countries(Supplementary Note 5, and Supplementary Figs. 8 and 9, andSupplementary Data 4). We also added to our dataset genomesequences from four Asian wild asses (one E. hemionus, one E.hemionus onager, and two E. kiang), one Somali wild ass (E.africanus somaliensis) and 43 domestic donkeys (SupplementaryData 4). A total of 133 genomes of 126 domestic donkeys andseven wild asses from nine countries were used for populationgenetics analyses. Analysis of these combined data generated acollection of 17.28 million SNPs and 1.5 million indels.Approximately 7.0 million SNPs and 0.66 million indels weredetected among the 126 domestic donkeys (SupplementaryTables 16 and 17, Supplementary Data 5).
Both the phylogenetic tree (Fig. 1a) and the principalcomponent analysis (PCA) (Supplementary Fig. 10) separatedthe 133 individuals under analysis into two clades, one includingall Asian wild asses and the other including the African wild assand all domestic donkeys, thus confirming previous reportsdemonstrating that the domestic donkeys originated from Africanwild asses and not from Asian wild asses1,2.
PCA of only domestic donkeys (Fig. 1b, Supplementary Fig. 11)revealed three main clusters: (i) Tropical Africa cluster (Kenya,Ethiopia, and Nigeria), (ii) North Africa and Eurasia cluster(Egypt, Spain, Iran, Kyrgyzstan, and China), and (iii) Australiacluster, roughly corresponding to their continental distribution.Unfortunately, the absence of textual records and archeologicalremains as well as of pictorial and sculptural representations9
makes it very difficult to infer the routes of spread of donkeysacross Africa. Blench9 proposed several potential paths ofdiffusion, none of which connect West and East Africa, but thisdoes not necessarily imply the absence of gene flow between thesetwo geographic areas. We have also observed that Australiansamples clustered separately from their African, Asian, andEuropean counterparts. The strong differentiation of Australiandonkeys might be attributed to the limited number of founderindividuals that were brought by the British colonizers toAustralia 200 years ago15 as well as to the effects of prolongedgeographic isolation and high genetic drift.
Individual ancestry coefficients were inferred with Admix-ture16 to further assess population structure (Fig. 1c). WithK= 2, the genetic ancestry represented by garnet color appearsmainly in populations from Kenya, Ethiopia, Nigeria, andAustralia. With K= 3, which is also the optimal K-value(Supplementary Fig. 12, Supplementary Data 6), the thirdgenetic ancestry (in blue) appears mainly in Australian donkeysand Spanish donkeys. When K= 4, the fourth genetic ancestryappears mainly in populations from Spain, Iran, Egypt, andNigeria.
Based on the population structure analyses mentionedpreviously, domestic donkeys could be subdivided into theTropical Africa group (including donkeys from Kenya, Ethiopia,and Nigeria) and the North Africa & Eurasia group (includingdonkeys from Egypt, Spain, Iran, Kyrgyzstan, China, andAustralia). Population genetic analyses of the two groups werecarried out to infer nucleotide diversities (π), Watterson’sestimators (θW), minor allele frequency (MAF) distributions,and the linkage disequilibrium (LD) parameters (r2).The nucleotide diversity of the Tropical Africa group (π=0.697 × 10⁻³) was lower than that of the North Africa & Eurasiagroup (π= 0.857 × 10⁻³). In contrast (Supplementary Table 18),the Watterson’s estimator of the Tropical Africa group (θW=0.644 × 10⁻³) was higher than that of the North Africa andEurasia group (θW= 0.576 × 10⁻³). The distribution of MAFswas similar in both groups (Supplementary Fig. 13), while theTropical Africa group had a higher LD than the North Africa &Eurasia group (Supplementary Fig. 14). These results make itdifficult to infer whether there are one or, as proposed by Beja-Pereira et al.1, two primary donkey domestication sites.
We used the D-statistic17 to study the relations between theSomali wild ass and the two domestic donkey groups. The D-statistics were calculated in the form of (((Population 1,Population 2), African wild ass), Asian wild ass) wherePopulation 1 (P1) and Population 2 (P2) were represented bydonkeys from African or Eurasian countries. A positive D-statisticindicates that gene flow existed between P1 and African wild asswhile a negative D-statistic indicates that gene flow took placebetween P2 and African wild ass. Among the 12 tests (Fig. 1d,Supplementary Table 19), the form (((Kenya, Australia), Africanwild ass), Asian wild ass) has the highest D-statistic and (((Egypt,Australia), African wild ass), Asian wild ass) has the secondhighest D-statistic, indicating that the Tropical Africa group(including donkeys from Kenya) is genetically closer to theAfrican wild ass than Egyptian donkeys, and that Egyptiandonkeys are more closely related to the African wild ass thanEurasian donkeys, suggesting a result consistent with the Africandomestication of donkeys and their subsequent spread to Europeand Asia.
To detect potential introgression events among domesticdonkey populations, we performed a combination of analyses,including D-statistic17 and TreeMix18 analyses. D-statistic testswere applied by considering the Asian wild asses as an outgroup.This analysis indicated that introgression events existed betweendifferent geographic populations (Z scores <−3, SupplementaryTable 20), for example, between Ethiopian donkeys and Egyptiandonkeys, between Nigerian donkeys and Egyptian donkeys,between Ethiopian donkeys and Nigerian donkeys, and betweenSpanish donkeys and Egyptian donkeys. For Australian donkeys,a potential gene flow with their Egyptian and Spanish counter-parts was detected, but Australian donkeys were genetically closerto Spanish donkeys than to Egyptian donkeys (SupplementaryTable 20). TreeMix analysis also confirmed the existence of geneflow between donkey populations from different countries andcontinents (Supplementary Fig. 15).
NATURE COMMUNICATIONS | https://doi.org/10.1038/s41467-020-19813-7 ARTICLE
NATURE COMMUNICATIONS | (2020) 11:6014 | https://doi.org/10.1038/s41467-020-19813-7 | www.nature.com/naturecommunications 3

Domestic donkeys have similar historic effective populationsizes. By taking into account whole-genome data from singleindividuals, we utilized the pairwise sequentially Markoviancoalescent (PSMC) model19 to infer the local time to the mostrecent common ancestor (TMRCA) as well as to assess changes in
the historic effective population size (Ne), measured by themutation-scaled rate (Fig. 2a, Supplementary Data 7). Our resultsare consistent with those of Renaud et al.11. All the curves ofdomestic donkeys mixed well, indicating that donkey domes-tication is a recent event. The ancestral Ne values of E. africanus
–0.10
–0.05
0.00
0.05
0.10
0.15
0.20
–0.40 –0.35 –0.30 –0.25 –0.20 –0.15 –0.10 –0.05 0.00 0.05 0.10
PC
2(2.
46%
)
PC1(3.09%)
KenyaEthiopiaNigeria
EgyptIran
KyrgyzChinaSpain
Australia
dc
K = 2
K = 3
K = 4
Ken
yaE
thio
pia
Nig
eria
Egy
ptIr
anK
yrgy
zsta
n
Chi
na
Spa
inA
ustr
alia
a
b
Ti-3
Eg-5
Sp-3
Ch-tlf4
Ky-4
Ir-7
Ch-
xj3
Ch-tlf5
Ch-tlf2
Aw1
Ch-qy1
Ch-
ht4
Ch-qy2
Sp-13
Ke-4
Au-6
Eg-7
Ir-2
Ch-jm
2
Sp-11
Ch-qy3
Sp-5
Et-
8
Ni-1
Ch-
jm1
Ni-6
Ch-kl2
Kia2
Ch-jm
5
Ir-4
Ch-
yn3
Ch-
xj4
Ch-gl3
Ir-6
Ke-11
Ch-
ht2
Ch-tlf1
Ky-2C
h-yn
2
Et-
1
Ky-6
Ch-
yn1
Ch-gl4
Eg-6
Ky-3
SOM
Au-3
Ke-
17
Sp-4
Sp-15
Ke-1Ke-
14
Ti-1
Ir-8
Ke-16
Au-5
Ke-9
Sp-7
Ke-6Ke-10
Ni-3
Sp-2
Ir-1Ch-ht3
Au-4
Au-7Au-8
Kia1
Sp-18
Ch-
xj1
Ke-1
2
Ch-jm
3Sp-17
Sp-9
Au-2
Aw2
Sp-8
Ky-5
Et-
6
Eg-8
Ch-
ht1
Ke-5
Ch-by3
Ch-kl4
Ke-
3Et-
4
Au-1
T2-i
Et-1
0
Ch-tlf3
Ke-15
Eg-4
Ch-gl1
Ch-qy4
Ch-kl1
Eg-2
Ni-2
Eg-3
9-tE
Ke-2
Ona
Et-
2
Ch-by4
Ch-
by1
Ch-gl2
Eg-1
Ky-1
Ch-
xj5
Et-
7
Ti-4
Ky-7
Aw3
Sp-16
Sp-12
Ch-jm
4
Sp-6
Ke-
7
Ni-5
Ke-13
Ni-4
Ch-dz Sp-10
Sp-1
Don
Ir-5Ir-3
Ch-kl3
Et-5
Ke-8
Sp-14
Et-3
Ch-xj2
Ch-by2
Tree scale: 0.01
AWAsTropical AfricaAustraliaNorth Africa & EurasiaSOM
–0.004
0
0.004
0.008
0.012
0.016
0.02
D s
tatis
tic
(Egy
pt, I
ran)
(Egy
pt,
Aus
tral
ia)
(Egy
pt, K
yrgy
zsta
n)(E
gypt
, Spa
in)
(Ken
ya, I
ran)
(Ken
ya, A
ustr
alia
)(K
enya
, Kyr
gyzs
tan)
(Ken
ya, S
pain
)(K
enya
, Chi
na)
(Ira
n, A
ustr
alia
)(K
enya
, Egy
pt)
(Spa
in, A
ustr
alia
)
ARTICLE NATURE COMMUNICATIONS | https://doi.org/10.1038/s41467-020-19813-7
4 NATURE COMMUNICATIONS | (2020) 11:6014 | https://doi.org/10.1038/s41467-020-19813-7 | www.nature.com/naturecommunications

somaliensis and E. asinus diverged ~0.11 million years ago (mya).Much later, donkeys were domesticated about 7000–9000 yearsago (kya), as assessed through the analysis of archeological evi-dence9. In addition, we inferred the demographic history ofTropical African donkeys and North African & Eurasian donkeyswith SMC++ software20. The Ne curves of these two groups ofdonkeys were indistinguishable (Fig. 2b), indicating that thesedonkeys were probably derived from the domestication of onecommon ancestral group or at least two ancestral groups with asimilar biogeography. Our analyses lack enough resolution toinfer whether donkeys were domesticated in one or severallocations. The study of ancient DNA will be crucial to elucidatethis essential question.
We also built a statistical model based on PSMC to detect themost recent possible admixture event time of ancestral species ofdomestic donkey from autosome-sequencing data (see “Methods”section, Supplementary Fig. 16, Supplementary Data 8). Thismodel indicated that historical admixture events took place ~40to 60 kya in wild ancestral species of domestic donkeys (Fig. 2c),which was concordant with the variation trend of Ne estimatedwith PSMC (Fig. 2a), as the population split and admixture eventswere expected to generate a hump in the historicalpopulation size.
Donkeys have different paternal and maternal demographichistories. The analysis of 126 domestic donkey genomes showedthat the SNP density on the sex chromosomes was dramaticallylower than that on the autosomes (Supplementary Table 20). Themarked differences in the genetic diversities of the X and Ychromosomes can be attributed to multiple causal factors asso-ciated with the mutation rate, Ne, demography, and evolutionaryselection21. Interestingly, a similar genetic pattern has beenobserved in horse22, which is also a polygynous species withdominant males defending large territories.
To determine the patrilines of donkeys, we constructed aphylogenetic tree for male donkeys with SNPs mapping to the Ychromosome (Fig. 2d). The tree outlined the divergence time forthe Y chromosome of wild asses and domestic donkeys. Wescaled the results to a real temporal scale by setting the divergencetime between E. africanus somaliensis and E. kiang to 1.61 mya, aspreviously reported13. Our results based on Y chromosome SNPsshow that the ancestral species of E. africanus and E. hemionusseparated between 1.55 and 1.66 mya (95% confidence interval)(Fig. 2d and Supplementary Data 9). The common ancestralspecies of all domestic donkeys (E. africanus) separated into twoclades ~14.67–17.93 kya (95% confidence interval), and bothclades further split into diverse donkey breeds in a window oftime from 5.5 to 3.62 kya (Fig. 2d and Supplementary Data 9). Wealso constructed a phylogenetic tree with SNPs mapping to themitochondrial genome for all donkeys and asses (SupplementaryFig. 17, Supplementary Data 10), and the result was consistentwith the estimated time of donkey domestication. Remarkably,
the estimated time at which the ancestral species of E. africanussplit into two clades according to Y chromosome data(14.67–17.93 kya) does not match the estimated divergence timeof the two mitochondrial clades (0.303–0.910 mya) reported byBeja-Pereira et al.1 and confirmed in the current work(Supplementary Fig. 17, Supplementary Data 10). These resultssuggest a different demographic history for maternal and paternaldonkey lineages.
Positive selection of the TBX3 gene modified the pigmentationpatterns of donkeys. Coat color is one of the main traits thatwere selected during the domestication process. The base color ofdonkeys can be black or red (chestnut)23. There is a dominantDun allele causing strong dilution of the pigmentation, whichbecomes gray or light chestnut/rose Dun, in contrast to therecessive non-Dun allele (black or chestnut, as mentioned pre-viously). The Dun coat is considered to be the ancestral wildtype24, while the non-Dun coat is found exclusively in domesticanimals. In this study, we compared 25 Dun donkey samples and23 non-Dun donkey samples from different geographic regions toidentify the genomic region responsible for this coloration pattern(Supplementary Data 11). We used three methods to search forthe causal mutations, including the fixation index for diversitydifferentiation (FST), extended haplotype homozygosity (XP-EHH) test and reduction of diversity (ROD). The overlap of theselective signals consistently detected with the three methodsrevealed that the most significant region was located on the42–43Mb interval of chromosome 8 (Fig. 3a). The analysis basedon π and Tajima’s D supported a strong selective signal in thisregion (Fig. 3b). By plotting the phased SNPs, the selective sweepwas finely mapped to the 42,587,636–42,781,262 bp interval(Fig. 3c), which contains the T-Box 3 gene (TBX3, EAS0007835 inthe Ensembl database). The only TBX3 polymorphism fullyassociated with the Dun phenotype was a 1 bp deletion (chr8:g.42742556 CT>C−). This deletion showed homozygous or het-erozygous genotypes (CT/CT or CT/C−) in all Dun donkeys,while all non-Dun donkeys were homozygous for the deletion (C−/C−) (Supplementary Table 21). These results indicate that thenon-Dun pigmentation emerged as a result of the loss of 1 bp inthe TBX3 gene. This 1 bp deletion (chr8:g.42742556 CT>C−) islocated ~18.6 kb downstream of the transcription start site of theTBX3 gene.
We investigated the biochemical basis of the Dun phenotype indonkeys. Hematoxylin and eosin (H&E) staining of cross-sectionsof croup hairs revealed that hair pigment is differentiallydeposited in Dun and non-Dun donkeys (Fig. 4a). In thismanner, hair pigment is evenly distributed in the hair cortex ofnon-Dun donkeys. Conversely, a radial and asymmetricaldistributions of pigment in the hair cortex of Dun donkeys isobserved. As expected, pigmentation in Dun donkeys is markedlydiluted. Pigment granules in hairs from the croup of the Dundonkey are limited to approximately less than half of the cortex
Fig. 1 Population structure of domestic donkeys. a Neighbor-joining phylogenetic tree of 133 donkey and ass samples constructed using 16,582,014autosomal SNPs based on pairwise identity-by-state (IBS) genetic distances. The Asian wild asses were set as an outgroup. AWAs Asian wild asses, SOMSomali wild ass. The following acronyms are used: Ke (Kenya), Ch (China), Ni (Nigeria), Ir (Iran), Sp (Spain), Eg (Egypt), Et (Ethiopia), Ti (Tibet), Au(Australia), and Don (the European donkey whose sequence was reported in a previous study13). b Principal component analysis (PCA) based on 6,825,163autosomal SNPs identified in 126 domestic donkeys with different geographic origins. c Bayesian model-based clustering (from K= 2 to K= 4) of 126domestic donkeys. Each vertical bar represents one individual. Each color represents one putative ancestral background, and the y-axis quantifies ancestrymembership. d D-statistic tests in the form (((Population 1, Population 2), Somali wild ass), Asian wild ass) where Population 1 (P1) and Population 2 (P2)indicates donkeys from African or Eurasian countries. Data are presented as D-statistic ± 1 s.e.m. A positive D-statistic indicates that P1 shares morederived alleles with African wild ass than P2 does, while negative D-statistic indicates that P2 shares more derived alleles with African wild ass than P1does. D-statistic and Z scores for each test can be seen in Supplementary Table 19. Source data are provided as a Source Data file.
NATURE COMMUNICATIONS | https://doi.org/10.1038/s41467-020-19813-7 ARTICLE
NATURE COMMUNICATIONS | (2020) 11:6014 | https://doi.org/10.1038/s41467-020-19813-7 | www.nature.com/naturecommunications 5

(diluted hairs). This result is consistent with observations madeby Imsland et al.25 in horses. Histological sections of croup skinindicated that in Dun donkeys, pigments are densely distributedon the outward side of the hair follicle and sparsely distributed onthe inward side. In contrast, in non-Dun donkeys, pigments areevenly distributed on both sides of the hair follicle (Fig. 4b).Histological sections of anagen hair follicles revealed that in Dundonkeys, the uneven distribution of pigments starts in the hair
bulb, while in non-Dun donkeys, this asymmetric pattern of hairpigmentation is disrupted (Fig. 4c, Supplementary Fig. 18).
To understand the role of the 1 bp deletion presumablyinvolved in the determination of the non-Dun phenotype, wecompared the expression levels of TBX3 and other genesregulating melanocyte pigment production in Dun and non-Dun donkeys. We first assessed the genotype of the 1 bp deletionin three Dun and three non-Dun donkeys by Sanger sequencing.
Time (years ago)
Effe
ctiv
e po
pula
tion
size
(×
104 )
20
15
10
5
104 105 106 107
Ch-dzIr-3Ky-7SomSp-5
0
5
10
15
20
104 105 106 107
Effe
ctiv
e po
pula
tion
size
(×
104)
Time (years ago)
Equus hemionusEquus kiang
Equus hemionus onagerEquus africanus somaliensis
Equus asinus
a
b d
c
Tropical Africa Donkeys
North Africa & Eurasia Donkeys
1
10
104
Effe
ctiv
e po
pula
tion
size
(×
104 )
105
Time (years ago)
MCMC posterior
0.001
0.8808
1.60 Mya[1.53–1.66 Mya]
Ti-4
0.0090
16.3 Kya[14.67–17.93 Kya]
Ir-4
Eg-8
Ch-xj4
Sp-9
Sp-7Sp-8
Ky-3
Et-2Et-5Ke-13Ni-1Ni-6Ni-3
Ky-7
Sp-1
Ch-yn1
Eg-7
Ir-2Ti-3Ch-tlf3
Eg-6Ni-4
Ch-qy1
Ch-ht1Ch-qy3
Ch-by4Ch-jm2
Ch-by3Ch-qy4
Ch-dzCh-yn3Eg-3
Ke-7Ke-5Ke-10
Et-4Ke-16
Ke-9
Ke-14Ke-15
Ke-1Ke-12
Ke-2
Ch-jm4Ch-jm5
Et-6Et-9Et-10
Ir-5Ke-3
Et-1Et-3
Ch-xj3Sp-4
Ke-4
Ke-8
Ch-gl3Ch-xj2
[3.08–3.98 Kya]0.0020
3.62 Kya
[4.44-6.39 Kya]
Ir-7
0.0031
5.5 Kya
Aw2Ona0.1670
0.30 Mya[0.29–0.31 Mya]
Eg-4Don
Au-8
Ir-3Sp-12
SP-5
Equus hemionusEquus hemionus onager
Equus asinus
0.0 0.2 0.4 0.6 0.8 1.0
ARTICLE NATURE COMMUNICATIONS | https://doi.org/10.1038/s41467-020-19813-7
6 NATURE COMMUNICATIONS | (2020) 11:6014 | https://doi.org/10.1038/s41467-020-19813-7 | www.nature.com/naturecommunications

This analysis demonstrated that the genotype of the 1 bp deletionwas CT/C− in all Dun donkeys and C−/C− in all non-Dundonkeys. Then, we performed transcriptome sequencing of croupskin from three Dun and three non-Dun donkeys. Among thedifferentially expressed genes, we found that TBX3 mRNA wasdownregulated 1.8-fold in non-Dun skin (Fig. 4d, SupplementaryData 12), and this observation was confirmed by quantitative RT-PCR (downregulated by 2.3-fold in non-Dun skin, Fig. 4e). Wealso identified nine genes (DCT, KIT, KITLG, MC1R, MLANA,OCA2, SLC24A5, TRPM1, and TYR) that are known to regulatepigment production in melanocytes. These genes showedupregulated expression in non-Dun croup skin (Fig. 4d, Supple-mentary Data 12). This result is consistent with the increasedpigment content in non-Dun hair. We also compared theexpression of melanogenic or melanocyte regulatory genes inthe dorsal stripe skin of Dun donkeys and skin from thecorresponding location in non-Dun donkeys, but we did notobtain evidence of differential expression (SupplementaryTable 22).
To illustrate the relationship between pigment depositionpatterns and the profile of TBX3 mRNA expression, we carriedout immunohistochemical and immunostaining assays of TBX3expression in croup skin sections of Dun and non-Dun donkeys.Immunohistochemistry of a Dun croup skin section showed thatTBX3 is expressed on only one side of the longitudinal axis of thehair follicle and that pigment is distributed on the other side(Fig. 4f). In the section of anagen hair follicles from the Dundonkey, TBX3 immunostaining was observed in a subset ofkeratinocytes in the developing hair cortex and in the outercuticular layer. In contrast, in the non-Dun donkey, immunos-taining was observed only in the outer cuticular layer of the hairfollicle (Fig. 4g, Supplementary Fig. 18). These results suggest thatthe expression of TBX3 in cortical keratinocytes suppresses thedeposition of pigment, thus generating the asymmetricaldistribution pigmentation pattern characteristic of Dun donkeys.It is likely that the 1 bp deletion inhibits, to some extent, theexpression of TBX3 in the hair follicles of non-Dun donkeys, thussuppressing the abrogating effect of TBX3 on pigment deposition.In addition, we analyzed the selective sweep in Asian wild asses,Somali wild ass and chestnut donkeys. The gray-colored Asianwild asses and Somali wild ass were homozygous for the allele CT,suggesting that CT/CT is the ancestral genotype. The chestnutand black donkeys were both C−/C− and showed similar phasedhaplotypes in the selective sweep. The median-joining haplotypenetwork (Fig. 3d) for the TBX3 region (from 42,726,257 to42,743,062) encompassing the short indel, indicated that thechestnut and black coats were more likely derived from gray-colored domestic donkeys than directly from wild donkeys.
Convergent selection for the Dun phenotype in horses anddonkeys. In horses, two variants associated with the non-Dunphenotype, i.e., the G>T mutation at chr8:18,227,267 (horse non-Dun1 allele) and the 1609 bp deletion (horse non-Dun2 allele), arealso located ~18 kb downstream of the transcription start site ofTBX325. The alignment of sequences containing the non-Dun1allele of horse with the donkey sequence that harbors the 1 bpdeletion mentioned previously indicated that these sequences arehomologous (Supplementary Fig. 19). Moreover, the 1 bp deletionis located 25 bp downstream of the non-Dun1 causal substitution(Supplementary Fig. 19). Careful inspection of both Dun andnon-Dun donkey TBX3 sequences indicated that there was nopolymorphism equivalent to the horse non-Dun2 allele (Supple-mentary Fig. 19). Likewise, the horse non-Dun1 allele identified inhorses did not segregate in donkeys. Moreover, the 1 bp deletiondetected in the current work was located within the 1609 bpdeleted region corresponding to the horse non-Dun2 allele. Theseresults indicate that the same causal gene (TBX3) is involved, butthe causative mutations for the non-Dun phenotype in donkeysand horses occurred independently after the divergence of thesetwo species. Imsland et al.25 inferred that the binding sites forNF-Y and NF-I, which are CCAT box-binding transcriptionfactors, were altered in horses harboring the non-Dun1 allele. Thebinding sites for ALX4 and MSX2, which are known transcriptionfactors participating in hair follicle development26–28, weredeleted in horses carrying the non-Dun2 allele. Transcriptionfactor affinity prediction with TRAP29 indicated that the shortdeletion in the TBX3 gene of non-Dun donkeys involves thesuppression of one binding site for the transcription factor NFIC,which is essential for TGF-β-dependent hair follicle cycling30. InDun donkeys, the binding site for NFIC is CTGGC, while in non-Dun donkeys, the 1 bp deletion generated a motif (CGGC) thatcannot bind NFIC (Supplementary Fig. 19). Moreover, com-parative mapping indicated that the region 1000 bp upstream anddownstream of the CT/C− indel corresponds to the114,663,952–114,689,575 interval on human chromosome 12(version GRCh38), which contains an enhancer (GH12F114663,chr12:114,663,952–114,689,575).
In horses, the Dun phenotype, which is also ancestral, ischaracterized by a generalized dilution of the pigmentationexcept in certain areas of the body, e.g., the dark dorsal stripe.Dun coloration is assumed to enhance camouflage frompredators25. As previously stated, the non-Dun phenotype (nocolor dilution) is predominant in most domestic horses and isexplained by regulatory mutations in the TBX3 gene. In thenon-Dun skin of horses, the expression of the TBX3 gene is alsodownregulated. We detected the upregulated expression ofseveral pigmentation genes in the skin of non-Dun donkeys
Fig. 2 Demographic history of Asian wild ass, Somali wild ass, and domestic donkeys. a Demographic trajectories revealed by PSMC. The time scale onthe x-axis is calculated assuming a mutation rate of 7.242 × 10⁻⁹ mutations per generation and site, while the assumed generation time is 8 years11,87.Bootstrapping confidence intervals for each sample are shown in Supplementary Data 7. b Demographic history of Tropical African donkeys and NorthAfrican & Eurasian donkeys revealed by SMC++. c Potential admixture events and corresponding times inferred with a model based on PSMC. AutosomalSNPs from randomly selected domestic donkeys (Ch-dz, Ir-3, Ky-7, and Sp-5) and the Somali wild ass were used in this analysis. The admixture eventswere indicated by crosses on the curves. d Phylogenetic tree based on Y chromosome SNPs from wild asses and domestic donkeys. Sample names in goldrepresent North African & Eurasian donkeys while sample names in red represent Tropical African donkeys. A total of 13,032 SNPs mapping to the Ychromosome were used to construct the tree. BEAST 2 was applied in this phylogenetic analysis. The parameters for generating the maximum cladecredibility (MCC) tree are HKY for the site model, strict clock model for the clock model (clock rate= 1), and Yule model for tree priors. The phylogenetictree was generated by Bayesian Markov chain Monte Carlo (MCMC) with 1000 simulations. The numbers beside the nodes indicate the estimated nodeheight, the divergence time, and the corresponding 95% confidence intervals. Kya refers to 1000 years ago and Mya refers to million years ago. The nodestatistical support was assessed by MCMC posterior probability indicated by the edge color linked to the node. In Fig. 1c, d, the following acronyms havebeen used: Ke (Kenya), Ch (China), Ni (Nigeria), Ir (Iran), Sp (Spain), Eg (Egypt), Et (Ethiopia), Ti (Tibet), Au (Australia), and Don (the European donkeywhich sequence was reported in a previous study13).
NATURE COMMUNICATIONS | https://doi.org/10.1038/s41467-020-19813-7 ARTICLE
NATURE COMMUNICATIONS | (2020) 11:6014 | https://doi.org/10.1038/s41467-020-19813-7 | www.nature.com/naturecommunications 7

1.0
2.0
3.0
XP
-EH
H
0.1
0.2
0.3
F ST
0.4
0.6
0.8
RO
D
0.000
0.001
0.002
42.0 42.5 43.0 43.5
–2.00
0.00
2.00
42.0 42.5 43.0 43.5
Taj
ima’
s D
Position (Mb)
BlackGray
Chromosome
πTBX3
chr8:42.5–42.8 Mbp
AWASOM
Gray
Black
Chestnut
42.52 Mbp 42.82 Mbp
TBX3 Indel: CT/C-
AWA SOM Gray Black Chestnut
b c
d e
1 2 3 4 5 6 7 8 9 10 11 12 13 14 15 16 17 18 19 20 21 22 23 24 25 26 27 28 29 30
Genomic position of SNPs
Dun
3.17
0.31
0.86
a
Dun
Non-Dun
Gray Gray
Black Chestnut
Non
-Dun
Fig. 3 Selective scans for the Dun phenotype of donkeys. a Donkeys with Dun (gray) and non-Dun (black and chestnut) coat colors. b Whole genomescan with XP-EHH, FST, and ROD. The orange arrow indicates the genome position of the strongest selective signal for the Dun phenotype. The numbers inred are the values of the three statistics for the strongest selective signal. The dashed lines represent the empirical threshold values for the three methods:2.5 for XP-EHH, 0.3 for FST, and 0.8 for ROD. c Nucleotide diversity and Tajima’s D corresponding to the Dun selective sweep on chromosome 8 whichencompasses the TBX3 gene. d Plot of the haplotype structure of SNPs around the TBX3 gene in all donkeys and wild asses. AWA refers to Asian wildasses. SOM refers to Somali wild ass. Genotypes identical or different to those of our donkey assembly are represented with yellow and green colors,respectively. The red rectangle shows the position of the TBX3 gene (from 42,723,946 bp to 42,735,174 bp). The blue arrow indicates the position(42,742,556 bp) of the candidate causal 1 bp deletion for the Dun phenotype. e Median-joining haplotype network based on the SNPs from the 5′ end ofthe TBX3 gene (42,723,946 bp) to its downstream 20,000 bp (42,743,946 bp) on chromosome 8. Each circle represents one haplotype, and the size of thecircle indicates the number of individuals harboring the haplotype. Lines with dashes between circles represent the mutational steps between haplotypes.One dash represents one mutation and two dashes represent two mutations. Only SNPs with minor allele frequencies ≥0.1 were considered in this analysis.
ARTICLE NATURE COMMUNICATIONS | https://doi.org/10.1038/s41467-020-19813-7
8 NATURE COMMUNICATIONS | (2020) 11:6014 | https://doi.org/10.1038/s41467-020-19813-7 | www.nature.com/naturecommunications

(Supplementary Data 12, Supplementary Note 6), thus showingthat the molecular mechanism of pigment dilution is verysimilar in horses and donkeys.
DiscussionThe history of donkey domestication is controversial. Previousmitochondrial data of donkey indicated the existence of twohighly differentiated clades. Our mitochondrial data agree wellwith the existence of two clades that diverged 0.303–0.910 mya,but population structure data based on the analysis of whole-genome sequences indicate that modern Tropical African don-keys and North African & Eurasian donkeys coalesced before6000 ybp. Interestingly, analysis of extensive mitochondrial datasets has shown that Somali wild asses are distinct from Nubianwild asses and domestic donkeys from clades 1 and 231. Theseresults suggest that both clades might have a Nubian-likeancestry31. Interestingly, wall paintings and other iconography
of domestic donkeys began in Egypt in the fourth millennium BC,while no representations of wild asses or domestic donkeys havebeen found in the Horn of Africa9. Moreover, the analysis ofancient Egyptian wall paintings has shown that the process ofdifferentiation of donkeys from their wild relatives can be trackedthrough the progressive disappearance, during the transition fromthe Old Kingdom to the Middle Kingdom, of the dark shoulderstripe of the wild ass from donkeys9. Such depictions of thegradual transformation of wild asses into domestic donkeys arecompletely absent in other parts of Africa9. The scarcity ofarcheological remains and other sources of historical informationreinforces the need to sequence a broad collection of ancient andmodern African samples from wild asses and domestic donkeysto clearly ascertain the geography and timing of donkeydomestication.
We also observed a limited level of variability in the donkey Ychromosome, a result that is consistent with previous findings in
Dun
Non-dun
a
Dun Non-dunb
Non-dunDun
c
d e
f
g
Dun Non-dun
Dun
TBX3 (red)DAPI (blue)
Non-dun
TBX3 (red)DAPI (blue)
–1
–0.5
0
0.5
1
1.5
2
TB
X3
TY
R
DC
T
MC
1R
TR
PM
1
SLC
24A
5
MLA
NA
KIT
LG KIT
OC
A2
non-
dun/
Dun
log
2(f
old
chan
ge)
0
0.005
0.01
0.015
0.02
0.025
Dun Non-dun
GE
NE
mR
NA
/β-a
ctin
mR
NA
Relative gene expression of TBX3p = 0.04
Fig. 4 Phenotypic characterization and differential gene and protein expression in the croup skin of Dun and non-Dun donkeys. aMicrographs of cross-sections of hairs from Dun and non-Dun donkeys, images representative of three experiments b Micrographs of skin and hair sections from Dun and non-Dun donkeys stained with hematoxylin and eosin, images representative of three experiments. c Micrographs of sections of anagen hair follicles from Dunand non-Dun donkeys stained with hematoxylin and eosin, images representative of three experiments. d Bar plot of differential mRNA expression (log2-transformed fold change) of 10 pigmentation-related genes expressed in the skin of non-Dun (n= 3) versus Dun (n= 3) donkeys. Upregulated anddownregulated genes are indicated with red and orange bars, respectively. Black circles indicate the data points. e Relative croup skin TBX3 mRNA levels(mean ± s.e.m.) as assessed by quantitative RT-PCR in Dun (n= 3) and non-Dun (n= 3) donkeys (statistical significance of a two-tailed t-test is indicated).Black circles indicate the data points. Source data are provided as a Source Data file. f Micrographs of immunohistochemistry of the TBX3 protein insections of hair follicles from the croup of Dun and non-Dun donkeys, images representative of three experiments. g Micrographs of immunofluorescenceanalysis of the TBX3 protein (red) in sections of anagen hair follicles from the croup of Dun and non-Dun donkeys, images representative of threeexperiments. DAPI staining is indicated with blue color, and white lines show the basement membrane. Scale bars were defined in each image.
NATURE COMMUNICATIONS | https://doi.org/10.1038/s41467-020-19813-7 ARTICLE
NATURE COMMUNICATIONS | (2020) 11:6014 | https://doi.org/10.1038/s41467-020-19813-7 | www.nature.com/naturecommunications 9
horses32. While horses display high levels of mitochondrialdiversity, the study of Y chromosome data has evidenced lowvariation32. Until recently, it was thought that the decline in horseY chromosome variability began 5500 years ago as a result offounder effects associated with the domestication process, i.e.,most likely, a limited number of stallions were incorporated intothe domestic stock33. However, the analysis of horse ancient DNArevealed that stallion Y chromosome diversity remained highuntil at least 2000 ybp34,35 with a steady reduction then35. Indeed,Byzantine horses (287–861 CE) and horses from the GreatMongolian Empire (1206–1368 CE) already displayed reducedvariation (although larger than the current variation)35. Morerecently, in the post-Renaissance period, the predominance ofcertain stallion lines caused a 3.8- to 10.0-fold reduction in Ychromosome diversity35, exemplifying the strong impact ofbreeding and artificial selection on equine paternal diversity. Themost prevalent view is that the limited paternal variabilityobserved in modern horse breeds was mainly produced by thereproductive strategies employed during the last two millennia,which relied on the extensive use of a limited number of specificstallion lines that became predominant35. This is illustrated by thedominance of an ~1000- to 700-year-old oriental haplogroup inmost modern studs34. The analysis of ancient donkey genomeswill be fundamental for determining whether jack Y chromosomediversity was high at the initial stages of domestication, and thendeclined as a result of mating practices similar to those imple-mented in horse breeding.
Livestock species were domesticated at different locationsand historical times, but, compared to their wild ancestralspecies, domestic animals display a few common features(increased tameness, existence of multiple coat colors, increasedreproduction, earlier onset of sexual maturity, etc.) that wereestablished through artificial selection36. Currently, there ismuch debate about whether this phenotypic convergence isexplained by common mechanisms leading to genetic con-vergence (homologous causal genes or mutations) or by theaction of distinct sets of genes37. According to Glémin andBataillon38 and Martínez-Ainsworth and Tenaillon39, geneticconvergence is a rare phenomenon in cultivated plants, andsimilar domestication traits are generally controlled by differentloci. However, the generalized lack of knowledge about thegenes involved in the domestication process makes it difficult toassess whether genetic convergence is the rule or the exception.In the current work, we demonstrated that the dilution of thecoloration typical of the Dun phenotype displays very similarmicroscopic and macroscopic features in horses and donkeys.More importantly, we were able to demonstrate that the samegene, TBX3, is responsible for the Dun pattern of pigmentationin both species, and we also showed that the causal mutation ofthe non-Dun phenotype in donkeys is a 1 bp deletion with aprobable regulatory effect. Similarly, in horses, the non-Dunphenotype is explained by two deletions with regulatoryeffects25. In another study, Vickrey et al.40 provided evidencethat head crests in domestic rock pigeons (Columba livia) andring neck doves (Streptopelia risoria) are produced by differentmutations in the ephrin receptor B2 gene. Moreover, the ana-lysis of the genomes of sheep, goats, and their wild ancestralspecies demonstrated that approximately half of the genesshowing selection signatures in Ovis, show congruent signaturesin Capra41. Here, we showed that the TBX3 gene was con-vergently selected in horses and donkeys. Although this parti-cular case cannot be generalized to other phenotypes, itemphasizes the need to precisely clarify the role of convergentevolution in the fixation of Mendelian phenotypes that havebeen recurrently targeted by selection in multiple domesticspecies.
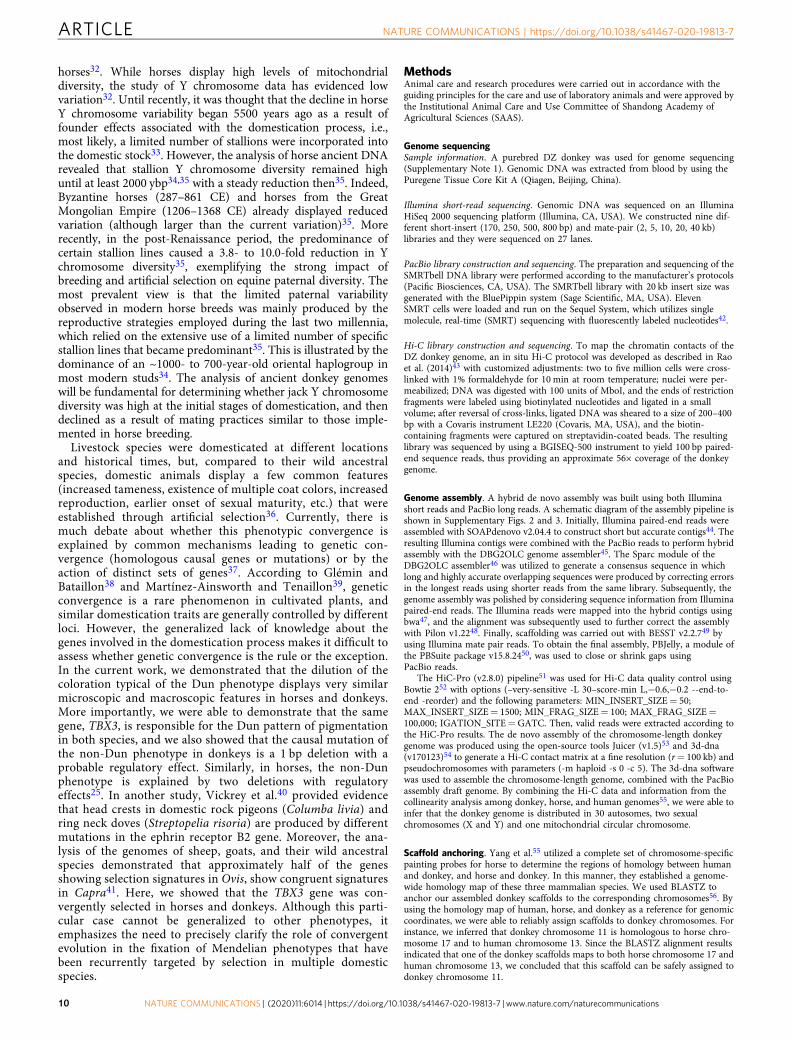
MethodsAnimal care and research procedures were carried out in accordance with theguiding principles for the care and use of laboratory animals and were approved bythe Institutional Animal Care and Use Committee of Shandong Academy ofAgricultural Sciences (SAAS).
Genome sequencingSample information. A purebred DZ donkey was used for genome sequencing(Supplementary Note 1). Genomic DNA was extracted from blood by using thePuregene Tissue Core Kit A (Qiagen, Beijing, China).
Illumina short-read sequencing. Genomic DNA was sequenced on an IlluminaHiSeq 2000 sequencing platform (Illumina, CA, USA). We constructed nine dif-ferent short-insert (170, 250, 500, 800 bp) and mate-pair (2, 5, 10, 20, 40 kb)libraries and they were sequenced on 27 lanes.
PacBio library construction and sequencing. The preparation and sequencing of theSMRTbell DNA library were performed according to the manufacturer’s protocols(Pacific Biosciences, CA, USA). The SMRTbell library with 20 kb insert size wasgenerated with the BluePippin system (Sage Scientific, MA, USA). ElevenSMRT cells were loaded and run on the Sequel System, which utilizes singlemolecule, real-time (SMRT) sequencing with fluorescently labeled nucleotides42.
Hi-C library construction and sequencing. To map the chromatin contacts of theDZ donkey genome, an in situ Hi-C protocol was developed as described in Raoet al. (2014)43 with customized adjustments: two to five million cells were cross-linked with 1% formaldehyde for 10 min at room temperature; nuclei were per-meabilized; DNA was digested with 100 units of MboI, and the ends of restrictionfragments were labeled using biotinylated nucleotides and ligated in a smallvolume; after reversal of cross-links, ligated DNA was sheared to a size of 200–400bp with a Covaris instrument LE220 (Covaris, MA, USA), and the biotin-containing fragments were captured on streptavidin-coated beads. The resultinglibrary was sequenced by using a BGISEQ-500 instrument to yield 100 bp paired-end sequence reads, thus providing an approximate 56× coverage of the donkeygenome.
Genome assembly. A hybrid de novo assembly was built using both Illuminashort reads and PacBio long reads. A schematic diagram of the assembly pipeline isshown in Supplementary Figs. 2 and 3. Initially, Illumina paired-end reads wereassembled with SOAPdenovo v2.04.4 to construct short but accurate contigs44. Theresulting Illumina contigs were combined with the PacBio reads to perform hybridassembly with the DBG2OLC genome assembler45. The Sparc module of theDBG2OLC assembler46 was utilized to generate a consensus sequence in whichlong and highly accurate overlapping sequences were produced by correcting errorsin the longest reads using shorter reads from the same library. Subsequently, thegenome assembly was polished by considering sequence information from Illuminapaired-end reads. The Illumina reads were mapped into the hybrid contigs usingbwa47, and the alignment was subsequently used to further correct the assemblywith Pilon v1.2248. Finally, scaffolding was carried out with BESST v2.2.749 byusing Illumina mate pair reads. To obtain the final assembly, PBJelly, a module ofthe PBSuite package v15.8.2450, was used to close or shrink gaps usingPacBio reads.
The HiC-Pro (v2.8.0) pipeline51 was used for Hi-C data quality control usingBowtie 252 with options (–very-sensitive -L 30–score-min L,−0.6,−0.2 --end-to-end -reorder) and the following parameters: MIN_INSERT_SIZE= 50;MAX_INSERT_SIZE= 1500; MIN_FRAG_SIZE= 100; MAX_FRAG_SIZE=100,000; IGATION_SITE=GATC. Then, valid reads were extracted according tothe HiC-Pro results. The de novo assembly of the chromosome-length donkeygenome was produced using the open-source tools Juicer (v1.5)53 and 3d-dna(v170123)54 to generate a Hi-C contact matrix at a fine resolution (r= 100 kb) andpseudochromosomes with parameters (-m haploid -s 0 -c 5). The 3d-dna softwarewas used to assemble the chromosome-length genome, combined with the PacBioassembly draft genome. By combining the Hi-C data and information from thecollinearity analysis among donkey, horse, and human genomes55, we were able toinfer that the donkey genome is distributed in 30 autosomes, two sexualchromosomes (X and Y) and one mitochondrial circular chromosome.
Scaffold anchoring. Yang et al.55 utilized a complete set of chromosome-specificpainting probes for horse to determine the regions of homology between humanand donkey, and horse and donkey. In this manner, they established a genome-wide homology map of these three mammalian species. We used BLASTZ toanchor our assembled donkey scaffolds to the corresponding chromosomes56. Byusing the homology map of human, horse, and donkey as a reference for genomiccoordinates, we were able to reliably assign scaffolds to donkey chromosomes. Forinstance, we inferred that donkey chromosome 11 is homologous to horse chro-mosome 17 and to human chromosome 13. Since the BLASTZ alignment resultsindicated that one of the donkey scaffolds maps to both horse chromosome 17 andhuman chromosome 13, we concluded that this scaffold can be safely assigned todonkey chromosome 11.
ARTICLE NATURE COMMUNICATIONS | https://doi.org/10.1038/s41467-020-19813-7
10 NATURE COMMUNICATIONS | (2020) 11:6014 | https://doi.org/10.1038/s41467-020-19813-7 | www.nature.com/naturecommunications

Sex chromosome determination and assessment. The X chromosome assemblywas built by considering collinearity mapping with horse X scaffolds. Toassemble the donkey Y chromosome, we mapped 20 public donkey Y chromo-some markers to our scaffolds22. We used our resequenced mapping data todetermine the average sequencing depth of sex chromosomes. The sequencingdepth of autosomes was defined as “normal”. If the average sequencing depth ofsex chromosomes was approximately half of the average sequencing depth ofautosomes, the sequencing depth was defined as “half”. If the average sequencingdepth of sex chromosomes was nearly zero, the sequencing depth was defined as“zero”. For all 126 domestic donkeys, the average sequencing depths of X infemale individuals were “normal” and in male accessions were “half”; mean-while, the average sequencing depths of the Y chromosome in female accessionswere “zero” and in male accessions were “half”. These results confirmed the highquality of our sex chromosome assembly. The nonrecombining region of the Ychromosome (NRY) was identified according to two criteria: (i) it cannot befound in female genomes (depth= 0) and (ii) its sequencing depth must be halffor at least 80% of the jacks.
Assessment of the genome assembly. To assess the completeness of our genomeassembly, ~145.76 Gbp of Illumina reads generated from short-insert libraries (250,500, 800 bp) were mapped to the donkey genome assembly by using BWA softwarewith default parameters47. Subsequently, we used BamDeal-0.19 (https://github.com/BGI-shenzhen/BamDeal) to calculate sequencing depth. To check the completeness ofcoding regions, all transcriptome sequences from 13 tissues (brain, heart, kidney, liver,lung, muscle, skin, spleen, stomach, blood, cecum, epididymis, and testis) wereassembled into unigenes with Trinity57. Next, unigenes were mapped to the assem-bled genome sequence with BLAT, and the coverage rate was duly assessed.
Genome annotationRepeat annotation. To identify repeat sequences in the donkey genome, we searchedfor both tandem repeats and transposable elements (TEs). Tandem repeats weredetected using Tandem Repeats Finder 4.04 software58 with the following settings:Match= 2, Mismatching penalty= 7, Delta= 7, PM= 80, PI= 10, Minscore= 50,MaxPeriod= 2000. TEs were identified using a combination of homology-based andde novo approaches. The homology-based approach used standard databases forknown repetitive sequences (e.g., RepBase17.01) and predicted TEs at both the DNAand protein levels59. At the DNA level, RepeatMasker (v4.0.4) was applied by con-sidering data from the Repbase library (http://www.repeatmasker.org/), while at theprotein level we used RepeatProteinMask by considering information from theRepbase library. For de novo prediction of TEs, RepeatModeler 1.05 software (www.repeatmasker.org/RepeatModeler) was employed. In the RepeatModeler analysis, weused two de novo repeat-finding programs, i.e., RECON (1.08)60 and REPEATSC-OUT (v1.0.6)61, which employ complementary computational methods for identify-ing repeat element boundaries and family relationships from sequences. The resultsobtained with RepeatModeler were merged into a library, which was used byRepeatMasker to find homologous repeats in the donkey genome and to categorizethem. In addition, we used LTR_finder62 to identify long terminal repeat (LTR)sequences in the donkey genome.
Gene annotation. To predict mRNA-encoding genes in the donkey genome, weperformed both de novo and homology-based predictions. For the homology-based predictions, we used protein data from five species (Homo sapiens, BosTaurus, E. caballus, Sus scrofa, and Mus musculus) that were retrieved from theEnsembl (release 64) database and mapped to the donkey genome withTBLASTN (version 2.2.26)63 by considering an E-value of 1e−5 as the thresholdof significance. Subsequently, we selected the most homologous protein for eachgenomic locus showing multiple matches. To make de novo predictions, we usedAUGUSTUS (version 2.5.5)64 and GENSCAN (version 1.0)65. The gene modelparameters for AUGUSTUS were trained using homologous horse proteinsequences, while the parameters for GENSCAN were derived from humanstudies. Genes with coding lengths smaller than 150 bp were filtered out toreduce false positives. GLEAN software (http://sourceforge.net/projects/glean-gene/) was employed to integrate evidence from the AUGUSTUS and GEN-SCAN predictions to generate a consensus gene set. To aid gene prediction,samples from 13 tissues (brain, heart, kidney, liver, lung, muscle, skin, spleen,stomach, blood, cecum, epididymis, and testis) retrieved from three donkeyswere used to construct a normalized cDNA library. Transcriptome sequencingwas performed with on the HiSeq 2000 platform. Transcriptome reads weremapped onto the genome to refine gene structures and in combination withGLEAN to yield the final protein-encoding gene set.
Gene function annotation. Gene functions were assigned according to the bestmatch of the BLASTP alignment to the SwissProt and Translated EMBL NucleotideSequence Data Library (TrEMBL) databases (UniProt release 2011-01)66. Motifsand domains in the protein-coding genes were determined with InterProScan(v55.0)67, which searches several protein databases, including ProDom (ProDom,RRID:SCR_006969), PRINTS (PRINTS, RRID:SCR_003412), HAMAP (HAMAP,RRID:SCR_007701), Pfam (Pfam, RRID:SCR_004726), PIRSF (PIRSF, RRID:SCR_003352), PANTHER (PANTHER, RRID:SCR_004869), TIGRFAM
(TIGRFAM, RRID:SCR_005493), SMART (SMART, RRID:SCR_005026),SUPERFAMILY (SUPERFAMILY, RRID:SCR_007952), Gene3D (Gene3D, RRID:SCR_007672), PROSITE (PROSITE, RRID:SCR_003457), COILS (COILS, RRID:SCR_008440), SignalP (RRID:SCR_015644), Phobius (PHOBIUS, RRID:SCR_015643) and TMHMM (http://www.cbs.dtu.dk/services/TMHMM/). GeneOntology identifiers68 for each gene were obtained from the correspondingInterPro entry. We also mapped the reference genes to the KEGG pathway data-base69 and identified the best match for each gene.
Transcriptome sequencingAnimal material and RNA isolation. We collected 17 samples corresponding to 13distinct tissues (Supplementary Fig. 5) from three donkeys to perform RNA-seq(Supplementary Table 16). Samples were trimmed and cut into small pieces,cleaned with RNase-free and DNase-free water and immediately frozen in liquidnitrogen for storage until RNA isolation. Total RNA from each tissue sample wasextracted by using TRIzol reagent (Thermo Fisher Scientific, CA, USA) accordingto the manufacturer’s instructions. The quality of RNA samples was evaluated withan Agilent 2100 Bioanalyzer (Agilent Technologies, CA, USA). RNA samples witha minimum RIN > 7.0 and a 28S/18S ratio > 1.0 were selected for sequencing.
Construction and sequencing of cDNA libraries. First, 200 ng of total RNA werepurified by using oligo-dT beads, and then, poly(A)-containing mRNA was frag-mented into small pieces with Fragmentation Buffer (Ambion, Thermo Fisher Sci-entific, CA, USA). First-strand cDNA was generated by employing First StrandMaster Mix and Super Script II reverse transcriptase (Thermo Fisher Scientific). Thereaction conditions were as follows: 25 °C for 10min; 42 °C for 50min; and 70 °C for15min. Then, Second Strand Master Mix (Thermo Fisher Scientific) was added tosynthesize the second-strand cDNA (16 °C for 1 h). The purified fragmented cDNAwas combined with End Repair Mix (Thermo Fisher Scientific) and incubated at30 °C for 30min. The end-repaired DNA was purified with AMPure XP Beads(Beckman Coulter, CA, USA). Then, A-Tailing Mix (ThermoFisher Scientific) wasadded and incubated at 37 °C for 30min. Subsequently, poly(A)-containing mRNAwas fragmented into small pieces with fragmentation buffer (Thermo Fisher Scien-tific). The 3′-adenylated DNA, RNA Index Adapter and Ligation Mix (Thermo FisherScientific) were mixed and incubated at 30 °C for 10min. The end-repaired DNA waspurified with AMPure XP Beads (Beckman Coulter). Several rounds of PCR ampli-fication with PCR Primer Cocktail and PCR Master Mix (Thermo Fisher Scientific)were performed to enrich the cDNA fragments. Then, the PCR products were pur-ified with AMPure XP Beads (Beckman Coulter, USA). The resulting library wasquantitated in two ways: the average molecule length was determined using an Agilent2100 Bioanalyzer (Agilent Technologies, CA, USA), and the library was quantified byreal-time quantitative PCR (TaqMan Probe). Quantified libraries that passed thequality control were first amplified within the flow cell on the cBot instrument forcluster generation (HiSeq 4000 PE Cluster Kit, Illumina). Subsequently, the clusteredflow cell was loaded onto the HiSeq 4000 Sequencer for paired-end sequencing(HiSeq® 4000 SBS Kit, Illumina) with a recommended read length of 100 bp.
Gene expression. Transcript reads were mapped to the reference genome withBowtie (version 2.2.5)70. Gene expression levels were calculated with RSEM(v1.2.12)71.
Resequencing and identification of polymorphismsCollection of samples. We collected blood samples from 83 domestic donkeys and twoAsian wild asses encompassing four continents (Africa, Europe, Oceania, and Asia)(Supplementary Table 19). In addition, we obtained resequencing data for three Asianwild asses (accession numbers: SRR1562345, ERR650932–ERR650969, andERR654542–ERR654612), one Somali wild ass (accession numbers:ERR650540–ERR650547, and ERR650570–ERR650703) and one domestic donkey(accession number: SRA082086) reported in previous studies10,13,14 and for 42domestic donkeys and one kiang donkey accessible from the National Genomics DataCenter (https://bigd.big.ac.cn/bioproject/browse/PRJCA001131). In total, genomesequences from 133 individuals were available to carry out population genomicsanalyses.
Sequencing, mapping, and variant calling. Genomic DNA was extracted from freshblood and sequenced on the HiSeq 4000 platform. We cleaned the Illumina NGSraw data to remove adaptors, trim low-quality bases and remove “N” sites withTrimmomatic (V0.36)72. Subsequently, clean reads were mapped to our donkeygenome using BWA (version: 0.7.10-r789)47. High-quality mapped reads (mapped,nonduplicated reads with mapping quality ≥ 20) were selected with SAMTools(version 1.3.1) and the following commands: “-view -F 4 -q 20” and “rmdup”73. Forall 133 samples, mapping statistics based on high-quality mapped reads of eachaccession included (I) the coverage depth of each chromosomal position (SAM-Tools command “-depth”) and (II) the proportion of the donkey genome coveredby different read depths. For autosomal and X chromosomes, the region covered byat least two reads in ≥80% of all donkey accessions was defined as the “effectivelycovered region” of the donkey genome.
Only high-quality mapped reads were used for variant calling with GATK(version: 3.3-0-g37228af)74. BAM files were sorted and marked as PCR
NATURE COMMUNICATIONS | https://doi.org/10.1038/s41467-020-19813-7 ARTICLE
NATURE COMMUNICATIONS | (2020) 11:6014 | https://doi.org/10.1038/s41467-020-19813-7 | www.nature.com/naturecommunications 11

duplications with Picard (version: 1.117, http://broadinstitute.github.io/picard/).There is no well-annotated SNP and short-indel database for donkeys, so it was notfeasible to use the “Base Quality Score Recalibrator” (BQSR) and “IndelRealigner”options of GATK. To carry out variant calling, we used the command“HaplotypeCaller”, which calls SNPs and indels simultaneously via local de novoassembly of haplotypes in an active region. Applying the “hard filtering” method,we obtained an initial set of high-confidence SNPs and indels. The parameters of“hard filtering” were set by default, i.e., for SNPs we used QD < 2.0, FS > 60.0, MQ< 40.0, and MQRankSum <−12.5, while for short indels, we considered QD < 2.0,FS > 200.0, and ReadPosRankSum <−20.0. Subsequently, the original BAM fileswere analyzed with the BQSR and Indel Realigner options of GATK by using theset of high-confidence SNPs and indels. This dataset included 133 accessions (sixAsian wild asses, one Somali wild ass, and 126 domestic donkeys) and it wasconsidered the raw confidence variant set.
To obtain high-quality variant sets, the raw confidence variants were filteredbased on well-established criteria. For autosomal and X chromosomes, (i) onlyvariants present within the “effective covered region” were kept; (ii) only biallelicvariants were taken into consideration; (iii) genotype calls were deemed successfulif the read depth was ≥2 and ≤80 (otherwise they were classified as missing); (iv)positions with more than 80% heterozygous calls or more than 20% missinggenotype calls were discarded; and (v) both alleles of each variant were required tobe present in the homozygous state in at least one individual. In contrast, the NRYvariants of 68 male accessions were filtered according to the following criteria: (i)only variants in NRY were kept; (ii) only biallelic variants were considered; (iii)genotype calls were considered successful if the read depth was ≥2 and ≤50(otherwise they were classified as missing); (iv) all of the genotype calls needed tobe homozygous; and (v) positions with more than 20% missing genotype calls werediscarded. After these filtering steps, the remaining variants segregated in our dataset were considered high-confidence variants. The polymorphic variants of 126domestic donkey accessions were directly extracted from the high-confidence dataset. To assess SNP quality, 10 primers were designed with Primer-BLAST (https://www.ncbi.nlm.nih.gov/tools/primer-blast/index.cgi?LINK_LOC= BlastHome).Seven accessions were used for Sanger sequencing. The annotation of these variantsusing our donkey gene set as a reference was carried out with an in-house Perlscript and ReSeqTools (https://github.com/BGI-shenzhen/Reseqtools).
Population structure analysisAutosomes. Pairwise clustering based on identity by state (IBS) was calculated withPlink (version 1.90)75 by using high-quality SNP data from 133 samples. Based onthe pairwise IBS genetic distance matrix, we constructed the neighbor-joiningphylogenetic tree with Fneighbor (http://bioinfo.nhri.org.tw/cgi-bin/emboss/fneighbor). The tree was rooted on Asian wild asses and visualized with iTOL(http://itol.embl.de/)76. The PCA of 133 samples was performed with GCTA(v1.92.4)77. Ancestry and population structure were analyzed with ADMIXTURE(v1.23)16. An LD pruning step was performed with Plink (v1.90)75 with the fol-lowing parameters: “--indep-pairwise 50 10 0.1”. Fifteen replicate runs, from K= 1to K= 10, were performed with a random seed (1–999,999,999). The cross-validation errors of 20 replicate runs were plotted with the Gnuplot “boxplot”(version 5.2, http://www.gnuplot.info/). The 20 replicate ADMIXTURE runs werecombined with CLUMPP (v1.1.2)78 and plotted with Distruct (v1.1)79.
Sex chromosomes. SNPs located in the NRY portion of the Y chromosome wereused. Male samples with more than 20% missing genotype calls were removed. Theneighbor-joining phylogenetic tree was constructed with MEGA (version 6.06)80,rooted on Asian wild asses and visualized with iTOL (http://itol.embl.de/).
Comparing the genetic diversity of the autosomal and sex chromosomes. The single-site nucleotide diversity (π)81 was calculated for autosomal and X chromosomes(only females were taken into consideration) with VCFtools (v0.1.13)82. In con-trast, for NRY, we used an in-house Perl script. For each chromosome, the sum ofthe per-site π divided by the value of the “effective covered region” yielded theaverage chromosomal π (per-bp π). The π calculation was based on the SNPs of126 domestic donkeys.
Analysis of the genetic diversity within each genetic group. Based on the populationstructure data (phylogenetic tree, PCA, and Admixture), all 126 domestic donkeyswere divided into three groups: Tropical African donkeys, North African & Eur-asian donkeys, and Australian donkeys. We took into consideration that theAustralian sample was smaller than those representing the other two groups and,moreover, that it had a recent European origin, so the Australian group was notused in the diversity analysis. The π values of Tropical Africa and North Africa &Eurasia groups were inferred with the method explained previously. Watterson’sestimator (θw) was calculated as defined in ref. 83. The magnitude of the LD wasestimated with PopLDdecay software (v3.40)84.
Calculation of the D-statistic. To study the genetic relationship between SOM anddomestic donkeys, we computed D-statistics85. First, we selected non-admixedsamples (Admixture analysis) from Kenya (which is close to the geographic dis-tribution of SOM), Iran, and Australia. The D-statistic calculation was performed
with ADMIXtools (v5.1)86. The SNP matrix was converted to EIGENSOFT formatby using the fcGENE and CONVERTF bioinformatic tools86. The D-statistics werecalculated in the form of (((Population 1, Population 2), African wild ass), Asianwild ass) where Population 1 (P1) and Population 2 (P2) were represented bydonkeys from African or Eurasian countries.
Demographic history of donkeys and asses. The demographic history of theAsian wild asses, Somali wild ass, and domestic donkeys was inferred by using thePSMC model19. In the case of domestic donkeys, one sample per country (thosewith the maximum coverage fold) was selected for PSMC analysis. The parameterswere set as follows: -N30 -t15 -r5 -p “4+ 25*2+ 4+ 6”. The generation time wasset to 8 years, and the neutral mutation rate μ was set to 7.242 × 10⁻⁹ mutationsper generation and site in accordance with previous reports11,87. Bootstrapping wasperformed 100 times for each sample (Supplementary Data 1).
The sequential Markov coalescent implemented in SMC++ software (V1.13)20
was used to estimate the demographic history of donkeys belonging to the TropicalAfrica and North Africa & Eurasia groups. For each group, 10 random sampleswere selected and 10 replicated runs were performed. The non-WGS effectivecovered regions were masked by using the parameter “vcf2smc -m”. A mutationrate of 7.242 × 10⁻⁹ per site per generation, and a constant generation time of 8years were assumed11,87 to convert coalescence generations into a time-scale.
Phylogenetic tree of the Y chromosome. We transformed the genotypes of the Ychromosome to NEXUS format to perform phylogenetic tree inference withBEAST 2 (v2.5.2)88. BEAST 2 software was run with default parameters and theYule Process89 as tree prior.
Potential admixture events in ancestral species of donkeys and asses. Toestimate the admixture event time in the donkey population, we performed aPSMC analysis19 and captured the hump structure in the estimated population size,which indicates when the admixture event took place. We verified the method with70 experiments of simulated data generated with ms software90. For each experi-ment, we assumed an 8-year generation time. The ancestral population split intotwo populations with equal sizes at 200 kya. The two resulting populations mergedinto a single population at an admixture time ranging from 5 to 100 kya. Theparameters for ms command lines, real admixture time and estimated admixturetime are shown in Supplementary Table 23.
Selection scan for coat color. Photos and records91 were used to determine the coatcolor of 44 donkeys, which were divided into two groups, i.e., Dun (23 gray donkeys)and non-Dun (21 black donkeys). The selection analysis involved these two groups andincluded the calculation of three statistics: (i) cross population XP-EHH92; (ii) FST93;(iii) RODDun_non-Dun (1 − πnon-Dun/πDun). The windows were set to 20 kb with a 10 kbstep. The FST, Tajima’s D94, and π were calculated using VCFtools82. In contrast,RODDun_non-Dun was computed using an in-house Perl script, and the XP-EHH metricwas estimated with selscan95. The empirical thresholds of selective signal values for XP-EHH, FST, and ROD were empirically set as 2.5, 0.3, and 0.8, respectively. The overlapof the data sets generated with the three methods indicated that the strongest signalwas located on chromosome 8 (~42.6Mb). Other signals above the thresholds indi-cated previously were considered as secondary candidate regions. In the two comparedgroups (Dun vs. non-Dun), we calculated π and Tajima’s D in the major selectivesweep mapping to chromosome 8 (~ 42.6Mb). The SNPs and the indels mapping tothis region were compared between Dun and non-Dun donkeys, and we found onlyone indel CT/C− located at chr8:42,742,556 (CT was the genotype of the referencegenome), which segregated perfectly with the non-Dun phenotype. The SNPs aroundthe indel were phased with SHAPEIT (v2.r790)96 to investigate haplotype structure inDun and non-Dun donkeys. Median-joining haplotype networks based on the phasedSNPs (only SNPs with MAF ≥ 0.1 were considered) from the 5′ end of the TBX3 gene(chr8:42,723,946) to the 20,000 bp downstream (chr8:42,743,946) were built withPopART (v1.7)97. The genomic segments located 1000 bp upstream and downstreamof the CT/C− indel position (chr8:42,742,556) were mapped to the human genomewith BLAST (https://blast.ncbi.nlm.nih.gov/Blast.cgi). Enhancers located within thisregion were identified with GeneCards (http://www.genecards.org).
Histological characterization of the Dun phenotype in donkeys and elucidationof the molecular basisSample collection. We selected three healthy non-Dun donkeys that were~18 months old (Supplementary Fig. 18) from the Black Donkey Research Insti-tute, Shandong Province. We also selected three healthy Dun donkeys, which werealso ~18 months old, from a farm located in the Inner Mongolia AutonomousRegion. We collected 5 ml of blood from each of the six donkeys via venipunctureinto tubes with anticoagulant, and samples were stored at 4 °C until DNAextraction. We collected croup skin samples from these six donkeys with a mini-mally invasive procedure (Supplementary Fig. 18), and each sample was dividedinto two parts: one part was stored in liquid nitrogen for RNA extraction, and theother part was fixed in 4% paraformaldehyde for histological sectioning. We alsocollected skin samples from the dorsal strip line of Dun donkeys and the corre-sponding anatomical region of non-Dun donkeys.
ARTICLE NATURE COMMUNICATIONS | https://doi.org/10.1038/s41467-020-19813-7
12 NATURE COMMUNICATIONS | (2020) 11:6014 | https://doi.org/10.1038/s41467-020-19813-7 | www.nature.com/naturecommunications
Genotyping of the 1 bp deletion in the six donkeys. DNA was extracted from bloodsamples with the RelaxGene Blood DNA System (TIANGEN, Beijing, China). The1 bp deletion was genotyped by Sanger sequencing on an ABI 3730xl DNA Ana-lyzer (Applied Biosystems, USA) according to the manufacturer’s instructions. Theprimer sequences used were as follows: forward primer 5′-TTAGGGTCCAGCTCTCTCCA-3′ and reverse primer 5′-AAAGATGCACCCTGCCCATA-3′.
Transcriptome sequencing of the six croup skin samples. RNA extraction and tran-scriptome sequencing were performed according to the approach described in the partof Transcriptome sequencing. Differentially expressed genes between Dun and non-Dun donkeys were identified with the DESeq2 package (v1.28.1) from Bioconductor98.Genes were identified as differentially expressed if their expression level differed bytwo-fold. Gene expression is represented in fragments per kilobase million (FPKM).
RT-qPCR for the TBX3 gene. One microgram of RNA from each of the six croupskin samples was used to synthesize first-strand cDNA with the Transcript First-Strand cDNA Synthesis SuperMix Kit (TransGen, Beijing, China). QuantitativeRT-PCR was performed in a Roche LightCycler 480 II Real-Time PCR DetectionSystem (Roche, Swiss) device by using the Takara SYBR Premix Ex Taq II Kit(TAKARA, Dalian, China). The β-actin locus was used as the reference gene, andrelative expression was calculated with the 2−ΔΔCT method99. The primersequences used for qRT-PCR analysis of TBX3 expression were as follows: forwardprimer 5′-GAGGCCAAAGAACTTTGGGAT-3′ and reverse primer 5′-GGCATTTCAGGATCTGCCTTA-3′.
Histology and immunofluorescence. Croup skin samples stored in 4% paraf-ormaldehyde were washed in phosphate buffered saline (PBS), dehydrated with agradient of alcohol solutions (50%→ 70%→ 80%→ 95%→ 100%→ 100%),cleared with xylene and infiltrated with paraffin wax. Samples were embedded inparaffin and sectioned into 4-micrometer-thick tissue sections. We also collectedhair from the croup skin samples of Dun and non-Dun donkeys and madetransverse sections of the samples. Both the hair and croup skin sections werestained with hematoxylin and eosin (H&E). Immunohistochemistry andimmunofluorescence were carried out with a rabbit antibody against TBX3(Bioss, China, bs-10266R), diluted at 1:200, by following a protocol involving theremoval of wax from sections, antigen retrieval with Tris–EDTA (pH 8.0) in amicrowave oven, and quenching autofluorescence. Sections were incubated with4′,6-diamidino-2-phenylindole (DAPI) to stain the nucleus and were imagedwith a fluorescence microscope.
Reporting summary. Further information on research design is available in the NatureResearch Reporting Summary linked to this article.
Data availabilityData from whole-genome sequencing, resequencing and transcriptome sequencing havebeen deposited in the GenBank database under BioProject accession PRJNA431818.Sanger sequences of the Dun, non-dun1, and non-dun2 alleles from horse can be accessedwith accessions KT896508, KT896509 and KT896510, respectively. In addition, weobtained resequencing data for 3 Asian wild asses (accession numbers: SRR1562345,ERR650932-ERR654612, ERR669419-ERR669469), one Somali wild ass (accessionnumbers: ERR650540-ERR650547, and ERR650570-ERR650703), one domestic donkey(accession number: SRR873443-SRR873445), and for 42 domestic donkeys and one kiangdonkey accessible from the National Genomics Data Center (https://bigd.big.ac.cn/bioproject/browse/PRJCA001131). All relevant data are available from theauthors. Source data are provided with this paper.
Code availabilityCustom Perl scripts were deposited into Github (https://github.com/JINPENG-WANG/scripts-for-donkey-genomes-sequencing).
Received: 25 June 2019; Accepted: 29 October 2020;
References1. Beja-Pereira, A. et al. African origins of the domestic donkey. Science 304,
1781 (2004).2. Rossel, S. et al. Domestication of the donkey: timing, processes, and indicators.
Proc. Natl Acad. Sci. USA 105, 3715–3720 (2008).3. Bökönyi, S. Studi di paletnologia in onore do Salvatore M. Puglisi (Università
di Roma ‘La Sapienza’, Rome, 1985).4. Boesneck, J., von den Driesch, A. & Ziegler, R. Maadi III (von Zabern, Mainz,
1989).5. Boesneck, J., & von den Driesch, A. El Omari (von Zabern, Mainz, 1990).6. Marshall, F. Rethinking Agriculture; Archaeological and Ethnoarchaeological
Perspectives (Left Coast Press, Walnut Creek, 2007).
7. Cattani, M., & Bökönyi, S. Essays of the Late Prehistory of the ArabianPeninsula (Istituto Italiano per l’Africa e l’Oriente, Rome, 2002).
8. Rosenbom, S. et al. Genetic diversity of donkey populations from the putativecenters of domestication. Anim. Genet. 46, 30–36 (2014).
9. Blench R. Donkeys, People and Development. A Resource Book of the AnimalTraction Network for Eastern and Southern Africa (ATNESA) (TechnicalCentre for Agricultural and Rural Cooperation, Wageningen, 2004),
10. Huang, J. et al. Donkey genome and insight into the imprinting of fastkaryotype evolution. Sci. Rep. 5, 14106 (2015).
11. Renaud, G. et al. Improved de novo genomic assembly for the domesticdonkey. Sci. Adv. 4, eaaq0392 (2018).
12. Wade, C. M. et al. Genome sequence, comparative analysis, and populationgenetics of the domestic horse. Science 326, 865–867 (2009).
13. Jónsson, H. et al. Speciation with gene flow in equids despite extensivechromosomal plasticity. Proc. Natl Acad. Sci. USA 11, 18655–18660 (2014).
14. Orlando, L. et al. Recalibrating Equus evolution using the genome sequence ofan early Middle Pleistocene horse. Nature 499, 74–78 (2013).
15. Bough, J. From value to vermin: a history of the donkey in Australia. Aust.Zool. 33, 388–397 (2006).
16. Alexander, D. H., Novembre, J. & Lange, K. Fast model-based estimation ofancestry in unrelated individuals. Genome Res. 19, 1655–1664 (2009).
17. Soraggi, S., Wiuf, C. & Albrechtsen, A. Powerful inference with the D-statisticon low-coverage whole-genome data. G3 (Bethesda) 8, 551–566 (2018).
18. Pickrell, J. K. & Pritchard, J. K. Inference of population splits and mixturesfrom genome-wide allele frequency data. PLoS Genet. 8, e1002967 (2012).
19. Li, H. & Durbin, R. Inference of human population history from individualwhole-genome sequences. Nature 475, 493–496 (2011).
20. Terhorst, J., Kamm, J. A. & Song, Y. S. Robust and scalable inference ofpopulation history from hundreds of unphased whole genomes. Nat. Genet.49, 303–309 (2017).
21. Handley, L. J., Berset-Brändli, L. & Perrin, N. Disentangling reasons for low Ychromosome variation in the greater white-toothed shrew (Crocidura russula).Genetics 173, 935–942 (2006).
22. Lindgren, G. et al. Limited number of patrilines in horse domestication. Nat.Genet. 36, 335–336 (2004).
23. Sponenberg, D. P. Equine Color Genetics (Wiley-Blackwell, Ames, 2009).24. Groves, C. P. Equids in the Ancient World (Dr. Ludwig Reichert Verlag,
Wiesbaden, 1986).25. Imsland, F. et al. Regulatory mutations in TBX3 disrupt asymmetric hair
pigmentation that underlies Dun camouflage color in horses. Nat. Genet. 48,152–158 (2016).
26. Ma, L. et al. ‘Cyclic alopecia’ in Msx2 mutants: defects in hair cycling and hairshaft differentiation. Development 130, 379–389 (2003).
27. Kayserili, H. et al. ALX4 dysfunction disrupts craniofacial and epidermaldevelopment. Hum. Mol. Genet. 18, 4357–4366 (2009).
28. Satokata, I. et al. Msx2 deficiency in mice causes pleiotropic defects in bonegrowth and ectodermal organ formation. Nat. Genet. 24, 391–395 (2000).
29. Thomas-Chollier, M. et al. Transcription factor binding predictions usingTRAP for the analysis of ChIP-seq data and regulatory SNPs. Nat. Protoc. 6,1860–1869 (2011).
30. Plasari, G. et al. Nuclear factor I-C regulates TGF-β-dependent hair folliclecycling. J. Biol. Chem. 285, 34115–14125 (2010).
31. Kimura, B. et al. Ancient DNA from Nubian and Somali wild ass provides insightsinto donkey ancestry and domestication. Proc. R. Soc. B 278, 50–57 (2010).
32. Janečka, J. E. et al. Horse Y chromosome assembly displays uniqueevolutionary features and putative stallion fertility genes. Nat. Commun. 9,2945 (2018).
33. Wallner, B. et al. Y chromosome uncovers the recent oriental origin ofmodern stallions. Curr. Biol. 27, 2029–2035.e5 (2017).
34. Wutke, S. et al. Decline of genetic diversity in ancient domestic stallions inEurope. Sci. Adv. 4, eaap9691 (2018).
35. Fages, A. et al. Tracking five millennia of horse management with extensiveancient genome time series. Cell 177, 1419–1435 (2019).
36. Wright, D. The genetic architecture of domestication in animals. Bioinform.Biol. Insights 9, 11–20 (2015).
37. Pickersgill, B. Parallel vs. convergent evolution in domestication anddiversification of crops in the Americas. Front. Ecol. Environ. 6, 56 (2018).
38. Glémin, S. & Bataillon, T. A comparative view of the evolution of grassesunder domestication. New Phytol. 183, 273–290 (2009).
39. Martínez-Ainsworth, N. E. & Tenaillon, M. I. Superheroes and mastermindsof plant domestication. C. R. Biol. 339, 268–273 (2016).
40. Vickrey, A. I., Domyan, E. T., Horvath, M. P. & Shapiro, M. D. Convergentevolution of head crests in two domesticated columbids is associated withdifferent missense mutations in EphB2. Mol. Biol. Evol. 32, 2657–2664 (2015).
41. Alberto, F. J. et al. Convergent genomic signatures of domestication in sheepand goats. Nat. Commun. 9, 813 (2018).
42. Eid, J. et al. Real-time DNA sequencing from single polymerase molecules.Science 323, 133–138 (2009).
NATURE COMMUNICATIONS | https://doi.org/10.1038/s41467-020-19813-7 ARTICLE
NATURE COMMUNICATIONS | (2020) 11:6014 | https://doi.org/10.1038/s41467-020-19813-7 | www.nature.com/naturecommunications 13

43. Rao, S. S. et al. A 3D map of the human genome at kilobase resolution revealsprinciples of chromatin looping. Cell 159, 1665–1680 (2014).
44. Li, R. et al. De novo assembly of human genomes with massively parallel shortread sequencing. Genome Res. 20, 265–272 (2010).
45. Ye, C., Hill, C. M., Wu, S., Ruan, J. & Ma, Z. S. DBG2OLC: efficient assemblyof large genomes using long erroneous reads of the third generationsequencing technologies. Sci. Rep. 6, 31900 (2016).
46. Ye, C. & Ma, Z. S. Sparc: a sparsity-based consensus algorithm for longerroneous sequencing reads. PeerJ 4, e2016 (2016).
47. Li, H. & Durbin, R. Fast and accurate short read alignment with Burrows-Wheeler transform. Bioinformatics 25, 1754–1760 (2009).
48. Walker, B. J. et al. Pilon: an integrated tool for comprehensive microbial variantdetection and genome assembly improvement. PLoS ONE 9, e112963 (2014).
49. Sahlin, K., Vezzi, F., Nystedt, B., Lundeberg, J. & Arvestad, L. BESST–efficientscaffolding of large fragmented assemblies. BMC Bioinforma. 15, 281 (2014).
50. English, A. C. et al. Mind the gap: upgrading genomes with Pacific BiosciencesRS long-read sequencing technology. PLoS ONE 7, e47768 (2012).
51. Servant, N. et al. HiC-Pro: an optimized and flexible pipeline for Hi-C dataprocessing. Genome Biol. 16, 259 (2015).
52. Langmead, B. & Salzberg, S. L. Fast gapped-read alignment with Bowtie 2. Nat.Methods 9, 357–359 (2012).
53. Durand, N. C. et al. Juicer provides a one-click system for analyzing loop-resolution Hi-C experiments. Cell Syst. 3, 95–98 (2016).
54. Dudchenko, O. De novo assembly of the Aedesaegypti genome using Hi-Cyields chromosome-length scaffolds. Science 356, 92–95 (2017).
55. Yang, F. et al. Refined genome-wide comparative map of the domestic horse,donkey and human based on cross-species chromosome painting: insight intothe occasional fertility of mules. Chromosome Res. 12, 65–76 (2004).
56. Schwartz, S. et al. Human–mouse alignments with BLASTZ. Genome Res. 13,103–107 (2003).
57. Grabherr, M. G. et al. Trinity: reconstructing a full-length transcriptomewithout a genome from RNA-Seq data. Nat. Biotechnol. 29, 644–652 (2011).
58. Benson, G. Tandem repeats finder: a program to analyze DNA sequences.Nucleic Acids Res. 27, 573–580 (1999).
59. Jurka, J. Repbase update: a database and an electronic journal of repetitiveelements. Trends Genet. 9, 418–420 (2000).
60. Bao, Z. & Eddy, S. R. Automated de novo identification of repeat sequencefamilies in sequenced genomes. Genome Res. 12, 1269–1276 (2002).
61. Price, A. L., Jones, N. C. & Pevzner, P. A. De novo identification of repeatfamilies in large genomes. Bioinformatics 21(Suppl. 1), i351–i358 (2005).
62. Xu, Z. & Wang, H. LTR_FINDER: an efficient tool for the prediction of full-length LTR retrotransposons. Nucleic Acids Res. 35, W265–W268 (2007).
63. Camacho, C. et al. BLAST+: architecture and applications. BMC Bioinforma.10, 421 (2009).
64. Stanke, M. et al. AUGUSTUS: ab initio prediction of alternative transcripts.Nucleic Acids Res. 34, W435–W439 (2006).
65. Burge, C. & Karlin, S. Prediction of complete gene structures in humangenomic DNA. J. Mol. Biol. 268, 78–94 (1997).
66. Bairoch, A. & Apweiler, R. The SWISS-PROT protein sequence database andits supplement TrEMBL in 2000. Nucleic Acids Res. 28, 45–48 (2000).
67. Mulder, N. J. et al. New developments in the InterPro database. Nucleic AcidsRes. 35, D224–D228 (2007).
68. Ashburner, M. et al. Gene ontology: tool for the unification of biology. TheGene Ontology Consortium. Nat. Genet. 25, 25–29 (2000).
69. Kanehisa, M. & Goto, S. KEGG: Kyoto encyclopedia of genes and genomes.Nucleic Acids Res. 28, 27–30 (2000).
70. Langmead, B., Trapnell, C., Pop, M. & Salzberg, S. L. Ultrafast and memory-efficient alignment of short DNA sequences to the human genome. GenomeBiol. 10, R25 (2009).
71. Li, B. & Dewey, C. N. RSEM: accurate transcript quantification from RNA-Seqdata with or without a reference genome. BMC Bioinforma. 12, 323 (2011).
72. Bolger, A. M. et al. Trimmomatic: a flexible trimmer for Illumina sequencedata. Bioinformatics 30, 2114–2120 (2014).
73. Li, H. et al. The sequence alignment/map (SAM) format and SAMtools.Bioinformatics 25, 2078–2079 (2009).
74. McKenna, A. et al. The Genome Analysis Toolkit: a MapReduce frameworkfor analyzing next-generation DNA sequencing data. Genome Res. 20,1297–1303 (2010).
75. Purcell, S. et al. PLINK: a tool set for whole-genome association andpopulation-based linkage analyses. Am. J. Hum. Genet. 81, 559–575 (2007).
76. Letunic, I. & Bork, P. Interactive tree of life (iTOL) v3: an online tool for thedisplay and annotation of phylogenetic and other trees. Nucleic Acids Res. 44,W242–W245 (2016).
77. Yang, J., Lee, S. H., Goddard, M. E. & Visscher, P. M. GCTA: a tool forgenome-wide complex trait analysis. Am. J. Hum. Genet. 88, 76–82 (2010).
78. Jakobsson, M. & Rosenberg, N. A. CLUMPP: a cluster matching andpermutation program for dealing with label switching and multimodality inanalysis of population structure. Bioinformatics 23, 1801–1806 (2007).
79. Rosenberg, N. A. DISTRUCT: a program for the graphical display ofpopulation structure. Mol. Ecol. Notes 4, 137–138 (2004).
80. Tamura, K. et al. MEGA6: molecular evolutionary genetics analysis version6.0. Mol. Biol. Evol. 30, 2725–2729 (2013).
81. Tajima, F. Evolutionary relationship of DNA sequences in finite populations.Genetics 105, 437–460 (1983).
82. Danecek, P. et al. The variant call format and VCFtools. Bioinformatics 27,2156–2158 (2011).
83. Watterson, G. A. On the number of segregating sites in genetical modelswithout recombination. Theor. Popul. Biol. 7, 256–276 (1975).
84. Zhang, C., Dong, S., Xu, J., He, W. & Yang, T. PopLDdecay: a fast and effectivetool for linkage disequilibrium decay analysis based on variant call formatfiles. Bioinformatics 35, 1786–1788 (2018).
85. Durand, E. Y., Patterson, N., Reich, D. & Slatkin, M. Testing for ancient admixturebetween closely related populations. Mol. Biol. Evol. 28, 2239–2252 (2011).
86. Patterson, N. et al. Ancient admixture in human history. Genetics 192,1065–1093 (2012).
87. Fages, A. et al. Tracking five millennia of horse management with extensiveancient genome time series. Cell 177, 1419–1435.e31 (2019).
88. Suchard, M. A. et al. Bayesian phylogenetic and phylodynamic dataintegration using BEAST 1.10. Virus Evol. 4, vey016 (2018).
89. Yule, G. U. A mathematical theory evolution, based on the conclusions of Dr.J. C. Willis, F. R. S. Philos. Trans. R. Soc. Lond. B 213, 21–87 (1925).
90. Hudson, R. R. Generating samples under a Wright–Fisher neutral model ofgenetic variation. Bioinformatics 18, 337–338 (2002).
91. Kugler, W., Grunenfelder, H. P. & Broxham, E. Donkey Breeds in Europe (SaveFoundation, St. Gallen, 2008).
92. Sabeti, P. C. et al. Genome-wide detection and characterization of positiveselection in human populations. Nature 449, 913–918 (2007).
93. Wright, S. The genetical structure of populations. Ann. Eugen. 15, 323–354 (1949).94. Tajima, F. Statistical method for testing the neutral mutation hypothesis by
DNA polymorphism. Genetics 123, 585–595 (1989).95. Szpiech, Z. A. & Hernandez, R. D. selscan: an efficient multithreaded program
to perform EHH-based scans for positive selection. Mol. Biol. Evol. 31,2824–2827 (2014).
96. Delaneau, O., Marchini, J. & Zagury, J. F. A linear complexity phasing methodfor thousands of genomes. Nat. Methods 9, 179–181 (2012).
97. Leigh, J. W. & Bryant, D. POPART: full-feature software for haplotypenetwork construction. Methods Ecol. Evol. 6, 1110–1116 (2015).
98. Love, M. I., Huber, W. & Anders, S. Moderated estimation of fold change anddispersion for RNA-seq data with DESeq2. Genome Biol. 15, 550 (2014).
99. Livak, K. J. & Schmittgen, T. D. Analysis of relative gene expression data usingreal-time quantitative PCR and the 2−ΔΔCT method.Methods 25, 402–408 (2001).
AcknowledgementsWe would like to thank the numerous donkey owners who provided the samples ana-lyzed in our study. This work was supported by the National Natural Science Foundationof China (grant nos. 31671287 and 31601007), Agricultural Science and TechnologyInnovation Project of Shandong Academy of Agricultural Sciences (grant no.CXGC2016C02), Well-bred Program of Shandong Province (grant no. 2017LZGC020),Joint Innovation Funds of Dong E. E. Jiao and Shandong Academy of AgriculturalSciences, Taishan Leading Industry Talents-Agricultural Science of Shandong Province(grant no. LJNY201713), and Shandong Province Modern Agricultural TechnologySystem Donkey Industrial Innovation Team (grant no. SDAIT-27).
Author contributionsC.W., Y.G., J.M., S.L., and J.W. were responsible for drafting this manuscript. M.A.critically revised the first and subsequent drafts of the manuscript. C.W., G.Y., andD.D.W. formulated the research goals. H.L., J.H., J.M., Z.Z., S.W., Y.Z., Q.L., X.W., Y.G.,G.Z., Y.L., J.G., S.P., G.F., Q.Y., and Y.J. were responsible for genome and resequencingdata analysis. G.Y., M.L., J.L., and S.L. managed and coordinated the research activityplanning. Q.J., C.Y., Y.W., F.T., Y.F., Q.G., R.Z., J.Y., X.Z., C.J., J.J., and A.N. collected allthe donkey samples. X.Z. and J.Z. supervised the planning and execution of researchactivities. Z.J., J.L., R.L., G.L., W.L., and W.Z. were responsible for analyzing the geneticmechanism underlying the donkey coat color phenotype. Y.S., J.W., M.H., and M.A. wereresponsible for presentation of the published work. J.W. led the experiments to study thegenetic mechanism underlying the emergence of the non-Dun coat colors of donkeys,including performing RNA-seq of croup skin samples of Dun and non-Dun donkeys,performing the immunohistochemistry and immunofluorescence assays against donkeyTBX3 protein and bioinformatics analysis of the 1 bp deletion downstream the TBX3gene. J.W. also contributed to the plotting of Figures.
Competing interestsThe authors declare no competing interests.
ARTICLE NATURE COMMUNICATIONS | https://doi.org/10.1038/s41467-020-19813-7
14 NATURE COMMUNICATIONS | (2020) 11:6014 | https://doi.org/10.1038/s41467-020-19813-7 | www.nature.com/naturecommunications

Additional informationSupplementary information is available for this paper at https://doi.org/10.1038/s41467-020-19813-7.
Correspondence and requests for materials should be addressed to D.D.W., S.L., X.Z. orJ.Z.
Peer review information Nature Communications thanks Francois Pompanon, and theother, anonymous, reviewer(s) for their contribution to the peer review of this work.
Reprints and permission information is available at http://www.nature.com/reprints
Publisher’s note Springer Nature remains neutral with regard to jurisdictional claims inpublished maps and institutional affiliations.
Open Access This article is licensed under a Creative CommonsAttribution 4.0 International License, which permits use, sharing,
adaptation, distribution and reproduction in any medium or format, as long as you giveappropriate credit to the original author(s) and the source, provide a link to the CreativeCommons license, and indicate if changes were made. The images or other third partymaterial in this article are included in the article’s Creative Commons license, unlessindicated otherwise in a credit line to the material. If material is not included in thearticle’s Creative Commons license and your intended use is not permitted by statutoryregulation or exceeds the permitted use, you will need to obtain permission directly fromthe copyright holder. To view a copy of this license, visit http://creativecommons.org/licenses/by/4.0/.
© The Author(s) 2020, corrected publication 2021
NATURE COMMUNICATIONS | https://doi.org/10.1038/s41467-020-19813-7 ARTICLE
NATURE COMMUNICATIONS | (2020) 11:6014 | https://doi.org/10.1038/s41467-020-19813-7 | www.nature.com/naturecommunications 15