Embed Size (px)
Citation preview

Do’s & Don’ts of Cash Flow/Balance Sheet Forecasting
ASA’s 23rd Advanced Business Valuation Conference
San Antonio, TX - October 7, 2004
Scott A. Nammacher, ASA, CFA
Managing DirectorEmpire Valuation Consultants, LLC
Email: [email protected]

2
Agenda
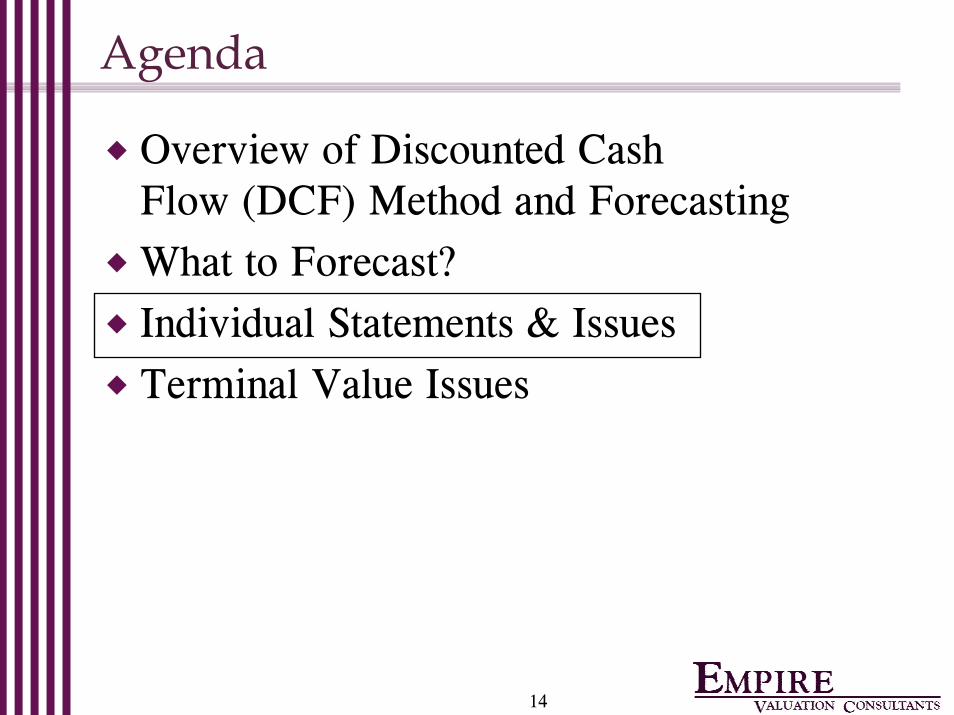
Overview of Discounted Cash Flow (DCF) Method and ForecastingWhat to Forecast?Individual Statements & IssuesTerminal Value Issues

3
Overview – When to Use DCF?
DCF Method Useful When:Business in industry amenable to forecasting
Non-commodity
When future cash flows expected to be materially different than recent past
Otherwise redundant with capitalization method
When history difficult to determine or getDivestiture of subsidiaryTurnaround situationsTransactions with changed assumptions

4
Overview - Key DCF “Components”
2005 2006 2007 2008 2009Sales 500.0 550.0 600.0 600.0 650.0Net Income 50.0 55.0 60.0 60.0 65.0
Deprec. 12.5 13.8 15.0 15.0 16.3Cap. Exp. -13.1 -14.4 -15.8 -15.8 -17.1Wkg. Cap. -2.5 -2.5 -2.5 0.0 -2.5Net Debt Pmts -3.0 0.0 -3.0 -1.5 -1.5
43.9 51.8 53.8 57.8 60.2
Terminal Value& Growth Rates
421.4 [1]
Equity Cash Flows: 43.9 51.8 53.8 57.8 481.6
Net Present Value of Equity: $325.1
Equity Rate: 20% (Year end discounting)
[1] Terminal Value Model: Gordon Growth Model: CF X (1+g) / (ER-g)
ProjectionsIncome Statement(Interest & Taxes)
Cash Flow Items driven by Balance Sheet Changes
Value & Adjustments
Discount Rate

5
Overview – DCF Projections
Current Appraisal PracticeSome use projected net income/NOPAT onlyMany make only limited adjustments to NI based on estimates for certain itemsFull projections used more often todayProbability weighted projections
Sources of ProjectionsManagement (at more sophisticated companies)Valuation expert with management input

6
Overview – Why Full Projections?
Cash Flows are Key Valuation MeasureIbbotson return data relates to cash flowsCleanest measure of economic income to investorsMost appraisers underestimate required investment in businesses over time, particularly in the “terminal value” calculationsAffords appraisers ability to explicitly examine assumptions and their impact on cash flow

7
Agenda
Overview of Discounted Cash Flow (DCF) Method and ForecastingWhat to Forecast?Individual Statements & IssuesTerminal Value Issues
8
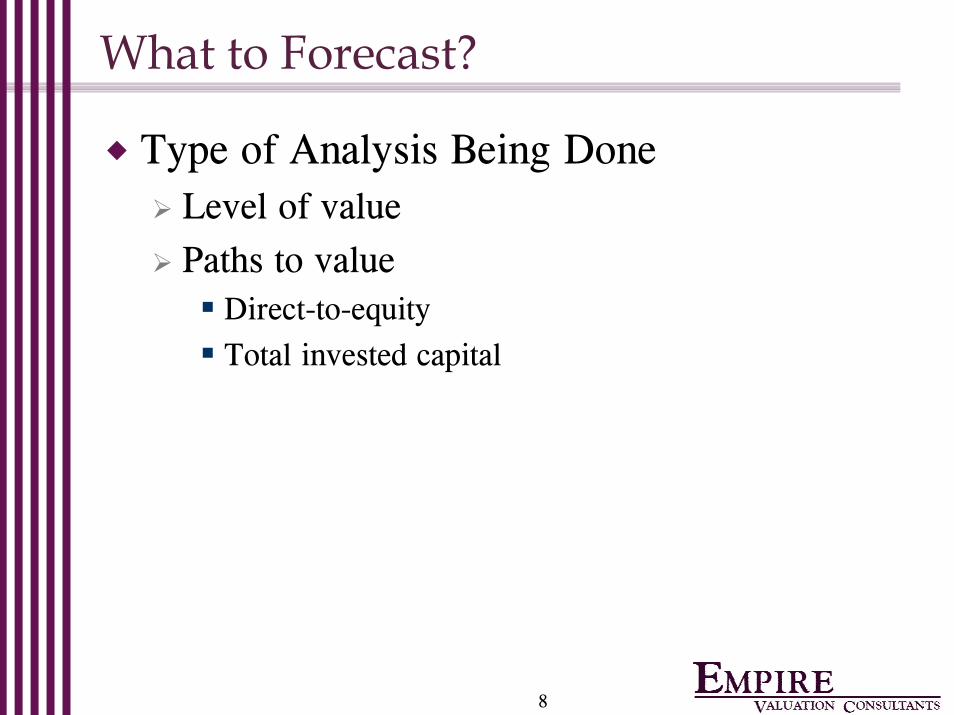
What to Forecast?
Type of Analysis Being DoneLevel of valuePaths to value
Direct-to-equityTotal invested capital
9
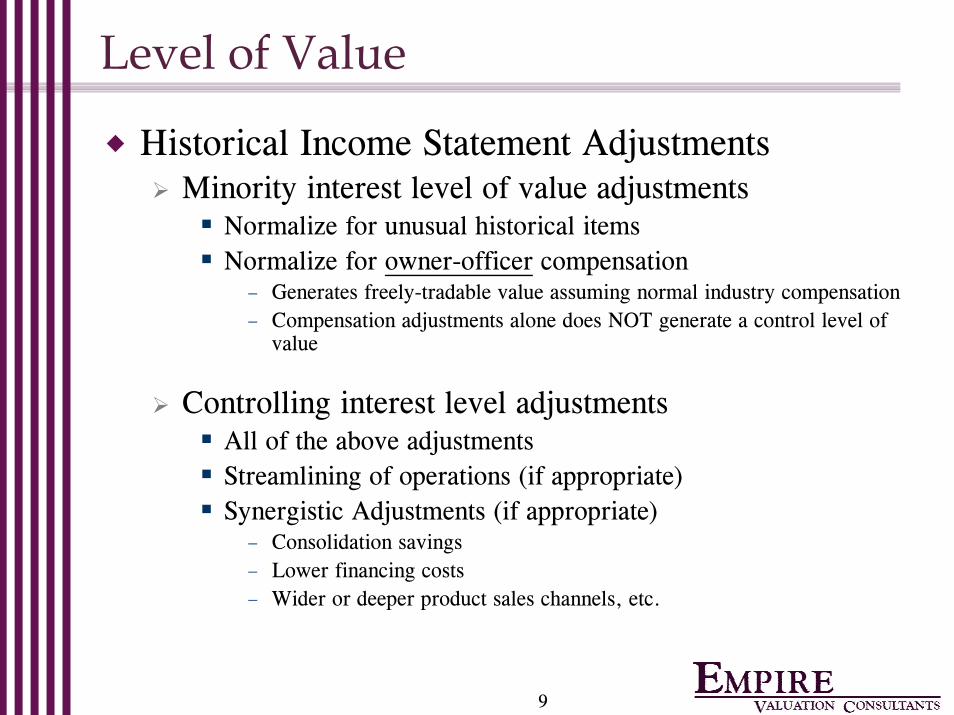
Level of Value
Historical Income Statement AdjustmentsMinority interest level of value adjustments
Normalize for unusual historical itemsNormalize for owner-officer compensation
– Generates freely-tradable value assuming normal industry compensation– Compensation adjustments alone does NOT generate a control level of
value
Controlling interest level adjustmentsAll of the above adjustmentsStreamlining of operations (if appropriate)Synergistic Adjustments (if appropriate)
– Consolidation savings– Lower financing costs– Wider or deeper product sales channels, etc.

10
“Paths” to Value
Path determines balance sheet items to be forecasted and cash flows to be used
Direct-to-Equity - using an equity discount rate and equity cash flows (net of all debt service)
Total Invested Capital (“TIC”) - using a “WACC” discount rate and debt-free cash flows (before debt service)
Provides enterprise or total invested capital values (debt+equity)Subtract existing debt from TIC to derive equity value

11
Annual Cash Flows By “Path”
12 15 19 20 24
TIC
or
“Ent
erpr
ise
Val
ue”
20 19 1820 22
32 34 3740
46
Deb
t Val
ueE
quity
Val
ue
Operating Free Cash Flows
Cash Flows to DebtHolders
(total debt service)
Total Invested Capital Cash Flows
Direct to Equity Cash Flows
Value of Annual Operating Free
Cash Flows

12
Example: Net Cash Flow to Equity
Traditionally: Net income (after interest exp. & taxes)
Plus: deprec., amort., & non-cash chargesLess: working capital changes +/-Less: capital expendituresPlus: new debt incurredLess: principal repayments

13
Example: To Total Invested Capital - TIC
Net Income Plus: deprec., amort., & non-cash chargesLess: working capital changes +/-Less: capital expendituresPlus: interest expense (after tax cost)
Note: Can also tax effect EBIT to get “debt-free” NI
Equals: cash flow to debt & equity holders (or operating cash flows)
14
Agenda
Overview of Discounted Cash Flow (DCF) Method and ForecastingWhat to Forecast?Individual Statements & IssuesTerminal Value Issues

15
Statement Forecasts - General
Spread and analyze full historical financialsMuch better insight into history “Normalize” to establish base for projections
Do ratio analysis on historical and projected financials
Ratios should be consistent or explained if different
Number of years - Until growth and cash flows normalize
Five years typical10 + years for large projects/utility/telecom type companies
16
Look to Each Type of Statement
Projected Income Statements
Projected Balance Sheets
Projected Cash Flow Statements

17
Income Statements – Historical Perspective
Minority interest level value adjustmentsNormalize for unusual historical itemsNormalize for owner-officer compensation
Controlling interest level adjustmentsAll of the above adjustmentsStreamlining of operations (if appropriate)Synergistic Adjustments (if appropriate)
Consolidation savingsLower financing costsWider or deeper product sales channels, etc.

18
Income Statements - Projections
Revenues to operating income levels
Interest expense
Taxes

19
Beware of the “Hockey Stick” Forecast
020406080
100120140160
0 1 2 3 4 5
SalesIncomeCash Flow
20
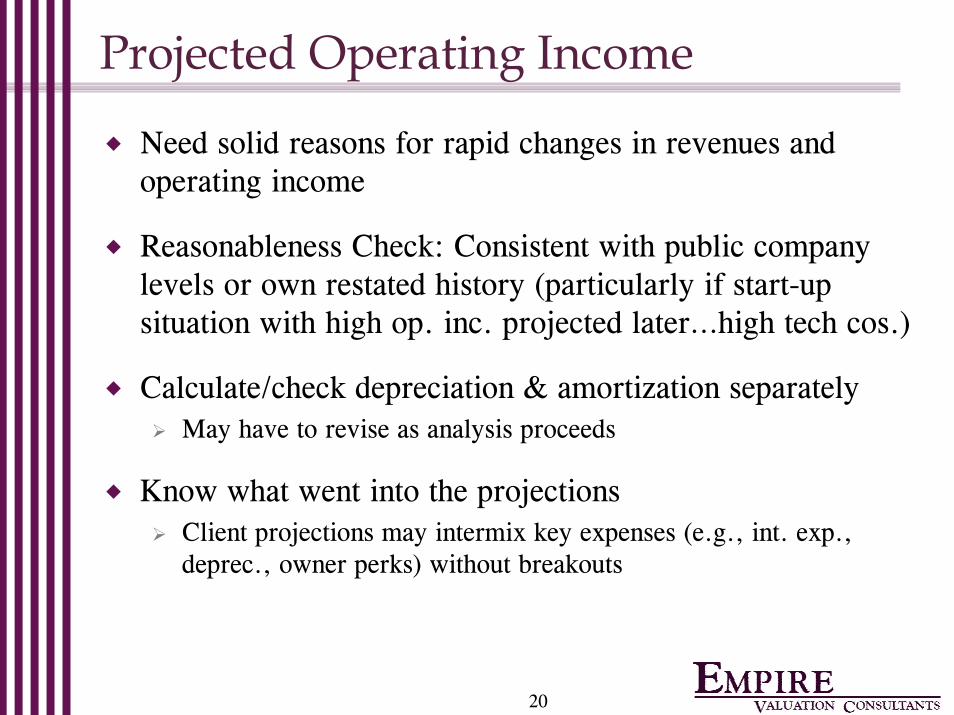
Projected Operating Income
Need solid reasons for rapid changes in revenues and operating income
Reasonableness Check: Consistent with public company levels or own restated history (particularly if start-up situation with high op. inc. projected later…high tech cos.)
Calculate/check depreciation & amortization separatelyMay have to revise as analysis proceeds
Know what went into the projectionsClient projections may intermix key expenses (e.g., int. exp., deprec., owner perks) without breakouts
21
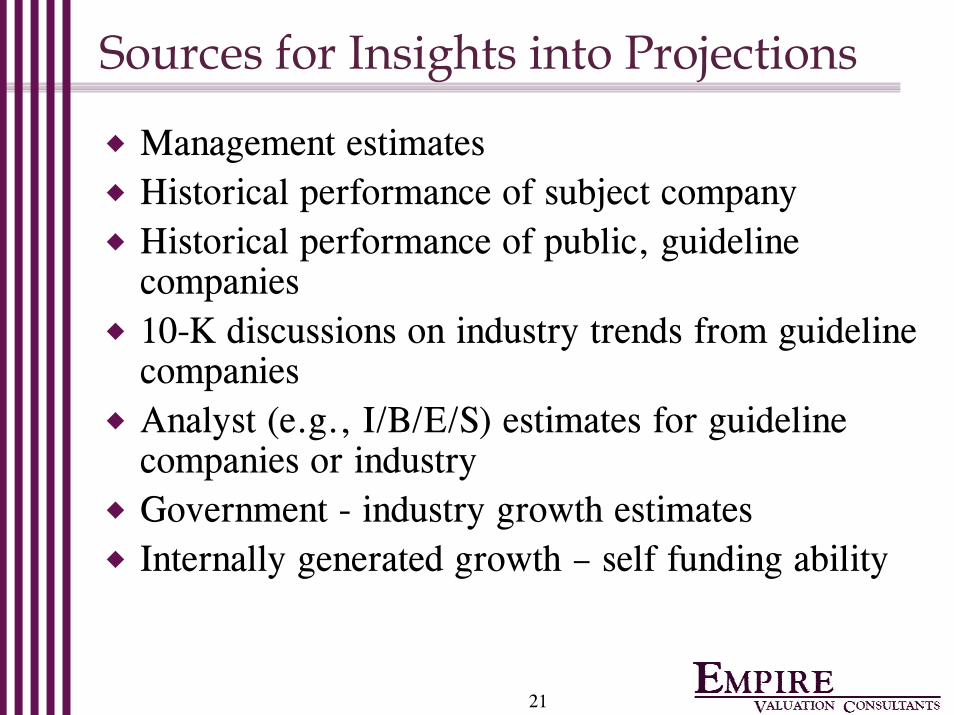
Sources for Insights into Projections
Management estimatesHistorical performance of subject companyHistorical performance of public, guideline companies10-K discussions on industry trends from guideline companiesAnalyst (e.g., I/B/E/S) estimates for guideline companies or industryGovernment - industry growth estimatesInternally generated growth – self funding ability
22
Income Statements – Interest Expense
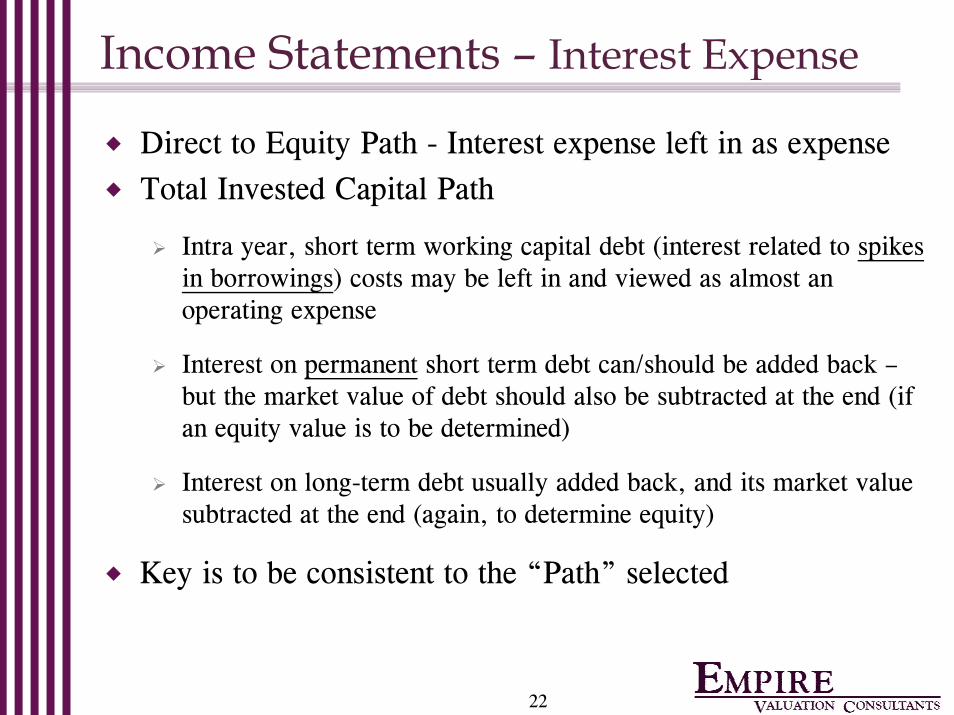
Direct to Equity Path - Interest expense left in as expenseTotal Invested Capital Path
Intra year, short term working capital debt (interest related to spikes in borrowings) costs may be left in and viewed as almost an operating expense
Interest on permanent short term debt can/should be added back –but the market value of debt should also be subtracted at the end (if an equity value is to be determined)
Interest on long-term debt usually added back, and its market value subtracted at the end (again, to determine equity)
Key is to be consistent to the “Path” selected

23
Income Statements – Taxes
Adjust Subchapter-S taxes as appropriateDetermine tax rate to use
Potential hypothetical willing buyerTax levels for standalone business
Use marginal tax rate (w/depreciation on tax basis)Incorporate existing Net Operating Loss Carryforwards, where appropriate (non-change in control situations)
24
Income Statements – Common Errors
“Hockey Stick” projections w/out consideration to history, capital requirements and market realities
Revenue RocketMargin CreepOff the Books Revenue/Income
Improper add backs for level of value being considered
Non-operating asset/liability impacts on earnings not eliminated from income or expenses

25
Look to Each Type of Statement
Projected Income Statements
Projected Balance Sheets
Projected Cash Flow Statements
26
Balance Sheets – Function in Valuation
Allows for analyzing and tracking all working capital accounts (including cash)
Historically
Projected basis
Validates capital exp. and depreciation ratios going forward
Explicit forecast of PP&E
Tracks other non-current assets/liabilities levels that the company needs to operate
Tracks debt assumptions if appropriate
27
Balance Sheets – Forecasting
Review HistoryEstablish Assumptions and Ratios
Ratios can be used to drive projections
Focus on:Net Property/Plant/Equip (PPE)/Net SalesDays or turns for major working capital categoriesDebt and equity financings that may be imbedded in projections (need to account for properly or remove) Intangible Asset TreatmentOther ratios as appropriate

28
Balance Sheets – Forecasting
Minor misalignments in depreciation and capital expenditures potentially cause major issuesIssue occurs with most projections
SAMPLE COMPANY1 2 3 4 5 Terminal
SALES 1,000 1,200 1,440 1,699 1,954 2,149 Growth 20% 20% 18% 15% 10%
PP&E 200 190 178 164 147 127
CAPITAL EXPENDITURE 50 60 72 85 98 107 % of Sales 5%
DEPRECIATION 60 72 86 102 117 129 % of Sales 6%NET PP&E 190 178 164 147 127 114
SALES/NET PP&E 5.26 6.74 8.80 11.59 15.38 18.87
29
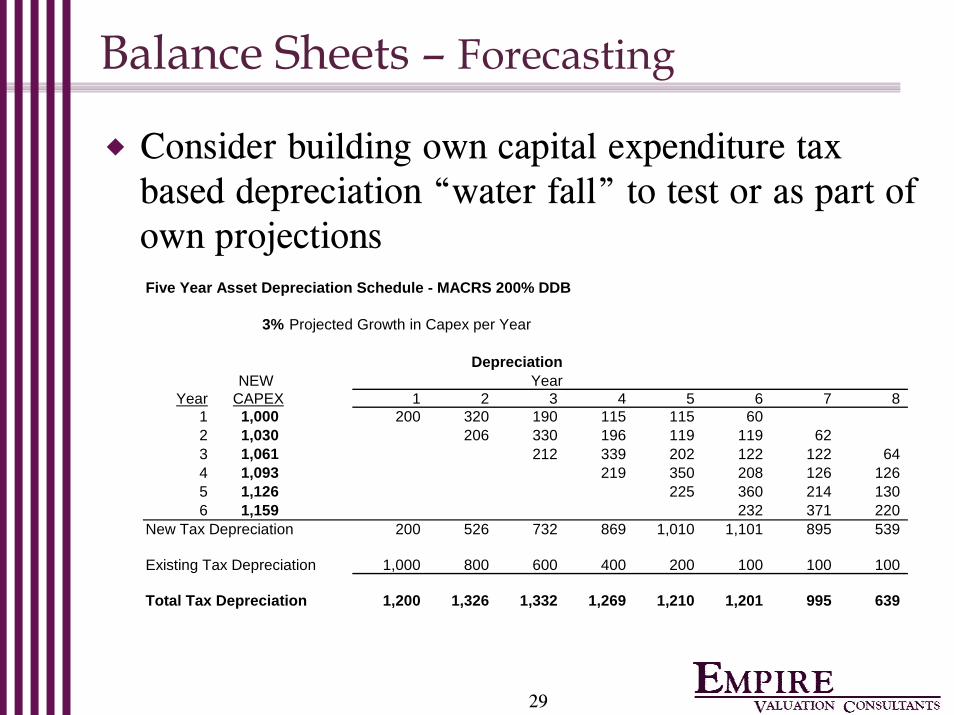
Balance Sheets – Forecasting
Consider building own capital expenditure tax based depreciation “water fall” to test or as part of own projectionsFive Year Asset Depreciation Schedule - MACRS 200% DDB
3% Projected Growth in Capex per Year
Depreciation NEW Year
Year CAPEX 1 2 3 4 5 6 7 8 1 1,000 200 320 190 115 115 60 2 1,030 206 330 196 119 119 62 3 1,061 212 339 202 122 122 64 4 1,093 219 350 208 126 126 5 1,126 225 360 214 130 6 1,159 232 371 220
New Tax Depreciation 200 526 732 869 1,010 1,101 895 539
Existing Tax Depreciation 1,000 800 600 400 200 100 100 100
Total Tax Depreciation 1,200 1,326 1,332 1,269 1,210 1,201 995 639

30
Balance Sheets – Forecasting Issues
Tricky Areas:Debt and working capital
Short and long-term debt forecasting“Path to value” determines treatment
Capitalized leases vs operating leasesDepreciation/AmortizationExcess Assets/LiabilitiesCash balances
Requirements of business – rest “distributed” for value
Terminal (or normalized) year cash flowsin high growth to lower growth situations

31
Balance Sheets – Common Errors
Depreciate PP&E to negative or insupportably low numbers given growth in revenues over projection period
Look at NET PP&E to sales ratio over time to checkCapital expenditures usually understated for depreciation taken
Ignore smaller but important working capital accounts (both asset and liabilities)
Overly aggressive changes in required current assets or liabilities
Reductions in Accts. Rec. from 60+ days to 30 days or vice versa for Accts. Pay, without adequate reasoningInventory turns adjusted without consideration to margin impacts
Ignore long-term net asset investments required
Ignore deferred taxes if income statements not on tax basis

32
Look to Each Type of Statement
Projected Income Statement Topics
Projected Balance Sheets
Projected Cash Flow Statements
33
Cash Flow Statements
Ties projections together so all are functioning properly
Easy place to spot anomalies in cash flows and trouble shoot unbalanced balance sheet forecasts/histories
34
Agenda
Overview of Discounted Cash Flow (DCF) Method and ForecastingWhat to Forecast?Individual Statements & IssuesTerminal Value Issues
35
Terminal Value is Very Important
50% to 80% of value typically captured in Terminal Value
Terminal year projections and adjustments have major impacts on values
Many appraisers project a “normalized” terminal year (different from the last projection year) to ensure proper cash flow levels
36
Terminal Value Cash Flows
Adjustments needed if long-term growth expected to be lower than last year of projections
Explicitly project extra year at normalized growth rateConfirm correct relationship between capital expenditures and depreciationConfirm proper treatment of tax amortization benefit or other cash flow benefits that may not be in perpetuity
Confirm your discount/WACC rate agrees with the cash flows you are forecasting for valuation purposes (consistent “path to value”)
37
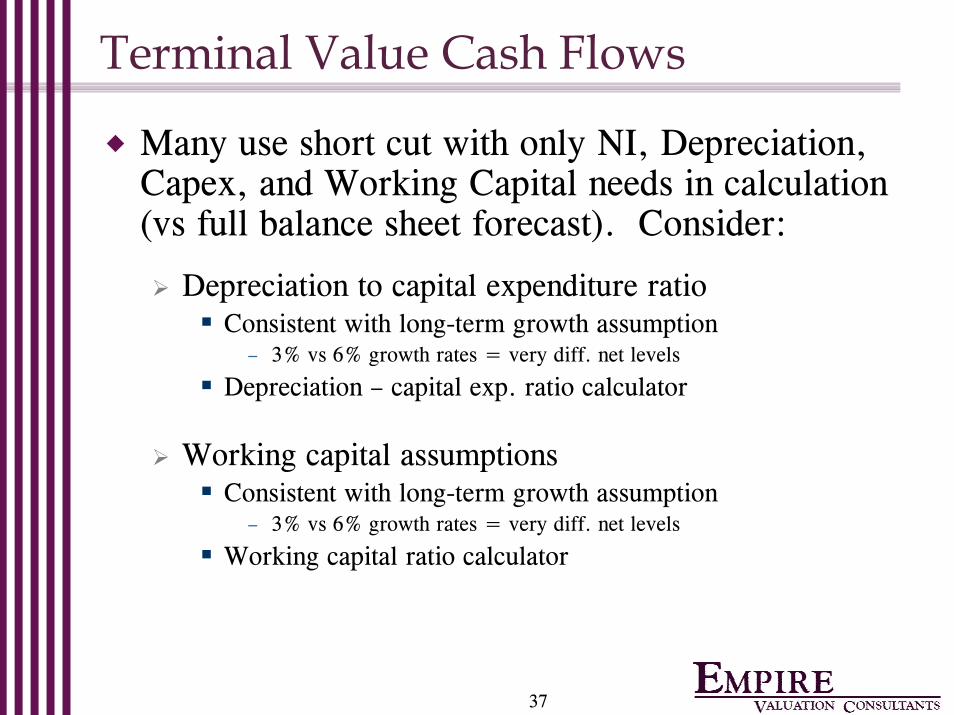
Terminal Value Cash Flows
Many use short cut with only NI, Depreciation, Capex, and Working Capital needs in calculation (vs full balance sheet forecast). Consider:
Depreciation to capital expenditure ratioConsistent with long-term growth assumption
– 3% vs 6% growth rates = very diff. net levels
Depreciation – capital exp. ratio calculator
Working capital assumptionsConsistent with long-term growth assumption
– 3% vs 6% growth rates = very diff. net levels
Working capital ratio calculator

38
Capital Exp. vs Depreciation CalculatorBased on MACRS depreciation schedule
Example: If Depreciation=$100 in terminal year then Capex should =$107, if mostly 5-year assets with 4% growth assumed.
Ratio of Capital Expenditures to Depreciation at Equalibrium
Five year Assets Seven year Assets
Assumed AssumedLT Growth Ratio Reciprocal* LT Growth Ratio Reciprocal*
3.0% 105% 95% 3.0% 108% 93%4.0% 107% 93% 4.0% 110% 91%5.0% 109% 92% 5.0% 113% 88%6.0% 111% 90% 6.0% 116% 86%7.0% 112% 89% 7.0% 118% 85%8.0% 114% 88% 8.0% 121% 83%9.0% 116% 86% 9.0% 123% 81%
* Reciprocal = Depreciation as % of Capex
Cap. Exp. vs Depreciation vs Growth

39
Working Capital “Calculator”TERMINAL YEAR WORKING CAPITAL CALCULATOR
FOR NORMALIZING WORKING CAPITAL TO LONG-TERM GROWTH ASSUMPTIONS
($000) 1999 2000 2001 2002 2003
SALES: $50.0 $55.0 $60.0 $65.0 $70.0
RECEIVABLES: $6.0 $7.0 $7.0 $8.0 $9.0
INVENTORY: $10.0 $11.0 $13.0 $13.5 $15.0
PAYABLES: $4.0 $5.0 $5.0 $6.0 $6.0
OTHER CURRENT A. $0.1 $0.2 $0.4 $0.5 $0.6
OTHER CURRENT L. $3.0 $3.0 $4.0 $4.0 $5.0AVERAGE ANALYST'S
DAYS OVER NORMALIZEDDAYS IN SALES OF EACH ITEM PERIOD VALUES
DAYS REC (43.8) (46.5) (42.6) (44.9) (46.9) (44.9) (45.0)
DAYS INVENTORY (73.0) (73.0) (79.1) (75.8) (78.1) (75.8) (75.0)
DAYS PAYABLE to SLS 29.2 33.2 30.4 33.7 31.3 31.6 33.0
DAYS OTHER A. to SLS (0.7) (1.3) (2.3) (2.7) (3.4) (2.1) (2.5)
DAYS OTHER L. to SLS 21.9 19.9 24.3 22.5 26.1 22.9 23.0
WORKING CAP LINE 0.0 0.0 0.0 0.0 0.0 0.0 0.0(68.3) (66.5)
TERMINAL VALUE WKG CAPITAL INV CALCULATIONSTERMINAL VALUE GROWTH ASSUMPTION: 4.00%
NORMALIZED OR BASE YEAR'S SALES VOLUM $70.00
NEXT YEAR'S SALES VOLUME: $72.80 [BASE YEAR'S SALES + GROWTH]
RESTATED PRIOR YEAR'S SALES BASED ON TERMINAL GROWTH ASSUMPTION: $70.00
NORMALIZED TOTAL WKG CAP INV FOR:NEXT YEAR'S SALES: ($13.26) [FUNCTION OF DAYS OF SALES]
LESS: PRIOR YEAR ($12.75)CHANGE IN WKG CAP AT L-T. GROWTH RATE: ($0.510)
HISTORY

40
Appendix
41
Balance Sheets – Forecasting Ratios
Liquidity Ratios
Current RatioCurrent Assets/Current Liabilities
Quick RatioCash & Equivalents+Invests+Accts. Receivables
Current Liabilities

42
Balance Sheets – Forecasting Ratios
Activity Ratios
Days Payables (Payment Policy Measure)
365/(Cost of Goods Sold/Average Accts. Payables)
Days Receivables (Collection Measure)
365/(Sales/Average Accts. Receivables)
Days Inventory (Inventory Age/Costs)
365/(Cost of Goods Sold/Average Inventory)
Working Capital to Sales
(Current Assets-Current Liabilities)/Sales
Sales to Net PP&E (PP&E Utilization & Adequacy)
Average Net PP&E/Sales or reciprical

43
Balance Sheets – Forecasting Ratios
Profitability & Return Ratios
EBITDA to SalesEBITDA =Earnings b/Interest, Taxes, Deprec. & Amort.
Operating Profit to Sales
Net Income to Sales
Return on EquityNet Income/Average Stockholder’s Equity
Return on Total AssetsEBIT/Average Total Assets
– EBIT=Earnings b/Interest & Taxes
44
Balance Sheets – Forecasting Ratios
Leverage Ratios – Direct-to-Equity Path Model
Total Interest Bearing Debt to Total Assets
Equity to Total Book CapitalTotal Equity/(Long Term Debt + Book Equity)
Times Interest EarnedEBIT/Interest Expense
Fixed Charges CoverageEBIT+Lease Pmts./(Interest+Current Debt Due+Lease Pmts. Due)
Do’s & Don’ts of Cash Flow/Balance Sheet Forecasting
23rd Advanced Business Valuation Conference
American Society of AppraisersSan Antonio, TX - October 7, 2004
Scott A. Nammacher, ASA, CFA
Managing DirectorEmpire Valuation Consultants, LLC
Email: [email protected]