Embed Size (px)
Citation preview
© 1989 Elsevier Science Publishers B V (Biomedical Division)Dose response relationships m clinical pharmacologyL Lasagna, S Enll, C A Naranjo, editors 201
DOSE-RESPONSE RELATIONSHIP AND THERAPEUTIC DRUG MONITORING
EMILIO PERUCCA1 and FRANCESCO PISANI2
•'•Clinical Pharmacology Unit, Department of Internal Medicine and
Therapeutics, University of Pavia, 27100 Pavía and 2Institute of
Neurology, University of Messina, 98100 Messina (Italy)
INTRODUCTION
During the last 20 years, therapeutic drug monitoring (TDM) has
become part of clinical management in several important areas of
therapeutics. Basically, the usefulness of serum drug level
monitoring stems from the fact that the dose-response relationship
for many drugs shows a wide interindividual variability, which
can be explained to a large extent by interindividual
differences in pharmacokinetics. Under these conditions, the
clinical effect correlates with the concentration of the drug
in serum (which varies widely among individuals receiving the
same dose) better than with the prescribed daily dose (1-3) .
When the effect is not immediately or easily quantifiable,
e.g. in the case of antidysrhythmic or antiepileptic agents
given prophylactically, knowledge of the serum drug concentration
enables the clinician to make dosage adjustments more rapidly
and effectively. By individualizing dosage based on TDM
determinations, the variability in response which arises from
interindividual differences in serum drug levels can be easily
controlled.
There are important aspects of the dose-response relationship
which need to be considered in TDM. If TDM is to be used
rationally to make dosage adjustments, the following requirements
must be met:
i) the correlation between serum concentration and effect must have
been clearly defined, and shown to be superior to the correlation
between prescribed dosage and effect;
ii) the intraindividual relationship between dosage and serum
concentration must be known.
The purpose of the present article is to review knowledge
concerning the dosage-serum level-effect relationships for some
commonly monitored drugs and to highlight some of the implications
resulting from variations in such relationships.
202
THE CONCENTRATION-EFFECT RELATIONSHIP
The concentration-response curve in TDM
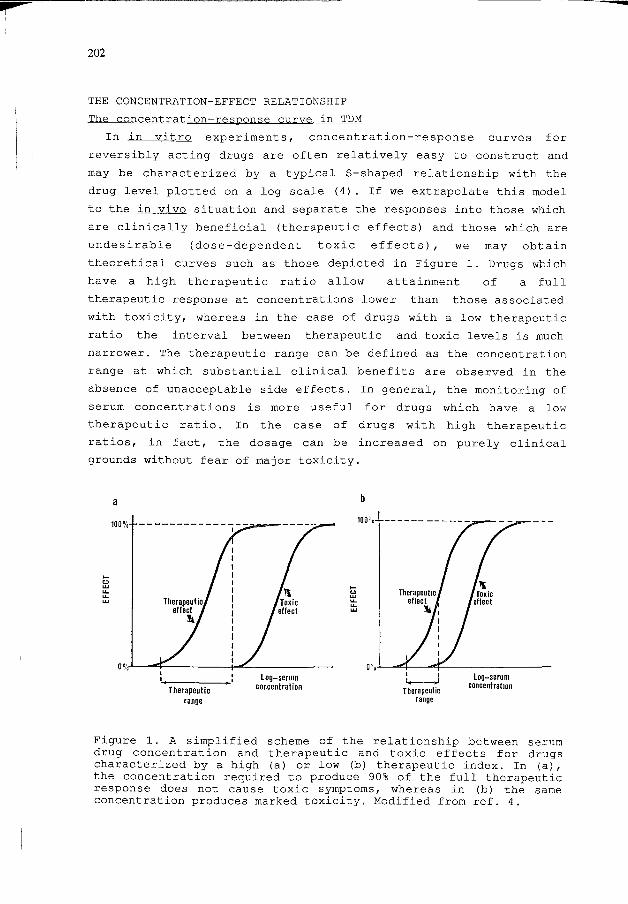
In in vitro experiments, concentration-response curves for
reversibly acting drugs are often relatively easy to construct and
may be characterized by a typical S-shaped relationship with the
drug level plotted on a log scale (4). If we extrapolate this model
to the in vivo situation and separate the responses into those which
are clinically beneficial (therapeutic effects) and those which are
undesirable (dose-dependent toxic effects), we may obtain
theoretical curves such as those depicted in Figure 1. Drugs which
have a high therapeutic ratio allow attainment of a full
therapeutic response at concentrations lower than those associated
with toxicity, whereas in the case of drugs with a low therapeutic
ratio the interval between therapeutic and toxic levels is much
narrower. The therapeutic range can be defined as the concentration
range at which substantial clinical benefits are observed in the
absence of unacceptable side effects. In general, the monitoring of
serum concentrations is more useful for drugs which have a low
therapeutic ratio. In the case of drugs with high therapeutic
ratios, in fact, the dosage can be increased on purely clinical
grounds without fear of major toxicity.
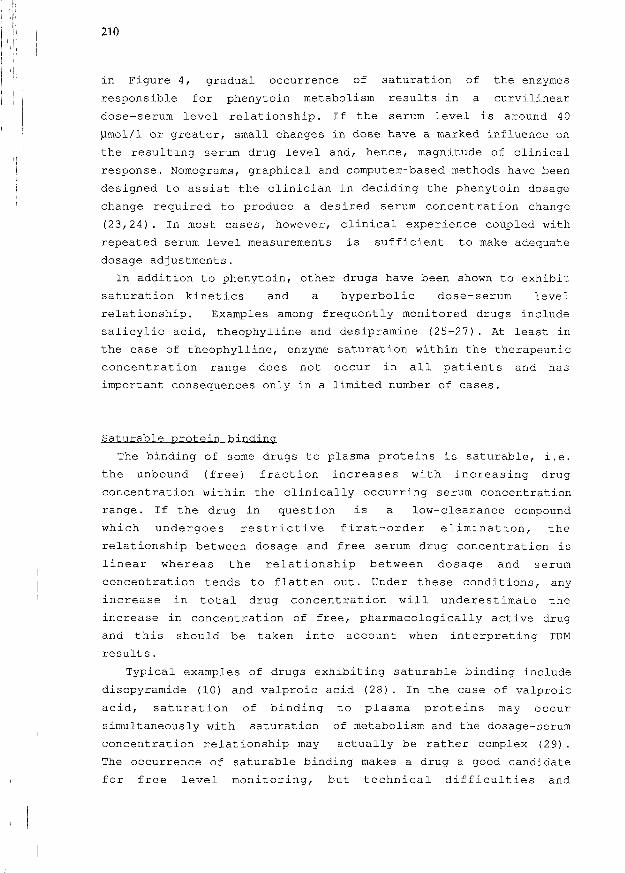
Therapeuticrange
Figure 1. A simplified scheme of the relationship between serumdrug concentration and therapeutic and toxic effects for drugscharacterized by a high (a) or low (b) therapeutic index. In (a),the concentration required to produce 90% of the full therapeuticresponse does not cause toxic symptoms, whereas in (b) the sameconcentration produces marked toxicity. Modified from ref. 4.
203
In clinical practice, the situation is usually much more complex
than that illustrated in Figure 1. In the first instance,
therapeutic and adverse effects are usually difficult to quantify
objectively and early appearance of toxicity often prevents
exploration of the dose-response relationship over a sufficiently
wide concentration range. Moreover, the concentration-response
curve in the in vivo organism may be distorted by many factors,
including the activation of physiological homeostatic mechanisms,
changes in the levels of endogenous agonists, the involvement of
more than one receptor type at target tissues and, at times, the
occurrence of a slow equilibration phase beween the drug in serum
and the drug at the receptor sites (5). An additional complication,
which will be discussed below in more detail, arises from the fact
that the concentration-effect relationship may show a large
interindividual and, sometimes, intraindividual variability.
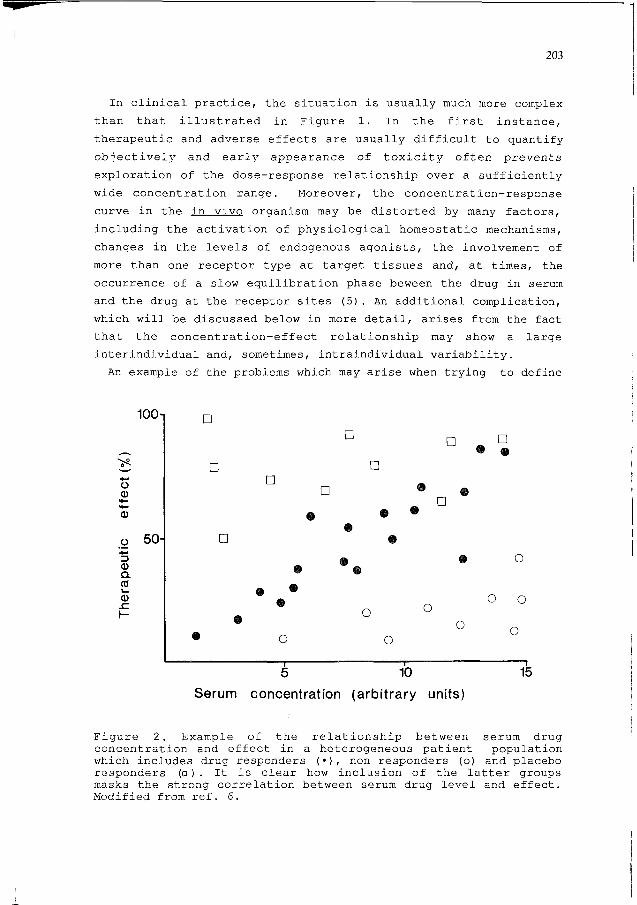
An example of the problems which may arise when trying to define
100n
O0)
0)
ü"30aroU.
0)
50-
D
o
a a
D
D
0 0
0
o o
°
5 10 15
Serum concentration (arbitrary units)
Figure 2. Example of the relationship between serum drugconcentration and effect in a heterogeneous patient populationwhich includes drug responders (•), non responders (o) and placeboresponders (a ) . It is clear how inclusion of the latter groupsmasks the strong correlation between serum drug level and effect.Modified from ref. 6.
204
concentration-response relationships in clinical practice is given
in Figure 2, Even when a drug shows a nicely graduated quantifiable
dose-response curve, the overall concentration-effect relationship
may be blurred or masked by inclusion into the trial of
placebo-responders (patients who do well without the drug) and/or
non responders. Sometimes, non-responders and placebo-responders
can be identified beforehand and excluded from the trial but this
may not be always feasible, resulting in failure to recognize the
potential value of TDM in the subpopulation of patients showing a
good response to the drug. Indeed, patients selection is the most
critical factor to be considered in the study of dose-response
relationships: therapeutic ranges identified in a given patient
population may not be applicable to individuals with different kind
of disease(s) and/or different severity of the same disease. The
usually quoted therapeutic range of serum phenytoin (40-80 jlmol/l),
for example, was originally identified in patients with severe
forms of epilepsy and it has been subsequently proved that many
patients with milder forms of the disease can be optimally treated
at serum phenytoin levels lower than these (7,8).
In order to use TDM effectively, it is important to obtain as
much information as possible about (i) the shape of the
intraindividual concentration-response curve, (ii) the
interindividual variability in response and (iii) the factors which
affect the intensity of response at a given drug concentration.
The shape of the curve
As discussed above, for many drugs the shape of the
dose-response relationship may d i f fer considerably from the
prototype shown in Figure 1. The problems encountered in
pharmacodynamic modelling in man and examples of different types of
serum concentration-effect relationships for individual drugs have
been recently reviewed (5) . In some cases, the distortion of
the relationship arises from pharmacokinetic factors: the serum
level-response curve for a given drug, for example, may be
affected by the simultaneous presence of an active metabolite,
especially when the parent drug/metabolite ratio is dose-
dependent . Another source of variation arises from changes in drug
binding to serum proteins. Since the pharmacological response is
generally considered to be proportional to the concentration of
free (non protein-bound) drug, the relationship between total serum
205
concentration and effect can be distorted by
concentration-dependent changes in unbound fraction (9) . A
situation of this kind is seen with disopyramide, whose binding to
serum proteins decreases markedly with increasing drug
concentration: therefore, any increase in total serum disopyramide
concentration may underestimate the increase in concentration of
free, pharmacologically active drug and, hence, magnitude of effect
(10) .
An important distortion of the dose-response curve, presumably
caused by pharmacodynamic factors, is represented by "bell-shaped"
relationships. For drugs which exhibit this relationship, the
intensity of therapeutic effect increases with increasing serum
drug concentration up to a maximum: thereafter, further increases
in concentration result in paradoxical loss of clinical efficacy.
The occurrence of this kind of relationship is by itself an
indication for TDM, since it may be difficult to establish on
purely clinical grounds whether a patient's lack of response is due
to over- or under-dosing. A "bell-shaped" dose-response curve has
been described for some tricyclic antidepressants and considered to
be possibly related to antagonism of therapeutic effects by
adrenergic blocking activity becoming manifest at high drug
levels (11,12) . A paradoxical decrease of efficacy at high drug
levels, however, may occur with other compounds, including various
anticonvulsants (13) .
Variability in concentration-effect relationship
If the serum level-effect relationship was fixed and identical in
all patients, the task of the clinician would be greatly
simplified. It would be sufficient to draw a blood sample, measure
the drug concentration and adjust dosage in order to obtain the
optimal level. Unfortunately, in real life things are much more
complicated. The main complication arises from the fact that, for
virtually all drugs, there is not a fixed "optimal level"
appropriate for all patients. On the contrary, there is
considerable inter- and, sometimes, intra-patient variation in the
response achieved at a given serum level: this implies that the
"therapeutic range" should be regarded as a purely statistical
concept, representing the concentration at which most (not
necessarily all) patients with a well defined pathology will show
an optimal response (1-4, 13,14). For some drugs, the inter-patient
206
variability in response is so great that subtherapeutic,
therapeutic and toxic levels in a given population overlap widely:
under these conditions, the definition of an optimal range becomes
very difficult and the very value of monitoring serum levels is
questionable. Interestingly, a criticism of this kind has been
voiced for two of the most frequently monitored drugs, e.g. digoxin
(15) and valproic acid (16).
Obviously, the fact that the relationship between serum level and
response varies widely among individuals reduces the value of serum
level monitoring, but it does not necessarily imply that TDM is
useless in such situation. In fact, for some of these drugs it is
still possible to identify empyrically the serum level at which an
individual patient shows the best clinical response (2,3,14):
knowledge of this "individualized therapeutic range" provides a
valuable reference which can be useful to evaluate the clinical
picture should the same patient at a later stage show an unexpected
change in response (e.g., due to lack of compliance or to a
pharmacokinetic interaction with another drug). In all situations,
many of the interpretative problems in TDM can be minimized by a
good knowledge of the various factors which affect the drug
level-response relationship.
Factors affecting the drug level-response relationship
A throughout discussion of the factors responsible for the intra-
and inter-patient variation in the drug level-response relationship
is beyond the purpose of this article (for detailed information see
refs . 1-5,9,14) . Some of the most important examples will be
reviewed briefly in this section.
Type and severity of the disease, It is well known that the
serum drug levels required to obtain a desired pharmacological
response is dependent upon the type and severity of the disease.
The optimal serum concentration of a given antibiotic, for example,
varies with the type of infecting organism and the site of the
infection. Similarly, the optimal levels of various antiepileptic
drugs vary depending on the form of epilepsy (7).
The duration of treatment. The concentration-response relation-
ship may change with time . A good example is provided by
barbiturates. Because of the development of functional tolerance,
patients exposed chronically to phenobarbital may tolerate and
indeed require serum drug levels which would be extremely toxic in
207
a naif subject (13).
Variation in drug binding to serum proteins. Although many drugs
are extensively bound to serum proteins, only the free, non-protein
bound fraction is available to cross the endothelial barrier and
equilibrate with receptor sites in tissues. If the free fraction
increases, the total drug concentration, which is the one usually
measured for TDM purposes, may underestimate the concentration of
free, pharmacologically active drug. Individual variation in
drug-protein binding is one of the factors responsible for the
inter-patient variability in response to a given serum drug
concentration. An altered dose-response relationship can be
observed in patients with abnormal protein binding: uremic
patients, for example, may show a gross impairment in the
protein binding of phenytoin and develop signs of toxicity at
total serum phenytoin levels lower than usual (17) . Concomitantly
administered agents may displace protein-bound drugs from
binding sites, resulting in an increased free fraction and a
correspondingly altered dose-response relationship.
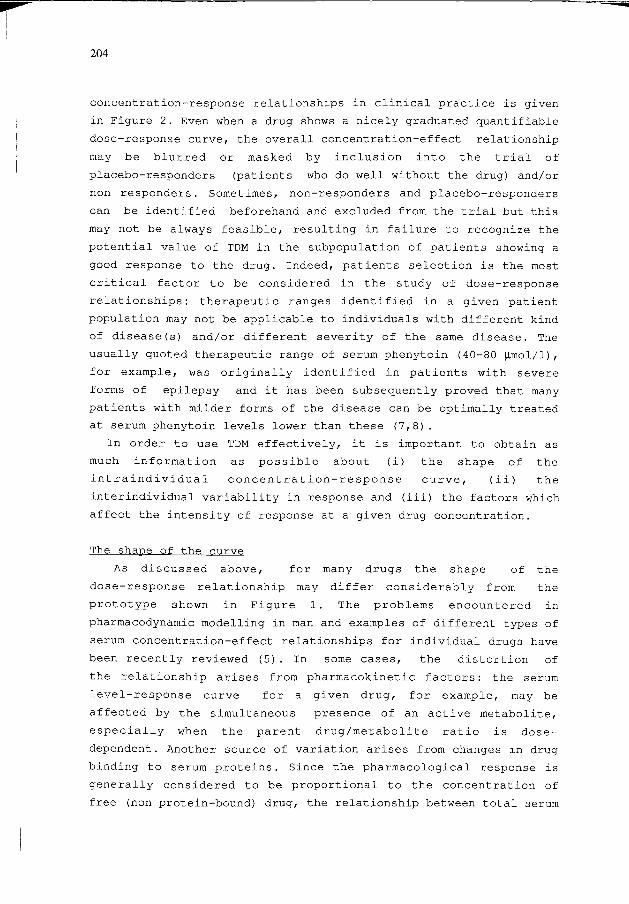
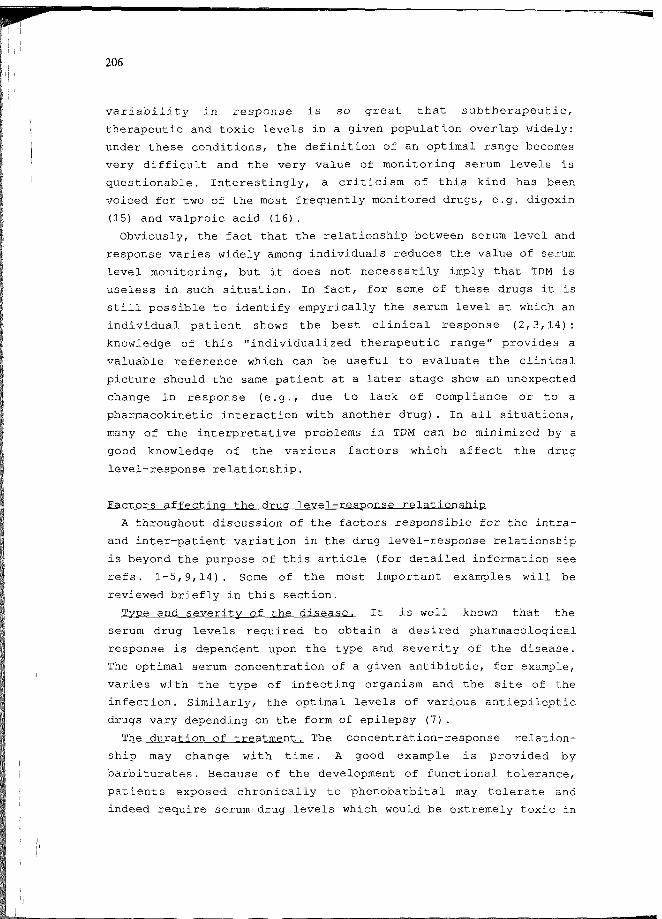
Presence of active metabolites. Several commonly monitored drugs,
including procainamide, primidone, carbamazepine and some
tricyclic antidepressants have active metabolites. Since patients
may show differences in parent drug/metabolite ratios, it is
not surprising that clinical response may not be consistently
related to the levels of parent drug alone. We have found, for
example, that patients receiving carbamazepine are likely to
develop signs of toxicity when valpromide, the amide of
valproic acid, is added to their treatment: this is explained
entirely by a marked rise in the serum levels of the active
metabolite carbamazepine-10,11-epoxide without any significant
change in the levels of parent drug (Figure 3).
Pathophysiological factors leading to altered drug sensitivity.
Physiological and pathological factors may affect drug sensitivity
at receptor sites. Elderly subjects, for example, show increased
sensitivity to benzodiazepines while hypokalemic patients are more
vulnerable to digitalis toxicity (9).
Pharmacodynamic drug interactions. The dose-response curve to a
given drug may be influenced by the simultaneous administration of
other agents. An example is the progressive shift to the left of
the concentration-effect relationship of theophylline at increasing
concentrations of concurrently given terbutaline (19).
208
32-,
28-
3- 24~o
2 2oHc0)ocoo
LUtxjcaoEDw0)W
16-
12-
8-
4-
15 22 29 36 days
Figure 3. Effect of a 2-week treatment with valpromide (VPM) , 900mg/day, on the serum levels of carbamazepine-10,11-epoxide (CBZ-E)in patients stabilized on a fixed carbamazepine (CBZ) dosage. Dataare means ± s.d in 6 patients. The slight decrease incarbamazepine-10,11- epoxide levels after 2 weeks on valpromide wasrelated to a decrease in valpromide dosage in 2 patients whoexperienced adverse effects. Serum carbamazepine levels were notaffected by the interaction. Modified from ref. 18.
Variation in drug assay. Intra- and inter-laboratory variation in
drug assays is not a secondary cause of apparent inconsistencies
between reported serum drug level results and concurrently assessed
clinical response. The size and the implications of this problem
have been stressed elsewhere (20) .
THE DOSAGE-SERUM CONCENTRATION RELATIONSHIP
If TDM is to be used effectively, information about the expected
relationship between serum level and response must be coupled with
209
knowledge about the effect that a given dosage adjustment will have
on the serum level. In many cases, the relationship between dosage
and serum level is linear and dose-independent, e.g. doubling the
dose will also cause a doubling of the serum level at steady-state,
at least within the therapeutically used dose range. In other
cases, marked deviations from linearity may occur, and it is
essential for the clinician to be aware of their existence.
Saturation kinetics
The enzymes responsible for the metabolism of several drugs may
become saturated within the clinically occurring dose range. When
saturation is approached, the drug metabolizing efficiency of the
organism declines sharply, the rate of drug elimination becomes
progressively slower and small dose increments can cause
disproportionately large increases in serum drug concentration.
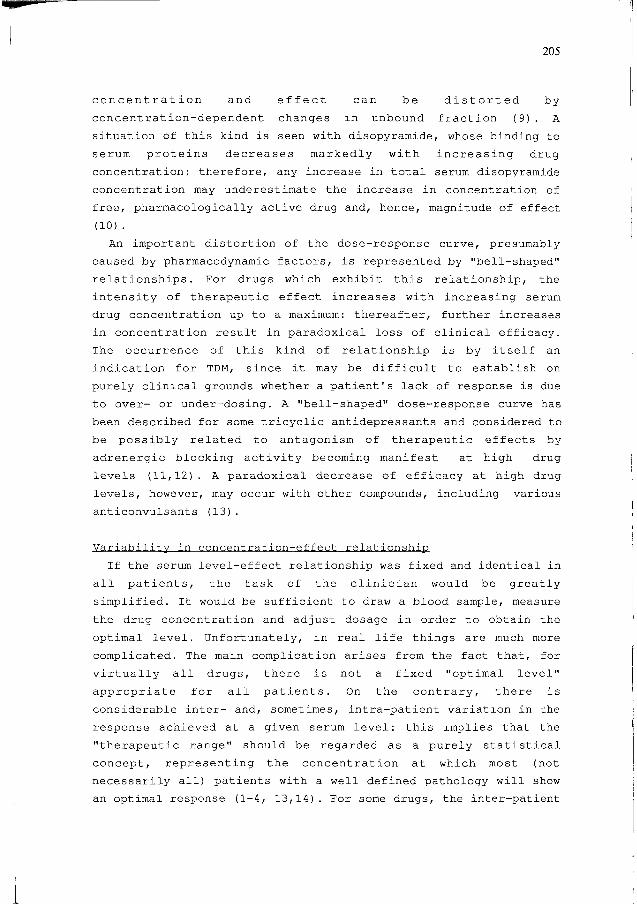
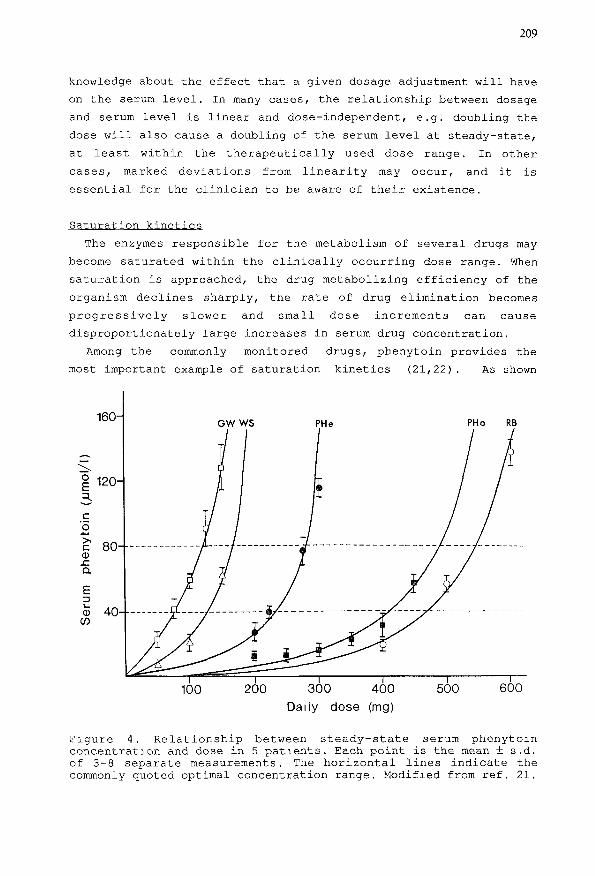
Among the commonly monitored drugs, phenytoin provides the
most important example of saturation kinetics (21,22) . As shown
PHo RB
100 200 300 400
Daily dose (mg)500 600
Figure 4. Relationship between steady-state serum phenytoinconcentration and dose in 5 patients. Each point is the mean ± s.d.of 3-8 separate measurements. The horizontal lines indicate thecommonly quoted optimal concentration range. Modified from ref. 21.
210
in Figure 4, gradual occurrence of saturation of the enzymes
responsible for phenytoin metabolism results in a curvilinear
dose-serum level relationship. If the serum level is around 40
(lmol/1 or greater, small changes in dose have a marked influence on
the resulting serum drug level and, hence, magnitude of clinical
response. Nomograms, graphical and computer-based methods have been
designed to assist the clinician in deciding the phenytoin dosage
change required to produce a desired serum concentration change
(23,24) . In most cases, however, clinical experience coupled with
repeated serum level measurements is sufficient to make adequate
dosage adjustments.
In addition to phenytoin, other drugs have been shown to exhibit
saturation kinetics and a hyperbolic dose-serum level
relationship. Examples among frequently monitored drugs include
salicylic acid, theophylline and desipramine (25-27). At least in
the case of theophylline, enzyme saturation within the therapeutic
concentration range does not occur in all patients and has
important consequences only in a limited number of cases.
Saturable protein binding
The binding of some drugs to plasma proteins is saturable, i.e.
the unbound (free) fraction increases with increasing drug
concentration within the clinically occurring serum concentration
range. If the drug in question is a low-clearance compound
which undergoes restrictive first-order elimination, the
relationship between dosage and free serum drug concentration is
linear whereas the relationship between dosage and serum
concentration tends to flatten out. Under these conditions, any
increase in total drug concentration will underestimate the
increase in concentration of free, pharmacologically active drug
and this should be taken into account when interpreting TDM
results.
Typical examples of drugs exhibiting saturable binding include
disopyramide (10) and valproic acid (28) . In the case of valproic
acid, saturation of binding to plasma proteins may occur
simultaneously with saturation of metabolism and the dosage-serum
concentration relationship may actually be rather complex (29) .
The occurrence of saturable binding makes a drug a good candidate
for free level monitoring, but technical difficulties and
211
interpretative problems (30) restrict the applicability of this
option.
Other sources of non-linear dose-level relationship
There is some evidence that when a given serum carbamazepine
level is achieved, further increases in dosage result in
disproportionately low increases in serum concentration (31). This
phenomenon is not related to saturable plasma protein binding and
may be due to decrease bioavailability at higher dosages or,
alternatively, to dose-dependent autoinduction.
CONCLUSIONS
To use TDM effectively, the clinician must have a good knowledge
of clinical pharmacology and be especially aware of the many
factors which may influence the relationship between daily dose,
resulting serum drug concentration and magnitude of pharmacological
effect. As pointed out above, the interidividual variability in the
dose-response relationship can be very large and it may not be
controlled entirely by monitoring the serum concentration of the
drug. Although TDM is a useful aid in the individualization of drug
therapy, it is not a substitute for clinical observation and
careful monitoring of drug response.
REFERENCES
1. Koch-Weser J (1981)In: Richens A, Marks V(eds) Therapeutic DrugMonitoring.Churchill-Livingstone, Edinburgh, pp 1-22
2. Perucca E (1987) Basi Raz Ter 17:196-206
3. Perucca E (1987) Inpharzam Medical Forum 11:60-63
4. Perucca E, Richens A (1980) In: Grundmann E (ed) Drug-InducedPathology, Current Topics in Pathology vol 69, Springer-Verlag,Berlin, pp 18-68
5. Oosterhuis B, Van Boxtel CJ (1988) Ther Drug Monit 10:121-132
6. Asberg M, Sjoqvist F (1978) Comm Psychopharmacol 2:381-391
7. Schmidt D, Haenel F (1984) Neurology 34:1252-1255
8. Woo E, Chan Y M, YU Y L, Chan Y W, Huang C Y (1988) Epilepsia29:129-139
9. Perucca E, Grimaldi R, Crema A (1985) Clinical Pharmacokinetics10:498-513
10. Lima JJ,Bondoulas H,Blanford M (1981) J Pharmacol exp Ther 219:741-747
11. Àsberg M, Cronholm B, Sjoqvist F, Tuck D (1971) Brit Med J 3:331-334
212
12. Task Force on the Use of Laboratory Tests in Psychiatry (1985)Am J Psych 142:155-162
13. Perucca E, Richens A (1981) In: Richens A, Marks V (eds),Therapeutic Drug Monitoring, Churchill-Livingstone, Edinburgh,pp 320-348
14. Perucca E (1988) In: Faienza C, Prati GL (eds), Diagnostic andTherapeutic Problems in Pediatria Epileptology,Excerpta Medica,Amsterdam, pp. 125-134
15. Morgan DB (1984) Ann Clin Biochem 21: 449-452
16. Chadwick DW (1987) Brit Med J 294:723-724
17. Perucca E (1984) Clinical Pharmacokinetics 9 (Suppl. 1): 71-78
18. Pisani F, Fazio A, Oteri G, Ruello C, Gitto C, Russo F,Perucca E (1986) Epilepsia 27: 548-552
19. Billing B, Dahlqvist R, Garle M, Hornblad Y, Ripe E (1982) EurJ Resp Dis 63:399-409
20. Griffiths A, Hebdige S, Perucca E, Richens A (1980) Ther DrugMonit 2:51-59
21. Richens A, Dunlop A (1975) The Lancet ii:247-248
22. Perucca E, Makki K, Richens A (1978) Clin Pharmacol Ther 26:46-51
23. Sheiner LB, Seal SL (1980) J Pharmacok Biopharm 8:553-571
24. Welty TE, Robinson FC, Meyer PR (1986) Epilepsia 27:76-80
25. Brisen K, Gram LF, Klysner R, Bech V (1986) Eur J clinPharmacol 30:43-49
26. Dahlqvist R, Billing B, Miners JO, Birkett DJ (1984) Ther DrugMonit 6:290-297
27. Nelson JC, Jatlow PI (1987) Clin Pharmacol Ther 41:666-670
28. Perucca E, Richens A (1985) In:Janz D, Frey HH (eds), Antiepi-leptic Drugs, Handbook of Experimental Pharmacology,vol 74,Springer-Verlag, Berlin, pp 661-723
29. Bowdle TA, Patel IH, Levy RH, Wilensky AJ (1980) Clin PharmacolTher 28:486-492
30. Barre J, Didey F, Delion F, Tillement J-P (1988) Ther DrugMonit 10:133-142
31. Perucca E, Bittencourt P, Richens A (1980) Clinical Pharmacoki-netics 6:576-582
213
Discussion - Dose-response relationships and therapeutic drug
monitoring
L.F. Prescott
I wonder if you have any thoughts about how the dose response
curve is modified by other drug therapy. Epileptic patients are
sometimes prescribed drugs which are potential convulsants, such
us mefenamic acid, antidepressants, or theophylline. Many other
drugs in high doses will produce convulsions and epileptics are
often prescribed these. Could you comment on that?
E. Perucca
The most common situation is that created by the prescription
of several anticonvulsants. In that case the optimal concentra-
tion of a drug may be altered by the additional effect of a
second drug. Sometimes, this is favourable and perhaps the best
example is provided by valproic acid and ethosuximide, which
exhibit synergistic effects, irrespective of their serum concen-
trations. More frequently, however, one does not increase much
the efficacy but produces more toxicity, by adding a second drug.
Some time ago we looked at a level/response relationship for
carbamazepine in patients receiving this drug alone or in combi-
nation with phenobarbital and when the two drugs were combined,
the threshold at which side effects of carbamazepine appeared was
lower than when the drug was given alone. So the optimum ranges
may change when a drug combination is used. As far as potentially
convulsant drugs are concerned, that is a very complicated
situation and I am not aware of studies looking specifically at
the level/response relationship in such cases.
D.S. Davies
It has been said that probably doctors do not invest sufficient
time and money to study two or possibly three dose levels of
phenytoin in order to define the dose/plasma concentration curve
in an individual while ample time and money is spent on the diag-
nosis. And yet, the dosage is critical and may be needed for a
lifetime. I always find that rather odd.
214
E. Perucca
Yes, it is. On the other hand, when one has already studied a
patient on three different dosages and serum levels at each of
these dosages are available, it is easy to predict what effect a
further dosage change will produce on the serum level.
D. Lalka
Many authors are critical of free level monitoring in a general
population since for most drugs there is no convincing evidence
that measuring free drug concentration is more useful than mea-
suring total concentration. I think it is fair to say, however,
that the animal data available are encouraging enough to justify
continued exploration in this area.