Embed Size (px)
Citation preview
Dose-Response Relationships
Lesson 6
Dose & Drug Effects
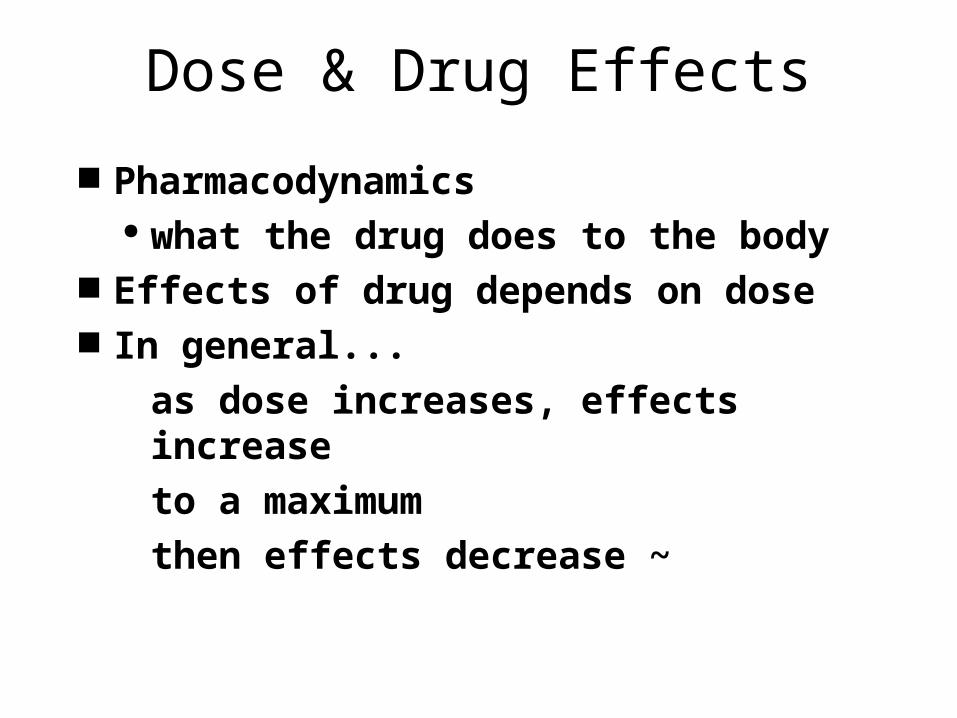
Pharmacodynamics what the drug does to the body
Effects of drug depends on dose In general...
as dose increases, effects increase
to a maximum
then effects decrease ~

Behavior
Drug amount (dose)
min
max
lo hi
Peak Effects as Function of Dose

Dose-response Relationship
Weight of individual important Dose
amount of drug per body weight mg/kg
milligrams/kilogram Helps achieve equal blood concentrations
often not tightly controlled in humans ~
Dose-response Relationship
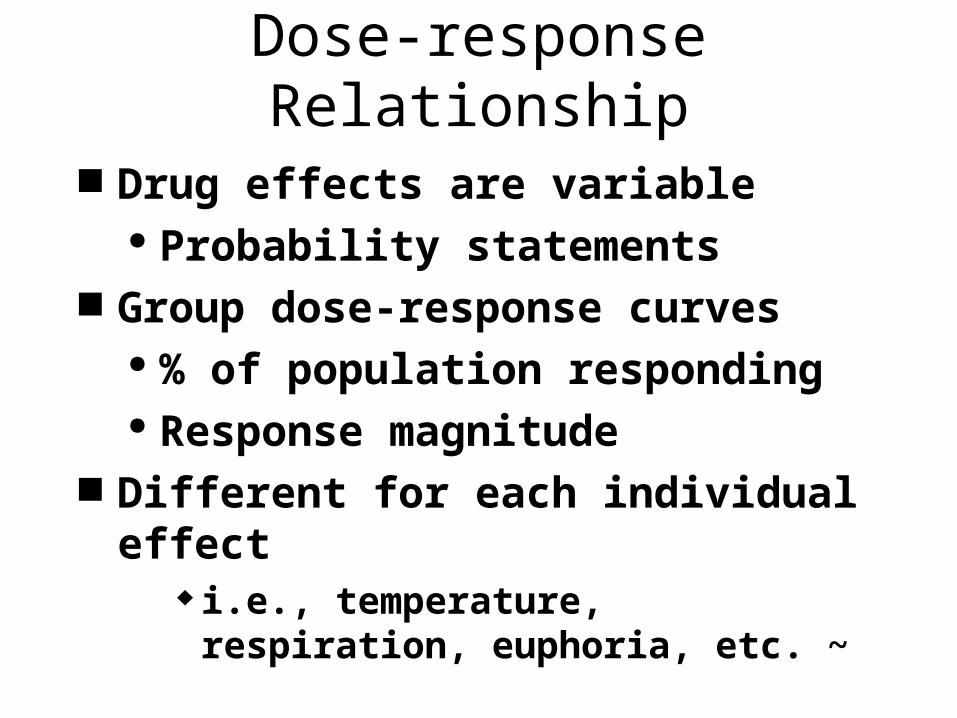
Drug effects are variable Probability statements
Group dose-response curves % of population responding Response magnitude
Different for each individual effect i.e., temperature, respiration,
euphoria, etc. ~
Percentage Responding
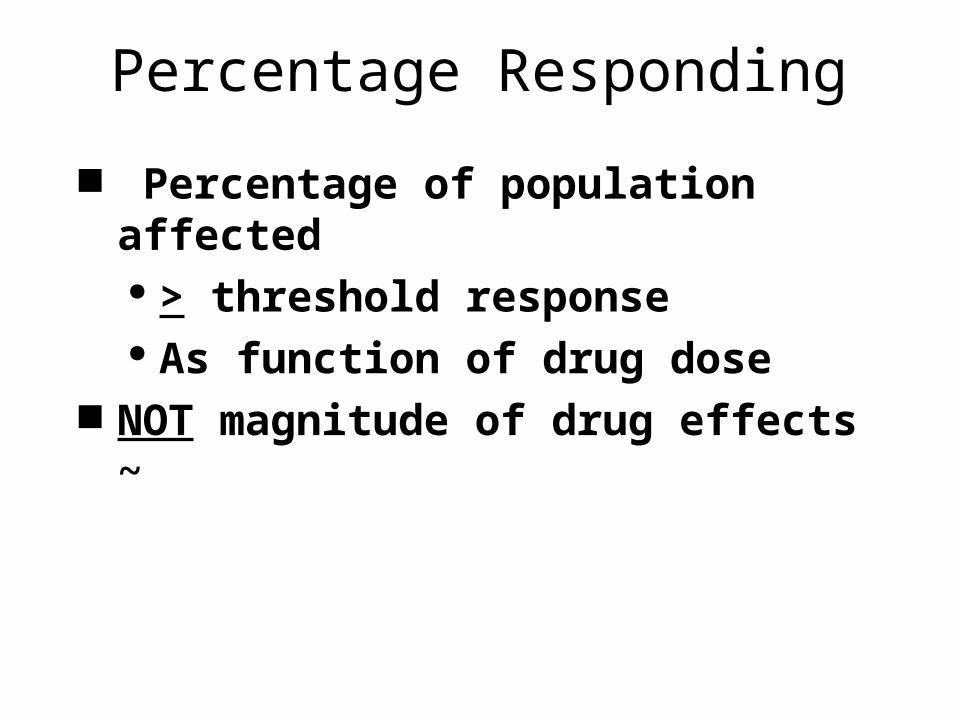
Percentage of population affected > threshold response As function of drug dose
NOT magnitude of drug effects ~
Response Magnitude
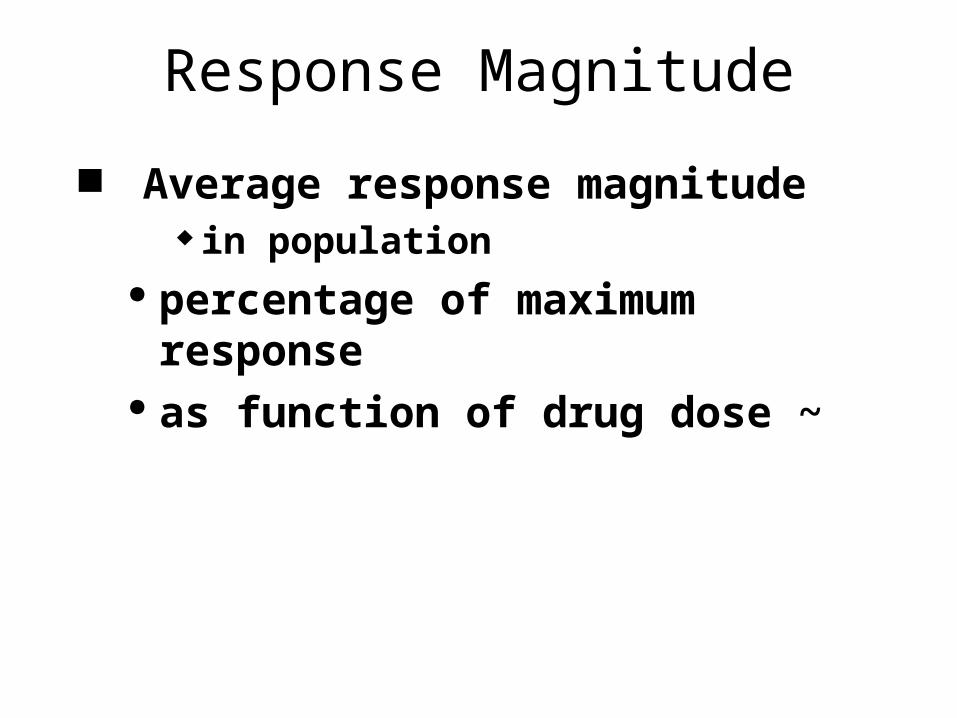
Average response magnitude in population
percentage of maximum response as function of drug dose ~
Dose-Response Curve
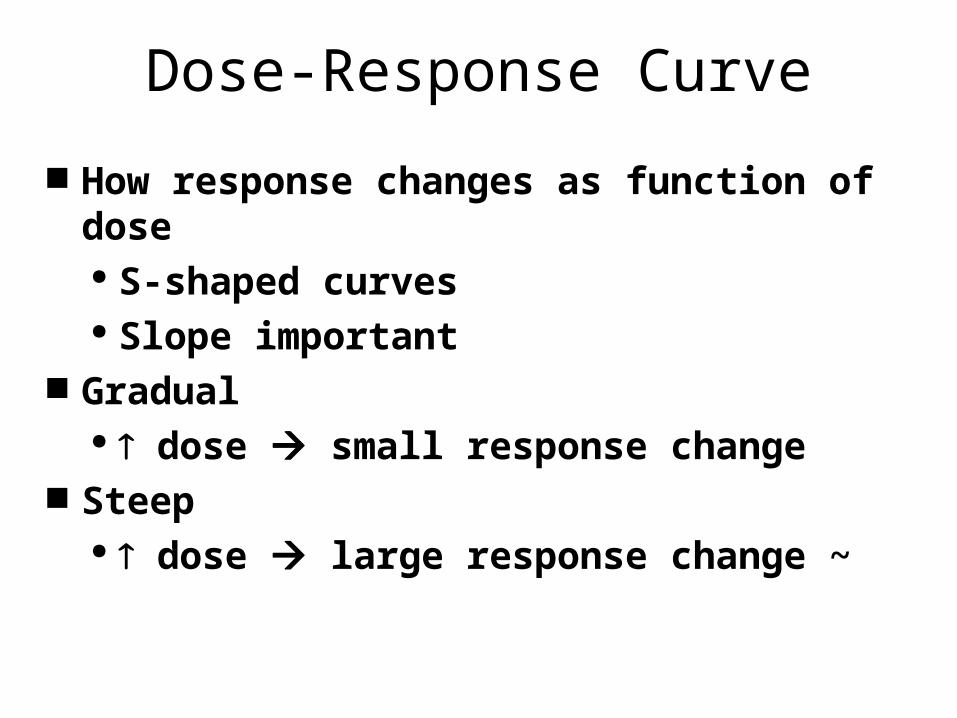
How response changes as function of dose S-shaped curves Slope important
Gradual dose small response change
Steep dose large response change ~
100
50
0
DRUG DOSE0 X
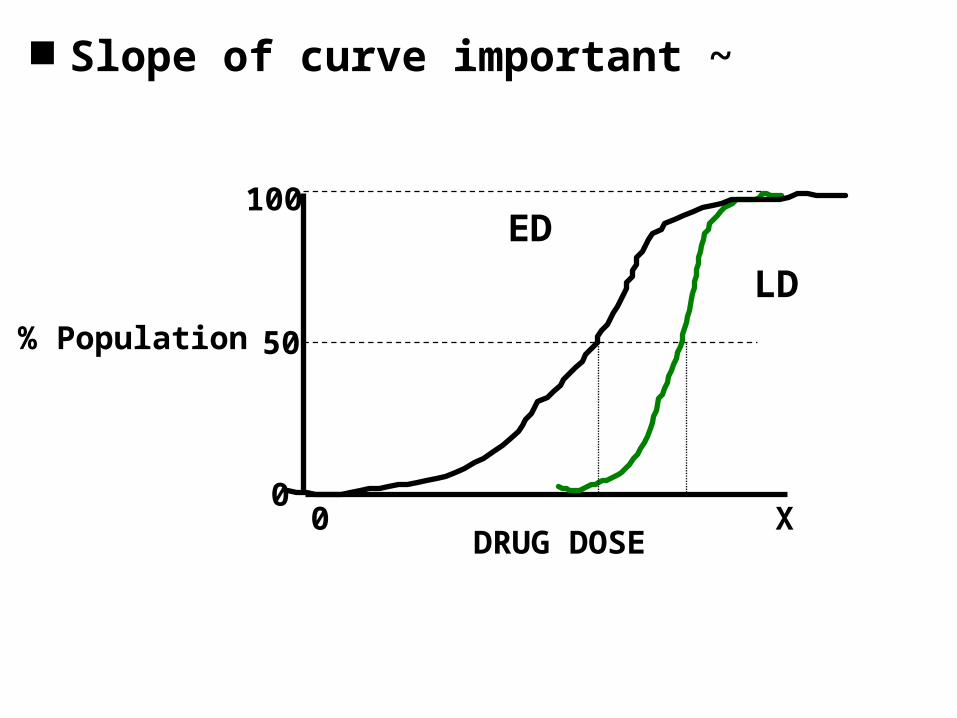
ED50
% population
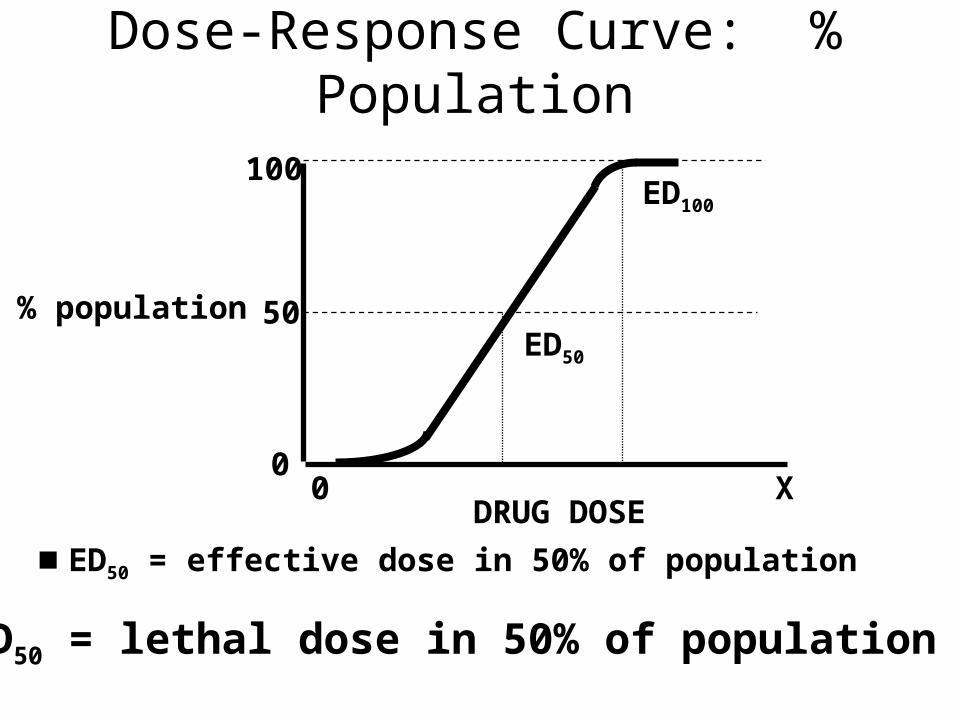
ED50 = effective dose in 50% of population
Dose-Response Curve: % Population
ED100
LD50 = lethal dose in 50% of population ~
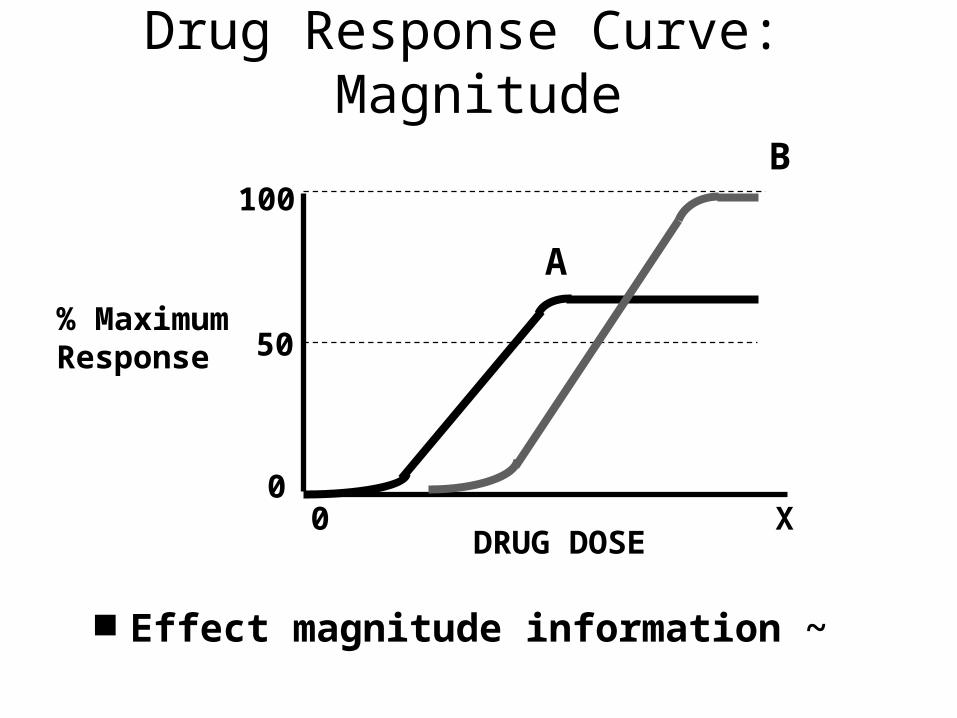
Effect magnitude information ~
% MaximumResponse
0
DRUG DOSE0 X
100
Drug Response Curve: Magnitude
A
B
50
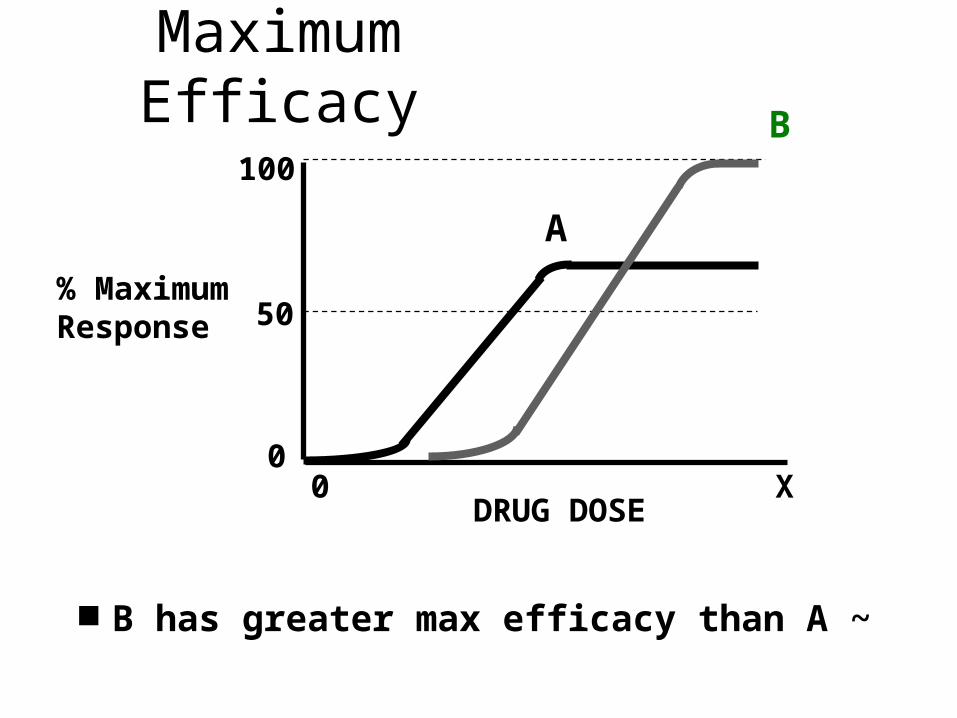
Potency vs. Efficacy
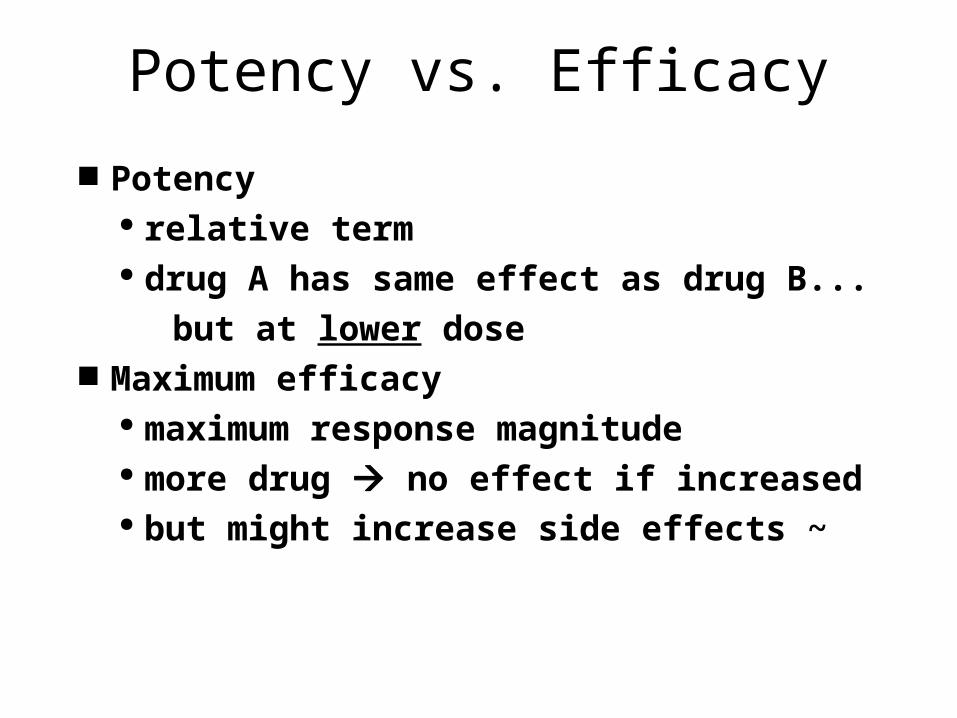
Potency relative term drug A has same effect as drug B...
but at lower dose Maximum efficacy
maximum response magnitude more drug no effect if increased but might increase side effects ~
DRUG DOSE0 X
Maximum Efficacy
B has greater max efficacy than A ~
A
B
% MaximumResponse
0
100
50

DRUG DOSE0 X
Potency
A is more potent than B ~
A
B
% MaximumResponse
0
100
50
Predicting Drug Effects
Response magnitude Dose-response Curve
represents mean from groups Predict individual’s response to
drug? Variability standard error of the mean ~
DRUG DOSE0 X
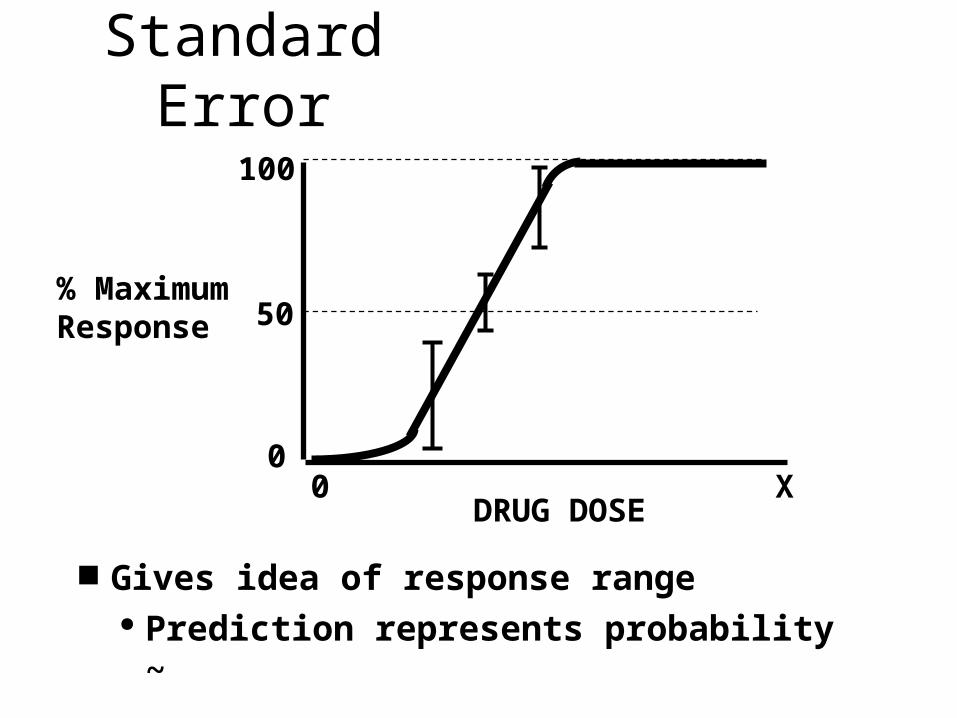
Standard Error
Gives idea of response range Prediction represents probability ~
% MaximumResponse
0
100
50

Margin of safety % population responding
Compare effective dose (ED50) to
Lethal dose (LD50)
Or toxic dose (TD50)
Therapeutic Index
TI: 10mg/10mg = 1
100mg/10mg = 10
1000mg/10mg = 100 ~
LD50
ED50

100
50
0
DRUG DOSE0 X
ED LD
% Population
TI = LD50/ ED50
Relatively safe ~

100
50
0
DRUG DOSE0 X
ED LD
% Population
TI = LD50/ ED50
Less safe drug ~
100
50
0
DRUG DOSE0 X
ED
LD
% Population
Slope of curve important ~
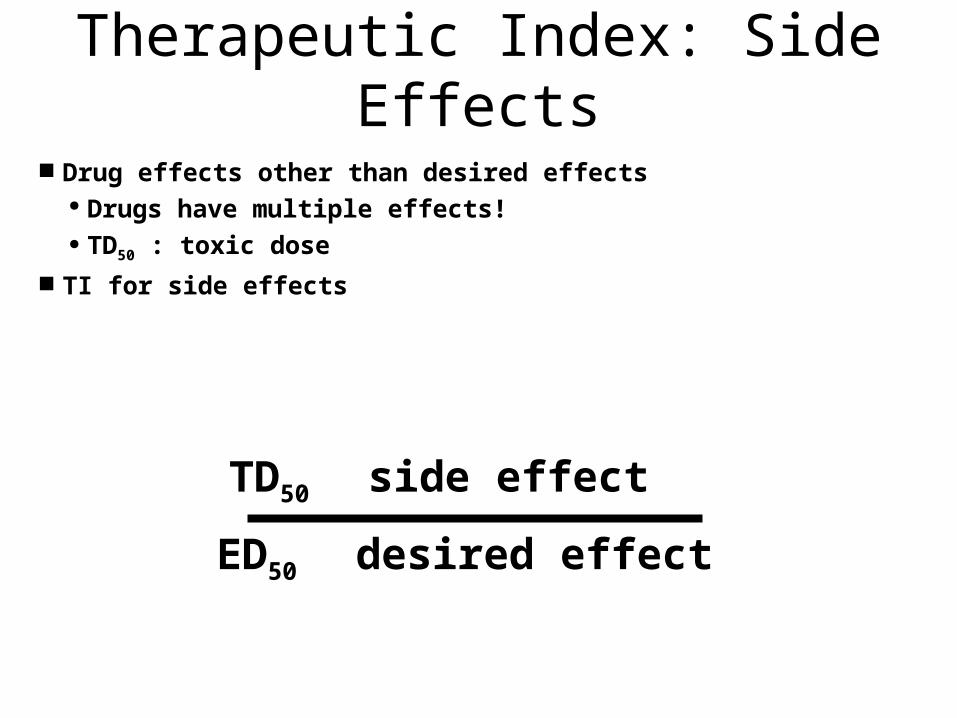
Drug effects other than desired effects Drugs have multiple effects! TD50 : toxic dose
TI for side effects
Therapeutic Index: Side Effects
TD50 side effect
ED50 desired effect

Comparing different variables same drug
100
50
0
DRUG DOSE0 X
A B
% population
sex, age, etc.
or tolerance ~


![Non-linear Pharmacokinetics Arthur G. Roberts. Linear Pharmacokinetics AUC dose K Cl dose [Drug] plasma time ln[Drug] plasma time Increasing Dose](https://img.pdfslide.net/doc/110x75/56649eb35503460f94bba929/non-linear-pharmacokinetics-arthur-g-roberts-linear-pharmacokinetics-auc.jpg)