Embed Size (px)
Citation preview
DOT/FAA/TC-13/38 Federal Aviation Administration William J. Hughes Technical Center Aviation Research Division Atlantic City International Airport New Jersey 08405
Development of Next Generation Burner Characteristics for Fire Testing of Power Plant Materials and Components April 2015 Final Report This document is available to the U.S. public through the National Technical Information Services (NTIS), Springfield, Virginia 22161. This document is also available from the Federal Aviation Administration William J. Hughes Technical Center at actlibrary.tc.faa.gov.
U.S. Department of Transportation Federal Aviation Administration
NOTICE
This document is disseminated under the sponsorship of the U.S. Department of Transportation in the interest of information exchange. The U.S. Government assumes no liability for the contents or use thereof. The U.S. Government does not endorse products or manufacturers. Trade or manufacturers’ names appear herein solely because they are considered essential to the objective of this report. The findings and conclusions in this report are those of the author(s) and do not necessarily represent the views of the funding agency. This document does not constitute FAA policy. Consult the FAA sponsoring organization listed on the Technical Documentation page as to its use. This report is available at the Federal Aviation Administration William J. Hughes Technical Center’s Full-Text Technical Reports page: actlibrary.tc.faa.gov in Adobe Acrobat portable document format (PDF).
Technical Report Documentation Page
1. Report No. DOT/FAA/TC-13/38
2. Government Accession No. 3. Recipient's Catalog No.
4. Title and Subtitle DEVELOPMENT OF NEXT GENERATION BURNER OPERATIONS SETTING FOR FIRE TESTING OF POWER PLANT COMPONENTS
5. Report Date April 2015
6. Performing Organization Code
7. Author(s) Samir Tambe, Yi-Huan Kao, and San-Mou Jeng
8. Performing Organization Report No.
9. Performing Organization Name and Address Department of Aerospace Engineering and Engineering Mechanics University of Cincinnati Cincinnati, OH 45221-0070
10. Work Unit No. (TRAIS)
11. Contract or Grant No. 10-G-003
12. Sponsoring Agency Name and Address U.S. Department of Transportation Federal Aviation Administration Aircraft Certification Service—Design, Manufacturing and Airworthiness FAA National Headquarters 950 L’Enfant Plaza, S.W. Washington DC 20024
13. Type of Report and Period Covered Final Report
14. Sponsoring Agency Code AIR-133
15. Supplementary Notes The Federal Aviation Administration William J. Hughes Technical Center Aviation Research Division Technical Monitor was Steven Summer. 16. Abstract The Next Generation (NexGen) burner is a new burner designed by the Federal Aviation Administration (FAA) William J. Hughes Technical Center for the required FAA fire certification tests on power plant components. The objective of this study is to understand the performance of this burner and provide the benchmark to adapt the burner settings for future FAA fire tests. The NexGen burner was found to satisfy the temperature and heat flux requirements under the FAA fire test guidelines. This NexGen burner was modified by adding four tabs to the turbulator in the current study and was found to result in wider and more uniform flames, which increased the burner robustness for the fire test. Calibrations of heat flux and thermocouple (TC) temperature from the NexGen burner were much more sensitive to a change in the fuel flow rate than to a change in the air flow rate. However, the fire test results on the samples were also sensitive to air flow rate. It is recommended that both the fuel and the air flow rate of the NexGen burner be regulated in future FAA fire tests. The influence of TC size on flame calibrations and fire test results was studied. The burner calibrated with the smaller TC size produced less damage on the test sample. It is recommended that the FAA have a narrower tolerance on the TC size used in the temperature calibrations. The performance of the ISO propane burner was also studied. Heat flux produced by the ISO propane burner was found to be much lower than that produced by the NexGen burner, and the damage induced by the propane burner in a horizontal orientation was significantly less than that induced by the NexGen burner. Fire tests were conducted on two different sample sizes. Smaller samples could survive longer under the same burner operating conditions. It is recommended that the sample size be specified in future FAA fire tests. This report discusses ongoing developmental efforts related to the Nexgen burner. It should be noted that the burner construction and settings discussed in this report are not representative of the most recent that are used on the Nexgen burner. For detailed construction drawings and to view other documentation and presentations that discuss the most up-to-date burner configurations, please see the FAA’s Fire Safety Branch’s website at www.fire.tc.faa.gov. 17. Key Words Fire tests, Power plant, Operation setting, Next Generation burner
18. Distribution Statement This document is available to the U.S. public through the National Technical Information Service (NTIS), Springfield, Virginia 22161. This document is also available from the Federal Aviation Administration William J. Hughes Technical Center at actlibrary.tc.faa.gov.
19. Security Classif. (of this report) Unclassified
20. Security Classif. (of this page) Unclassified
21. No. of Pages 52
22. Price
Form DOT F 1700.7 (8-72) Reproduction of completed page authorized

ACKNOWLEDGEMENTS
The authors wish to acknowledge the support of the Federal Aviation Administration William J. Hughes Technical Center.
iii/iv

TABLE OF CONTENTS
Page
EXECUTIVE SUMMARY xi
1. INTRODUCTION 1
1.1 Introduction to Fire Test 1 1.2 Approved Burner 2 1.3 Burner Calibration 2 1.4 Issue With TC Temperature Measurement in a High Temperature Environment 31.5 Objective 4
2. EXPERIMENT SETUP 5
2.1 NexGen Burner Configuration 5 2.2 Propane Burner Configuration 6 2.3 Calibration Stand: NexGen Burner 7 2.4 Calibration Stand: Propane Burner 10 2.5 Fire Test Setup 12
3. RESULTS AND DISCUSSION—CALIBRATIONS 13
3.1 Calibration for NexGen Burner 13
3.1.1 Influence of the Turbulator 13 3.1.2 Influence of TC Size 15 3.1.3 Burner Sensitivity to Fuel Flow 16 3.1.4 Burner Sensitivity to Air Flow 17 3.1.5 Burner Sensitivity to Total Flow Rate 21
3.2 Calibration for Propane Burner 25
3.2.1 Burner Sensitivity to Fuel Flow 25 3.2.2 Influence of Mixing/Cooling Air Ratio 27
4. RESULTS AND DISCUSSION—FIRE TEST 29
4.1 Fire Tests for NexGen Burner 29
4.1.1 Results of Fire Tests on Sample Plates: Effect of Air Flow 30 4.1.2 Results of Fire Tests on Sample Plates: Effect of Sample Plate Size 34 4.1.3 Results of Fire Tests on Sample Plates: Effect of TC Size 36
4.2 Fire Tests for Propane Burner 37
v

5. CONCLUSION 39 6. REFERENCES 40
vi
LIST OF FIGURES
Figure Page 1 Energy Balance on TCs 3
2 Configuration of NexGen Burner 5
3 Modified Monarch F-124 Turbulator With Four Tabs 6
4 Configuration of Propane Burner 7
5 Relative Location of TCs to NexGen Burner 8
6 Baseline TC and Smaller TC 8
7 Relative Location of Copper Tube as Heat Transfer Device to NexGen Burner 9
8 Simultaneous Heat Flux and Temperature Calibration for NexGen Burner 9
9 Relative Locations of TCs to Propane Burner 10
10 Relative Location of Copper Tube to Propane Burner 11
11 Simultaneous Heat Flux and Temperature Calibration for Propane Burner 11
12 Fire Test Setup for NexGen Burner 12
13 Fire Test Setup for Propane Burner 12
14 4″ x 4″ Test Sample With 3″ x 3″ Exposure Area and TCs Installed 13
15 Flame Produced by NexGen Burner With Original Turbulator and Modified Turbulator 14
16 Temperature Distribution: Original Turbulator vs. Modified Turbulator 14
17 Temperature vs. Jet-A Mass Flow Rate 16
18 Heat Flux vs. Jet-A Mass Flow Rate 17
19 Heat Flux vs. Air Mass Flow Rate 19
20 Temperature vs. Air Mass Flow Rate 19
21 Terror vs. Equivalence Ratio for Air Sensitivity Study 20
22 Temperature vs. Total Mass Flow Rate at Different Flow Rates 22
23 Heat Flux vs. Total Mass Flow Rate at Different Flow Rates 23
24 Temperature vs. Propane Mass Flow Rate 26
25 Heat Flux vs. Propane Mass Flow Rate 26
26 Temperature vs. Mixing/Cooling Air Ratio 28
27 Heat Flux vs. Mixing/Cooling Air Ratio 28
28 Temperature Profile for Different Air Settings on Type A Sample—Part 1 30
29 Temperature Profile for Different Air Settings on Type A Sample—Part 2 31
vii
30 Type A Test Samples After 17-Minute Fire Test 31
31 Temperature Profile for Different Air Settings on Type B Sample—Part 1 34
32 Temperature Profile for Different Air Settings on Type B Sample—Part 2 35
33 Type B Test Samples After 10-Minute Fire Test 35
34 Temperature Profile for Different Test Sample Sizes at Baseline Condition 36
35 Temperature Profile for Different TCs Used During Calibration Process 37
36 Type B Test Samples After 10-Minute Fire Tests Calibrated by Different TCs 37
37 Temperature Profile for NexGen and Propane Burners on Type B Test Sample 39
38 Test Sample After 20 Minutes of Propane Burner Operation 39
viii
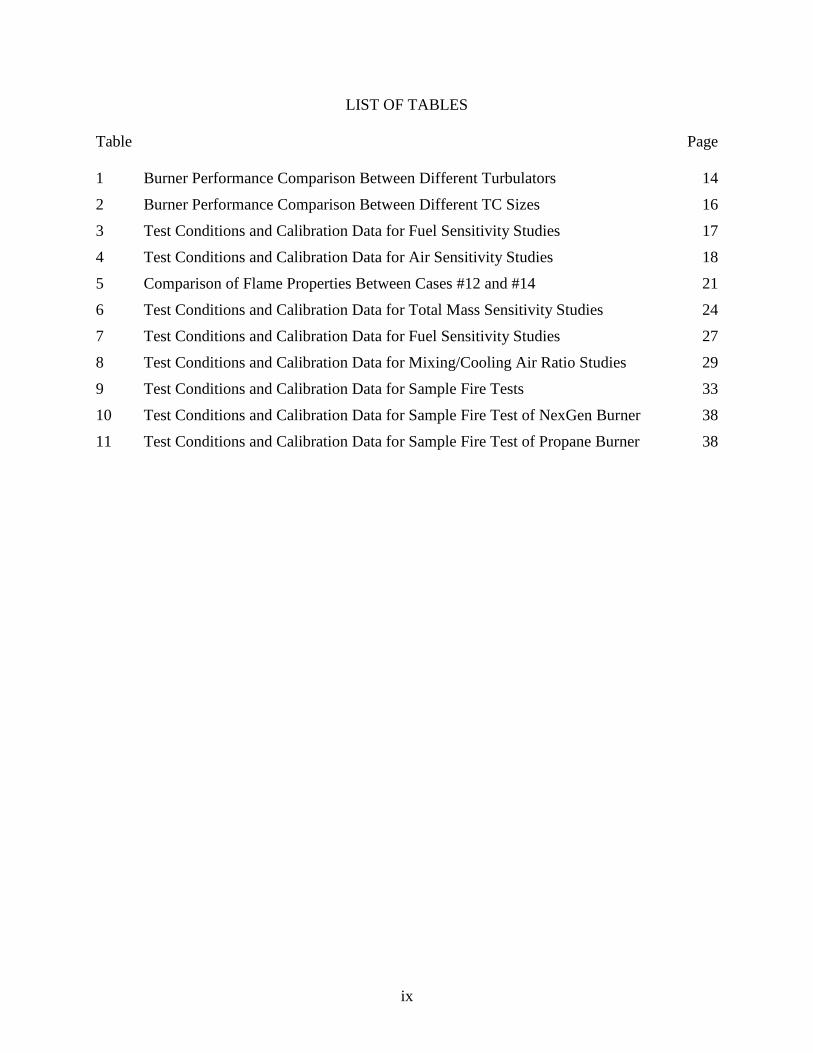
LIST OF TABLES
Table Page 1 Burner Performance Comparison Between Different Turbulators 14
2 Burner Performance Comparison Between Different TC Sizes 16
3 Test Conditions and Calibration Data for Fuel Sensitivity Studies 17
4 Test Conditions and Calibration Data for Air Sensitivity Studies 18
5 Comparison of Flame Properties Between Cases #12 and #14 21
6 Test Conditions and Calibration Data for Total Mass Sensitivity Studies 24
7 Test Conditions and Calibration Data for Fuel Sensitivity Studies 27
8 Test Conditions and Calibration Data for Mixing/Cooling Air Ratio Studies 29
9 Test Conditions and Calibration Data for Sample Fire Tests 33
10 Test Conditions and Calibration Data for Sample Fire Test of NexGen Burner 38
11 Test Conditions and Calibration Data for Sample Fire Test of Propane Burner 38
ix
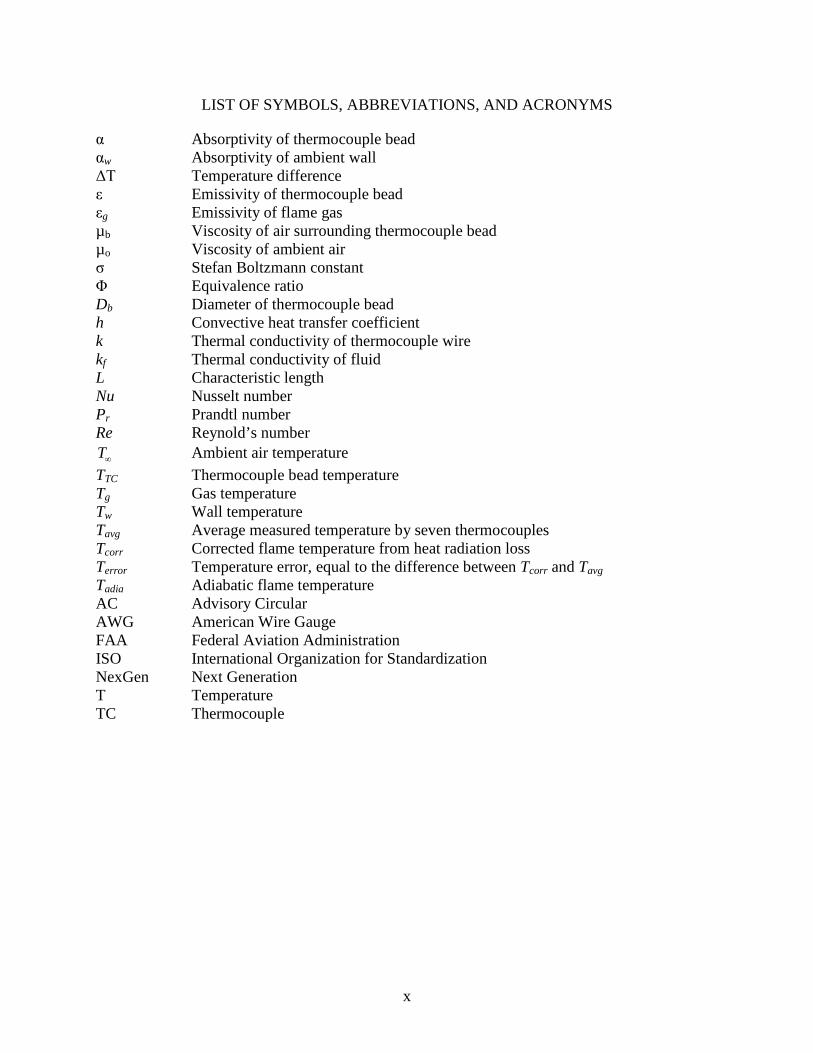
LIST OF SYMBOLS, ABBREVIATIONS, AND ACRONYMS
α Absorptivity of thermocouple bead αw Absorptivity of ambient wall ΔT Temperature difference ε Emissivity of thermocouple bead εg Emissivity of flame gas µb Viscosity of air surrounding thermocouple bead µo Viscosity of ambient air σ Stefan Boltzmann constant Φ Equivalence ratio Db Diameter of thermocouple bead h Convective heat transfer coefficient k Thermal conductivity of thermocouple wire kf Thermal conductivity of fluid L Characteristic length Nu Nusselt number Pr Prandtl number Re Reynold’s number T∞ Ambient air temperature TTC Thermocouple bead temperature Tg Gas temperature Tw Wall temperature Tavg Average measured temperature by seven thermocouples Tcorr Corrected flame temperature from heat radiation loss Terror Temperature error, equal to the difference between Tcorr and Tavg Tadia Adiabatic flame temperature AC Advisory Circular AWG American Wire Gauge FAA Federal Aviation Administration ISO International Organization for Standardization NexGen Next Generation T Temperature TC Thermocouple
x
EXECUTIVE SUMMARY
The Next Generation (NexGen) burner is a new burner being developed by the Federal Aviation Administration (FAA) William J. Hughes Technical Center to replace older technology burners currently in use for demonstrating that power plant installation and system materials and components meet FAA fire certification requirements. This report documents the results of developmental studies needed to understand the performance of this burner and provide necessary data to adapt the burner settings for future FAA fire tests. The NexGen burner was found to satisfy the temperature and heat flux requirements defined in FAA Advisory Circular 20-135. Results from the current study, showed the NexGen burner performance could be enhanced by modifying the burner to add four tabs to the turbulator, resulting in flames that were wider and more uniform. This modification improved the burner performance for use in powerplant installation fire testing. Results showed the methods used to measure burner performance can produce variability in the measured burner heat flux. Calibrations of heat flux and thermocouple (TC) temperature from the NexGen burner were much more sensitive to a change in the fuel flow rate than to a change in the air flow rate. However, the fire test results on the samples were also sensitive to air flow rate. It is recommended that both the fuel and the air flow rate of the NexGen burner be regulated in future FAA fire tests. The influence of TC size on flame calibrations and fire test results was studied. The burner calibrated with the smaller TC size produced less damage on the test sample. It is recommended that the FAA have a narrower tolerance on the TC size used in the temperature calibrations. The performance of the International Organization for Standardization (ISO) propane burner was also studied. Heat flux produced by the ISO propane burner was found to be much lower than that produced by the NexGen burner, and the damage induced by the propane burner in a horizontal orientation was significantly less than that induced by the NexGen burner. Fire tests were conducted on two different sample sizes. Smaller samples could survive longer under the same burner operating conditions. It is recommended that the sample size be specified in future FAA fire tests.
This report discusses ongoing developmental efforts related to the Nexgen burner. It should be noted that the burner construction and settings discussed in this report are not representative of the most recent that are used on the Nexgen burner. For detailed construction drawings and to view other documentation and presentations that discuss the most up-to-date burner configurations, please see the FAA’s Fire Safety Branch’s website at www.fire.tc.faa.gov.
xi/xii
1. INTRODUCTION
1.1 INTRODUCTION TO FIRE TEST
For fire safety reasons, the Federal Aviation Administration (FAA) established requirements to ensure that critical parts and components in aircraft and engine installations affected by fire are able to function effectively to permit safe engine shutdown. There are three ways to establish the fireworthiness of a materials or component. The first method involves the use of materials that are considered fireproof by nature and, thus, components manufactured from these materials can be claimed as fireproof by definition.1 The second method used to rate a material or component is by comparison. If the properties of a component are similar to an existing certified component, then it can be claimed that it has the same fireproof or fire resistant capability. If a component cannot be shown to be fireproof or fire resistant by the above-mentioned methods, then the applicant must show that the material or component meet fireproof and fire resistant capabilities established by the FAA as a means of compliance in AC20-135. Conducting a certification fire test is the most common way to demonstrate the fireproof and fire resistant properties of materials and components. The FAA has established criteria for showing that a component was subjected to a flame from an FAA-approved burner operated for a specific amount of time and was exposed to conditions that simulate the installed loading, vibration and environmental conditions. The condition of the material or component at the end of the test in combination with an analysis of the installed configuration is used to establish whether fire resistance or fireproof criteria have been met. Analysis of the installed configuration is needed in cases where the entire component cannot be exposed to the test flame, or when it is impractical to simulate the installed loading, vibration and environmental conditions. However, the fire-resistance limit of a tested material is always related to the surface temperature of the test sample, which is dominated by flame temperature, and the initial thermal response of a tested material is typically determined by applied heat flux. Therefore, the flame temperature and heat flux produced by the burner have to be calibrated at the given test location as specifically defined by the FAA documents to ensure that the fire test environment is qualified to simulate a severe real life condition that could affect an aircraft engine. The test sample has to be exposed to the flame, which needs to be calibrated by approved instrumentation before and after the fire test to ensure the repeatability of measurement and test results. The flame properties should be consistent throughout the fire test and should not be changed by adjusting burner operating conditions. The components that are used on an aircraft engine, the engine nacelle, and the supporting framework of the engine form a class of components (called power plant components) that have their own set of standards for fireworthiness ratings. These requirements were reported in International Organization for Standardization (ISO) 2685 [1] and Advisory Circular (AC) 20-135 [2] as two major standards for FAA fire tests. The specifications laid out in these two documents are very similar, although there are a few notable differences.
1 14 CFR Part 1 provides the definition of fireproof and fire resist.
1
1.2 APPROVED BURNER
The FAA 3A report [3] lists several different oil-fueled burners that have been approved for fire tests on the power plant components. AC20-135 refers to the FAA 3A report for a list of approved burners. The oil burners listed in the FAA 3A report are no longer in production, so the FAA is developing a new replacement burner for fire testing of powerplant materials and components. The new burner, commonly known as the NexGen burner, is based upon technology used in burners previously approved for use on a class of fire tests used for seat cushion materials and fuselage burn through requirements. The FAA William J. Hughes Technical Center is now working on adapting this burner for use in fire tests for power plant materials and components. The work presently being conducted is a part of the effort to ensure that this burner meets performance standards and can produce consistent fire test results. 1.3 BURNER CALIBRATION
Two properties of the flame induced by the burner must be calibrated: flame temperature and heat flux. The flame temperature calibration is conducted through a rake of 7 thermocouples (TC) with an exposed bead TC, which is listed in both documents. However, there is no clear agreement on the size of TCs. AC20-135 indicates an allowable size range of 1.59-mm- (1/16-inch-) to 3.18-mm- (1/8-inch-) sheath diameters, whereas ISO2685 states that the TC sheath diameter should be ≤3 mm (0.12 inch). Another difference in calibration requirements between the two documents involves the measured temperatures. ISO2685 indicates that the temperature of each TC must reach 1100±80°C (2012±144°F) and AC20-135 requires that the temperature of each TC be within 1093±83°C (2000±150°F). However, the average temperature of 7 TCs should be higher than 1093°C (2000°F) as imposed by AC33.17-1, which is the complement of AC20-135 [4]. Two different instruments are specified for use in heat flux calibration: The first instrument is a calorimeter, which can be used to directly measure the heat flux at a given location in the flame; the second instrument is a heat transfer tube, the location of which is specified in the documents. Water moves at a constant flow rate through the tube, and the heat capacity of the burner causes the water temperature to rise at the outlet of the heat transfer tube. The heat flux of the flame can be calculated from the amount of heat absorbed by the water, as obtained by the temperature rise across the heat transfer tube and the surface area of the tube exposed to the flame. There is a difference between the heat flux requirements of the flame in the two documents. The ISO2685 document states that the heat flux should be in the range of 116±10 kW/m2 (11.05 BTU/ft2-sec). AC20-135 indicates only the minimum heat flux requirement of 106 kW/m2 (9.3 BTU/ft2-sec).
2

1.4 ISSUE WITH TC TEMPERATURE MEASUREMENT IN A HIGH TEMPERATURE ENVIRONMENT
Both ISO-2685 and AC20-135 indicate that flame temperature must be measured by TCs for calibration purposes. However, an inevitable temperature error exists between the true flame temperature and the temperature reading by the TC. The TC is not adiabatic and has prominent surface radiation heat loss that increases as the fourth power of the bead temperature. The measured temperature by the TC is actually lower than the true flame temperature and the difference between these two temperatures increases as the heat radiation loss increases. This temperature loss may also depend on the TC bead size because the thermal radiation is a function of surface area as well. Measuring the true flame temperature and evaluating the temperature difference is a challenging task. According to Blevins’ model [5], the error percentage in the measured temperature for a bare bead TC with diameter Db = 1 mm, emissivity ε = 0.8, and external flow velocity U = 0.5 m/s could reach to 20% while gas temperature Tg = 1400K and ambient temperature T∞ = 300K. According to Blevin’s other paper [6], the temperature error could reach 340°C if the TC diameter changes to 1.5 mm, and the remaining properties stay the same while the gas temperature Tg = 1127°C (1400K) and ambient temperature T∞ = 27°C (300K). The energy balance on the TC bead is a combination of heat conduction between the bead and wire including the support; heat convection between the bead and flame gas; and heat radiation between the bead, flame, and ambient wall, as shown in figure 1.
Figure 1. Energy Balance on TCs The energy balance equation could be expressed as:
( ) ( ) ( )4 44 44 4 4 0g TC TC w w TC g gd dT hk T T T T T Tdx dx D D D
σ σ + − − ε −α − α − ε =
(1)
Convection
Bare bead
Conduction Radiation
Support
Exposed wire
3
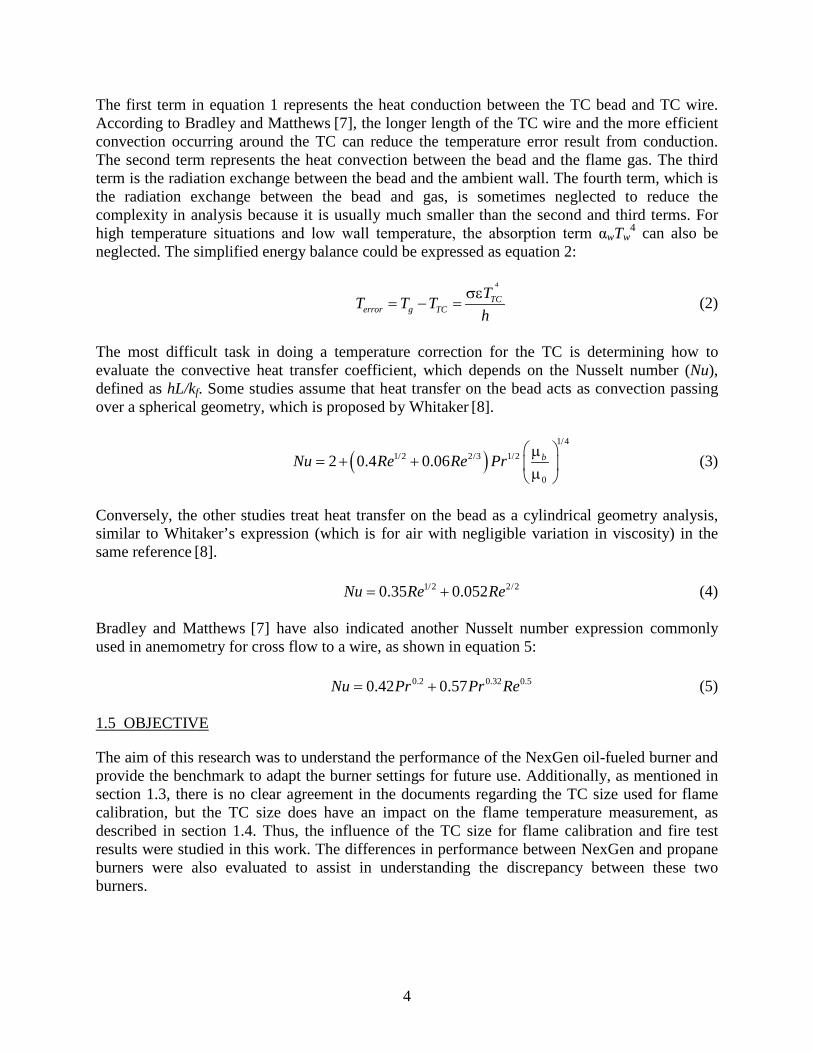
The first term in equation 1 represents the heat conduction between the TC bead and TC wire. According to Bradley and Matthews [7], the longer length of the TC wire and the more efficient convection occurring around the TC can reduce the temperature error result from conduction. The second term represents the heat convection between the bead and the flame gas. The third term is the radiation exchange between the bead and the ambient wall. The fourth term, which is the radiation exchange between the bead and gas, is sometimes neglected to reduce the complexity in analysis because it is usually much smaller than the second and third terms. For high temperature situations and low wall temperature, the absorption term αwTw
4 can also be neglected. The simplified energy balance could be expressed as equation 2:
4
TCerror g TC
TT T Th
σε= − = (2)
The most difficult task in doing a temperature correction for the TC is determining how to evaluate the convective heat transfer coefficient, which depends on the Nusselt number (Nu), defined as hL/kf. Some studies assume that heat transfer on the bead acts as convection passing over a spherical geometry, which is proposed by Whitaker [8].
( )1/4
1/2 2/3 1/2
0
2 0.4 0.06 bNu Re Re Pr µ
= + + µ (3)
Conversely, the other studies treat heat transfer on the bead as a cylindrical geometry analysis, similar to Whitaker’s expression (which is for air with negligible variation in viscosity) in the same reference [8]. 1/2 2/20.35 0.052Nu Re Re= + (4) Bradley and Matthews [7] have also indicated another Nusselt number expression commonly used in anemometry for cross flow to a wire, as shown in equation 5: 0.2 0.32 0.50.42 0.57Nu Pr Pr Re= + (5) 1.5 OBJECTIVE
The aim of this research was to understand the performance of the NexGen oil-fueled burner and provide the benchmark to adapt the burner settings for future use. Additionally, as mentioned in section 1.3, there is no clear agreement in the documents regarding the TC size used for flame calibration, but the TC size does have an impact on the flame temperature measurement, as described in section 1.4. Thus, the influence of the TC size for flame calibration and fire test results were studied in this work. The differences in performance between NexGen and propane burners were also evaluated to assist in understanding the discrepancy between these two burners.
4
2. EXPERIMENT SETUP
The two burner arrangements and their associated temperatures, as well as heat flux calibration hardware and processes, are described in this section, followed by the descriptions of the test sample setup. 2.1 NEXGEN BURNER CONFIGURATION
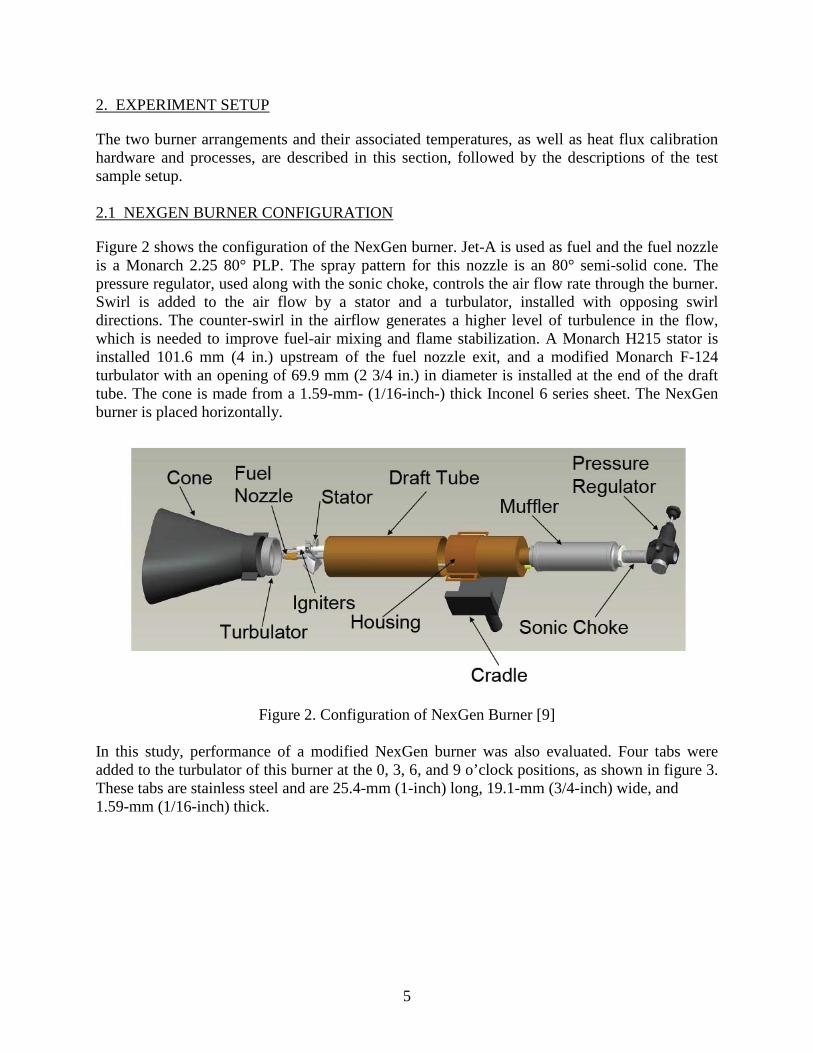
Figure 2 shows the configuration of the NexGen burner. Jet-A is used as fuel and the fuel nozzle is a Monarch 2.25 80° PLP. The spray pattern for this nozzle is an 80° semi-solid cone. The pressure regulator, used along with the sonic choke, controls the air flow rate through the burner. Swirl is added to the air flow by a stator and a turbulator, installed with opposing swirl directions. The counter-swirl in the airflow generates a higher level of turbulence in the flow, which is needed to improve fuel-air mixing and flame stabilization. A Monarch H215 stator is installed 101.6 mm (4 in.) upstream of the fuel nozzle exit, and a modified Monarch F-124 turbulator with an opening of 69.9 mm (2 3/4 in.) in diameter is installed at the end of the draft tube. The cone is made from a 1.59-mm- (1/16-inch-) thick Inconel 6 series sheet. The NexGen burner is placed horizontally.
Figure 2. Configuration of NexGen Burner [9] In this study, performance of a modified NexGen burner was also evaluated. Four tabs were added to the turbulator of this burner at the 0, 3, 6, and 9 o’clock positions, as shown in figure 3. These tabs are stainless steel and are 25.4-mm (1-inch) long, 19.1-mm (3/4-inch) wide, and 1.59-mm (1/16-inch) thick.
5

Figure 3. Modified Monarch F-124 Turbulator With Four Tabs 2.2 PROPANE BURNER CONFIGURATION
Figure 4 shows the propane burner configuration. Basically, air and gas fuel are mixed at the upstream of the burner, then the mixture goes through 3.18-mm (1/8-inch) copper tubes with a 1.8-mm (0.07-inch) bore. Cooling air (called secondary air) passes through a 2.6-mm (0.102-inch) air channel to cool the burner hardware and to maintain burner performance. Propane is used as fuel. The propane burner is placed horizontally to compare it with the performance of the NexGen burner.
6
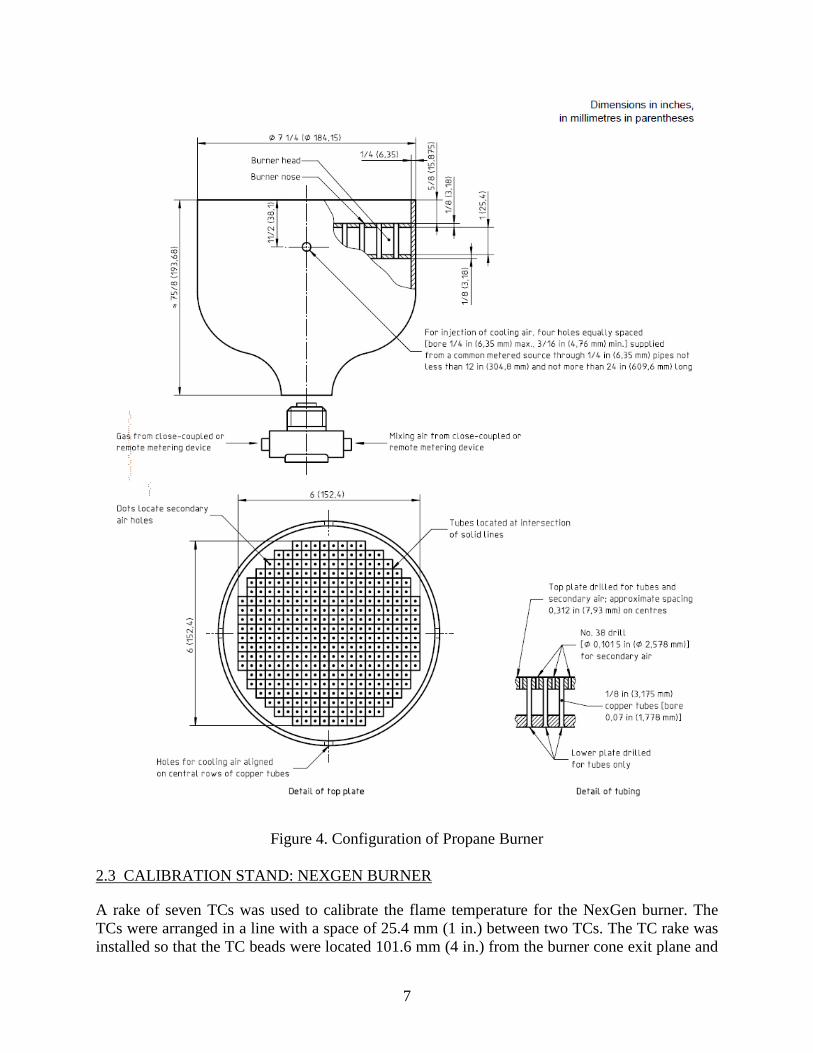
Figure 4. Configuration of Propane Burner 2.3 CALIBRATION STAND: NEXGEN BURNER
A rake of seven TCs was used to calibrate the flame temperature for the NexGen burner. The TCs were arranged in a line with a space of 25.4 mm (1 in.) between two TCs. The TC rake was installed so that the TC beads were located 101.6 mm (4 in.) from the burner cone exit plane and
7
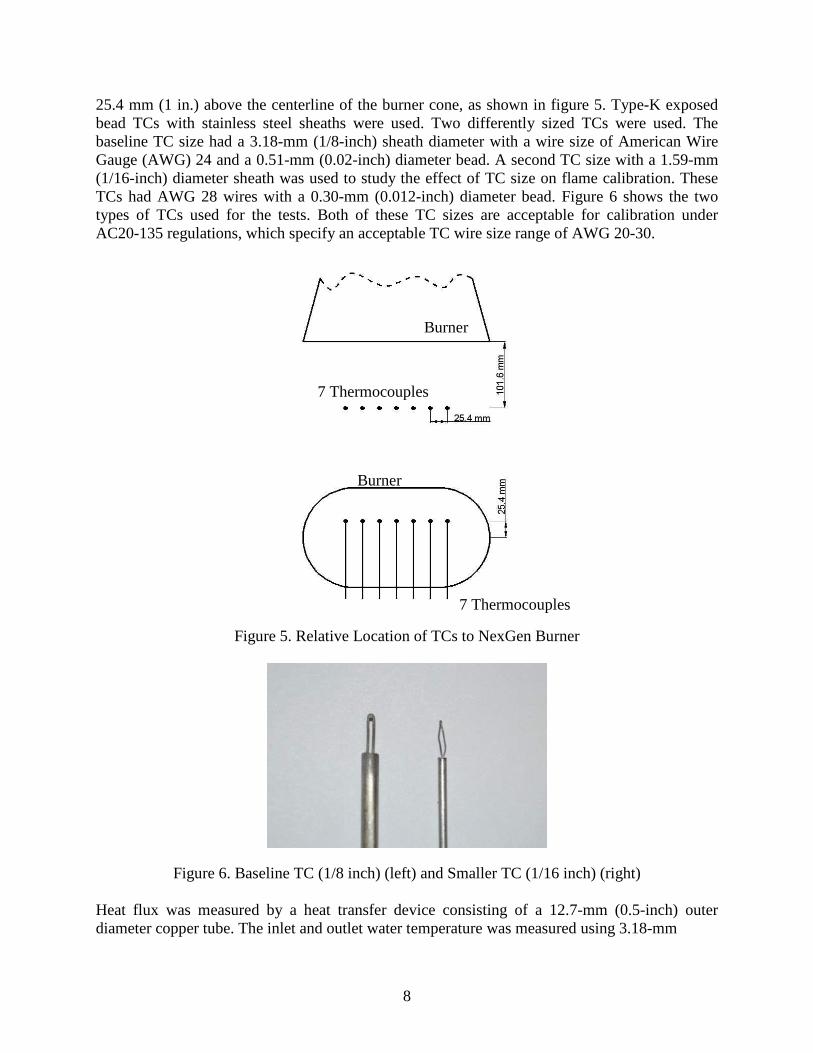
25.4 mm (1 in.) above the centerline of the burner cone, as shown in figure 5. Type-K exposed bead TCs with stainless steel sheaths were used. Two differently sized TCs were used. The baseline TC size had a 3.18-mm (1/8-inch) sheath diameter with a wire size of American Wire Gauge (AWG) 24 and a 0.51-mm (0.02-inch) diameter bead. A second TC size with a 1.59-mm (1/16-inch) diameter sheath was used to study the effect of TC size on flame calibration. These TCs had AWG 28 wires with a 0.30-mm (0.012-inch) diameter bead. Figure 6 shows the two types of TCs used for the tests. Both of these TC sizes are acceptable for calibration under AC20-135 regulations, which specify an acceptable TC wire size range of AWG 20-30.
Figure 5. Relative Location of TCs to NexGen Burner
Figure 6. Baseline TC (1/8 inch) (left) and Smaller TC (1/16 inch) (right) Heat flux was measured by a heat transfer device consisting of a 12.7-mm (0.5-inch) outer diameter copper tube. The inlet and outlet water temperature was measured using 3.18-mm
Burner
Burner
7 Thermocouples
7 Thermocouples
8
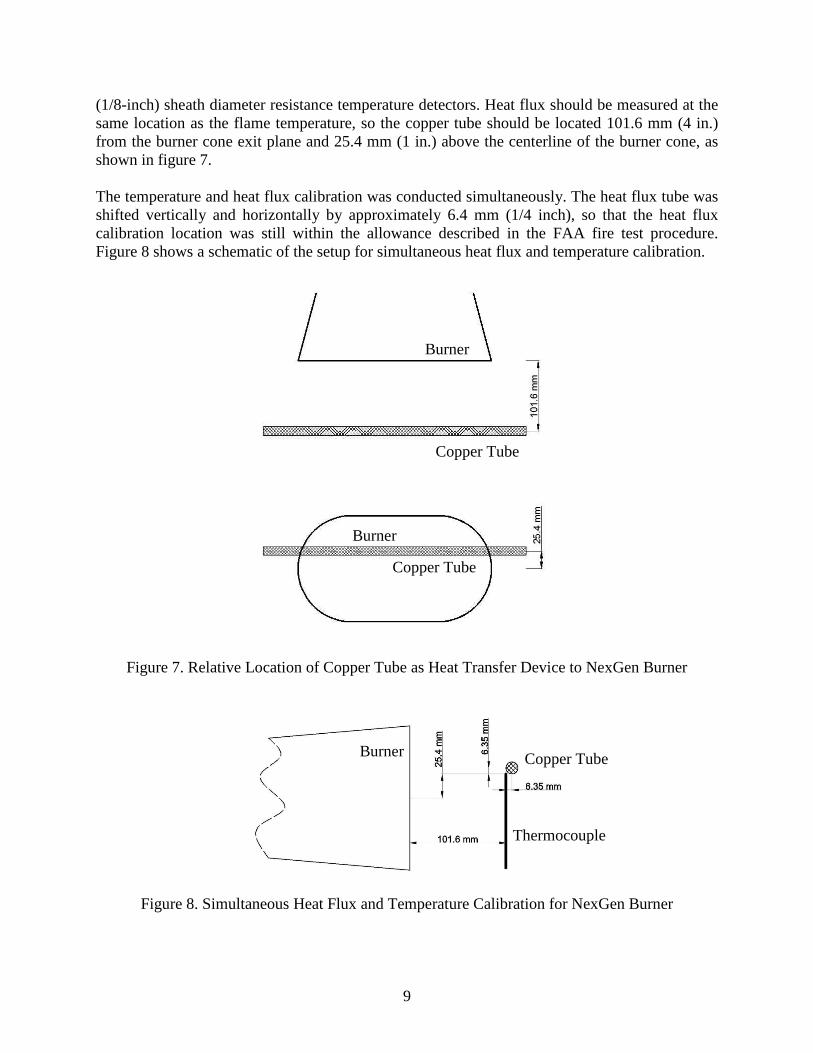
(1/8-inch) sheath diameter resistance temperature detectors. Heat flux should be measured at the same location as the flame temperature, so the copper tube should be located 101.6 mm (4 in.) from the burner cone exit plane and 25.4 mm (1 in.) above the centerline of the burner cone, as shown in figure 7. The temperature and heat flux calibration was conducted simultaneously. The heat flux tube was shifted vertically and horizontally by approximately 6.4 mm (1/4 inch), so that the heat flux calibration location was still within the allowance described in the FAA fire test procedure. Figure 8 shows a schematic of the setup for simultaneous heat flux and temperature calibration.
Figure 7. Relative Location of Copper Tube as Heat Transfer Device to NexGen Burner
Figure 8. Simultaneous Heat Flux and Temperature Calibration for NexGen Burner
Burner
Copper Tube
Burner
Copper Tube
Burner Copper Tube
Thermocouple
9
2.4 CALIBRATION STAND: PROPANE BURNER
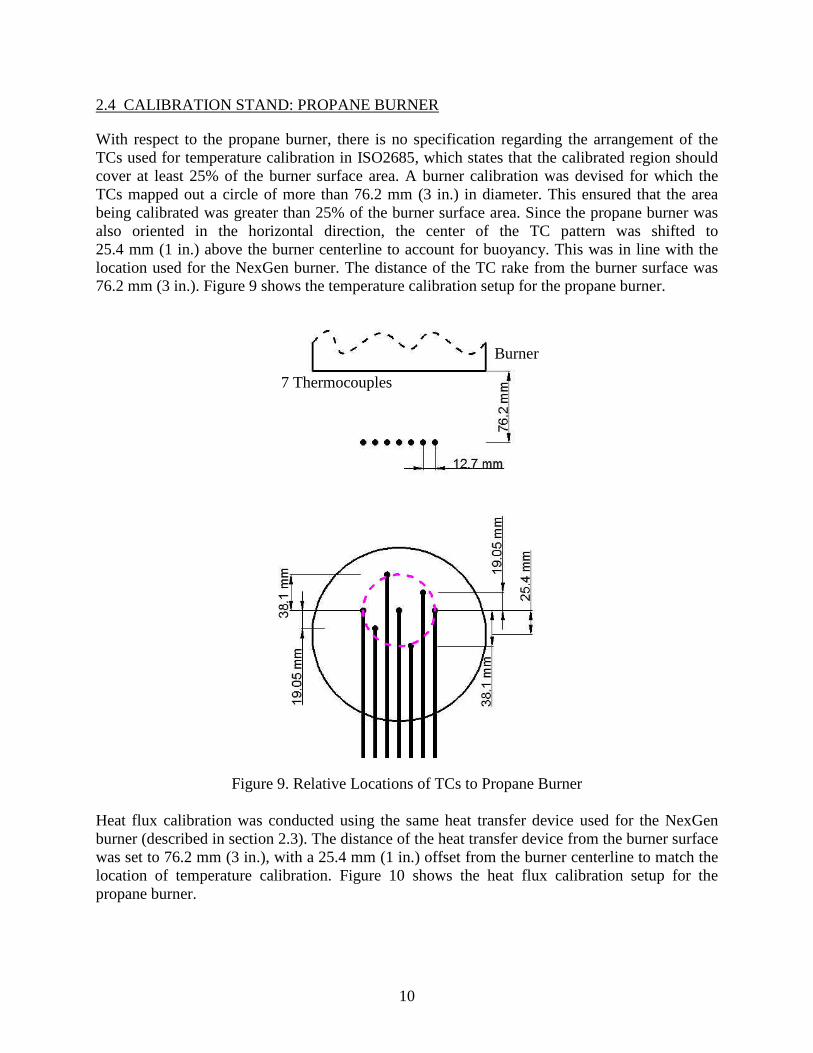
With respect to the propane burner, there is no specification regarding the arrangement of the TCs used for temperature calibration in ISO2685, which states that the calibrated region should cover at least 25% of the burner surface area. A burner calibration was devised for which the TCs mapped out a circle of more than 76.2 mm (3 in.) in diameter. This ensured that the area being calibrated was greater than 25% of the burner surface area. Since the propane burner was also oriented in the horizontal direction, the center of the TC pattern was shifted to 25.4 mm (1 in.) above the burner centerline to account for buoyancy. This was in line with the location used for the NexGen burner. The distance of the TC rake from the burner surface was 76.2 mm (3 in.). Figure 9 shows the temperature calibration setup for the propane burner.
Figure 9. Relative Locations of TCs to Propane Burner Heat flux calibration was conducted using the same heat transfer device used for the NexGen burner (described in section 2.3). The distance of the heat transfer device from the burner surface was set to 76.2 mm (3 in.), with a 25.4 mm (1 in.) offset from the burner centerline to match the location of temperature calibration. Figure 10 shows the heat flux calibration setup for the propane burner.
Burner
7 Thermocouples
10

Similar to the setup for the NexGen burner, the temperature and heat flux measurements were conducted simultaneously for the propane burner, as shown in figure 11.
Figure 10. Relative Location of Copper Tube to Propane Burner
Figure 11. Simultaneous Heat Flux and Temperature Calibration for Propane Burner
Burner
Copper Tube
Burner
Thermocouple
Copper Tube
11
2.5 FIRE TEST SETUP
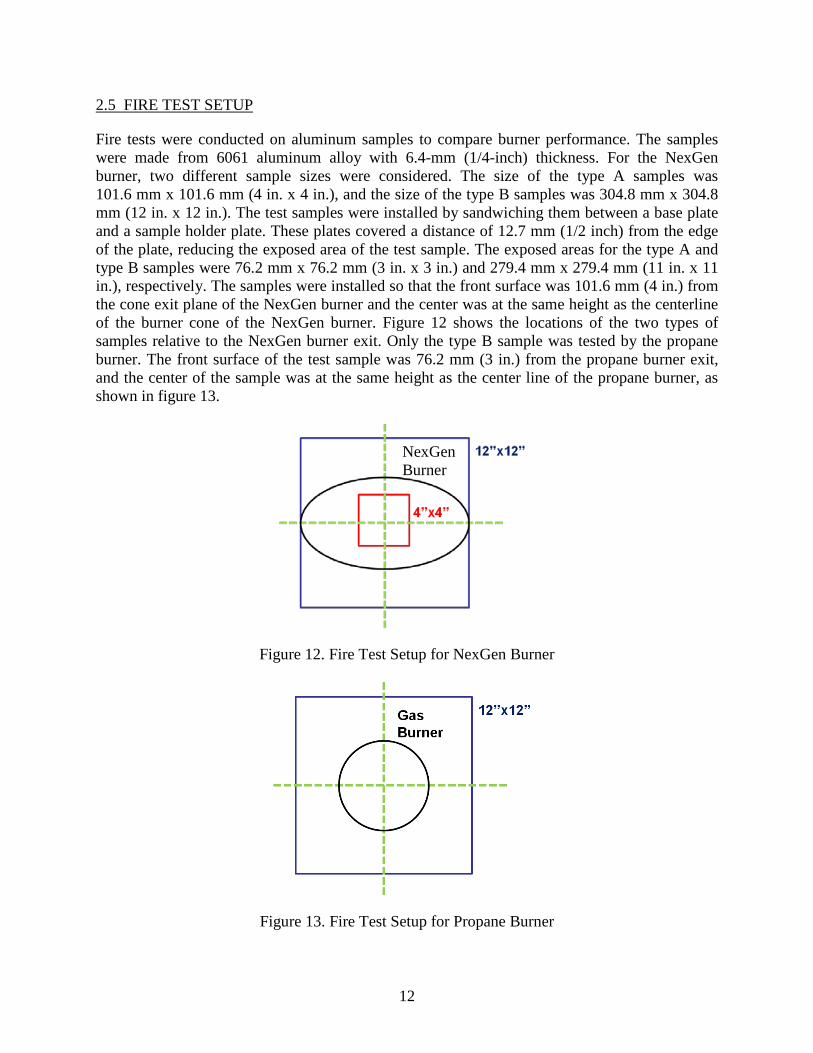
Fire tests were conducted on aluminum samples to compare burner performance. The samples were made from 6061 aluminum alloy with 6.4-mm (1/4-inch) thickness. For the NexGen burner, two different sample sizes were considered. The size of the type A samples was 101.6 mm x 101.6 mm (4 in. x 4 in.), and the size of the type B samples was 304.8 mm x 304.8 mm (12 in. x 12 in.). The test samples were installed by sandwiching them between a base plate and a sample holder plate. These plates covered a distance of 12.7 mm (1/2 inch) from the edge of the plate, reducing the exposed area of the test sample. The exposed areas for the type A and type B samples were 76.2 mm x 76.2 mm (3 in. x 3 in.) and 279.4 mm x 279.4 mm (11 in. x 11 in.), respectively. The samples were installed so that the front surface was 101.6 mm (4 in.) from the cone exit plane of the NexGen burner and the center was at the same height as the centerline of the burner cone of the NexGen burner. Figure 12 shows the locations of the two types of samples relative to the NexGen burner exit. Only the type B sample was tested by the propane burner. The front surface of the test sample was 76.2 mm (3 in.) from the propane burner exit, and the center of the sample was at the same height as the center line of the propane burner, as shown in figure 13.
Figure 12. Fire Test Setup for NexGen Burner
Figure 13. Fire Test Setup for Propane Burner
NexGen Burner
12
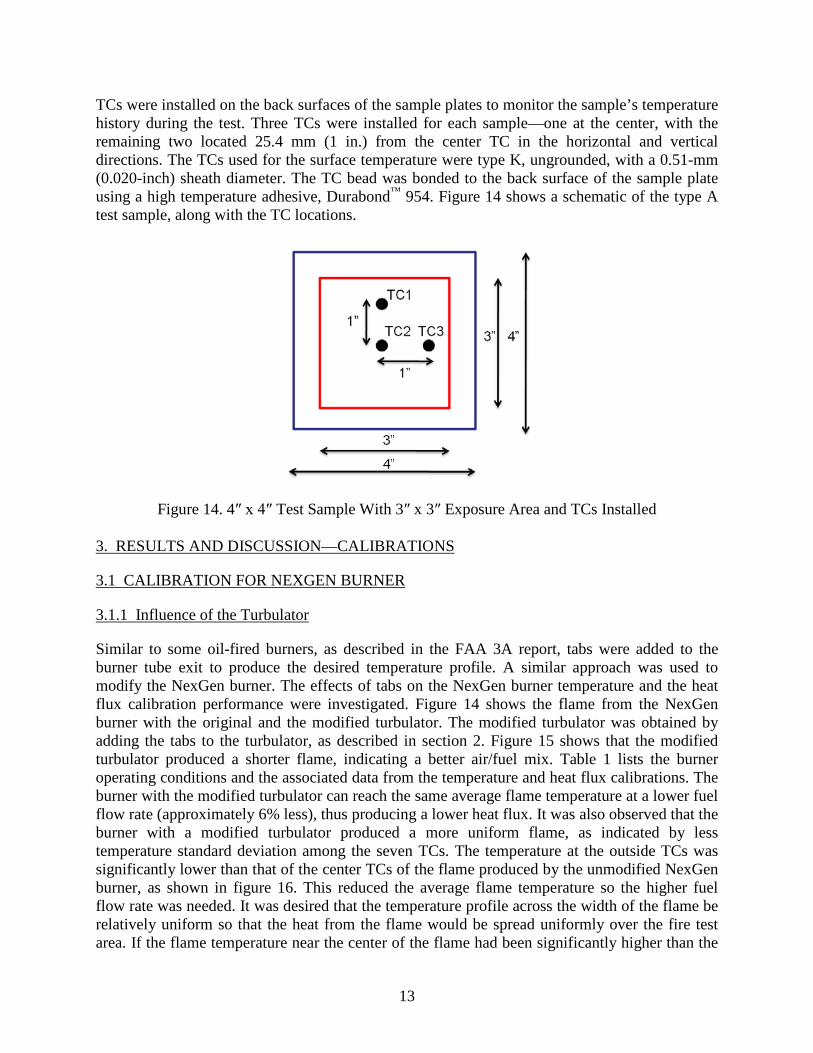
TCs were installed on the back surfaces of the sample plates to monitor the sample’s temperature history during the test. Three TCs were installed for each sample—one at the center, with the remaining two located 25.4 mm (1 in.) from the center TC in the horizontal and vertical directions. The TCs used for the surface temperature were type K, ungrounded, with a 0.51-mm (0.020-inch) sheath diameter. The TC bead was bonded to the back surface of the sample plate using a high temperature adhesive, Durabond™ 954. Figure 14 shows a schematic of the type A test sample, along with the TC locations.
Figure 14. 4″ x 4″ Test Sample With 3″ x 3″ Exposure Area and TCs Installed 3. RESULTS AND DISCUSSION—CALIBRATIONS
3.1 CALIBRATION FOR NEXGEN BURNER
3.1.1 Influence of the Turbulator
Similar to some oil-fired burners, as described in the FAA 3A report, tabs were added to the burner tube exit to produce the desired temperature profile. A similar approach was used to modify the NexGen burner. The effects of tabs on the NexGen burner temperature and the heat flux calibration performance were investigated. Figure 14 shows the flame from the NexGen burner with the original and the modified turbulator. The modified turbulator was obtained by adding the tabs to the turbulator, as described in section 2. Figure 15 shows that the modified turbulator produced a shorter flame, indicating a better air/fuel mix. Table 1 lists the burner operating conditions and the associated data from the temperature and heat flux calibrations. The burner with the modified turbulator can reach the same average flame temperature at a lower fuel flow rate (approximately 6% less), thus producing a lower heat flux. It was also observed that the burner with a modified turbulator produced a more uniform flame, as indicated by less temperature standard deviation among the seven TCs. The temperature at the outside TCs was significantly lower than that of the center TCs of the flame produced by the unmodified NexGen burner, as shown in figure 16. This reduced the average flame temperature so the higher fuel flow rate was needed. It was desired that the temperature profile across the width of the flame be relatively uniform so that the heat from the flame would be spread uniformly over the fire test area. If the flame temperature near the center of the flame had been significantly higher than the
13
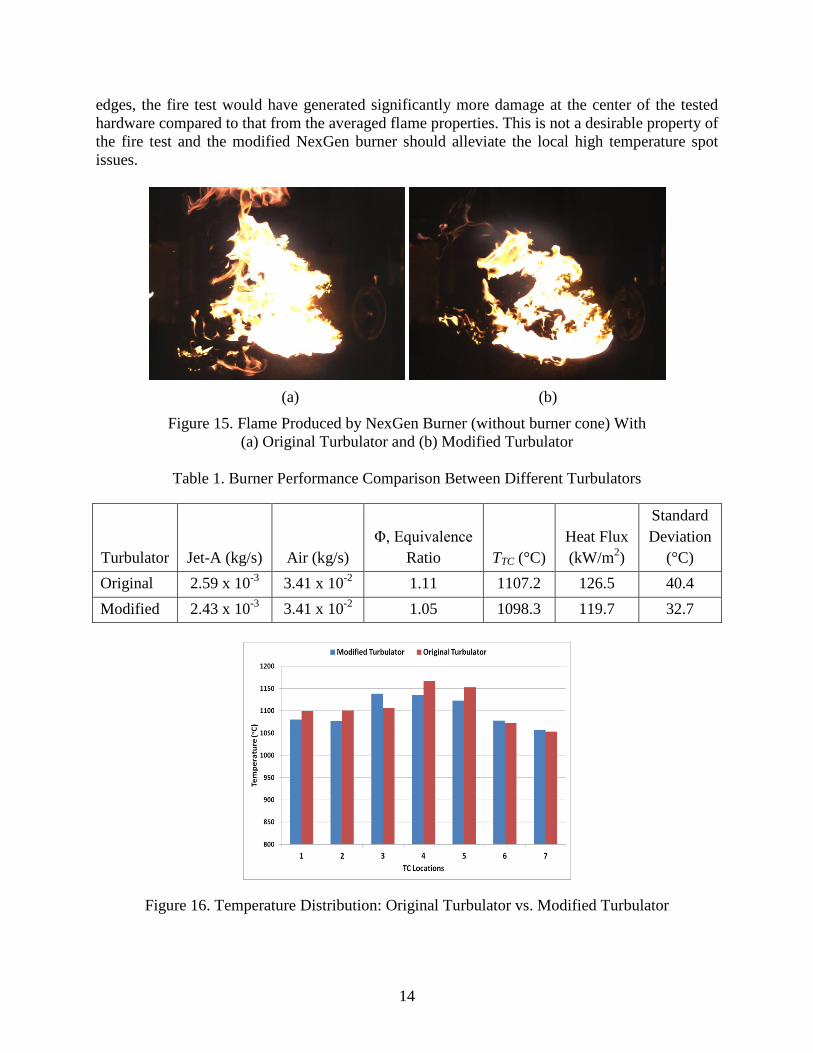
edges, the fire test would have generated significantly more damage at the center of the tested hardware compared to that from the averaged flame properties. This is not a desirable property of the fire test and the modified NexGen burner should alleviate the local high temperature spot issues.
(a) (b)
Figure 15. Flame Produced by NexGen Burner (without burner cone) With (a) Original Turbulator and (b) Modified Turbulator
Table 1. Burner Performance Comparison Between Different Turbulators
Turbulator Jet-A (kg/s) Air (kg/s) Φ, Equivalence
Ratio TTC (°C) Heat Flux (kW/m2)
Standard Deviation
(°C) Original 2.59 x 10⁻³ 3.41 x 10⁻² 1.11 1107.2 126.5 40.4 Modified 2.43 x 10⁻³ 3.41 x 10⁻² 1.05 1098.3 119.7 32.7
Figure 16. Temperature Distribution: Original Turbulator vs. Modified Turbulator
14
The better mixing obtained using the modified turbulator resulted in a smaller temperature difference from the center TCs to those on the edge, so the standard deviation of the temperature profile of the modified turbulator was less than that of the original turbulator, as listed in table 1. Thus, the modified burner was able to achieve the same flame temperature at a set point that produced less heat flux. Because it was observed that the use of the modified turbulator resulted in a more uniform flame, the modified turbulator was retained for all studies described in this report. 3.1.2 Influence of TC Size
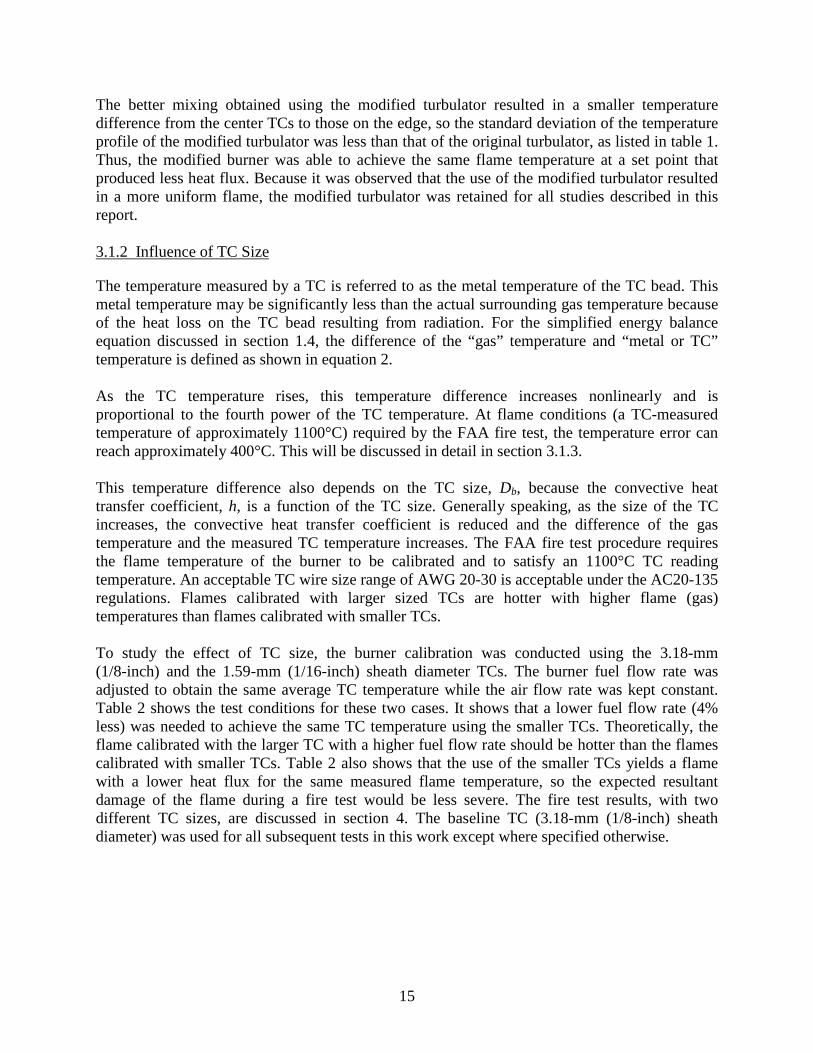
The temperature measured by a TC is referred to as the metal temperature of the TC bead. This metal temperature may be significantly less than the actual surrounding gas temperature because of the heat loss on the TC bead resulting from radiation. For the simplified energy balance equation discussed in section 1.4, the difference of the “gas” temperature and “metal or TC” temperature is defined as shown in equation 2. As the TC temperature rises, this temperature difference increases nonlinearly and is proportional to the fourth power of the TC temperature. At flame conditions (a TC-measured temperature of approximately 1100°C) required by the FAA fire test, the temperature error can reach approximately 400°C. This will be discussed in detail in section 3.1.3. This temperature difference also depends on the TC size, Db, because the convective heat transfer coefficient, h, is a function of the TC size. Generally speaking, as the size of the TC increases, the convective heat transfer coefficient is reduced and the difference of the gas temperature and the measured TC temperature increases. The FAA fire test procedure requires the flame temperature of the burner to be calibrated and to satisfy an 1100°C TC reading temperature. An acceptable TC wire size range of AWG 20-30 is acceptable under the AC20-135 regulations. Flames calibrated with larger sized TCs are hotter with higher flame (gas) temperatures than flames calibrated with smaller TCs. To study the effect of TC size, the burner calibration was conducted using the 3.18-mm (1/8-inch) and the 1.59-mm (1/16-inch) sheath diameter TCs. The burner fuel flow rate was adjusted to obtain the same average TC temperature while the air flow rate was kept constant. Table 2 shows the test conditions for these two cases. It shows that a lower fuel flow rate (4% less) was needed to achieve the same TC temperature using the smaller TCs. Theoretically, the flame calibrated with the larger TC with a higher fuel flow rate should be hotter than the flames calibrated with smaller TCs. Table 2 also shows that the use of the smaller TCs yields a flame with a lower heat flux for the same measured flame temperature, so the expected resultant damage of the flame during a fire test would be less severe. The fire test results, with two different TC sizes, are discussed in section 4. The baseline TC (3.18-mm (1/8-inch) sheath diameter) was used for all subsequent tests in this work except where specified otherwise.
15
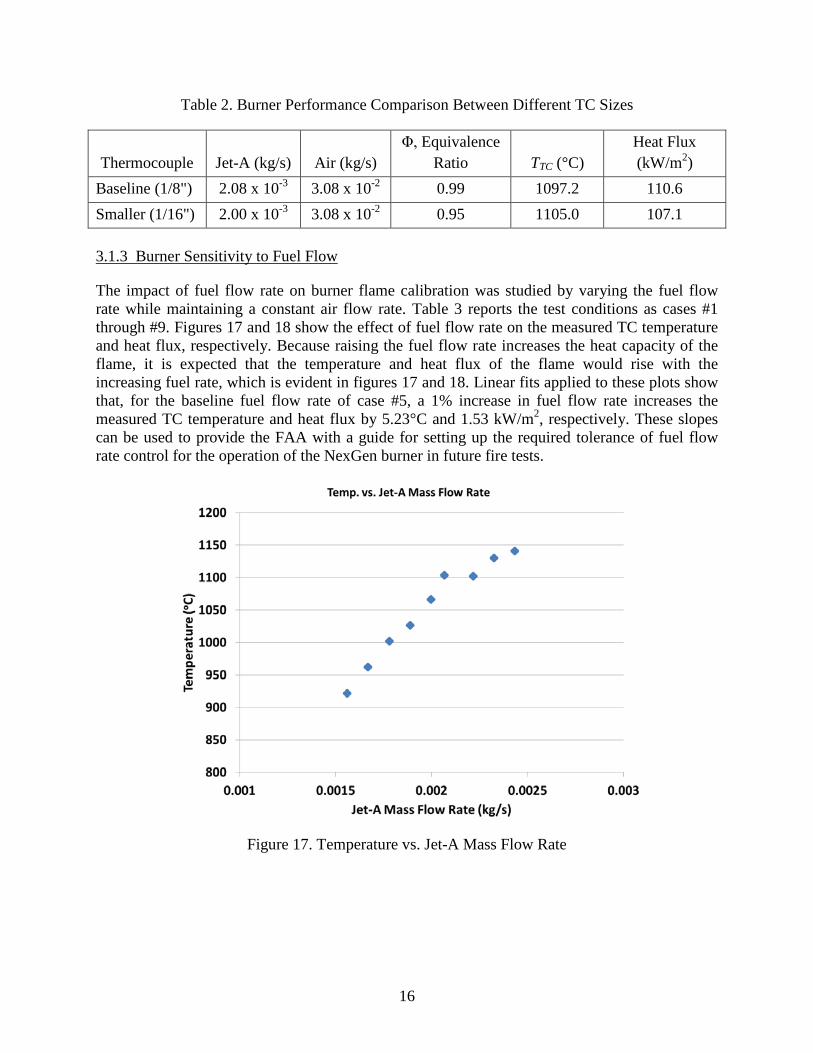
Table 2. Burner Performance Comparison Between Different TC Sizes
Thermocouple Jet-A (kg/s) Air (kg/s) Φ, Equivalence
Ratio TTC (°C) Heat Flux (kW/m2)
Baseline (1/8") 2.08 x 10⁻³ 3.08 x 10⁻² 0.99 1097.2 110.6 Smaller (1/16") 2.00 x 10⁻³ 3.08 x 10⁻² 0.95 1105.0 107.1 3.1.3 Burner Sensitivity to Fuel Flow
The impact of fuel flow rate on burner flame calibration was studied by varying the fuel flow rate while maintaining a constant air flow rate. Table 3 reports the test conditions as cases #1 through #9. Figures 17 and 18 show the effect of fuel flow rate on the measured TC temperature and heat flux, respectively. Because raising the fuel flow rate increases the heat capacity of the flame, it is expected that the temperature and heat flux of the flame would rise with the increasing fuel rate, which is evident in figures 17 and 18. Linear fits applied to these plots show that, for the baseline fuel flow rate of case #5, a 1% increase in fuel flow rate increases the measured TC temperature and heat flux by 5.23°C and 1.53 kW/m2, respectively. These slopes can be used to provide the FAA with a guide for setting up the required tolerance of fuel flow rate control for the operation of the NexGen burner in future fire tests.
Figure 17. Temperature vs. Jet-A Mass Flow Rate
16
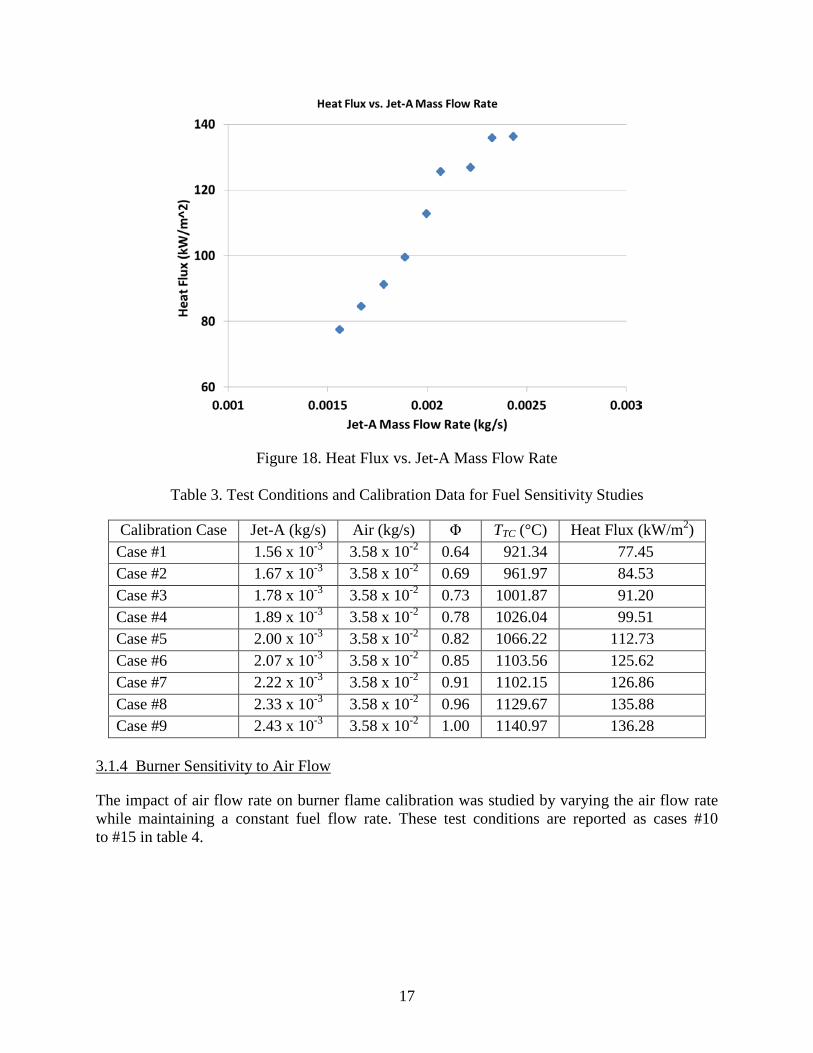
Figure 18. Heat Flux vs. Jet-A Mass Flow Rate
Table 3. Test Conditions and Calibration Data for Fuel Sensitivity Studies
Calibration Case Jet-A (kg/s) Air (kg/s) Φ TTC (°C) Heat Flux (kW/m2) Case #1 1.56 x 10⁻³ 3.58 x 10⁻² 0.64 921.34 77.45 Case #2 1.67 x 10⁻³ 3.58 x 10⁻² 0.69 961.97 84.53 Case #3 1.78 x 10⁻³ 3.58 x 10⁻² 0.73 1001.87 91.20 Case #4 1.89 x 10⁻³ 3.58 x 10⁻² 0.78 1026.04 99.51 Case #5 2.00 x 10⁻³ 3.58 x 10⁻² 0.82 1066.22 112.73 Case #6 2.07 x 10⁻³ 3.58 x 10⁻² 0.85 1103.56 125.62 Case #7 2.22 x 10⁻³ 3.58 x 10⁻² 0.91 1102.15 126.86 Case #8 2.33 x 10⁻³ 3.58 x 10⁻² 0.96 1129.67 135.88 Case #9 2.43 x 10⁻³ 3.58 x 10⁻² 1.00 1140.97 136.28
3.1.4 Burner Sensitivity to Air Flow
The impact of air flow rate on burner flame calibration was studied by varying the air flow rate while maintaining a constant fuel flow rate. These test conditions are reported as cases #10 to #15 in table 4.
17

Table 4. Test Conditions and Calibration Data for Air Sensitivity Studies
Calibration Case
Jet-A (kg/s)
Air (kg/s) Φ
Tavg (°C)
Heat Flux
(kW/m2) Tcorr (°C)
Terror (°C)
Tadia (°C)
Case #10 2.00 x 10⁻³ 3.09 x 10⁻² 0.95 1033.6 112.83 1502.7 469.1 1962.6 Case #11 2.00 x 10⁻³ 3.24 x 10⁻² 0.91 1059.0 105.54 1556.1 497.1 1922.4 Case #12 2.00 x 10⁻³ 3.41 x 10⁻² 0.86 1064.8 103.16 1558.4 493.6 1860.4 Case #13 2.00 x 10⁻³ 3.58 x 10⁻² 0.82 1062.0 105.40 1543.0 480.9 1803.8 Case #14 2.00 x 10⁻³ 3.73 x 10⁻² 0.79 1042.9 110.78 1490.9 448.0 1758.1 Case #15 2.00 x 10⁻³ 3.89 x 10⁻² 0.75 1027.3 108.69 1466.5 429.1 1693.9
The effect of air flow rate on the measured TC temperature and heat flux is shown in figures 19 and 20. From figure 19, it can be seen that the change in air flow rate has no significant effect on the heat flux. The convective heat transfer rate, which dominates the measured heat flux, is proportional to the convective (flame) velocity and flame temperature. As the air flow rate increases, the fuel/air ratio decreases and the burner produces a lower flame temperature. In the meantime, the higher air rate increases the flame convective velocity. Lower flame temperature and higher flame velocity are the reasons the measured heat flux is not sensitive to the air flow rate of the NexGen burner. Figure 20 shows that the air flow rate has no significant effect on the measured TC temperature, which is counterintuitive. One would expect the flame temperature to decrease as the air flow increases because the fuel/air ratio or the equivalence ratio decreases. One possible reason for this is that, as air flow increases, so does the velocity of the hot gases past the TCs, changing the convective heat transfer coefficient. As a result, the temperature difference between the true flame/gas temperature and measured TC temperature is reduced as the air flow rate increases, as discussed in section 1.4. Although the measured TC temperature is not sensitive to the air flow rate, the true gas/flame temperature, which is the critical factor on a fire test, is expected to decrease while the air flow rate increases.
18
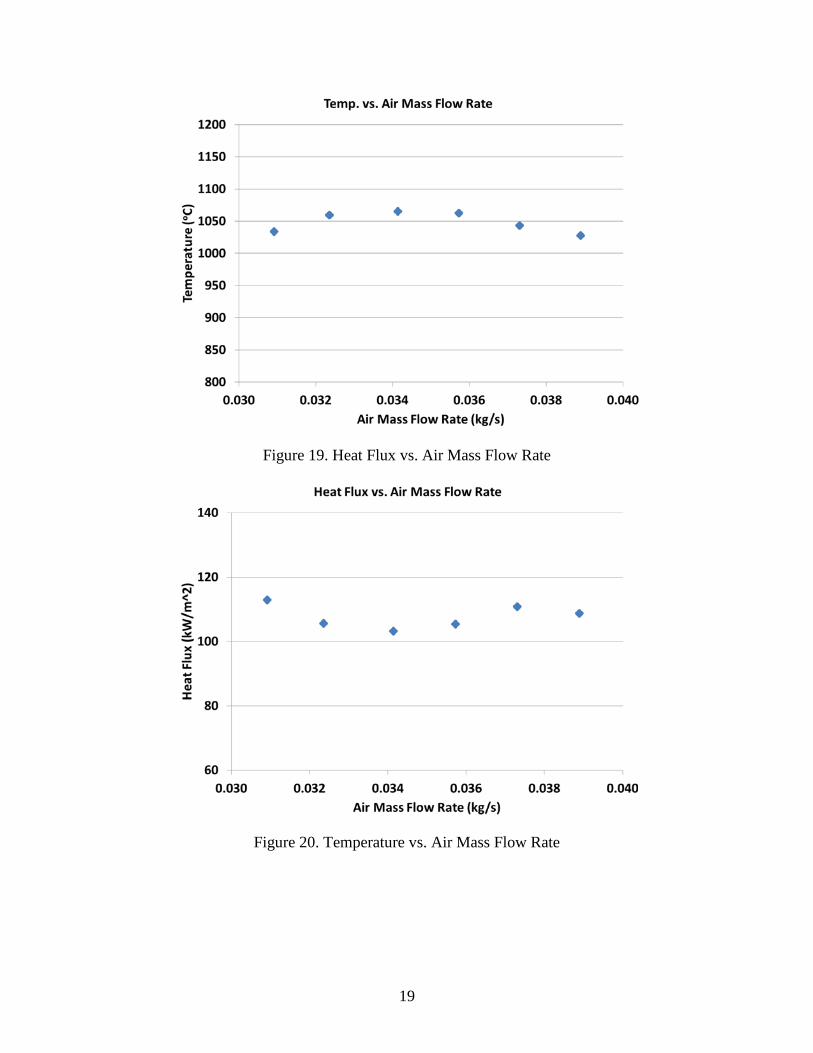
Figure 19. Heat Flux vs. Air Mass Flow Rate
Figure 20. Temperature vs. Air Mass Flow Rate
19
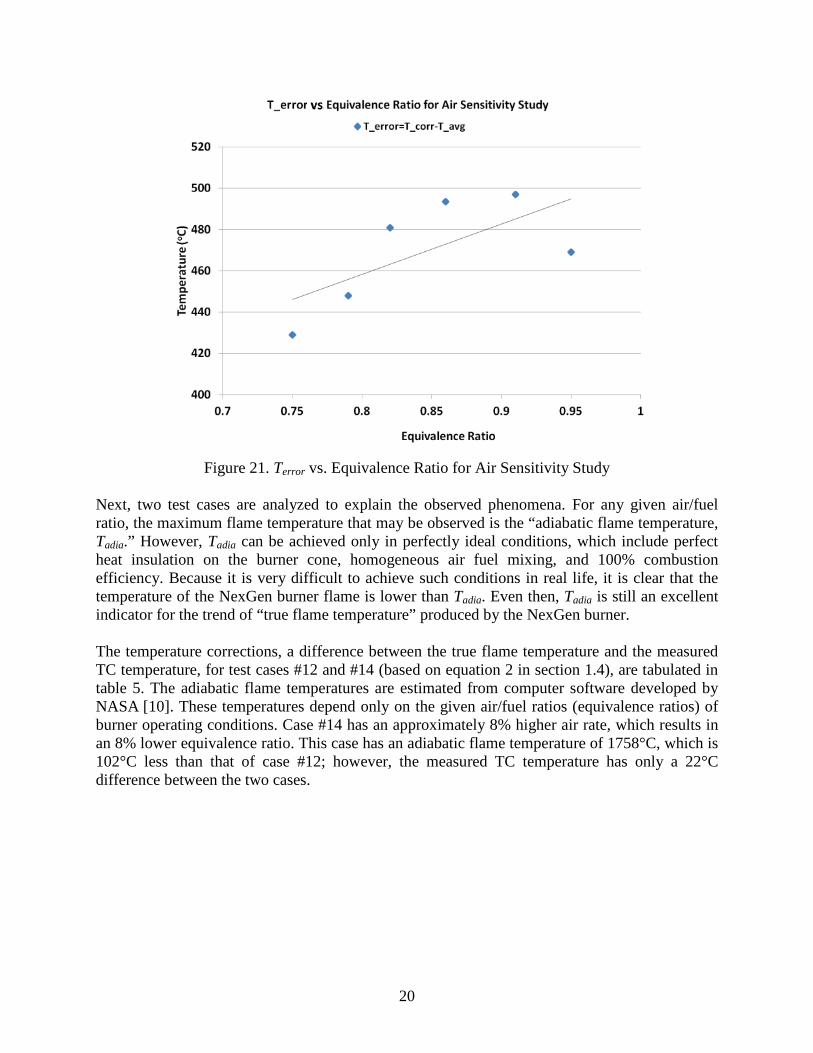
Figure 21. Terror vs. Equivalence Ratio for Air Sensitivity Study Next, two test cases are analyzed to explain the observed phenomena. For any given air/fuel ratio, the maximum flame temperature that may be observed is the “adiabatic flame temperature, Tadia.” However, Tadia can be achieved only in perfectly ideal conditions, which include perfect heat insulation on the burner cone, homogeneous air fuel mixing, and 100% combustion efficiency. Because it is very difficult to achieve such conditions in real life, it is clear that the temperature of the NexGen burner flame is lower than Tadia. Even then, Tadia is still an excellent indicator for the trend of “true flame temperature” produced by the NexGen burner. The temperature corrections, a difference between the true flame temperature and the measured TC temperature, for test cases #12 and #14 (based on equation 2 in section 1.4), are tabulated in table 5. The adiabatic flame temperatures are estimated from computer software developed by NASA [10]. These temperatures depend only on the given air/fuel ratios (equivalence ratios) of burner operating conditions. Case #14 has an approximately 8% higher air rate, which results in an 8% lower equivalence ratio. This case has an adiabatic flame temperature of 1758°C, which is 102°C less than that of case #12; however, the measured TC temperature has only a 22°C difference between the two cases.
20
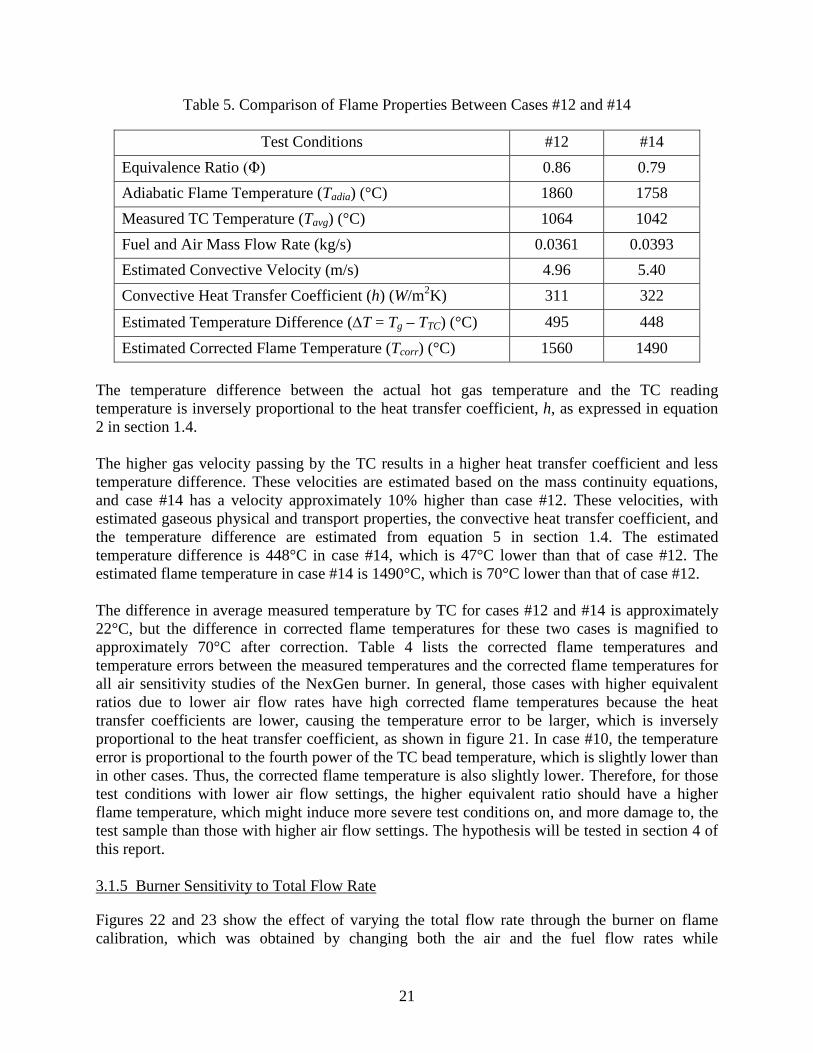
Table 5. Comparison of Flame Properties Between Cases #12 and #14
Test Conditions #12 #14 Equivalence Ratio (Φ) 0.86 0.79 Adiabatic Flame Temperature (Tadia) (°C) 1860 1758 Measured TC Temperature (Tavg) (°C) 1064 1042 Fuel and Air Mass Flow Rate (kg/s) 0.0361 0.0393 Estimated Convective Velocity (m/s) 4.96 5.40 Convective Heat Transfer Coefficient (h) (W/m2K) 311 322
Estimated Temperature Difference (∆T = Tg – TTC) (°C) 495 448 Estimated Corrected Flame Temperature (Tcorr) (°C) 1560 1490
The temperature difference between the actual hot gas temperature and the TC reading temperature is inversely proportional to the heat transfer coefficient, h, as expressed in equation 2 in section 1.4. The higher gas velocity passing by the TC results in a higher heat transfer coefficient and less temperature difference. These velocities are estimated based on the mass continuity equations, and case #14 has a velocity approximately 10% higher than case #12. These velocities, with estimated gaseous physical and transport properties, the convective heat transfer coefficient, and the temperature difference are estimated from equation 5 in section 1.4. The estimated temperature difference is 448°C in case #14, which is 47°C lower than that of case #12. The estimated flame temperature in case #14 is 1490°C, which is 70°C lower than that of case #12. The difference in average measured temperature by TC for cases #12 and #14 is approximately 22°C, but the difference in corrected flame temperatures for these two cases is magnified to approximately 70°C after correction. Table 4 lists the corrected flame temperatures and temperature errors between the measured temperatures and the corrected flame temperatures for all air sensitivity studies of the NexGen burner. In general, those cases with higher equivalent ratios due to lower air flow rates have high corrected flame temperatures because the heat transfer coefficients are lower, causing the temperature error to be larger, which is inversely proportional to the heat transfer coefficient, as shown in figure 21. In case #10, the temperature error is proportional to the fourth power of the TC bead temperature, which is slightly lower than in other cases. Thus, the corrected flame temperature is also slightly lower. Therefore, for those test conditions with lower air flow settings, the higher equivalent ratio should have a higher flame temperature, which might induce more severe test conditions on, and more damage to, the test sample than those with higher air flow settings. The hypothesis will be tested in section 4 of this report. 3.1.5 Burner Sensitivity to Total Flow Rate
Figures 22 and 23 show the effect of varying the total flow rate through the burner on flame calibration, which was obtained by changing both the air and the fuel flow rates while
21

maintaining a constant equivalence ratio (air/fuel ratio). Table 6 lists the test conditions for these cases. Similar trends were obtained at four equivalence ratios conducted in this study. It was reported in previous sections that only the fuel flow rate had a significant impact on the measured TC temperature and heat flux, whereas they were largely insensitive to the air flow rate. Because increasing the total flow rate also involves a change in the fuel flow rate, it follows that the flame temperature and heat flux would increase with the flow rate, as seen in figures 22 and 23. The same arguments can explain why the adiabatic flame temperatures depend only on the burner equivalence ratios, but, with the same equivalence ratio, the temperature difference between true flame temperature and measured TC temperature will be less for cases with higher velocity mass rates. This is the reason for higher measured TC temperatures at higher mass flow rates.
Figure 22. Temperature vs. Total Mass Flow Rate at Different Flow Rates
22
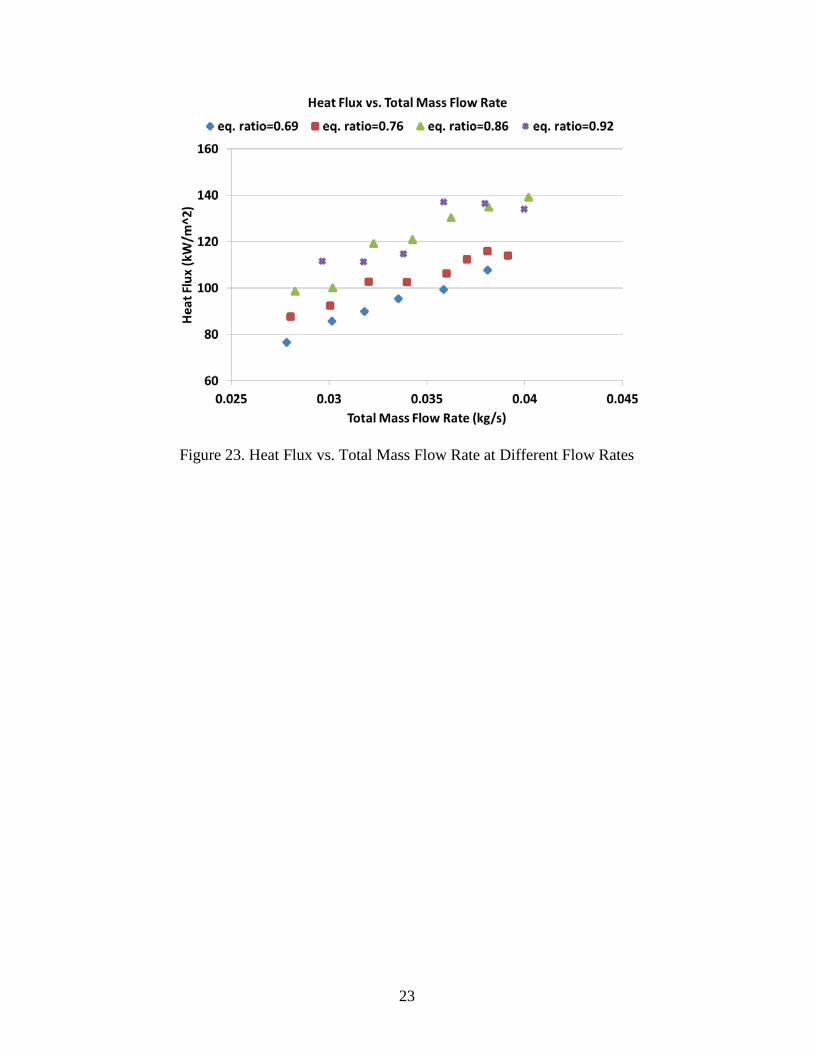
Figure 23. Heat Flux vs. Total Mass Flow Rate at Different Flow Rates
23
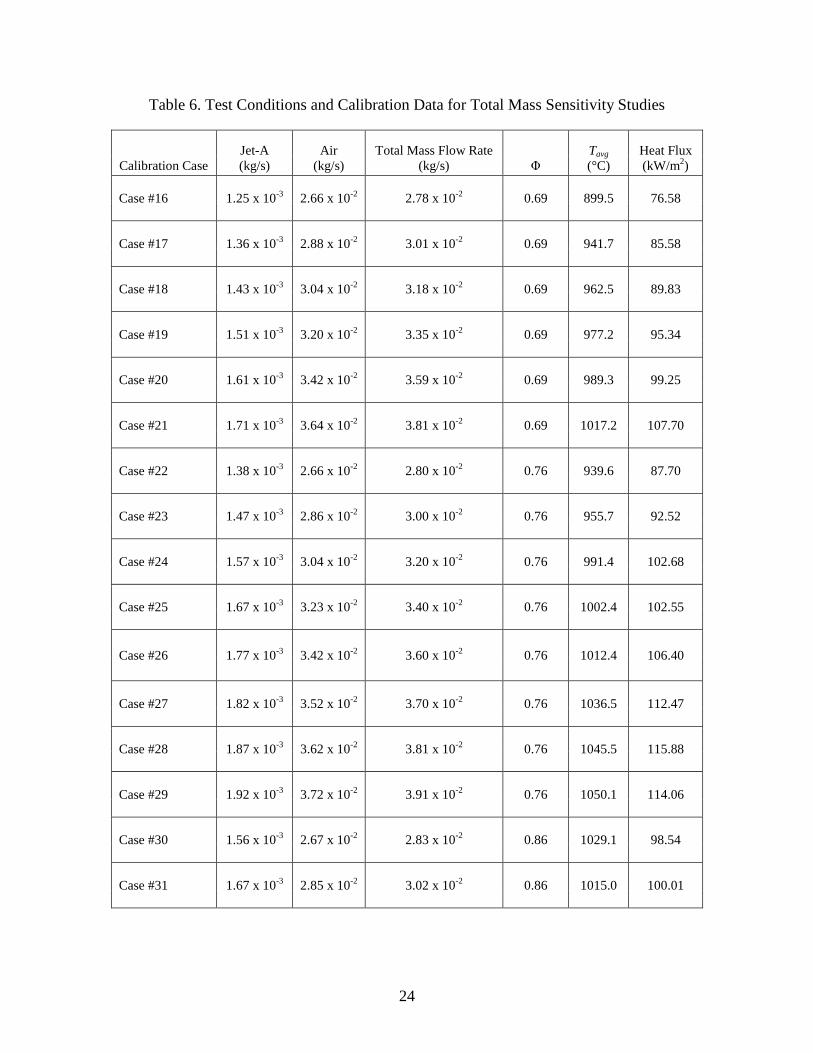
Table 6. Test Conditions and Calibration Data for Total Mass Sensitivity Studies
Calibration Case Jet-A (kg/s)
Air (kg/s)
Total Mass Flow Rate (kg/s) Φ
Tavg (°C)
Heat Flux (kW/m2)
Case #16 1.25 x 10⁻³ 2.66 x 10⁻² 2.78 x 10⁻² 0.69 899.5 76.58
Case #17 1.36 x 10⁻³ 2.88 x 10⁻² 3.01 x 10⁻² 0.69 941.7 85.58
Case #18 1.43 x 10⁻³ 3.04 x 10⁻² 3.18 x 10⁻² 0.69 962.5 89.83
Case #19 1.51 x 10⁻³ 3.20 x 10⁻² 3.35 x 10⁻² 0.69 977.2 95.34
Case #20 1.61 x 10⁻³ 3.42 x 10⁻² 3.59 x 10⁻² 0.69 989.3 99.25
Case #21 1.71 x 10⁻³ 3.64 x 10⁻² 3.81 x 10⁻² 0.69 1017.2 107.70
Case #22 1.38 x 10⁻³ 2.66 x 10⁻² 2.80 x 10⁻² 0.76 939.6 87.70
Case #23 1.47 x 10⁻³ 2.86 x 10⁻² 3.00 x 10⁻² 0.76 955.7 92.52
Case #24 1.57 x 10⁻³ 3.04 x 10⁻² 3.20 x 10⁻² 0.76 991.4 102.68
Case #25 1.67 x 10⁻³ 3.23 x 10⁻² 3.40 x 10⁻² 0.76 1002.4 102.55
Case #26 1.77 x 10⁻³ 3.42 x 10⁻² 3.60 x 10⁻² 0.76 1012.4 106.40
Case #27 1.82 x 10⁻³ 3.52 x 10⁻² 3.70 x 10⁻² 0.76 1036.5 112.47
Case #28 1.87 x 10⁻³ 3.62 x 10⁻² 3.81 x 10⁻² 0.76 1045.5 115.88
Case #29 1.92 x 10⁻³ 3.72 x 10⁻² 3.91 x 10⁻² 0.76 1050.1 114.06
Case #30 1.56 x 10⁻³ 2.67 x 10⁻² 2.83 x 10⁻² 0.86 1029.1 98.54
Case #31 1.67 x 10⁻³ 2.85 x 10⁻² 3.02 x 10⁻² 0.86 1015.0 100.01
24
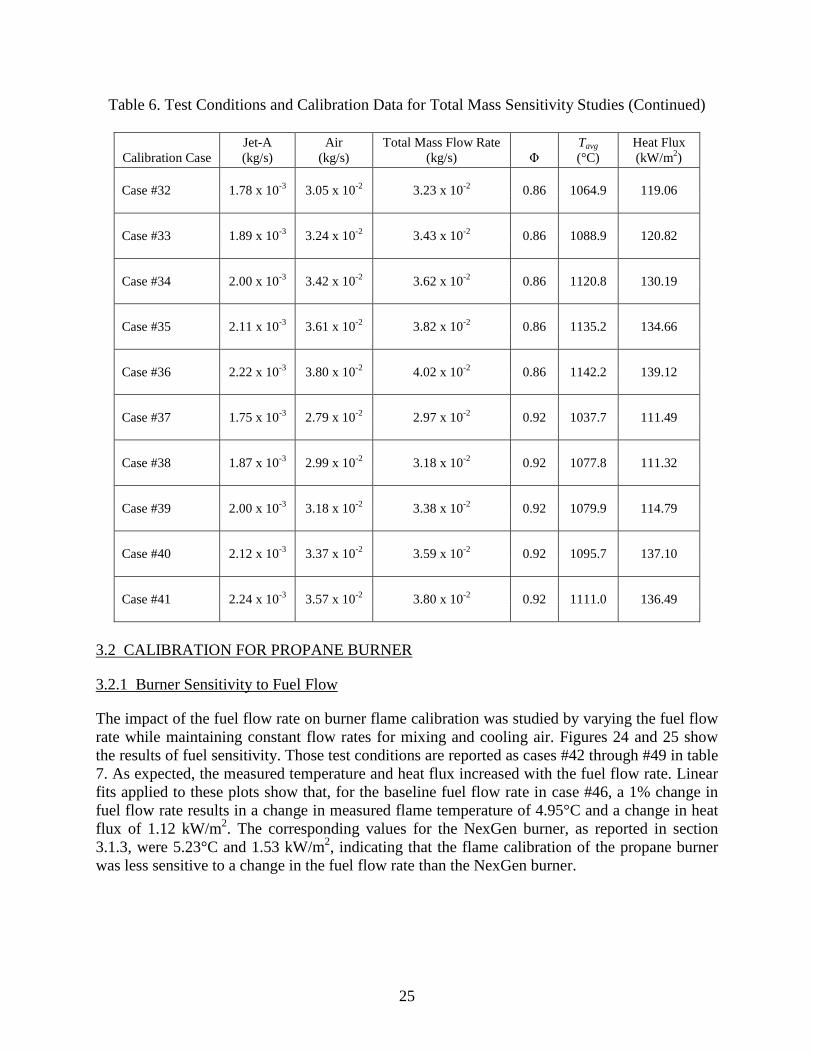
Table 6. Test Conditions and Calibration Data for Total Mass Sensitivity Studies (Continued)
Calibration Case Jet-A (kg/s)
Air (kg/s)
Total Mass Flow Rate (kg/s) Φ
Tavg (°C)
Heat Flux (kW/m2)
Case #32 1.78 x 10⁻³ 3.05 x 10⁻² 3.23 x 10⁻² 0.86 1064.9 119.06
Case #33 1.89 x 10⁻³ 3.24 x 10⁻² 3.43 x 10⁻² 0.86 1088.9 120.82
Case #34 2.00 x 10⁻³ 3.42 x 10⁻² 3.62 x 10⁻² 0.86 1120.8 130.19
Case #35 2.11 x 10⁻³ 3.61 x 10⁻² 3.82 x 10⁻² 0.86 1135.2 134.66
Case #36 2.22 x 10⁻³ 3.80 x 10⁻² 4.02 x 10⁻² 0.86 1142.2 139.12
Case #37 1.75 x 10⁻³ 2.79 x 10⁻² 2.97 x 10⁻² 0.92 1037.7 111.49
Case #38 1.87 x 10⁻³ 2.99 x 10⁻² 3.18 x 10⁻² 0.92 1077.8 111.32
Case #39 2.00 x 10⁻³ 3.18 x 10⁻² 3.38 x 10⁻² 0.92 1079.9 114.79
Case #40 2.12 x 10⁻³ 3.37 x 10⁻² 3.59 x 10⁻² 0.92 1095.7 137.10
Case #41 2.24 x 10⁻³ 3.57 x 10⁻² 3.80 x 10⁻² 0.92 1111.0 136.49
3.2 CALIBRATION FOR PROPANE BURNER
3.2.1 Burner Sensitivity to Fuel Flow
The impact of the fuel flow rate on burner flame calibration was studied by varying the fuel flow rate while maintaining constant flow rates for mixing and cooling air. Figures 24 and 25 show the results of fuel sensitivity. Those test conditions are reported as cases #42 through #49 in table 7. As expected, the measured temperature and heat flux increased with the fuel flow rate. Linear fits applied to these plots show that, for the baseline fuel flow rate in case #46, a 1% change in fuel flow rate results in a change in measured flame temperature of 4.95°C and a change in heat flux of 1.12 kW/m2. The corresponding values for the NexGen burner, as reported in section 3.1.3, were 5.23°C and 1.53 kW/m2, indicating that the flame calibration of the propane burner was less sensitive to a change in the fuel flow rate than the NexGen burner.
25

Figure 24. Temperature vs. Propane Mass Flow Rate
Figure 25. Heat Flux vs. Propane Mass Flow Rate
Propane Mass Flow Rate (g/s)
26
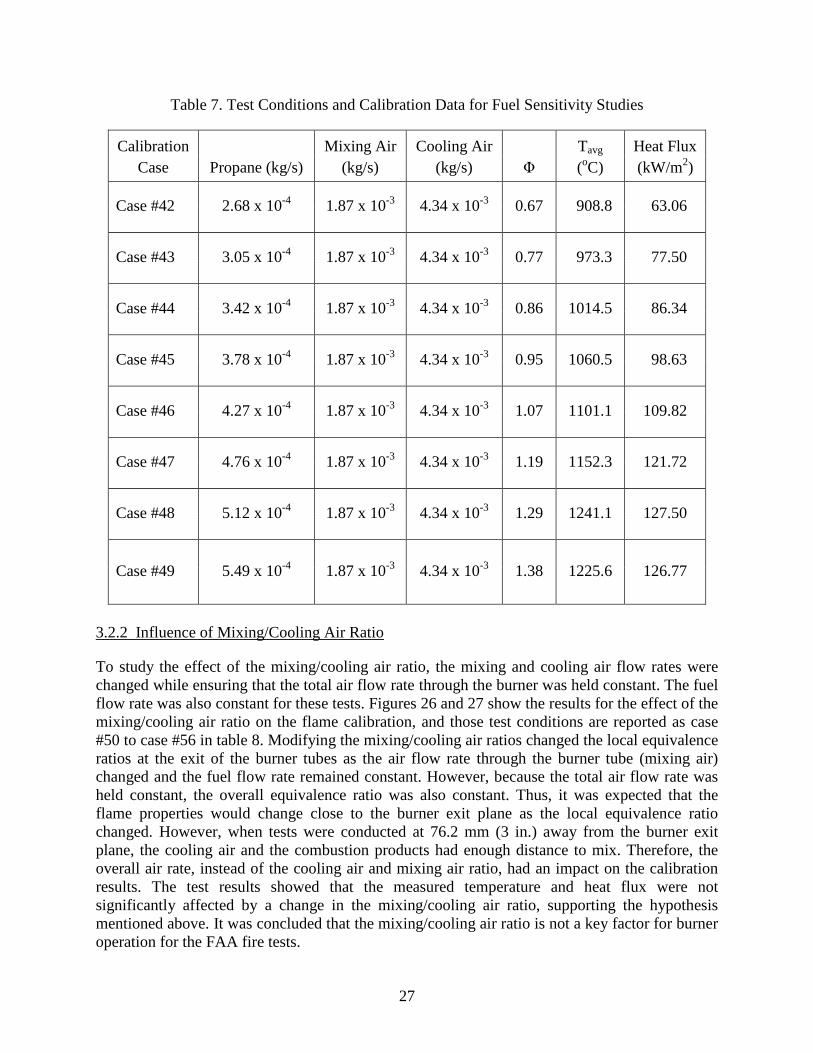
Table 7. Test Conditions and Calibration Data for Fuel Sensitivity Studies
Calibration Case Propane (kg/s)
Mixing Air (kg/s)
Cooling Air (kg/s) Φ
Tavg
(oC) Heat Flux (kW/m2)
Case #42 2.68 x 10⁻⁴ 1.87 x 10⁻³ 4.34 x 10⁻³ 0.67 0908.8 063.06
Case #43 3.05 x 10⁻⁴ 1.87 x 10⁻³ 4.34 x 10⁻³ 0.77 0973.3 077.50
Case #44 3.42 x 10⁻⁴ 1.87 x 10⁻³ 4.34 x 10⁻³ 0.86 1014.5 086.34
Case #45 3.78 x 10⁻⁴ 1.87 x 10⁻³ 4.34 x 10⁻³ 0.95 1060.5 098.63
Case #46 4.27 x 10⁻⁴ 1.87 x 10⁻³ 4.34 x 10⁻³ 1.07 1101.1 109.82
Case #47 4.76 x 10⁻⁴ 1.87 x 10⁻³ 4.34 x 10⁻³ 1.19 1152.3 121.72
Case #48 5.12 x 10⁻⁴ 1.87 x 10⁻³ 4.34 x 10⁻³ 1.29 1241.1 127.50
Case #49 5.49 x 10⁻⁴ 1.87 x 10⁻³ 4.34 x 10⁻³ 1.38 1225.6 126.77
3.2.2 Influence of Mixing/Cooling Air Ratio
To study the effect of the mixing/cooling air ratio, the mixing and cooling air flow rates were changed while ensuring that the total air flow rate through the burner was held constant. The fuel flow rate was also constant for these tests. Figures 26 and 27 show the results for the effect of the mixing/cooling air ratio on the flame calibration, and those test conditions are reported as case #50 to case #56 in table 8. Modifying the mixing/cooling air ratios changed the local equivalence ratios at the exit of the burner tubes as the air flow rate through the burner tube (mixing air) changed and the fuel flow rate remained constant. However, because the total air flow rate was held constant, the overall equivalence ratio was also constant. Thus, it was expected that the flame properties would change close to the burner exit plane as the local equivalence ratio changed. However, when tests were conducted at 76.2 mm (3 in.) away from the burner exit plane, the cooling air and the combustion products had enough distance to mix. Therefore, the overall air rate, instead of the cooling air and mixing air ratio, had an impact on the calibration results. The test results showed that the measured temperature and heat flux were not significantly affected by a change in the mixing/cooling air ratio, supporting the hypothesis mentioned above. It was concluded that the mixing/cooling air ratio is not a key factor for burner operation for the FAA fire tests.
27
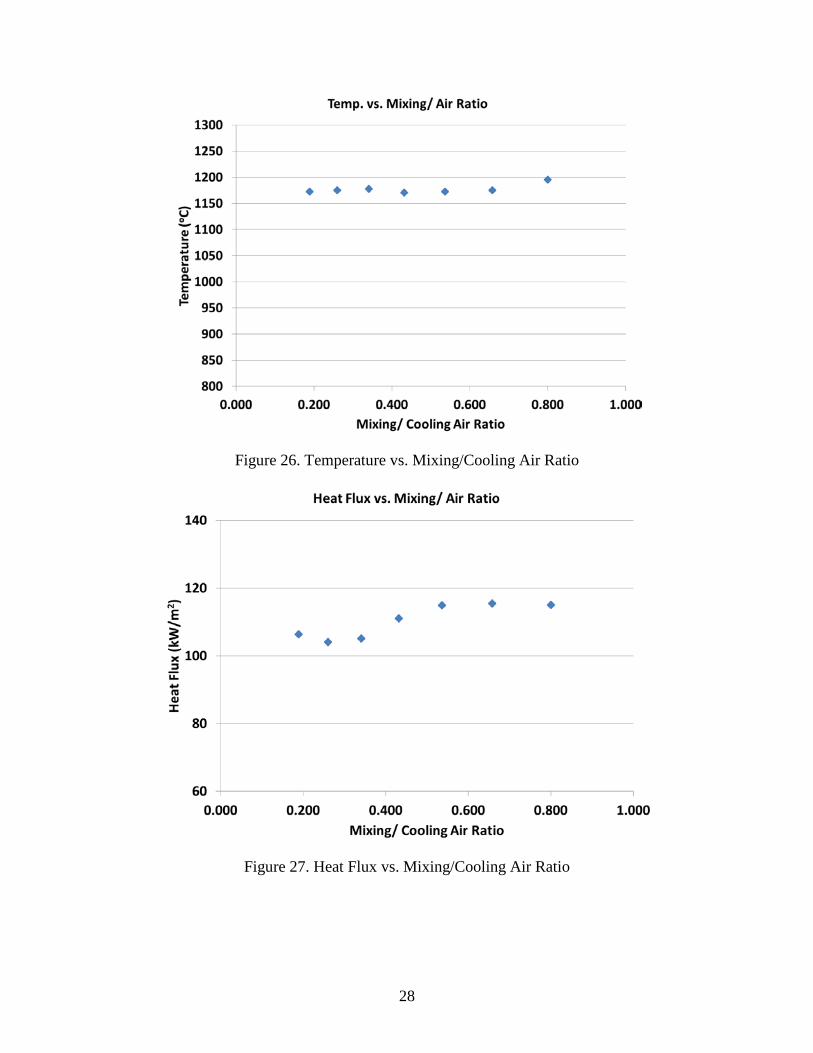
Figure 26. Temperature vs. Mixing/Cooling Air Ratio
Figure 27. Heat Flux vs. Mixing/Cooling Air Ratio
28
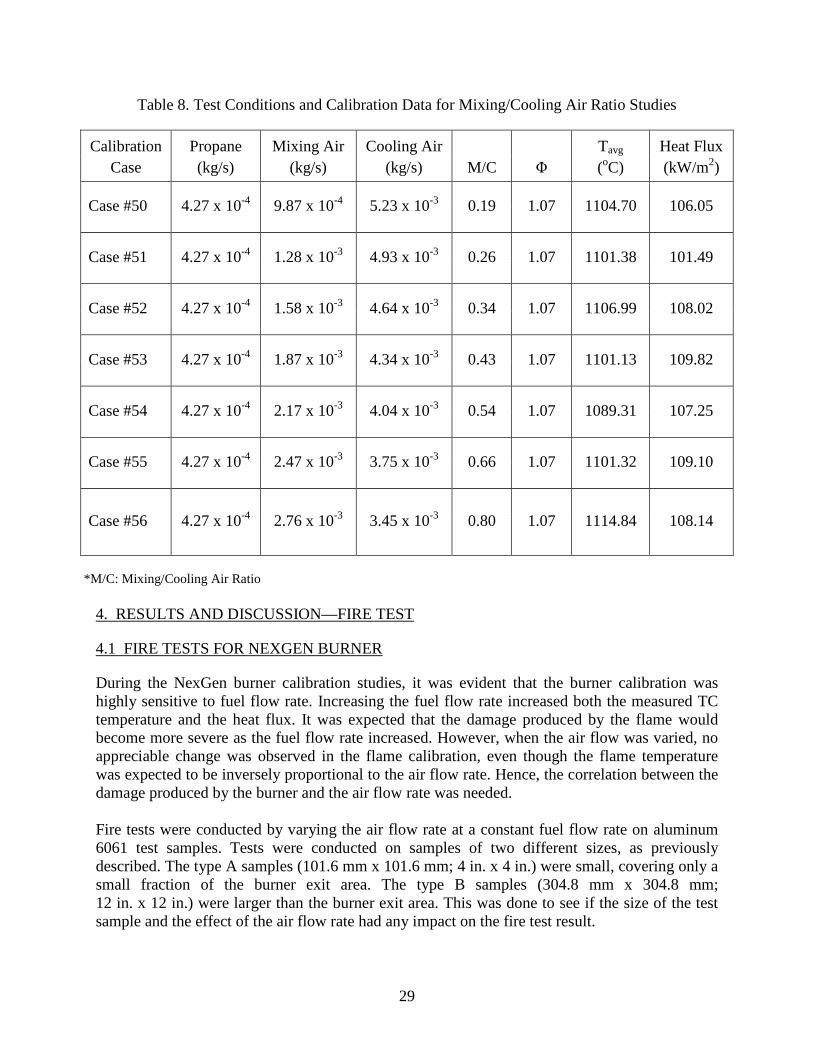
Table 8. Test Conditions and Calibration Data for Mixing/Cooling Air Ratio Studies
Calibration Case
Propane (kg/s)
Mixing Air (kg/s)
Cooling Air (kg/s) M/C Φ
Tavg (oC)
Heat Flux (kW/m2)
Case #50 4.27 x 10⁻⁴ 9.87 x 10⁻⁴ 5.23 x 10⁻³ 0.19 1.07 1104.70 106.05
Case #51 4.27 x 10⁻⁴ 1.28 x 10⁻³ 4.93 x 10⁻³ 0.26 1.07 1101.38 101.49
Case #52 4.27 x 10⁻⁴ 1.58 x 10⁻³ 4.64 x 10⁻³ 0.34 1.07 1106.99 108.02
Case #53 4.27 x 10⁻⁴ 1.87 x 10⁻³ 4.34 x 10⁻³ 0.43 1.07 1101.13 109.82
Case #54 4.27 x 10⁻⁴ 2.17 x 10⁻³ 4.04 x 10⁻³ 0.54 1.07 1089.31 107.25
Case #55 4.27 x 10⁻⁴ 2.47 x 10⁻³ 3.75 x 10⁻³ 0.66 1.07 1101.32 109.10
Case #56 4.27 x 10⁻⁴ 2.76 x 10⁻³ 3.45 x 10⁻³ 0.80 1.07 1114.84 108.14
*M/C: Mixing/Cooling Air Ratio
4. RESULTS AND DISCUSSION—FIRE TEST
4.1 FIRE TESTS FOR NEXGEN BURNER
During the NexGen burner calibration studies, it was evident that the burner calibration was highly sensitive to fuel flow rate. Increasing the fuel flow rate increased both the measured TC temperature and the heat flux. It was expected that the damage produced by the flame would become more severe as the fuel flow rate increased. However, when the air flow was varied, no appreciable change was observed in the flame calibration, even though the flame temperature was expected to be inversely proportional to the air flow rate. Hence, the correlation between the damage produced by the burner and the air flow rate was needed. Fire tests were conducted by varying the air flow rate at a constant fuel flow rate on aluminum 6061 test samples. Tests were conducted on samples of two different sizes, as previously described. The type A samples (101.6 mm x 101.6 mm; 4 in. x 4 in.) were small, covering only a small fraction of the burner exit area. The type B samples (304.8 mm x 304.8 mm; 12 in. x 12 in.) were larger than the burner exit area. This was done to see if the size of the test sample and the effect of the air flow rate had any impact on the fire test result.
29
Tests were conducted for three different test conditions for each sample plate: a baseline case, a case with higher air flow (“leaner” equivalence ratio), and a case with lesser air flow (“richer” equivalence ratio). Each test was performed twice. The purpose of the first set of tests was to determine the burn-through time, whereas the second set of tests was terminated at a predetermined time to compare the induced damage for the same flame exposure time. The TCs attached on the backside of the test samples allowed for monitoring of the temperature rise of the test sample with time. Because of the uniformity of temperature distribution on the back side of the test samples, an average temperature was used to represent the lumped sample back side temperature. Additionally, tests were conducted on the type B samples while calibrating the flame with the smaller (1.6-mm, 1/16-inch sheath diameter) TCs to evaluate the impact of TC size during temperature calibration. 4.1.1 Results of Fire Tests on Sample Plates: Effect of Air Flow
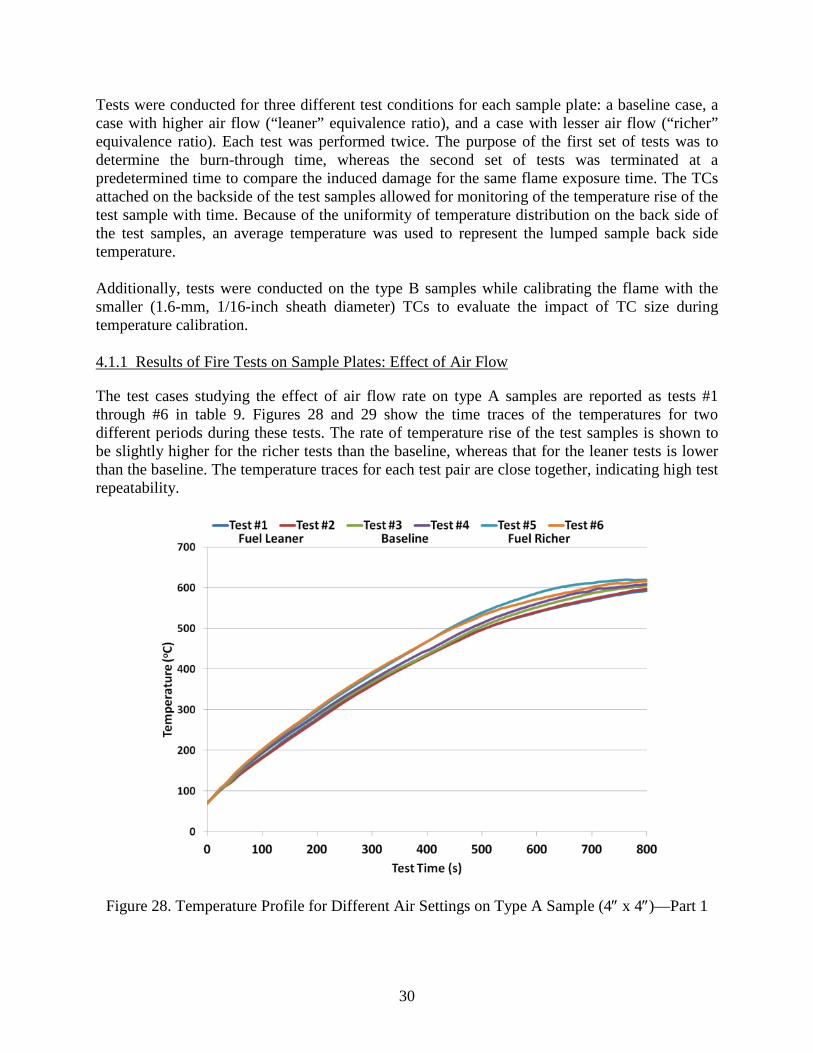
The test cases studying the effect of air flow rate on type A samples are reported as tests #1 through #6 in table 9. Figures 28 and 29 show the time traces of the temperatures for two different periods during these tests. The rate of temperature rise of the test samples is shown to be slightly higher for the richer tests than the baseline, whereas that for the leaner tests is lower than the baseline. The temperature traces for each test pair are close together, indicating high test repeatability.
Figure 28. Temperature Profile for Different Air Settings on Type A Sample (4″ x 4″)—Part 1
30

Figure 29. Temperature Profile for Different Air Settings on Type A Sample (4″ x 4″)—Part 2 Tests #2, #4, and #6 were terminated at 17 minutes. Figure 30 shows the type A test samples after these tests. Whereas the test sample for the richer case had completely burned through (figure 30(c)), the baseline case exhibited only small deformation near the top of the exposed area (figure 30(b)), and no surface deformation was observed for the leaner case (figure 30(a)).
(a) Fuel Leaner (Φ =0.74) (b) Baseline (Φ =0.80) (c) Fuel Richer (Φ =0.87)
Undamaged Surface Melted Burned Through
Figure 30. Type A Test Samples (4″ x 4″) After 17-Minute Fire Test
31
Air flow rate was shown to have had a significant impact on the fire test result, even though it did not affect the burner flame calibration as per the current calibration processes. This anomaly can be attributed to the change in the heat transfer coefficient, as explained in the previous section. The real flame temperature was expected to be inversely proportional to the air flow rate so that the damage caused by the flame should also be inversely proportional to the air flow rate, which is validated by the results of tests #1 through #6. In equation 2 (see section 1), the temperature difference between the real flame temperature and the measured temperature is inversely proportional to the heat transfer coefficient, h, so a higher heat transfer coefficient would make the temperature error smaller. A higher air flow rate would generate more efficient heat convection, thus yielding a higher value of h. As a result, the error between measured and real flame temperature would be smaller. However, because the measured temperature was comparable to other cases, it follows that the corrected flame temperature for a higher (leaner) air flow rate is lower than in the other cases, as table 9 demonstrates. This is the main reason the test sample survived longer for the higher air flow rate test conditions.
32
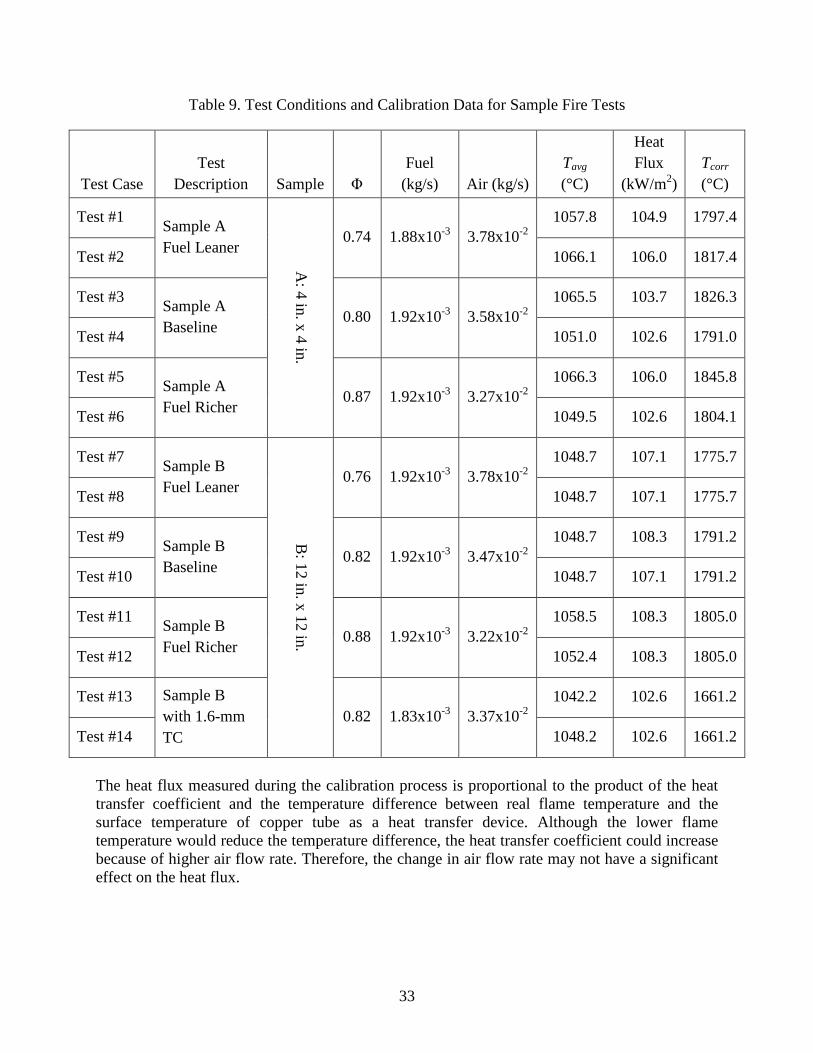
Table 9. Test Conditions and Calibration Data for Sample Fire Tests
Test Case Test
Description Sample Φ Fuel
(kg/s) Air (kg/s) Tavg (°C)
Heat Flux
(kW/m2) Tcorr (°C)
Test #1 Sample A Fuel Leaner
A: 4 in. x 4 in.
0.74 1.88x10⁻³ 3.78x10⁻² 1057.8 104.9 1797.4
Test #2 1066.1 106.0 1817.4
Test #3 Sample A Baseline
0.80 1.92x10⁻³ 3.58x10⁻² 1065.5 103.7 1826.3
Test #4 1051.0 102.6 1791.0
Test #5 Sample A Fuel Richer
0.87 1.92x10⁻³ 3.27x10⁻² 1066.3 106.0 1845.8
Test #6 1049.5 102.6 1804.1
Test #7 Sample B Fuel Leaner
B: 12 in. x 12 in.
0.76 1.92x10⁻³ 3.78x10⁻² 1048.7 107.1 1775.7
Test #8 1048.7 107.1 1775.7
Test #9 Sample B Baseline
0.82 1.92x10⁻³ 3.47x10⁻² 1048.7 108.3 1791.2
Test #10 1048.7 107.1 1791.2
Test #11 Sample B Fuel Richer
0.88 1.92x10⁻³ 3.22x10⁻² 1058.5 108.3 1805.0
Test #12 1052.4 108.3 1805.0
Test #13 Sample B with 1.6-mm TC
0.82 1.83x10⁻³ 3.37x10⁻² 1042.2 102.6 1661.2
Test #14 1048.2 102.6 1661.2
The heat flux measured during the calibration process is proportional to the product of the heat transfer coefficient and the temperature difference between real flame temperature and the surface temperature of copper tube as a heat transfer device. Although the lower flame temperature would reduce the temperature difference, the heat transfer coefficient could increase because of higher air flow rate. Therefore, the change in air flow rate may not have a significant effect on the heat flux.
33
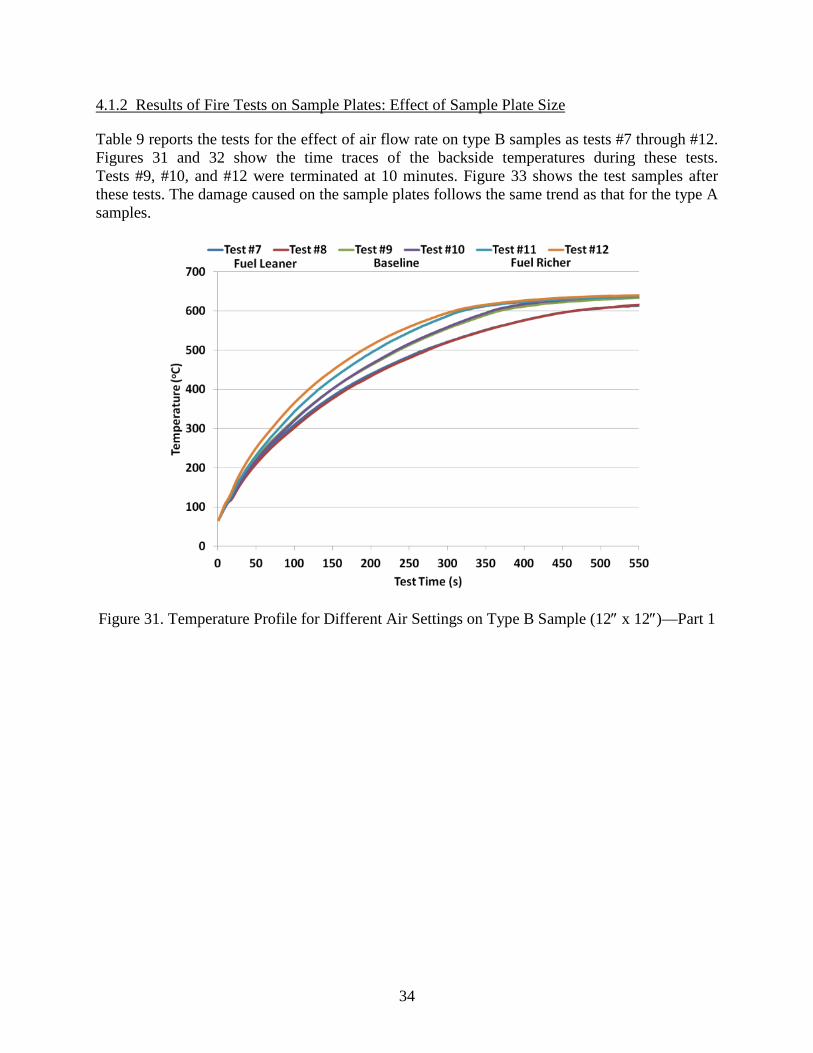
4.1.2 Results of Fire Tests on Sample Plates: Effect of Sample Plate Size
Table 9 reports the tests for the effect of air flow rate on type B samples as tests #7 through #12. Figures 31 and 32 show the time traces of the backside temperatures during these tests. Tests #9, #10, and #12 were terminated at 10 minutes. Figure 33 shows the test samples after these tests. The damage caused on the sample plates follows the same trend as that for the type A samples.
Figure 31. Temperature Profile for Different Air Settings on Type B Sample (12″ x 12″)—Part 1
34
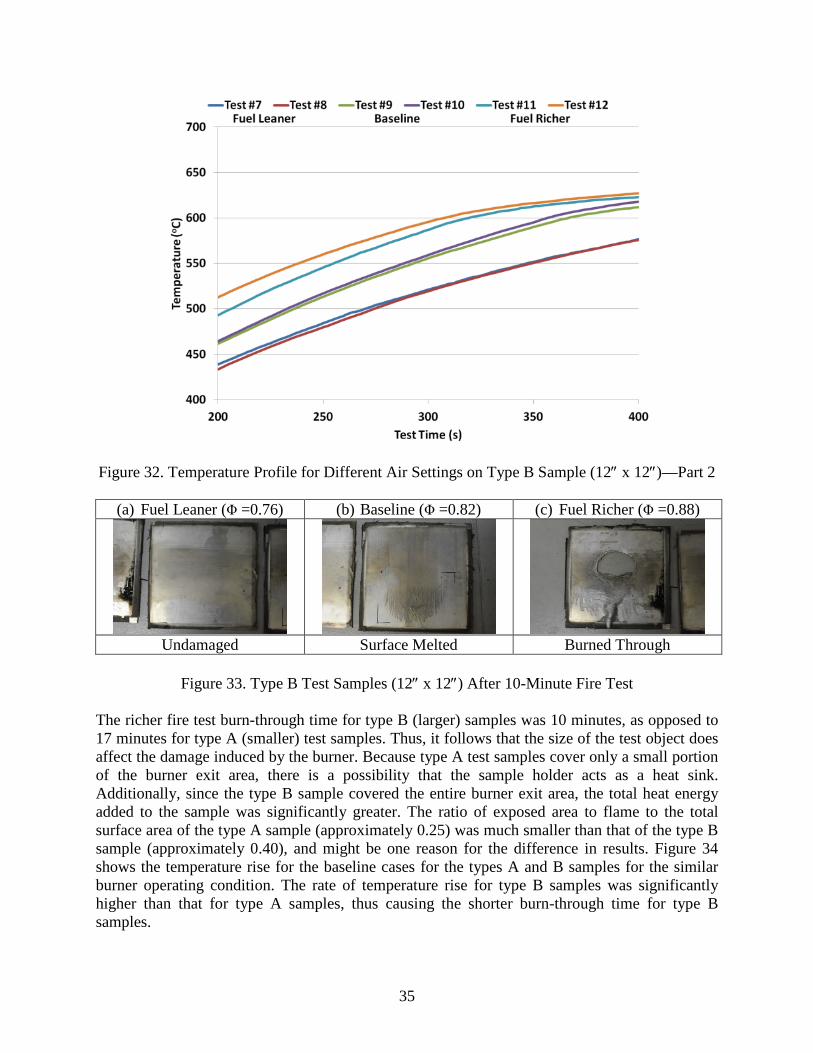
Figure 32. Temperature Profile for Different Air Settings on Type B Sample (12″ x 12″)—Part 2
(a) Fuel Leaner (Φ =0.76) (b) Baseline (Φ =0.82) (c) Fuel Richer (Φ =0.88)
Undamaged Surface Melted Burned Through
Figure 33. Type B Test Samples (12″ x 12″) After 10-Minute Fire Test
The richer fire test burn-through time for type B (larger) samples was 10 minutes, as opposed to 17 minutes for type A (smaller) test samples. Thus, it follows that the size of the test object does affect the damage induced by the burner. Because type A test samples cover only a small portion of the burner exit area, there is a possibility that the sample holder acts as a heat sink. Additionally, since the type B sample covered the entire burner exit area, the total heat energy added to the sample was significantly greater. The ratio of exposed area to flame to the total surface area of the type A sample (approximately 0.25) was much smaller than that of the type B sample (approximately 0.40), and might be one reason for the difference in results. Figure 34 shows the temperature rise for the baseline cases for the types A and B samples for the similar burner operating condition. The rate of temperature rise for type B samples was significantly higher than that for type A samples, thus causing the shorter burn-through time for type B samples.
35
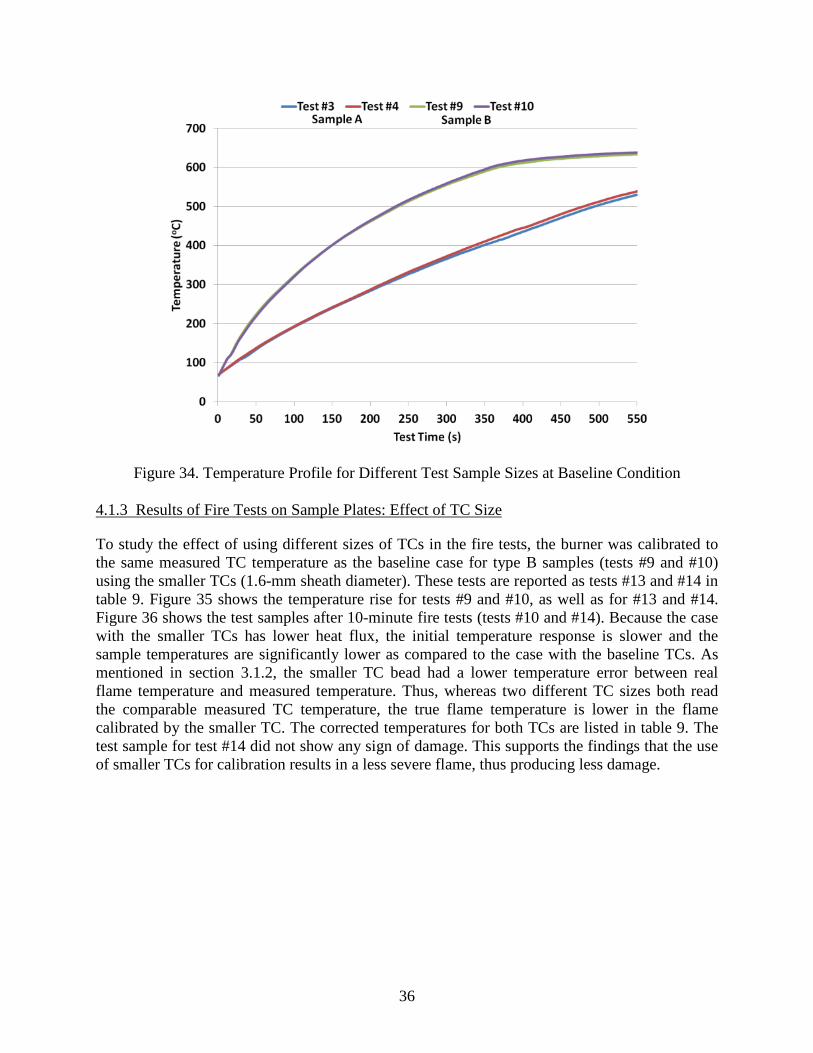
Figure 34. Temperature Profile for Different Test Sample Sizes at Baseline Condition 4.1.3 Results of Fire Tests on Sample Plates: Effect of TC Size
To study the effect of using different sizes of TCs in the fire tests, the burner was calibrated to the same measured TC temperature as the baseline case for type B samples (tests #9 and #10) using the smaller TCs (1.6-mm sheath diameter). These tests are reported as tests #13 and #14 in table 9. Figure 35 shows the temperature rise for tests #9 and #10, as well as for #13 and #14. Figure 36 shows the test samples after 10-minute fire tests (tests #10 and #14). Because the case with the smaller TCs has lower heat flux, the initial temperature response is slower and the sample temperatures are significantly lower as compared to the case with the baseline TCs. As mentioned in section 3.1.2, the smaller TC bead had a lower temperature error between real flame temperature and measured temperature. Thus, whereas two different TC sizes both read the comparable measured TC temperature, the true flame temperature is lower in the flame calibrated by the smaller TC. The corrected temperatures for both TCs are listed in table 9. The test sample for test #14 did not show any sign of damage. This supports the findings that the use of smaller TCs for calibration results in a less severe flame, thus producing less damage.
36
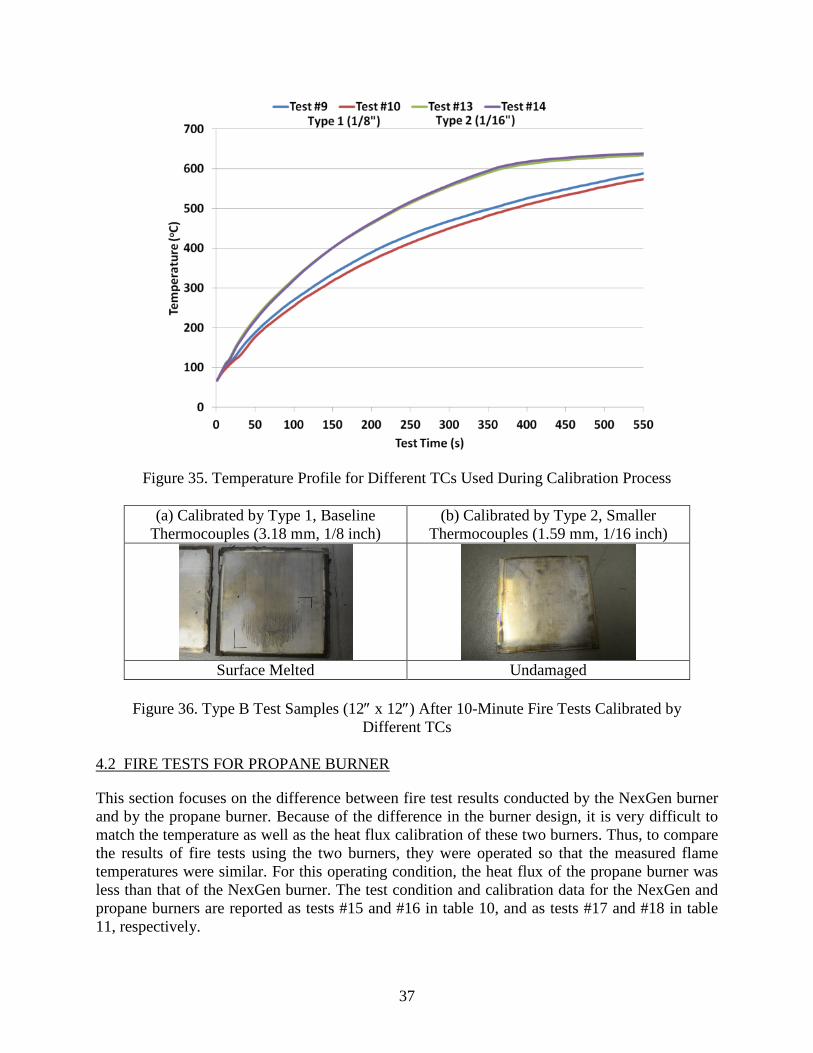
Figure 35. Temperature Profile for Different TCs Used During Calibration Process
(a) Calibrated by Type 1, Baseline Thermocouples (3.18 mm, 1/8 inch)
(b) Calibrated by Type 2, Smaller Thermocouples (1.59 mm, 1/16 inch)
Surface Melted Undamaged
Figure 36. Type B Test Samples (12″ x 12″) After 10-Minute Fire Tests Calibrated by
Different TCs 4.2 FIRE TESTS FOR PROPANE BURNER
This section focuses on the difference between fire test results conducted by the NexGen burner and by the propane burner. Because of the difference in the burner design, it is very difficult to match the temperature as well as the heat flux calibration of these two burners. Thus, to compare the results of fire tests using the two burners, they were operated so that the measured flame temperatures were similar. For this operating condition, the heat flux of the propane burner was less than that of the NexGen burner. The test condition and calibration data for the NexGen and propane burners are reported as tests #15 and #16 in table 10, and as tests #17 and #18 in table 11, respectively.
37
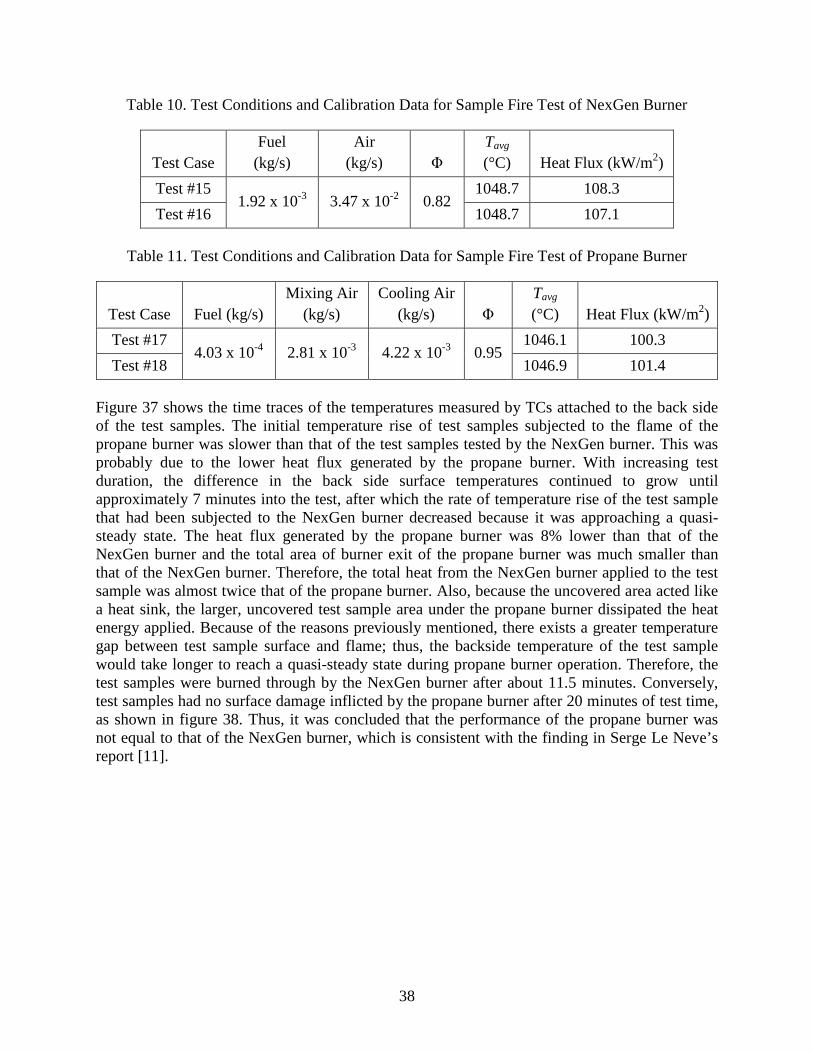
Table 10. Test Conditions and Calibration Data for Sample Fire Test of NexGen Burner
Test Case Fuel
(kg/s) Air
(kg/s) Φ Tavg (°C) Heat Flux (kW/m2)
Test #15 1.92 x 10⁻³ 3.47 x 10⁻² 0.82
1048.7 108.3 Test #16 1048.7 107.1
Table 11. Test Conditions and Calibration Data for Sample Fire Test of Propane Burner
Test Case Fuel (kg/s) Mixing Air
(kg/s) Cooling Air
(kg/s) Φ Tavg (°C) Heat Flux (kW/m2)
Test #17 4.03 x 10⁻⁴ 2.81 x 10⁻³ 4.22 x 10⁻³ 0.95
1046.1 100.3 Test #18 1046.9 101.4
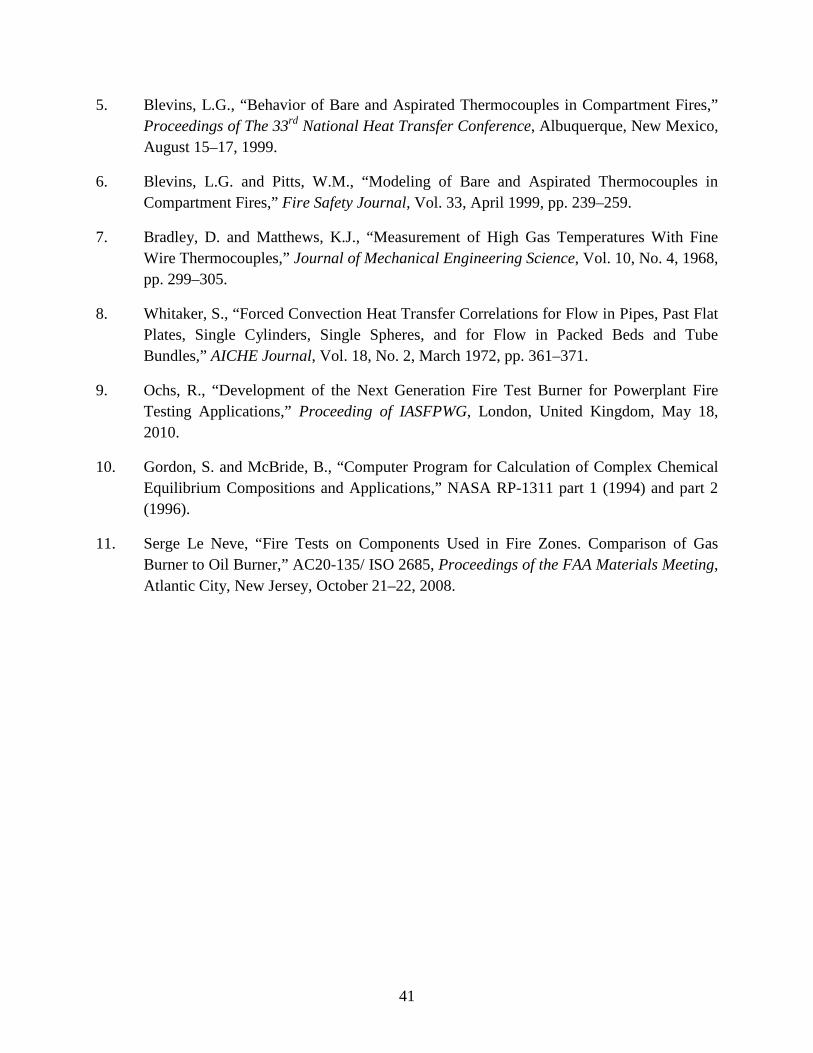
Figure 37 shows the time traces of the temperatures measured by TCs attached to the back side of the test samples. The initial temperature rise of test samples subjected to the flame of the propane burner was slower than that of the test samples tested by the NexGen burner. This was probably due to the lower heat flux generated by the propane burner. With increasing test duration, the difference in the back side surface temperatures continued to grow until approximately 7 minutes into the test, after which the rate of temperature rise of the test sample that had been subjected to the NexGen burner decreased because it was approaching a quasi-steady state. The heat flux generated by the propane burner was 8% lower than that of the NexGen burner and the total area of burner exit of the propane burner was much smaller than that of the NexGen burner. Therefore, the total heat from the NexGen burner applied to the test sample was almost twice that of the propane burner. Also, because the uncovered area acted like a heat sink, the larger, uncovered test sample area under the propane burner dissipated the heat energy applied. Because of the reasons previously mentioned, there exists a greater temperature gap between test sample surface and flame; thus, the backside temperature of the test sample would take longer to reach a quasi-steady state during propane burner operation. Therefore, the test samples were burned through by the NexGen burner after about 11.5 minutes. Conversely, test samples had no surface damage inflicted by the propane burner after 20 minutes of test time, as shown in figure 38. Thus, it was concluded that the performance of the propane burner was not equal to that of the NexGen burner, which is consistent with the finding in Serge Le Neve’s report [11].
38
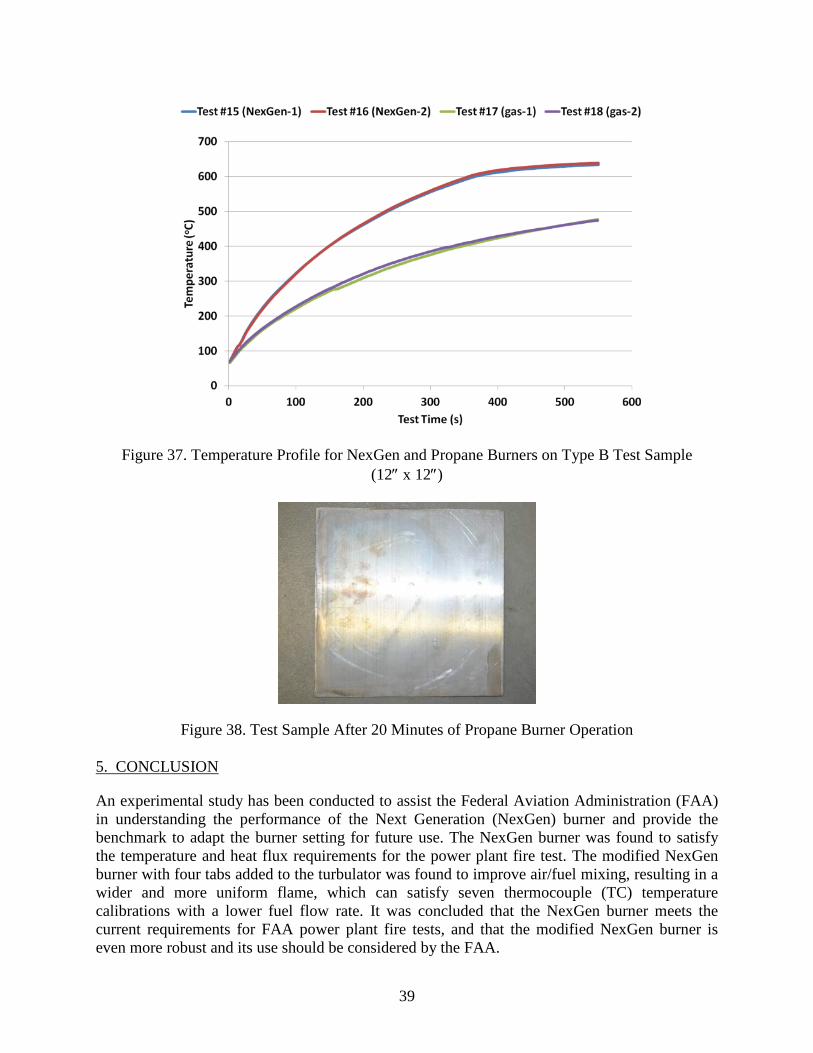
Figure 37. Temperature Profile for NexGen and Propane Burners on Type B Test Sample (12″ x 12″)
Figure 38. Test Sample After 20 Minutes of Propane Burner Operation 5. CONCLUSION
An experimental study has been conducted to assist the Federal Aviation Administration (FAA) in understanding the performance of the Next Generation (NexGen) burner and provide the benchmark to adapt the burner setting for future use. The NexGen burner was found to satisfy the temperature and heat flux requirements for the power plant fire test. The modified NexGen burner with four tabs added to the turbulator was found to improve air/fuel mixing, resulting in a wider and more uniform flame, which can satisfy seven thermocouple (TC) temperature calibrations with a lower fuel flow rate. It was concluded that the NexGen burner meets the current requirements for FAA power plant fire tests, and that the modified NexGen burner is even more robust and its use should be considered by the FAA.
39

Heat flux and TC temperature calibration from both gas and NexGen burners were found to be much more sensitive to a change in the fuel flow rate than to a change in the air flow rate. However, fire test results on the test sample were found to be sensitive to air flow rate as well. It is recommended that both the fuel and the air flow rate of NexGen and propane burners be controlled and metered for future FAA-required fire tests. Currently, there is a wide range of TC sizes that can be used for temperature calibration. The influence of TC size for flame calibration and fire test results was studied in this research. Two TC sizes, within the specification of FAA guidelines, were used in the temperature calibrations. It was found that the burner can satisfy the required temperature calibration with a lower fuel flow rate if the smaller sized TC is used. The burner calibrated with a smaller TC size will also induce less fire damage on the test sample. It is recommended that the FAA set up a tighter tolerance for the TC size used in temperature calibrations to limit the uncertainty of flame temperature measurement. Mixing/cooling air ratio is not a key factor for propane burner flame calibration. The difference in performance between NexGen and propane burners was evaluated to understand the discrepancy between them. Heat flux produced by a propane burner was found to be much lower than that produced by the NexGen burner, and the damage induced by the propane burner in a horizontal orientation was significantly less than that induced by the NexGen burner. Fire tests were conducted on two sample sizes. It was found that the smaller sample could survive longer under the same burner operating conditions. It is recommended that the sample size be specified for future FAA fire tests. It should be noted that the burner construction and settings discussed in this report are not representative of the most recent that are used on the Nexgen burner. For detailed construction drawings and to view other documentation and presentations that discuss the most up-to-date burner configurations, please see the FAA’s Fire Safety Branch’s website at www.fire.tc.faa.gov. 6. REFERENCES
1. “Aircraft—Environmental Test Procedure for Airborne Equipment—Resistance to Fire in Designated Fire Zones,” ISO 2685, 1998(E), second edition, December, 1998.
2. Advisory Circular 20-135, “Powerplant Installation and Propulsion System Component Fire Protection Test Methods, Standards, and Criteria,” U.S. Department of Transportation, Federal Aviation Administration, February 6, 1990.
3. Federal Aviation Administration, “Power Plant Engineering Report No. 3A: Standard Fire Test Apparatus and Procedure (for Flexible Hose Assemblies)” (revised), March, 1978.
4. Advisory Circular 33.17-1, “Fire Prevention,” U.S. Department of Transportation, Federal Aviation Administration, June 28, 2002.
40
5. Blevins, L.G., “Behavior of Bare and Aspirated Thermocouples in Compartment Fires,” Proceedings of The 33rd National Heat Transfer Conference, Albuquerque, New Mexico, August 15–17, 1999.
6. Blevins, L.G. and Pitts, W.M., “Modeling of Bare and Aspirated Thermocouples in Compartment Fires,” Fire Safety Journal, Vol. 33, April 1999, pp. 239–259.
7. Bradley, D. and Matthews, K.J., “Measurement of High Gas Temperatures With Fine Wire Thermocouples,” Journal of Mechanical Engineering Science, Vol. 10, No. 4, 1968, pp. 299–305.
8. Whitaker, S., “Forced Convection Heat Transfer Correlations for Flow in Pipes, Past Flat Plates, Single Cylinders, Single Spheres, and for Flow in Packed Beds and Tube Bundles,” AICHE Journal, Vol. 18, No. 2, March 1972, pp. 361–371.
9. Ochs, R., “Development of the Next Generation Fire Test Burner for Powerplant Fire Testing Applications,” Proceeding of IASFPWG, London, United Kingdom, May 18, 2010.
10. Gordon, S. and McBride, B., “Computer Program for Calculation of Complex Chemical Equilibrium Compositions and Applications,” NASA RP-1311 part 1 (1994) and part 2 (1996).
11. Serge Le Neve, “Fire Tests on Components Used in Fire Zones. Comparison of Gas Burner to Oil Burner,” AC20-135/ ISO 2685, Proceedings of the FAA Materials Meeting, Atlantic City, New Jersey, October 21–22, 2008.
41