Embed Size (px)
Citation preview

Double-looped Mach-Zehnder interferometer for achieving multiple ring-down interferograms
Jin Hwan Kim,1 Won Sik Kwon,1 Hyub Lee,1 Kyung-Soo Kim,1,2 and Soohyun Kim1,* 1Division of Mechanical Engineering, Korea Advanced Institute of Science and Technology (KAIST), Daejeon 305-
701, South Korea [email protected]
Abstract: We put forward a double-looped Mach-Zehnder interferometer for acquiring continuous ring-down interferograms with two fiber-loop cavities with slightly different optical path lengths. Each group of pulses through the sample and reference loops creates a ring-down pulse train with equal time intervals in Vernier fashion, and interferes with each other to produce multiple ring-down interferograms successively by scanning of a delay line. The system requires a scanning range of only a few millimeters to obtain multiple ring-down interferograms. In a proof-of-concept demonstration, the intrinsic losses of two loops are estimated. The measured combined-loss of both loops is compared to the sum of the loop losses measured separately with a conventional fiber-loop ring-down system. The result obtained using the proposed system exhibits a difference of only 0.06 dB with that of the reference system.
©2014 Optical Society of America
OCIS codes: (060.2370) Fiber optics sensors; (120.3180) Interferometry; (300.6340) Spectroscopy, infrared.
References and links 1. T. Stacewicz, J. Wojtas, Z. Bielecki, M. Nowakowski, J. Mikolajczyk, R. Medrzycki, and B. Rutecka, “Cavity
ring down spectroscopy: Detection of trace amounts of substance,” Opto-Electron. Rev. 20(1), 53–60 (2012).2. D. S. Moore, “Instrumentation for trace detection of high explosives,” Rev. Sci. Instrum. 75(8), 2499–2512
(2004).3. A. O’Keefe and D. A. G. Deacon, “Cavity ring‐down optical spectrometer for absorption measurements using
pulsed laser sources,” Rev. Sci. Instrum. 59(12), 2544–2551 (1988).4. A. Karpf and G. N. Rao, “Trace detection of no2 using cavity ring-down spectroscopy and a diode laser,” in
Conference on Lasers & Electro-Optics, (Optical Society of America, 2013), paper JW2A.73.5. G. Stewart, K. Atherton, H. B. Yu, and B. Culshaw, “An investigation of an optical fibre amplifier loop for intra-
cavity and ring-down cavity loss measurements,” Meas. Sci. Technol. 12(7), 843–849 (2001).6. R. S. Brown, I. Kozin, Z. Tong, R. D. Oleschuk, and H. P. Loock, “Fiber-loop ring-down spectroscopy,” J.
Chem. Phys. 117(23), 10444–10447 (2002).7. Z. Wang, M. Jiang, H. Xu, and R. Du, “New optical fiber micro-bend pressure sensors based on fiber-loop
ringdown,” in Proccedings of International Conference on Information, Computing and Telecommunications, (Elsevier, 2012), pp. 4234–4238.
8. H. Qiu, Y. Qiu, Z. Chen, B. Fu, X. Chen, and G. Li, “Multimode fiber loop ring down spectroscopy for pressuremeasurement,” in Conference on Lasers & Electro-Optics, (Optical Society of America, 2007), paper CThKK6.
9. C. Wang and S. T. Scherrer, “Fiber loop ringdown for physical sensor development: Pressure sensor,” Appl. Opt. 43(35), 6458–6464 (2004).
10. C. J. Wang, “Fiber ringdown temperature sensors,” Opt. Eng. 44(3), 030503 (2005). 11. T. Hiraoka, T. Ohta, M. Ito, N. Nishizawa, and M. Hori, “Optical-fiber-type broadband cavity ring-down
spectroscopy using wavelength-tunable ultrashort pulsed light,” Jpn. J. Appl. Phys. 52(4), 040201 (2013). 12. C. Wang, M. Kaya, and C. Wang, “Evanescent field-fiber loop ringdown glucose sensor,” J. Biomed. Opt. 17(3),
037004 (2012). 13. C. Herath, C. Wang, M. Kaya, and D. Chevalier, “Fiber loop ringdown DNA and bacteria sensors,” J. Biomed.
Opt. 16(5), 050501 (2011).14. H. Waechter, J. Litman, A. H. Cheung, J. A. Barnes, and H. P. Loock, “Chemical sensing using fiber cavity ring-
down spectroscopy,” Sensors (Basel) 10(3), 1716–1742 (2010).
#222558 - $15.00 USD Received 5 Sep 2014; revised 26 Oct 2014; accepted 30 Oct 2014; published 6 Nov 2014(C) 2014 OSA 17 November 2014 | Vol. 22, No. 23 | DOI:10.1364/OE.22.028353 | OPTICS EXPRESS 28353
15. H. Waechter, K. Bescherer, C. J. Dürr, R. D. Oleschuk, and H. P. Loock, “405 nm absorption detection in nanoliter volumes,” Anal. Chem. 81(21), 9048–9054 (2009).
16. H. F. Huang and K. K. Lehmann, “CW cavity ring-down spectroscopy (crds) with a semiconductor optical amplifier as intensity modulator,” Chem. Phys. Lett. 463(1–3), 246–250 (2008).
17. W. V. Houston, “A compound interferometer for fine structure work,” Phys. Rev. 29(3), 478–484 (1927). 18. J. Capmany and M. A. Muriel, “Double-cavity fiber structures as all optical timing extraction circuits for gigabit
networks,” Fiber Integrated Opt. 12(3), 247–255 (1993). 19. Y. Ja, “Vernier operation of fiber ring and loop resonators,” Fiber Integrated Opt. 14(3), 225–244 (1995). 20. L. Jin, M. Li, and J.-J. He, “Highly-sensitive silicon-on-insulator sensor based on two cascaded micro-ring
resonators with vernier effect,” Opt. Commun. 284(1), 156–159 (2011). 21. R. Boeck, N. A. Jaeger, N. Rouger, and L. Chrostowski, “Series-coupled silicon racetrack resonators and the
Vernier effect: Theory and measurement,” Opt. Express 18(24), 25151–25157 (2010). 22. O. Schwelb and I. Frigyes, “Vernier operation of series‐coupled optical microring resonator filters,” Microw.
Opt. Technol. Lett. 39(4), 257–261 (2003). 23. S. Schiller, “Spectrometry with frequency combs,” Opt. Lett. 27(9), 766–768 (2002). 24. J. Mandon, G. Guelachvili, and N. Picqué, “Fourier transform spectroscopy with a laser frequency comb,” Nat.
Photonics 3(2), 99–102 (2009). 25. D. W. Chandler and K. E. Strecker, “Dual-etalon frequency-comb cavity ringdown spectrometer,” J. Chem.
Phys. 136(15), 154201 (2012). 26. J. H. Kim, W. S. Kwon, H. Lee, K.-S. Kim, and S. Kim, “A novel method to acquire ring-down interferograms
using a double-looped mach-zehnder interferometer,” in Conference on Lasers & Electro-Optics: Science and Innovations, (Optical Society of America, 2014), paper SM3E. 3.
27. R. Trebino, Frequency-Resolved Optical Gating: The Measurement of Ultrashort Laser Pulses: The Measurement of Ultrashort Laser Pulses (Springer, 2000).
28. S. Y. Ryu, K.-S. Kim, J. Kim, and S. Kim, “Degradation of optical properties of a film-type single-wall carbon nanotubes saturable absorber (swnt-sa) with an er-doped all-fiber laser,” Opt. Express 20(12), 12966–12974 (2012).
29. D. W. Stowe, D. R. Moore, and R. G. Priest, “Polarization fading in fiber interferometric sensors,” IEEE J. Quantum Electron. 18(10), 1644–1647 (1982).
30. A. D. Kersey, M. J. Marrone, A. Dandridge, and A. B. Tveten, “Optimization and stabilization of visibility in interferometric fiber-optic sensors using input-polarization control,” J. Lightwave Technol. 6(10), 1599–1609 (1988).
31. A. D. Kersey, M. J. Marrone, and M. A. Davis, “Polarization-insensitive fiber optic michelson interferometer,” Electron. Lett. 27(6), 518–520 (1991).
32. N. Ming, H. Y. Yang, S. D. Xiong, and Y. M. Hu, “Investigation of polarization-induced fading in fiber-optic interferometers with polarizer-based polarization diversity receivers,” Appl. Opt. 45(11), 2387–2390 (2006).
33. X. Y. Dong, H. Y. Tam, and P. Shum, “Temperature-insensitive strain sensor with polarization-maintaining photonic crystal fiber based sagnac interferometer,” Appl. Phys. Lett. 90(15), 151113 (2007).
1. Introduction
Recently, the detection of trace molecules has received considerable attention in fields such as environmental monitoring, industry, biology, natural science and military applications [1, 2]. Cavity ring-down spectroscopy (CRDS) is used in highly sensitive trace gas sensors [3]. CRDS systems are commonly composed of a pair of high-finesse mirrors that form a ring-down cavity. This cavity elongates the length of interaction between the light and the sample to several hundred times longer than the length of the cavity. This effect allows one to detect trace amounts of molecules in the gas phase at the ppb level by measuring the intensity decay rate of the portion of light leaving the cavity [4]. Due to its use of a bulk cavity, CRDS is primarily used in the detection of gas-phase molecules. To overcome the limits of this technique, fiber optics have been exploited in the study and improvement of fiber-loop ring-down spectroscopy (FLRDS) [5]. FLRDS was newly coined by Brown et al [6]. Because of the existence of various types of fiber sensing modules, FLRDS can be used in a wide variety of applications, such as the measurement of pressure [7–9] and temperature [10], the measurement of bio-sample concentrations [11–13], and chemical sensing [14] even in the detection of liquid-phase samples in small volumes down to the nanoliter level [15].
In general, the source is switched off to measure the intensity of the exponentially decaying light, thus determining the ring-down time. The ring-down time is computed by fitting the exponentially decaying signal. Thus, regardless of its simplicity, the system requires a fast optical switch, such as an electro-optic modulator (EOM) or an acoustic-optic
#222558 - $15.00 USD Received 5 Sep 2014; revised 26 Oct 2014; accepted 30 Oct 2014; published 6 Nov 2014(C) 2014 OSA 17 November 2014 | Vol. 22, No. 23 | DOI:10.1364/OE.22.028353 | OPTICS EXPRESS 28354

modulator (AOM) [16]. Moreover, a fast detector is required because of the brevity of the ring-down time, which ranges from a few tens of nanoseconds to a few hundreds of microseconds.
Recently, a ring-down time measurement based on the peaks of multiple interferograms was introduced [11]. An interferometric system was developed to acquire ring-down interferograms using a slow balanced photodiode detector and an optical switching module to enhance the signal-to-noise ratio (SNR). The spectrum obtained using this system was in agreement with the result obtained via conventional absorption spectroscopy. Although this method has succeeded in measuring glucose concentrations, an optical switch module and several fibers are required to induce a time delay between one and fifteen times longer than the sample cavity. These additional components restrict the number of interferograms that can be obtained and limit the accuracy of the calculation of the ring-down time.
To overcome the aforementioned difficulties, we focused on establishing a simple mechanism and we found that the Vernier fashioned schematic can be applied to solve the problem. The Vernier operation was proposed a few decades ago [17]. When single cavities, whose free spectral ranges (FSRs) determined by their effective cavity lengths are slightly different, are coupled with a certain condition, the transfer function of the system can be produced by the two individual cavities. It was normally utilized in communication applications as a technique for optical timing extraction [18], or a solution to overcome an upper limit for the free spectral range (FSR) linked to the ring radius [19]. To obtain the Vernier effect, several individual single cavities or ring loops are sequentially concatenated and form a series-coupled resonator [20–22]. There are numerous research results based on this effect in spectroscopy such as a so-called multi-heterodyne technique by using two individual different frequency-comb lasers with slightly different repetition rates [23, 24]. Each pair of adjacent combs creates a beating frequency, resulting in spectral information that is achievable with conventional electronics [23]. Armed with this technique, the dual-etalon frequency-comb cavity ringdown spectrometer was proposed as presented in Ref [25]. It uses a so-called multi-heterodyne technique to increase across the bandwidth of the lasers and interfere with two beams to form an interferogram in time domain with high-performance devices such as a fast photomultiplier tube and an oscilloscope.
A so-called double-looped Mach-Zehnder interferometer (DL-MZI) was presented in [26]. This system has a schematic composed of Vernier-fashioned two loops, which have slightly different cavity lengths. The two-loop configuration plays a key role in obtaining ring-down interferograms with a remarkably short delay line using a slow detector. The important aspect of this system is that laser sources that range from a few picoseconds to hundreds of femtoseconds can be used for this technique. Considering that general supercontinuum sources have a pulse duration in that range, the proposed technique can be utilized with broadband frequency combs. In addition, the proposed technique has potential in utilizing fiber-based broadband sources and obtaining spectral ring-down time simultaneously by fourier transforming the obtained multiple ring-down interferograms. This method is similar to that presented by Chandler et al [25]. The proposed system can be a useful solution especially in the infrared range, where fast photodetectors are not easily available.
In this paper, we introduce the principle of the proposed system and describe the behavior of the two loops in detail. An assessment of the system performance conducted by accurately measuring the net loss of the two loops is presented. The contents of the spectral information obtained simultaneously via fourier transforming ring-down interferograms are excluded here.
2. Principle
The interferometric system proposed in this paper is depicted in Fig. 1(a). This system consists of two fiber loops, which act as double cavities. The two fiber-loop cavities have slightly different lengths. Each group of pulses through the sample and reference loops creates a ring-down pulse train with equal time intervals of τsam = lsam × n / c and τref = lref × n /
#222558 - $15.00 USD Received 5 Sep 2014; revised 26 Oct 2014; accepted 30 Oct 2014; published 6 Nov 2014(C) 2014 OSA 17 November 2014 | Vol. 22, No. 23 | DOI:10.1364/OE.22.028353 | OPTICS EXPRESS 28355
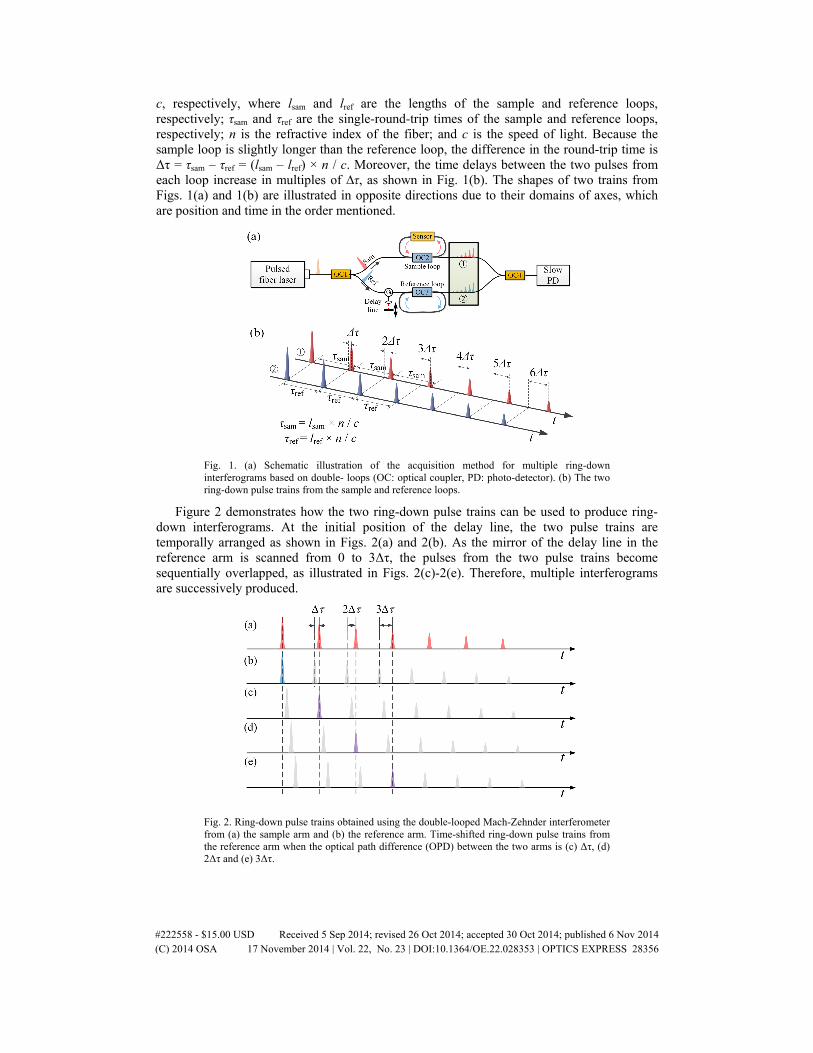
c, respectively, where lsam and lref are the lengths of the sample and reference loops, respectively; τsam and τref are the single-round-trip times of the sample and reference loops, respectively; n is the refractive index of the fiber; and c is the speed of light. Because the sample loop is slightly longer than the reference loop, the difference in the round-trip time is Δτ = τsam – τref = (lsam – lref) × n / c. Moreover, the time delays between the two pulses from each loop increase in multiples of ∆τ, as shown in Fig. 1(b). The shapes of two trains from Figs. 1(a) and 1(b) are illustrated in opposite directions due to their domains of axes, which are position and time in the order mentioned.
Fig. 1. (a) Schematic illustration of the acquisition method for multiple ring-down interferograms based on double- loops (OC: optical coupler, PD: photo-detector). (b) The two ring-down pulse trains from the sample and reference loops.
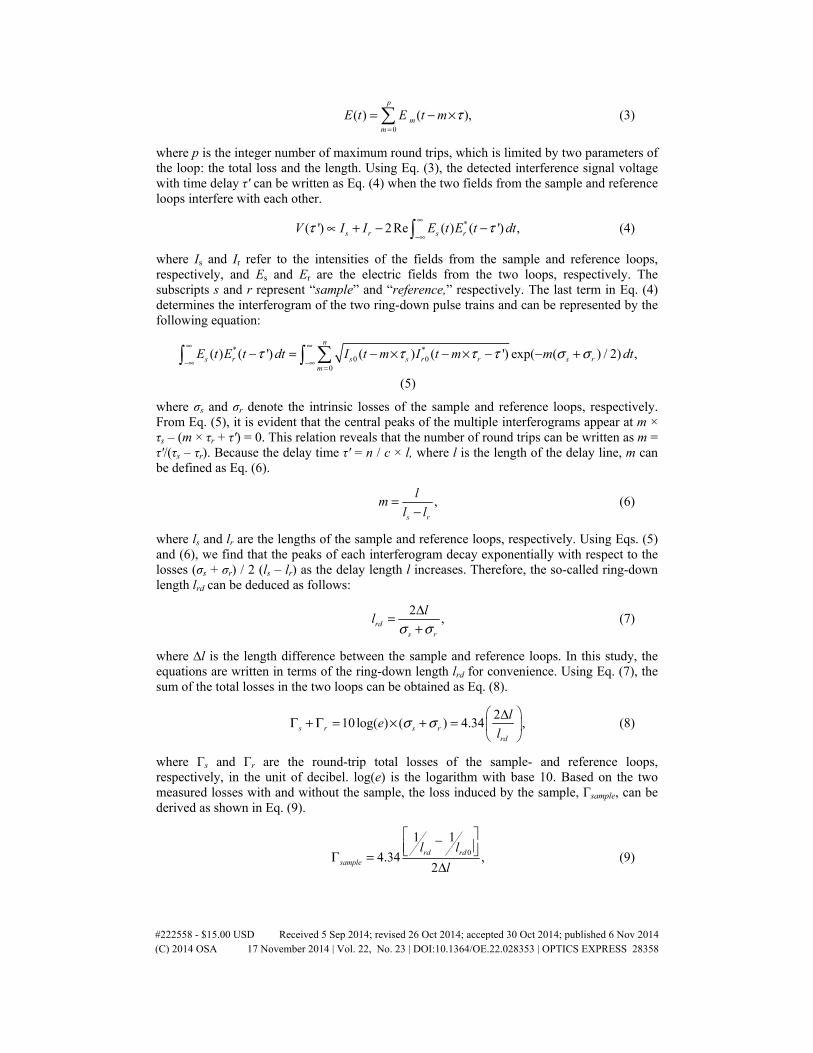
Figure 2 demonstrates how the two ring-down pulse trains can be used to produce ring-down interferograms. At the initial position of the delay line, the two pulse trains are temporally arranged as shown in Figs. 2(a) and 2(b). As the mirror of the delay line in the reference arm is scanned from 0 to 3Δτ, the pulses from the two pulse trains become sequentially overlapped, as illustrated in Figs. 2(c)-2(e). Therefore, multiple interferograms are successively produced.
Fig. 2. Ring-down pulse trains obtained using the double-looped Mach-Zehnder interferometer from (a) the sample arm and (b) the reference arm. Time-shifted ring-down pulse trains from the reference arm when the optical path difference (OPD) between the two arms is (c) Δτ, (d) 2Δτ and (e) 3Δτ.
#222558 - $15.00 USD Received 5 Sep 2014; revised 26 Oct 2014; accepted 30 Oct 2014; published 6 Nov 2014(C) 2014 OSA 17 November 2014 | Vol. 22, No. 23 | DOI:10.1364/OE.22.028353 | OPTICS EXPRESS 28356

The expected result is presented in Fig. 3, which consists of multiple interferograms. The peak intensities of each interferogram decay exponentially as a function of the number of round trips and the total losses of the two loops, and hence, these multiple interferograms are termed “ring-down interferograms,” a concept that is presented for the first time in this paper. An experimental confirmation of the acquisition of ring-down interferograms using the proposed system was performed using a fast detector and an oscilloscope, as shown in Fig. 4. The result indicates that interference occurs only between every two ring-down pulses.
Fig. 3. The expected result consisting of ring-down interferograms, which can be obtained using two ring-down pulse trains.
Fig. 4. Experimental confirmation of the interference phenomena observed using an oscilloscope with time delays of (a) 2Δτ and (b) 3Δτ as the time difference was adjusted from 0 to 6Δτ.
The ring-down interferograms can be described using the following mathematical approach. The pulse electric field emitted from the source is divided by an output coupler and enters the two arms, called the sample and reference arms. Each field passes into the so-called “ring-down loop” cavity coupled to each arm, and a portion of the field leaks out, at a ratio determined by the coupler used to fabricate the ring-down loop. According to [27], the electric field of a pulse from either the sample or the reference loop after m round trips can be described as Eq. (1).
0
1( ) ( ) exp( [ ( )]) . .,
2m m m m m mE t I t j t t c cω φ= − + (1)
where tm is time in the reference frame of the pulse. We define the time as tm = t – m × τ where m is the number of round trips and τ is the time interval of each loops. w0 is the carrier frequency, φ is the phase of the pulse, and c.c. is the complex conjugate of the first term. Im(tm) is the time-dependent intensity of the field, which is given by Eq. (2).
0( ) ( ) exp( ),m m mI t I t mσ= − (2)
where I0(tm) is the time-dependent intensity of the initial pulse, i.e., when the pulse is a Gaussian pulse, I0(tm) = A × exp (−(tm/Δt)2) where A is the peak intensity of the pulse and Δt is its root-mean-square (rms) pulse duration. σ is the round-trip total loss of loop. As mentioned previously, these pulses Em form a ring-down pulse train E with a constant time interval τ:
#222558 - $15.00 USD Received 5 Sep 2014; revised 26 Oct 2014; accepted 30 Oct 2014; published 6 Nov 2014(C) 2014 OSA 17 November 2014 | Vol. 22, No. 23 | DOI:10.1364/OE.22.028353 | OPTICS EXPRESS 28357
0
( ) ( ),p
mm
E t E t m τ=
= − × (3)
where p is the integer number of maximum round trips, which is limited by two parameters of the loop: the total loss and the length. Using Eq. (3), the detected interference signal voltage with time delay τ' can be written as Eq. (4) when the two fields from the sample and reference loops interfere with each other.
*( ') 2Re ( ) ( ') ,s r s rV I I E t E t dtτ τ∞
−∞∝ + − − (4)
where Is and Ir refer to the intensities of the fields from the sample and reference loops, respectively, and Es and Er are the electric fields from the two loops, respectively. The subscripts s and r represent “sample” and “reference,” respectively. The last term in Eq. (4) determines the interferogram of the two ring-down pulse trains and can be represented by the following equation:
* *0 0
0
( ) ( ') ( ) ( ') exp( ( ) / 2) ,n
s r s s r r s rm
E t E t dt I t m I t m m dtτ τ τ τ σ σ∞ ∞
−∞ −∞=
− = − × − × − − + (5)
where σs and σr denote the intrinsic losses of the sample and reference loops, respectively. From Eq. (5), it is evident that the central peaks of the multiple interferograms appear at m × τs – (m × τr + τ') = 0. This relation reveals that the number of round trips can be written as m = τ'/(τs – τr). Because the delay time τ' = n / c × l, where l is the length of the delay line, m can be defined as Eq. (6).
,s r
lm
l l=
− (6)
where ls and lr are the lengths of the sample and reference loops, respectively. Using Eqs. (5) and (6), we find that the peaks of each interferogram decay exponentially with respect to the losses (σs + σr) / 2 (ls – lr) as the delay length l increases. Therefore, the so-called ring-down length lrd can be deduced as follows:
2
,rds r
ll
σ σΔ=+
(7)
where ∆l is the length difference between the sample and reference loops. In this study, the equations are written in terms of the ring-down length lrd for convenience. Using Eq. (7), the sum of the total losses in the two loops can be obtained as Eq. (8).
2
10log( ) ( ) 4.34 ,s r s rrd
le
lσ σ
ΔΓ + Γ = × + =
(8)
where Γs and Γr are the round-trip total losses of the sample- and reference loops, respectively, in the unit of decibel. log(e) is the logarithm with base 10. Based on the two measured losses with and without the sample, the loss induced by the sample, Γsample, can be derived as shown in Eq. (9).
0
1 1
4.34 ,2
rd rdsample
l l
l
− Γ =Δ
(9)
#222558 - $15.00 USD Received 5 Sep 2014; revised 26 Oct 2014; accepted 30 Oct 2014; published 6 Nov 2014(C) 2014 OSA 17 November 2014 | Vol. 22, No. 23 | DOI:10.1364/OE.22.028353 | OPTICS EXPRESS 28358

where lrd and lrd0 are the ring-down lengths corresponding to the cases in which the sample is present in and absent from the cavity, respectively.
A comparison of performance based on the results obtained using a conventional interferometer demonstrates the advantages of the proposed system. Figure 5(a) presents the two ring-down pulse trains obtained using the proposed system. This figure demonstrates that a time delay of only τ' = k × ∆τ is required to achieve k ring-down interferograms, meaning that a spatial delay of lDL = k × ∆τ × c / n = k × ∆l is necessary, where the subscript DL represents “double-looped.” The necessary delay is proportional not to the absolute lengths of the sample and reference loops but only to the length difference ∆l between them. The result would be same even in the case of two longer loops with the same length difference. Figure 5(b) presents a ring-down pulse train and reference pulse obtained using a single-looped Mach-Zehnder interferometer (SL-MZI). When using an SL-MZI, a delay length of lSL = k × τs × c / n = k × ls is necessary to achieve k ring-down interferograms, where the subscript SL represents “single-looped.” This result indicates that the single-looped interferometer requires a delay length of r = lSL / lDL = τs / ∆τ = ls / ∆l times longer than that needed for the proposed system. For example, for sample and reference loops with lengths of approximately 600.6 mm and 600 mm, respectively, with a length difference of only 0.6 mm, r would be 1000, meaning that the delay length required by the proposed system would be 1000 times shorter than the length required when using the single-looped interferometer.
Fig. 5. Ring-down pulse trains obtained using (a) a double-looped interferometer and (b) a single-looped interferometer.
This technique therefore overcomes all of the aforementioned obstacles reported in [10]. The delay required to achieve multiple interferograms using only two passive loops is in good agreement with that required by the previously discussed method using the optical switch module and several pieces of fiber, and there is no limit on the maximum achievable number of interferograms.
3. Experimental setup and results
We fabricated a DL-MZI, as shown in Fig. 6, and the total losses of the two loops, which consisted of 50/50 couplers, were measured. The DL-MZI was formed of two loops whose fiber strands were gently measured for length and carefully cut to form two loops with a sub-millimeter difference in path length. The fiber loops had lengths of 404 mm and 404.6 mm. The two loops were kept stable and free of sharp bends. The experiment was performed using an erbium-doped fiber laser (EDFL) [28] that was passively mode-locked using a carbon-nanotube saturable absorber (CNT-SA) and generated pulses with a pulse duration of approximately 200 fs and a spectral bandwidth of 13.8 nm. The output power was 3.5 mW at 1550 nm. A 1-MHz InGaAs amplified detector (Model PDA10CS, Newport) was employed to measure the interference signal. The output from the detector was recorded using a data acquisition board (Model PCI-MIO-16XE-10, National Instruments), and a LabVIEW program was used to control the various instruments and process the data. A 25-mm
#222558 - $15.00 USD Received 5 Sep 2014; revised 26 Oct 2014; accepted 30 Oct 2014; published 6 Nov 2014(C) 2014 OSA 17 November 2014 | Vol. 22, No. 23 | DOI:10.1364/OE.22.028353 | OPTICS EXPRESS 28359
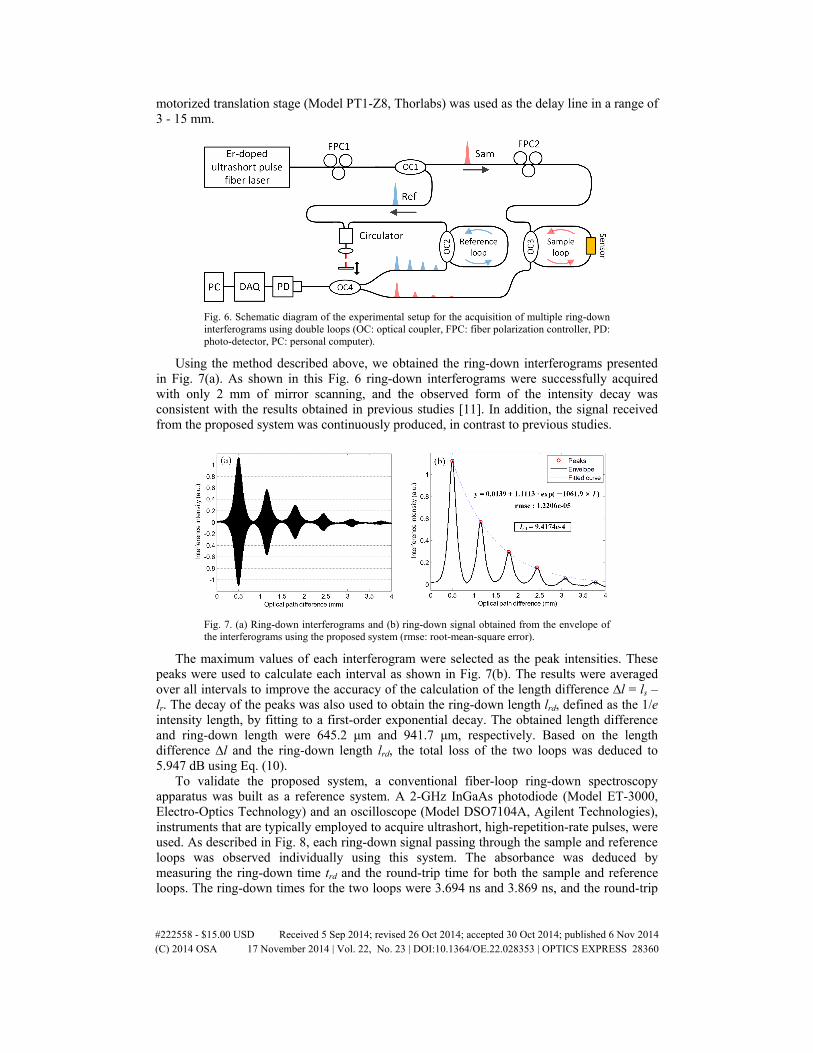
motorized translation stage (Model PT1-Z8, Thorlabs) was used as the delay line in a range of 3 - 15 mm.
Fig. 6. Schematic diagram of the experimental setup for the acquisition of multiple ring-down interferograms using double loops (OC: optical coupler, FPC: fiber polarization controller, PD: photo-detector, PC: personal computer).
Using the method described above, we obtained the ring-down interferograms presented in Fig. 7(a). As shown in this Fig. 6 ring-down interferograms were successfully acquired with only 2 mm of mirror scanning, and the observed form of the intensity decay was consistent with the results obtained in previous studies [11]. In addition, the signal received from the proposed system was continuously produced, in contrast to previous studies.
Fig. 7. (a) Ring-down interferograms and (b) ring-down signal obtained from the envelope of the interferograms using the proposed system (rmse: root-mean-square error).
The maximum values of each interferogram were selected as the peak intensities. These peaks were used to calculate each interval as shown in Fig. 7(b). The results were averaged over all intervals to improve the accuracy of the calculation of the length difference ∆l = ls – lr. The decay of the peaks was also used to obtain the ring-down length lrd, defined as the 1/e intensity length, by fitting to a first-order exponential decay. The obtained length difference and ring-down length were 645.2 μm and 941.7 μm, respectively. Based on the length difference ∆l and the ring-down length lrd, the total loss of the two loops was deduced to 5.947 dB using Eq. (10).
To validate the proposed system, a conventional fiber-loop ring-down spectroscopy apparatus was built as a reference system. A 2-GHz InGaAs photodiode (Model ET-3000, Electro-Optics Technology) and an oscilloscope (Model DSO7104A, Agilent Technologies), instruments that are typically employed to acquire ultrashort, high-repetition-rate pulses, were used. As described in Fig. 8, each ring-down signal passing through the sample and reference loops was observed individually using this system. The absorbance was deduced by measuring the ring-down time trd and the round-trip time for both the sample and reference loops. The ring-down times for the two loops were 3.694 ns and 3.869 ns, and the round-trip
#222558 - $15.00 USD Received 5 Sep 2014; revised 26 Oct 2014; accepted 30 Oct 2014; published 6 Nov 2014(C) 2014 OSA 17 November 2014 | Vol. 22, No. 23 | DOI:10.1364/OE.22.028353 | OPTICS EXPRESS 28360
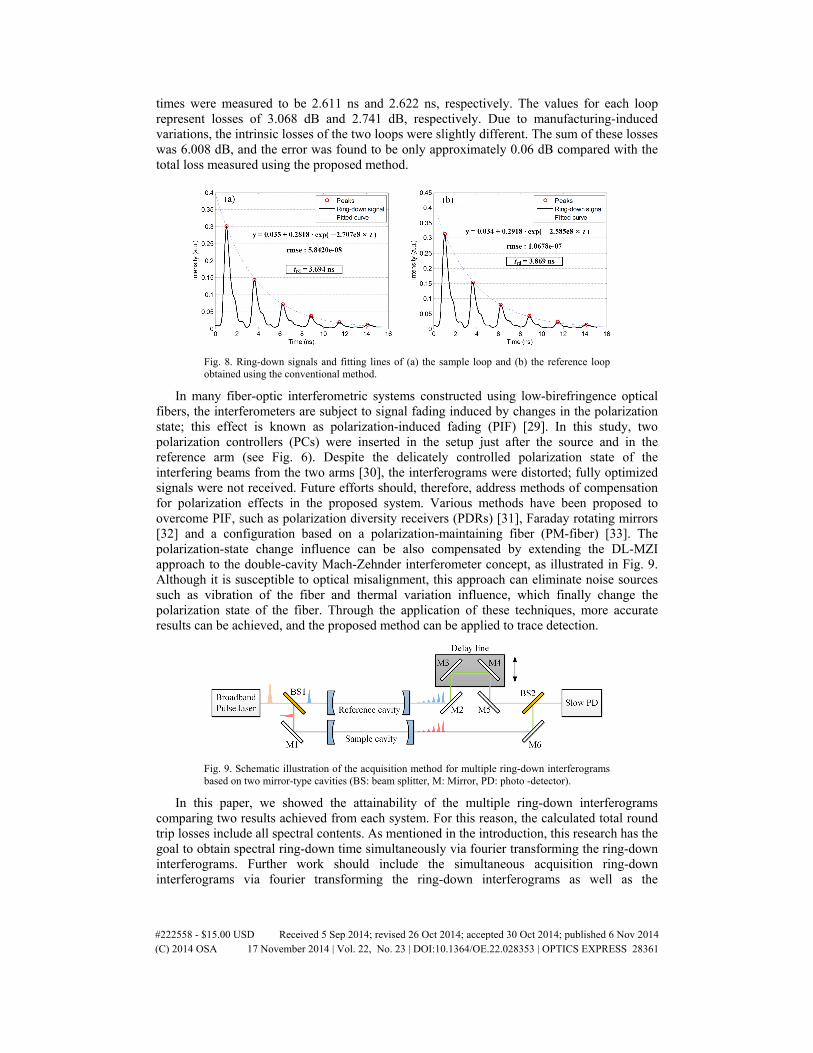
times were measured to be 2.611 ns and 2.622 ns, respectively. The values for each loop represent losses of 3.068 dB and 2.741 dB, respectively. Due to manufacturing-induced variations, the intrinsic losses of the two loops were slightly different. The sum of these losses was 6.008 dB, and the error was found to be only approximately 0.06 dB compared with the total loss measured using the proposed method.
Fig. 8. Ring-down signals and fitting lines of (a) the sample loop and (b) the reference loop obtained using the conventional method.
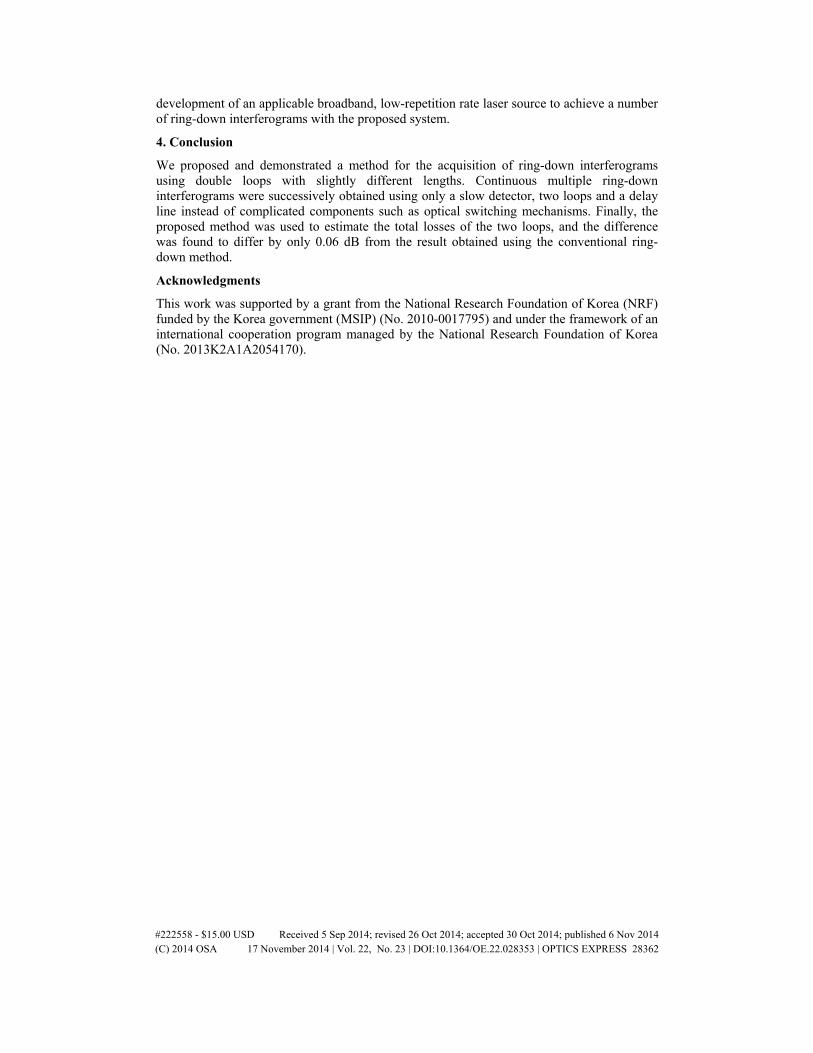
In many fiber-optic interferometric systems constructed using low-birefringence optical fibers, the interferometers are subject to signal fading induced by changes in the polarization state; this effect is known as polarization-induced fading (PIF) [29]. In this study, two polarization controllers (PCs) were inserted in the setup just after the source and in the reference arm (see Fig. 6). Despite the delicately controlled polarization state of the interfering beams from the two arms [30], the interferograms were distorted; fully optimized signals were not received. Future efforts should, therefore, address methods of compensation for polarization effects in the proposed system. Various methods have been proposed to overcome PIF, such as polarization diversity receivers (PDRs) [31], Faraday rotating mirrors [32] and a configuration based on a polarization-maintaining fiber (PM-fiber) [33]. The polarization-state change influence can be also compensated by extending the DL-MZI approach to the double-cavity Mach-Zehnder interferometer concept, as illustrated in Fig. 9. Although it is susceptible to optical misalignment, this approach can eliminate noise sources such as vibration of the fiber and thermal variation influence, which finally change the polarization state of the fiber. Through the application of these techniques, more accurate results can be achieved, and the proposed method can be applied to trace detection.
Fig. 9. Schematic illustration of the acquisition method for multiple ring-down interferograms based on two mirror-type cavities (BS: beam splitter, M: Mirror, PD: photo -detector).
In this paper, we showed the attainability of the multiple ring-down interferograms comparing two results achieved from each system. For this reason, the calculated total round trip losses include all spectral contents. As mentioned in the introduction, this research has the goal to obtain spectral ring-down time simultaneously via fourier transforming the ring-down interferograms. Further work should include the simultaneous acquisition ring-down interferograms via fourier transforming the ring-down interferograms as well as the
#222558 - $15.00 USD Received 5 Sep 2014; revised 26 Oct 2014; accepted 30 Oct 2014; published 6 Nov 2014(C) 2014 OSA 17 November 2014 | Vol. 22, No. 23 | DOI:10.1364/OE.22.028353 | OPTICS EXPRESS 28361
development of an applicable broadband, low-repetition rate laser source to achieve a number of ring-down interferograms with the proposed system.
4. Conclusion
We proposed and demonstrated a method for the acquisition of ring-down interferograms using double loops with slightly different lengths. Continuous multiple ring-down interferograms were successively obtained using only a slow detector, two loops and a delay line instead of complicated components such as optical switching mechanisms. Finally, the proposed method was used to estimate the total losses of the two loops, and the difference was found to differ by only 0.06 dB from the result obtained using the conventional ring-down method.
Acknowledgments
This work was supported by a grant from the National Research Foundation of Korea (NRF) funded by the Korea government (MSIP) (No. 2010-0017795) and under the framework of an international cooperation program managed by the National Research Foundation of Korea (No. 2013K2A1A2054170).
#222558 - $15.00 USD Received 5 Sep 2014; revised 26 Oct 2014; accepted 30 Oct 2014; published 6 Nov 2014(C) 2014 OSA 17 November 2014 | Vol. 22, No. 23 | DOI:10.1364/OE.22.028353 | OPTICS EXPRESS 28362