Embed Size (px)
Citation preview
Doubling the Market Share of Public Transport Worldwide by 2025:
A Smart Future for Cities
Hans Rat
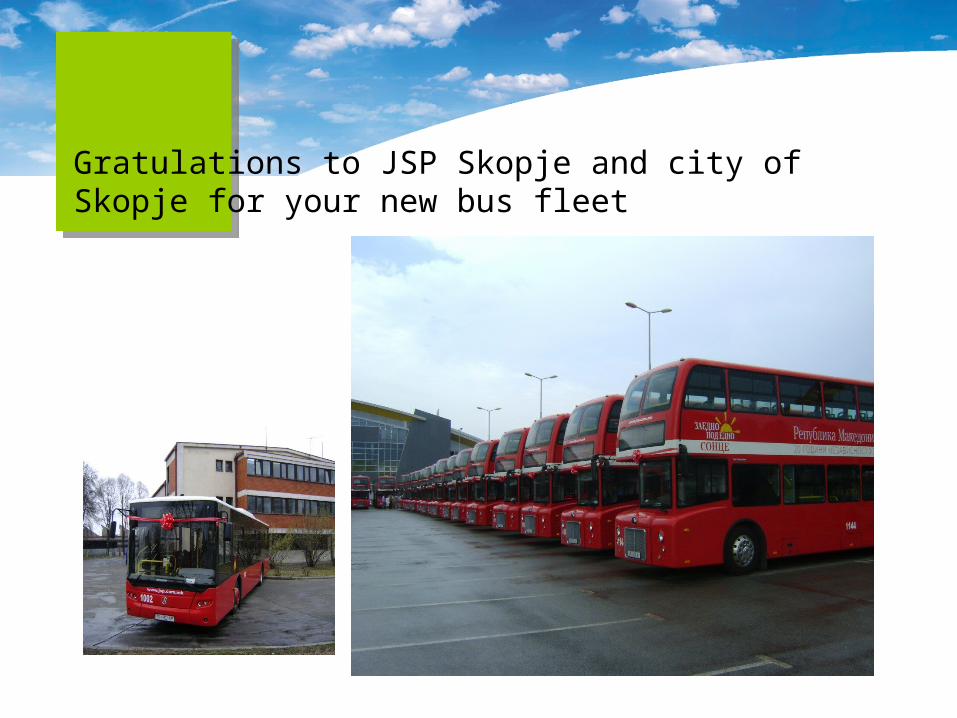
Gratulations to JSP Skopje and city of Skopje for your new bus fleet
1. Why doubling the market share of public transport worldwide is necessary to safeguard the quality of life in cities?
2. What are the adequate measures to support the development of public transport in Macedonia?
ContentsContents
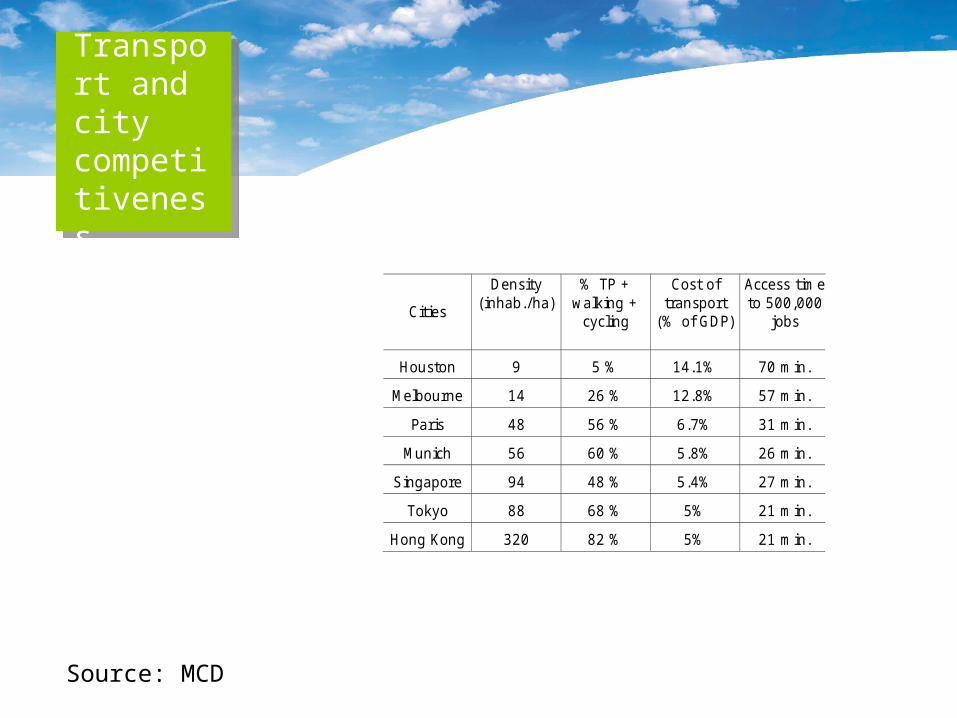
Transport and city competitiveness
Cities
Density (inhab./ha)
% TP + walking +
cycling
Cost of transport
(% of GDP)
Access time to 500,000
jobs
Houston 9 5 % 14.1% 70 min.
Melbourne 14 26 % 12.8% 57 min.
Paris 48 56 % 6.7% 31 min.
Munich 56 60 % 5.8% 26 min.
Singapore 94 48 % 5.4% 27 min.
Tokyo 88 68 % 5% 21 min.
Hong Kong 320 82 % 5% 21 min.
Source: MCD
MethodologyMethodology
• UITP developed urban transport scenarios for 2025 to compare “Business as Usual” and “PTx2”
• Projections computed through Mobility Model developed by the International Energy Agency.
• Based on demographic, economic and technology factors.
Urban transport today Urban transport today (2005)(2005)
• World’s urban population is 3.2 billion.
• About 7.5 billion trips made in urban areas every day.
• Public transport represents about 16% of those trips.
Urban population in Urban population in 20252025
• Urban population will increase from 3.2 to 4.5 billion.
• Contrasted situations:
• Fast urban population growth in Asia, Africa and the Middle-East.
• Almost no urban population increase in Europe and Eurasia.
Business as usual vs. Business as usual vs.
PTx2PTx2
• More urban population means more mobility in urban areas: +50% by 2025.
• Business as usual: growth of urban mobility followed by growth of its negative consequences.
• PTx2: growth of urban mobility decoupled from growth of its negative consequences.
Studied impactsStudied impacts
(1) Urban transport energy consumption
(2) Urban transport GHG emissions
(3) Urban traffic fatalities
(4) Public health
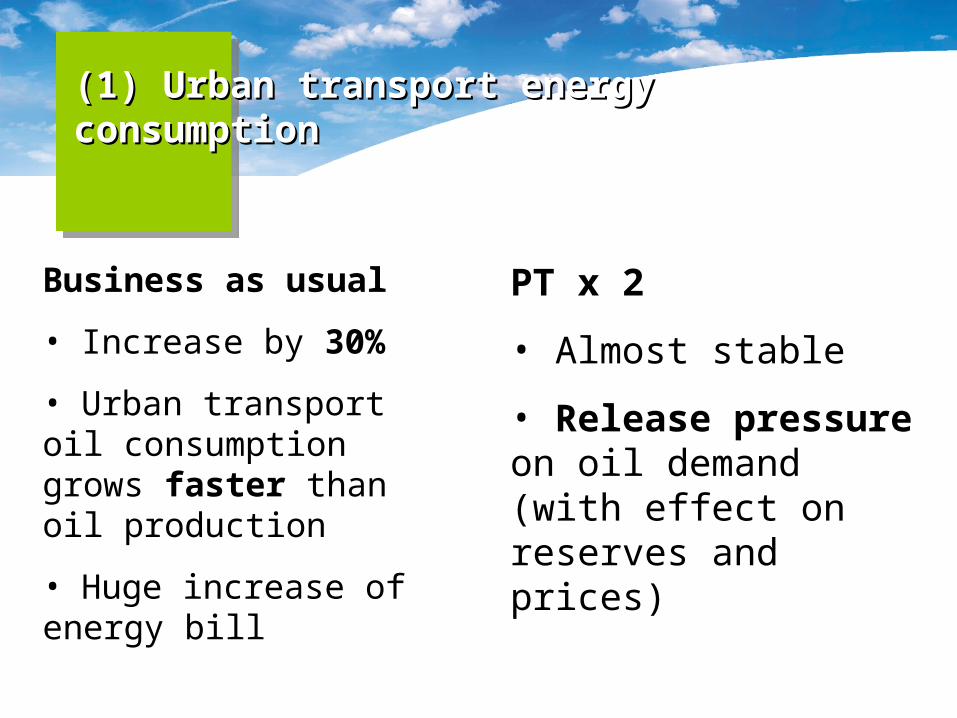
(1) Urban transport energy (1) Urban transport energy consumptionconsumption
Business as usual
• Increase by 30%
• Urban transport oil consumption grows faster than oil production
• Huge increase of energy bill
PT x 2
• Almost stable
• Release pressure on oil demand (with effect on reserves and prices)
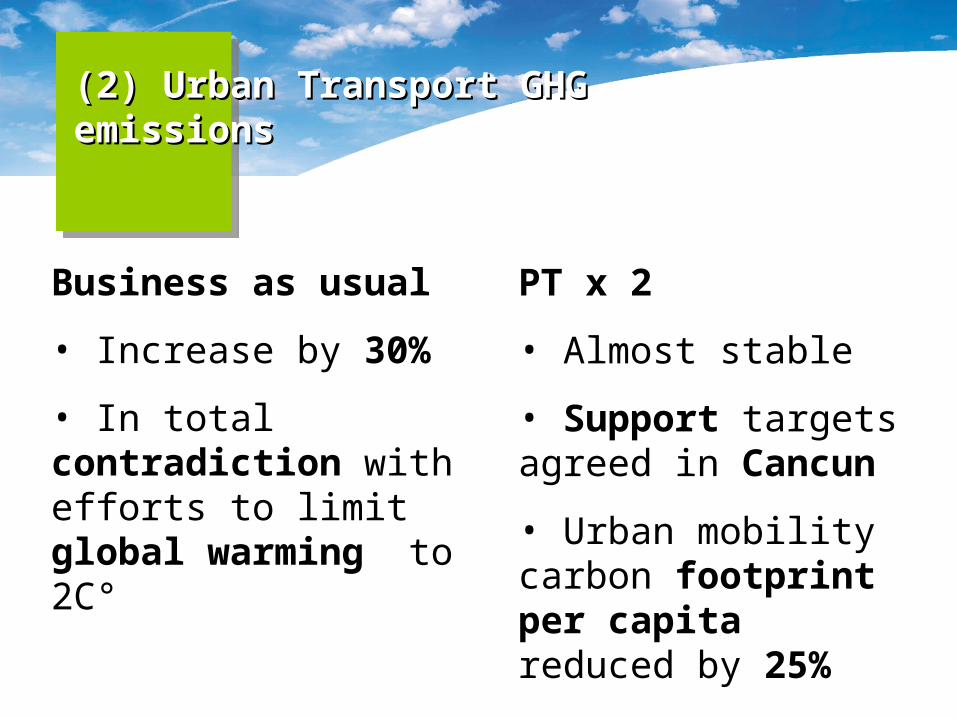
(2) Urban Transport GHG (2) Urban Transport GHG emissionsemissions
Business as usual
• Increase by 30%
• In total contradiction with efforts to limit global warming to 2C°
Buses, trams, metros, pedestrians, cyclists
PT x 2
• Almost stable
• Support targets agreed in Cancun
• Urban mobility carbon footprint per capita reduced by 25%
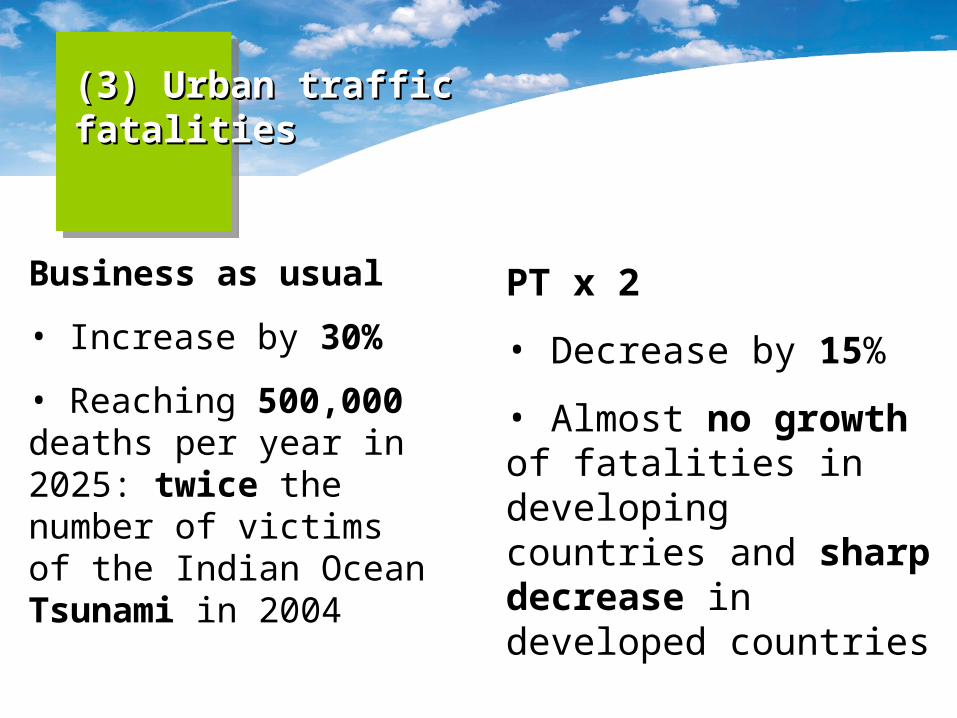
Business as usual
• Increase by 30%
• Reaching 500,000 deaths per year in 2025: twice the number of victims of the Indian Ocean Tsunami in 2004
(3) Urban traffic fatalities(3) Urban traffic fatalities
PT x 2
• Decrease by 15%
• Almost no growth of fatalities in developing countries and sharp decrease in developed countries
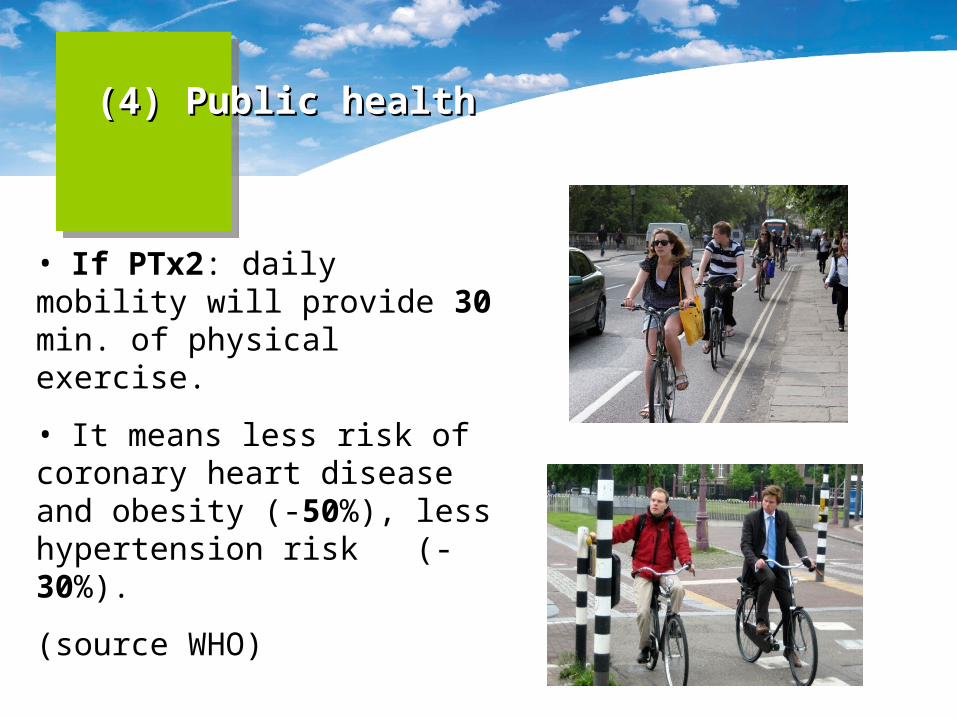
(4) Public health(4) Public health
• If PTx2: daily mobility will provide 30 min. of physical exercise.
• It means less risk of coronary heart disease and obesity (-50%), less hypertension risk (-30%).
(source WHO)
Making PTx2 a realityMaking PTx2 a reality
Set of mutually reinforcing policies:
• Providing lifestyle services
• Developing a new business culture
• Securing adequate and stable funding
• Integrating public transport and other urban policies
• Smart mobility management
Cities with ambitious policies and targets
• Beijing – China
• Bogota – Colombia
• Dubai - UAE
• Geneva – Switzerland
• Lagos – Nigeria
• Paris - France
• London – UK
• Madrid – Spain
• Shanghai – China
• Belfort - France
• New Zealand
• Perth – Australia
• Singapore
• Sweden
• Tehran – Iran
• Melbourne - Australia
• Toronto – Canada
• Vienna – Austria
• Luxemburg
• Lille – France
Life style services
• Diversification of services: giving choice to citizens and targeting new segments.
• Provision of high quality mobility services.
Examples: Sofia – extension of metro network, tram and trolley modernisation
Belgrade – improving infrastructure and implementing new ticketing system


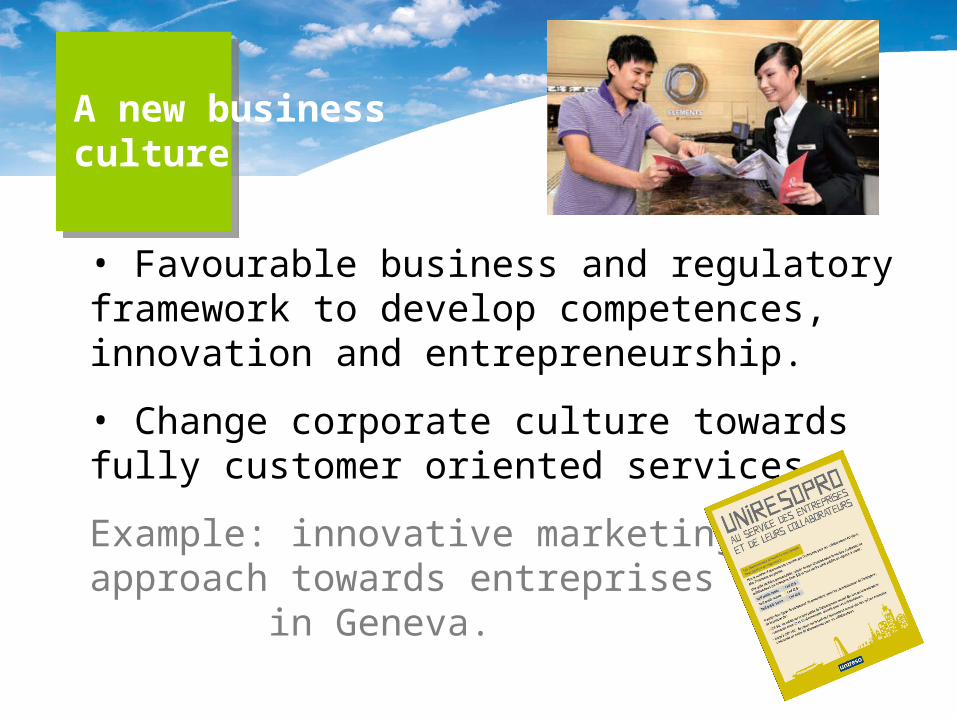
A new business culture
• Favourable business and regulatory framework to develop competences, innovation and entrepreneurship.
• Change corporate culture towards fully customer oriented services.
Example: innovative marketing approach towards entreprises in Geneva.
Adequate and stable funding streams
• Developing revenue strategies and optimizing fare policies.
• Earmarking charges based on polluter pays and beneficiary pays principles to support public transport.
• Developing reciprocal understanding with asset managers and asset owners.
Example: Asian cities lead the way
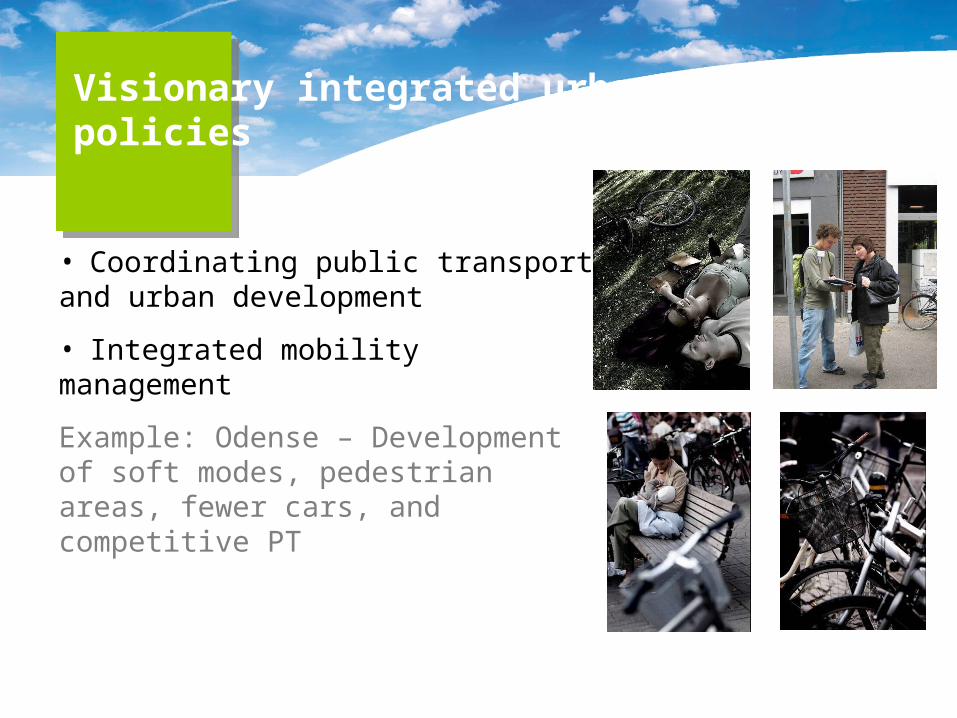
Visionary integrated urban policies
• Coordinating public transport and urban development
• Integrated mobility management
Example: Odense – Development of soft modes, pedestrian areas, fewer cars, and competitive PT
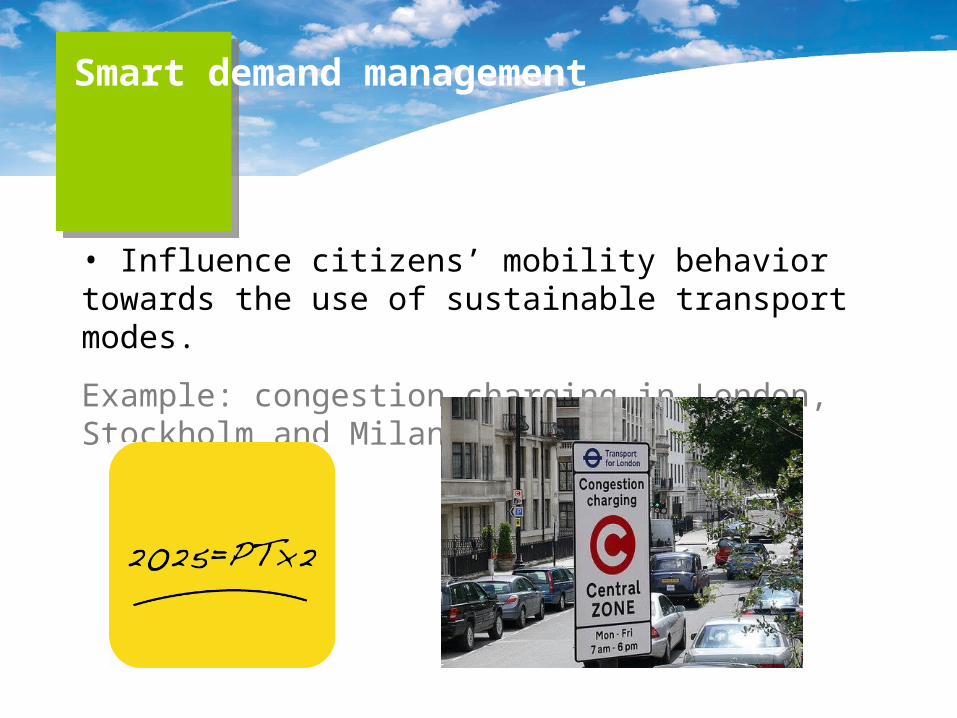
Smart demand management
• Influence citizens’ mobility behavior towards the use of sustainable transport modes.
Example: congestion charging in London, Stockholm and Milan
Thank you for your attention!Thank you for your attention!

![Index [s3.amazonaws.com]s3.amazonaws.com/.../ · Index . 1. Media backgrounder: PTx2 Scenarios – The benefits of doubling the public transport market share worldwide by 2025 p](https://img.pdfslide.net/doc/110x75/5bdfd41409d3f29b578b65a2/index-s3-s3-index-1-media-backgrounder-ptx2-scenarios-the-benefits.jpg)