Embed Size (px)
Citation preview

DoView Creative Commons Copyright 2008 www.DoView.org
1
DoView Visual Evaluation Plan Workbook
Paul Duignan, PhD
Working Draft V1-1SV 20 November 2008
A complete guide to building a visual evaluation plan in DoView outcomes and evaluation software.

DoView Creative Commons Copyright 2008 www.DoView.org
2
This is an uncorrected working draft version of this document. It is still being developed and may contain typographical or other errors. If you have any feedback on the document please email: [email protected].
Creative Commons Copyright 2008
The material in this document is covered by a Creative Commons Copyright License. Without having to seek permission, YOU CAN USE it for commercial and non-commercial purposes as long as you acknowledge the source. For instance an employee of a for-profit corporation or a not-for profit organization could use the workbook to structure evaluation planning. A private contractor could also
use the workbook in their paid consulting work as long as they acknowledge its source. Simply handing out the workbook in the form it is here is sufficient acknowledgement.
The only limitation on the use of this material is that, without permission, you cannot reproduce all of it in another publication
(physical, electronic, web-based or in another form) nor embed the information within this document within any software product. However we are happy to discuss the possibility of also giving permission for this type of use, please contact
Resources for using DoView are available at http://www.doview.com The visual evaluation plan set out here is a sub-set of a wider approach to visual planning, monitoring, evaluation and contracting
called Easy Outcomes http://www.easyoutcomes.org Examples of outcomes models are available at http://www.outcomesmodels.org
The author’s blog on outcomes and evaluation is available at http://www.outcomesblog.org.

DoView Creative Commons Copyright 2008 www.DoView.org
3
Introduction This workbook shows you how to use DoView outcomes software to create a visual evaluation and
monitoring plan. The advantages of a DoView visual evaluation plan are:
1. It takes about one half the time to develop than a traditional text-based narrative evaluation plan 2. You can develop a template approach to your evaluation planning, just changing your template
each time you develop a new evaluation plan, saving more time 3. You can use the visual evaluation plan for all your presentations regarding evaluation planning –
meaning you do not need to create and update separate Powerpoint presentations on the evaluation
4. You can use the visual evaluation plan to control the implementation of your evaluation – meaning that you do need fewer other files and documentation to do this
5. If a new staff member arrives and they need to know where the evaluation plan is up to you just refer them to the one DoView file which will contain everything they need to know about the implementation of the evaluation
6. You can quickly report back to evaluation funders or other stakeholders by emailing them a PDF of the visual evaluation plan created from within DoView or put a web page model of it up on an intranet or the internet (an example is at http://www.outcomesmodels.org/models/communitycentral31.html
7. Once you have build an outcomes model as the basis of your visual evaluation plan you can use it for a range of other purposes (see the Easy Outcomes site – http://www.easyoutcomes.org.
This workbook is a step-by-step guide for those who want to build a visual evaluation plan in DoView. It includes some aspects of the Easy Outcomes approach that you may or may not want to include in your visual evaluation plan. They are included in the visual evaluation plan workbook so as to illustrate the possibilities available in setting out a DoView visual evaluation plan. You may wish to adapt them

DoView Creative Commons Copyright 2008 www.DoView.org
4
or add your own additional aspects to the plan. Throughout this workbook an example is used to illustrate how you can set out a visual evaluation plan. The program which is used as an example is called the Consumer Environmental Program. This program seeks to encourage more responsible consumer behavior by providing information on the environmental impact of goods and services at the time consumers are buying products. It also involves a media campaign. This is just one example of a visual evaluation plan for a project. Other examples are available at the Outcomes Models site (http://www.outcomesmodels.org).
How to use this workbook
The following sections are provided in this workbook to assist you with each step:
• A description of the step. • An illustration of what the step looks like in DoView using the example of a Consumer
Environmental Program. • Any resources which are needed for the step. • A summary of the process of doing the step. • Tips for using DoView to do the step.
Work through the steps, building your DoView version of your visual evaluation plan as you go.
DOVIEW TIPS 1. If you do not already have DoView, go to http://www.doview.com/download.html and install DoView (currently only a PC version is available – a Mac version is planned, a 14-day free trial is available).
2. Look at the DoView Quick-start Video Tours (Help>Quick-start Video Tours) to familiarize yourself with DoView (these can also be found on the web at http://www.doview.com/files/videotours/videotours.html).
3. Go to the Outcomes Models site (http://www.outcomesmodels.org). Look through the visual evaluation plans on that site (there is one there at the moment but more will be added, to look through them you click on View HTML). To download a visual evaluation plan that you like

DoView Creative Commons Copyright 2008 www.DoView.org
5
and want to use as a template, you need DoView installed on your computer. You just need to click on the icon at the bottom of the page in the Options Bar with the text “Download the DoView file of this model”. A copy of the DoView file will then open on your computer.
4. Experiment with using one or more files you have downloaded until you are confident in using DoView. Don’t worry about making mistakes as you can always get a fresh version of the file from the Outcomes Models (http://www.outcomesmodels.org) web site (as set out in items 3 above). It is good to practice using DoView in front of a group as this is the most powerful way of using it to plan and implement an evaluation. First practice on your own, then practice in front of colleagues and finally try it out in front of a meeting of stakeholders.
5. You will be making a visual evaluation plan as you work through this workbook. So when you are ready either open a new DoView file and name it for the name of your project, or open one of the template models from the Outcomes Models site (http://www.outcomesmodels.org) and rename it the name of your project.
6. Remember to carefully date the version of your DoView file in its file name so that you don’t lose track of which file you are working on (e.g. Filename V1-0 2009-9-23).
7. Use the Save As function frequently to save a new version of your DoView file and rename it a new version number, in case you have to go back to an earlier version.
8. A DoView model consists of a set of pages (called slices) on which diagrams or text can be placed. At each step in the DoView visual evaluation planning process you either have a diagram on a page or text on a page in the DoView model. This makes the DoView model a complete record of your visual evaluation plan.
9. DoView has been designed to always be able to be dataprojected in a meeting so that the DoView version of your visual evaluation plan can be used at every stakeholder or evaluation meeting. This means that all of the decisions you have made in your visual evaluation plan are only a click away within the DoView model when you are talking about aspects of your plan to your evaluation team, the project team or stakeholders.
10. Pages in DoView are referred to as slices. An outcomes model, which forms the basis of your visual evaluation plan work is made up one or more slices. In most real-world programs you will need a number of slices to provide sufficient detail of the outcomes model of your program. The DoView default slice (page) size is called a compact slice (page). This slice (page) size has been set at the right size for dataprojecting in a medium size room. If you build your outcomes

DoView Creative Commons Copyright 2008 www.DoView.org
6
model and other aspects of your visual evaluation plan work as compact slices (pages) you will know that they will always be able to be seen when dataprojected. It is possible to create an enlarged DoView slice (page), but this is for producing an overview model for printing out on ledger/A3 paper. Using DoView’s clone feature (discussed in later DoView Tips) you can make this overview slice (page) containing a set of clones (‘live copies’) of the steps and outcomes from your outcomes model. This means that if you update information on steps and outcomes on a compact slice (page) when you are working with it dataprojected in a meeting, the information will also change on the large overview slice (page). You should regard your compact version of your model as the basic working version of the model and any enlarged overview model as simply a version of the model for the purposes of printing.
Steps in building a visual evaluation plan
There are a number of steps used in building a visual evaluation and monitoring plan. These are set out below. There are also other uses for the outcomes model that you will create as a part of building your visual evaluation plan (e.g. for strategic planning, mapping multiple projects onto a common outcomes model and contracting) and these can be found at the Easy Outcomes site (http://www.easyoutcomes.org). The table below sets out the steps used in building a visual evaluation plan. Step Sub-step 1. Plan your approach 1. Plan your Easy Outcomes work, identify who is going to be
involved in what way in the process 2. Build an outcomes model 2a. Build an outcomes model of the project, program,
organization, sector, collaboration or join venture 2b. Check the evidence for the model being an accurate
picture of the world 3. Identify indicators 3a. Put indicators onto the model 3b. Identify indicators attributable to particular players.
Ones that everyone will agree have been changed by particular players

DoView Creative Commons Copyright 2008 www.DoView.org
7
3c. Identify indicator targets and success criteria 3c. List any indicators project(s) for improving or developing
indicators 4. Identify & assess evaluation questions
4a. Put evaluation questions onto the outcomes model
4b. List evaluation questions going to be answered 4c. Assess possible outcome evaluation designs 4d. List priority evaluation project(s) 4e. List evaluation methods for evaluation projects. 5. Identify & assess possible economic evaluation
6. Decide on piloting or full roll-out outcome/impact evaluation
7. Identify evaluation management issues
8. Use the outcomes model for reporting back on evaluation findings
The rest of this workbook sets out each of these steps and describes how you can go about undertaking it for your particular evaluation.
DoView Creative Commons Copyright 2008 www.DoView.org
8
Step 1: Plan your approach
It is important to carefully plan your work in developing a visual evaluation plan to make sure that the whole process goes smoothly. At different stages in the process, particularly when drawing the outcomes model, it is likely that you will need to involve other stakeholders. You have to make sure that you have enough time scheduled to let stakeholders have input into the outcomes model and into other aspects of developing your visual evaluation plan. Tip: How much time does it take to develop a DoView visual evaluation plan? This question is difficult to answer because it depends on how many other stakeholders you need to involve in the process. However, experience has shown that a good outcomes model for a project can be drawn with a stakeholder group in four 3-hour sessions. If a lot of work has to be done on indicators and evaluation questions, then two more sessions should be scheduled. Additional time will be needed outside of this by whoever is tidying up the visual evaluation plan in DoView. If limited time is available, progress on an outcomes model can be made in shorter periods of time, particularly for simpler projects. Remember that time spent on building a good outcomes model for your visual evaluation plan is likely to pay of in the future in increased efficiency because you can build off the work which has been done in developing your outcomes model for your visual evaluation plan for a range of other purposes (see the Easy Outcomes web site – http://www.easyoutcomes.org). Tip: What expertise does it take to develop a visual evaluaton plan? Running a visual evaluation planning exercise and doing much of the basic work setting up the approach does not require any expertise beyond that found in most work situations where people are involved in some way in evaluation, monitoring and related organizational processes. However, there are particular stages within building a visual evaluation plan where you may need input from people with particular skills if you do not currently have these skills yourself. The advantage of a standardized visual evaluation approach to evaluation planning is that a wide range of people can develop the overall framework and just call in other expertise to assist with specific parts of it. This keeps you in control and it also means that the experts know exactly where their expertise is needed and where they can most add value. They do not need to spend any time thinking about where their work fits within an
DoView Creative Commons Copyright 2008 www.DoView.org
9
inadequately specified wider framework (this is often what happens when people are not using an integrated framework like a DoView visual evaluation plan). Refer those who you are working with to develop particular parts of your visual evaluation plan to this workbook if they have any questions. Unless you are an expert yourself, particular expertise may be needed in regard to: Step 1:Build an outcomes model (subject matter expertise); Step 3a: Put indicators onto the model (subject matter expertise); Step4c: Assess possible outcome evaluation (evaluation expertise); and Step 5: Identify possible economic evaluation (economic evaluation expertise). Tip: Dealing with large numbers of stakeholders As is discussed in Step 2, working with a large number of stakeholders (e.g. over 7) when trying to draw an outcomes model is difficult. When you are planning your visual evaluation plan work, consider the best way to manage your interaction with stakeholders. One approach where there are a number of stakeholders is:
• Call together a meeting with the wider group of interested stakeholders and explain the visual evaluation planning process as set out in this workbook.
• Set up a smaller group to build the outcomes model, do the visual evaluation planning work and
then report back to the wider group at appropriate intervals. Setting up your DoView file Start to set up your DoView file in which you will put your visual evaluation plan. As suggested above you can get a model from the Outcomes Model site (http://www.outcomesmodels.org) and use it as the basis for your work, or you can start with a fresh empty DoView file. The slices (pages) below show the first few pages in the plan.

DoView Creative Commons Copyright 2008 www.DoView.org
10
Easy Outcomes plan title page
Here is the title page of your visual evaluation plan set out on a DoView slice (page). It should contain the name of the plan, reference to the DoView website for those who want more information on the approach. It is important to include a version number to keep track of the versions of the plan. In addition, the file name has been included so that you can keep track of the file. In this case, the file name is written all in lower case because the file is going to be put into HTML at a later stage and put up on the web. Lower case file names avoid any potential problems with entering the URL. The date can be put in the bottom right-hand corner. You can set this slice (page) out in any way that you like and add any additional information you need.

DoView Creative Commons Copyright 2008 www.DoView.org
11
Project summary page
Here a summary of the program has been put on this DoView slice (page). There needs to be enough in it for the reader to understand what the program is about. If the program was complex it would be possible to have more than one slice (page) setting out this information.

DoView Creative Commons Copyright 2008 www.DoView.org
12
Index page
Here is a slice (page) on which an index of all of the slices (pages) within the visual evaluation plan can be placed. Make this slice (page) after you have built your visual evaluation plan. This slice (page) is made by you entering the names of the different slices (pages) in the plan onto this slice (page) as text objects. It is not created automatically by DoView.

DoView Creative Commons Copyright 2008 www.DoView.org
13
Administration slice (page) to keep track of your work
Here is a slice (page) in DoView which you can use to keep track of your work and which version of the DoView is the latest. Each time you work with the model you should save a new version (e.g. version V1-1). Use the X-1 for minor version changes and then when you go to a major version change change the 1-X.
Step 1: PROCESS 1. Read through this workbook to make sure you familiar with the steps needed in building a visual evaluation plan.
2. Download and become familiar with using DoView if you do not already have it and know how to use it.
3. Set up your DoView file for your visual evaluation plan as described in the DoView Tips below.

DoView Creative Commons Copyright 2008 www.DoView.org
14
Step 1: DOVIEW TIPS 1. Start setting up your visual evaluation plan in DoView. 2. Make sure you are familiar with using DoView. 3. DoView has been designed to be used in a medium-sized room using a dataprojector to draw
outcomes models and work with other elements in your visual evaluation plan. Make sure that you are going to have an appropriate room available to use. In particular, make sure that the physical screen size is large enough so that everyone in the room will be able to read the details on the DoView slices (pages). In some cases it is better to use a white wall than a physical screen if the wall means that you can get a larger image size.
4. Start setting up your visual evaluation plan in DoView by using either using as a template a visual evaluation plan you have got from the Outcomes Models website (http://www.outcomesmodels.org) or and amending it or starting a fresh DoView file.
5. The text on the DoView slices (pages) shown above has been put on the slice (page) using the Text object (Right click>Text). In the case of the title, it has been made large size by Left-click>Change size>Large.
6. The project (or sector, organization, program etc.) should be summarized on one or more following slices (pages). To make more slices (pages) in DoView click on New Slice (page) in the Slice (page) List.

DoView Creative Commons Copyright 2008 www.DoView.org
15
Step 2a: Build an outcomes model This step is used for: Evaluation Monitoring Strategic planning Multi-project (player) coordination Evidence-based practice Economic evaluation Contracting
The second step in building a visual evaluation plan is drawing an outcomes model. Outcomes models are also known as logic models, intervention logics, program logics, strategy maps, means-ends diagrams etc. There are many ways in which such diagrams are drawn and various conventions about how you should set them out. A set of guidelines is available on how to draw such a model and they are set out in this workbook. A summary sheet called 13 Tips to Building Great Outcomes Models is available at http://easyoutcomes.org/files/13tipsa4-205.pdf. If you follow these tips you can be sure that your outcomes model will work as the basis for a visual evaluaton plan. Tip: How should you get an outcomes model drawn? In some cases it is possible for a program staff member, an evaluator, or some other individual to draw an outcomes model on their own. Regardless of the program and how many people you can involve in drawing an outcomes model, it is always good for there to be an outcomes model developed because such models clearly set out the way in which it is believed that lower-level steps result in improvement of higher-level outcomes. Setting this out in a visual format is powerful because it quickly communicates to stakeholders the way it is believed the program works. Even if this results in stakeholders disagreeing with the model, this is still useful. This is because at the moment in many programs, the beliefs about how the program works is never specified in a way that stakeholders can either agree or disagree with. It is often largely undocumented, or if it is documented, it has been done in lengthy tables and narrative documents which are largely inaccessible to stakeholders who want to quickly overview the claims being made about how it is thought the program is going to work. However, while a model can be developed by one person, usually it is better to have a process whereby a group is involved in building the model. When involving a number of people the process needs to be carefully set up because too many people involved at the same time in attempting to build an outcomes model can be difficult to manage. It is possible to draw an outcomes model in real-time with a group of a sufficiently small size and which includes the right people. This requires the use of outcomes model software which has been designed to use in real-time with a dataprojector. DoView has been designed with this purpose in mind (e.g. large icons so
DoView Creative Commons Copyright 2008 www.DoView.org
16
the group can see what you are doing, a limited range of formatting options to reduce the number of decisions which need to be made, automation of common procedures, etc). So the best way to get an outcomes model drawn is to work in real-time in a meeting with a small group who have the information needed to build the model. How to set up the group is discussed next. Tip: Who should be in the group which draws the outcomes model? As already mentioned under Step 1, while a wider group of stakeholders often needs to be briefed and consulted about building a visual evaluation plan, a smaller group should be set up to actually build the initial version of the outcomes model. This small group could consist of:
• Someone who knows how to use DoView and has some idea of how to build outcomes models according to the guidelines set out below.
• 1-3 subject experts who can help with the details of the way in which it is thought the program works.
• Where needed, extra specialist expertise just for those sessions when you need their input. • The highest level stakeholder you can involve in the process so that it will have credibility with other
high-level stakeholders. • Others can sit in on the process in order to learn how it is done, but they would be expected to
mainly observe the process rather than being active participants.

DoView Creative Commons Copyright 2008 www.DoView.org
17
Outcomes model
Here is an outcomes model for the Consumer Environmental Program. This program will be used throughout this workbook to illustrate how to build a visual evaluation plan. In the case of this example, there is only one slice (page). Typically outcomes models would consist of more than one slice (page). You would start with an overview slice (page) containing steps which, when you click on their Hop-tos (a small triangle in the bottom left-hand corner of a step box) would take you down to other slice (page) containing more detail about the steps involved in the program.
Step 2a: PROCESS 1. Identify who will be the best people to have in the small outcomes model working group. 2. Depending on the size of the outcomes model that has to be drawn, arrange for the small

DoView Creative Commons Copyright 2008 www.DoView.org
18
working group to attend four 3 hours sessions. Say one a week for four weeks (this gives you time to tidy up the model between sessions).
3. Make sure that the meeting venue has a dataprojector which can be projected on a large enough screen (or light colored wall) so that all the participants will be able to easily read the details on the slice (page) in the model.
4. Try out the dataprojector to make sure that it shows the colors in the DoView models adequately (older dataprojectors do not always have the best color resolution).
5. At the first meeting, talk about the process of building an visual evaluation plan as set out in this workbook. Give the participants the 13 Tips page so that they can understand how you are planning to build the outcomes model (http://easyoutcomes.org/files/13tipsa4-205.pdf).
6. Between meetings, tidy the model and circulate a PDF of it, or put it up on an intranet or the web (DoView version 1.15 and beyond can create a web page version of a DoView model).
Step 2a: DOVIEW TIPS 1. Practice drawing outcomes models in DoView before you start building your first real outcomes model.
2. Once you have mastered DoView on your own (users report that it is an easy program to learn) practice working on a model in real-time in front of a group of your workmates before you start using it with the working group which will build the model.
3. Use a DoView file as a template if you like (you can get these from the Outcomes Models site (http://www.outcomesmodels.org) – see above on how to download them).
4. If you are going to be building your model in real-time with the working group it is best to build your model in a number of ‘compact’ slices (pages) within DoView. The default slice (page) which gets created when you click on New Slice (page) in the DoView Slice List is a compact-sized slice (page). Using compact-sized slices (pages) means that their contents will always be able to be seen on the screen when dataprojected in a meeting. The compact slice (page) size also means that you can always email the model to a colleague and they will be able to see it on their screen (this is not the case with models which are built using ledger/A3 sized slices (pages)); it can also be easily read when printed out on letter/A4 paper; and it will be the right size to be viewed as an HTML model of the slices (pages) in your model on the web. Using compact slices (pages) means that your outcomes model is ‘portable’ across these four formats. This is essential if the outcomes model is to play its

DoView Creative Commons Copyright 2008 www.DoView.org
19
central role at the heart of your visual evaluation plan. 5. To build a model of any size using compact slices (pages) in DoView, once you have run out of
room on one slice (page) you simply create another one. An easy way of doing this is to highlight a step and then Right-click>Drill down to new slice (page). This creates a new slice (page); names it after the name of the step you are on; puts a clone (‘live copy’) of the step you are on onto the new slice (page); and puts a Hop-to (internal hyperlink) in the two clones of the step – the one on the original slice (page) and the one on the new slice (page). Using this command you can quickly build multi-slice (page) DoView outcomes models where you can click down from a top summary slice (page) to slices (pages) below which set out the model in more detail.
6. When working with compact slices (pages) you will need to divide your model up into ‘modular’ pieces one on each compact slice (page). You should try to create modules which make sense to yourself and others who will be reading the model. For instance, in many social programs there is a national, regional, organizational and individual level. Look at the OutcomesModels.org site (http://www.outcomesmodels.org) for some examples of modular outcomes models. On that site you might even find some modules which you can borrow and use to start off drawing the outcomes model for your project. The models on OutcomesModels.org are covered by a Creative Commons license which means that you are free to use the models up on that site for most commercial and non-commercial purposes (check the site for more details). First look at the PDF version of the model to see if it has slices (pages) in it that you might like to borrow and amend for your project. To borrow a slice (page) from another DoView model, first download the model. If you have DoView installed on your computer, just click on the model on the OutcomesModels.org site and click Open. The model you want to borrow parts of will open in your copy of DoView on your computer. Next, Right-click in the Slice (page) List on the slice (page) you want to borrow. Open the DoView file you want to copy the slice (page) to, click on the relevant slice (page) in the Slice (page) List you want the new slice (page) to go beneath, Right-click>Paste.
7. If you want to provide the working group or other stakeholders with a printed overview of the model, you can create an enlarged slice (page) in DoView and ‘clone’ all of the model from the compact slices (pages) onto it. You should regard this large model as a copy of the basic compact model which you continue to work . You continue to work with the compact model because you know that it always be able to be visible when dataprojected.
8. The way you clone all of the steps from a set of compact slices (pages) onto an enlarged slice (page)

DoView Creative Commons Copyright 2008 www.DoView.org
20
is as follows: First, create an enlarged slice (page). To get an enlarged slice (page), create a new slice (page) in the Slice (page) List (click on New Slice (page)), click on the slice (page) name and Right-click>Enlarge. You will now have an enlarged slice (page) which can take the contents of four or so compact slices (pages). To clone the steps and outcomes on a compact slice (page) onto this new enlarged slice (page), select all the steps and outcomes on the compact slice (page). To do this go to the compact slice (page), do a Left-Mouse-click and drag (while holding the Left-mouse button down) across all of the steps and outcomes on a compact slice (page) which you want to clone. Then go to the enlarged slice (page), put your mouse pointer where you want to clone the steps and outcomes and Right-click>Paste as clone. Clones of all of the steps and outcomes will appear on the enlarged slice (page). Resize each of the clones on the enlarged slice (page) to fit them all in if necessary. For instance, on the enlarged slice (page) you often will often want to make the steps longer and thinner so that they don’t take up so much vertical space. This means that you can fit the contents from more compact slices (pages) onto the enlarged slice (page). From now on when you edit a clone on a compact slice (page) it will automatically be updated on the enlarged slice (page) (apart from color and shape).
9. You can now print out the enlarged slice (page) on ledger/A3 paper and provide it as an overview of the model to your working group or other stakeholders. However, when working with the group you should continue to work with the compact slice (page) version of your outcomes model as the contents of these can always be seen in a medium sized room when dataprojected.
10. If your outcomes model is at all complex, you will probably find that you have problems drawing all of the causal links between steps because you cannot fit them all on the page. In DoView if you go to the Link tool on the Toolbar and select ‘Insert Link and Draw Line’ from the small arrow on the right of the Link tool, when you make a link between two steps a DoView link will be put in and a drawn line and arrow will also appear on the slice (page) running between the two step boxes. To make a link you drag out from the small blue box in the middle of a step by holding down a Left-mouse click. If you change the Link tool in the Toolbar to ‘Insert Link’ it will only put in a DoView link (shown by the DoView endpoint link icon – an inverted V on the bottom edge of the step being linked to, and two small lines on the top edge of the step you are linking from); no line and arrow link will be drawn. From then on, whenever you click on a step it will show all of the other steps on the slice (page) it is linked to because their DoView endpoint link icons will light up (you can also see what a step is linked to by Right-clicking>This makes happen or Right-clicking>This is a result

DoView Creative Commons Copyright 2008 www.DoView.org
21
of). At any time you can draw the line and arrow link where a DoView link endpoint icon exists by Right-clicking on the link endpoint icon and selecting Draw line.
Step 2a: RESOURCE 1 Five features of steps and outcomes
Steps or outcomes can have any of five major features It is useful to have a simple framework for understanding the features of steps and outcomes which can be put into an outcomes model. Steps is the term used in DoView for lower-level causes which lead up to higher-level outcomes. In DoView you place step objects (on an empty space on a slice (page) Right-click>Step to insert a step) onto a slice (page) to represent steps and outcomes at any level within an outcomes model. Whether something is a step or an outcomes is a relative rather than absolute. This is because programs and organizations are generally positioned within hierarchies such that an outcome for a player further down the hierarchy is a step for a player above them in the hierarchy. Traditionally, the steps and outcomes within outcomes models (which go under names such as logic models, program logics, intervention logics, end-means diagrams, strategy maps, results chains etc) are set out in horizontal or vertical (depending on the way the diagram is orientated) layers which have headings such as – inputs, outputs, intermediate outcomes, key drivers, priorities, final outcomes etc. Some of these terms like ‘outputs’ – the goods and services produced by an organization – have widely understood definitions. Others, however, such as ‘intermediate outcomes’ or ‘key drivers’ are not so clearly defined that stakeholders can immediately work out the level at which they will be in the program they are involved in. It is useful to have a clear and simple conceptual framework in which you can discuss which types of steps and outcomes are allowed within an outcomes model. Sometimes stakeholders attempt to insist that an outcomes model should only contain steps or outcomes which are measurable or attributable (the definition of attributable will be discussed below). In DoView visual outcomes models there is no such limit is put on the steps and outcomes which can be put

DoView Creative Commons Copyright 2008 www.DoView.org
22
into an outcomes model. This is because, if outcomes models are limited to measurable and attributable outcomes, in most instances they lose their ability to perform the central role they have later in the visual evaluation planning process (e.g. for identifying where there are outcomes for which an indicator has not been developed - if the outcomes model only contains measurable steps and outcomes, it will be impossible to find a step or an outcome which is not yet being measured within the model). Steps and outcomes can have one or more of the following five major features. They can be: • Influencable - able to be influenced by a player • Controllable - only influenced by one particular player • Measurable - able to be measured • Attributable - able to be attributed to one particular player (i.e. proved that only one particular player changed it) • Accountable - something that a particular player will be rewarded or punished for. The steps and outcomes which are allowed within a DoView outcomes model, as discussed below are not limited to any particular set of these features. When talking to stakeholders it is often helpful to get them to define the entity they are talking about (e.g. an intermediate outcome, a key driver etc.) in terms of these five features of steps and outcomes. This often clarifies the discussion.
Step 2a: RESOURCE 2 Easy Outcomes Model Guidelines
Outcomes Model Guidelines – for drawing outcomes models for a visual evaluation plan This set of guidelines should be used when you are drawing an outcomes model to be used in a visual evaluation plan. 1. Use outcomes not activities. You can change an activity (doing) into an outcome (done) by simply changing the wording (for example, 'Increasing stakeholder support' to 'Increased stakeholder support'). 2. Let your outcomes model include any of the 'cascading set of causes in the real world'. The steps that you put into your models do not have to be limited to your measurable, attributable (ones you can absolutely

DoView Creative Commons Copyright 2008 www.DoView.org
23
prove you changed) or accountable outcomes. There's usually a lot of resistance to putting into non-measurable and non-attributable outcomes into your outcomes models. This is because stakeholders want to manage their risk around being held to account for the outcomes that go into such models. This is a genuine risk but is best managed by dealing with measurement, attribution and accountability after you've built your base model. All these are dealt with at later stages within the visual evaluation planning process. 3. Don't force your outcomes model into particular horizontal 'levels' within the model such as inputs, outputs, intermediate outcomes and final outcomes. In some cases this may distort a good clear visualization of the flow of causality in the real world. For instance, some types of outputs (for instance) may reach further up one side of an outcomes model than another. Forcing artificial horizontal layers onto an outcomes model often distorts it and makes it harder for stakeholders to 'read' the logical flow of causality in the model. The concept of outputs is useful for accountability purposes and they can be identified later at whatever level of a model they are located by going through and marking them with color or brief letter codes. 4. Do not 'siloize' your model. Silozing is when you draw an outcomes model in a way that artificially forces lower level outcomes to only contribute to single separate high level outcomes. In the real world, good lower level outcomes can contribute to multiple high level outcomes. Any outcome can potentially contribute to any other outcome in a model, the way you draw the model should allow for this. You need to draw you model in software which lets you do this. DoView never forces you to siloize your outcomes model. Any outcome (step) can be connected to any other outcome at any level through using its linking tool. 5. Use 'singular' not 'composite' outcomes. Composite outcomes contain both a cause and an effect (e.g. increase seat-belt use through tougher laws). This should be stated as two, rather than just one outcome. Words like through, or by in an outcome or step show that you're looking at a composite, rather than a singular outcome. 6. Keep outcomes short. Outcomes models with wordy outcomes are hard to read. You need software which helps you keep your outcome and step names short. DoView does this by letting you also include separate descriptive notes in rows within the record table where you can put as much detail as you like about

DoView Creative Commons Copyright 2008 www.DoView.org
24
any outcome or step. 7. Put outcomes into an hierarchical order. The normal DoView convention is to have highest level outcomes at the top and then drill down to lower level outcomes (you could have it another way - for instance from right to left). Use the simple rule that you can tell that outcome A is above outcome B in a case where, if you could magically make A happen, you would not bother with trying to make B happen. 8. Each level in an outcomes model should include all the relevant steps needed to achieve the steps or outcome(s) above it. 9. Keep measurements/indicators separate from outcomes and steps they're attempting to measure. Measurement should not be allowed to dominate an outcomes model. If it does, you're drawing a model of what you can measure, not what you want to do. Put your measurements (indicators) in as a next stage after you've drawn your model. 10. Put a 'value' in front of your outcomes and steps (e.g. suitable, sufficient, adequate). You don't need to define this at the time you first build your outcomes model. If it's not clear exactly what it amounts to, it can become the subject of an evaluation project later on. 11. Develop as many outcome slices (pages) (separate diagrams of part of your outcomes model) as you need (but no more). In an outcomes model you're trying to communicate to yourselves and to other stakeholders the nature of the world in which you're trying to intervene. Slices (pages) can be seen as a series of cuts through the world of outcomes in your area of interest. For instance, you might have slices (pages) at the national, locality, organization and individual level. The trick is to get the smallest number of slices (pages) needed to effectively communicate the relevant outcomes in the model. DoView lets you quickly move through your slices (pages) once you've built them with 'hop-to' hyperlinks. 12. Don't assume that you need a single high level outcome at the top of an integrated organizational outcomes model. Outcomes models should be about the external world, not just about your organization. Often organizations are delegated to undertake interventions in a number of areas or sectors that are best modeled separately. If you build separate models for the conceptually different areas or sectors you're

DoView Creative Commons Copyright 2008 www.DoView.org
25
intervening in, you can then just take that specific model and use it in discussions with stakeholders from that sector. This keeps things really clear for external stakeholders as the specific outcomes model which they're interested in is not enmeshed with other outcomes from other sectors they're not interested in. In addition, if you have drawn your models as generic 'cascading sets of causes in the real world' as suggested in 2 above, rather than restricting them only to steps and outcomes which are attributable (ones you can absolutely prove just you changed) to you, you'll find that they make a lot more sense to external stakeholders. External stakeholders can then just map onto the outcomes model the particular steps and outcomes they're focusing on. 13. Include both current high priority and lower priority steps and outcomes. Your outcomes model should be as accurate a model as you can draw of the 'cascading set of causes in the real world ' therefore it's not just about the current priorities you can afford to work on if they are a sub-set of the wider outcomes picture. Once you' ve drawn your outcomes model you can then map a typically more limited number of priorities onto your more comprehensive outcomes model. This allows you to think strategically about alternative options in the future and reflect this by changing your priorities. If your outcomes model only includes your current priorities it gives you no steer as to how your current priorities map onto the real world. In a public sector context this also allows outcomes models to support public sector employees providing 'free and frank advice' about how the world is – that is, the cascading set of causes in the real world. It's also consistent with the idea of evidence-based practice. It's then up to elected government officials to decide what their priorities will be and these can be mapped onto the underlying outcomes model. This approach means that outcomes models do not have to change every time there's a change in the elected official in charge or of the government as a whole. If elected official priorities change they're simply mapped onto the more comprehensive outcomes model. These guidelines are an adaptation of the set of outcomes model standards which has been developed Duignan, P. (2006) Outcomes model standards for Systematic Outcomes Analysis [http://www.parkerduignan.com/oiiwa/toolkit/standards1.html]. They are also available at http://www.easyoutcomes.org/guidelines/outcomesguidelines.html.

DoView Creative Commons Copyright 2008 www.DoView.org
26
Step 2b: Check the evidence for the model
The next step in developing a visual evaluation plan is to summarize any evidence you, or others, have about the connection between steps, or between steps and outcomes in your outcomes model. Developing the evidence for the links will probably be a somewhat lengthy exercise. You may just start with part of the model at the start. However, the concept is to over time build up the evidence base for the links in your model. Obviously, you and your stakeholders can have much more confidence in a model which has clearly stated evidence underlying all links within the model. This step needs to be undertaken in any evaluation where you are relying on arguing that the program is based on evidence rather than being able to prove changes from impact/outcome evaluation. Sometimes people commission outside researchers to find what evidence exists for certain parts of their models. The evidence can be from previous research, or from previous experience which has not been written up as research. Some links between steps in your model will be so self-evident that you will not need evidence for them. Stakeholders may have different demands about the type of evidence they will accept. It should not be assumed that there is the same level of difficulty in providing evidence for all links. Since this is the case, the fact that there is not yet sufficient evidence for a link may be either because the link does not exist in reality, or because it is hard to prove the link (e.g. it is generally easier to definitely prove a link between a drug and an individual health outcome than between a local community health promotion strategy and community level health outcomes). It is important to be clear that at this stage what is being considered is evidence from previous research and experience that the outcomes model is justified. This can be done even before a program starts. It is a different matter as to what has been proved regarding links in an outcomes model in the case of the specific implementation of an actual program. This second type of evidence is what is being looked for in the monitoring and evaluation activity set out later in this plan. However, where it is difficult to prove that the links in an outcomes model are actually occurring in a particular program, it is often argued that the fact that the outcomes model is well based in evidence from previous research and experience is good grounds for having more confidence in a program. A program which does not have such a well validated outcomes model backing it up would be less likely to inspire such confidence.

DoView Creative Commons Copyright 2008 www.DoView.org
27
Entering evidence into the record-table
Here the user has selected the link between ‘Appropriate information channels’ and ‘Responsible consumer purchasing decisions’ by clicking on the DoView link endpoint icon (an inverted V). The editing box for the record in the record-table associated with that link has opened and the user has entered some information into the Notes tab of the record about the evidence that exists for that link.

DoView Creative Commons Copyright 2008 www.DoView.org
28
An external hyperlink next to a link between two steps
Here an external hyperlink has been included next to the link between ‘Appropriate information channels’ and ‘Responsible consumer purchasing decisions’. When the user clicks on this external hyperlink they will be taken to a web page which sets out the evidence for this link.

DoView Creative Commons Copyright 2008 www.DoView.org
29
Web page with evidence for link laid out
Here is the web page that the user would arrive at if they clicked the external hyperlink in the last slice (page). This webs page lays out all of the evidence for the link between the steps identified in the previous slice (page).
Step 2b: PROCESS 1. Identify which, if any, areas of the outcomes model you are going to try to get evidence for.

DoView Creative Commons Copyright 2008 www.DoView.org
30
2. If you commission researchers to obtain evidence backing up links in the model, use the outcomes model in your discussions with the researchers to focus their attention on the areas where you want evidence (e.g. we want you to look at the evidence for the outcomes and links in this part of the model here).
3. Consider getting the researchers to enter the evidence directly into the DoView file if this approach will work for you (this is an option if you are always going to be working with the DoView file on a computer and therefore will have the record-table accessible).
4. Or, consider getting the researchers to put their research into HTML web pages. This means that others building similar models can access the evidence in the future.
5. Consider ‘front-ending’ the HTML web pages produced by the researchers with your visual DoView model also in HTML (from the end of April 2008 DoView will produce HTML versions of the set of slices (pages) in a model which can then be put up on any web site). If you put external hyperlinks in the DoView HTML version of the model (DoView does this from Version 1.15) you can have external hyperlinks in the DoView file next to the links or outcomes for which evidence has been identified and clicking on these will take the user down to the particular web pages which contain the evidence.
6. Lastly, if you also make available a copy of the DoView file on the site where the HTML model can be viewed, users, if they want to, can simply download the DoView file version of the model (which will contain all of the external hyperlinks out to the web-based evidence). They can then amend the DoView file version of the model (e.g. delete or include other steps) while still being able to access all of the web-based evidence (via the external hyperlinks) for those parts of the model that they have not altered.
7. This approach also means that as evidence is accumulated in the future, the web pages can be updated and anyone in the world who links via their DoView model (either on the web or just within Doview running on their computer) will have up-to-date evidence justifying the links between their steps and outcomes. If you are doing this you need to make sure that the internet addresses for the evidence pages remain constant (see below in DoView Tips).
8. Once you have put the evidence into your model you can then send your model out to peer review by experts to see if they agree that you have summarized the evidence correctly. A successfully peer reviewed DoView outcomes model gives stakeholders confidence that the outcomes model behind the program is sound.

DoView Creative Commons Copyright 2008 www.DoView.org
31
Step 2b: DOVIEW TIPS 1. To put evidence, or other information, under a link, click on the DoView link endpoint icon (an inverted V representing an arrow point) to highlight it. Then double click, or Right-click>Edit details, and an editing box will appear. This editing box is for the record associated with that link in the record-table at the bottom of the DoView screen. You can put the evidence into the Notes section of this box (click on the notes tab). The Working Notes section of the box is for any additional, more informal, working notes you might need to include.
2. You can get all the information in the record-table out of your DoView file by printing to PDF (File>Print as PDF). If the Include Data Table option is checked at the bottom of the Print as PDF panel then the PDF will include a table at the end which includes all of the information in the record table.
3. From the end of April 2008 you will be able to produce an HTML version of the slices (pages) in your DoView file from the File menu in DoView. This will function rather like the current Print as PDF command. The HTML files will be put in a subdirectory on your computer. Either you, or someone else, will need to upload all of the HTML files in this subdirectory to the web site on which you want the HTML version of your DoView slices (pages) to appear. Once they have been uploaded, when someone goes to the web site they will be able to move through the DoView slices (pages) (clicking on Hop-tos) in the same way as you can with your outcomes model when using it within DoView.
4. You can put up the DoView file which produced the HTML version on the same web site (if you don’t know how to do this ask the relevant web site administrator). This means that anyone who has DoView installed on their computer will be able to click on the file on the web site, click Open and the file will open within DoView ready for them to amend it and work with it in any way that they like. If there are external hyperlinks in the HTML version of the file (you are able to insert these in your DoView files from DoView version 1.15) these will still work in the DoView version once users download it if whenever they are using it on a computer which is connected to the internet.
5. If you are linking to external hyperlinks from within your DoView (or HTML) version of your model make sure that the web site addresses (URLs) which you link to do not change. Unchanging web site addresses are sometimes called permalinks (because they are permanent rather than chaning from time to time). Obviously, if a web address changes then when you click on the external

DoView Creative Commons Copyright 2008 www.DoView.org
32
hyperlink in either DoView or the HTML version you will not be able to locate the link any more.

DoView Creative Commons Copyright 2008 www.DoView.org
33
Step 3a. Put indicators onto the model
Put any indicators which you can identify onto the outcomes model next to the outcomes or steps they measure.
• Indicators are routinely collected measures of outcomes or steps. • You may or may not be collecting these indicators at the moment. • Use the picture you now have of what indicators you are, or are planning to collect, to think carefully
about whether it these are the right indicators to collect or whether it would be better to collect different indicators.
Tip: The importance of visualising indicators Lists of indicators are often prepared for programs and projects. Just looking at such a list, it is often impossible to work out whether it is just a list of the easily measurable, or a list of measures of the important outcomes a program is trying to influence. It is only by mapping indicators back onto a visual outcomes model such as is done in this step in developing a visual evaluation plan that you are able to work out whether or not the proposed indicator set is a comprehensive set of indicators for your program. If you do not do this step, you run the risk of you indicators just being the easily measurable. If such a list of indicators are, in turn, used to assess how well the program is doing, you run the risk of ending up just doing the measurable rather than doing the important.
.

DoView Creative Commons Copyright 2008 www.DoView.org
34
Indicators mapped onto the outcomes model
Here indicators have been mapped onto the outcomes model. They are shown by the small yellow icons which are placed next to the outcome the indicator is measuring. These icons stand for a small ruler. It can be seen from this that there is currently no indicator for the step ‘Responsible consumer use’. It may be appropriate to attempt to develop an indicator in regard to this outcome. In other instances this indicator mapping may show that there are a lot of indicators for a particular step or outcome and it may be decided to stop collecting some indicators. Also if an indicator is collected at a higher level within a model it may, in some cases be possible to not bother collecting lower level indicators of the steps which lead to the higher-level step.

DoView Creative Commons Copyright 2008 www.DoView.org
35
Name of indicator shown
Here the name of the indicator has been shown.
Step 3a. PROCESS 1. Identify all indicators you can, and map them onto the outcomes model next to the step or outcome you believe they are attempting to measure.
2. Examine the pattern of indicators across the model. There may be areas where there are too many indicators or areas where there are current no indicators, or not enough indicators.
3. Decide which indicators you will continue to collect and whether there are new indicators you should develop.

DoView Creative Commons Copyright 2008 www.DoView.org
36
Step 3a. DOVIEW TIPS 1. Indicators are inserted onto a slice (page) with a Right-click>Advanced>Indicator.
2. To turn off the text of an indicator name, Left-click on it to select it>Right-click>Show details>Icon only. This will show only the small yellow ruler which is the icon for an indicator.

DoView Creative Commons Copyright 2008 www.DoView.org
37
Step 3b. Identify indicators attributable to particular players
Some indicators may be able to be attributed to (proved that they have been caused by) particular players.
Indicators attributable to the program

DoView Creative Commons Copyright 2008 www.DoView.org
38
Here attributable indicators have been identified with the word ATTRIBUTABLE written next to them. You can see by the DoView link endpoint icons (an inverted V) the steps and outcomes it is believed are influenced by the program. However there are a number of other influences on the steps and outcomes in addition to the program – these are shown by the other white boxes along the bottom of the slice (page). This approach allows a rich conversation with stakeholders about what is, and is not, attributable to the program.
Step 3b. PROCESS 1. Examine each of the indicators to determine which it is agreed will be regarded as attributable to a particular project (player). An attributable indicator is one which is controllable by a particular play (i.e. the actions of the player are the main thing that influences the indicator).
2. Identify in some way which indicators these are (e.g. by putting a letter code next to them).
Step 3b. DOVIEW TIPS 1. To edit an indicator to identify it as an attributable indicator simply click on it to select it. Then double click on it to edit text in the indicator’s name and write in a letter code, the word ATTRIBUTABLE or whatever you want to serve to show that it is an attributable indicator.

DoView Creative Commons Copyright 2008 www.DoView.org
39
Step 3c. Identify targets and success criteria
Targets and success criteria (sometimes also known as evaluative or merit criteria) are levels on quantitative indicators, or states for qualitative indicators, which are used to define what constitutes achieving success. They can be for lower-level steps within an outcomes model or for the highest-level of the model as a whole. Targets and success criteria are often described as being for steps, outcomes or even for a program rather than being referred to as relating to indicators. However, from a conceptual point of view they can be thought of as being specified levels on quantitative or qualitative indicators. A benchmark is a target that is set for an indicators at the levels a similar program has been able to achieve. Targets and success criteria will be used in Step 8: Using your model for reporting back. Success criteria can be more qualitative than targets, but often quantitative information is also be used in deciding whether they have been met. When using success criteria, particularly at the highest-levels of an outcomes model, information from both indicators and from evaluation will be taken into account in determining the success of a program.

DoView Creative Commons Copyright 2008 www.DoView.org
40
Targets and success criteria examples
THIS IS AN EXAMPLE FOR THE ILLUSTRATIVE PROJECT (SOCIAL EVENT – A PARTY) WHICH IS USED ON THE EASY OUTCOMES SITE – REFER TO THAT SITE TO SEE THE OUTCOMES MODEL THIS RELATES TO. AN EXAMPLE RELATING TO THE CONSUMER ENVIRONMENTAL PROGRAM IS BEING PREPARED AND WILL BE PUT IN LATER VERSIONS OF THIS WORKBOOK. Here are examples of targets and success criteria.
Step 3c. PROCESS 1. Where appropriate set targets for indicators.

DoView Creative Commons Copyright 2008 www.DoView.org
41
2. Where appropriate set benchmarks (targets based on other programs) for indicators. 3. Where appropriate develop success criteria for the program.
Step 3c. DOVIEW TIPS 1. Targets and success criteria can be represented in various ways in DoView. For indicators, targets can be shown in the indicator name as can be seen illustrated in Step 9: Select outcomes-focused contracting arrangements.
2. Success criteria for a program can be set out on a slice (page) as has been done in the slice (page) above.

DoView Creative Commons Copyright 2008 www.DoView.org
42
Step 3d. List indicator projects
You may or may not have any indicator projects. These are projects designed to improve existing indicators or to develop new indicators. Sometimes they can be joint projects with other organizations which also want to set up or improve an indicator because they want to measure the same step or outcome. You can list these projects in your DoView file to keep track of them and so that you can refer to them when you are in meetings talking to stakeholders.
Indicator projects
Here only one indicator project has been listed because the other indicators are being collected by other

DoView Creative Commons Copyright 2008 www.DoView.org
43
organizations and the data will be available from them. This is an indicator project for a national telephone consumer survey including various questions related to the steps in the outcomes model. See the DoView Tips section below for the best way to set this out in DoView.
Step 3d. PROCESS 1. List indicator projects on a slice (page).
Step 3d. DOVIEW TIPS 1. Make a new slice (page) (click on New Slice at the bottom of the Slice (page) List) 2. Name the slice (page) in the Slice (page) List ‘Indicator Projects’ and put ‘Indicator Projects’ as a
text object at the top of the slice (page) (Right-click>Text or Click on the Text Tool on the Toolbar and click where you want the title). Make the heading ‘Indicator Projects’ large by clicking on the heading>Right-click>Change Size>Large.
3. Insert a new indicator project by doing a Right-click on an empty part of the slice (page)>Advanced>Item. An item is a generic object in DoView which can be used for any purpose you like in this case we are using it for an indicator project.
4. Clone (that is, put ‘live copies’) of the indicators which are being collected by the indicator project under the indicator. Do this by going to the outcomes model on which the indicators are located. Select all the indicators you want to clone (by Left-clicking on them one at a time while you hold down Shift). Return to your Indicator Projects slice (page) and on an empty space Right-click>Paste as clone. This will put clones of all of your indicators onto the slice (page). Rearrange them by holding down a Left-click and dragging them to where you want to place them under the indicator project name.
5. If you wish, put in a heading above the cloned indicator list by entering it as another text object. 6. If you wish, put in some information about the indicator project by Left-clicking>Right-click>Edit
details (or by double clicking on its associated record in the record-table at the bottom of the screen which will be highlighted whenever you click on the indicator project name).
7. Put whatever information you like into the notes or other fields of the record associated with the indicator project name.
8. Select the indicator project name by a Left-click then Right-click>Show details>Notes. This will show just the notes field from the record for the indicator project.

DoView Creative Commons Copyright 2008 www.DoView.org
44
Step 4a. Put evaluation questions onto the model
Put all the important evaluation questions you can think of onto your outcomes model.
• Put them next to the outcomes they focus on.
• Include both impact/outcome evaluation questions (asking about your effect on high-level outcomes) and non-outcome evaluation questions (asking about how to improve what you're doing or asking about how the process works – called formative and process evaluation questions).
• Don't worry at this stage if you can, or can't, answer these evaluation questions.
• If you want to be able to do certain types of economic analysis later on you should include the
evaluation question: How much did it cost to do this activity? This is so that information will be collected when the program is being set up which will enable an estimate to be made of the cost of setting up and running the program. It is often hard to get accurate information about the cost of a project if it has not been collected at the time the program first starts running.
Tip: Mapping evaluation questions onto an outcomes model can be very helpful in clarifying stakeholder discussions Thinking about exactly what information an evaluation is going to be able to provide is difficult for both evaluators and non-evaluators. One useful way of dealing with this problem is careful specification of evaluation questions. Mapping evaluation questions back onto the visual outcomes model as is suggested in this visual evaluation planning process helps keep the discussion clear both for the evaluators and stakeholders. A similar evaluation question can be put in different words. For instance the question: ‘Did the program work?’ ‘Did the program achieve its objectives?’ ‘Was the program successful?’ are all very similar evaluation questions. By requiring that all evaluation questions are mapped back onto the outcomes model next to the steps or outcomes they apply to, you are able to clarify the discussion and get rid of different verbal formulations of the same evaluation questions. Once the evaluation questions have been clarified in this way they are used as the basis for further steps within the visual evaluation planning process.

DoView Creative Commons Copyright 2008 www.DoView.org
45
Impact/outcome evaluation question placed on outcomes model
Here the high-level impact/outcome evaluation question has been placed onto the outcomes model.

DoView Creative Commons Copyright 2008 www.DoView.org
46
Process/formative evaluation questions placed onto outcomes model
Here some lower-level process and formative evaluation questions have been put onto the outcomes model.
Step 4a. PROCESS 1. Place evaluation questions onto the outcomes model next to the steps or outcomes they apply to.
2. Use the mapped evaluation questions to clarify all discussions about evaluation when the evaluation team or stakeholders are trying to formulate the questions that the evaluation will answer.
3. Look at the outcomes model and see if there are important steps or outcomes for which an evaluation question has not been identified. Assess whether an evaluation question needs to be

DoView Creative Commons Copyright 2008 www.DoView.org
47
identified for these steps or outcomes. 4. Identify which evaluation question (or in some instances questions) is/are the high-level
outcome evaluation question.
Step 4a. DOVIEW TIPS 1. Place evaluation questions on the slice (page) (on an empty space Right-click>Advanced>Question). 2. To edit an evaluation question double click on it. 3. Drag the evaluation question to where you want it next to the relevant steps or outcomes (select with
a Left-click and drag).
Step 4a. RESOURCE 1 Three ‘purposes’ for evaluation
The Three ‘Purposes’ for Evaluation Evaluation activity can be divided up into three types – which can be referred to as the three ‘purposes’ for evaluation. These are: Formative evaluation – evaluation with the purpose of improving program implementation. This type of evaluation takes place while the program before and during the program implementation and while there is type for feedback to be used to improve program implementation. Within the visual evaluation planning approach formative evaluation is viewed as any attempt to improve the implementation of the outcomes model as it is being applied in a program in a particular instance. Other names for formative evaluation area: developmental evaluation, implementation evaluation, prospective evaluation synthesis. Process evaluation – evaluation with the purpose of describing the course and/or context of the program. This type of evaluation details the way in which the program is unfolding in a particular instance. It can include any examination of the details of program implementation. It can also include examining the wider context (e.g. politics) in which a program is running which have influenced the way in which the program turns out. If the program is still running, process evaluation information can be fed back into program improvement – if this is done then the purpose of the evaluation becomes formative. Other names for process evaluation are: descriptive evaluation.

DoView Creative Commons Copyright 2008 www.DoView.org
48
Impact/outcome evaluation – evaluation with the purpose of assessing the intended and unintended, positive and negative outcomes of a program. This type of evaluation makes judgements about the success or otherwise of the program and its intended and unintended consequences. Sometimes the attempt is made to differentiate the words impact and outcome to make one mean changes which occur sooner than changes that occur later. In terms of visual evaluation planning approach these are just regarded as changes in steps or outcomes at different levels at the top of the outcomes model. Other names for impact/outcome evaluation: summative evaluation.

DoView Creative Commons Copyright 2008 www.DoView.org
49
Step 4b. List evaluation questions going to be answered
Work out which of the possible evaluation questions you came up with in the last step you're going to try to answer. One of the important differences between visual evaluation planning process and most other monitoring and evaluation approaches is that it encourages you to make clear which evaluation questions you are NOT going to attempt to answer in addition to the ones you are going to try to answer. This is a very effective way of making sure that stakeholders are absolutely clear about what questions you are and are not going to be attempting. Don't just assume that you have to answer high level outcome evaluation questions. Discuss with your funding or controlling organization whether or not you should be trying to answer these. Often it would be better if the funding agency evaluated them across a number of the programs they're funding rather than just getting one program to answer them. Setting your thinking out in this was means that you can always justify your decisions to stakeholders now and in the future.

DoView Creative Commons Copyright 2008 www.DoView.org
50
Evaluation question list
Here is a list of all of the evaluation questions which have been identified and mapped onto the model. They have been put on this slice (page) and a decision made as to whether or not the attempt it going to be made to answer them. This approach is used to structure stakeholder decision-making about which evaluation questions to focus on.
Step 4b. PROCESS 1. List the evaluation questions identified in the previous step. 2. Identify the ones where an attempt is going to be made to answer them.
DoView Creative Commons Copyright 2008 www.DoView.org
51
Step 4b. DOVIEW TIPS 1. Clone the evaluation questions from the outcomes model onto this slice (page). (For information on how to clone objects in DoView see the earlier DoView Tips).

DoView Creative Commons Copyright 2008 www.DoView.org
52
Step 4c. Assess possible outcome evaluation
There're only a limited number of possible high level outcome evaluation designs. Outcome evaluation asks the question - 'Can I prove that this activity actually changed high level outcomes rather than them being changed by something else'. You can use this step in your visual evaluation plan, or you may chose not to. It is based on a set of outcome evaluation designs identified in the Easy Outcomes approach (http://www.easyoutcomes.org).
• Think about each of the seven possible outcome evaluation designs used in the DoView visual evaluation planning process and work out whether any of them are appropriate, feasible or affordable.
• Information about the seven designs is provided below in the Resource section. If you don't know
much about evaluation designs you'll have to talk to someone who does at this stage in the Easy Outcomes process. Show them your visual evaluation plan so far and get them to help you write up this particular step.
Keeping a clear record of your decisions about outcome evaluation is usually very helpful when outside stakeholders start asking questions about why you're doing what you're doing in an evaluation.

DoView Creative Commons Copyright 2008 www.DoView.org
53
Assessment of appropriateness, feasibility and affordability of first 4 of the 7 possible impact/outcome designs
Here the first four of the possible seven impact/outcomes designs which can establish causality have been analysed and none are considered appropriate or feasible in this case.

DoView Creative Commons Copyright 2008 www.DoView.org
54
Assessment of appropriateness, feasibility and affordability of last 3 of the 7 possible impact/outcome designs
Here the last three of the seven impact/outcomes designs which can establish causality have been analysed and none are considered appropriate or feasible in this case. This will not always be the case, in a number of evaluations it will be possible to undertake outcome evaluation designs such as those which are described here.
Step 4c. PROCESS 1. Examine each of seven possible impact/outcome evaluation designs specified in the visual evaluation planning process and see which of them are appropriate, feasible and affordable in the case of your program.
2. Involve those with impact/outcome evaluation in this visual evaluation planning step if you do

DoView Creative Commons Copyright 2008 www.DoView.org
55
not have this expertise. 3. Document in your visual evaluation plan as has been done above the reasons why each design
is, or is not, appropriate, feasibile and/or affordable.
Step 4c. DOVIEW TIPS 1. There are no specific DoView tips for this step.
Step 4c. RESOURCE 1 The seven possible impact/outcome evaluation designs
The seven possible high-level Impact/Outcome evaluation attribution designs There are seven possible types of high-level impact/outcomes attribution evaluation designs used in the Easy Outcomes approach (http://www.easyoutcomes.org) and which can be used when developing a visual evaluation plan if you chose to. These are described below. In each case, diagrams are used to illustrate the designs so as to assist cross-discipline clarity regarding what a particular type of design actually entails. It is hoped that over time, this set of designs (amended if necessarily) can provide an exhaustive and mutually exclusive set of designs such than any evaluation can unambiguously be identified as using one or more of these designs 1[1]. At the moment these designs are specified using language used in evaluation and policy analysis, in future they may be specified in more generic language which includes the way in which such designs are seen in econometrics and other disciplines.

DoView Creative Commons Copyright 2008 www.DoView.org
56
True experimental design In the typical simplest case of this design, a group of units (people, schools, hospitals) is identified which is the focus of the intervention being studied. A sample is taken from this group (if there are large numbers of the particular unit on which the intervention could be used). The sample is randomly divided. One half of the units have the intervention applied to them (the intervention group) and the other half do not (control group). Changes in measurements of the high-level outcomes are compared before and after the intervention has been run. It is presumed that any significant difference (beyond what is estimated as likely to have occurred by chance), is a result of the intervention. This is because there is no reason to believe that the units in the intervention and the control group differed in any systematic way which could have created the difference, apart from receiving, or not receiving, the intervention. The diagram below illustrates this design:

DoView Creative Commons Copyright 2008 www.DoView.org
57
Regression discontinuity design
A regression discontinuity design can be used in the case where units can be ranked in order based on measurement of a high-level outcome before any intervention takes place. For instance, reading level for students or crime clearance rate for a police district. A sub-set of the units below a point on the outcome measurement are then given the intervention. After the intervention has taken place, if it is successful, there should be a clear improvement in those subject to the intervention but no similar amount of improvement amongst those units above the cut off point (which did not receive the intervention). This design is more ethically acceptable in a case where there are limited resources for piloting an intervention because (in contrast to a true experiment) the intervention resources are being allocated to those units with the greatest need.
The diagram illustrates this design:

DoView Creative Commons Copyright 2008 www.DoView.org
58
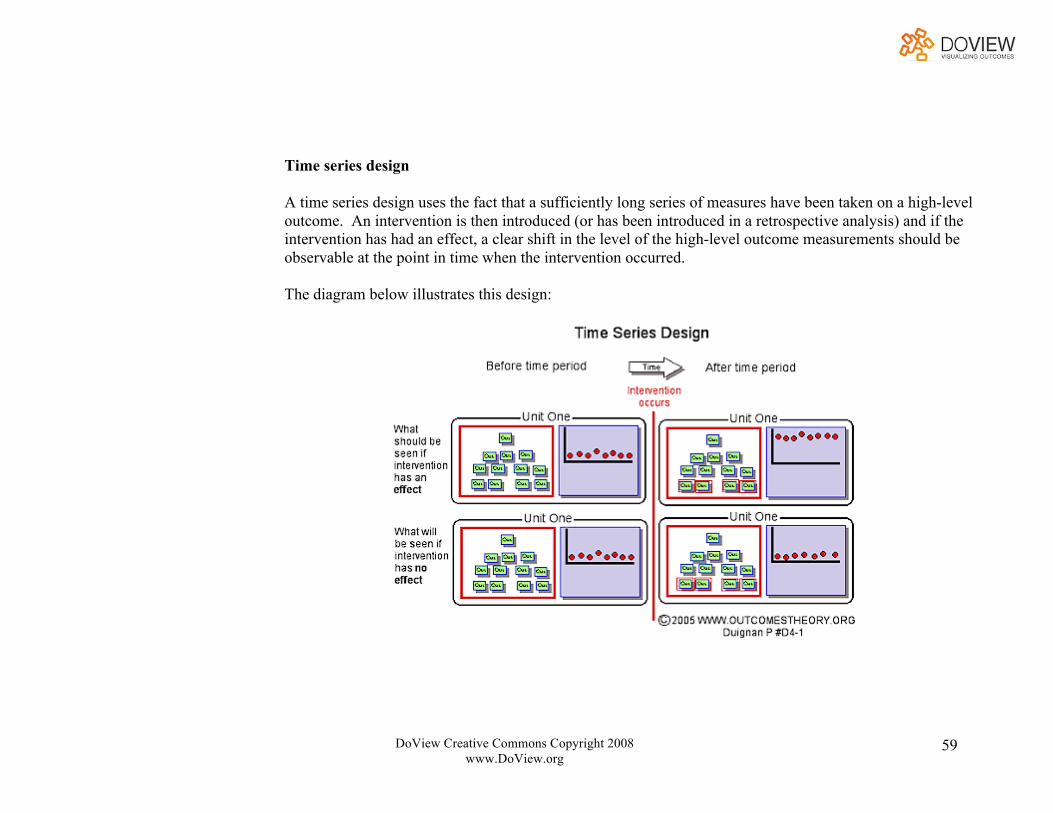
DoView Creative Commons Copyright 2008 www.DoView.org
59
Time series design
A time series design uses the fact that a sufficiently long series of measures have been taken on a high-level outcome. An intervention is then introduced (or has been introduced in a retrospective analysis) and if the intervention has had an effect, a clear shift in the level of the high-level outcome measurements should be observable at the point in time when the intervention occurred.
The diagram below illustrates this design:

DoView Creative Commons Copyright 2008 www.DoView.org
60
Constructed matched comparison group design
This design is where a naturally occurring group is located which is similar in as many ways as possible to the group which is receiving the intervention apart from the fact that it is not receiving the intervention. For instance this could be different administrative units which do not receive an intervention. Or different towns or different countries. In a somewhat different version of this design (but which employes the same underlying logic) estimates are made of what happens on average to people with a certain set of characteristics (e.g. who have been on an unemployment benefit for four weeks). An intervention is then given to a group and what happens to them (how long they remain on the unemployment benefit) is compared to the predicted amount of time they should have remained on the unemployment benefit if they had not received the intervention. This type of design is called propensity matching. Figure 5 illustrates this design.

DoView Creative Commons Copyright 2008 www.DoView.org
61
Exhaustive alternative causal explanation elimination design
The exhaustive alternative causal explanation design proceeds by examining all of the possible alternative hypothetical outcomes hierarchies that may lie behind the changes observed in high-level outcome measurement. This can use a range of techniques all directed at identifying and excluding alternative

DoView Creative Commons Copyright 2008 www.DoView.org
62
explanations to the intervention. Sometimes this is described as more “forensic-type” method rather than the experimental approaches used above.
The diagram illustrates this design:
Expert opinion summary judgment design [1]
In this design, an expert is asked to give their summary judgment opinion regarding whether high-level outcomes are attributable to an intervention. They are expected to use whatever data gathering and analysis methods they normally use in their work in the area and to draw on their previous knowledge in dealing with similar instances.
The diagram below illustrates this design:

DoView Creative Commons Copyright 2008 www.DoView.org
63
Key informants opinion summary judgment design [1]
In this design, key informants (people who have experience of the program or significant parts of the program) are asked to give them summary judgment opinion as to whether changes in high-level outcomes are attributable to the intervention. They are expected to use whatever data gathering and analysis methods they normally use in their day to day work and to draw on their previous knowledge in dealing with similar instances. These judgments are then summarized and analyzed and brought together as a set of findings about the outcomes of the program. 1[2]
The diagram below illustrates this design:
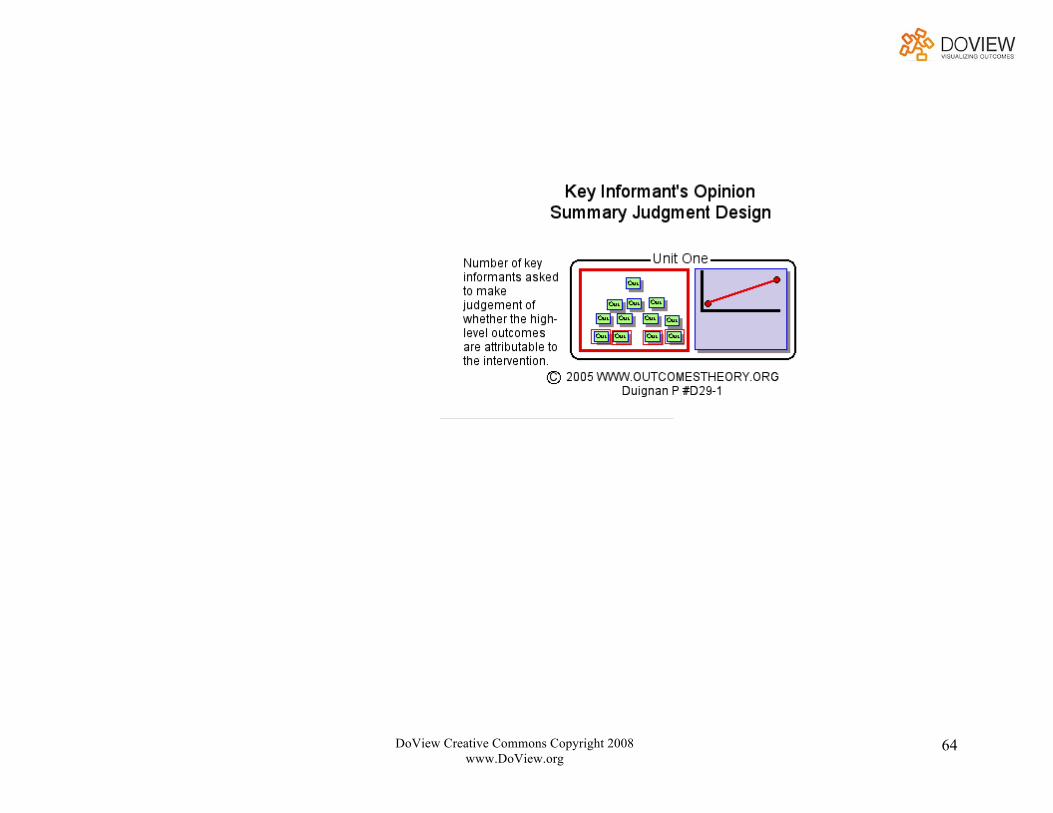
DoView Creative Commons Copyright 2008 www.DoView.org
64

DoView Creative Commons Copyright 2008 www.DoView.org
65
Step 4d. List priority evaluation projects
Set your evaluation projects out and under them put the evaluation questions they'll be answering. This is very helpful in a large evaluation because it stops different evaluation sub-projects undertaken by different evaluators attempting to answer the same questions written in different ways.
An evaluation project slice (page)

DoView Creative Commons Copyright 2008 www.DoView.org
66
Here an evaluation project has been set out with who will do the evaluation, the estimated cost and timeframe. This slice (page) will be added to in Step 5e when evaluation methods are listed.
Step 4d. PROCESS 1. Once you have identified the priority evaluation questions, group them into evaluation projects.
2. It may be that an evaluation project only answers a single evaluation question or one evaluation project may answer a number of evaluation questions.
3. For each evaluation project identify: 1) who will do the evaluation project (e.g. internal staff or external contractors; 2) the likely cost of the evaluation project; and 3) the timeframe for the completion of the evaluation project.
Step 4d. DOVIEW TIPS 1. Create a new slice (page) for the evaluation project (click on New Slice in the Slice (page) List) 2. Enter the name of the evaluation project at the top using the text object (on an empty space Right-
click>Text). Make the text heading large (Left-click on the text to select it, Right-click>Change size>Large).
3. Insert an item for the evaluation project (on a empty part of the slice (page) Right-click>Advanced>Item, then put in the Evaluation Project name as the item name.
4. Go back to the outcomes model slice (page) which has on it the evaluation question or questions that the evaluation project will answer (Left-click on the relevant slice (page) name in the Slice (page) List or use the Browser-type back or forward arrow at the top left of the DoView screen to move through the slices you have been looking at recently to find the one with the evaluation question or questions on it).
5. Copy the relevant evaluation question or questions (Left-click to select the question, Right-click>Copy, go to the evaluation project slice (page) and clone the evaluation question onto the slice (page) (on an empty space Right-click>Paste as clone). From now on if you change the name or details of the evaluation question in one place it will change in all of the other clones.
DoView Creative Commons Copyright 2008 www.DoView.org
67
Step 4e. List evaluation methods for evaluation projects
There are a number of evaluation methods which can be used to answer evaluation questions within evaluation projects. The purpose of this step in the visual evaluation plan is to identify the methods that will be appropriate to answer your priority evaluation questions. In addition to evaluation methods there are a range of types of analysis which can be used with different evaluation methods you should also identify which type of analysis you will be using to answer each evaluation question within each evaluation project. If you are not an expert in different evaluation methods it is likely that you will need to get some assistance at this stage from someone who is knowedgable about evaluation methods and analysis. There is a set of evaluation method which are set out in the Easy Outcomes approach (http://www.easyoutcomes.org) and they are shown below. This list shows a list of possible evaluation methods (e.g. focus groups, questionnaires) and types of analysis (e.g. statistical, qualitative etc) which you can use within any of the evaluation projects you have just identified.

DoView Creative Commons Copyright 2008 www.DoView.org
68
Possible evaluation methods and analyses which can be used
Here is the list of major evaluation methods which are used in Easy Outcomes. Appropriate methods are selected from this list which will answer the questions in each evaluation project. Most of these methods can be used at one of three stages in the program life-cycle – before, during or after. In addition there are four different types of analysis which can be used in various combinations with these methods, these are – statistical analysis (which is the same as what is often referred to as quantitative analysis), qualitative analysis, economic analysis and expert analysis (where expert judgement is relied on). Methods should be taken from this list, when they will be used and the method analysis decided on and they should be pasted onto the slice (page) for the particular evaluation project as in the next screenshot. If you wished you could develop a different template setting out evaluation methods and types of analysis.

DoView Creative Commons Copyright 2008 www.DoView.org
69
Analyses which will be used for a example Evaluation Project 1: Appropriate communication channels for consumers
Here the methods which will be used in Evaluation Project 1: Appropriate communication channels for consumers are listed. In this case they have been put on the bottom of the earlier slice (page) which described the cost and timeframe for the evaluation project. These method will be used during the program and there are no plans in this evaluation project for any methods to be used before the program (it is too late) or after the program since it is an ongoing program, therefore there are empty boxes for each of these. Because the information from this evaluation project is going to be used to improve program implementation it is described as being formative evaluation. This type of listing of evaluation methods would be done for each of the priority evaluation projects which are to be undertaken. Often there would be an additional slice (page) which would set out in more detail how the methods would be used, for example,

DoView Creative Commons Copyright 2008 www.DoView.org
70
how many participants would be interviewed by telephone etc.
Step 4e. PROCESS 1. For each evaluation project, use the Easy Outcomes list of evaluation methods, timing and analysis to identify the specific methods which will be used in the evaluation project.
2. Copy and paste each of the relevant methods onto the Evaluation Project Slice (page).
Step 4e. DOVIEW TIPS 1. Get a copy of the template slice (page) which has on it the Easy Outcomes list of Evaluation Methods and Analysis. You can do this by downloading the Easy Outcomes template on the Resources page of the Easy Outcomes site (http://www.easyoutcomes.org/resources.html). If you have DoView installed on your PC, simply click on the DoView file version of the template, select Open and the template will open within DoView. If you are not using all of the template, select the relevant slice (page) from the Slice (page) List (select it by a Left-click on the slice (page) name>Right-click>Copy. Now go to the DoView file you are creating your Easy Outcomes plan in (if it is not open, open it by clicking on File>Open). This will open a new instance of DoView with the file you are working on in it. In the instance of DoView which contains the file you are working on, Right-click on the slice (page) name for the Evaluation Project you are focusing on and Right-click>Paste. This will paste the Easy Outcomes Evaluation Methods and Analysis template below the Evaluation Project slice (page).
2. From the Evaluation Methods and Analysis template you now have open, copy any of the methods you want to use in the Evaluation Project (select with a Left-click>Right-click>Copy). Now go to the Evaluation Project slice (page), paste the methods items you are going to use onto the Evaluation Project slice (page) (on an empty space Right-click>Paste).
3. Identify the type of analysis which will be used and put the relevant letter (S=Statistical analysis, Q=Qualitative analysis, $=Economic analysis, E=Expert analysis) next to each method.
4. If you want to you could make other slices for an evaluation project. For instance, more information on the methods or more information setting out the steps which will be needed to carry out the evaluation project with dates for completion etc.

DoView Creative Commons Copyright 2008 www.DoView.org
71
Step 4e. RESOURCE 1 List of possible methods and analysis which can be used in evaluation projects
Methods and Types of Analysis Which are Used in Evaluation Evaluation methods should be selected on the basis of whether or not they will be able to effectively answer the evaluation questions within each evaluation project. There are a number of consideration when selecting evaluation methods. The first is to make sure that the methods which are selected are appropriate and ethical for the groups involved in them. Appropriate ethical approval processes need to be followed where required and evaluators need to conform to appropriate ethical standards. Methods selection in evaluation also needs to be very focused on value for money in terms of the selection of methods. There are usually limited evaluation resources and they need to be used wisely. Evaluation methods should be ‘fit for purpose’ in the sense that they provide the amount of information required at a level of certainty which is sufficient for the purpose of the evaluation. There is little point in using all of one’s evaluation resource for a particular evaluation on the perfect application of a single method when it would have been better to use several different methods at a level which was ‘fit for purpose’ rather than attempting to achieve a perfect application of the method. Of course, methods have to be used in a way that will produce usable information. Selecting the mix of evaluation methods for a particular evaluation is therefore a matter of making decisions about the various trade-offs between spending a lot of resources on a few methods, or of undertaking a wider mix of methods. Stakeholder consultation – a wide range of consultation methods are used at different stages within evaluation. In all of the purposes for evaluation (formative, process and impact/outcome evaluation) there is likely to be some type of stakeholder consultation about the evaluation. Stakeholders can be divided into two types, first participant stakeholders – ones who are going to be involved in some way in the process of the evaluation itself (e.g. being interviewed, handing out questionnaires). Second, audience stakeholders – ones who are interested in the results of the evaluation. Any particular stakeholder can be either of these types of stakeholders or both types. In formative evaluation stakeholder consultation may also involve aspects of the program itself in addition to just the evaluation. This consultation may focus on ideas for the design of the program; getting stakeholder support for the program; working out protocols with stakeholders for aspects of the program. Analysis: Qualitative summary of what the workshop concluded Needs assessment – this can involve a wide range of processes for working out if there is a need for the program. It may involve talking with stakeholders, analysing existing data, doing surveys to identify need,

DoView Creative Commons Copyright 2008 www.DoView.org
72
looking what other programs and activities are already occurring (Easy Outcomes Step 3b Map current or planned activities can be used for this) etc. The purpose is to define if there is a need and to detail as much as possible what that need is so that the program can be designed to meet the need. Analysis: Quantitative or qualitative analysis. Outcomes logic model drawing – drawing outcomes models of any type that are then used to clarify thinking about all of the steps which are needed in order to achieve higher-level outcomes. These models are known by different names including: logic models, program logics, intervention logics, strategy maps, means-ends diagrams, results chains etc. There are often different conventions about what types of steps and outcomes are allowed in such models (e.g. do they need to be measurable and attributable). A set of guidelines for drawing such models which can be used within the Easy Outcomes approach is provided earlier in this workbook. Once drawn, the links between steps and outcomes within an outcomes model can be examined to see if there is evidence for the link (this is done in Easy Outcomes Step 2b Check the evidence for the model.) Analysis: Logic analysis of whether the pattern of causality claimed in the outcomes model makes logical sense. Collaborative group processes - Often used in formative evaluation (evaluation with the purpose of improving the implementation of a program). For instance, if a program is being run in 20 localities across a country the program workers could be brought together either physically and/or electronically to work in an ongoing collaborative style with formative evaluators and in some instance with the funder. This collaborative process would: define common and locality-based outcomes; identify indicators for tracking success; working in groups to define strategies; develop collective resources; collectively approach national level stakeholders to remove policy barriers; provide collegial support for each other; and document the process for evaluation purposes (process evaluation – describing the course and context of a program). Analysis: Qualitative summary of what the workshop concluded. Review of: literature, previous experience – A review of the literature is a summary of the research findings from the past which relate to the program. In Easy Outcomes it is suggested that literature reviews are focused on the outcomes model (this takes place in Step 2b: Check the evidence for the model). Literature reviews can range from a fairly informal look at what research has been published about the area a program is working in, to highly structured reviews which are called Systematic Review. In areas in which

DoView Creative Commons Copyright 2008 www.DoView.org
73
there is quantitative data available these systematic reviews attempt to summarize all of the outcome evaluation findings from the past (examples of systematic reviews can be found at http://www.cochrane.org for the health sector and http://www.campbellcollaboration.org for the social sector and http://www.cebc.bham.ac.uk for the natural resource conservation area). In addition to research literature reviews, there can be reviews of previous experience with programs similar to the program which is being evaluated which has not got into the research literature. This is often done by an evaluator (in the case of formative evaluation) contacting other programs to find out what they have learnt about best practice for running such programs. In the case of a number of programs which are running concurrently some sort of Collaborative group process as described above can be used. Analysis: Qualitative summary of the research literature or previous experience. Quantitative analysis of the effect size from previous studies in the case of some systematic reviews. Records collected not just for the evaluation – In any program there are likely to be administrative or other records which are routinely collected. These would be collected regardless of whether the evaluation is taking place or not. These are often in the form of statistics about those who are involved in the program or written notes about those involved. Analysis: These records can be analysed using qualitative or quantitative analyses. Photo, video or audio recordings of program activities – As part of the evaluation various types of recordings of program activities may be made using photo, video or audio recording. This material may then be analysed using qualitative or quantitative analyses as part of the evaluation. In addition to whatever technical analysis is undertaken of these types of recordings, visual or audio recordings are a good way to quickly communicate to an audience what a program consisted of and they are often used in explaining the program to participants at the time that evaluation results are being disseminated. Analysis: Qualitative or quantitative analysis of the material produced. Other records of the program made for the evaluation – In addition to the two types of records discussed so far, there are other records which are made specifically for the evaluation itself. This covers a whole range of records which are then analysed qualitatively or quantitatively as part of the evaluation. Analysis: Document analysis – analysis of documents in order to extract themes in regard to the topic being

DoView Creative Commons Copyright 2008 www.DoView.org
74
evaluated. This can include all types of documents such as formal reports, minutes of meetings, memos and print media reports or electronic media transcripts. The analysis can range from a extraction of general themes to a tight, specific and detailed analysis. It may use either quantitative analysis (e.g. counting the number of times that a theme occurs) and/or qualitative analysis (e.g. identifying the major themes). In either case it is important to document the criteria which are used to make decisions about rating and analysing material. In addition in some evaluations material is independently rated by more than one rater so as to increase the accuracy of the rating. Analysis: Qualitative or quantitative analysis of the documents being examined. Participant questionnaires/scales/surveys: written, postal, web-based – Evaluations use a wide range of different types of questionnaires/scales/surveys (sometimes called instruments) which can be delivered in different ways (written, postal, web-based). Many different types of simple instruments are used in evaluations. More complex instruments may require the involvement of those with expertise in their design and use. Sampling and analysis of these instruments may also require considerable expertise. Analysis: Quantitative or qualitative analysis. Participant (P) interviews, P Group interviews: face to face, telephone (audio/video record?) – Participant interviews can be used in formative, process and impact/outcome evaluation. Such interviews can use highly structured questions through to broad ‘semi-structured interview schedules’ which are just lists of question areas to be covered in the interview. In some styles of interviewing the interviewer does not have to follow the exact order of the questions on the interview schedule as long as the participant covers all of the questions over the course of the interview. Participants may be asked a wide range of questions directed at assessing the effect of the program on them. They may also be asked about the program more generally (for process evaluation); to make suggestions for program improvement (for formative evaluation); or they may be asked to make judgements about whether the program was an overall success for them(for impact/outcome evaluation). If participants are doing the latter it is a good idea for them to be given some sort of success criteria so that all participants can use the same type of criteria to judge the program. (See Easy Outcomes Step 4c: Identify targets and success criteria). Participants and other stakeholders may also be involved in developing the success criteria. Face to face participant interviews usually provide the best information, however telephone interviews can provide adequate information and have the advantage of costing less, being able to be done within a shorter time frame, and usually being

DoView Creative Commons Copyright 2008 www.DoView.org
75
more convenient for the participant and the interviewer. There are some circumstances, e.g. because of cultural reasons, that face to face interviews would be preferred over telephone interviews. A set of participant interviews may be repeated in an evaluation, for instance at the start, in the middle and at the end of a program. Telephone interviews generally make the burden on participants less than face to face interviews and therefore may be more likely to have a high response rate. However, this depends on telephone coverage and ease of using the telephone amongst the participant group. Interviews allow interaction between the interviewer and the participant which allows the interviewer to probe participant replies. It also means that the interview can take up at later interviews some themes which have emerged at earlier interviews if this fits with the protocol being used in regard to the participant interviews. Group interviews are where a number of participants are interviewed together in the interests of efficiency. Once one participant has made a point the others can just quickly agree or disagree with it. This is more efficient but has the downside that it may produce a less divergent picture of the program. It may be possible to supplement it with a private questionnaire about the program being filled out at the start of the group interview before the convergent pressure which comes from people being in a group situation starts to operate. Group interviews are different from focus groups discussed below in that the emphasis in a group interview is not in generating a lot of discussion between the participants, just getting their own views from them as efficiently as possible. Analysis: Participant interviews are usually analysed in a straight forward manner with the key themes identified by the group of participants being extracted and summarized. More complex qualitative research analysis methods may be used in some cases. Non-participant observation – non-participant observation covers a wide range of types of observations which can be made to get information about a program. Some of these are referred to as unobtrusive observation and include measures because taking the measurements is unlikely to influence behaviour (e.g. counting the amount of recycling put into recycling bins at an event). Analysis: often quantitative analyses are used in regard to this type of observation. Participant observation – participant observation in this context does not refer to observing participants but rather to a method used in evaluation research where the evaluator becomes a participant in the program they are evaluating. Such involvement has the potential to influence the way that others react depending on how the evaluator operates. However, it has the advantage that the evaluator can sometimes get a much closer picture of exactly what is happening in the evaluation than then may if they did not involve

DoView Creative Commons Copyright 2008 www.DoView.org
76
themselves in the program. It is sometimes possible to take this sort of approach at only one or several sites on which a program is operating so that the evaluator gets a better picture of how the program operates but also has data from sites where they were not involved. This type of approach often provides good insights into the more informal, undocumented aspects of what is happening in a program. Analysis: the analysis used for this method tends to be qualitative. Key informant (KI) interviews, KI group interviews: face to face, telephone (audio/video record?) – Key informants are people who are in positions which mean that they are likely to have particular knowledge of a program. They are often interviewed in formative, process and impact/outcome evaluation. In such interviews, key informants can be asked for their judgements about any aspect of the program. Key informant interviews usually work off a ‘semi-structured interview schedule’ which is list of questions about the program. In some styles of interviewing the interviewer does not have to follow the exact order of the questions on the interview schedule as long as the key informant covers all of the questions over the course of the interview. Key informants may be asked to describe the program (for process evaluation); to make suggestions for program improvement (for formative evaluation); or they may be asked to make judgements about whether the program was an overall success (for impact/outcome evaluation). If key informants are doing the latter it is a good idea for them to be given some sort of success criteria so that all key informants can use the same type of criteria to judge the program. (See Easy Outcomes Step 4c: Identify targets and success criteria). Key informants and other stakeholders may also be involved in developing the success criteria. Face to face key informant interviews usually provide the best information, however telephone interviews can provide adequate information and have the advantage of costing less, being able to be done within a shorter time frame, and usually being more convenient for the key informant and the interviewer. There are some circumstances, e.g. because of cultural reasons, that face to face interviews would be preferred over telephone interviews. A set of key informant interviews may be repeated in an evaluation, for instance at the start, in the middle and at the end of a program. Telephone interviews generally make the burden on key informants less than face to face interviews and therefore may be more likely to have a high response rate. Interviews allow interaction between the interviewer and the key informant which allows the interviewer to probe key informant replies. It also means that the interview can take up at later interviews some themes which have emerged at earlier interviews. Group interviews are where a number of key informant are interviewed together in the interests of efficiency. Once one key informant has made a point the others can just quickly agree or disagree with it. This is more efficient but has the downside that it may

DoView Creative Commons Copyright 2008 www.DoView.org
77
produce a less divergent picture of the program. It may be possible to supplement it with a private questionnaire about the program being filled out at the start of the group interview before the convergent pressure which comes from people being in a group situation starts to operate. Group interviews are different from focus groups discussed below in that the emphasis in a group interview is not in generating a lot of discussion between the key informants, just getting their own views from them as efficiently as possible. Analysis: Key informant interviews are usually analysed in a straight forward manner with the key themes identified by the group of key informants being extracted and summarized. More complex qualitative research analysis methods may be used in some cases. Key informant questionnaires/scales/surveys: written, postal, web-based – questionnaires/scales/surveys in written, postal or web-base form may be used in evaluations. They are used for the same reasons as discussed for key informant interviews above. In contrast to interviews these methods do not allow for the interviews to probe replies in the same way. Analysis: Analysis may include quantitative analysis of results as well as qualitative analysis of themes. Focus groups: participant, key informant – Focus groups are a method where the main emphasis is on collecting information which arises from the interaction between those involved in the focus group. They are based on the idea that it is in interaction between those in the group that a deeper analysis will evolve of the topic under discussion. They can be used at various stages in an evaluation. In formative evaluation they are often use to pre-test aspects of a program with potential participants. Analysis: The usual method of analysis is a simple qualitative analysis of the themes which emerged from the focus group illustrated with representative quotes from participants. Stakeholder assessment workshops – Stakeholder assessment workshops are a process where a group of stakeholders are asked to assess the success or otherwise of a program. In order to do this they need to have a clear set of success criteria (see Easy Outcomes Step 4c: Identifying targets and success criteria).The idea is for the group as a whole to come to a consensus on the success of the program. Obviously the use of such a method depends on the politics of the context in which a program is operating and the chances of getting a group of stakeholders which is willing to make such a judgement, and which is capable of making such a judgement in an unbiased way. Analysis: Qualitative summary of what the workshop concluded.

DoView Creative Commons Copyright 2008 www.DoView.org
78
Expert assessment (e.g. clinical examination) – There is a wide range of different types of expert assessments which can be made in an evaluation. These could, for instance, be clinical examinations, psychological or educational assessments or any other expert professional assessment. Analysis: analysis can either be quantitative or qualitative. Case studies – Case studies are where there is a particular focus on one or more instances within an evaluation. These can be individuals, particular instances in which a program is being implemented or particular settings. Case studies typically use a more in-depth assessment of all aspects of the instance being studied. They are often used to complement measures which are being used in evaluations across a wider number of instances. Analysis: Qualitative or quantitative analysis can be used.

DoView Creative Commons Copyright 2008 www.DoView.org
79
Step 5. Identify possible economic evaluation
Easy Outcomes identifies ten possible types of economic evaluation. Not all of these are possible in all cases. In particular, impact/outcome evaluation which produces an effect-size estimate is needed for a number of these analyses. They also require that an estimate has been made of the cost of running the program. You may or may not want to use this list of ten types of economic analysis in your visual evaluation plan. Economic evaluation requires expertise in the area, if you do not have it, involve someone who does in this step of developing your visual evaluation plan.

DoView Creative Commons Copyright 2008 www.DoView.org
80
Economic analysis being undertaken
Here Easy Outcomes economic Analysis 1.3 Cost benefit analysis, set of arbitrary high level effect size estimates, single intervention is being used. It is based on the cost of running the program having been estimated and a cost-benefit analysis being undertaken using several arbitrary high-level effect size estimates. These are arbitrary in the sense that because an outcome evaluation has not been undertaken, there is no way of knowing the true effect size of this program in this instance. However it is useful for decision-makers to know the type of benefit which would be occurring for various assumed levels of effect from the program. The decision-maker then needs to make up their mind as to what they think is a reasonable effect size to assume. This means that the decision-maker is still having to make their decisions under conditions of uncertainty but has a better feel what the benefits could possibly be. Providing this type of hypothetical information and clearly indicating that the figures being used in arbitrary is a much clearer

DoView Creative Commons Copyright 2008 www.DoView.org
81
way of dealing with economic analysis than just putting in an effect size estimate and pretending that it has some validity when, in fact, the actual effect of the program is unknown because no outcome evaluation has been done.
Step 5. PROCESS
1. If you are not a specialist in economic evaluation, involve someone who is in this step. 2. Make a decision as to the type of economic evaluation that is feasible in this case.
Step 5. DOVIEW TIPS 1. Use the outcomes model to illustrate what type of economic evaluation you are undertaking by putting text objects (on an empty space on the slice (page) Right-click>Text). Resize the text to large if appropriate (select the text object with a Left-click>Right-click>Change size>Large.
2. If you are doing a number of types of economic evaluation, use more than one slice (page) to illustrate them. To make a slice (page) click on New Slice in the Slice (page) List.
Step 5. RESOURCE 1 List of 10 possible types of economic analysis
Easy Outcomes uses an exhaustive set of ten possible types of economic analysis (grouped into three groups of analyses). You may or may not want to use these in your visual evaluation plan. This list is used to establish exactly what economic evaluation is, and is not, possible for any intervention or set of interventions. Moving through the three overall groups of analyses, if a later analysis can be done, then by definition one of corresponding earlier analyses can also be done. So if you can do Analysis 3.2 you can also do 2.2, 2.1 and all of the Analyses 1.1-1.4. The analyses are grouped into three sets - those you can do when you do not have actual effect-size estimates for attributable outcomes above the intervention; those you can do when you have estimates for mid-level outcomes and those you can do if you have estimates for high-level attributable outcomes. In summary, you can only do the first grouping if you have estimated the cost of the intervention; for the second grouping you also need to have estimated mid-level outcome effect sizes by using one of the impact/outcomes evaluation designs in Step 5: Assess Possible Outcome Evaluation; for the third grouping you need to have estimated high-level outcome effect sizes by using one of the impact/outcome evaluation designs in Step 5: Assess Possible Outcome Evaluation.

DoView Creative Commons Copyright 2008 www.DoView.org
82
In addition, another important prerequisite of any type of cost benefit analysis (Analyses 1.3,1.4,2.3,2.4,3.3,3.4 below) is that a comprehensive outcomes model has been developed. The robustness of a cost benefit analysis depends on it providing a comprehensive measurement of all of the relevant costs and benefits associated with an intervention. It is easy to distort the results of a cost benefit analysis in any direction you wish by simply leaving out either the costs or the benefits of one or more important outcomes. In Easy Outcomes all cost benefit analyses should be mapped back onto an outcomes model. This lets the reader of such an analysis quickly overview what is, and what is not, included in the analysis and how this relates to the underlying outcomes model. It is not easy to assess the comprehensiveness of a cost benefit analysis without using this type of approach. The ten economic evaluation analyses grouped into three groups are: 1: No attributable outcomes above intervention Analysis 1.1 Cost of intervention analysis, single intervention. Cost of intervention analysis just looks at the cost of an intervention not its effectiveness (how much it costs to change an outcome by a certain amount) or the benefits (the result of subtracting the dollar cost of the program from the benefits of the program estimated in dollar terms). This analysis allows you to say what the estimated cost of the intervention is (e.g. $1,000 per participant). Analysis 1.2 Cost of intervention analysis, multi-intervention comparison. Same as 1.1 but a multi-intervention comparison. This analysis allows you to compare the costs of different interventions (e.g. Program 1 - $1,000 per participant; Program 2 - $1,500 per participant or to put it in terms of Program 2 costing 1 1/2 times more than Program 1 per participant. Analysis 1.3 Cost benefit analysis, set of arbitrary high level effect size estimates, single intervention. Even where you cannot establish any attributable outcomes above the intervention, but you do have an estimate of the cost of the intervention, you can just use some arbitrary (hypothetical) effect sizes. These can be used, if they can be estimated in dollar terms, to do a hypothetical cost benefit analysis (e.g. for a hypothetical effect size of 5%, 10% or 20%). It is essential that this type of hypothetical analysis is clearly distinguished from Analyses 3.3 which is based on estimates from actual measurement of effect sizes. This

DoView Creative Commons Copyright 2008 www.DoView.org
83
analysis allows you to estimate the overall benefit (or loss) of running the intervention if any of the hypothetical effect sizes were achieved (e.g. there would be a loss of $500 per participant for a 5% effect size, a gain of $100 for a 10% effect size and gain of $600 per participant for a 20% effect size). Analysis 1.4 Cost benefit analysis, set of arbitrary high-b level effect size estimates, multi-intervention comparison. Same as 1.3 but a multi-intervention comparison. This analysis allows you to compare the overall loss or gain from more than one program for various hypothetical effect sizes (e.g. for a 5% effect size, Program 1 would have an estimated loss of $500 per participant whereas Program 2 would have a gain of $200 and so on, you could even theoretically vary the arbitrary effect sizes if there was some reason to believe that there would be differences, e.g. a general population program is likely to have a lower effect size than an intensive one to one program, but this may not say anything about the overall loss or gain when comparing two such programs). It is essential that this type of hypothetical analysis is clearly distinguished from Analyses 3.4 which is based on estimates from actual measurement of effect sizes. 2: Attributable mid-level outcomes Analysis 2.1 Cost effectiveness analysis, attributable mid-level outcomes, single intervention. In this analysis, estimates are available of the attributable effect of the intervention on mid-level outcomes. When combined with the estimated cost of the intervention this allows you to work out the cost of achieving a certain level of effect on mid-level outcomes (e.g. a 6% increased in X cost approximately $1,000 per participant). Analysis 2.2 Cost effectiveness analysis, attributable mid-level outcomes, multi-intervention comparison. Same as 2.1 but a multi-intervention comparison. This analysis lets you work out the cost of achieving a certain level of effect on mid-level outcomes for a number of interventions (e.g. a 6% increase in X cost approximately $1,000 per participant for Program 1 whereas it cost $1,500 for Program 2). It is likely that the measured effect sizes of different interventions will vary, therefore you may need to adjust estimates to a common base. This may or may not reflect what would happen in regard to the actual programs in reality. 3: Attributable high-level outcomes

DoView Creative Commons Copyright 2008 www.DoView.org
84
Analysis 3.1 Cost effectiveness analysis, attributable high level outcomes, single intervention. Same as 2.1 except you can work out the cost of achieving a high level outcome effect size of a certain amount. Analysis 3.2 Cost effectiveness analysis, attributable high level outcomes, multi-intervention comparison. Same as 2.2 except you can work out the cost of achieving a high level outcome effect size of a certain amount and compare this across more than one intervention. Analysis 3.3 Cost benefit analysis, attributable high level outcomes, single intervention. In this analysis, figures are available for the cost of the intervention, its attributable effect on high level outcomes, and the costs and benefits of all outcomes can be reasonably accurately determined in dollar terms. If this information is not available this type of analysis cannot be done. This analysis lets you compare the overall loss or gain from running the program (e.g. the program cost $1,000 per participant and other negative impacts of the program are estimated at $1,000 while the benefits of the program are estimated at $2,500 per participant. Therefore there is an overall benefit of the program of $500 per participant.) Analysis 3.4 cost benefit analysis, attributable high level outcomes, multi-intervention comparison. Same as 3.3 but a multi-intervention comparison. This analysis lets you work out the overall cost or benefit for a number of programs compared (e.g. Progam 1 has an overall benefit of $500 whereas Program 2 has and overall benefit of only $200 per participant). [Note: This list of designs is still provisional within Systematic Outcomes Analysis. For instance, there could theoretically be a 'cost benefit analysis, set of arbitrary mid-level effect size estimates, single intervention or multi-intervention comparison', however it is not clear why anyone would do this rather than 1.3 or 1.4 which sets arbitrary high level effect sizes.

DoView Creative Commons Copyright 2008 www.DoView.org
85
Step 6. Deciding on piloting or full roll-out outcome/impact evaluation
Work out what approach you are going to take to the question of piloting or full roll-out outcome/impact evaluation. This is the overall way you are going to set up your evaluation. In thinking about this it is useful to distinguish between a pilot phase and a full program roll-out phase. In the Easy Outcomes approach you chose between three major overall evaluation schemes relating to piloting and full roll-out.
1. Outcome evaluation or no outcome evaluation of pilot (if there is a pilot); outcome evaluation on full roll-out.
2. Outcome evaluation of pilot; only monitoring that best practice from pilot is applied for full roll-out. 3. No outcome evaluation of pilot (if there is a pilot); no outcome evaluation of full roll-out.
In a large number of areas it is not appropriate, feasible or affordable to undertake an outcome evaluation of the full roll-out of a program. In some cases, where it is appropriate, feasible and affordable to do an outcome evaluation for a pilot, then this can be done and on full roll-out of the program best practice from the pilot is applied without there being an outcome evaluation for the full roll-out. This scheme is used in numerous situations where it is inappropriate, not feasible or too expensive to do outcome evaluation - for instance most of individual medical treatment uses this approach. Attributable indicators are monitored (e.g. patient attendance and sometimes treatment compliance) and best practice from the pilot is applied, but no attempt is made to actually establish that any improvement in the patient can actually be attributed to the treatment (as opposed to other factors like placebo or time).

DoView Creative Commons Copyright 2008 www.DoView.org
86
Options for piloting and full roll-out impact/outcome evaluation
Here the three options for outcome evaluation on piloting and full program roll-out are set out. In this case the third option – no outcome evaluation on pilot (because no pilot); no outcome evaluation on full roll-out (because not feasible) is the option being used. It is marked in green.
Step 6. PROCESS 1. Decide which of the three possible overall evaluation schemes you are going to use.
Step 6. DOVIEW TIPS 1. Copy the template slice (page) from the Easy Outcomes template file into the DoView file you are working on and select which of the three approaches is going to be adopted in the case of your

DoView Creative Commons Copyright 2008 www.DoView.org
87
program. Change the color of the boxes (select the box with a Left-click>Right-click>Change color.
DoView Creative Commons Copyright 2008 www.DoView.org
88
Step 7. Identify evaluation management issues
There are a number of evaluation management issues which need to be considered in undertaking an evaluation. These issues include:
1. Consultation with stakeholders on monitoring and evaluation 2. Evaluation management structure 3. Knowledge management for the evaluation 4. Risk management 5. Evaluation budget

DoView Creative Commons Copyright 2008 www.DoView.org
89
Evaluation management issues slice (page)
Here evaluation management issues have been set out. If needed take more than one slice (page) to set these out.
Step 7. PROCESS 1. Under each of the evaluation management issues used in Easy Outcomes (consultation with stakeholders, evaluation management structure, knowledge management, risk management and evaluation budget) set out how these will be dealt with in the evaluation. You may wish to amend this list to create your own list of evaluation management issues which could fill as many slices (pages) as you need.

DoView Creative Commons Copyright 2008 www.DoView.org
90
Step 7. DOVIEW TIPS 1. Use a text object (on an empty space on the slice (page) Right-click>Text) to put in the text about
the evaluation management issues. 2. If necessary use more than one slices to deal with these issues. 3. If you take more than one slice (page) to provide this information call each slice (page) – Evaluation
Management Issues [1]; Evaluation Management Issues [2]; Evaluation Management Issues [3] etc.

DoView Creative Commons Copyright 2008 www.DoView.org
91
Step 8. Use your model for reporting back
The final step in using a visual evaluation plan is using the visualized outcomes logic model in DoView to report back on progress which is being made. Identify strategic priorities when this step is being used within a strategic planning process. When doing this reporting back, in those cases where decisions are being made as to whether or not a program has been successful, the targets and success criteria developed in Step 3c: Identifying targets and success criteria would be relevant. Planning, monitoring and evaluation should occur in cycles where the information which has been found out through earlier waves of monitoring and evaluation is fed into program improvement within the next wave of strategic planning. The findings from previous monitoring and evaluation can be put into the record-table (see DoView Tips section below). When the model is dataprojected in a strategic planning meeting, the monitoring and evaluation results are immediately available for those in the room who are doing the planning. They can look at them at the time that they are considering which steps should be their priority focus in the next planning period. Reporting back on monitoring and evaluation in this way makes sure that the 'loop is closed' in the sense of evaluation findings being fed directly into further program development and strategic thinking. This, in turn, means that an organization can become a 'Learning Organization'. A 'Learning Organization' is one which has methods in place to make sure that whatever new information becomes available is fed directly into decision-making. In spite of all the talk about wanting organizations to be ‘Learning Organizations’ it is often very hard to make this happen in practice within an organization. Using visual evaluation plan in the way set out here can be an effective mechanism for making sure that it actually does occur.

DoView Creative Commons Copyright 2008 www.DoView.org
92
Reporting back findings regarding evaluation questions
Here the results of Evaluation Project 1: Appropriate Communication Channels for Consumers have been summarized and put into the record in the record-table associated with the relevant evaluation question (What is the best way to communicate product environmental information to consumers?). The results are being viewed in two ways here at the same time – you would not normally bother doing it two ways at a time. First, the editing box has been opened for the evaluation question (see the DoView Tips below for more information on this) and the summary of

DoView Creative Commons Copyright 2008 www.DoView.org
93
the results can be seen in the editing box. Secondly, the same details are shown in the record at the bottom of the screen associated with the evaluation question What is the best way to communicate product environmental information to consumers? When the evaluation question is selected (it has green boxes around it) the associated record in the record-table will be highlighted in blue in the record-table at the bottom of the screen.
Reporting back indicator results on an outcomes model

DoView Creative Commons Copyright 2008 www.DoView.org
94
Here progress is being reported back on the result in regard to indicators. In the case of one of the indicators ‘Consumer survey – peer pressure’ addition information is available in the record-table and this is being shown highlighted in blue because this indicator has been selected. This approach to reporting back indicators could be used when a provider is reporting back to a funder on whether it has met its contractual obligations in regard to indicators which it has been contracted to deliver on as discussed in the Tip below
Tip: Use the outcomes model when reporting back progress on a contract When reporting back on a contract, visual evaluation plan could be used in meetings to report back on progress. The provider could prepare the model and identify the issues they wanted discussed with the funder by marking them with a code in some way. It could include notations of progress on contracted indicators and more detailed notes in the record-table discussing variations from what was contracted. All this information would also be available in a dataprojected version of the model at all contract reporting meetings. When submitting a written report. If a PDF is prepared of the slice (page) in the screenshot above (see DoView Tips below) and the boxes for including the record-table (data-table) in the PDF are selected then there will be a section at the end of the PDF which lists all of the information about indicators. This PDF could be submitted as an appendix to a contract report or as a contract report. Alternatively, all of the indicators could be cloned onto a new slice (page) and the contents of the Notes field shown (see DoView Tips below for how to do this). Such a slice (page) is shown below. In this case the PDF would not need to contain the record-table information (data-table) and it could just consist of a series of slices (pages) and be submitted to the funder as the report on the contract.

DoView Creative Commons Copyright 2008 www.DoView.org
95
List of indicators and their notes field as part of a contract report back
Here the indicators from the previous slice (page) have been cloned (see DoView Tips below) onto a new slice (page) and the Notes field of any indicators that have notes in the record-table has been shown. Indicators which are contracted for have been listed separately from those which the provider is just measuring but is not contracted to change. Such a slice, if printed to PDF along with the other slices in a model can be submitted to a funder when reporting on a contract.
Step 8. PROCESS 1. Use the outcomes model to report back results for strategic planning and contracting meetings.

DoView Creative Commons Copyright 2008 www.DoView.org
96
Step 8. DOVIEW TIPS 1. The record table at the bottom of the screen can be used for reporting back results. There is a record associated with some of the objects in DoView (steps, indicators, evaluation questions, items).
2. Indicators have been cloned onto a new slice (page). Cloning means that they are ‘live copies’ which if updated in one instance of the clone (e.g. the name is changed, or the notes changed) they are updated in every instance of the clone in the model. To make a clone Left-click to select an indicator>Copy, go to the new slice (page) where you want to put the clone and on an empty space Right-click>Paste as clone.
3. The contents of the Notes field in the record-table have been shown for those indicators which have any content in this field. To show the Notes field, Left-click to select the indicator>Right-click>Show details>Notes.
4. The indicators on the slice (page) immediately above has been resized from the default indicator size of small to medium. To do this, Left-click to select the indicator>Right-click>Change size>Medium.
5. The headings ‘Not Contracted’ and ‘Contracted’ have been inserted on the slice (page). To do this Right-click on an empty space>Text.

DoView Creative Commons Copyright 2008 www.DoView.org
97
Appendix 1: The five ‘evidence cards’ available to prove a program ‘works’
This appendix sets out a simple framework which provides a good framework for thinking about steps and outcomes within an outcomes model and for thinking about the types of evidence which can be used to prove that a program ‘works’. These concepts are useful to quickly clarify some of the questions that stakeholders sometimes have when using the Easy Outcomes approach (http://www.easyoutcomes.org). For instance, sometimes stakeholders argue that the outcomes model should only include steps and outcomes which are measurable and/or attributable. The framework below sets out five features of steps or outcomes which enable a clear discussion about this and other questions which may arise. The five ‘evidence cards’ that can be used to prove that a program ‘works’. These are set out in the accompanying diagram and are as follows:
1. An outcomes model - setting out how you think your program is working - all of the important steps needed to achieve high-level outcomes.
2. Indicators - Not-necessarily attributable indicators showing general progress at meeting steps and
outcomes. These do not need to be attributable to (able to be proved that they are caused by) any one player.
3. Attributable indicators - Indicators which by simply being measured imply that a particular player
has caused them to occur. The measurements of outputs (the goods and services produced by a player) are attributable indicators.
4. Outcome evaluation - Ways of proving that a particular player has caused high-level outcomes to
occur.

DoView Creative Commons Copyright 2008 www.DoView.org
98
5. Non-high-level outcome evaluation - other types of evaluation which do not claim to measure high-
level outcomes, but which are used to improve the implementation of an outcomes model and examine its content and context (called formative and process evaluation).

DoView Creative Commons Copyright 2008 www.DoView.org
99
Appendix 2: Frequently Asked Questions from stakeholders working with Easy Outcomes
1. Why are unmeasurable and unattributable steps and outcomes allowed in an outcomes model? Outcomes models in the visual evaluation plan approach attempt to model the outside world, not just your project or the things that can be measured and attributed to your project. Therefore any type of step or outcome is allowed to be included in an outcomes model in the visual evaluation planning approach because limiting outcomes models to just measurable and attributable steps will often make them unusable for other steps in the visual evaluation plan approach. For instance if only measurable and attributable steps are allowed to be included, when it comes to the stage of mapping indicators onto the model to see how much of a model is currently being routinely measured, there will, by definition, not be any steps or outcomes which are not being currently measured. Measurement and attribution are important but they are dealt with later in the visual evaluation plan approach.
2. Does the visual evaluation plan approach have a bias toward quantitative outcomes studies by the inclusion of the list of seven outcomes attribution designs in Step 4c of the approach?
A claim that a piece of evaluation work has established an attributable improvement (or lack of improvement) in a high-level outcome within an outcomes model is different from a claim that a piece of formative or process evaluation aids implementation or documentation of the process. It is important that evaluation plans are transparent about such claims regarding attribution of outcomes so that stakeholders can know the type of information that any particular evaluation is claiming it is going to provide. Step 4c within the visual evaluation plan approach in which outcome/impact evaluation designs are assessed is included to allow evaluation planners to be clear about whether they are going to make such attributional claims in the course of doing the evaluation. Others who disagree for either practical or philosophical reasons about the wisdom or accuracy of such claims can deal with this issue within the visual evaluation planning approach by rejecting all of the outcome evaluation designs they consider inappropriate. The visual evaluation planning approach allows stakeholders to assess outcome evaluation designs on the basis of the assessment of their appropriateness, feasibility and affordability as set out in Step 4c within the visual evaluation planning approach. In addition, anyone developing a visual evaluation plan is at liberty to just leave out Step 4c if they do not think that it works for them or their stakeholders.

DoView Creative Commons Copyright 2008 www.DoView.org
100