Embed Size (px)
Citation preview
CO
MM
UN
ICATI
ON
174
www.MaterialsViews.comwww.advenergymat.de
Jaewon Lee, Neetu Chopra, Debasis Bera, Sergey Maslov, Sang-Hyun Eom, Ying Zheng, Paul Holloway, Jiangeng Xue, and Franky So*
Down-Conversion White Organic Light-Emitting Diodes Using Microcavity Structure
White organic light-emitting diodes (WOLEDs) are of impor-tance for fl at-panel display and solid-state lighting applications. Since the discovery of phosphorescent organic light-emitting diodes, there has been a steady progress inimprovement of OLED effi ciency and WOLEDs have become a serious candidate for general lighting applications. [ 1–9 ] In recent years, signifi cant progress has been made. Using a low index grid, white OLEDs with an effi ciency up to 68 lm/W have been reported. [ 10 ] More recently, using high-refractive-index substrates and a macrolens to extract substrate modes, white OLEDs with effi ciencies up to 90 lm/W have also been reported. [ 6 ] These results demonstrated the potential of OLEDs for general lighting applications.
There are several ways to fabricate OLEDs with light quality similar to that of a blackbody radiator. For lighting applica-tions, a key parameter describing the quality of light is the coloring rendering index (CRI). An incandescent light bulb is an ideal light source with a CRI close to 100 and a good quality light source requires a CRI value larger than 80. A common approach is to fabricate OLEDs with red, green, and blue emit-ters. [ 1–3 ] Another approach is to use down-conversion phosphors with blue-emitting OLEDs. Using the down-conversion phos-phors approach, part of the blue light emitted from an OLED is converted to yellow and red light, resulting in white light emission. This approach has been widely used in inorganic LEDs because of the availability of high effi ciency GaN-based blue LEDs. [ 11 ] Down-conversion OLEDs for white light genera-tion was fi rst demonstrated by Duggal et al. using blue polymer OLEDs. [ 12 ] The effi ciency was low because of the low effi ciency blue fl uorescent polymers used in the devices. Krummacher were the fi rst group to demonstrate down-conversion white OLEDs using a blue phosphorescent emitter, iridium(III) bis[(4,6-di-fl uorophenyl)-pyridinato-N,C2´] picolinate (FIrpic), and a maximum luminous effi ciency of 25 lm/W was demon-strated. [ 5 ] While it was an improvement over the fl uorescent devices, the white light effi ciency was still limited by the FIrpic OLED effi ciency. In the last few years, there has been signifi -cant progress made in the effi ciency of FIrpic-based OLEDs, and several groups have reported external quantum effi ciencies (EQEs) exceeding 20%. [ 13–17 ] With these high effi ciencies in
© 2011 WILEY-VCH Verlag Gmwileyonlinelibrary.com
DOI: 10.1002/aenm.201000014
Dr. J. Lee , Dr. N. Chopra , Dr. D. Bera , S. Maslov , Dr. S.-H. Eom , Dr. Y. Zheng , Prof. P. Holloway , Prof. J. Xue , Prof. F. So Department of Materials Science and EngineeringUniversity of FloridaGainesville, Florida 32611–6400, U.S.A. E-mail: [email protected] .edu
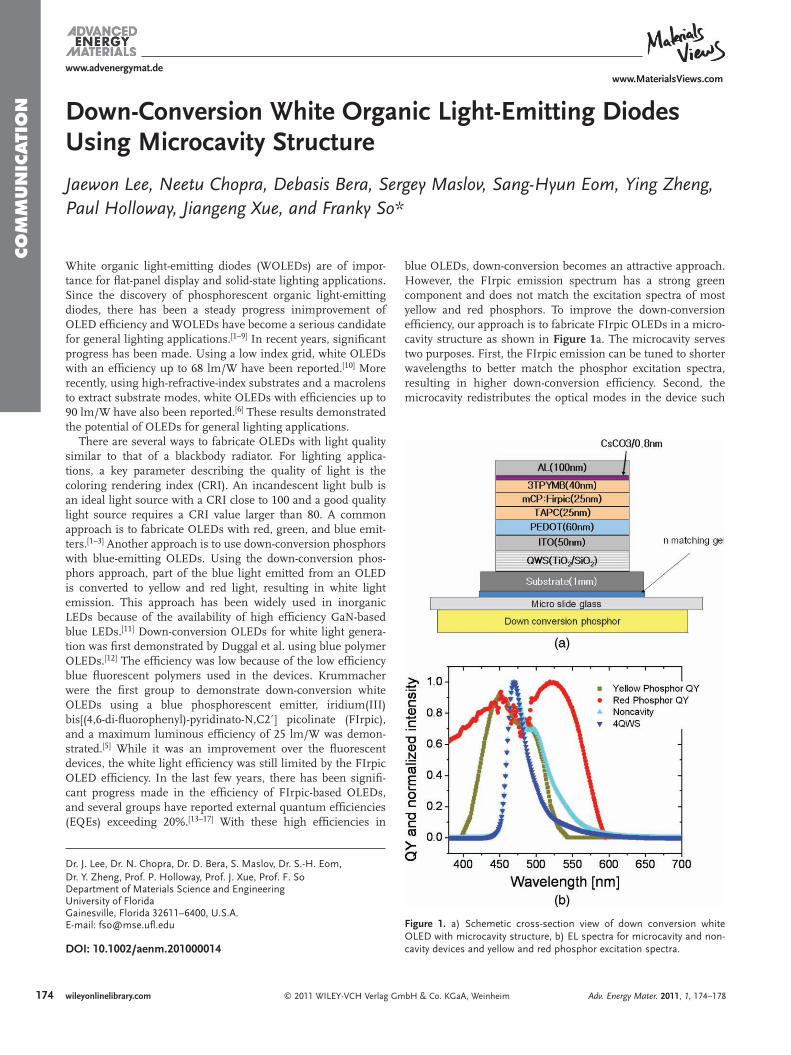
blue OLEDs, down-conversion becomes an attractive approach. However, the FIrpic emission spectrum has a strong green component and does not match the excitation spectra of most yellow and red phosphors. To improve the down-conversion effi ciency, our approach is to fabricate FIrpic OLEDs in a micro-cavity structure as shown in Figure 1 a. The microcavity serves two purposes. First, the FIrpic emission can be tuned to shorter wavelengths to better match the phosphor excitation spectra, resulting in higher down-conversion effi ciency. Second, the microcavity redistributes the optical modes in the device such
bH & Co. KGaA, Weinheim Adv. Energy Mater. 2011, 1, 174–178
Figure 1 . a) Schemetic cross-section view of down conversion white OLED with microcavity structure, b) EL spectra for microcavity and non-cavity devices and yellow and red phosphor excitation spectra.
CO
MM
UN
ICATIO
N
www.MaterialsViews.comwww.advenergymat.de
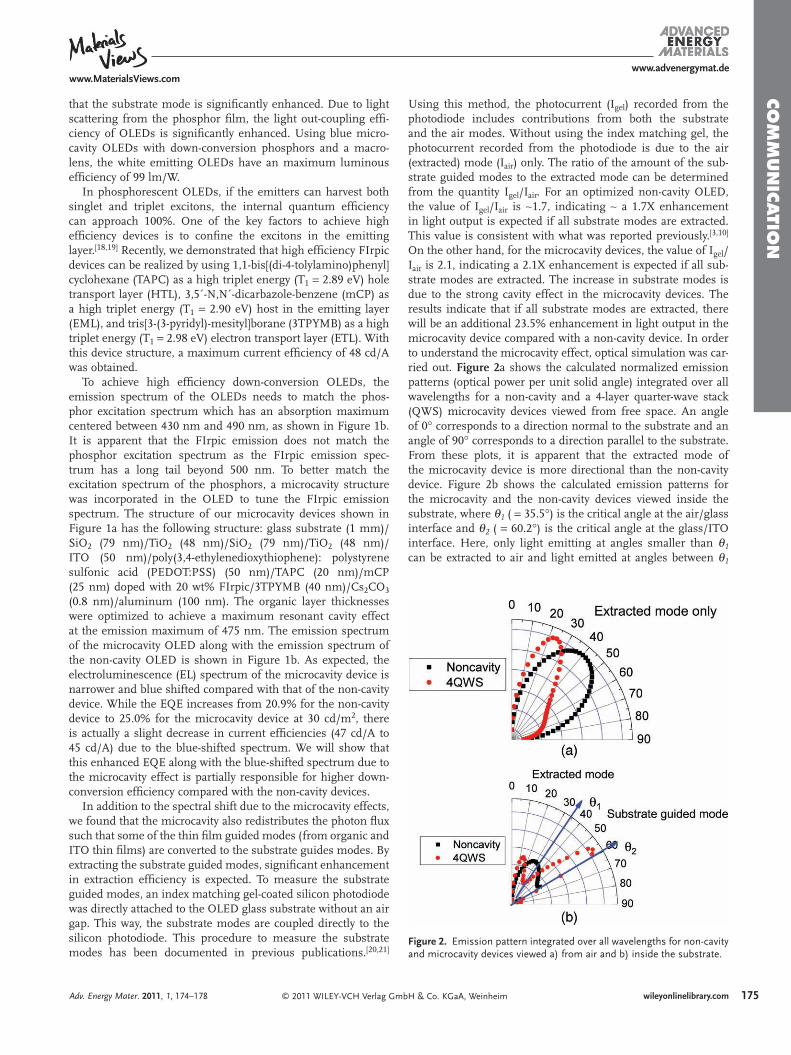
Figure 2 . Emission pattern integrated over all wavelengths for non-cavity and microcavity devices viewed a) from air and b) inside the substrate.
that the substrate mode is signifi cantly enhanced. Due to light scattering from the phosphor fi lm, the light out-coupling effi -ciency of OLEDs is signifi cantly enhanced. Using blue micro-cavity OLEDs with down-conversion phosphors and a macro-lens, the white emitting OLEDs have an maximum luminous effi ciency of 99 lm/W.
In phosphorescent OLEDs, if the emitters can harvest both singlet and triplet excitons, the internal quantum effi ciency can approach 100%. One of the key factors to achieve high effi ciency devices is to confi ne the excitons in the emitting layer. [ 18 , 19 ] Recently, we demonstrated that high effi ciency FIrpic devices can be realized by using 1,1-bis[(di-4-tolylamino)phenyl]cyclohexane (TAPC) as a high triplet energy (T 1 = 2.89 eV) hole transport layer (HTL), 3,5´-N,N´-dicarbazole-benzene (mCP) as a high triplet energy (T 1 = 2.90 eV) host in the emitting layer (EML), and tris[3-(3-pyridyl)-mesityl]borane (3TPYMB) as a high triplet energy (T 1 = 2.98 eV) electron transport layer (ETL). With this device structure, a maximum current effi ciency of 48 cd/A was obtained.
To achieve high effi ciency down-conversion OLEDs, the emission spectrum of the OLEDs needs to match the phos-phor excitation spectrum which has an absorption maximum centered between 430 nm and 490 nm, as shown in Figure 1 b. It is apparent that the FIrpic emission does not match the phosphor excitation spectrum as the FIrpic emission spec-trum has a long tail beyond 500 nm. To better match the excitation spectrum of the phosphors, a microcavity structure was incorporated in the OLED to tune the FIrpic emission spectrum. The structure of our microcavity devices shown in Figure 1 a has the following structure: glass substrate (1 mm)/SiO 2 (79 nm)/TiO 2 (48 nm)/SiO 2 (79 nm)/TiO 2 (48 nm)/ITO (50 nm)/poly(3,4-ethylenedioxythiophene): polystyrene sulfonic acid (PEDOT:PSS) (50 nm)/TAPC (20 nm)/mCP (25 nm) doped with 20 wt% FIrpic/3TPYMB (40 nm)/Cs 2 CO 3 (0.8 nm)/aluminum (100 nm). The organic layer thicknesses were optimized to achieve a maximum resonant cavity effect at the emission maximum of 475 nm. The emission spectrum of the microcavity OLED along with the emission spectrum of the non-cavity OLED is shown in Figure 1 b. As expected, the electroluminescence (EL) spectrum of the microcavity device is narrower and blue shifted compared with that of the non-cavity device. While the EQE increases from 20.9% for the non-cavity device to 25.0% for the microcavity device at 30 cd/m 2 , there is actually a slight decrease in current effi ciencies (47 cd/A to 45 cd/A) due to the blue-shifted spectrum. We will show that this enhanced EQE along with the blue-shifted spectrum due to the microcavity effect is partially responsible for higher down-conversion effi ciency compared with the non-cavity devices.
In addition to the spectral shift due to the microcavity effects, we found that the microcavity also redistributes the photon fl ux such that some of the thin fi lm guided modes (from organic and ITO thin fi lms) are converted to the substrate guides modes. By extracting the substrate guided modes, signifi cant enhancement in extraction effi ciency is expected. To measure the substrate guided modes, an index matching gel-coated silicon photodiode was directly attached to the OLED glass substrate without an air gap. This way, the substrate modes are coupled directly to the silicon photodiode. This procedure to measure the substrate modes has been documented in previous publications. [ 20 , 21 ]
© 2011 WILEY-VCH Verlag GmAdv. Energy Mater. 2011, 1, 174–178
Using this method, the photocurrent (I gel ) recorded from the photodiode includes contributions from both the substrate and the air modes. Without using the index matching gel, the photocurrent recorded from the photodiode is due to the air (extracted) mode (I air ) only. The ratio of the amount of the sub-strate guided modes to the extracted mode can be determined from the quantity I gel /I air . For an optimized non-cavity OLED, the value of I gel /I air is ∼ 1.7, indicating ∼ a 1.7X enhancement in light output is expected if all substrate modes are extracted. This value is consistent with what was reported previously. [ 3 , 10 ] On the other hand, for the microcavity devices, the value of I gel /I air is 2.1, indicating a 2.1X enhancement is expected if all sub-strate modes are extracted. The increase in substrate modes is due to the strong cavity effect in the microcavity devices. The results indicate that if all substrate modes are extracted, there will be an additional 23.5% enhancement in light output in the microcavity device compared with a non-cavity device. In order to understand the microcavity effect, optical simulation was car-ried out. Figure 2 a shows the calculated normalized emission patterns (optical power per unit solid angle) integrated over all wavelengths for a non-cavity and a 4-layer quarter-wave stack (QWS) microcavity devices viewed from free space. An angle of 0 ° corresponds to a direction normal to the substrate and an angle of 90 ° corresponds to a direction parallel to the substrate. From these plots, it is apparent that the extracted mode of the microcavity device is more directional than the non-cavity device. Figure 2 b shows the calculated emission patterns for the microcavity and the non-cavity devices viewed inside the substrate, where θ 1 ( = 35.5 ° ) is the critical angle at the air/glass interface and θ 2 ( = 60.2 ° ) is the critical angle at the glass/ITO interface. Here, only light emitting at angles smaller than θ 1 can be extracted to air and light emitted at angles between θ 1
bH & Co. KGaA, Weinheim 175wileyonlinelibrary.com
CO
MM
UN
ICATI
ON
176
www.MaterialsViews.comwww.advenergymat.de
Table 1. Luminous power effi ciencies (lm/W) and CRI for non-cavity and 4QWS microcavity OLED with YR180 phosphor fi lm.
lm/W
Device 30 cd/m 2 100 cd/m 2 1000 cd/m 2 CRI
Non-cavity 38 38 21
Non-cavity + phosphors 42 32 16 80
4QWS 41 34 19 –
4QWS + phosphors 68 57 30 83
4QWS + phosphors +
Macrolens
99 87 47 83
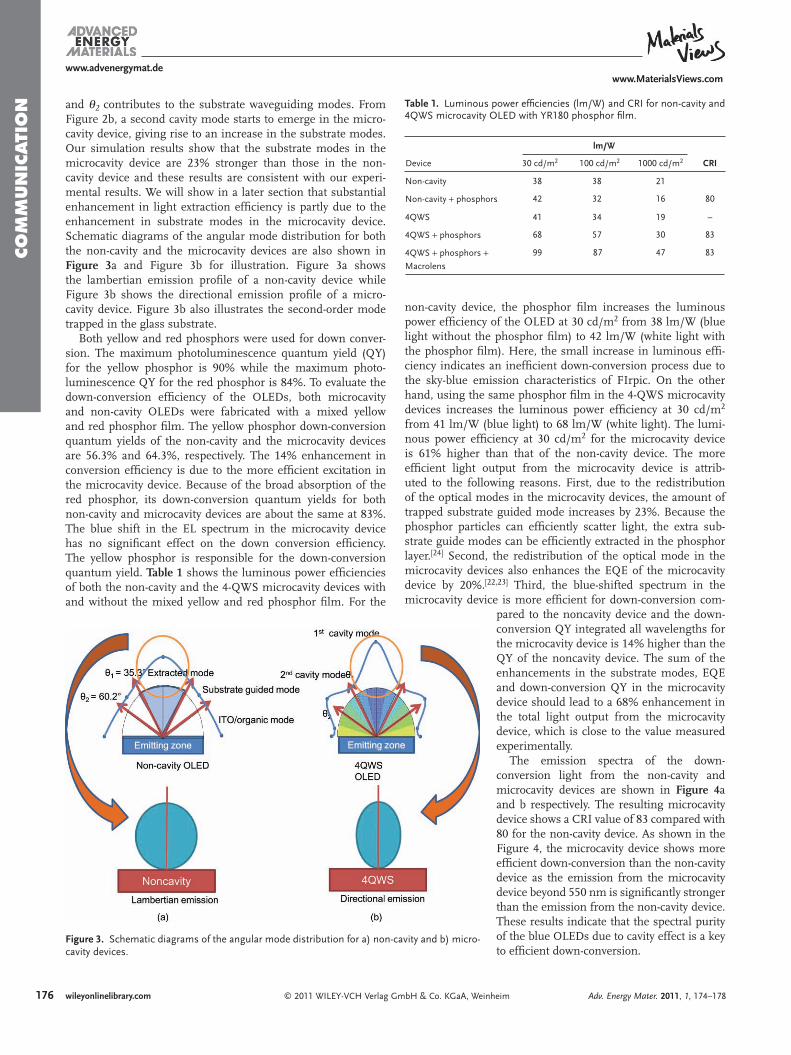
and θ 2 contributes to the substrate waveguiding modes. From Figure 2 b, a second cavity mode starts to emerge in the micro-cavity device, giving rise to an increase in the substrate modes. Our simulation results show that the substrate modes in the microcavity device are 23% stronger than those in the non-cavity device and these results are consistent with our experi-mental results. We will show in a later section that substantial enhancement in light extraction effi ciency is partly due to the enhancement in substrate modes in the microcavity device. Schematic diagrams of the angular mode distribution for both the non-cavity and the microcavity devices are also shown in Figure 3 a and Figure 3 b for illustration. Figure 3 a shows the lambertian emission profi le of a non-cavity device while Figure 3 b shows the directional emission profi le of a micro-cavity device. Figure 3 b also illustrates the second-order mode trapped in the glass substrate.
Both yellow and red phosphors were used for down conver-sion. The maximum photoluminescence quantum yield (QY) for the yellow phosphor is 90% while the maximum photo-luminescence QY for the red phosphor is 84%. To evaluate the down-conversion effi ciency of the OLEDs, both microcavity and non-cavity OLEDs were fabricated with a mixed yellow and red phosphor fi lm. The yellow phosphor down-conversion quantum yields of the non-cavity and the microcavity devices are 56.3% and 64.3%, respectively. The 14% enhancement in conversion effi ciency is due to the more effi cient excitation in the microcavity device. Because of the broad absorption of the red phosphor, its down-conversion quantum yields for both non-cavity and microcavity devices are about the same at 83%. The blue shift in the EL spectrum in the microcavity device has no signifi cant effect on the down conversion effi ciency. The yellow phosphor is responsible for the down-conversion quantum yield. Table 1 shows the luminous power effi ciencies of both the non-cavity and the 4-QWS microcavity devices with and without the mixed yellow and red phosphor fi lm. For the
© 2011 WILEY-VCH Verlag Gmwileyonlinelibrary.com
Figure 3. Schematic diagrams of the angular mode distribution for a) non-cacavity devices.
non-cavity device, the phosphor fi lm increases the luminous power effi ciency of the OLED at 30 cd/m 2 from 38 lm/W (blue light without the phosphor fi lm) to 42 lm/W (white light with the phosphor fi lm). Here, the small increase in luminous effi -ciency indicates an ineffi cient down-conversion process due to the sky-blue emission characteristics of FIrpic. On the other hand, using the same phosphor fi lm in the 4-QWS microcavity devices increases the luminous power effi ciency at 30 cd/m 2 from 41 lm/W (blue light) to 68 lm/W (white light). The lumi-nous power effi ciency at 30 cd/m 2 for the microcavity device is 61% higher than that of the non-cavity device. The more effi cient light output from the microcavity device is attrib-uted to the following reasons. First, due to the redistribution of the optical modes in the microcavity devices, the amount of trapped substrate guided mode increases by 23%. Because the phosphor particles can effi ciently scatter light, the extra sub-strate guide modes can be effi ciently extracted in the phosphor layer. [ 24 ] Second, the redistribution of the optical mode in the microcavity devices also enhances the EQE of the microcavity device by 20%. [ 22 , 23 ] Third, the blue-shifted spectrum in the microcavity device is more effi cient for down-conversion com-
bH & Co. KGaA, Weinh
vity and b) micro-
pared to the noncavity device and the down-conversion QY integrated all wavelengths for the microcavity device is 14% higher than the QY of the noncavity device. The sum of the enhancements in the substrate modes, EQE and down-conversion QY in the microcavity device should lead to a 68% enhancement in the total light output from the microcavity device, which is close to the value measured experimentally.
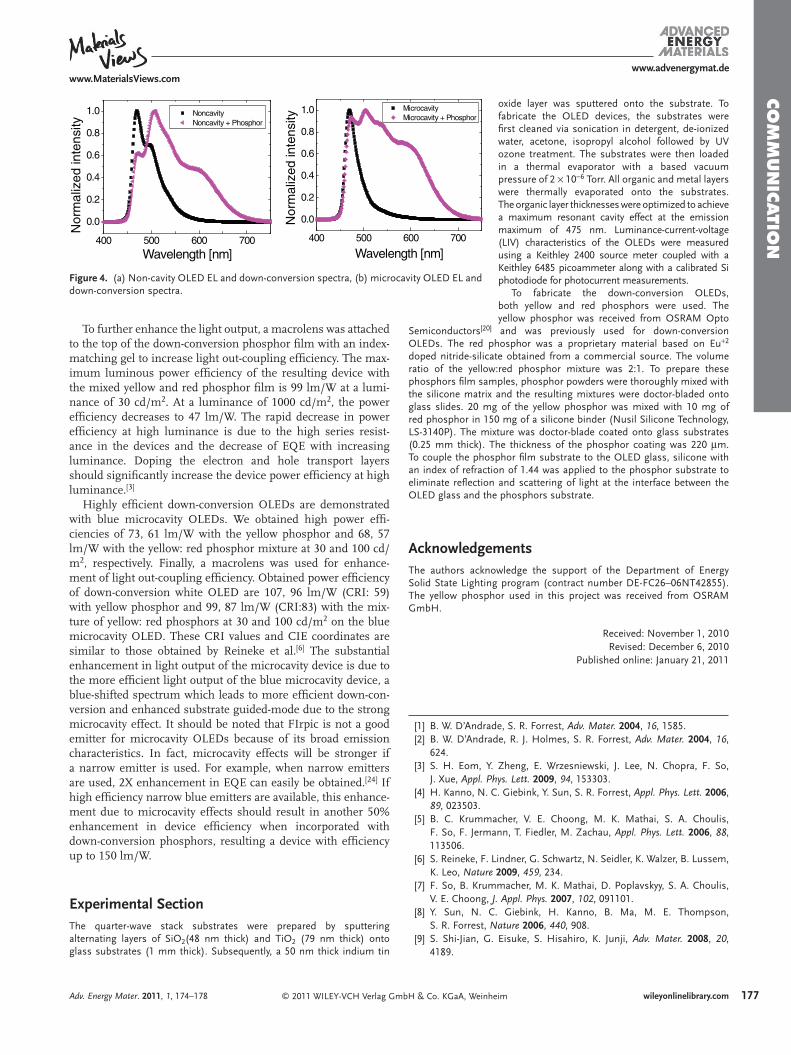
The emission spectra of the down-conversion light from the non-cavity and microcavity devices are shown in Figure 4 a and b respectively. The resulting microcavity device shows a CRI value of 83 compared with 80 for the non-cavity device. As shown in the Figure 4 , the microcavity device shows more effi cient down-conversion than the non-cavity device as the emission from the microcavity device beyond 550 nm is signifi cantly stronger than the emission from the non-cavity device. These results indicate that the spectral purity of the blue OLEDs due to cavity effect is a key to effi cient down-conversion.
eim Adv. Energy Mater. 2011, 1, 174–178
CO
MM
UN
ICATIO
N
www.MaterialsViews.comwww.advenergymat.de
Figure 4 . (a) Non-cavity OLED EL and down-conversion spectra, (b) microcavity OLED EL and down-conversion spectra.
0.4
0.6
0.8
1.0 Noncavity Noncavity + Phosphor
ized
inte
nsity
0.4
0.6
0.8
1.0 Microcavity Microcavity + Phosphor
aliz
ed in
tens
ity
400 500 600 700
0.0
0.2
Nor
mal
Wavelength [nm]400 500 600 700
0.0
0.2
Nor
ma
Wavelength [nm]
To further enhance the light output, a macrolens was attached to the top of the down-conversion phosphor fi lm with an index-matching gel to increase light out-coupling effi ciency. The max-imum luminous power effi ciency of the resulting device with the mixed yellow and red phosphor fi lm is 99 lm/W at a lumi-nance of 30 cd/m 2 . At a luminance of 1000 cd/m 2 , the power effi ciency decreases to 47 lm/W. The rapid decrease in power effi ciency at high luminance is due to the high series resist-ance in the devices and the decrease of EQE with increasing luminance. Doping the electron and hole transport layers should signifi cantly increase the device power effi ciency at high luminance. [ 3 ]
Highly effi cient down-conversion OLEDs are demonstrated with blue microcavity OLEDs. We obtained high power effi -ciencies of 73, 61 lm/W with the yellow phosphor and 68, 57 lm/W with the yellow: red phosphor mixture at 30 and 100 cd/m 2 , respectively. Finally, a macrolens was used for enhance-ment of light out-coupling effi ciency. Obtained power effi ciency of down-conversion white OLED are 107, 96 lm/W (CRI: 59) with yellow phosphor and 99, 87 lm/W (CRI:83) with the mix-ture of yellow: red phosphors at 30 and 100 cd/m 2 on the blue microcavity OLED. These CRI values and CIE coordinates are similar to those obtained by Reineke et al. [ 6 ] The substantial enhancement in light output of the microcavity device is due to the more effi cient light output of the blue microcavity device, a blue-shifted spectrum which leads to more effi cient down-con-version and enhanced substrate guided-mode due to the strong microcavity effect. It should be noted that FIrpic is not a good emitter for microcavity OLEDs because of its broad emission characteristics. In fact, microcavity effects will be stronger if a narrow emitter is used. For example, when narrow emitters are used, 2X enhancement in EQE can easily be obtained. [ 24 ] If high effi ciency narrow blue emitters are available, this enhance-ment due to microcavity effects should result in another 50% enhancement in device effi ciency when incorporated with down-conversion phosphors, resulting a device with effi ciency up to 150 lm/W.
Experimental Section The quarter-wave stack substrates were prepared by sputtering alternating layers of SiO 2 (48 nm thick) and TiO 2 (79 nm thick) onto glass substrates (1 mm thick). Subsequently, a 50 nm thick indium tin
© 2011 WILEY-VCH Verlag GmbH & Co. KGaA, WeinhAdv. Energy Mater. 2011, 1, 174–178
oxide layer was sputtered onto the substrate. To fabricate the OLED devices, the substrates were fi rst cleaned via sonication in detergent, de-ionized water, acetone, isopropyl alcohol followed by UV ozone treatment. The substrates were then loaded in a thermal evaporator with a based vacuum pressure of 2 × 10 − 6 Torr. All organic and metal layers were thermally evaporated onto the substrates. The organic layer thicknesses were optimized to achieve a maximum resonant cavity effect at the emission maximum of 475 nm. Luminance-current-voltage (LIV) characteristics of the OLEDs were measured using a Keithley 2400 source meter coupled with a Keithley 6485 picoammeter along with a calibrated Si photodiode for photocurrent measurements.
To fabricate the down-conversion OLEDs, both yellow and red phosphors were used. The yellow phosphor was received from OSRAM Opto
Semiconductors [ 20 ] and was previously used for down-conversion OLEDs. The red phosphor was a proprietary material based on Eu + 2 doped nitride-silicate obtained from a commercial source. The volume ratio of the yellow:red phosphor mixture was 2:1. To prepare these phosphors fi lm samples, phosphor powders were thoroughly mixed with the silicone matrix and the resulting mixtures were doctor-bladed onto glass slides. 20 mg of the yellow phosphor was mixed with 10 mg of red phosphor in 150 mg of a silicone binder (Nusil Silicone Technology, LS-3140P). The mixture was doctor-blade coated onto glass substrates (0.25 mm thick). The thickness of the phosphor coating was 220 μ m. To couple the phosphor fi lm substrate to the OLED glass, silicone with an index of refraction of 1.44 was applied to the phosphor substrate to eliminate refl ection and scattering of light at the interface between the OLED glass and the phosphors substrate.
Acknowledgements The authors acknowledge the support of the Department of Energy Solid State Lighting program (contract number DE-FC26–06NT42855). The yellow phosphor used in this project was received from OSRAM GmbH.
Received: November 1, 2010 Revised: December 6, 2010
Published online: January 21, 2011
[ 1 ] B. W. D’Andrade , S. R. Forrest , Adv. Mater. 2004 , 16 , 1585 . [ 2 ] B. W. D’Andrade , R. J. Holmes , S. R. Forrest , Adv. Mater. 2004 , 16 ,
624 . [ 3 ] S. H. Eom , Y. Zheng , E. Wrzesniewski , J. Lee , N. Chopra , F. So ,
J. Xue , Appl. Phys. Lett. 2009 , 94 , 153303 . [ 4 ] H. Kanno , N. C. Giebink , Y. Sun , S. R. Forrest , Appl. Phys. Lett. 2006 ,
89 , 023503 . [ 5 ] B. C. Krummacher , V. E. Choong , M. K. Mathai , S. A. Choulis ,
F. So , F. Jermann , T. Fiedler , M. Zachau , Appl. Phys. Lett. 2006 , 88 , 113506 .
[ 6 ] S. Reineke , F. Lindner , G. Schwartz , N. Seidler , K. Walzer , B. Lussem , K. Leo , Nature 2009 , 459 , 234 .
[ 7 ] F. So , B. Krummacher , M. K. Mathai , D. Poplavskyy , S. A. Choulis , V. E. Choong , J. Appl. Phys. 2007 , 102 , 091101 .
[ 8 ] Y. Sun , N. C. Giebink , H. Kanno , B. Ma , M. E. Thompson , S. R. Forrest , Nature 2006 , 440 , 908 .
[ 9 ] S. Shi-Jian , G. Eisuke , S. Hisahiro , K. Junji , Adv. Mater. 2008 , 20 , 4189 .
eim 177wileyonlinelibrary.com
CO
MM
UN
ICATI
ON
178
www.MaterialsViews.comwww.advenergymat.de
[ 10 ] Y. Sun , S. R. Forrest , J. Appl. Phys. 2006 , 100 , 073106 . [ 11 ] P. Schlotter , R. Schmidt , J. Schneider , Appl. Phys. A 1997 , 64 , 417 . [ 12 ] A. R. Duggal , J. J. Shiang , C. M. Heller , D. F. Foust , Appl. Phys. Lett.
2002 , 80 , 3470 . [ 13 ] N. Chopra , J. Lee , Y. Zheng , S.-H. Eom , J. Xue , F. So , Appl. Phys.
Lett. 2008 , 93 , 143307 . [ 14 ] R. J. Holmes , S. R. Forrest , Y. J. Tung , R. C. Kwong , J. J. Brown ,
S. Garon , M. E. Thompson , Appl. Phys. Lett. 2003 , 82 , 2422 . [ 15 ] J. Kido , I. Nobuhiro , L. Yanjun , Y. Agata , H. Shimizu , “Applica-
tion of Electron-transporting Wide Energy Gap Material for Organic Electroluminescent Devices” , Lasers and Electro-Optics/CLEO Pacifi c Rim 2005. http://ieeexplore.ieee.org/xpl/mostRecentIssue.jsp?punumber = 10492 (accessed January 2011).
[ 16 ] N. Chopra , J. Lee , Y. Zheng , S.-H. Eom , J. Xue , F. So , ACS Appl. Mater. & Inter. 2009 , 1 , 1169 .
© 2011 WILEY-VCH Verlag Gwileyonlinelibrary.com
[ 17 ] N. Chopra , J. Lee , J. Xue , F. So , IEEE Transaction Electron. Dev. 2009 , 57 , 101 .
[ 18 ] G. He , M. Pfeiffer , K. Leo , M. Hofmann , J. Birnstock , R. Pudzich , J. Salbeck , Appl. Phys. Lett. 2004 , 85 , 3911 .
[ 19 ] K. Goushi , R. Kwong , J. J. Brown , H. Sasabe , C. Adachi , J. Appl. Phys. 2004 , 95 , 7798 .
[ 20 ] B. C. Krummacher , M. K. Mathai , V. Choong , S. A. Choulis , F. So , A. Winnacker , J. Appl. Phys. 2006 , 100 , 054702 .
[ 21 ] J. Lee , N. Chopra , F. So , Appl. Phys. Lett. 2008 , 92 , 033303 . [ 22 ] J. J. Shiang , T. J. Faircloth , A. R. Duggal , J. Appl. Phys. 2004 , 95 ,
2889 . [ 23 ] M. Agrawal , Y. Sun , S. R. Forrest , P. Peumans , Appl. Phys. Lett. 2007 ,
90 , 241112 . [ 24 ] R. H. Jordan , A. Dodabalapur , R. E. Slusher , Appl. Phys. Lett. 1996 ,
69 , 1997 .
mbH & Co. KGaA, Weinheim Adv. Energy Mater. 2011, 1, 174–178