Embed Size (px)
Citation preview

Down, P.M. (2016) Optimising decision making in mastitis control. PhD thesis, University of Nottingham.
Access from the University of Nottingham repository: http://eprints.nottingham.ac.uk/33913/1/PhDThesis_PeterDown_10.06.2016.pdf
Copyright and reuse:
The Nottingham ePrints service makes this work by researchers of the University of Nottingham available open access under the following conditions.
This article is made available under the University of Nottingham End User licence and may be reused according to the conditions of the licence. For more details see: http://eprints.nottingham.ac.uk/end_user_agreement.pdf
For more information, please contact [email protected]

Optimising Decision Making in Mastitis Control
Peter M. Down BVSc DipECBHM MRCVS
Thesis submitted to the University of Nottingham for
the degree of Doctor of Philosophy
January 2016
2
Abstract
Mastitis remains one of the most common diseases of dairy cows and
represents a large economic loss to the industry as well as a considerable
welfare issue to the cows affected. Decisions are routinely made about the
treatment and control of mastitis despite evidence being sparse regarding
the likely consequences in terms of clinical efficacy and return on
investment. The aim of this thesis was to enhance decision making around
the treatment and prevention of mastitis using probabilistic methods.
In Chapter 2 and Chapter 3, decision making around the treatment of
clinical mastitis was explored using probabilistic sensitivity analysis. The
results from Chapter 2 identified transmission to be the most influential
parameter affecting the cost of clinical mastitis at cow level and,
therefore, highlighted how important the prevention of transmission was
in order to minimise losses associated with clinical mastitis. The cost-
effectiveness of an on-farm culture (OFC) approach to the treatment of
clinical mastitis was explored in Chapter 3, and compared with the cost-
effectiveness of a ‘standard’ approach commonly used in the UK. The
results of this study identified that the OFC approach could be cost-
effective in some circumstances but this was highly dependent on the
proportion of Gram-negative infections and the reduction in
bacteriological cure rate that may occur as a result of the delay before
treatment. Therefore, in the UK, this approach is unlikely to be cost
beneficial in the majority of dairy herds.
3
In Chapters 4, 5 and 6, decision making around the control of mastitis was
explored utilising data from UK dairy herds that had participated in a
nationwide mastitis control plan. In Chapter 4, mastitis control
interventions were identified that were not currently practised by a large
proportion of herds, and the frequency at which they were made a
priority by the plan deliverers was also reported. In Chapter 5 and
Chapter 6, the cost-effectiveness of specific mastitis control interventions
was explored within an integrated Bayesian cost-effectiveness framework
from herds with a predominance of environmental intramammary
infections. Results from the Bayesian microsimulations identified that a
variety of interventions would be cost effective in different farm
circumstances. The cost-effectiveness of different interventions has been
incorporated in a decision support tool to assist optimal decision making
by veterinary practitioners in the field.
4
Publications
Chapter 2
Down, P. M., Green, M. J., Hudson, C. D. 2013. Rate of transmission: A
major determinant of the cost of clinical mastitis. J. Dairy Sci. 96, 6301-
6314
Chapter 3
Down, P. M., Bradley, A. J., Breen, J. E., Green, M. J. Factors affecting the
cost-effectiveness of an on-farm culture approach for the treatment of
clinical mastitis in dairy cows. Submitted to J. Dairy Sci. 2016
Chapter 4
Down, P. M., Bradley, A. J., Breen, J. E., Hudson, C. D., Green, M. J. 2016.
Current management practices and interventions prioritised as part of a
nationwide mastitis control plan. Vet. Record. 178:449
Chapter 5
Down, P. M., Bradley, Breen, J. E., A. J., Browne, W. J., Kypraios, T., Green,
M. J. A Bayesian micro-simulation to evaluate the cost-effectiveness of
interventions for mastitis control during the dry period in UK dairy herds.
Submitted to Prev. Vet. Med. 2016

5
Acknowledgements
The last 4 years have been both challenging and rewarding in equal
measure and there are many people that have helped me along the way
that I would like to thank.
Firstly, I would like to thank my primary supervisor, Professor Martin
Green for all of the time, patience, encouragement and limitless
enthusiasm that you have shown to me during this project and for making
this whole experience such an overwhelmingly positive one. This was all
your fault! And I will be forever grateful for your help in making this
happen.
I would also like to thank my secondary supervisors, Dr Andrew Bradley,
Professor Bill Browne and Dr Theo Kypraios, for your help and support at
different times throughout this PhD.
A huge thanks also to Dr James Breen, for your help with technical issues
with farm data and your ability to persuade vets to provide herd data
when I had failed to and to Dr Chris Hudson, for your database skills and
awesome macros.
This PhD was part funded by AHDB Dairy and I am extremely grateful for
all of the encouragement and support that they have given to me over the
years especially Dr Jenny Gibbons and Dr Ray Keatinge.
This project would not have been possible without the kind assistance of
the many vets and consultants who shared their data with me. You are too
many to name but you know who you are and I will happily buy any of
you a beer by way of recompense to make up for the months of nagging
that you have all suffered over the last few years!
Thank you to my friends and family for all of the love, prayers and
support that you have given me during this PhD and for helping me to
laugh during the difficult days.
Finally, a special thankyou to Shelley, Isaac and James, for your endless
love, support and encouragement and for the many sacrifices that you
have made to make this possible.

6
Contents
Chapter 1 Introduction ............................................................................................ 16
Background ...................................................................................................... 16 1.1
The importance of mastitis in dairy cows ................................... 16 1.1.1
Mastitis pathogens ................................................................................ 18 1.1.2
Historical perspective in the UK ...................................................... 20 1.1.3
Current UK Situation ............................................................................ 21 1.1.4
Measuring mastitis ............................................................................... 22 1.1.5
Mastitis Control .............................................................................................. 30 1.2
Risk factors associated with clinical mastitis ............................. 30 1.2.1
Risk factors associated with somatic cell count ........................ 33 1.2.2
Implications of study design ............................................................. 34 1.2.3
The Agriculture and Horticulture Development Board Dairy 1.2.4
Mastitis Control Plan ............................................................................................ 36
Statistical methods used in this thesis ................................................... 38 1.3
Bayesian approach ................................................................................ 39 1.3.1
Probabilistic sensitivity analysis ..................................................... 41 1.3.2
Integrated approach and micro-simulation ................................ 44 1.3.3
Markov Chain Monte Carlo for parameter estimation ............ 45 1.3.4
Aims of the thesis ........................................................................................... 47 1.4
Summary ................................................................................................... 47 1.4.1
Overview of Chapters .......................................................................... 47 1.4.2
Chapter 2 Transmission and the cost of clinical mastitis ........................... 50
Introduction ..................................................................................................... 50 2.1
Materials and Methods ................................................................................ 52 2.2
Model Structure ..................................................................................... 52 2.2.1
Model input parameters ..................................................................... 60 2.2.2
Model Simulation .................................................................................. 62 2.2.3
Data analysis ........................................................................................... 63 2.2.4
Results ................................................................................................................ 64 2.3
Data analysis ........................................................................................... 64 2.3.1
Scenarios ................................................................................................... 65 2.3.2
7
Discussion ......................................................................................................... 70 2.4
Conclusions ...................................................................................................... 78 2.5
Chapter 3 The cost-effectiveness of an on-farm culture approach
compared with a standard approach for the treatment of clinical mastitis
in dairy cows ..................................................................................................................... 79
Introduction ..................................................................................................... 79 3.1
Materials and methods ................................................................................ 80 3.2
Model structure ...................................................................................... 80 3.2.1
Model input parameters ..................................................................... 82 3.2.2
On-farm culture specific input parameters ................................. 82 3.2.3
Model simulation ................................................................................... 85 3.2.4
Data analysis ........................................................................................... 85 3.2.5
Results ................................................................................................................ 87 3.3
Data analysis ........................................................................................... 87 3.3.1
Scenario and sensitivity analysis .................................................... 88 3.3.2
Discussion ......................................................................................................... 91 3.4
Conclusions ...................................................................................................... 96 3.5
Chapter 4 Current management practices and interventions prioritised
as part of a nationwide mastitis control plan ....................................................... 98
Introduction ..................................................................................................... 98 4.1
Materials and methods ................................................................................ 99 4.2
AHDB Dairy Mastitis Control Plan (DMCP) ................................. 99 4.2.1
Farm selection ..................................................................................... 100 4.2.2
Data collection ..................................................................................... 100 4.2.3
Data analysis ........................................................................................ 100 4.2.4
Results ............................................................................................................. 102 4.3
Mastitis parameters .......................................................................... 103 4.3.1
Herd Management Practices .......................................................... 105 4.3.2
Discussion ...................................................................................................... 108 4.4
EDP herds .............................................................................................. 108 4.4.1
EL herds ................................................................................................. 111 4.4.2
CDP/CL herds ...................................................................................... 112 4.4.3
Conclusions ................................................................................................... 116 4.5

8
Chapter 5 A Bayesian micro-simulation to evaluate the cost-
effectiveness of specific interventions for mastitis control during the dry
period …………………………………………………………………………………….117
Introduction .................................................................................................. 117 5.1
Materials and methods ............................................................................. 119 5.2
Data collection ..................................................................................... 119 5.2.1
Data analysis ........................................................................................ 120 5.2.2
Somatic cell count micro-simulation model ............................ 128 5.2.3
Results ............................................................................................................. 129 5.3
Herd parameters ................................................................................ 129 5.3.1
Interventions........................................................................................ 129 5.3.2
Micro-simulation models ................................................................ 130 5.3.3
Discussion ...................................................................................................... 137 5.4
Conclusions ................................................................................................... 142 5.5
Chapter 6 A Bayesian micro-simulation to evaluate the cost-
effectiveness of specific interventions for mastitis control during lactation
…………………………………………………………………………………….143
Introduction .................................................................................................. 143 6.1
Materials and methods ............................................................................. 144 6.2
Data collection ..................................................................................... 144 6.2.1
Data analysis ........................................................................................ 145 6.2.2
Results ............................................................................................................. 149 6.3
Herd parameters ................................................................................ 149 6.3.1
Interventions........................................................................................ 149 6.3.2
Micro-simulation models ................................................................ 150 6.3.3
Discussion ...................................................................................................... 156 6.4
Conclusions ................................................................................................... 163 6.5
Chapter 7 Discussion and Conclusions ........................................................... 164
Discussion ...................................................................................................... 164 7.1
Treatment of clinical mastitis ........................................................ 164 7.1.1
Mastitis control ................................................................................... 169 7.1.2
Potential future work ....................................................................... 173 7.1.3
Conclusions ................................................................................................... 175 7.2
Chapter 2 ............................................................................................... 175 7.2.1
9
Chapter 3 ............................................................................................... 176 7.2.2
Chapter 4 ............................................................................................... 176 7.2.3
Chapter 5 ............................................................................................... 177 7.2.4
Chapter 6 ............................................................................................... 177 7.2.5
Overall .................................................................................................... 177 7.2.6
References ....................................................................................................................... 179
Appendices ...................................................................................................................... 214
Appendix 1 ................................................................................................................. 214
Example of the WinBUGS code for the cost of clinical mastitis model
from Chapter 2. .................................................................................................... 214
Appendix 2 ................................................................................................................. 254
Example of WinBUGS code for cost-effectiveness model from Chapter
5 ................................................................................................................................. 254
Appendix 3 ................................................................................................................. 256
EDP Interventions investigated in Chapter 5 ........................................... 256
Appendix 4 ................................................................................................................. 264
EL Interventions investigated in Chapter 6 .............................................. 264

10
Figures
Figure 1-1 UK average bulk milk somatic cell count over time. .................... 21
Figure 1-2 Cases of clinical mastitis of dry-period origin plotted over time.
................................................................................................................................................ 24
Figure 1-3 Cases of clinical mastitis of lactation origin plotted over time 24
Figure 1-4 Dry period new infection rate over time. ......................................... 27
Figure 1-5 Dry period cure rate over time ............................................................ 27
Figure 1-6 Lactation new infection rate over time ............................................. 28
Figure 1-7 Percentage of cows infected and chronically infected over time
................................................................................................................................................ 29
Figure 1-8 Apparent cure rates over time. ............................................................ 29
Figure 2-1 Schematic representation of the treatment model. ..................... 57
Figure 2-2 Bar charts depicting the proportion of variance in the total cost
of clinical mastitis accounted for by each variable for each of the
treatment protocols ........................................................................................................ 67
Figure 2-3 Series of scatterplots demonstrating the relationship between
the predictor variable and the total cost of clinical mastitis (CM) for
treatment 1 (3 days intramammary antibiotic). ................................................. 69
Figure 2-4 Tornado plot to demonstrate the predicted effect of a given
change in one of the predictor variables on the total cost of clinical
mastitis when all of the others remain constant. ................................................ 70
Figure 3-1 Difference in cost between standard and OFC protocol (all
scenarios). .......................................................................................................................... 89
Figure 3-2 Difference in cost between standard and OFC protocol (SD)... 89
11
Figure 3-3 Difference in cost between standard and OFC protocol (MD). 90
Figure 3-4 Difference in cost between standard and OFC protocol (LD). . 91
Figure 4-1 Geographical location of herds in the study ................................ 102
Figure 5-1 Overview of the 1-step micro-simulation procedure using the
clinical mastitis micro-simulation model as an example. ............................. 122
Figure 5-2 Distribution of the outcome variable for the clinical mastitis
regression model. ......................................................................................................... 124
Figure 5-3 Distribution of the outcome variable for the somatic cell count
regression model. ......................................................................................................... 125
Figure 5-4 Probabilistic cost-effectiveness curve for use of individual
calving pens. ................................................................................................................... 132
Figure 5-5 Probabilistic cost-effectiveness curve for removing dung from
dry-cow cubicles at least twice daily. ................................................................... 132
Figure 5-6 Probabilistic cost-effectiveness curve for removing calves
within 24hrs of birth. .................................................................................................. 133
Figure 5-7 Probabilistic cost-effectiveness curve for checking all quarters
within 24hrs of calving. .............................................................................................. 133
Figure 5-8 Scatterplot of observed and predicted values of the percentage
change in CMDP............................................................................................................. 134
Figure 5-9 Scatterplot of observed and predicted values of the percentage
change in DPNIR. .......................................................................................................... 134
Figure 6-1 Distribution of the outcome variable for the clinical mastitis
regression model. ......................................................................................................... 147
Figure 6-2 Distribution of the outcome variable for the somatic cell count
regression model. ......................................................................................................... 147

12
Figure 6-3 Scatterplot of observed and predicted values of the percentage
change in the incidence rate of clinical mastitis after the first 30 days of
lactation (CMLP). .......................................................................................................... 153
Figure 6-4 Scatterplot of the observed and predicted values of the
monthly rate of LNIR. .................................................................................................. 153
Figure 6-5 Probabilistic cost-effectiveness curve for keeping a closed
herd. ................................................................................................................................... 154
Figure 6-6 Probabilistic cost-effectiveness curve for having good fly
control for all lactating cows and heifers. ........................................................... 155
Figure 6-7 Probabilistic cost-effectiveness curve for using an NSAID when
treating Grade 3 clinical mastitis cases. ............................................................... 155
Figure 6-8 Probabilistic cost-effectiveness curve for having a bedded lying
area of 1.25m2/1000L of milk/cow. ...................................................................... 156
13
Tables
Table 2-1 Probability distributions specific to the 5 defined clinical
mastitis antimicrobial treatment protocols .......................................................... 54
Table 2-2 Probability distributions applicable to all 5 antimicrobial
clinical mastitis (CM) treatment protocols ............................................................ 58
Table 2-3 Spearman rank correlation coefficients measuring the statistical
dependence between the specified variable and the total cost of clinical
mastitis estimated in the complete model. ............................................................ 66
Table 2-4 Breakdown of average (median) costs (£) associated with a case
of clinical mastitis (CM) for each treatment protocol (2.5th and 97.5th
percentiles given in parenthesis). ............................................................................. 68
Table 3-1 Probability distributions applicable to both treatment protocols
................................................................................................................................................ 84
Table 3-2 On-farm culture specific model input parameters ......................... 86
Table 3-3 Spearman rank correlation coefficients for on-farm specific
model input parameters ............................................................................................... 88
Table 4-1 Mastitis parameter definitions ........................................................... 101
Table 4-2 General performance parameters and mastitis indices. Range of
12 month averages given (lowest-highest) with median value in
parenthesis ..................................................................................................................... 104
Table 4-3 Proportion of herds practising each intervention at the time of
the study .......................................................................................................................... 106

14
Table 5-1 Probability of saving at least £1000 after 12 months at different
incidence rates of clinical mastitis in the first 30 days after calving
(CMDP) and different costs of implementing the intervention. ................. 135
Table 5-2 Probability of saving at least £1000 after 12 months at different
rates of DPNIR and different costs of implementing the intervention. ... 136
Table 6-1 Probability of saving at least £1000 after 12 months at different
incidence rates of clinical mastitis after the first 30 days of lactation
(CMLP) and different costs of implementing the intervention. .................. 151
Table 6-2 Probability of saving at least £1000 after 12 months at different
starting rates of LNIR and different costs of implementing the
intervention. ................................................................................................................... 152

15
Abbreviations
CM Clinical mastitis
SCC Somatic cell count
BMSCC Bulk milk somatic cell count
IRCM Incidence rate of clinical mastitis
CMDP Clinical mastitis of dry-period origin
CMLP Clinical mastitis of lactation origin
DPNIR Dry-period acquired new intramammary infection
LNIR Lactation acquired new intramammary infection
DPCR Dry-period cure rate
DMCP AHDB Dairy Mastitis Control Plan
EDP Environmental dry-period
EL Environmental lactation
CDP Contagious dry-period
CL Contagious lactation
RCT Randomised controlled trial
PSA Probabilistic sensitivity analysis
MCMC Markov chain Monte Carlo
IMI Intramammary infection
ml Millilitres
DCT Dry cow therapy
hr Hour

16
Chapter 1
Introduction
Background 1.1
The importance of mastitis in dairy cows 1.1.1
Bovine mastitis can be defined as ‘inflammation of the mammary gland’
and can have either an infectious or non-infectious aetiology (Bradley,
2002). Bovine mastitis can be classified as being either clinical (CM),
whereby gross changes are seen in the milk, or subclinical if no such
changes are visible but changes in the secretion are present, such as an
increase in somatic cell count (SCC). Mastitis is the most costly infectious
disease affecting dairy cattle, accounting for 38% of the total direct costs
of the common production diseases (Huijps et al., 2008; Kossaibati and
Esslemont, 1997). A conservative estimate for the total cost of CM to the
UK dairy industry alone is in excess of £168 million annually (Bradley,
2002). The cost of subclinical mastitis to the industry is harder to quantify
as it is more variable and includes more hidden costs such as reduced
yield, increased risk of culling and increased risk of clinical mastitis.
However, a Dutch study found that the majority (55%) of the total cost of
mastitis is caused by subclinical infections (Huijps et al., 2008).
Whilst the economic consequences of mastitis are reasonably well
defined, the same is not true with respect to the impact that mastitis has
on the welfare of the affected cows. There is, however, an increasing
awareness within the industry of this aspect of the disease (Fitzpatrick et
17
al., 1998; Huxley and Whay, 2007; Leslie and Petersson-Wolfe, 2012) and
a general acceptance of welfare guidelines such as the five freedoms
(Farm Animal Welfare Council Press Statement, 1979) and advice given by
the Farm Animal Welfare Council (Farm Animal Welfare Council, 2009)
and European Food Safety Authority (Algers et al., 2009). One of the ‘five
freedoms’ is “Freedom from Pain, Injury and Disease” and therefore, it is
incumbent on all those working with dairy cows to be aware of the
potential impact that mastitis has on the health and well-being of the
dairy cow population.
Other factors which have been shown to motivate farmers to improve
mastitis management include job satisfaction, external recognition from
peers and improved milk quality (Valeeva et al., 2007). In addition to
these incentives for reducing mastitis in dairy cows, there is also
increasing pressure on the industry to reduce the use of antimicrobial
drugs in food-producing animals because of possible implications for
human health through the emergence of antibiotic-resistant strains of
bacteria (White and McDermott, 2001). This pressure has led to the
banning of some antimicrobial drugs from use in food producing animals
in certain countries already (Page, 1991) and has prompted a widespread
call for governments to implement stricter controls on the use of ‘high
risk’ antimicrobial drugs such as 3rd and 4th generation cephalosporins
and fluoroquinolones (EFSA, 2011). Given that the treatment of mastitis
accounts for the majority of the total antimicrobial drug usage on most
dairy farms (Pol and Ruegg, 2007), this represents a further compelling
18
reason for striving to reduce mastitis in dairy cows and to consider
carefully how we apply the use of antimicrobial drugs in the treatment
and control of mastitis.
Mastitis pathogens 1.1.2
Most cases of mastitis occur in response to a bacterial infection of the
mammary gland, but other agents that are known to cause mastitis in
dairy cows include mycoplasmas, yeasts and algae. More than 130
different pathogens have been associated with bovine mastitis (Watts,
1988). The vast majority of mastitis in the UK is of bacterial origin with
just four species (Escherichia coli, Streptococcus uberis, Staphylococcus
aureus and Streptococcus dysgalactiae) accounting for over 70% of all
diagnoses made (Anon, 2009).
Mastitis pathogens have historically been classified as either ‘contagious’
or ‘environmental’ (Blowey and Edmondson, 2010). Contagious bacteria
commonly exist within the mammary gland and are transmitted from
cow to cow during the milking process (Radostits et al., 1994). They are
associated with persistent infections which are reflected by a raised SCC.
The bacteria most likely to behave in a contagious manner include
Staphylococcus aureus, Streptococcus dysgalactiae and Streptococcus
agalactiae. Environmental bacteria are not adapted to survive in the host
but are opportunistic invaders from the cow’s environment. These are
generally acquired between milkings, multiply, instigate an immune
response and are rapidly dealt with by the immune system resulting in a
transient increase in SCC. The bacteria most likely to infect cows via the

19
environment include the Enterobacteriacae and Streptococcus uberis. The
distinction between contagious and environmental pathogens is not clear
cut and there appears to be some overlap of transmission behaviour
within pathogen species. This has been highlighted by studies that have
demonstrated persistent infections with both Strep. uberis (Todhunter et
al., 1995; Zadoks et al., 2003) and E. coli (Bradley and Green, 2001a;
Döpfer et al., 1999; Hill and Shears, 1979; Lam et al., 1996b) in addition to
studies that have shown that E. coli is quite capable of causing recurrent
infections (Bradley and Green, 2001a; Lam et al., 1996b). It is not
possible, therefore, to definitively categorise a mastitis pathogen as being
contagious or environmental based on bacteriology alone and any
bacteriology results should be interpreted in light of the mastitis
epidemiology for a given farm (Green, 2012).
Mastitis pathogens have also historically been classified as either ‘major’
or ‘minor’ pathogens based on the inflammatory response that they
engender and their propensity to cause clinical signs. The ‘major’
pathogens comprise Staph. aureus, Strep. dysgalactiae, Strep. agalactiae,
Strep. uberis and the Enterobacteriacae. The ‘minor’ pathogens comprise
the Corynebacterium spp. and the coagulase-negative Staphylococcus spp
(CNS). The ‘minor’ pathogens are generally associated with mild immune
responses and rarely with clinical signs, however, as discussed
previously, this classification is often considered to be too simplistic as
some strains of Staph. aureus are coagulase negative and could, therefore,
be classed as ‘minor’ pathogens which they are not (Green, 2012).

20
Historical perspective in the UK 1.1.3
In the 1940’s, the average herd size in the UK was approximately 15 cows
(Bradley, 2002) and the average bulk milk somatic cell count (BMSCC)
was approximately 750,000 cells/ml (Booth, 1997). This situation
changed considerably in the 1960’s with the introduction of the 5-point
plan which was devised from research at the National Institute for
Research in Dairying in Reading (Kingwill et al., 1970; Neave et al., 1969,
1966; Smith et al., 1967). The plan consisted of the rapid identification
and treatment of clinical mastitis, the routine application of antibiotic dry
cow therapy at drying off, post-milking teat disinfection, the culling of
chronically infected cows and the routine maintenance of the milking
machine. This was further compounded by the implementation of EC Milk
Hygiene Directive (92/46) that stipulated an upper BMSCC of 400,000
cells/ml for milk destined for human consumption and the addition of
financial bonuses offered to producers via the milk buyers for the
production of milk with lower SCC. The result of the 5-point plan and the
EC milk hygiene directive was a rapid reduction in BMSCC from over
600,000 cells/ml in 1967 to just over 400,000 cells/ml in 1982 (Booth,
1997) and a reduction in the incidence of CM from over 150 cases/100
cows/year to around 40 cases/100 cows/year over the same period of
time (Wilesmith et al., 1986; Wilson and Kingwill, 1975). The main driver
behind the success of the 5-point plan appeared to be in reducing Gram-
positive infections caused by contagious pathogens, the prevalence of
which has reduced dramatically since the 1960’s. A study by Wilson and
Kingwill. (1975) showed that contagious pathogens accounted for almost

21
60% of clinical mastitis cases in 1967 whereas Bradley et al. (2007b)
showed that they accounted for just 10% by 2005.
Current UK Situation 1.1.4
With respect to the current situation in the UK, the average herd size is
currently 133 cows (AHDB Dairy, 2014) and the most recent study
suggested that the incidence rate of clinical mastitis was likely to be
between 47 and 65 cases per 100 cows per year (Bradley et al., 2007b).
This is higher than many previous estimates (Berry, 1998; Milne et al.,
2002; Peeler et al., 2000, 2002), but in line with several others (Bradley
and Green, 2001b; Kossaibati et al., 1998; Wilesmith et al., 1986). All of
these studies have the potential of introducing selection bias as a result of
farmers having to volunteer to participate in the surveys.
The average BMSCC is currently around 167,000 cells/ml, and this has
reduced each year since 2009 (DairyCo, 2015), which corresponds with
the time that the national mastitis control plan was launched in the UK
(Figure 1-1).
Figure 1-1 UK average bulk milk somatic cell count over time. (DairyCo, 2015)

22
The aetiology of clinical mastitis in the UK, taken from the study by
Bradley et al. (2007b), suggests that pathogens traditionally classified as
‘environmental’ now predominate, accounting for around 60% of positive
samples, with Strep. uberis being the most common pathogen. In contrast,
pathogens traditionally classified as ‘contagious’ accounted for around
13% of diagnoses made. This finding is in broad agreement with previous
studies (Bradley and Green, 2001b; Milne et al., 2002; Wilesmith et al.,
1986) that all show that ‘environmental’ pathogens are the main cause of
clinical mastitis in most UK dairy herds.
Measuring mastitis 1.1.5
The primary measures of mastitis in dairy cows are the incidence rate of
clinical mastitis (IRCM), which is typically reported in cases/100
cows/year, and somatic cell count, which is typically reported in cells/ml.
Clinical mastitis
The conventional approach to CM analysis has been focused on the
reporting of basic quarter and cow rates and incidences as well as certain
ratios, such as the case-to-cow-case ratio (total number of quarter-
cases/number of cow-cases) (Bradley et al., 2008a). Whilst the absolute
rates and ratios give some indication as to the extent and likely aetiology
of mastitis on a particular dairy farm, they are less informative when it
comes to the targeting of mastitis control interventions and, for this, a
different approach is required. One such approach is to categorise CM by
its putative origin based on the temporal occurrence during the lactation
cycle in which it presents, with cases that occur in early lactation
23
attributed to the dry period (Bradley et al., 2008b). This approach stems
from studies that demonstrated that intramammary infections may be
acquired from the environment during the dry period (Berry and
Hillerton, 2002; Bradley and Green, 2001c; Eberhart and Buckalew, 1977;
Oliver and Mitchell, 1983; Smith et al., 1985; Todhunter et al., 1991;
Williamson et al., 1995), and that these infections are able to persist in the
udder and cause CM in the subsequent lactation (Green et al., 2002;
McDonald and Anderson, 1981). In the study by Green et al. (2002), it was
demonstrated that over 50% of all environmental mastitis occurring in
the first 100 days of lactation resulted from infections acquired during the
dry period. A subsequent study demonstrated that much of the peak in
clinical mastitis seen in early lactation can be attributed to dry period
infections, particularly cases occurring in the first month of lactation
(Green et al., 2002). Therefore, the incidence rate of clinical mastitis in the
first 30 days of lactation can be a useful proxy for the rate of dry-period
origin infections (Bradley et al., 2008b), and this novel approach has been
demonstrated as being helpful in the targeting of mastitis interventions at
herd level (Green et al., 2007b).
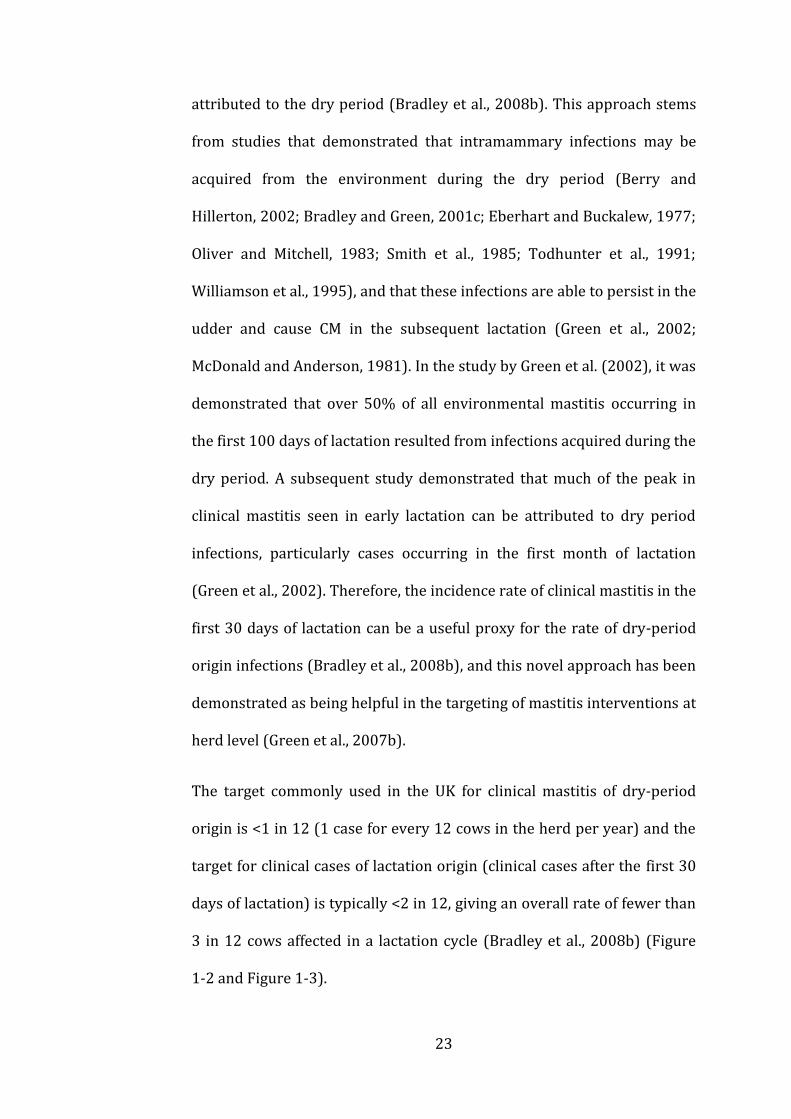
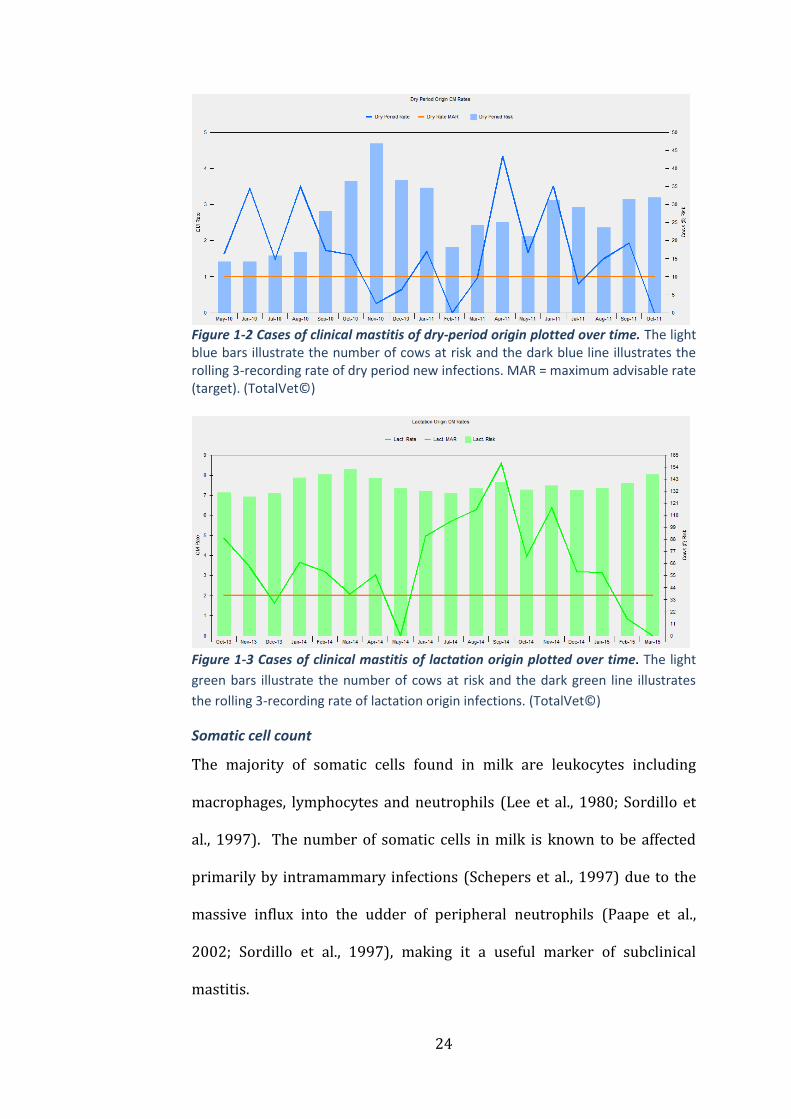
The target commonly used in the UK for clinical mastitis of dry-period
origin is <1 in 12 (1 case for every 12 cows in the herd per year) and the
target for clinical cases of lactation origin (clinical cases after the first 30
days of lactation) is typically <2 in 12, giving an overall rate of fewer than
3 in 12 cows affected in a lactation cycle (Bradley et al., 2008b) (Figure
1-2 and Figure 1-3).
24
Figure 1-2 Cases of clinical mastitis of dry-period origin plotted over time. The light blue bars illustrate the number of cows at risk and the dark blue line illustrates the rolling 3-recording rate of dry period new infections. MAR = maximum advisable rate (target). (TotalVet©)
Figure 1-3 Cases of clinical mastitis of lactation origin plotted over time. The light
green bars illustrate the number of cows at risk and the dark green line illustrates
the rolling 3-recording rate of lactation origin infections. (TotalVet©)
Somatic cell count
The majority of somatic cells found in milk are leukocytes including
macrophages, lymphocytes and neutrophils (Lee et al., 1980; Sordillo et
al., 1997). The number of somatic cells in milk is known to be affected
primarily by intramammary infections (Schepers et al., 1997) due to the
massive influx into the udder of peripheral neutrophils (Paape et al.,
2002; Sordillo et al., 1997), making it a useful marker of subclinical
mastitis.
25
Cow level SCC data is relatively easy to collect and readily available in
most milk recorded herds, compared with CM data, and the
concentrations of somatic cells are used to categorise individual cows as
‘infected’ or ‘uninfected’ according to defined thresholds. An SCC of <
100,000 cells/ml is generally accepted to indicate the absence of infection
(Sordillo et al., 1997), whereas a SCC > 200,000 cells/ml is indicative of a
bacterial infection (Brolund, 1985; Schepers et al., 1997). The widely
accepted threshold above which cows are considered to be ‘infected’ is
200,000 cells/ml although test sensitivity is reduced at this threshold in
herds with a high prevalence of ‘minor’ pathogens (Dohoo and Leslie,
1991). Therefore, most standard approaches to measuring subclinical
mastitis in dairy herds focus on the movements of cows above and below
this threshold. Historically, SCC analysis typically comprised the
proportion of cows above 200,000 cells/ml, the proportion of the herd
chronically infected (> 200,000 cells/ml for 2 or more consecutive
recordings) and the bulk milk somatic cell count (SCC of composite milk
sample from all milking cows). With advances in computer software, it is
possible to perform an in-depth and robust SCC analysis whereby specific
SCC indices are used to characterise the mastitis epidemiology for a
particular dairy farm. Commonly reported SCC parameters now include
the lactation new infection rate (LNIR) which is a measure of the
proportion of cows moving from a SCC < 200,000 cells/ml, to a SCC >
200,000 cells/ml each month, dry period new infection rate (DPNIR)
which is a monthly measure of the proportion of cows that have a SCC >
200,000 cells/ml at the first milk recording after calving that had a SCC <
26
200,000 cells/ml at the last milk recording before being dried-off and dry
period cure rate which is a monthly measure of the proportion of cows
that had a SCC < 200,000 cells/ml at the first milk recording after calving
that had a SCC > 200,000 cells/ml at the last milk recording before being
dried-off (Bradley et al., 2007a).
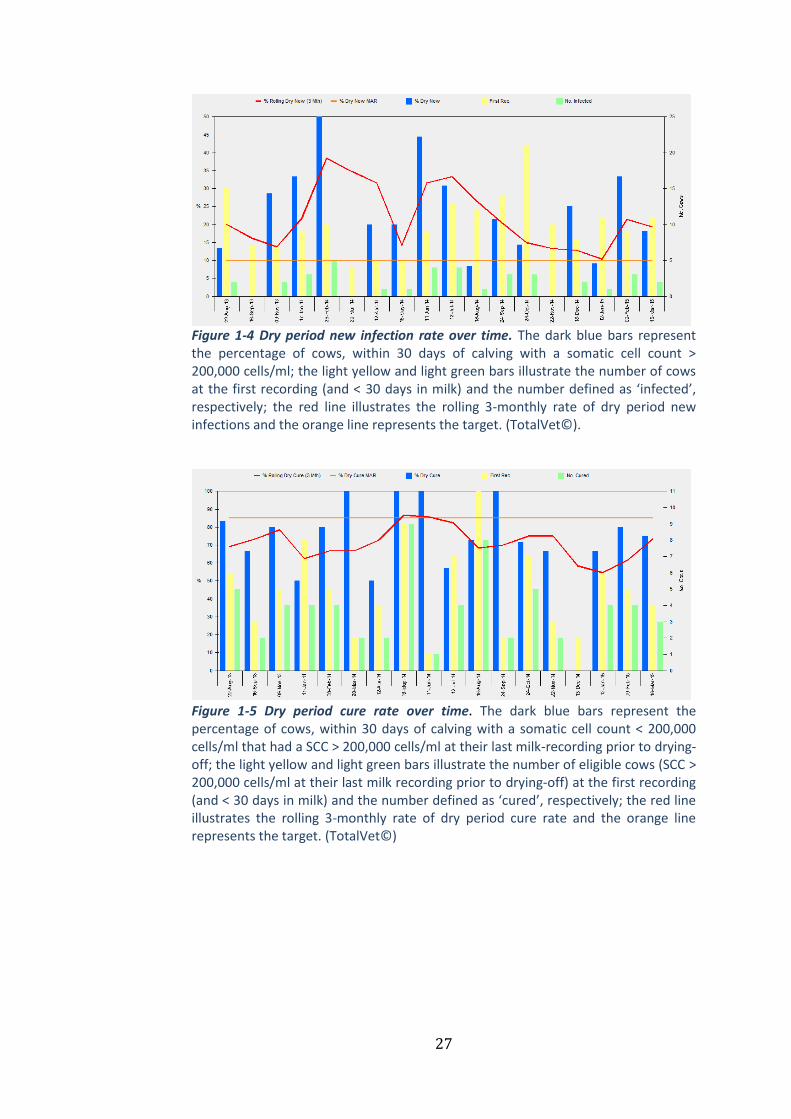
As with CM data, the relative importance of the dry-period may also be
reflected in somatic cell count trends such as the dry-period new infection
rate and the dry-period cure rate. Common targets for these are
<10%/month and >85%/month respectively, however, the dry period
cure rate tends to decrease as the rate of dry period new infection rate
increases, as a result of reinfection of previously high SCC quarters that
had cured earlier during the dry-period, and this needs to be factored into
the interpretation of dry-period data (Figure 1-4 and Figure 1-5).
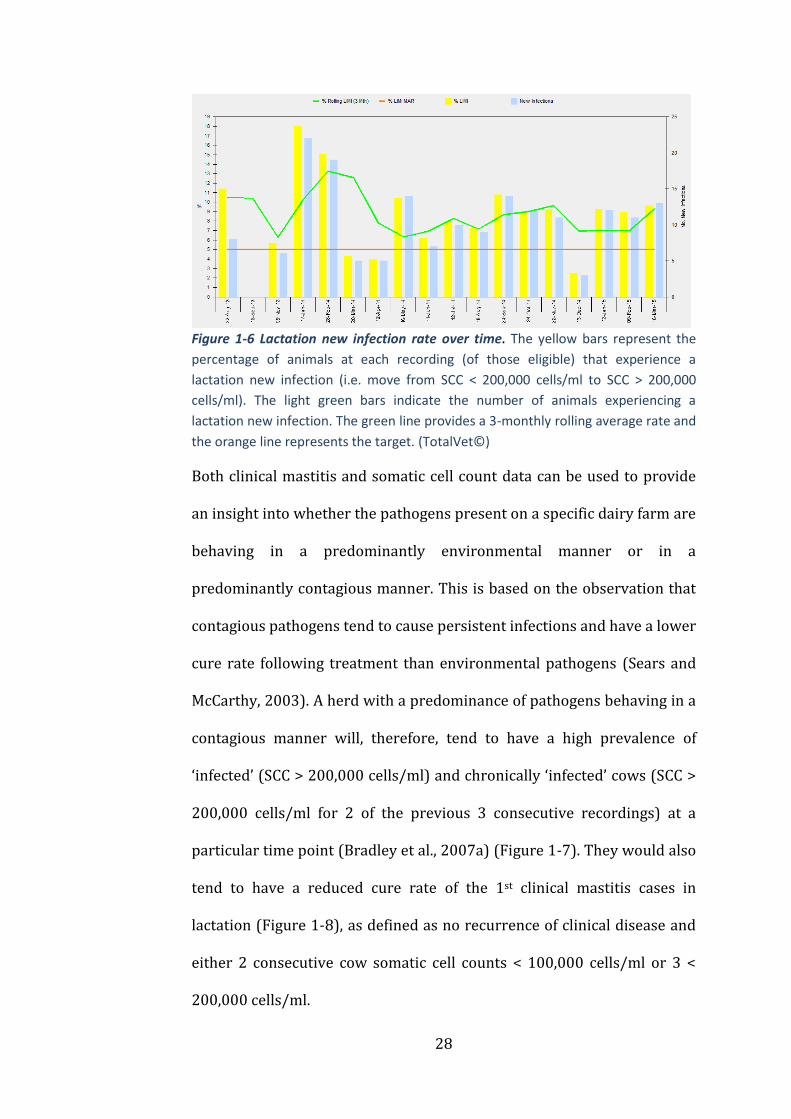
The lactation new infection rate (LNIR) provides a measure of the
proportion of cows acquiring a new intramammary infection between
consecutive milk recordings and this can also be a useful measure of the
relative importance of the dry-period versus lactation (Figure 1-6). A
common target is 5-7%/month moving from SCC < 200,000 cells/ml to >
200,000 cells/ml, although the UK mean is likely to be nearer 10%/month
(Green, 2012).
27
Figure 1-4 Dry period new infection rate over time. The dark blue bars represent the percentage of cows, within 30 days of calving with a somatic cell count > 200,000 cells/ml; the light yellow and light green bars illustrate the number of cows at the first recording (and < 30 days in milk) and the number defined as ‘infected’, respectively; the red line illustrates the rolling 3-monthly rate of dry period new infections and the orange line represents the target. (TotalVet©).
Figure 1-5 Dry period cure rate over time. The dark blue bars represent the percentage of cows, within 30 days of calving with a somatic cell count < 200,000 cells/ml that had a SCC > 200,000 cells/ml at their last milk-recording prior to drying-off; the light yellow and light green bars illustrate the number of eligible cows (SCC > 200,000 cells/ml at their last milk recording prior to drying-off) at the first recording (and < 30 days in milk) and the number defined as ‘cured’, respectively; the red line illustrates the rolling 3-monthly rate of dry period cure rate and the orange line represents the target. (TotalVet©)
28
Figure 1-6 Lactation new infection rate over time. The yellow bars represent the
percentage of animals at each recording (of those eligible) that experience a
lactation new infection (i.e. move from SCC < 200,000 cells/ml to SCC > 200,000
cells/ml). The light green bars indicate the number of animals experiencing a
lactation new infection. The green line provides a 3-monthly rolling average rate and
the orange line represents the target. (TotalVet©)
Both clinical mastitis and somatic cell count data can be used to provide
an insight into whether the pathogens present on a specific dairy farm are
behaving in a predominantly environmental manner or in a
predominantly contagious manner. This is based on the observation that
contagious pathogens tend to cause persistent infections and have a lower
cure rate following treatment than environmental pathogens (Sears and
McCarthy, 2003). A herd with a predominance of pathogens behaving in a
contagious manner will, therefore, tend to have a high prevalence of
‘infected’ (SCC > 200,000 cells/ml) and chronically ‘infected’ cows (SCC >
200,000 cells/ml for 2 of the previous 3 consecutive recordings) at a
particular time point (Bradley et al., 2007a) (Figure 1-7). They would also
tend to have a reduced cure rate of the 1st clinical mastitis cases in
lactation (Figure 1-8), as defined as no recurrence of clinical disease and
either 2 consecutive cow somatic cell counts < 100,000 cells/ml or 3 <
200,000 cells/ml.

29
Figure 1-7 Percentage of cows infected and chronically infected over time. The yellow bars represent the percentage of the milking herd with a SCC > 200,000 cells/ml; the light blue bars indicate the number of animals with a SCC > 200,000 cells/ml; the red bars show the percentage of the milking herd defined as chronically infected (SCC > 200,000 cells/ml for 2 of the last 3 consecutive recordings). The green line provides a 3-monthly rolling average proportion of the herd with a SCC > 200,000 cells/ml and the blue line is the 3-monthly rolling average proportion of the herd chronically ‘infected’. (TotalVet©)
Figure 1-8 Apparent cure rates over time. The light blue bars indicate the monthly dry-period cure rate as measured by somatic cell count (percentage of cows < 30 days in milk with a SCC < 200,000 cells/ml that had a SCC > 200,000 cells/ml at the last milk recording before drying-off); the green line indicates the 12-month rolling average clinical 1st case cure rate (no recurrence of clinical disease after a 1st clinical case and either 2 consecutive SCC < 100,000 cells/ml or 3 consecutive SCC < 200,000 cells/ml); the red line indicates the 12-month rolling average all case cure rate (no recurrence of clinical disease after a clinical case and either two consecutive SCC < 100,000 cells/ml or three consecutive SCC < 200,000 cells/ml); the blue line indicates the 12-month rolling average subclinical case cure rate (either two consecutive SCC < 100,000 cells/ml or three consecutive SCC < 200,000 cells/ml after the treatment of a subclinical case) *no subclinical cases were treated in this herd. (TotalVet©).

30
Using the CM and SCC parameters in this way to characterise the
epidemiology of mastitis for a given farm, both in terms of the putative
source of the majority of new infections as well as the likely behaviour of
pathogens present on the farm, is one of the key features of the UK
national mastitis control scheme (Green et al., 2007b).
Mastitis Control 1.2
Whilst bulk milk somatic cell counts and the prevalence of subclinical
mastitis have decreased nationally, the incidence of CM remains a
problem for many dairy herds. It has been demonstrated that BMSCC and
IRCM are not correlated (Barkema et al., 1998b), and that as BMSCC
reduces, the variation in the IRCM observed increases (Barkema et al.,
1998b). It has also been reported that herds with a low BMSCC tend to
have higher levels of environmental mastitis than herds with a higher
BMSCC (Barkema et al., 1998b; Elbers et al., 1998; Erskine et al., 1988;
Hutton et al., 1990), which is in agreement with the reported shift in the
aetiology of mastitis cases in the UK, as referred to previously. The
challenge with respect to environmental mastitis is that the interventions
that have successfully controlled contagious mastitis do not appear to
have the same efficacy against the causes of environmental mastitis and,
therefore, a different approach is required.
Risk factors associated with clinical mastitis 1.2.1
During the last 40 years, there have been a vast number of published
studies reporting associations between quarter-level, cow-level and herd-
level risk factors and the incidence of clinical mastitis. Most of these

31
studies were performed outside of the UK and the findings are, therefore,
not always applicable to the UK context. They range from small-scale
studies investigating one specific risk factor (e.g. post-milking teat
disinfection) to large-scale studies looking at many risk factors in a
specific ‘type’ of herd (e.g. low BMSCC). Despite these limitations, a
number of specific risk factors were common to two or more of these
studies.
Certain aspects of management that increased the exposure of cows to
environmental pathogens were consistently associated with an increased
IRCM, such as housing on straw yards (Barnouin et al., 2005; Peeler et al.,
2000) and cleaning out the straw yards housing the milking cows less
often than every 6 weeks (O’Reilly et al., 2006). Low frequency of cubicle
cleaning (Elbers et al., 1998; Schukken et al., 1991, 1990) and a low
quantity of bedding in cubicles (Elbers et al., 1998; Schukken et al., 1991)
were both associated with an increased IRCM. Hygiene of calving pens,
specifically the frequency of disinfection/cleaning and quantity of
bedding were also negatively correlated with IRCM in several studies
(Barkema et al., 1999a; Elbers et al., 1998; Peeler et al., 2000). The size of
the air inlet in milking cow sheds was positively correlated with the IRCM
caused by Strep. uberis in one study (Barkema et al., 1999a), but the
presence of an air inlet along the roof was associated with a reduced risk
of clinical mastitis caused by Staph. aureus in another study (Schukken et
al., 1991). The source of the cows’ drinking water was associated with an
increased risk of clinical mastitis when originating from a stream or a well

32
as opposed to public sources (Barkema et al., 1999a; Schukken et al.,
1991, 1990).
Aspects of management related to the milking process were also
identified by several studies, including the application of post-milking teat
disinfection (Barkema et al., 1999a; Elbers et al., 1998; Peeler et al., 2000;
Schukken et al., 1991, 1990), the practice of foremilking (Barkema et al.,
1999a; Elbers et al., 1998; O’Reilly et al., 2006; Peeler et al., 2000;
Schukken et al., 1990), which were both associated with an increased
IRCM. The wearing of gloves during milking (O’Reilly et al., 2006; Peeler
et al., 2000) was associated with an increased IRCM, as was the wet
preparation of teats before milking (Barkema et al., 1999a; Schukken et
al., 1991). The drying of wet teats with a cloth after premilking
preparation was associated with an increased IRCM in one study
(Barkema et al., 1999a) and a decreased IRCM in another (O’Reilly et al.,
2006). The proportion of cows leaking milk either just before or after
milking seemed to be important, with several studies reporting a positive
correlation with the IRCM (Elbers et al., 1998; O’Reilly et al., 2006; Peeler
et al., 2000; Schukken et al., 1991, 1990).
Other cow-level factors that were associated with IRCM include breed and
milk yield, with Meuse-Rhine-Yssel breeds being associated with an
increased risk (Elbers et al., 1998; Schukken et al., 1991, 1990) as well as
Holstein-Friesians (Barkema et al., 1999a) and Swedish-Holsteins
(Nyman et al., 2007) and higher milk yields being positively correlated

33
with IRCM (Barnouin et al., 2005; Chassagne et al., 1998; O’Reilly et al.,
2006; Schukken et al., 1990).
Risk factors associated with somatic cell count 1.2.2
Due to the relative availability of SCC data, there are a considerable
number of risk factor studies relating herd management with BMSCC and
these have been reviewed recently (Dufour et al., 2011). A key strength of
this review was its ability to identify practices that have shown consistent
associations with SCC under differing circumstances and which are
therefore most likely to be relevant to the largest number of dairy farms.
Management variables related to the milking process were some of the
most consistent including wearing gloves during milking, which was
associated with a low SCC (Bach et al., 2008; Hutton et al., 1991;
Rodrigues et al., 2005), the use of automatic cluster removal systems,
which was associated with a low SCC (Barkema et al., 1998a; Hutton et al.,
1990; Jayarao et al., 2004; Smith and Ely, 1997; Wenz et al., 2007) and
post-milking teat disinfection, which was associated with a low SCC
(Barkema et al., 1998a; Erskine and Eberhart, 1991; Erskine et al., 1987;
Hutton et al., 1991; Khaitsa et al., 2000). The order of milking (e.g. milking
high SCC and clinical mastitis cases last) has been associated with a low
SCC in several studies (Barnouin et al., 2004; Hutton et al., 1991; Wilson
et al., 1995) as has inspecting the milking machine at least annually
(Barkema et al., 1998a; Erskine et al., 1987; Hutton et al., 1990; Rodrigues
et al., 2005) and keeping cows standing after milking (Barkema et al.,
1998a; Barnouin et al., 2004). It is interesting to note that wearing gloves

34
during milking and post-milking teat disinfection were both associated
with an increased incidence of CM despite being associated with a
reduced SCC. This highlights how poorly correlated CM and SCC are
(Barkema et al., 1998b), and why it is important, therefore, to consider
the risk factors for CM and SCC separately.
With respect to housing, the use of cubicle housing (Bartlett et al., 1992;
Khaitsa et al., 2000; Smith and Ely, 1997; Wenz et al., 2007) with sand
beds (Bewley et al., 2001; Jayarao et al., 2004; Wenz et al., 2007) was
associated with the lowest SCC, as was increased cleanliness of the calving
pens (Barkema et al., 1998a; Barnouin et al., 2004).
Other variables consistently associated with a reduced SCC included the
application of blanket antibiotic dry cow therapy (Barkema et al., 1998a;
Erskine and Eberhart, 1991; Erskine et al., 1987; Hutton et al., 1991;
Rodrigues et al., 2005; Wenz et al., 2007), the daily inspection of dry cow
udders (Barkema et al., 1998a) and the application of the California
Mastitis Test (Erskine et al., 1987; Rodrigues et al., 2005).
Implications of study design 1.2.3
The vast majority of our current knowledge with respect to mastitis
control stems from observational studies using cross-sectional study
designs. There are several potential reasons for this, including that they
are relatively cheap and quick to perform and usually cover a broader
range of subjects (Feinstein, 1989). However, there are significant
limitations related to study design that need to be considered when
appraising evidence arising from such studies such as confounding,
35
interactions and non-randomisation (Martin, 2013). Due to the systematic
biases introduced by these factors and the associated propensity for the
inflation of positive effects (Sacks et al., 1982), observational studies are
typically used as hypothesis-generating and are considered to be a weak
source of evidence for causality (Concato et al., 2000). Despite
improvements in observational study design and methodology (Benson
and Hartz, 2000; Concato et al., 2000), intervention or ‘experimental’
studies remain the ‘gold-standard’ for assessing the clinical effectiveness
of therapeutic agents/medical interventions (Abel and Koch, 1999; Byar
et al., 1976; Feinstein, 1984). However, there are relatively few
intervention studies reported in the veterinary literature regarding
mastitis control (Green et al., 2007b) and those that have been performed
have been conducted at the cow level rather than the herd level. Some
recent examples of these include blanket dry cow therapy versus selective
dry cow therapy (Bradley et al., 2010), use of a mastitis vaccine (Bradley
et al., 2015) and the treatment of subclinical mastitis (van den Borne et
al., 2010b).
There have been several criteria proposed to assess the likelihood that
the relationship between an observed risk factor and a disease is causal
and these include temporality, consistency, biologic gradient and
experimental evidence (Schukken et al., 1990); another simple
consideration is plausibility. Plausibility simply refers to the biologic
plausibility of a causal relationship given the current state of knowledge.
For example, it was reported in one study that the increased cleanliness of

36
the calves was associated with a decreased risk of clinical mastitis caused
by E. coli in the milking herd (Barkema et al., 1999a). It would be very
difficult to arrive at a biologically plausible reason for this association to
be causal but far more likely is that the cleanliness of the calves reflects
some other characteristic, such as the attitude or skill of the farmer, which
was not directly measured in the study, which could have a closer
relationship with the incidence of clinical mastitis.
The Agriculture and Horticulture Development Board Dairy 1.2.4
Mastitis Control Plan
All of the data reported and analysed in Chapters 4, 5 and 6 of this thesis
originated from UK dairy herds that had participated in the AHDB Dairy
Mastitis Control Plan (DMCP). Background information and a detailed
description of the DMCP process are provided below.
In 2003, the UK dairy levy board (Milk Development Council) invited
tenders for a research partner to develop and test a mastitis control plan
developed and based on the risk factors in the veterinary literature. This
culminated in a randomised controlled clinical trial (RCT) carried out on
52 commercial dairy herds in England and Wales in 2004/2005 with the
aim of determining whether a clearly defined, structured plan for mastitis
control, implemented in herds with an increased incidence of clinical
mastitis, would reduce the incidence of clinical and subclinical disease.
Results from the RCT showed a mean reduction in the proportion of cows
affected with clinical mastitis of 22% (having accounted for confounders)
in intervention herds compared with the control herds, in addition to

37
reductions of around 20% in the incidence of clinical and subclinical
infections (Green et al., 2007b). After some further developments, the
AHDB Dairy Mastitis Control Plan (DMCP) was launched at a national
level in April 2009. The DMCP was delivered by trained ‘plan users’,
consisting of veterinary practitioners and dairy consultants that had
participated in 2 days of training, and a level of supervision and support
was provided by the group of specialist bovine veterinarians that
originally devised the DMCP.
The DMCP consists of 3 main stages: i) analysis of herd data to assess
patterns of mastitis and categorisation of each herd according to those
patterns, ii) assessment of the current farm management and, based on
deficiencies identified, prioritisation of the most important management
changes required, and iii) frequent monitoring of the farm data to assess
the subsequent impact on CM and SCC.
The first stage is arguably the most important (and novel) element of the
DMCP, whereby SCC and CM data for each herd are interpreted using
specialised analytical software and one of 4 ‘diagnoses’ assigned
according to the putative origin and cause of the majority of new
infections as described previously. The 4 potential diagnoses are as
follows:
environmental pathogens of mainly dry period origin (‘EDP’)
environmental pathogens of mainly lactation origin (‘EL’)
contagious pathogens of mainly dry period origin (‘CDP’)
contagious pathogens of mainly lactation origin (‘CL’)

38
The next element involves a visit to the farm during which a
comprehensive questionnaire/survey is completed covering all aspects of
management relevant to mastitis control (377 questions/observations).
The answers to the questionnaire are inputted into a bespoke software
package called the ‘ePlan’ together with the ‘diagnosis’ and management
deficiencies that are relevant to the ‘diagnosis’ are highlighted. At this
stage, the plan user would typically prioritise approximately 5-10
interventions to discuss further with the herd manager and agreement
sought on which ones to implement in the first instance. Once the
interventions have been agreed and implemented, the plan user monitors
the herd data (typically at 3-monthly intervals) to ensure that the plan is
kept up to date and relevant to the herd.
The key features of the DMCP approach are that it is farm-specific (unlike
the 5-point plan) and utilises the farm data to help target mastitis control
advice. It is also evidence-based, and has been proven to be effective in an
RCT. Since the DMCP was launched at a national level in 2009, over 350
plan users have been trained to deliver it, and over 2000 UK dairy herds
are estimated to have participated in the scheme.
Statistical methods used in this thesis 1.3
Economic evaluation is increasingly used to inform decisions about which
healthcare interventions to fund from available resources (Briggs and
Gray, 1999). There is a need for analytic methods used for economic
evaluation to compare new technologies with the full range of alternative
options and reflect uncertainty in evidence in the conclusions of the

39
analysis (Smith et al., 2004), all of which can be achieved with decision
analytic modelling.
Decision analysis, defined as a systematic approach to decision making
under uncertainty (Raiffa, 1968), has been widely established in the
human healthcare sector (Hunink et al., 2014; Sox et al., 1988). A decision
analytic model uses mathematical relationships to define a series of
possible consequences, and the likelihood of each consequence is
expressed as a probability with an associated cost and outcome (Briggs
and Gray, 1999). An important feature of decision modelling is to
acknowledge and incorporate the inevitable uncertainty surrounding
decisions. For example, apparently very similar herds will respond
differently to a specific mastitis intervention and, therefore, the likelihood
of a particular response can be expressed as a probability distribution in
the model. The process of populating a decision model usually involves
some form of evidence synthesis, whereby evidence is compiled from
multiple different sources, and there are many different approaches to
this (Spiegelhalter et al., 2004). Statisticians are increasingly using
Bayesian methods for evidence synthesis in decision models for economic
evaluation (Ades et al., 2006b) a key feature of which is the requirement
for parameters to be specified as probability distributions (Felli and
Hazen, 1999).
Bayesian approach 1.3.1
A Bayesian approach has been defined as ‘the explicit quantitative use of
external evidence in the design, monitoring, analysis, interpretation and

40
reporting of a health-care evaluation’ (Spiegelhalter et al., 2004). At its
most fundamental level, it deals with how our pre-existing opinion about
the likely effect of a specific mastitis intervention, for example (known as
the prior distribution), is altered, having observed some new data
(likelihood) to arrive at a final opinion about the effect of the mastitis
intervention (known as the posterior distribution). The mathematical
method proposed for this is known as Bayes’ theorem, after the Reverend
Thomas Bayes, an 18th Century minister who first described the theorem
which essentially weights the likelihood from the new data with the
relative plausibilities defined by the prior distribution (Spiegelhalter et
al., 2004).
From a decision maker’s perspective, a Bayesian approach allows the
combining of information from diverse sources, can encompass expert
judgement, addresses quantitatively all relevant sources of uncertainty,
and incorporates new information as it accrues sequentially, therefore
maximising the efficiency with which new knowledge is translated into
clinical practice (Parmigiani, 2002). Many clinical research questions can
most naturally be answered by assessing the probability that a particular
hypothesis is true or false, having observed a relevant set of data (Gurrin
et al., 2000) (e.g. the probability that a specific mastitis intervention
would result in a net saving of £1000 after 12 months). Unfortunately,
questions such as these cannot be readily answered within the
conventionally applied ‘frequentist’ framework. Statistical inference
within the frequentist framework is based upon p values that reflect the
41
probability of obtaining a particular pattern of results in a repeated series
of identical hypothetical experiments, on the basis of a hypothesis that is
assumed to be true (Burton et al., 1998; Gurrin et al., 2000). To establish
the probability that a hypothesis is true given a set of data, one first needs
to consider how plausible the hypothesis was in the first place (Nuzzo,
2014; O’Hagan, 2003) and, therefore, the weight of evidence required to
support it. The updating of our ‘prior’ or existing knowledge is a key
component of Bayesian inference, and one of the key advantages of the
Bayesian approach is that the resulting posterior distribution can be used
to provide clinically relevant and direct answers to all kinds of questions,
including the probability that a particular hypothesis is correct (O’Hagan,
2003). It also removes the reliance upon significance testing and the use
of arbitrary thresholds of ‘significance’ (Greenland and Poole, 2013;
Gurrin et al., 2000), meaning the clinician is able to make their own
judgement as to what is clinically ‘significant’ according to the degree of
uncertainty they are comfortable with.
There are numerous Bayesian approaches to economic decision
modelling (Spiegelhalter et al., 2004), and the two simulation-based
approaches used in this thesis are: (i) probabilistic sensitivity analysis,
using Monte Carlo methods and (ii) a related integrated approach using
Markov chain Monte Carlo methods (MCMC) and micro-simulation.
Probabilistic sensitivity analysis 1.3.2
A technique now widely adopted by the human healthcare sector for
analysis of the cost-effectiveness of new and existing treatments is

42
probabilistic sensitivity analysis (PSA) (Briggs et al., 2002; Brown et al.,
2006). Indeed, the National Institute for Clinical Excellence (NICE) now
requires all cost-effectiveness analyses submitted to the institute to utilise
PSA (Claxton et al., 2005). Whilst this form of analysis has widespread
acceptance within the human healthcare sector, there are relatively few
examples of its use in the veterinary literature (Detilleux, 2004; Hudson et
al., 2015, 2014).
The main feature of PSA is that all input parameters are specified as full
probability distributions (probabilistic), rather than point estimates
(deterministic), to represent the uncertainty surrounding their values.
This parameter uncertainty can then be propagated through the cost-
effectiveness model so that imprecision in model outputs is transparent
(Briggs et al., 2002). For example, rather than using a point estimate for
the probability of clinical cure after the treatment of CM of, say, 60%, we
might choose a probability distribution covering the range 40-80%
instead, accepting that we don’t know the precise figure but being fairly
confident that it lies somewhere within this range. Then, at each iteration
of the model, a different value is taken from the specified range and used
as the basis for the cost-effectiveness calculations. By repeating this
process thousands of times, many different scenarios can be explored.
The relative importance of different model parameter values on the
outcome of interest can then be evaluated irrespective of model
complexity.
43
The process of randomly drawing values from within a specified
probability distribution is commonly known as Monte Carlo simulation
(Metropolis, 1987) and was first utilised as a research tool for the
development of nuclear weapons during the second world war. Monte
Carlo methods have been used across many areas of science and business
with the primary purpose of evaluating integrals or sums by simulation
rather than exact or approximate algebraic analysis (Spiegelhalter, 2004).
PSA has become a popular modern method for determining the
uncertainty in the outcomes of cost-effectiveness studies because of the
uncertainty in input parameters (Boshuizen and van Baal, 2009). There
have been concerns that the use of deterministic or univariate sensitivity
analysis may underestimate overall uncertainty (Briggs, 2000) and
become difficult to interpret with large numbers of parameters, especially
if any are correlated (Claxton et al., 2005). Such concerns have led to the
development of PSA based on Monte Carlo simulation methods (O’Brien
et al., 1994), as PSA permits the analyst to examine the effect of joint
uncertainty in the variables of an analysis without resorting to the wide
range of results generated by extreme scenario analysis (Briggs and Gray,
1999). Parameter correlation is propagated automatically, providing
meaningful sensitivity analysis regardless of parameter correlation (Ades
et al., 2006a).
Given that the literature is often quite sparse concerning many of the
model inputs required, assumptions are usually necessary for this kind of
model and this can result in unreliable conclusions being drawn if this

44
uncertainty is not properly investigated. By using PSA, we can reflect the
level of uncertainty by defining the parameters as distributions that are
transparent. The distributions used do require a degree of judgement and
this has to be carried out in an open and transparent way and based on
current literature wherever possible.
Integrated approach and micro-simulation 1.3.3
The traditional approach to cost-effectiveness analysis involves a two-
stage process whereby parameter estimates and intervals are first
obtained based on subjective judgements, data analysis or a combination
of the two and, secondly, distributions for the parameter estimates are
then assumed and inputted into a separate model to evaluate the cost-
effectiveness. An alternative approach is the integrated or unified
approach which is a fully Bayesian analysis that simultaneously carries
out the evidence synthesis and cost-effectiveness analysis. The integrated
approach requires all of the available evidence to be specified as prior
distributions which are then revised by Bayes theorem using MCMC
simulation to derive posterior distributions. The effects of the resulting
posterior distributions are simultaneously propagated through the cost-
effectiveness model which is then used to make predictions.
There are many examples of this integrated approach in the human
medical literature (Bravo Vergel et al., 2007; Cooper et al., 2004, 2003;
Gillies et al., 2008; O’Hagan and Stevens, 2001; Welton et al., 2008) but
examples in the veterinary literature are relatively sparse (Archer et al.,
2014a, 2014b, 2013a, 2013b; Green et al., 2010).

45
The key features of the integrated approach are: (i) it provides a
systematic framework for relating uncertainty about model input
parameters to uncertainty in the computational results of the cost-
effectiveness model; (ii) it makes full allowance for any inter-
relationships between model input parameters; and (iii) it removes the
need to make parametric distributional assumptions and facilitates
sensitivity analyses (Cooper et al., 2004).
A common problem when trying to base clinical decisions on the results
of cost-effectiveness models is that it is often difficult to interpret all of
the model outcomes and apply them to the decisions that need to be made
(e.g. if a herd level interpretation is required from a cow-level model). For
this reason, it is often helpful to perform a ‘follow-on’ simulation
involving the trajectories of individual cows/herds which can then be
used as an estimate of the expected outcome in a population of
cows/herds. This is known as micro-simulation, and, by using this tool, it
is possible to replicate carefully controlled clinical trials varying only the
exposure of interest, which would often otherwise be very expensive to
perform and could give rise to ethical concerns.
Markov Chain Monte Carlo for parameter estimation 1.3.4
MCMC was invented shortly after Monte Carlo methods following a study
simulating a liquid in equilibrium with its gas phase (Metropolis et al.,
1953). The resulting ‘Metropolis algorithm’ was generalised by Hastings
to become the ‘Metropolis-Hastings algorithm’ (Hastings, 1970), a special

46
case of which became known as the Gibbs sampler (Geman and Geman,
1984) which is widely used today and was used in this thesis.
MCMC is an effective means of sampling from the posterior distribution
despite the precise form of the posterior distribution being unknown. A
Markov chain is created by continually updating parameter estimates
until a stable state is reached, known as convergence. Each parameter
estimate in the chain depends only on the previous estimate, so the chain
gradually becomes independent of past values, including initial
conditions. Any inferences required are derived from the sampled values
which together form an approximation of the posterior distribution of
interest.
A Markov Chain should converge to a stationary or non-variant state and
the sampling process up to convergence is usually termed ‘burn in’.
Determining if a chain has converged can be difficult (Gilks et al., 1995)
but methods used in this thesis included the visual assessment of chain
stability and the Brooks-Gelman-Rubin convergence diagnostic (Brooks
and Gelman, 1998; Gelman and Rubin, 1992). Following convergence,
Markov Chains are typically continued for thousands of iterations to
estimate parameters, after which, the initial ‘burn-in’ iterations are
discarded and parameter estimates at each iteration used for onward
prediction and simulation.
47
Aims of the thesis 1.4
Summary 1.4.1
The overall aim of the thesis was to explore the cost of clinical mastitis
and cost-effectiveness of different approaches to mastitis treatment and
specific mastitis control interventions using probabilistic methods that
incorporated uncertainty. The results of the decision analytic models
should facilitate decision making by enabling direct statements of
probability to be inferred about specific clinical hypotheses. Bayesian
approaches were used throughout the thesis to capture and propagate
sources of uncertainty that were identifiable.
Overview of Chapters 1.4.2
Transmission and the cost of clinical mastitis (Chapter 2)
The aim of Chapter 2 was to use probabilistic sensitivity analysis to
evaluate the relative importance of different components of a model
designed to estimate the cost of clinical mastitis. A particular focus was
placed on the importance of pathogen transmission relative to other
factors, such as milk price or treatment costs.
The cost-effectiveness of an on-farm culture approach compared with a
standard approach for the treatment of clinical mastitis in dairy cows
(Chapter 3)
In Chapter 3, an adaptation of the PSA model developed in Chapter 2 was
used to explore factors affecting the cost-effectiveness of an on-farm
culture approach versus a standard approach for the treatment of clinical
mastitis. The main aim of this study was to help veterinary decision
48
makers identify the types of dairy herds for which the on-farm culture
approach was likely to be cost-effective by exploring different simulated
scenarios.
Current management practices and interventions prioritised as part of a
nationwide mastitis control plan (Chapter 4)
Chapter 4 presents descriptive performance and management data taken
from a sample of UK dairy farms that have participated in the AHDB Dairy
Mastitis Control Plan and identifies important mastitis prevention
practices that were not widely implemented. The aim was to develop an
appreciation of current management practices such that this might aid the
understanding of why mastitis remains a significant problem on many UK
dairy farms and provide useful insights into which interventions are
perceived to be most important for different types of farms.
A Bayesian micro-simulation to evaluate the cost-effectiveness of specific
interventions for mastitis control during the dry period (Chapter 5)
The aim of Chapter 5 was to estimate the cost-effectiveness of specific
mastitis interventions that had been implemented in UK dairy herds that
had participated in the DMCP and that had an EDP diagnosis. The cost-
effectiveness under different circumstances was assessed using an
integrated Bayesian micro-simulation approach.
A Bayesian micro-simulation to evaluate the cost-effectiveness of specific
interventions for mastitis control during lactation (Chapter 6)
The aim of Chapter 6 was to estimate the cost-effectiveness of specific
mastitis interventions that had been implemented in UK dairy herds that
had participated in the DMCP and that had an EL diagnosis. As with
49
Chapter 5, the cost-effectiveness under different circumstances was
assessed using an integrated Bayesian micro-simulation approach. An
important end goal of this and the previous study was to integrate the
results of the micro-simulation into a decision support tool that would
facilitate the prioritisation of mastitis control interventions by veterinary
practitioners and advisors. The decision support tool is not in itself a part
of this thesis, but it is currently ongoing work building on the data
presented within.

50
Chapter 2
Transmission and the cost of
clinical mastitis
Introduction 2.1
Mastitis remains one of the most common diseases of dairy cows and
represents a large economic loss to the industry as well as a considerable
welfare issue to the cows affected (Bradley, 2002; Halasa et al., 2007).
Despite being an infectious disease, concentration is often focussed on the
individual animal with respect to treatment, cost and management. The
risk posed to the rest of the herd from infected individuals and the
potential impact of disease transmission on the cost of a case of clinical
mastitis (CM) is often overlooked.
The cost of CM is made up of direct costs (e.g. discarded milk, cost of
medicines, labour) and indirect costs (e.g. loss of future production,
increased culling), and varies considerably between farms (Huijps et al.,
2008). Whilst the direct costs are more apparent to the producer, they
are reported to comprise only a small proportion of the overall cost of CM
compared to the less obvious indirect costs (Huijps et al., 2008; Kossaibati
and Esslemont, 2000). Several studies have taken all of the direct and
indirect costs into account and have produced average figures of £111
(Bar et al., 2008), £167.41 (Huijps et al., 2008), £175.60 (Kossaibati and
Esslemont, 2000) and £341.17 (Hagnestam-Nielsen and Ostergaard,
2009) for the cost of a case of CM. Whilst this information is useful, such

51
‘average’ figures are difficult to interpret for an individual producer
unless they happen to be the ‘average’ farm. Whilst some recent studies
have investigated the impact of transmission on the overall cost of CM at
herd level (Halasa, 2012; Halasa et al., 2009; van den Borne et al., 2010a),
most studies have not evaluated the impact that within-herd transmission
may have on the cost of CM at cow-level, nor how important this may be
relative to the other factors that make up the overall cost of a case of CM.
A technique now widely adopted by the human healthcare sector for
analysis of the cost-effectiveness of new and existing treatments is
probabilistic sensitivity analysis (PSA, see 1.3.2) (Briggs et al., 2002;
Brown et al., 2006). The main feature of this technique is that all input
parameters in a cost effectiveness model are specified as full probability
distributions, rather than point estimates, to represent the uncertainty
surrounding their values. This parameter uncertainty can then be
propagated through the cost effectiveness model so that imprecision in
model outputs is transparent (Briggs et al., 2002). The relative
importance of different model parameter values on the outcome of
interest can then be evaluated irrespective of model complexity.
The purpose of Chapter 2 was to use PSA to evaluate the relative
importance of different components of a model designed to estimate the
cost of CM. The model included the potential for pathogen transmission
between cows and was an extension of a previously described model
structure (Steeneveld et al., 2011). A particular aim was to assess the

52
importance of the rate of transmission relative to other factors, such as
milk price or the cost of therapeutic agents.
Materials and Methods 2.2
Model Structure 2.2.1
A stochastic Monte Carlo model was developed using WinBUGS 1.4.3
software (Lunn et al., 2000) (WinBUGS code provided in Appendix 1).
This was used to simulate a case of CM (CM1) at the cow level and to
calculate the associated costs simultaneously for 5 treatment protocols as
defined by Steeneveld et al. (2011). The 5 protocols used were 3 days of
antibiotic intramammary treatment (treatment 1), 5 days of antibiotic
intramammary treatment (treatment 2), 3 days of intramammary and
systemic antibiotic treatment (treatment 3), 3 days intramammary and
systemic antibiotic treatment plus 1 day nonsteroidal anti-inflammatory
treatment (treatment 4) and 5 days intramammary and systemic
antibiotic treatment (treatment 5). The initial probability that the cow
was cured bacteriologically was defined by a probability distribution
based on the maximal cure rates given by Steeneveld et al. (2011) but
rather than being pathogen-specific (e.g. Staph aureus, Strep
dysgalactiae/uberis or E coli), a single distribution was used providing
coverage of cure rates encompassing those for all of the pathogens
modelled by Steeneveld et al. (2011). For example, for treatment 1 (3
days of intramammary treatment), the bacteriological cure rates given
ranged from 0.80 for E. coli infections down to 0.40 for Staph. aureus
infections, so the uniform distribution 0.40-0.80 was used for all
53
treatment 1 cases. After an initial treatment, there were 3 possible
outcomes; complete cure (bacteriological plus clinical cure), clinical cure
(with no bacteriological cure) or no cure (non-clinical and non-
bacteriological cure) with probabilities based upon Steeneveld et al.
(2011) (Table 2-1). The probability that a case was cured
bacteriologically was assumed to be further influenced by whether the
cow was systemically ill, the somatic cell count (SCC) at the time of
treatment, the days in milk at the time of treatment, parity and whether it
was a repeat case or not (Steeneveld et al., 2011) (Table 2-1). The cows
that failed to cure bacteriologically were deemed to have an 80% chance
of curing clinically (Steeneveld et al., 2011).

54
Table 2-1 Probability distributions specific to the 5 defined clinical mastitis antimicrobial treatment protocols used in a model designed to simulate the cost of a case of clinical mastitis
Antimicrobial treatment regimen
Treatment 1 Treatment 2 Treatment 3 Treatment 4 Treatment 5
Application and duration (d)
Intramammary (3) Intramammary (5) Intramammary (3) +
systemic (3)
Intramammary (3) + systemic (3) + nonsteroidal
antiinflammatory drug (1)
Intramammary (5) + systemic (3)
Probability of bacteriological cure1,2
(0.40,0.80) (0.60,0.80) (0.60.0.80) (0.63,0.83) (0.70,0.90)
Probability of bacteriological cure after extended tx1,2
(0.30,0.90) (0.50,0.90) (0.50,0.90) (0.53,0.93) (0.60,0.99)
Cost of medicines (£)1,3 (5.58,6.97) (9.30,11.62) (32.00,36.00) (43.00,47.00) (36.00,40.00)
Treatment Time (hr)1,2 (0.53,0.87) (0.87,1.20) (0.58,0.92) (0.63,0.97) (0.92,1.25)
Milk withdrawal (d)1,4 (5.00,9.00) (7.00,11.00) (5.00,9.00) (5.00,10.00) (7.00,11.00)
1Uniform distribution with upper and lower limits specified 2Based upon Steeneveld et al. (2011) 3Based upon estimate of current retail price of commonly used preparations in the UK. 4Based upon commonly used preparations in the UK.
55
The model structure was adapted from the model described by
Steeneveld et al. (2011) (Figure 2-1), which models the sequelae
following a case of CM within a single lactation with the addition of a risk
of transmission from cows that cured clinically but not bacteriologically.
Cases that completely cured could either go on to finish the lactation or be
culled within the remainder of the lactation. The probability of being
culled was increased if the cow was systemically ill at the time of
treatment. The cows that cured clinically but not bacteriologically could
go on to finish the current lactation, be culled or have a clinical recurrence
of the original case (CM2). If a cow did not cure, it would receive a repeat
course of the initial treatment protocol resulting in the same 3 possible
outcomes as previously outlined. Cows that failed to cure after a repeated
course could either die or have the quarter dried-off. If a quarter was
dried-off they could then go on to finish the lactation at a reduced level of
milk production, or be culled (Table 2-2). The same sequence of events
was modelled for CM2, but after CM3, the options became narrower. The
cows that cured completely after CM3 could either end the lactation or be
culled. The clinical (but not bacteriological) cures and the ‘no-cures’ were
culled, as was the case in the model described by Steeneveld et al. (2011).
The probabilities of a cow being culled varied according to whether the
case was a first, second or third case. The distributions used in the model
are shown in Table 2-1 and Table 2-2. Following each treatment for CM,
the probability of a cow curing bacteriologically was selected from the
56
specified distribution, and, of those cows that failed to cure, 80% were
assumed to cure clinically but not bacteriologically, as described by
Steeneveld et al. (2011), The remaining cows were assumed to fail to cure.
A risk of transmission was included from cows that cured clinically but
not bacteriologically (those that did not cure clinically received another
treatment and were deemed to be not at risk of transmission at this
point). The probability that a cow transmitted infection to a herdmate
(Table 2-2) was taken from van den Borne et al. (2010) who reported
estimated transmission rates over a 14 day period for infections caused
by Staph. aureus, Strep. uberis/dysgalactiae and E. coli. A uniform
distribution was specified (range 0.002 to 0.25, encompassing the
estimates of van den Borne et al. (2010)) from which a value was selected
at random at each iteration and used for each period of risk thereafter.
The total period of transmission risk modelled was limited to 12 weeks
split into 14 day intervals for CM1 and CM2. Therefore, the risk of
transmission had a wide distribution to reflect and encompass all types of
pathogen and strain. Thus, using one distribution, we could evaluate
differences between a very low transmission pathogen and a very high
transmission pathogen.
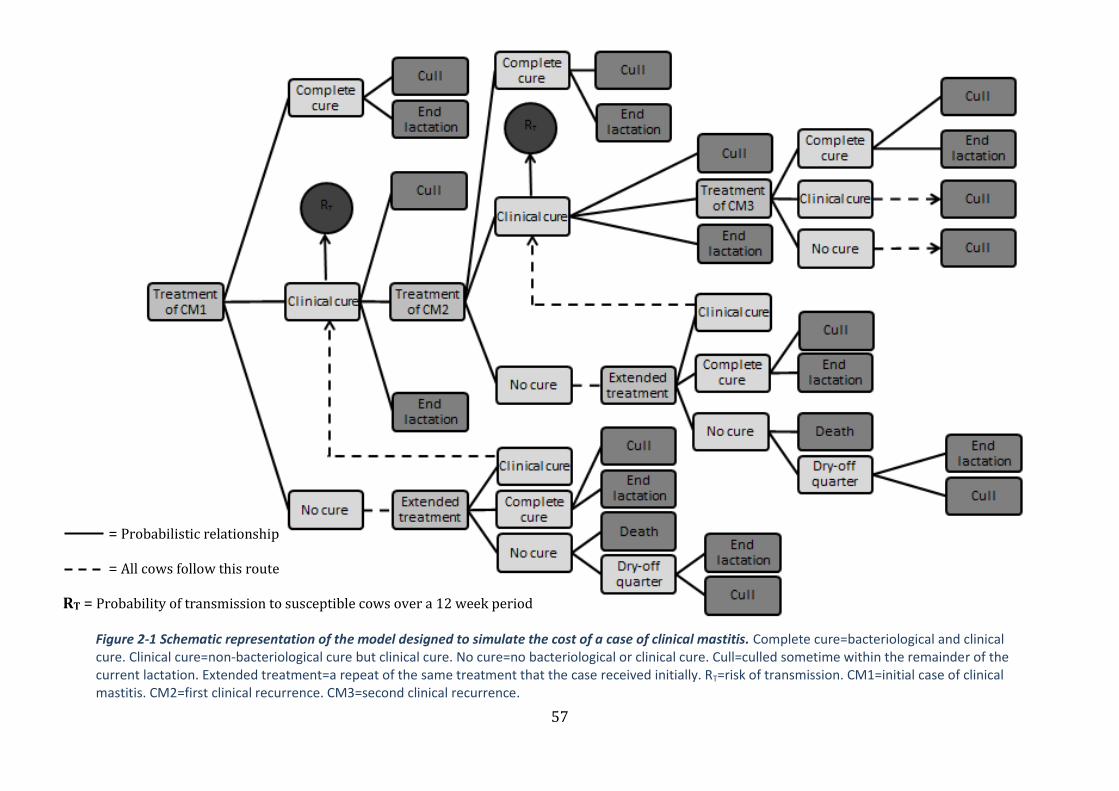
57
Figure 2-1 Schematic representation of the model designed to simulate the cost of a case of clinical mastitis. Complete cure=bacteriological and clinical cure. Clinical cure=non-bacteriological cure but clinical cure. No cure=no bacteriological or clinical cure. Cull=culled sometime within the remainder of the current lactation. Extended treatment=a repeat of the same treatment that the case received initially. RT=risk of transmission. CM1=initial case of clinical mastitis. CM2=first clinical recurrence. CM3=second clinical recurrence.
= Probabilistic relationship
= All cows follow this route
RT = Probability of transmission to susceptible cows over a 12 week period

58
Table 2-2 Probability distributions applicable to all 5 antimicrobial clinical mastitis (CM) treatment protocols used in the model designed to simulate the cost of a case of clinical mastitis
Input parameters Upper and lower limits of uniform
distribution Source
Decrease in probability of bacteriological cure1 a Parity ≥2 (-0.15,-0.05)
Days in milk ≥60 days (-0.15,-0.05) Cow is systemically ill (-0.25,-0.15) SCC 200,000-500,000 cells/mL at most recent recording (-0.15,-0.05) SCC >500,000 cells/mL at most recent recording (-0.25,-0.15) Repeated case (>1st case in current lactation) (-0.25,-0.15) Probability of being culled for bacteriologically noncured cases a Initial case (0,0.32)
Following first clinical recurrence (CM2) (0.04,0.36) Probability of being culled for completely cured cases a Initial case (0.04,0.06)
Following first clinical recurrence (CM2) (0.10,0.20) Following second clinical recurrence (CM3) (0.20,0.30) Probability of death for nonclinical cured cases (0.04,0.06) a Probability of drying-off quarter for nonclinical cured cases (0.94,0.96) a Probability of being culled for cows with dried off quarters (0.27,0.39) a Increase in all culling probabilities when cow is systemically ill (0.05,0.15) a Probability of clinical flare-up for bacteriologically noncured cases
(0.05,0.12) a
Probability of transmission after CM1 and CM2 (0.002,0.25) b Proportional yield loss a Case in 1st or 2nd month of lactation (0.07,0.09)
Case between months 3 and 6 (0.03,0.08) Case after month 6 (0,0.04) Parity ≥2 (0,0.02) 305d Yield (Kg) (7000,10000) Author Daily milk discard (Kg) (5.00,50.00) Author Value of discarded milk (£/Kg) (0.23,0.27) (DairyCo, 2012a) Cost of milk production (£/Kg) (0.03,0.10) c Cost of labour (£/hr) (1.00,15.87) c Cost of cull (£) (120,720) c, d Cost of death (£) (1200,2000) DairyCo 2012b 1 The value selected from this distribution was subtracted from the value selected from the bacteriological cure distribution. a = based on Steeneveld et al. (2011) b = based on Van den Borne et al. (2010) c = based on Huijps et al. (2008) d = based on Kossaibati & Esslemont. (2000)
59
The susceptible population was taken as the whole herd (99 cows) at the
start of the transmission period and was reduced according to the
number of cows that became infected after each 14 day period during the
subsequent 12 weeks. Cow parities and stage of lactation of the
susceptible population were not modelled separately; thus for simplicity,
all susceptible cows we assumed to have an equal probability of acquiring
an infection. All cows that were infected at the end of the previous 14 day
period were eligible to transmit infection during the next 14 day period
according to the defined probability distribution (Table 2-2). For example,
if the cow treated at CM1 remained subclinically infected after treatment,
it could transmit the infection to another cow in the herd during the
following 14 day period. At the start of the subsequent 14 day period,
there could now be 2 infectious cows able to transmit infection to another
2 cows during the next 14 day period. If 3 cows had become infected in
addition to the original case, then the susceptible population would be
reduced to 96 cows. The total number of infections accrued from CM1 and
CM2 were combined and the costs of subsequent cases of CM were
estimated by multiplying the cost from the original case (CM1) by the
number of extra cases of CM caused by transmission of the original
infection (thus assuming the same milk price, culling values and so on as
for the initial case). A total cost of CM was derived by adding the costs
from the original and secondary cases, following transmission. For
example, if the cost of a case of CM was calculated to be £200 (excluding
transmission) but the cow infected 2 herd mates, then the total cost
(including transmission) would be calculated as £600 (£200 x 3).

60
Model input parameters 2.2.2
The model was parameterised (i.e. the model inputs selected) with
distributions taken from the existing literature, from current commercial
data and where no other information was available, on transparent
assumptions made by the Dairy Herd Health Group, University of
Nottingham (Table 2-1 and Table 2-2). The purpose was to enable
exploration of the relationship between each model parameter and the
overall cost-benefit of each treatment protocol over a wide range of
possible scenarios. Whilst not a requirement of PSA, uniform distributions
were used throughout the model to enable evaluation of the cost of CM
over a spectrum of different scenarios without specifying which scenarios
were more or less likely thereby minimising assumptions. This was not
intended to represent the ‘true’ distribution of the input parameters
(which are generally unknown), but simply to allow investigation over the
whole of a realistic range of equally likely parameter values and, thus,
treatment scenarios. After a large number of model iterations (4000 per
treatment protocol), all combinations of treatment scenarios and other
input parameters were effectively investigated, so that dependencies
could be evaluated.
Where possible, distribution ranges were based on values from current
literature. Where a point estimate was identified in the literature, a
uniform distribution centred on that point was used, to allow sensitivity
analysis of realistic values around this point estimate. For example, the
increase in probability of a cow being culled within the remainder of

61
lactation when systemically ill was estimated to be 0.10 (Steeneveld et al.,
2011). In our model a uniform distribution of 0.05-0.15 was used to
evaluate this parameter over an enlarged but specified range. The
distributions used for input parameters are shown in Table 2-1 and Table
2-2, along with the source or basis for the choice of each distribution.
Economic parameter distributions included the cost of medicines (Table
2-1), labour, milk withdrawal and loss of milk production, culling and
death (Table 2-2). The cost of labour is subject to large variation quoted in
the literature. For this reason a wide distribution was assigned to the
hourly cost of labour with the upper limit taken from Huijps et al. (2008).
The total time taken to treat each case of CM was assigned a distribution
centred on the figures given by Steeneveld et al. (2011), surrounded by an
additional variation of +/- 10 minutes. The total cost of labour was the
product of the hourly rate and the total treatment time.
The length of milk withdrawal after CM was defined by a distribution
based on the commonly used medicines in the UK and the amount of milk
being discarded each day was taken from a plausible milk yield
distribution (Table 2-1). The distribution defined for milk price was taken
from DairyCo (2012a), and was based on the average UK milk price over
the last 12 months (range: lowest price and highest price). The cost of
milk production was based on Huijps et al. (2008), and assigned a
uniform distribution to reflect the variability in the figure (Table 2-2).
The calculation of total yield loss following a case of CM was based on the
herd 305 day yield, the parity of the animal and the stage of lactation in

62
which the infection occurred (Table 2-2). The distributions governing the
percentage of total loss in 305 day milk yield were based on Hagnestam et
al. (2007). The proportion of cases occurring at each stage postpartum
and the proportion of cases affecting multiparous cows versus
primiparous cows was governed by distributions based on Steeneveld et
al. (2011) (Table 2-2). The cost associated with the total loss in milk yield
was calculated according to the total loss in earnings (i.e. the quantity of
milk multiplied by the milk price) minus the savings made in feed costs
(i.e. the quantity of milk loss multiplied by the cost of production). All
distributions are provided in Table 2-2.
The cost of culling a cow within the remainder of the current lactation
was taken from a uniform distribution based on Huijps et al. (2008) and
Kossaibati and Esslemont (2000), which included the slaughter value and
replacement costs, with an appropriate range added to reflect the
variability of this parameter (Table 2-2). The cost of the death of an
individual was based on current UK average sales prices for freshly calved
cows and heifers (DairyCo 2012b) which would be required to replace the
dead cow in addition to the cost of carcass disposal (Table 2-2).
Model Simulation 2.2.3
The model was used to simulate 4000 cases of CM1 for each treatment
protocol. At each iteration, all model input parameter values for that
iteration were stored along with the calculated cost of a CM1 case: this
data was then used for analysis.

63
At each model iteration a value for each input parameter was drawn from
the probability distribution for that input parameter independent of other
parameter values selected, and the model used to calculate a cost of CM
based on those input values. At the next iteration, a new set of parameter
values were selected at random and used to calculate a cost of CM. This
process was repeated 4000 times for each of the 5 treatment protocols
and the impact of each parameter on the cost of CM was evaluated.
Data analysis 2.2.4
Spearman rank correlation coefficients were calculated to explore the
univariable associations between model input parameters and the cost of
CM (Table 2-3). The strength of the relationship was evaluated using the
Spearman rank rho (ρ) value.
Conventional first order multiple linear regression models were used to
explore the relationships between model inputs (Table 2-1and Table 2-2)
and the cost of CM for each of the treatment protocols (one model was
constructed for each treatment protocol). A natural log transformation
was required for the outcome variable (cost of CM) to give normality and
homoscedasticity of the residuals. Model fit was assessed using a visual
assessment of residuals and a Q-Q plot to evaluate normality. The
influence of any outlying residuals was assessed using the Cook’s D value.
Predictor variables were selected by backward stepwise selection and
variable coefficients that were significantly different from zero (p<0.05)
were retained in the final model. All analysis was performed in R version
2.15.0 (R Development Core Team, 2012).

64
The relative ‘importance’ of the independent variables (model input
parameters) on the cost of CM was assessed for each of the 5 treatment
protocols by removing the variable from the model and observing the
difference in the resulting R2 value. This difference was then expressed as
a proportion of the R2 value of the complete model.
The final regression models were used to make predictions based on
different cow and farm scenarios and to explore the predicted effect these
would have on the overall cost of CM. This was undertaken by altering the
value of each of the independent variables in the model in turn from their
median value to the 97.5th percentile whilst keeping all other variables
constant at their median value and recording the resulting change in the
model output (cost of CM) as a percentage. This was performed using
Microsoft Excel (2010).
Results 2.3
Data analysis 2.3.1
The Spearman rank correlation coefficients are presented in Table 2-3.
The cost of CM was most closely associated with the risk of transmission
of infection for all 5 treatment protocols. This was followed by the
bacteriological cure rate, the cost of a cull, total loss in yield and the
presence or absence of systemic illness.
The regression model fit was good for each of the 5 treatment protocols
and outliers had no significant influence on the model output. The results
of the regression analysis are illustrated in Figure 2-2. Transmission of
65
infection had the greatest influence on the overall cost of CM for all 5
treatment protocols and the number of cows infected as a result of CM1
ranged from 0 to 3 over the total 12 week period of risk (Table 2-4). This
was followed by occurrence of systemic illness, cost of a cull and total
yield loss during the remainder of the lactation. In total, 13 independent
variables were retained in the final models (Figure 2-4). The relative
importance of variables differed only slightly between the 5 treatment
protocols; the general trends were similar throughout.
The most influential financial input was the cost of a cull which accounted
for around 10% of the variance in the total cost of CM, followed by the
cost of milk production, milk price and cost of labour. The cost of
medicines was not found to be a significant predictor, and was excluded
from the final models. The relationship between the most important
independent variables and the cost of CM are displayed in Figure 2-3.
Scenarios 2.3.2
The regression models were used to explore the effect that changes to
specific independent variables had on the overall cost of CM and the
results from treatment 1 are displayed in Figure 2-4. An increase in the
rate of transmission from 0.13 new cases/14 days to 0.25 new cases/14
days would increase the predicted cost of CM by up to 60%, whereas
doubling the cost of labour from around £8.50/hr to £15.50/hr would
only be expected to increase the cost of mastitis by around 5%. Systemic
illness had a large effect on the total cost of CM (40%) if present due to
the depressing effect this had upon the probability of bacteriological cure.

66
The cost of a cull had a moderate effect on the cost of CM with an increase
from £420 to £702 resulting in a 15-20% increase in the overall cost.
Table 2-3 Spearman rank correlation coefficients measuring the statistical dependence between the specified variable and the total cost of clinical mastitis estimated in the complete model designed to simulate the cost of a case of clinical mastitis.
Treatment 1
Treatment 2
Treatment 3
Treatment 4
Treatment 5
Transmission 0.70 0.68 0.71 0.70 0.64
Bacteriological cure rate1
-0.24 -0.10 -0.07 -0.13 -0.09
Cost of cull 0.23 0.24 0.24 0.24 0.25
Total yield loss 0.23 0.23 0.22 0.22 0.23
Not systemically ill -0.23 -0.25 -0.25 -0.25 -0.27
Heifer -0.15 -0.16 -0.16 -0.17 -0.17
Not a repeat case -0.12 -0.14 -0.13 -0.14 -0.15
Milk price 0.10 0.11 0.11 0.11 0.11
SCC > 500,000 cells/ml2
0.10 0.09 0.09 0.08 0.09
Cost of milk production
-0.10 -0.10 -0.10 -0.11 -0.11
Less than 60 days in milk3
-0.09 -0.10 -0.10 -0.11 -0.11
Milk withdrawal4 0.09 0.07 0.07 0.12 0.07
Cost of labour 0.02 0.04 0.02 0.02 0.04
Cost of drugs 0.02 0.00 0.02 0.00 0.01 1 Baseline bacteriological cure rate before further influence of systemic illness, parity, days in milk, somatic cell count and case number. 2 Somatic cell count at the time of clinical mastitis. 3 Less than 60 days in milk at the time of clinical mastitis case. 4 Milk withdrawal during antibiotic treatment.

67
Figure 2-2 Bar charts depicting the proportion of variance in the total cost of clinical mastitis accounted for by each variable for each of the treatment protocols in a model designed to simulate the cost of a case of clinical mastitis 13 days of antibiotic intramammary treatment; 25 days of antibiotic intramammary treatment; 33 days of intramammary and systemic antibiotic; 43 days intramammary and systemic antibiotic plus 1 day NSAID; 55 days intramammary and systemic antibiotic; 6Proportion of variance in the total cost of CM; 7Including the effect of systemic illness, parity, days in milk, repeat case and somatic cell count at time of case; 8Milk withdrawal during treatment.
0.000.100.200.300.400.500.600.70
Pro
po
rtio
n6
Treatment 11
0.000.100.200.300.400.500.600.70
Pro
po
rtio
n6
Treatment 22
0.000.100.200.300.400.500.600.70
Pro
po
rtio
n6
Treatment 33
0.000.100.200.300.400.500.600.70
Pro
po
rtio
n6 Treatment 44
0.000.100.200.300.400.500.600.70
Pro
po
rtio
n6
Treatment 55

68
Table 2-4 Breakdown of average (median) costs (£) associated with a case of clinical mastitis (CM) for each treatment protocol as predicted by a model designed to simulate the cost of a case of clinical mastitis (2.5th and 97.5th percentiles given in parenthesis).
Antimicrobial treatment regimen
Treatment 1 Treatment 2 Treatment 3 Treatment 4 Treatment 5
Average proportion of total cost (%)
Yield loss 44 41 41 39 38
Culling 22 20 20 19 19
Milk discard 23 27 20 20 23
Medicines 3 5 15 18 15
Labour 3 4 3 3 4
Cost (£) of original CM case (including flare-ups) 229
(132; 353)
250
(144; 378)
256
(158; 382)
271
(169; 398)
278
(170; 412)
Median number of herd mates infected due to transmission 0.61
(0.03;2.02)
0.48
(0.02;1.65)
0.49
(0.02;1.64)
0.46
(0.02;1.61)
0.38
(0.02;1.38)
Cost (£) of transmission 132
(47; 471)
120
(47; 421)
125
(48; 425)
123
(51; 424)
105
(46; 363)
Total cost (£) 361
(179; 824)
370
(192;799)
380
(206; 806)
394
(216; 775)
383
(216;775)
Treatment 1 = 3 days of antibiotic intramammary treatment; treatment 2 = 5 days of antibiotic intramammary treatment; treatment 3 = 3 days of intramammary and
systemic antibiotic treatment; treatment 4 = 3 days intramammary and systemic antibiotic treatment plus 1 day NSAID; treatment 5 = 5 days intramammary and systemic
antibiotic treatment
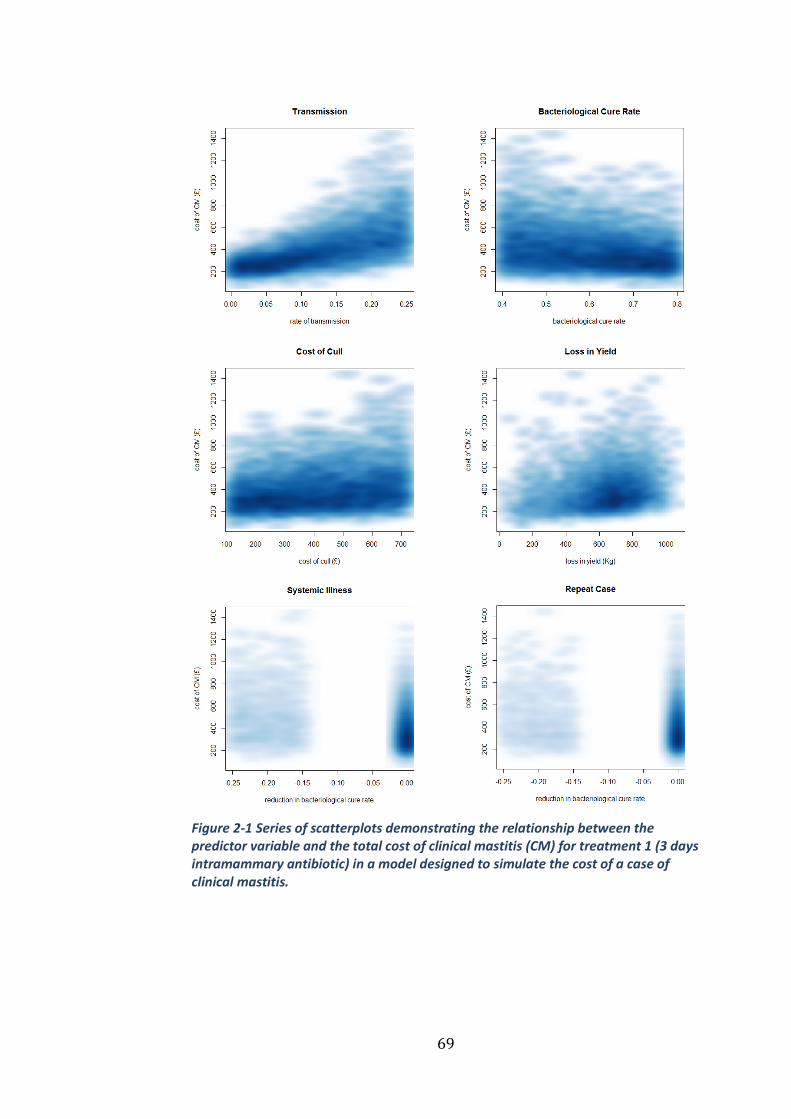
69
Figure 2-1 Series of scatterplots demonstrating the relationship between the predictor variable and the total cost of clinical mastitis (CM) for treatment 1 (3 days intramammary antibiotic) in a model designed to simulate the cost of a case of clinical mastitis.

70
Figure 2-4 Tornado plot to demonstrate the predicted effect of a given change in one of the predictor variables on the total cost of clinical mastitis when all of the others remain constant. Treatment 1 = three days of intramammary antibiotic treatment. Transmission refers to the risk of transmission over a 14 day period
Discussion 2.4
The results suggest that the risk of transmission of infection has the
greatest influence on the cost of a case of CM and this appeared to be the
case by a wide margin. Indeed, a relatively small increase in the rate of
transmission was associated with a large increase in cost (Figure 2-4) and
this is consistent with a study by Halasa (2012) who reported that the
total annual net cost of intramammary infection (IMI) was highly
sensitive to the transmission rate of Staph. aureus.
-10% 10% 30% 50%
Percentage change in the total cost of CM
Treatment 1
Transmission from 0.126 to0.2448Cost of a cull from £420 to £702
Systemic Illness
Bacteriological cure rate from%70 to %80Total loss in yield from 633Kg to923KgRepeat case
Heifer
Cost of milk production from6.5ppl to 9.9pplMilk price from 25ppl to 27ppl
Milk withdrawal increased by 2daysGreater than 60 days in milk
SCC > 500,000 cells/ml
Cost of labour from £8.52/hr to£15.48/hr
71
The potential for transmission of IMI between cows is well established
(Barkema et al., 2009) and yet despite this, relatively few studies exist
that seek to quantify this phenomenon (Lam et al., 1996a; Zadoks et al.,
2002, 2001). The transmission data from these studies has been used to
inform some economic (Swinkels et al., 2005a,b; van den Borne et al.,
2010) and epidemiological studies (Barlow et al., 2009) but these were all
set in the context of treatment of subclinical mastitis. One study that did
include transmission in a discrete-event model investigating the cost of
pathogen-specific IMI in a herd of 100 dairy cows found that the total net
cost was most sensitive to the transmission rate parameter (Halasa et al.,
2009). A limitation of previous research on ‘pathogen-specific’
transmission rates is that the rate is likely to vary considerably between
different strains of the ‘same’ pathogen. The advantage of using PSA, is
that a single distribution could be used to encompass many different
plausible rates (based on literature) and the importance of this parameter
could be investigated without the need to make assumptions as to how a
particular pathogen may or may not behave. Therefore, the variation in
the transmission rate parameter in this study effectively takes into
account known variation in pathogen and strain of bacteria. Whilst the
use of uniform distributions means that no assessment is made as to
which scenario is more or less likely and therefore which transmission
value is most common, their use does mean that the relative importance
of the different transmission values affecting the cost of CM can be
robustly assessed across a wide range of plausible situations.

72
In the model described in this study, cows that cured bacteriologically
following treatment could go on to either finish the lactation or be culled,
and at no point could they transmit infection to other cows. Cows that
remained subclinically infected could either end the lactation, be culled,
or experience a repeat case of CM; during this time, they were considered
‘eligible’ to transmit infection whichever route they followed. Whilst this
may represent a simplification of the biological reality, it is probably these
subclinically infected cows that represent the major reservoir of
contagious pathogens and the way in which those cows are managed
could have a significant impact on the degree of between cow
transmission and hence the cost of mastitis.
Transmission of contagious mastitis pathogens mainly occurs during
milking (Fox and Gay, 1993) and measures aimed at reducing
transmission therefore tend to focus on the milking process, the
management of the cows at milking and the milking machine itself. A
recent systematic review of the effect of udder health management
practices on herd SCC highlighted the importance of wearing gloves
whilst milking, the use of (well-adjusted) automatic cluster removal,
application of post-milking teat disinfection, milking cows with CM or a
high SCC last and the annual inspection of the milking machine (Dufour et
al., 2011). Whilst such studies measuring association are not strong
evidence of causality, they do highlight practices that are likely to help
minimise the transmission of IMI and appear to be relatively well adopted
by dairy farmers (Rodrigues et al., 2005; Olde Riekerink et al., 2010). The

73
segregation of infected cows represents a challenge for many producers
both logistically and diagnostically, because creating an additional group
may add to space and time pressures and a certain amount of expenditure
and effort will be required to diagnose infected cows. Despite this, it
would seem logical that keeping infectious cows separate to susceptible
individuals should reduce spread and there is evidence to support this in
the literature (Wilson et al., 1995; Middleton et al., 2001; Zecconi et al.,
2003). A possible alternative to segregation is back-flushing the milking
unit to prevent uninfected cows from being exposed to contaminated
milking units from infectious cows (Keefe, 2012) and there is some
evidence of its efficacy (Hogan et al., 1984; T. W. Smith et al., 1985).
Whilst this may represent a significant investment to install, it may offer a
pragmatic solution on farms for which in-parlour transmission appears to
be a problem but for whom segregation is not a viable option.
The role of the milking machine in transmission of mastitis should not be
ignored despite advancements aimed at reducing its involvement. It is
considered to account for up to 20% of new IMI’s in some herds although
it is probably closer to around 10% in most ‘average’ herds provided the
machine is appropriately configured (Mein, 2012). To minimise the risk of
pathogen spread via the milking machine, it should be inspected at least
annually (Dufour et al., 2011) which is especially pertinent given that
61% of UK parlours in one study (Berry et al., 2005) failed their annual
test.
74
The measuring and hence monitoring of transmission remains
challenging at present and has typically been estimated using SCC trends,
CM incidence data and bacteriology (Barkema et al., 2009). Molecular
epidemiological techniques (Zadoks and Schukken, 2006) are required to
measure how much transmission is occurring, and these are not currently
widely available in the commercial setting. This is however likely to
change with advances in technology, and thus the ability to accurately
quantify and monitor the degree of transmission in dairy herds should
improve.
After transmission, the most important factors influencing the cost of CM
were bacteriological cure rate, cost of a cull and loss in yield. This is
consistent with other studies (Halasa, 2012; Heikkilä et al., 2012; Huijps
et al., 2008). Van den Borne et al. (2010) also reported that cost of
mastitis was sensitive to the bacteriological cure rate, with higher cure
rates resulting in reduced costs due to mastitis when modelling the effect
of lactational treatment of subclinical IMI’s. Barlow et al. (2009) found
that increasing the cure rate of subclinical IMI’s was beneficial at some
levels of transmission, but when transmission was high, it could be
counterproductive, as it resulted in more uninfected cows (quarters)
being available to be re-infected.
In the model used in this study, bacteriological cure rate was structured
to be affected by cow factors such as parity, somatic cell count at the time
of infection, systemic illness, case number and days in milk as described
by Steeneveld et al. (2011). However, we used probability distributions
75
rather than point estimates for the cow factors and this resulted in a
highly variable set of possible values for bacteriological cure rate, which
we believe reflects real potential situations. As expected, factors that
affect the probability of bacteriological cure had an important influence
on the cost of CM, although more research would be useful to determine
the real degree of variation in these values in the field and the reasons for
such variation. The other parameters in the model such as milk price,
length of milk withdrawal and the cost of labour proved to be of lesser
significance to the cost of CM. Interestingly, the cost of medicines was
found to have little bearing on the overall cost of a case of CM (Table 2-3).
In this study, the probability distributions used for the bacteriological
cure rate reflected a greater degree of uncertainty associated with the
least aggressive protocol (treatment 1) and an increased chance of cure
for the more aggressive treatment protocols overall (Table 2-1). There
was a large degree of overlap in the bacteriological cure rates for the
different treatment protocols, and the same was true of the model outputs
(Table 2-4) which showed that the overall cost of CM was very similar
despite the treatment protocol selected. The relationship between the
bacteriological cure rate and the cost of CM was variable which was likely
to be a result of the increased width of the distribution used for treatment
protocol 1 relative to the other treatment protocols. The median total
costs (Table 2-4) were higher than most figures quoted in the literature as
they included the costs incurred by any transmission that happened as a
result of the case of CM which most other figures do not. So, rather than
76
representing the cost of a case of CM, it may be more appropriate to think
of the values for total cost in Table 2-4 in terms of the ‘room for
investment’ in preventing a case of CM. The median costs without taking
into account transmission were higher than the equivalent figures quoted
by Steeneveld et al. (2011), but these do not necessarily represent an
‘average’ cost for mastitis because with the use of uniform distributions in
this study, the aim was to fully explore causes of variation in cost rather
than averages. Treatment 1 (3 days intramammary antibiotic) resulted in
the lowest median cost, as was found by Steeneveld et al. (2011), but also
had the broadest range, which is intuitive given the increased risk of
transmission, subclinical infection and culling associated with a reduced
bacteriological cure rate. Therefore, and importantly, the treatment
protocol selected appears to be much less important than other factors
such as transmission. Steeneveld et al. (2011) hypothesised that the
inclusion of transmission would favour the intensive antibiotic treatment
regimens, and there was some evidence to support this hypothesis in the
results from our model, with the most aggressive treatment protocol
(treatment 5) being less highly correlated to the rate of transmission than
the other protocols (Table 2-3) and resulting in fewer cows becoming
infected due to transmission (Table 2-4). The increased bacteriological
cure rate associated with treatment 5 was based on expert opinion rather
than specific studies, but if intensive antibiotic treatment protocols were
indeed found to reduce transmission, then our model would indicate that
the potential economic benefits could be far greater than simply those
77
associated with the individual cow. More data on expected cure rates
would be needed to improve our understanding of this aspect.
The use of modelling in economic evaluations is now widespread in the
health-care sector as it enables the investigation of the likely range of
outcomes (cost-effectiveness) under different assumptions even when the
exact magnitude of key variables is unknown (Buxton et al., 1997). PSA
has become the state-of-the-art method for determining the uncertainty
in the outcomes of cost-effectiveness studies because of the uncertainty in
input parameters (Boshuizen and van Baal, 2009). There are concerns
that the use of deterministic or univariate sensitivity analysis may
underestimate overall uncertainty (Briggs, 2000) and become difficult to
interpret with large numbers of parameters especially if any are
correlated (Claxton et al., 2005). Such limitations with other forms of
sensitivity analysis have led to the development of PSA based on Monte
Carlo simulation methods (O’Brien et al., 1994). PSA permits the analyst
to examine the effect of joint uncertainty in the variables of an analysis
without resorting to the wide range of results generated by extreme
scenario analysis (Briggs and Gray, 1999). Parameter correlation is
propagated automatically providing meaningful sensitivity analysis
regardless of parameter correlation (Ades et al., 2006a). Given that the
literature is often quite sparse concerning many of the model inputs
required, assumptions are usually necessary for this kind of model and
this can result in unreliable conclusions being drawn if this uncertainty is
not properly investigated. By using PSA we can reflect the level of
78
uncertainty by defining the parameters as distributions that are specified
and transparent. The distributions used do require a degree of judgement
and this has to be carried out in an open and transparent way and based
on current literature where possible.
Our model calculated transmission over a limited period of 12 weeks, a
constraint primarily due to increasing model complexity. The amount of
time that a cow remains infective following an IMI is dependent on many
different factors, and, hence extremely variable. The duration of non-
agalactiae streptococcal infections may range from 1 day up to 1 lactation
(Todhunter et al., 1995; Zadoks et al., 2003), with a median of 42 days
(Zadoks et al., 2003). For Staph. aureus, the average length of infectivity
was found to be 115 days for herds practicing post-milking teat
disinfection (Lam et al., 1997). Given these findings, the 12 week period
that we used could have resulted in an under-estimation of the effect of
transmission.
Conclusions 2.5
The rate of transmission was found to be by far the most influential
parameter in a PSA investigating the factors affecting the cost of CM at the
individual cow level. This was followed by bacteriological cure rate, cost
of culling and loss of yield. The results from this study suggest that more
emphasis should be placed on the reduction in the risk of transmission in
dairy herds when seeking to minimise the economic impact of CM.

79
Chapter 3
The cost-effectiveness of an on-
farm culture approach compared
with a standard approach for the
treatment of clinical mastitis in
dairy cows
Introduction 3.1
Not only is mastitis important in terms of the economics, as reported in
Chapter 2, but the treatment and prevention of mastitis is widely reported
as the most common reason for antimicrobial drug use on dairy farms
(González et al., 2010; Pol and Ruegg, 2007; Thomson et al., 2008). There
is increasing pressure on the agricultural sector to reduce antimicrobial
drug usage due to fears over antimicrobial resistance (AMR) (O’Neill,
2015), and the way in which antimicrobial drugs are applied with respect
to the treatment of mastitis is, therefore, a sensible target. Conventionally,
all cases of clinical mastitis would receive a course of antimicrobial agents
but an alternative approach is the selective treatment of cases according
to the results of an on-farm culture (OFC) system. With the OFC system,
only cases that yield a Gram-positive or mixed culture are treated with
antimicrobial drugs, resulting in many cases of clinical mastitis not being
treated at all (Lago et al., 2011a). This was demonstrated recently in a
study performed in 8 herds based in Minnesota, Wisconsin and Ontario,
80
which reported that 51% of cows enrolled in the OFC group received
antimicrobial drugs as opposed to 100% of the cows enrolled in the
conventional group. The same study reported no statistical differences
between the two groups with respect to the bacteriological cure risk, the
time taken to clinical cure, new intramammary infection risk, treatment
failure risk or risk of removal from the herd within 21 days (Lago et al.,
2011a).
Whilst OFC appears to be effective at reducing antimicrobial drug usage
(Hess et al., 2003; Lago et al., 2011a; Neeser et al., 2006), little is known
about factors influencing the overall cost-effectiveness of this approach
and, therefore, the types of herds in which it is most likely to be cost-
effective. The purpose of this chapter was to use probabilistic sensitivity
analysis (PSA, see 1.3.2) to investigate the main factors that influence the
cost-effectiveness of an OFC approach to treating clinical mastitis. The
model used was an adaptation of the one reported in Chapter 2 with the
addition of OFC-specific parameters based on previous research (Lago et
al., 2011a). A specific aim was to identify the herd circumstances under
which an OFC approach would be most likely to be cost-effective.
Materials and methods 3.2
Model structure 3.2.1
A stochastic Monte Carlo model was developed using OpenBUGS 3.2.2
software (Thomas et al., 2006). The model was used to simulate a case of
clinical mastitis at the cow level and to calculate the associated costs

81
simultaneously when treated according to 2 different treatment
protocols; i) a standard approach (3 tubes of intramammary antibiotic)
and ii) an OFC programme as described by Lago et al. (2011a). The
general model structure and assumptions were consistent irrespective of
the treatment protocol applied, and was as described in Chapter 2 (Figure
2-1). An initial case of clinical mastitis (CM1) could either: i) cure
bacteriologically, ii) cure clinically but remain subclinically infected, or iii)
fail to cure (either clinically or bacteriologically). If CM1 failed to cure,
then a repeat treatment (same as initial treatment) would be
administered, and the same 3 outcomes permitted. If CM1 cured
bacteriologically, then the cow could either end the lactation or be culled
before the end of lactation. If CM1 cured clinically but not
bacteriologically, then it could either end the lactation, be culled before
the end of lactation, or have a repeat episode of clinical mastitis (CM2).
CM2 would be treated according to the same protocol as CM1 and would
then follow the same possible outcomes as CM1. A third clinical
recurrence was permitted for subclinically infected cows (CM3) which
were again treated in the same way as CM1 and CM2. If the cow remained
subclinically infected after CM3 or failed to cure clinically, then the cow
would be culled before the end of lactation. If the cow cured
bacteriologically after CM3, then it could either finish the lactation or be
culled before the end of lactation (Figure 2-1).
A risk of transmission parameter was included from cows that remained
subclinically infected after CM1 and CM2. This represented the risk that
82
the infection was transmitted from the infected cow to one of the other 99
‘susceptible’ cows in the herd during a 12-week period. The 12-week
period was split into 14-day blocks meaning the infected cow could infect
another cow in the herd every 14-days. If infection did spread to another
cow, then it too would be considered to be infectious during the
subsequent 14-day blocks. For example, if a cow remained subclinically
infected after CM1 and it transmitted an infection to another cow during
the first 14-day block, then there would be 2 infectious cows at the start
of the second 14-day block and the susceptible population would then be
98 cows.
Model input parameters 3.2.2
The model was parameterized with distributions based on existing
literature and current commercial data where possible (Table 3-1). All
parameter inputs were specified as uniform distributions with the
purpose of simulating a wide variety of different scenarios without
making assumptions as to which was the most likely. The distribution
ranges were based on the literature wherever possible but if only point
estimates were available then plausible ranges were added around the
point estimate. The input parameters were the same as used in Chapter 2
with the addition of some OFC-specific parameters based on the study by
Lago et al. (2011a) (Table 3-2).
On-farm culture specific input parameters 3.2.3
The OFC-specific input parameters comprised distributions reflecting
changes to the bacteriological cure rate, the proportion of culture-positive
83
cases, the time taken to set-up and read the culture plates and the cost of
a plate. The distribution for the reduction in bacteriological cure rate
associated with the OFC protocol was uniform (-0.22-0), meaning the
maximum reduction possible was 22% and the minimum was 0. This
possible reduction in bacteriological cure rate arises because of the delay
in treatment when using the OFC system. The middle value of 11% was
the non-significant effect size reported by Lago et al. (2011a) which was
the overall reduction in bacteriological cure rate in cases of clinical
mastitis treated with the OFC protocol compared to cases treated with the
standard approach. The distribution specifying the ‘herd-level’
proportion of Gram-positive cases was uniform (0.1-0.9), meaning the
lowest proportion was 10% of cases with a Gram-positive culture and the
highest proportion was 90%. This distribution reflects the wide spread of
values identified in the study by Lago et al. (2011a). There were no
published figures for the cost of the biplate used in the study or the time
taken to set-up and evaluate the culture results so plausible ranges were
estimated as (£1.00-1.40) and (30-60 mins) respectively. The
distributions used for all other input parameters are listed in Table 3-1.

84
Table 3-1 Probability distributions applicable to both treatment protocols used in a model designed to simulate the cost of a case of clinical mastitis treated according to different treatment protocols
Input parameters Upper and lower limits of uniform
distribution Source
Probability of bacteriological cure (0.40,0.80) a Probability of bacteriological cure after extended treatment (0.30,0.90) Decrease in probability of bacteriological cure1
a a
Parity ≥2 (-0.15,-0.05)
Days in milk ≥60 days (-0.15,-0.05) Cow is systemically ill (-0.25,-0.15) SCC 200,000-500,000 cells/mL at most recent recording (-0.15,-0.05) SCC >500,000 cells/mL at most recent recording (-0.25,-0.15) Repeated case (>1st case in current lactation) (-0.25,-0.15) Probability of being culled for bacteriologically noncured cases a Initial case (0,0.32)
Following first recurrence (CM2) (0.04,0.36) Probability of being culled for completely cured cases a Initial case (0.04,0.06)
Following first recurrence (CM2) (0.10,0.20) Following second recurrence (CM3) (0.20,0.30) Probability of death for nonclinical cured cases (0.04,0.06) a Probability of drying-off quarter for nonclinical cured cases
(0.94,0.96) a
Probability of being culled for cows with dried off quarters (0.27,0.39) a Increase in all culling probabilities when cow is systemically ill
(0.05,0.15) a
Probability of clinical recurrence for bacteriologically noncured cases
(0.05,0.12) a
Probability of transmission after CM1 and CM2 (0.002,0.25) (Van den Borne,
2010) Proportional yield loss a Case in 1st or 2nd month of lactation (0.07,0.09)
Case between months 3 and 6 (0.03,0.08) Case after month 6 (0,0.04) Parity ≥2 (0,0.02) 305d Yield (Kg) (7000,10000) Author Milk withdrawal (d) (5.00,9.00) b Daily milk discard (Kg) (5.00,50,00) Author Value of discarded milk (£/Kg) (0.23,0.27) (DairyCo, 2012a) Cost of milk production (£/Kg) (0.03,0.10) c Treatment Time (hr) (0.53,0.87) a Cost of labour (£/hr) (1.00,15.87) c Cost of drugs (£) (5.58,6.97) d Cost of cull (£) (120,720) c; e Cost of death (£) (1200,2000) DairyCo 2012b 1 The value selected from this distribution was subtracted from the value selected from the bacteriological cure distribution a=based on Steeneveld et al. (2011) b= based on commonly used preparations in the UK c= based on Huijps et al. (2008) d= based on estimate of current retail price of commonly used preparations in the UK e= based on Kossaibati & Esslemont (2000)

85
Model simulation 3.2.4
The model was used to simulate 5000 cases of CM1 for each treatment
protocol. At each model iteration, a value was selected at random from
within the ranges specified for each input parameter, independent of each
other, and the associated costs calculated. The parameter values and
overall cost were stored for each model iteration and were used for
subsequent analysis. The difference in overall cost between the two
protocols was calculated at each model iteration by subtracting the cost of
the OFC approach from the cost of the standard approach. Therefore, a
positive value would indicate that the standard approach was more cost-
effective and a negative value would indicate that the OFC protocol was
more cost-effective. The distribution specifying the herd-level proportion
of Gram-positive cases would govern whether the case treated according
to the OFC protocol was Gram-positive (or mixed infection) and,
therefore, treated with antibiotics, or Gram-negative (or no growth) and,
therefore, not treated with antibiotics. In this way, the impact of the
proportion of Gram-positive cases on the overall cost-effectiveness of the
OFC protocol could be assessed.
Data analysis 3.2.5
Spearman rank correlation coefficients were calculated to explore the
univariable associations between model input parameters and the
difference in cost between the standard and OFC treatment protocols
(Table 3-2). The strength and direction of the relationships were
evaluated using the Spearman rank rho (ρ) value. The outcome variable of
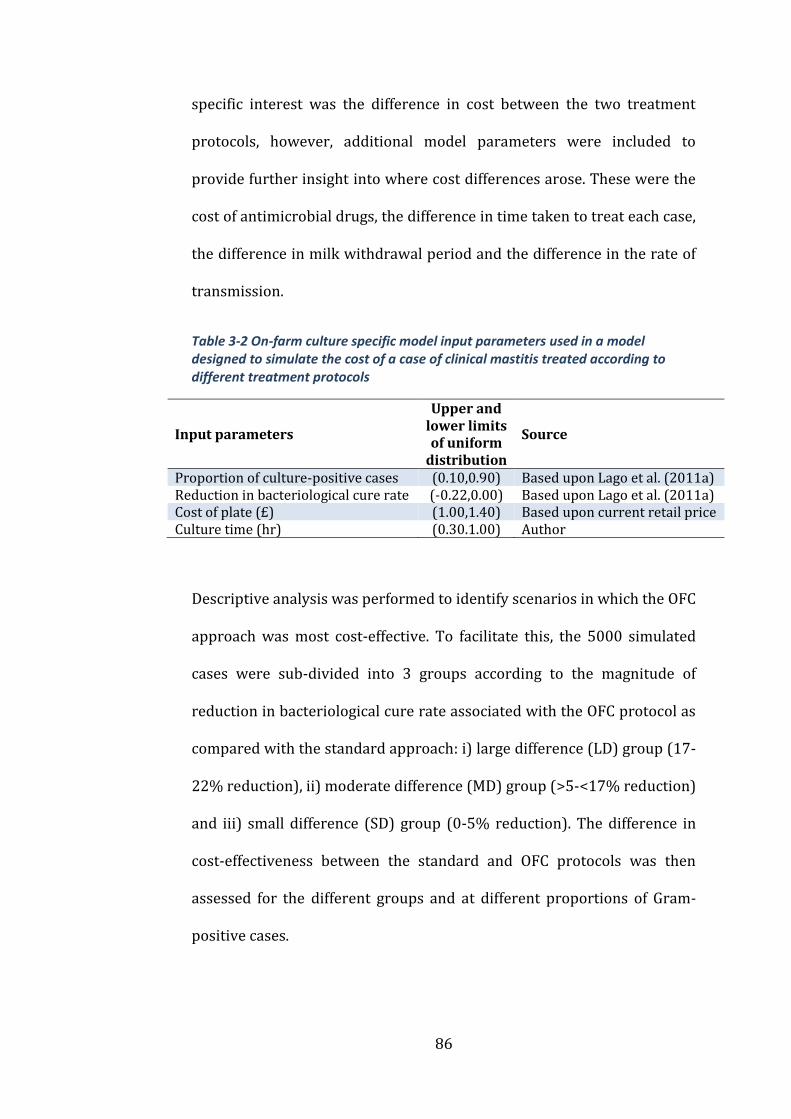
86
specific interest was the difference in cost between the two treatment
protocols, however, additional model parameters were included to
provide further insight into where cost differences arose. These were the
cost of antimicrobial drugs, the difference in time taken to treat each case,
the difference in milk withdrawal period and the difference in the rate of
transmission.
Table 3-2 On-farm culture specific model input parameters used in a model designed to simulate the cost of a case of clinical mastitis treated according to different treatment protocols
Input parameters
Upper and lower limits of uniform
distribution
Source
Proportion of culture-positive cases (0.10,0.90) Based upon Lago et al. (2011a) Reduction in bacteriological cure rate (-0.22,0.00) Based upon Lago et al. (2011a) Cost of plate (£) (1.00,1.40) Based upon current retail price Culture time (hr) (0.30.1.00) Author
Descriptive analysis was performed to identify scenarios in which the OFC
approach was most cost-effective. To facilitate this, the 5000 simulated
cases were sub-divided into 3 groups according to the magnitude of
reduction in bacteriological cure rate associated with the OFC protocol as
compared with the standard approach: i) large difference (LD) group (17-
22% reduction), ii) moderate difference (MD) group (>5-<17% reduction)
and iii) small difference (SD) group (0-5% reduction). The difference in
cost-effectiveness between the standard and OFC protocols was then
assessed for the different groups and at different proportions of Gram-
positive cases.
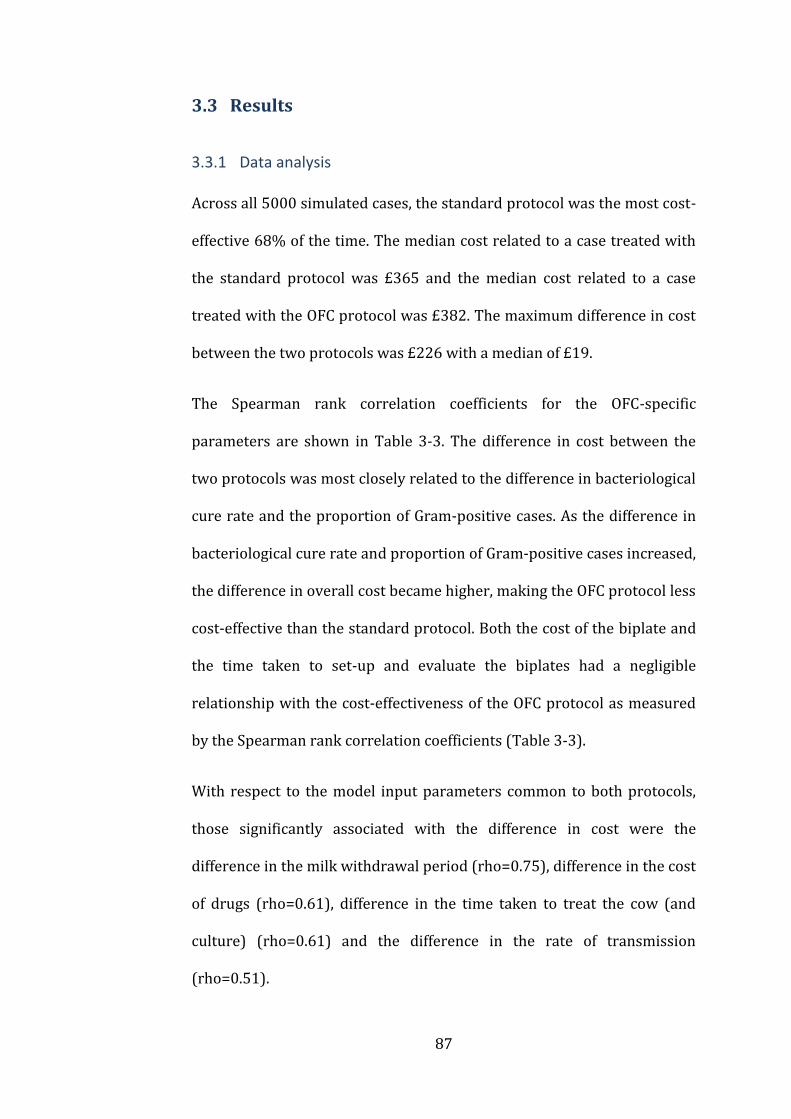
87
Results 3.3
Data analysis 3.3.1
Across all 5000 simulated cases, the standard protocol was the most cost-
effective 68% of the time. The median cost related to a case treated with
the standard protocol was £365 and the median cost related to a case
treated with the OFC protocol was £382. The maximum difference in cost
between the two protocols was £226 with a median of £19.
The Spearman rank correlation coefficients for the OFC-specific
parameters are shown in Table 3-3. The difference in cost between the
two protocols was most closely related to the difference in bacteriological
cure rate and the proportion of Gram-positive cases. As the difference in
bacteriological cure rate and proportion of Gram-positive cases increased,
the difference in overall cost became higher, making the OFC protocol less
cost-effective than the standard protocol. Both the cost of the biplate and
the time taken to set-up and evaluate the biplates had a negligible
relationship with the cost-effectiveness of the OFC protocol as measured
by the Spearman rank correlation coefficients (Table 3-3).
With respect to the model input parameters common to both protocols,
those significantly associated with the difference in cost were the
difference in the milk withdrawal period (rho=0.75), difference in the cost
of drugs (rho=0.61), difference in the time taken to treat the cow (and
culture) (rho=0.61) and the difference in the rate of transmission
(rho=0.51).

88
Table 3-3 Spearman rank correlation coefficients for on-farm specific model input parameters in a model designed to simulate the cost of a case of clinical mastitis treated according to different treatment protocols
Parameter rho
Proportion culture-positive 0.31 Difference in bacteriological cure rate -0.28 Cost of plate 0.0062 Culture time 0.02
Scenario and sensitivity analysis 3.3.2
The median difference in cost between the two protocols was plotted
against the proportion of Gram-positive cases and this indicated that the
proportion of Gram-positive cases would need to be less than 12% for the
OFC protocol to be more cost-effective than the standard protocol (Figure
3-1). When the proportion of Gram-positive cases increased to 50%, the
OFC protocol was on average £29 more expensive per case than the
standard protocol. However, the difference in cost between the treatment
groups was sensitive to the underlying bacteriological cure rate of Gram-
positive cases. When clinical mastitis was subdivided according to
whether the difference in bacteriological cure rate was small (SD)
medium (MD) or large (LD) the difference in the cost-effectiveness of the
treatments was as follows. The OFC protocol was more cost-effective than
the standard protocol when the proportion of Gram-positive cases was
less than 47% in the SD group (Figure 3-2) and less than 21% in the MD
group (Figure 3-3). The OFC protocol was never more cost-effective than
the standard protocol for cases in the LD group (Figure 3-4). Therefore,
the underlying bacteriological cure rate was a key parameter determining
relative cost-effectiveness of the treatment approaches.

89
Figure 3-1 Difference in cost between standard and OFC protocol (all scenarios) taken from a model designed to simulate the cost of a case of clinical mastitis treated according to different treatment protocols A positive value for difference
=standard protocol more cost-effective; a negative value = OFC protocol more cost-
effective.
Figure 3-2 Difference in cost between standard and OFC protocol (SD) taken from a model designed to simulate the cost of a case of clinical mastitis treated according to different treatment protocols A positive value for difference =standard protocol
more cost-effective; a negative value = OFC protocol more cost-effective. SD = 0-5%
reduction in bacteriological cure rate compared with standard protocol.
(0.1,0.2] (0.2,0.3] (0.3,0.4] (0.4,0.5] (0.5,0.6] (0.6,0.7] (0.7,0.8] (0.8,0.9]
Difference in cost between standard and OFC protocol
Proportion of Gram positive cases (0.1 = 10%)
Diffe
ren
ce
in
co
st (£
)
01
02
03
04
0
(0.1,0.2] (0.2,0.3] (0.3,0.4] (0.4,0.5] (0.5,0.6] (0.6,0.7] (0.7,0.8] (0.8,0.9]
Difference in cost between standard and OFC protocol (SD)
Proportion of Gram positive cases (0.1 = 10%)
Diffe
ren
ce
in
co
st (£
)
-20
-10
01
02
0
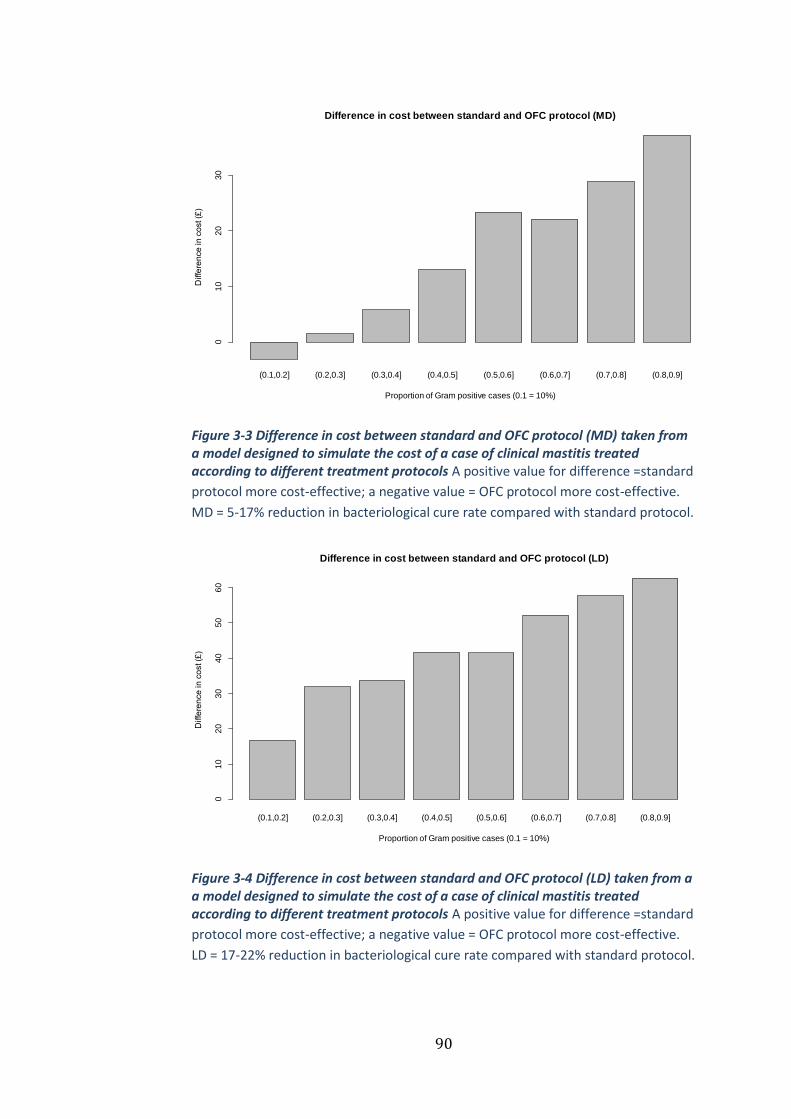
90
Figure 3-3 Difference in cost between standard and OFC protocol (MD) taken from a model designed to simulate the cost of a case of clinical mastitis treated according to different treatment protocols A positive value for difference =standard
protocol more cost-effective; a negative value = OFC protocol more cost-effective.
MD = 5-17% reduction in bacteriological cure rate compared with standard protocol.
Figure 3-4 Difference in cost between standard and OFC protocol (LD) taken from a a model designed to simulate the cost of a case of clinical mastitis treated according to different treatment protocols A positive value for difference =standard
protocol more cost-effective; a negative value = OFC protocol more cost-effective.
LD = 17-22% reduction in bacteriological cure rate compared with standard protocol.
(0.1,0.2] (0.2,0.3] (0.3,0.4] (0.4,0.5] (0.5,0.6] (0.6,0.7] (0.7,0.8] (0.8,0.9]
Difference in cost between standard and OFC protocol (MD)
Proportion of Gram positive cases (0.1 = 10%)
Diffe
ren
ce
in
co
st (£
)
01
02
03
0
(0.1,0.2] (0.2,0.3] (0.3,0.4] (0.4,0.5] (0.5,0.6] (0.6,0.7] (0.7,0.8] (0.8,0.9]
Difference in cost between standard and OFC protocol (LD)
Proportion of Gram positive cases (0.1 = 10%)
Diffe
ren
ce
in
co
st (£
)
01
02
03
04
05
06
0

91
Discussion 3.4
The simulation analyses revealed that both the difference in the
bacteriological cure rate due to a delay in treatment and the proportion of
Gram-positive cases that occur on a dairy unit will have a fundamental
impact on whether OFC will be cost-effective. There has undoubtedly
been a shift in the aetiology of clinical mastitis towards environmental
pathogens, with coliforms and no-growths frequently reported as
accounting for approximately 50% of all clinical mastitis culture results
(Bradley and Green, 2001b; Bradley et al., 2007b; Breen et al., 2009) as
was the case in the study by Lago et al. (2011a). On this basis, it would be
fair to assume that most dairy herds would expect to treat approximately
50% of clinical mastitis cases with antimicrobial drugs if utilizing an OFC
approach. The reduction in bacteriological cure rate associated with OFC
is more difficult to predict as there is very little published data on the
extent to which cure is reduced by a delay in treatment of mastitis.
However, a reduction of some degree is likely given the 24 hour delay in
initiating antimicrobial treatment for the Gram-positive cases and the
potential for Gram-positive cases to be incorrectly diagnosed as Gram-
negative and therefore not treated, as was the case in 14% of the cases
not treated with antibiotics in the study by Lago et al. (2011a). Given the
results from this research, further work to quantify the likely reduction in
bacteriological cure rate that will arise from this delay in treatment is
critical if the cost-effectiveness and welfare implications of OFC are to be
established.
92
One of the aims stated by the authors of the original OFC studies (Lago et
al., 2011a, 2011b) was to use their results to evaluate the overall cost-
benefit of using an OFC system, but to date, no data have been published.
The results of this study serve to illustrate that an OFC approach for the
treatment of clinical mastitis would probably not be cost-effective in
many circumstances, in particular, not those in which Gram-positive
pathogens represent more than 20% of all clinical cases. Since
Streptococcus uberis and Staphylococcus aureus remain common mastitis
pathogens on dairy units in many countries, the cost-effectiveness of OFC
should be carefully scrutinised in these circumstances.
Whilst OFC will reduce total antimicrobial drug usage on farm, the effect
on cow health and welfare and overall dairy farm profitability should be
considered. The assertion that there is no ‘significant’ reduction in
bacteriological cure from delayed treatment of Gram-positive pathogens
is fragile and requires substantially more research with sufficient power
to detect small differences in effect size. In the study by Lago et al.
(2011a), statistical analysis revealed a non-significant difference of 11%
in bacteriological cure risk between the standard and OFC groups. In that
study, the sample size used meant that a difference ≥14% would have
been needed between groups to detect the difference as being ‘significant’
(Lago et al., 2011a), and it therefore remains uncertain whether there is a
true difference in bacteriological cure between groups. The sensitivity
analysis in the current study suggests that a difference in cure rate of less

93
than 14% could certainly determine whether OFC is cost-effective, and
therefore, larger studies to ascertain this true difference are needed.
Significant differences were reported in the pathogen-specific
bacteriological cure rates in the study by Lago et al. (2011a), particularly
with respect to Klebsiella spp. and Staphylococcus aureus. Whilst the
reason for these differences is unknown, it is possible that the reduction
in bacteriological cure rate associated with OFC is a result of delayed
treatment, as was hypothesised by Lago et al. (2011a) and has been
reported in a previous study (Hillerton and Semmens, 1999). Given the
importance of this parameter, future research should include pathogen
specific differences in bacteriological cure rates when treatment is
delayed by using OFC.
In the current study, the overall proportion of Gram-positive cases was
also shown to be related to the likelihood of cost-effectiveness of an OFC
treatment programme. The proportion of Gram-positive cases was shown
to be highly variable in the study by Lago et al. (2011a), in which the
proportion of quarter cases receiving intramammary antibiotic treatment
as a consequence of assignment to the OFC protocol ranged from 31%-
89% in the 8 study herds. In the current study, the overall proportion of
Gram-positive cases had to be less than 12% (depending on
bacteriological cure rate) for OFC to be more cost-effective than the
standard protocol. By this measure, OFC would not have been cost-
effective in any of the herds in the study by Lago et al. (2011a). However,
when cases were grouped according to the difference in bacteriological

94
cure rate, OFC would be cost-effective when the proportion of Gram-
positive cases was less than 47% in the SD group and less than 21% in the
MD group. The OFC approach would, therefore, be most suitable for herds
in which Gram-negative pathogens are responsible for most clinical
mastitis and where the treatment of cows using an OFC approach results
in a minimal reduction in the bacteriological cure rate. In practice, it is
possible to assess the proportion of Gram-positive cases on a unit and this
will inform decision making on the likely cost benefit of OFC.
There may be a balance to be struck between reducing antimicrobial
usage and possible deleterious effects in terms of cow welfare and farm
finances; would the extra cost incurred by adopting an OFC approach be
considered a price worth paying if it results in a reduction in antibiotic
drug usage on dairy farms by 25%, as was estimated by Lago et al.
(2011a)? If, for societal reasons, this was considered to be a price worth
paying, there is also an issue of who should bear the cost. Whilst difficult,
it is perhaps time such debates became transparent given the increasing
pressure on antimicrobial drug usage and the potential risks posed by
antimicrobial resistant bacteria. In the absence of legal jurisdiction, it is
incumbent on those advising on animal health and welfare to ensure that
the adoption of new technologies, such as OFC, are undertaken in light of
comprehensive, transparent welfare and cost-effectiveness assessments.
Whilst the overall likelihood of cost-effectiveness was affected mostly by
the proportion of Gram-positive cases and the difference in
bacteriological cure rate, the parameters within the model that had the

95
largest impact on the difference in cost were the difference in milk-
withdrawal period, the difference in the cost of drugs, the difference in
culture and treatment time and the difference in rate of transmission.
Clearly, OFC would be expected to reduce the amount of milk withdrawn
from sale and the amount of money spent on drugs because a proportion
of the cows would not receive any antimicrobial treatment and would
therefore not incur any statutory milk withhold upon resolution of clinical
signs. This is in agreement with Lago et al. (2011a) who reported a
reduction in milk withdrawal period (5.2 days v 5.9 days) and quantity of
antimicrobial drug usage (51% of OFC cases treated v 100% of standard
cases treated) associated with OFC. The increase in labour required to
acquire milk samples from clinical mastitis cases in an aseptic manner
and plate out for culture is perhaps harder to assess and is likely to
represent a cost not only in terms of the time taken, but also the
opportunity cost incurred as a result of the herdsman being unable to
perform other duties as a result. The distribution used in this study of 30-
60 mins is, therefore, likely to be a realistic estimate for most
circumstances. The large impact that transmission could have on the cost
of a case of clinical mastitis has been reported in the previous chapter and
it is not surprising therefore that it was closely related to the difference in
cost between the standard and OFC approaches also. Whilst the risk
would clearly be influenced by herd management and pathogen-specific
factors, it could also be affected by any delay in treatment and differences
in bacteriological cure rate associated with OFC, resulting in an increased
96
risk of transmission. This again would need to be assessed at the herd
level.
There will inevitably be some unknown parameters in any cost-
effectiveness model (Buxton et al., 1997) and these parameters will have
a degree of uncertainty surrounding their true value. PSA permits the
incorporation of this parameter uncertainty which is subsequently
propagated through the model and is therefore reflected in the model
outputs. PSA is widely considered to be an implementation of Bayesian
statistics, because all parameters have a probability distribution, which is
a distinguishing feature of the Bayesian approach (Boshuizen and van
Baal, 2009; O’Hagan, 2003). One of the key advantages of the Bayesian
approach in medicine is that it removes the reliance upon significance
testing and the use of arbitrary thresholds of ‘significance’ (Greenland and
Poole, 2013; Gurrin et al., 2000) meaning the clinician is free to make
their own judgement as to what is clinically ‘significant’ according to the
degree of uncertainty with which they are comfortable. In this study, the
PSA allowed an evaluation of the parameters likely to be important in
determining the cost-effectiveness of the OFC approach and has
highlighted that more research is needed in this field before the technique
can be recommended on a widespread basis.
Conclusions 3.5
The results of this study indicate that the proportion of Gram-positive
cases and the difference in bacteriological cure rate between the two
treatment approaches has the greatest impact on the probability that an
97
OFC approach would be more cost-effective than a standard approach for
the treatment of clinical mastitis. The OFC approach appears to be
suitable for herds in which Gram-negative pathogens are responsible for
most clinical mastitis and where the treatment of cows according to the
results of an OFC approach results in minimal reductions in the
bacteriological cure rates. These results suggest that OFC will probably
not be cost-effective for many herds, and that OFC should, therefore, only
be adopted after careful consideration of the predominant pathogens
present in each herd and an honest discussion about the uncertainty
surrounding its overall cost-effectiveness.

98
Chapter 4
Current management practices
and interventions prioritised as
part of a nationwide mastitis
control plan
Introduction 4.1
Having highlighted the significant cost of mastitis in Chapter 2 and the
concerns about the quantity of antimicrobial drugs used to treat mastitis
in Chapter 3, the focus of the remainder of the thesis is on the control of
mastitis. All of the data reported and analysed in Chapters 4, 5 and 6
originated from UK dairy herds that have participated in the AHDB Dairy
Mastitis Control Plan (DMCP, see 1.2.4)
A variety of studies have considered on-farm management practices
relevant to mastitis control but there have been relatively few peer-
reviewed studies from the UK (Fenlon et al. 1995, Green et al. 2007b,
Green et al. 2008, Langford et al. 2009) and nothing as detailed as the
DMCP questionnaire which has 377 questions and observations all
relevant to mastitis control. A better appreciation of current management
practices would aid the understanding of why mastitis remains such a
problem on many UK dairy farms and provide useful insights into which
interventions are perceived to be most important for different types of
99
farms. The purposes of this chapter were to report performance and
management data taken from a sample of UK dairy farms that have
participated in the DMCP and to identify important mastitis prevention
practices that are not currently widely implemented. The frequency at
which these deficiencies in management were prioritised by the plan
deliverers was also reported to evaluate how important these
management practices were perceived to be.
Materials and methods 4.2
AHDB Dairy Mastitis Control Plan (DMCP) 4.2.1
As described in Section 1.2.4, the DMCP consists of 3 main stages; i)
analysis of the herd data to assess patterns of mastitis and categorisation
of each herd according to those patterns; ii) assessment of the current
farm management, and, based on deficiencies identified, prioritisation of
the most important management changes required; and, iii) frequent
monitoring of the farm data to assess the subsequent impact on CM and
SCC. During stage ii), the answers to the questionnaire and the ‘diagnosis’
made are entered into the ePlan software package. Once all of the
required information is entered, the programme identifies where the herd
differs from ‘best practice’ in terms of mastitis control, and highlights
specific interventions most relevant to the herd diagnosis. For example, a
lack of pre-milking teat disinfection would only be highlighted if the herd
had an Environmental Lactation (EL) diagnosis.
100
The plan deliverer would prioritise 5-10 of these interventions to be
implemented on the farm. A three level ranking system was used for the
interventions based on the strength of evidence from research, to assist
the plan deliverer in prioritising which interventions to focus on;
interventions supported by most evidence were made the priority for
action (DairyCo, 2014).
Farm selection 4.2.2
Participating farms were included in this study if the herd performance
data (e.g. SCC data and CM records) were available at the plan start date
in addition to the ePlan data (the answers to the questionnaire, the herd
diagnosis and the prioritised interventions).
Data collection 4.2.3
Herd performance data were submitted electronically by the plan
deliverer when each farm was enrolled on the DMCP. Plan deliverers
were contacted directly by the author and asked to send relevant ePlan
data.
Data analysis 4.2.4
The herd performance and ePlan data were imported into Microsoft
Access (Microsoft, 2010), checked and exported into Microsoft Excel
(Microsoft, 2010) for analysis. The herds were grouped accordingly for
analysis; EDP, EL, CDP/CL. The CDP/CL herds were grouped together due
to similarities in the epidemiology and low numbers of herds assigned
those contagious diagnoses.
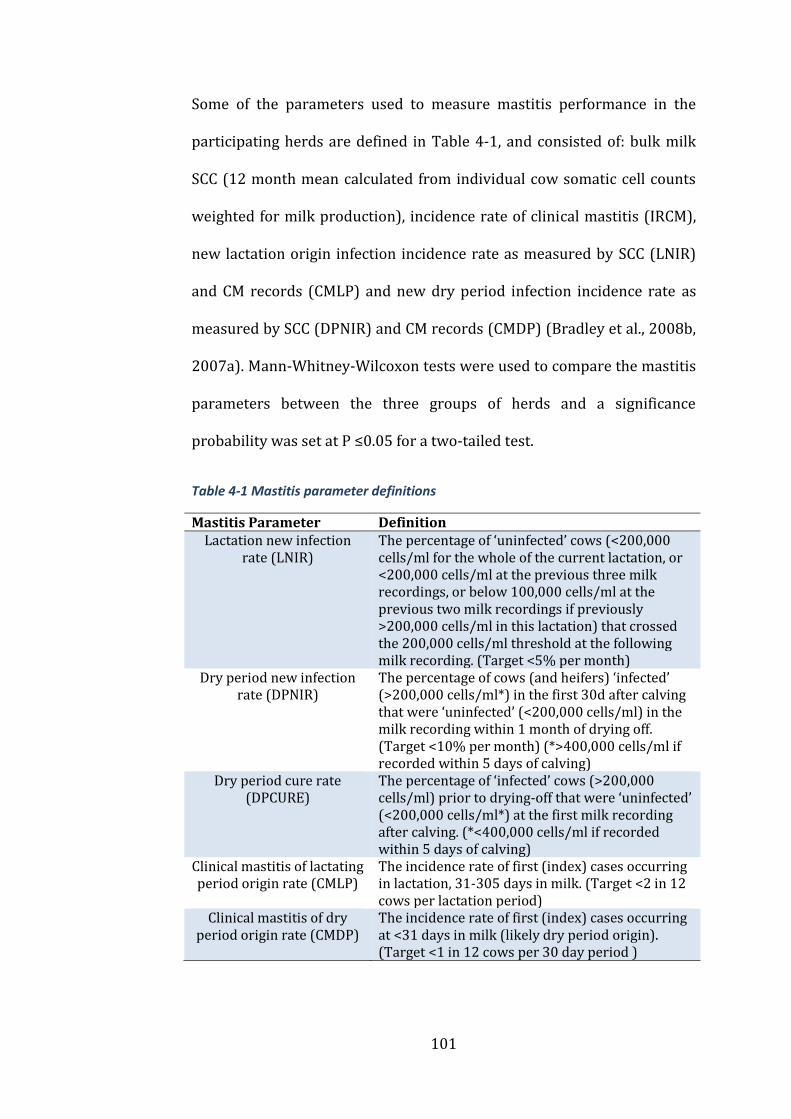
101
Some of the parameters used to measure mastitis performance in the
participating herds are defined in Table 4-1, and consisted of: bulk milk
SCC (12 month mean calculated from individual cow somatic cell counts
weighted for milk production), incidence rate of clinical mastitis (IRCM),
new lactation origin infection incidence rate as measured by SCC (LNIR)
and CM records (CMLP) and new dry period infection incidence rate as
measured by SCC (DPNIR) and CM records (CMDP) (Bradley et al., 2008b,
2007a). Mann-Whitney-Wilcoxon tests were used to compare the mastitis
parameters between the three groups of herds and a significance
probability was set at P ≤0.05 for a two-tailed test.
Table 4-1 Mastitis parameter definitions
Mastitis Parameter Definition Lactation new infection
rate (LNIR) The percentage of ‘uninfected’ cows (<200,000 cells/ml for the whole of the current lactation, or <200,000 cells/ml at the previous three milk recordings, or below 100,000 cells/ml at the previous two milk recordings if previously >200,000 cells/ml in this lactation) that crossed the 200,000 cells/ml threshold at the following milk recording. (Target <5% per month)
Dry period new infection rate (DPNIR)
The percentage of cows (and heifers) ‘infected’ (>200,000 cells/ml*) in the first 30d after calving that were ‘uninfected’ (<200,000 cells/ml) in the milk recording within 1 month of drying off. (Target <10% per month) (*>400,000 cells/ml if recorded within 5 days of calving)
Dry period cure rate (DPCURE)
The percentage of ‘infected’ cows (>200,000 cells/ml) prior to drying-off that were ‘uninfected’ (<200,000 cells/ml*) at the first milk recording after calving. (*<400,000 cells/ml if recorded within 5 days of calving)
Clinical mastitis of lactating period origin rate (CMLP)
The incidence rate of first (index) cases occurring in lactation, 31-305 days in milk. (Target <2 in 12 cows per lactation period)
Clinical mastitis of dry period origin rate (CMDP)
The incidence rate of first (index) cases occurring at <31 days in milk (likely dry period origin). (Target <1 in 12 cows per 30 day period )
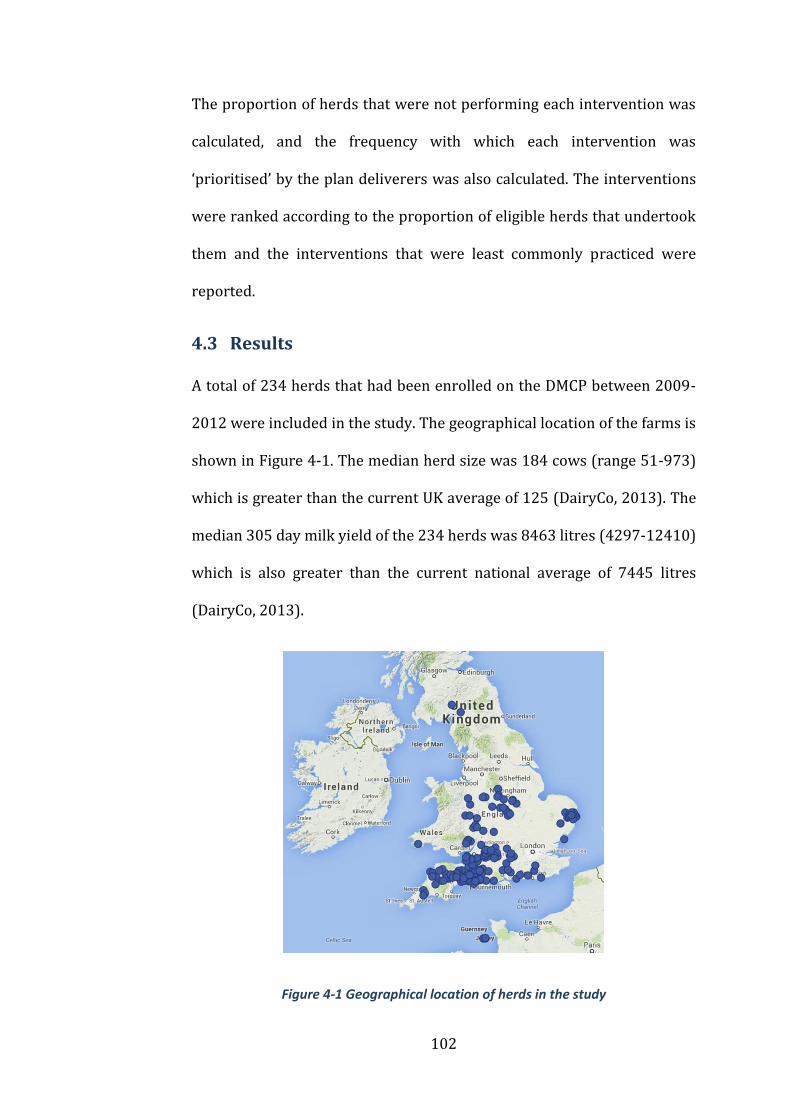
102
The proportion of herds that were not performing each intervention was
calculated, and the frequency with which each intervention was
‘prioritised’ by the plan deliverers was also calculated. The interventions
were ranked according to the proportion of eligible herds that undertook
them and the interventions that were least commonly practiced were
reported.
Results 4.3
A total of 234 herds that had been enrolled on the DMCP between 2009-
2012 were included in the study. The geographical location of the farms is
shown in Figure 4-1. The median herd size was 184 cows (range 51-973)
which is greater than the current UK average of 125 (DairyCo, 2013). The
median 305 day milk yield of the 234 herds was 8463 litres (4297-12410)
which is also greater than the current national average of 7445 litres
(DairyCo, 2013).
Figure 4-1 Geographical location of herds in the study
103
Mastitis parameters 4.3.1
Differences between the mastitis parameters for the different groups of
herds are shown in Table 4-2. The median bulk milk somatic cell count
(BMSCC) for all herds was 208,000 cells/ml (range 74,000-809,000
cells/ml) and the median incidence rate of clinical mastitis (IRCM) was 57
cases/100 cows/year (range 6-164). The incidence of new lactation origin
infections as measured by SCC (LNIR) and clinical mastitis records
(CMLP) was higher for the herds with a Contagious Lactation/Contagious
Dry Period and Environmental Lactation diagnosis than farms with an
Enviromental Dry Period diagnosis. The apparent cure rate during the dry
period as measured by SCC (DPCURE) was significantly higher in
Environmental Lactation herds than the Environmental Dry Period and
Contagious Lactation/Contagious Dry Period herds. The incidence of dry
period origin infections as measured by CM data (CMDP) was significantly
higher in the Environmnetal Dry Period herds than the herds with an
Environmental Lactation or Contagious Lactation/Contagious Dry Period
diagnosis (Table 4-2).
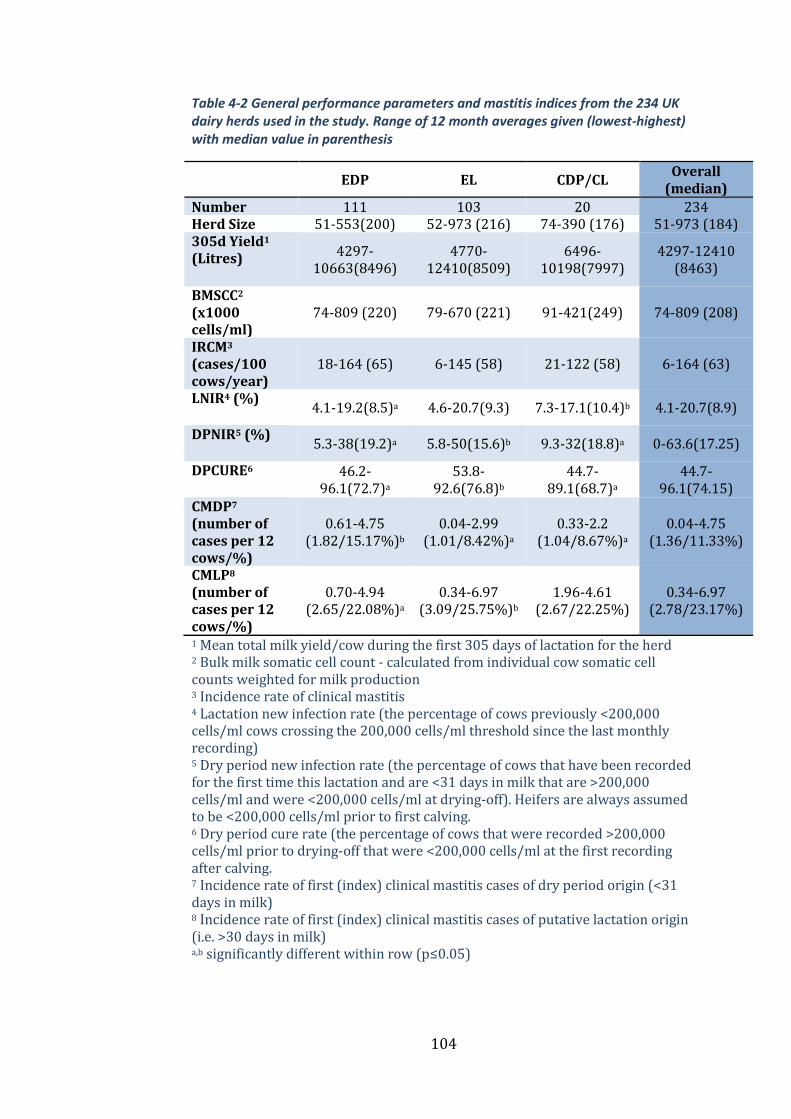
104
Table 4-2 General performance parameters and mastitis indices from the 234 UK dairy herds used in the study. Range of 12 month averages given (lowest-highest) with median value in parenthesis
EDP EL CDP/CL
Overall (median)
Number 111 103 20 234 Herd Size 51-553(200) 52-973 (216) 74-390 (176) 51-973 (184) 305d Yield1 (Litres) 4297-
10663(8496) 4770-
12410(8509) 6496-
10198(7997) 4297-12410
(8463)
BMSCC2 (x1000 cells/ml)
74-809 (220) 79-670 (221) 91-421(249) 74-809 (208)
IRCM3 (cases/100 cows/year)
18-164 (65) 6-145 (58) 21-122 (58) 6-164 (63)
LNIR4 (%) 4.1-19.2(8.5)a 4.6-20.7(9.3) 7.3-17.1(10.4)b 4.1-20.7(8.9)
DPNIR5 (%) 5.3-38(19.2)a 5.8-50(15.6)b 9.3-32(18.8)a 0-63.6(17.25)
DPCURE6 46.2-96.1(72.7)a
53.8-92.6(76.8)b
44.7-89.1(68.7)a
44.7-96.1(74.15)
CMDP7 (number of cases per 12 cows/%)
0.61-4.75 (1.82/15.17%)b
0.04-2.99 (1.01/8.42%)a
0.33-2.2 (1.04/8.67%)a
0.04-4.75 (1.36/11.33%)
CMLP8 (number of cases per 12 cows/%)
0.70-4.94 (2.65/22.08%)a
0.34-6.97 (3.09/25.75%)b
1.96-4.61 (2.67/22.25%)
0.34-6.97 (2.78/23.17%)
1 Mean total milk yield/cow during the first 305 days of lactation for the herd 2 Bulk milk somatic cell count - calculated from individual cow somatic cell counts weighted for milk production 3 Incidence rate of clinical mastitis 4 Lactation new infection rate (the percentage of cows previously <200,000 cells/ml cows crossing the 200,000 cells/ml threshold since the last monthly recording) 5 Dry period new infection rate (the percentage of cows that have been recorded for the first time this lactation and are <31 days in milk that are >200,000 cells/ml and were <200,000 cells/ml at drying-off). Heifers are always assumed to be <200,000 cells/ml prior to first calving. 6 Dry period cure rate (the percentage of cows that were recorded >200,000 cells/ml prior to drying-off that were <200,000 cells/ml at the first recording after calving. 7 Incidence rate of first (index) clinical mastitis cases of dry period origin (<31 days in milk) 8 Incidence rate of first (index) clinical mastitis cases of putative lactation origin (i.e. >30 days in milk) a,b significantly different within row (p≤0.05)
105
Herd Management Practices 4.3.2
The interventions that were most frequently found not to be undertaken
in herds with different diagnoses are displayed in Table 4-3. Only those
interventions relevant to each diagnosis were included in these results.
The frequency at which interventions were prioritised by the plan
deliverers is presented in Table 4-3. The number of interventions
prioritised on each farm ranged from 1-92, with a median of 22.
The three least commonly practiced interventions in the EDP herds were
the separation of heifers from dry cows prior to calving, allowing at least
4 weeks before returning dry cows to any one grazing, loafing or rest area
after it has been use by cattle and not allowing dry cows to have access to
any one lying area for more than 2 weeks. The three least commonly
practiced interventions in the EL herds were grouping cows with a high
SCC/CM separately and milking them last at each milking, using hot
disinfectant to clean clusters that become dirty during milking and
milking cows with a high SCC/CM last.

106
Table 4-3 Proportion of herds currently practising each intervention at the time of study, proportion of herds not practising each intervention that were prioritised by the plan deliverer and the proportion of herds not practising each intervention that were not prioritised by the plan deliverer (ranked in order of least commonly practiced).
EDP EL CDP/CL
Pregnant heifers kept separate to dry cows prior to calving
Cows with a high SCC/CM are grouped separately and milked last at each milking.
Hot disinfectant is used to clean clusters that become dirty during milking.
>4wks allowed before returning dry cows to any one grazing, loafing or rest area after it has been used by cattle
Hot disinfectant is used to clean clusters that become dirty during milking.
Cows with CM and high SCC milked last.
Dry cows don't have access to any one lying area for >2 continuous weeks
Cows with CM and high SCC are milked last.
Clusters washed with hot disinfectant after milking a cow with CM or a high SCC.
Cows calve in individual calving pens
Foremilking each quarter to detect mastitis.
Cows with a high SCC/CM grouped separately and milked last at each milking.
Dry cows spend <2wks on the same pasture, paddock or field
Cows with CM and high SCC are milked with a separate cluster.
Liners are changed at least every 2500 milkings or 6 monthly.
Alleyways, loafing and feed areas scraped at least twice daily (dry cows)
High SCC cows are clearly marked.
Cows are not dried-off during the milking process.
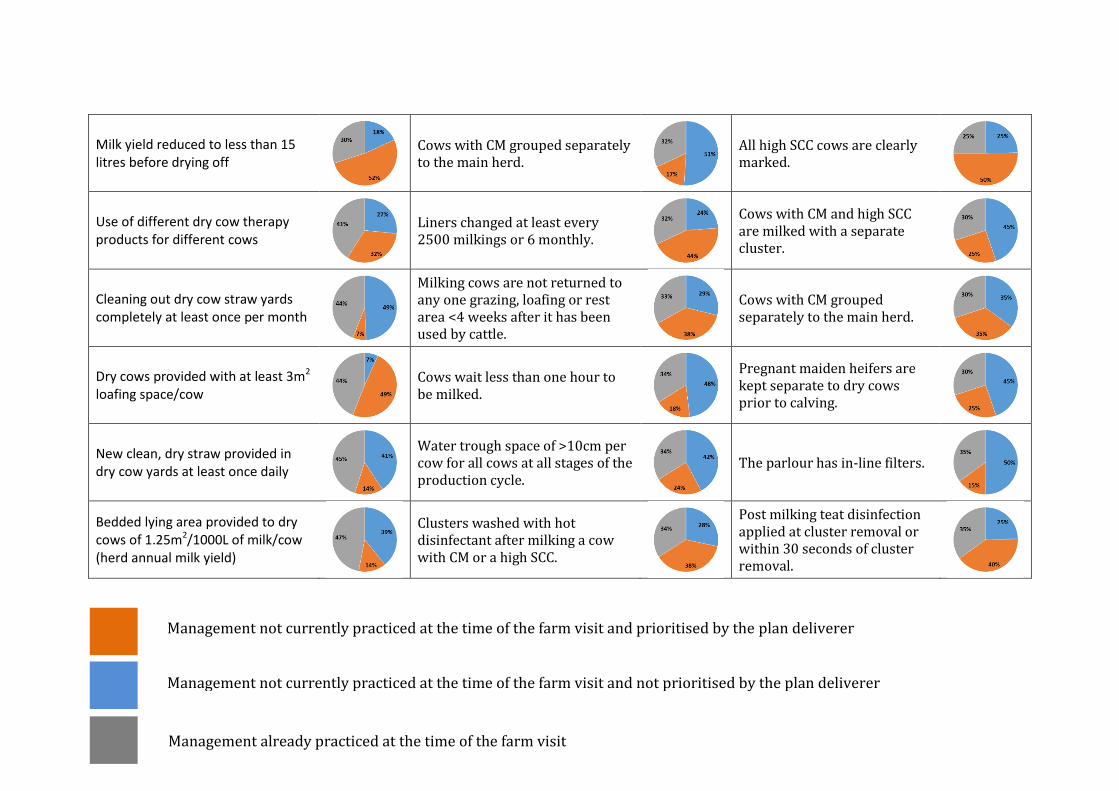
107
Milk yield reduced to less than 15 litres before drying off
Cows with CM grouped separately to the main herd.
All high SCC cows are clearly marked.
Use of different dry cow therapy products for different cows
Liners changed at least every 2500 milkings or 6 monthly.
Cows with CM and high SCC are milked with a separate cluster.
Cleaning out dry cow straw yards completely at least once per month
Milking cows are not returned to any one grazing, loafing or rest area <4 weeks after it has been used by cattle.
Cows with CM grouped separately to the main herd.
Dry cows provided with at least 3m2 loafing space/cow
Cows wait less than one hour to be milked.
Pregnant maiden heifers are kept separate to dry cows prior to calving.
New clean, dry straw provided in dry cow yards at least once daily
Water trough space of >10cm per cow for all cows at all stages of the production cycle.
The parlour has in-line filters.
Bedded lying area provided to dry cows of 1.25m2/1000L of milk/cow (herd annual milk yield)
Clusters washed with hot disinfectant after milking a cow with CM or a high SCC.
Post milking teat disinfection applied at cluster removal or within 30 seconds of cluster removal.
Management not currently practiced at the time of the farm visit and prioritised by the plan deliverer
Management not currently practiced at the time of the farm visit and not prioritised by the plan deliverer
Management already practiced at the time of the farm visit
108
Discussion 4.4
The results of this study show that many mastitis-related management
practices that are generally considered to be important were not widely
performed in a large sample of UK dairy herds. This is one of the most
comprehensive field studies of its kind and the first to group the herds
according to the putative origin of new mastitis cases. This grouping is
important as the most significant aspects of mastitis control for a CL herd
are very different than those for an EDP herd, and, therefore, by grouping
herds in this way, we are able to highlight the most relevant management
‘deficiencies’.
EDP herds 4.4.1
Management of the dry cow/calving cow accommodation to maximise
hygiene was an area of potential weakness highlighted in this study. Dry
cows had continual access to the same pasture/lying area for more than 2
weeks in over 80% of EDP herds and were allowed to return to paddocks
within 4 weeks of them being previously grazed in 85% of EDP herds. The
‘graze 2, rest 4’ strategy (i.e. graze the same paddock for no more than 2
continual weeks followed by at least a 4 week rest period) has been found
to be very effective at reducing the risk of CM in the first 30 days after
calving (Green et al., 2007b), and was commonly prioritised by the plan
deliverers in this study.
The size of the bedded lying area for dry cows was insufficient in over half
of the EDP herds in this study, despite research demonstrating the
importance of this with respect to SCC in the first 30 days of lactation

109
(Green et al., 2008). Other practices not undertaken by the majority of
EDP herds include adding fresh bedding to the dry cows daily and
scraping alleyways, loafing and feed areas twice daily which have been
associated with a reduced risk of CM in the first 30 days of lactation
(Green et al., 2007b). Each of these examples was highly prioritised by the
plan deliverers, reflecting the perceived importance associated with dry
cow environmental management for these herds.
Less than 20% of the EDP herds used individual calving pens, despite
evidence that they are associated with a reduced SCC and reduced
incidence of CM (Barnouin et al., 2004; Bartlett et al., 1992; O’Reilly et al.,
2006). This indicates that many cows are calving in the dry cow yards and
almost 60% of EDP herds were failing to completely clean-out these straw
yards on a monthly basis, which may result in increased CM (Peeler et al.,
2000). The use of individual calving pens and the cleaning-out of dry cow
yards were prioritised in 50% and 88% of cases respectively, once again
reflecting the importance of dry period hygiene, but also possibly
reflecting the practical difficulties that come with implementing
individual calving pens on some dairy farms.
Almost 60% of the EDP herds were not selecting dry cow therapy (DCT)
at cow-level in this study (DCT products selected according to the
infection status at drying-off), and this was made a priority in 45% of the
herds not doing so (Table 4-3). Whole-herd antibiotic DCT has been
recommended as part of the 5-point plan for several decades (Neave et al.,
1969), with the aim of curing existing IMI’s and preventing new IMI’s

110
during this time (Smith et al., 1966). There is, however, a growing body of
evidence showing potential advantages to selecting DCT at the cow-level
rather than the herd-level due to the impact on total antimicrobial usage
on-farm (Scherpenzeel et al., 2014), as well as a reduction in CM caused
by Gram-negative bacteria (Bradley et al., 2010) and a reduced overall
risk of CM in the first 30 days of lactation (Green et al., 2007b).
Less than 30% of EDP herds were reducing yields to below 15 litres prior
to drying-off, and this was only prioritised in 26% of cases suggesting that
other interventions were deemed more important for most EDP herds.
Increased yields at drying off have been associated with increased SCC
(Green et al., 2008) and IMI at calving (Dingwell et al., 2004; Odensten et
al., 2007; Rajala-Schultz et al., 2005), which is considered to be in-part as
a result of delayed formation of the keratin plug in the teat due to milk
leakage (Dingwell et al., 2004). Two strategies employed to reduce the
milk yield prior to drying-off include feed restriction and reduced milking
frequency (Bushe and Oliver, 1987), and, whilst both are effective, the
restriction of feed followed by abrupt cessation of milking was associated
with a reduced risk of IMI during the dry period (Tucker et al., 2009).
The vast majority (86%) of EDP herds mixed the heifers with the cows
prior to calving. However, several studies have demonstrated that the
mixing of maiden heifers and cows during the dry period is associated
with increased rates of CM (Barkema et al., 1999a) and increased SCC (De
Vliegher et al., 2004). Recent studies have also shown that heifers which
have a raised SCC at the first milk recording post-partum, are less

111
productive over the whole of their lifetime and have decreased longevity
(Archer et al., 2014a, 2013a; De Vliegher et al., 2005; Piepers et al., 2009),
and this is probably why it was made a priority for 64% of these herds.
EL herds 4.4.2
For herds with an EL diagnosis, key focus areas include the management
of the milking cows’ environment as well as the milking routine and
machine maintenance. The management of high SCC cows and those with
CM featured prominently, and were rarely housed separately to the main
herd in our study despite good evidence of the benefits of doing so
(Middleton et al., 2001; Wilson et al., 1995; Zecconi et al., 2003). Where
this is not possible, it is still preferable to milk these infected cows last,
but again this was not practiced in 83% of the EL herds, despite the
association with reductions in SCC (Barnouin et al., 2004; Hutton et al.,
1991; Wilson et al., 1995). If neither of these approaches is practical, then
a pragmatic solution may be to at least mark infected cows so they are
easily identifiable and milk them with a separate cluster, but these were
also poorly practiced despite evidence suggesting an association with
reduced SCC (Barnouin et al., 2004).
Another aspect of management relating to the hygiene of the milking
plant that was not widely practiced was the replacement of liners at the
appropriate interval. This highlights the value in the DMCP approach in
that it ensures that mastitis control measures that are often assumed to
be universally implemented are investigated and rectified when found to
be lacking.

112
The practice of foremilking was only carried out in approximately a
quarter of the EL herds in this study despite being a legal requirement
(European Commission, 2004). Foremilking is typically recommended to
detect CM, and is also a means of premilking stimulation (Wagner and
Ruegg, 2002). The application of foremilking is well established in
mastitis control programmes (Rodrigues et al., 2005) as it facilitates the
rapid detection of CM allowing for the prompt treatment and therefore
increased likelihood of successful outcomes (Hillerton and Semmens,
1999).
Two thirds of the EL herds were not following the ‘graze 2, rest 4’
principle as described previously, and the same number of herds were
allowing cows to wait for more than 1 hour to be milked. These aspects of
environmental management could both result in an increased exposure of
the cows teats to pathogens, in addition to the increased risk of lameness
caused by increased waiting times prior to milking (Espejo and Endres,
2007).
CDP/CL herds 4.4.3
Many of the management practices least implemented by the CDP/CL
herds were the same as for the EL herds, and focussed primarily on the
risk of transmission during the milking process, as would be expected.
Perhaps the most striking feature concerning these herds was how few of
them grouped or milked cows according to their infection status, or
replaced the liners at the correct interval, which for these herds is likely
to be of paramount importance. This was reflected in the high proportion
113
of such interventions that were prioritised by the plan deliverers for the
CDP/CL herds.
The majority of herds in this study (87%) were classified as having a
predominantly environmental pattern of disease, divided almost equally
between EDP and EL diagnoses. This was not unexpected, as it reflects the
national trend for the increased importance of the cows’ environment as a
source of intramammary infections relative to the contagious spread of
pathogens from cow to cow that were more common historically (Bradley
2002, Bradley et al., 2007a). Contagious pathogens are relatively well
controlled by the 5 point plan which was introduced in the 1960’s and
adopted widely by dairy farmers in the UK (Bradley, 2002).
Unfortunately, this strategy was not designed to control the
environmental routes of transmission, and so a more farm-specific
approach is required to identify risk factors and implement appropriate
interventions accordingly.
The importance of the dry period with respect to mastitis control has
been well documented (Bradley and Green, 2004), and it is known that a
significant proportion of CM cases occurring within the first 30 days after
calving will have been caused by infections acquired during the dry
period (Bradley and Green, 2000; Green et al., 2002). For herds where
these type of infections predominate, the impact that deficiencies in dry
cow management may have on udder health and productivity can be
profound, and should therefore be the focus of any mastitis control plan
(Green et al., 2007b). Approximately half of the herds in this study were

114
assigned a dry period origin diagnosis and as this is the first large scale
study to categorise herds in this way, it is not possible to say if this is
typical of the national population.
Whilst representing a relatively large sample of UK dairy herds for this
type of study, it is likely that the results are biased towards herds seeking
veterinary input with respect to mastitis control rather than being
representative of the national herd as a whole. However, this may provide
a true reflection of dairy herds seeking veterinary input with respect to
mastitis control, and therefore is of value to those involved in the delivery
of these services. The majority of the herds included in this study were
also based in the south-west of England (Figure 4-1) meaning that they
may not necessarily be representative of herds in Wales, Scotland and the
north of England.
The EDP herds had similar BMSCC and CM rates as the other herds in the
study but were characterised by a significantly higher rate of CMDP than
the other herds when the plan was first implemented as would be
expected. They also had a significantly higher rate of DPNIR than the EL
herds. Suggested targets for the rate of DPNIR and CMDP are 10% and 1
in 12 respectively, and the averages for the EDP herds in this study were
considerably higher than these.
Herds with an EL diagnosis had a similar BMSCC and CM rate to the other
herds in the study, but were characterised by significantly lower rates of
DPNIR and significantly higher DPCURE rates then the other herds as well

115
as a significantly higher rate of CMLP than the EDP herds. Suggested
targets for LNIR and CMLP are 5% and 2 in 12 respectively.
There were far fewer herds with a ‘contagious’ diagnosis in this study.
The CDP/CL herds were characterised by a lower average milk yield than
the other herds in the study and a higher BMSCC, which would be
expected due to the increased chronicity associated with IMI’s caused by
‘contagious’ pathogens (Bradley et al., 2007b). All other mastitis
parameters were broadly similar to the other herds in the study with the
exception of the dry period cure rate, which was the lowest of all the
groups reflecting the increased challenge of curing infections caused by
‘contagious pathogens’(Barkema et al., 2009).
The frequency with which the interventions reported in this study were
prioritised by the plan deliverers varied widely. When interventions were
not highly prioritised, this may reflect the presence of more pressing
concerns in those particular herds or perhaps a lack of perceived efficacy.
With a limited number of intervention studies from which to draw from, it
is very difficult to have much certainty about the efficacy of most mastitis
interventions at the individual herd level, and any uncertainty about the
clinical and financial benefit of an intervention will affect the decision to
implement it (Green et al., 2010; Huijps et al., 2010). Another reason why
mastitis interventions may not have been implemented is that vets may
sometimes make too many recommendations at once (Sorge et al., 2010),
or fail to ascertain the farmers own priorities before addressing their own
concerns (Derks et al., 2013). A useful continuation of this study would

116
be an investigation into what effect different management interventions
or combinations of interventions may have on the mastitis performance,
for different types of herd, thus facilitating an evidence-based approach to
decision making.
Conclusions 4.5
The results of this study provide data on performance and management of
UK dairy herds, grouped according to the main putative origin of new
cases of mastitis. Many aspects of management that might be considered
to be important in mastitis control were not being practiced by a large
proportion of these herds. A better understanding of those practices not
widely adopted by UK dairy farmers at present may aid practitioners in
identifying and overcoming potential barriers to improved mastitis
control in UK dairy herds.
117
Chapter 5
A Bayesian micro-simulation to
evaluate the cost-effectiveness of
specific interventions for mastitis
control during the dry period
Introduction 5.1
Having highlighted current management practices and identified specific
mastitis control interventions not widely practiced in Chapter 4, the
objective of the next two chapters was to explore the cost-effectiveness of
interventions that were implemented in herds during the study period.
This analysis was performed separately for ‘environmental dry period’
(EDP) herds in Chapter 5 and ‘environmental lactation’ (EL) herds in
Chapter 6.
The importance of the dry period with respect to mastitis control is now
well established (Bradley and Green, 2000, 2004), however the precise
interventions that reduce the risk of acquiring IMI during this time are
not clearly understood.
There exists a vast body of literature reporting associations between
various management practices and different measures of udder health e.g.
Dufour et al. (2011). A potential limitation with risk factor studies is that
they cannot always provide evidence of causation and so there remains a

118
large degree of uncertainty as to the likely impact that a specific
intervention has and therefore its overall cost-effectiveness. Intervention
studies can provide evidence of causation (Rubin, 2007; Martin, 2013),
but there are very few intervention studies that have sought to measure
the efficacy of specific mastitis control interventions within a cost-
effectiveness framework (Green et al., 2010). Furthermore, uncertainty
about the clinical and financial benefit of an intervention, will affect the
decision to implement it (Green et al., 2010; Huijps et al., 2010). If
potential interventions are to be prioritised in a rational and evidence-
based way, cost benefit analyses are required that capture the uncertainty
of the efficacy of interventions.
With limited resources available to a commercial dairy farm, it is
important that potential mastitis interventions are prioritised not only
according to their efficacy, but also on the likely return on investment.
The efficient use of available resources requires an understanding of the
opportunity costs whereby resources are allocated to fund one
intervention at the expense of the potential ‘benefits’ afforded by an
alternative intervention. This is the dilemma faced by veterinary decision
makers, and with many possible mastitis interventions making claims on
farm resources, it is necessary when deciding whether to employ
resources in one area to be able to compare the probability of a net
benefit in that area with all other potential areas where those resources
could be employed (Briggs and Gray, 1999).
119
The aim of this chapter was to investigate the cost-effectiveness of
mastitis control interventions to reduce IMI’s caused by ‘environmental’
pathogens during the dry period. An integrated Bayesian cost-
effectiveness framework (see 1.3.3) was used to construct a probabilistic
decision model that could be used to inform clinical decision making.
Materials and methods 5.2
Data collection 5.2.1
All of the data were collected from UK dairy herds that had participated in
the AHDB Dairy Mastitis Control Plan (DMCP, see 1.2.4) during 2009-
2012 that were assigned an EDP diagnosis. There were 265 plan
deliverers at the time of the study and each were asked to submit their
ePlan data, which consisted of the answers to the questionnaire, the
interventions prioritised and the herd ‘diagnosis’ for each of the farms
they had visited. They were also asked to submit the herd health and
performance data recorded on-farm, consisting of CM and SCC records,
herd size and milk production data, covering the 12 months prior to the
DMCP start date and the first 12 months from after the plan was
implemented. Out of the 265 plan deliverers, 87 plan deliverers had the
information and responded. From the 87 plan deliverers that responded,
ePlan data were received for a total of 452 herds that had participated in
the DMCP during 2009-2012. Complete herd health and performance data
were available for 290 of the 452 herds submitted. The 87 plan deliverers
that had responded were asked to specify the interventions that were
actually implemented on-farm over the 12 months after the initial herd

120
visit. The plan deliverers submitted this information for 212 out of the
290 herds for which complete data were available. From the 212 herds
with complete data, 77 herds were assigned an ‘EDP’ diagnosis and
therefore used in this study. All of this information was collated in a
Microsoft Access database (Microsoft Corp., Redmond, WA).
Data analysis 5.2.2
The clinical and subclinical mastitis data for each of the 77 herds were
initially checked for completeness and any herds with incomplete records
were excluded from the analysis; 73 herds out of the 77 had complete SCC
data and were used for the SCC analysis and 64 herds out of the 77 had
complete CM data and were therefore used for the CM analysis. In total,
data from all 77 herds was used as some herds had complete SCC data and
incomplete CM data and vice versa. The outcome of interest in this
research was mastitis originating from infections acquired during the dry
period as reflected by clinical mastitis and somatic cell count records.
Therefore to measure this, the incidence rate of clinical mastitis during
the first 30 days after calving (CMDP) was used (reported by DMCP
participants as the number of cases/12 cows/month) which has been
shown to be correlated to intramammary infections acquired during the
dry period (Bradley and Green, 2000; Green et al., 2002), and the monthly
percentage of cows that had a SCC < 200,000 cells/ml at the milk
recording prior to drying off, that were > 200,000 cells/ml at the first milk
recording after parturition (DPNIR), which has also been shown to be
121
indicative of new dry period intramammary infections (Bradley et al.,
2002; Cook et al., 2002; Bradley and Green, 2005).
Interventions that had been implemented on at least two farms were
identified and for each farm, categorised as 0 (not already implemented at
the time of the initial farm visit and not implemented following the
intervention visit), 1 (not already implemented at the time of the initial
farm visit but implemented following the DMCP) or 2 (already
implemented at the time of the initial farm visit or not applicable).
Interventions were classified as not applicable when they concerned an
area of management not relevant to a particular farm (e.g. management of
dry cow cubicles on a farm that used straw yards to house the dry cows).
Collinearity between covariates was assessed using Pearson product-
moment correlation coefficients, and no significant collinearity was found.
A Bayesian one-step micro-simulation model was constructed in
OpenBUGS version 3.2.2 (Lunn et al., 2009) separately for each of the two
outcomes, incorporating a multiple regression model and an onwards
cost-effectiveness micro-simulation, based on methods described
previously (Spiegelhalter et al., 2004) (Example WinBUGS code provided
in Appendix 2). Therefore the posterior distributions from the one-step
micro-simulation model incorporated uncertainty in all model
parameters (Figure 5-1).
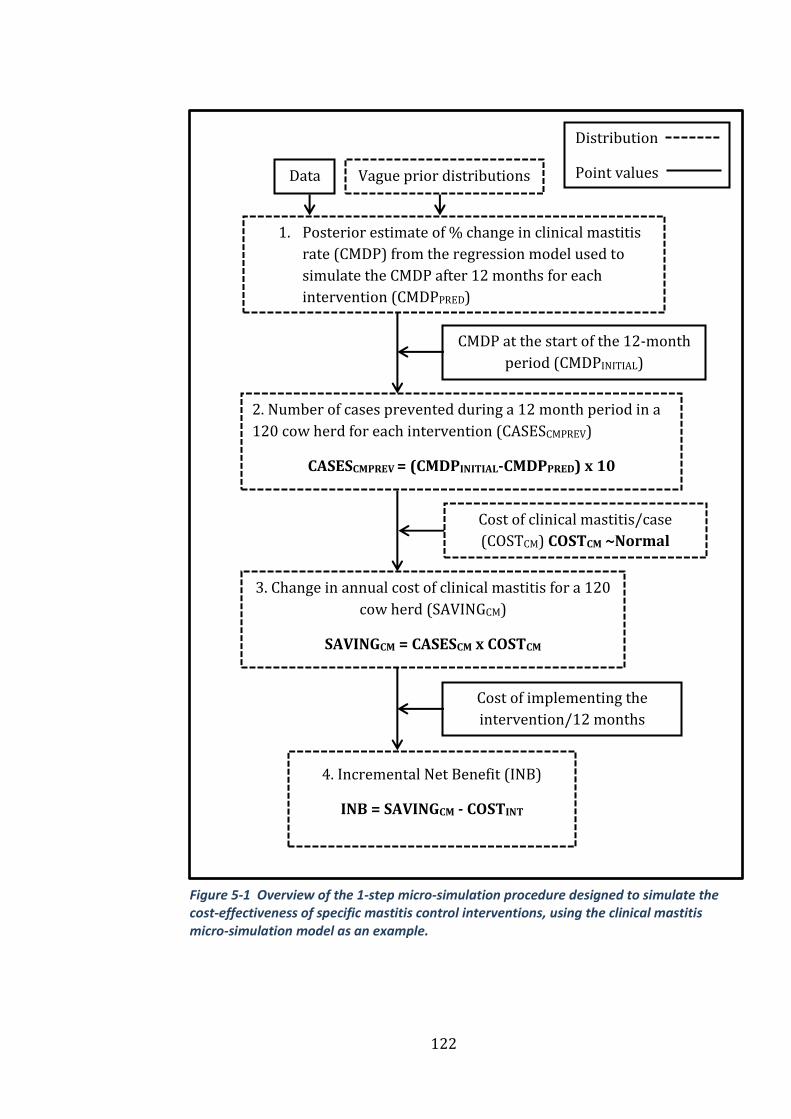
122
Vague prior distributions Data
1. Posterior estimate of % change in clinical mastitis
rate (CMDP) from the regression model used to
simulate the CMDP after 12 months for each
intervention (CMDPPRED)
CMDP at the start of the 12-month
period (CMDPINITIAL)
2. Number of cases prevented during a 12 month period in a
120 cow herd for each intervention (CASESCMPREV)
CASESCMPREV = (CMDPINITIAL-CMDPPRED) x 10
3. Change in annual cost of clinical mastitis for a 120
cow herd (SAVINGCM)
SAVINGCM = CASESCM x COSTCM
Cost of clinical mastitis/case
(COSTCM) COSTCM ~Normal
(mean=313, sd=101)
4. Incremental Net Benefit (INB)
INB = SAVINGCM - COSTINT
Cost of implementing the
intervention/12 months
(COSTINT)
Distribution
Point values
Figure 5-1 Overview of the 1-step micro-simulation procedure designed to simulate the cost-effectiveness of specific mastitis control interventions, using the clinical mastitis micro-simulation model as an example.
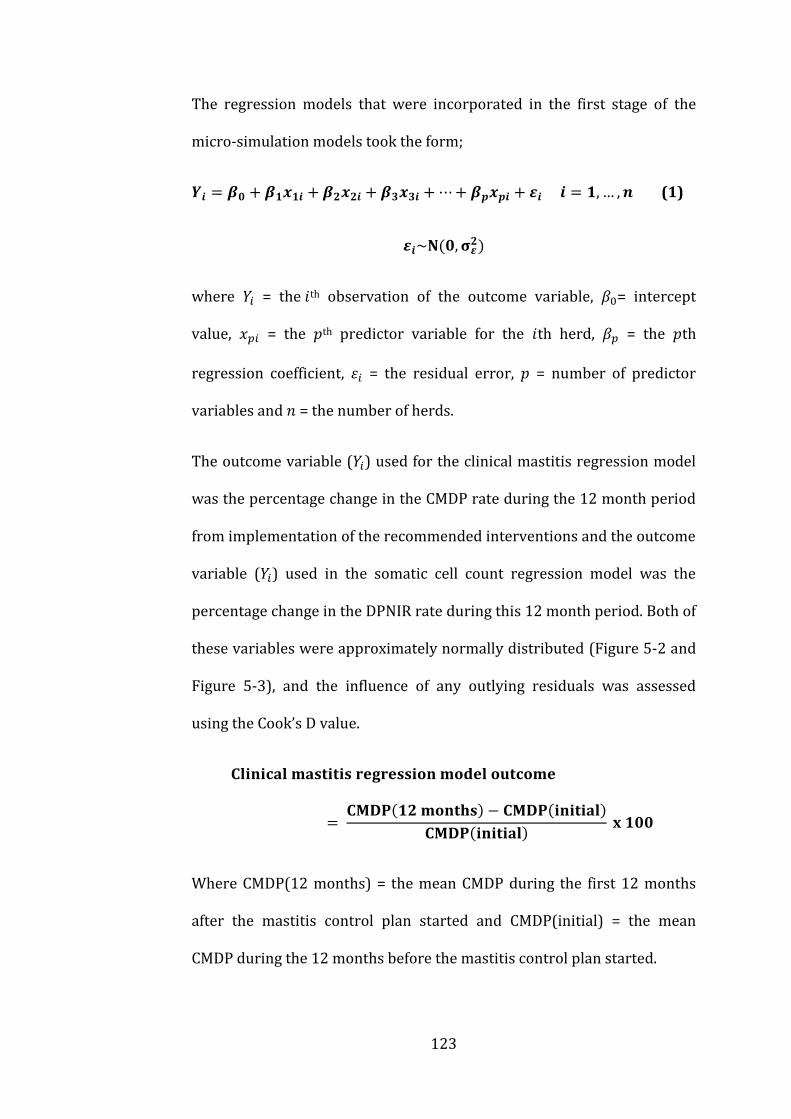
123
The regression models that were incorporated in the first stage of the
micro-simulation models took the form;
𝒀𝒊 = 𝜷𝟎 + 𝜷𝟏𝒙𝟏𝒊 + 𝜷𝟐𝒙𝟐𝒊 + 𝜷𝟑𝒙𝟑𝒊 + ⋯ + 𝜷𝒑𝒙𝒑𝒊 + 𝜺𝒊 𝒊 = 𝟏, … , 𝒏 (1)
𝜺𝒊~𝐍(𝟎, 𝛔𝜺𝟐)
where 𝑌𝑖 = the 𝑖th observation of the outcome variable, 𝛽0= intercept
value, 𝑥𝑝𝑖 = the 𝑝th predictor variable for the 𝑖th herd, 𝛽𝑝 = the 𝑝th
regression coefficient, 𝜀𝑖 = the residual error, 𝑝 = number of predictor
variables and 𝑛 = the number of herds.
The outcome variable (𝑌𝑖) used for the clinical mastitis regression model
was the percentage change in the CMDP rate during the 12 month period
from implementation of the recommended interventions and the outcome
variable (𝑌𝑖) used in the somatic cell count regression model was the
percentage change in the DPNIR rate during this 12 month period. Both of
these variables were approximately normally distributed (Figure 5-2 and
Figure 5-3), and the influence of any outlying residuals was assessed
using the Cook’s D value.
𝐂𝐥𝐢𝐧𝐢𝐜𝐚𝐥 𝐦𝐚𝐬𝐭𝐢𝐭𝐢𝐬 𝐫𝐞𝐠𝐫𝐞𝐬𝐬𝐢𝐨𝐧 𝐦𝐨𝐝𝐞𝐥 𝐨𝐮𝐭𝐜𝐨𝐦𝐞
= 𝐂𝐌𝐃𝐏(𝟏𝟐 𝐦𝐨𝐧𝐭𝐡𝐬) − 𝐂𝐌𝐃𝐏(𝐢𝐧𝐢𝐭𝐢𝐚𝐥)
𝐂𝐌𝐃𝐏(𝐢𝐧𝐢𝐭𝐢𝐚𝐥) 𝐱 𝟏𝟎𝟎
Where CMDP(12 months) = the mean CMDP during the first 12 months
after the mastitis control plan started and CMDP(initial) = the mean
CMDP during the 12 months before the mastitis control plan started.
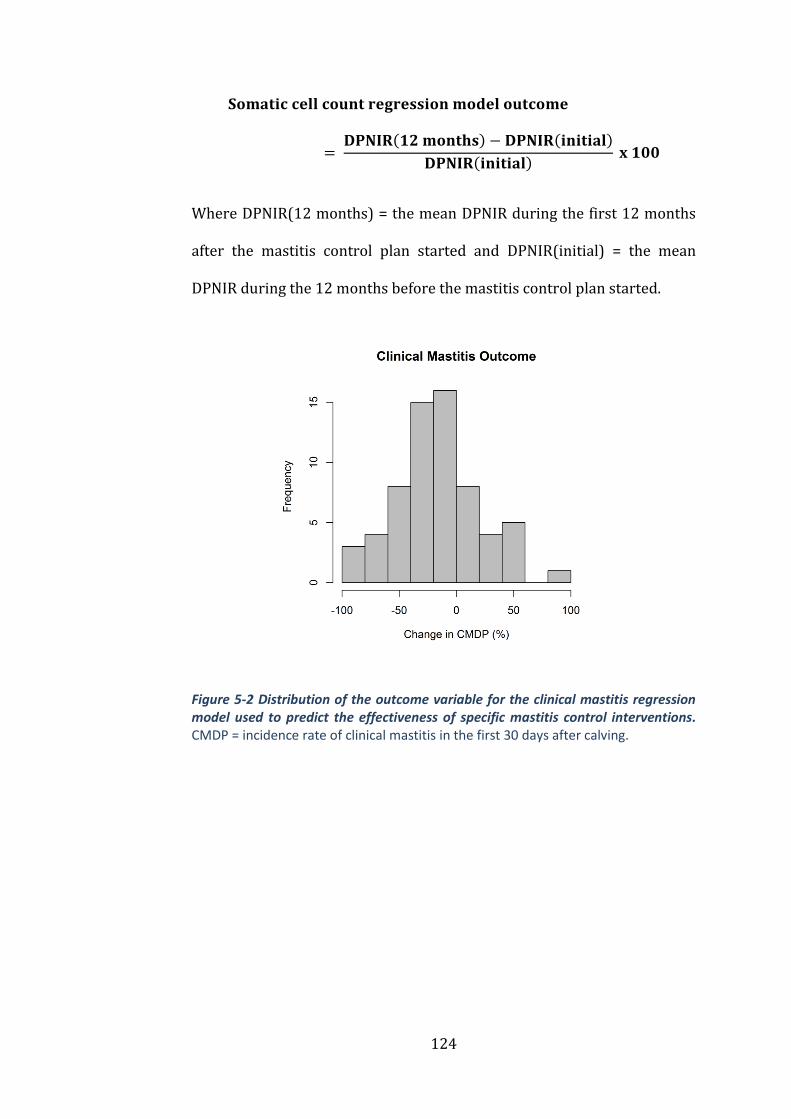
124
𝐒𝐨𝐦𝐚𝐭𝐢𝐜 𝐜𝐞𝐥𝐥 𝐜𝐨𝐮𝐧𝐭 𝐫𝐞𝐠𝐫𝐞𝐬𝐬𝐢𝐨𝐧 𝐦𝐨𝐝𝐞𝐥 𝐨𝐮𝐭𝐜𝐨𝐦𝐞
= 𝐃𝐏𝐍𝐈𝐑(𝟏𝟐 𝐦𝐨𝐧𝐭𝐡𝐬) − 𝐃𝐏𝐍𝐈𝐑(𝐢𝐧𝐢𝐭𝐢𝐚𝐥)
𝐃𝐏𝐍𝐈𝐑(𝐢𝐧𝐢𝐭𝐢𝐚𝐥) 𝐱 𝟏𝟎𝟎
Where DPNIR(12 months) = the mean DPNIR during the first 12 months
after the mastitis control plan started and DPNIR(initial) = the mean
DPNIR during the 12 months before the mastitis control plan started.
Figure 5-2 Distribution of the outcome variable for the clinical mastitis regression model used to predict the effectiveness of specific mastitis control interventions. CMDP = incidence rate of clinical mastitis in the first 30 days after calving.

125
Figure 5-3 Distribution of the outcome variable for the somatic cell count regression model used to predict the effectiveness of specific mastitis control interventions. DPNIR = monthly percentage of cows that had a somatic cell count <200,000 cells/ml at the milk recording prior to drying off, that were >200,000 cells/ml at the first milk recording after parturition.
Vague prior distributions were used for model parameters as follows;
σ𝜀2~Gamma(0.001,0.001), and β~Normal(0,106). The model predicted
values for the outcome variables for each herd were compared with the
observed data and displayed graphically to illustrate model performance.
Full probability distributions of the intervention efficacy estimates from
the regression models were carried forward in to the next stages of the
micro-simulation model.
The purpose of the micro-simulation was to simulate the cost-
effectiveness of each intervention in theoretical herds with a herd size of
120 cows, with different initial rates of CMDP and DPNIR and different
costs associated with implementing each intervention (Figure 5-1). The
Change in DPNIR (%)

126
values for CMDP and DPNIR on the simulated farms prior to interventions
being implemented were taken from actual data from 125 herds that had
previously participated in the DMCP so that a range of plausible scenarios
were used. The micro-simulation comprised the steps described below;
each step was undertaken at each model iteration.
Step 1. The regression model (1) was used to obtain an estimate of the
percentage change in the CMDP rate after a 12 month period for each
intervention for a given herd. The initial CMDP rate increased or
decreased according to the estimated percentage change and this resulted
in a predicted new CMDP rate for each farm once it had implemented the
intervention (CMDPPRED).
Step 2. The number of cases that would be prevented during a 12 month
period (CASESCMPREV) in a 120 cow herd was then simulated for each
intervention individually by multiplying the difference between the initial
CMDP rate (CMDPINITIAL) and the predicted CMDP rate (CMDPPRED) by 10
to convert the denominator to be per 120 cows:
𝐂𝐀𝐒𝐄𝐒𝐂𝐌𝐏𝐑𝐄𝐕 = (𝐂𝐌𝐃𝐏𝐈𝐍𝐈𝐓𝐈𝐀𝐋 − 𝐈𝐑𝐂𝐌𝟑𝟎𝐏𝐑𝐄𝐃) 𝐱 𝟏𝟎
Step 3. The change in annual cost of clinical mastitis for a 120 cow herd
(SAVINGCM) was calculated at each iteration by multiplying the number of
cases prevented (CASESCMPREV) by the cost of a case of clinical mastitis
(COSTCM):
𝐒𝐀𝐕𝐈𝐍𝐆𝐂𝐌 = 𝐂𝐀𝐒𝐄𝐒𝐂𝐌𝐱 𝐂𝐎𝐒𝐓𝐂𝐌
127
A cost per case of clinical mastitis within 30 days of calving was specified
as a full probability distribution, COSTCM~Normal (mean=313, sd=101),
based on a stochastic simulation study in the UK (Green et al., 2009). A
cost was selected at random from this distribution at each iteration and
multiplied by the number of cases prevented to give an overall saving in
pounds sterling associated with the implementation of each intervention.
Step 4. The incremental net benefit (INB) was calculated at each iteration
to represent the overall net benefit after all ‘savings’ and ‘costs’ had been
considered over the 12 month period:
𝐈𝐍𝐁𝐂𝐌 = 𝐒𝐀𝐕𝐈𝐍𝐆𝐂𝐌 − 𝐂𝐎𝐒𝐓𝐈𝐍𝐓
The cost of implementing each intervention (COSTINT) was specified as
one of four different values taken from across a plausible spectrum
ranging from a ‘low cost’ scenario (£250/12 months) to a ‘high cost’
scenario (£1000/12 months). Due to the huge inter-farm variation in the
cost of implementing mastitis interventions, any specified range could be
considered to be arbitrary. Therefore, rather than trying to predict the
actual cost of implementing specific interventions, a range of values was
specified to provide an indication as to how much ‘room for investment’
there was for each specific intervention. The actual cost of
implementation can be entered in the decision support tool in order to
make farm-specific predictions.
Parameters throughout the model were estimated from 10,000 Markov
chain Monte Carlo (MCMC) iterations, following a burn-in of 1000
128
simulations. Three chains starting at ‘overdispersed’ initial values were
simulated and convergence was assessed by comparing intra- and inter-
chain variability using the Brooks-Gelman-Rubin diagnostic (Brooks and
Gelman, 1998; Gelman and Rubin, 1992).
An indicator variable was set to 1 at each intervention when the micro-
simulation model predicted an INB of £1000 or greater and otherwise to
0. The mean value of this indicator over the 10,000 iterations provided an
estimate of the probability of exceeding a return of £1000. Predictions of
INB were plotted for each of the four different values of COSTINT to
produce probabilistic cost-effectiveness curves that display the
probability of saving, at least, £1000 over 12 months at different levels of
mastitis for each intervention (Figure 5-4, Figure 5-5, Figure 5-6 and
Figure 5-7). A cut point probability of ≥60% for a saving ≥£1000 in a 12
month period was used to label interventions as potentially cost-effective;
these interventions are reported. A saving of £1000 in a 12 month period
was considered by the authors to be a worthwhile saving for
demonstration purposes but farmers will be able to stipulate their own
desired level of saving in the decision support tool.
Somatic cell count micro-simulation model 5.2.3
The micro-simulation steps took the same form for the somatic cell count
micro-simulation model except the cost of a case of DPNIR was defined by
the normal distribution; COSTSCC~Normal (mean=290, sd=112) (Green et
al., 2009).
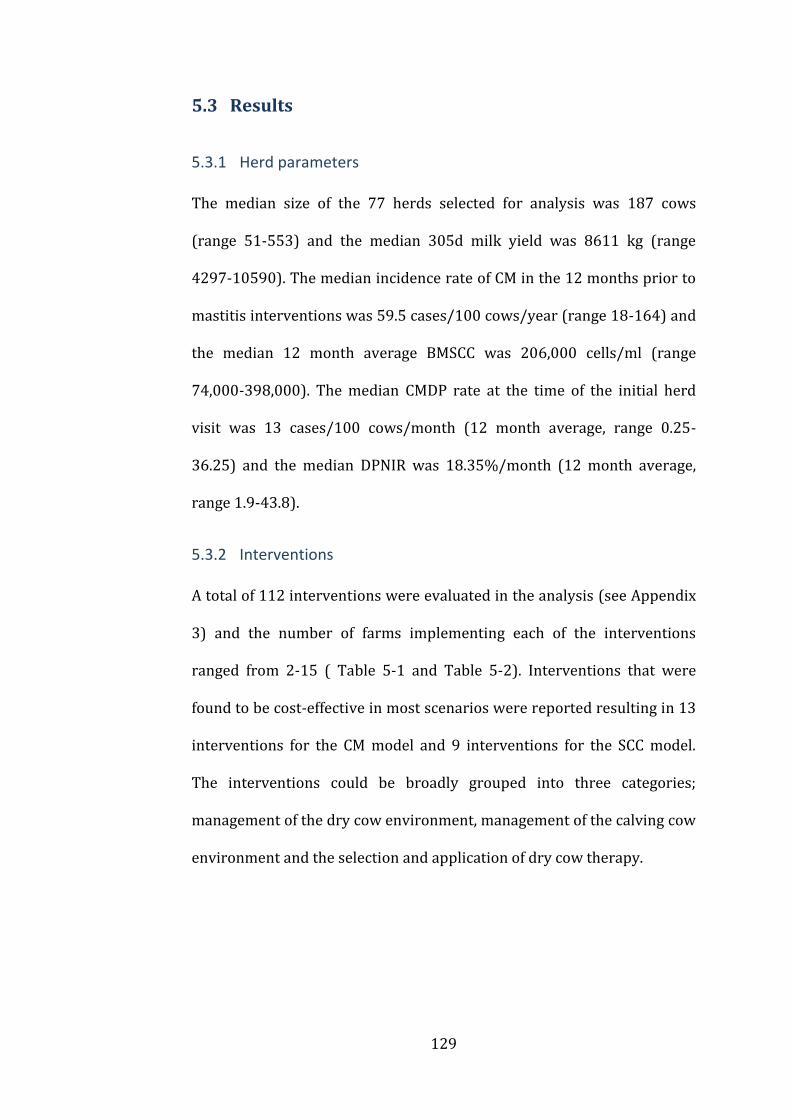
129
Results 5.3
Herd parameters 5.3.1
The median size of the 77 herds selected for analysis was 187 cows
(range 51-553) and the median 305d milk yield was 8611 kg (range
4297-10590). The median incidence rate of CM in the 12 months prior to
mastitis interventions was 59.5 cases/100 cows/year (range 18-164) and
the median 12 month average BMSCC was 206,000 cells/ml (range
74,000-398,000). The median CMDP rate at the time of the initial herd
visit was 13 cases/100 cows/month (12 month average, range 0.25-
36.25) and the median DPNIR was 18.35%/month (12 month average,
range 1.9-43.8).
Interventions 5.3.2
A total of 112 interventions were evaluated in the analysis (see Appendix
3) and the number of farms implementing each of the interventions
ranged from 2-15 ( Table 5-1 and Table 5-2). Interventions that were
found to be cost-effective in most scenarios were reported resulting in 13
interventions for the CM model and 9 interventions for the SCC model.
The interventions could be broadly grouped into three categories;
management of the dry cow environment, management of the calving cow
environment and the selection and application of dry cow therapy.

130
Micro-simulation models 5.3.3
Regression model fit
Both regression models demonstrated a good ability to predict the
incidence rate of CMDP and DPNIR for a given farm, with the model
predictions explaining over 84% of the variability in the observed data in
the clinical mastitis regression model (Figure 5-8) and 78% in the somatic
cell count regression model (Figure 5-9).
Cost-effectiveness outcome
The probability of an incremental net benefit of at least £1000 for
different interventions is provided in Table 5-1, Table 5-2, Figure 5-4,
Figure 5-5, Figure 5-6 and Figure 5-7. Interventions in the clinical mastitis
micro-simulation model that were cost-effective for most farms (>75%
probability of saving £1000 with initial CMDP rate of 2 cases/12 cows and
a COSTINT of £500) were dry cow rations being formulated by a suitably
qualified nutritionist as opposed to an unqualified person, selecting dry
cow therapy (DCT) at cow level (selective) rather than at herd level
(blanket), balancing calcium and magnesium in the dry cow rations,
designing cubicles in such a way that 90% of dry cows lied in them
correctly and not drying-off cows during foot trimming procedures. The
interventions in the somatic cell count micro-simulation model that were
cost-effective for most farms (>75% probability of saving £1000 with
initial DPNIR of 20% and a COSTINT of £500) were spreading bedding
evenly in dry cow yards as opposed to poor bedding spreading, abrupt
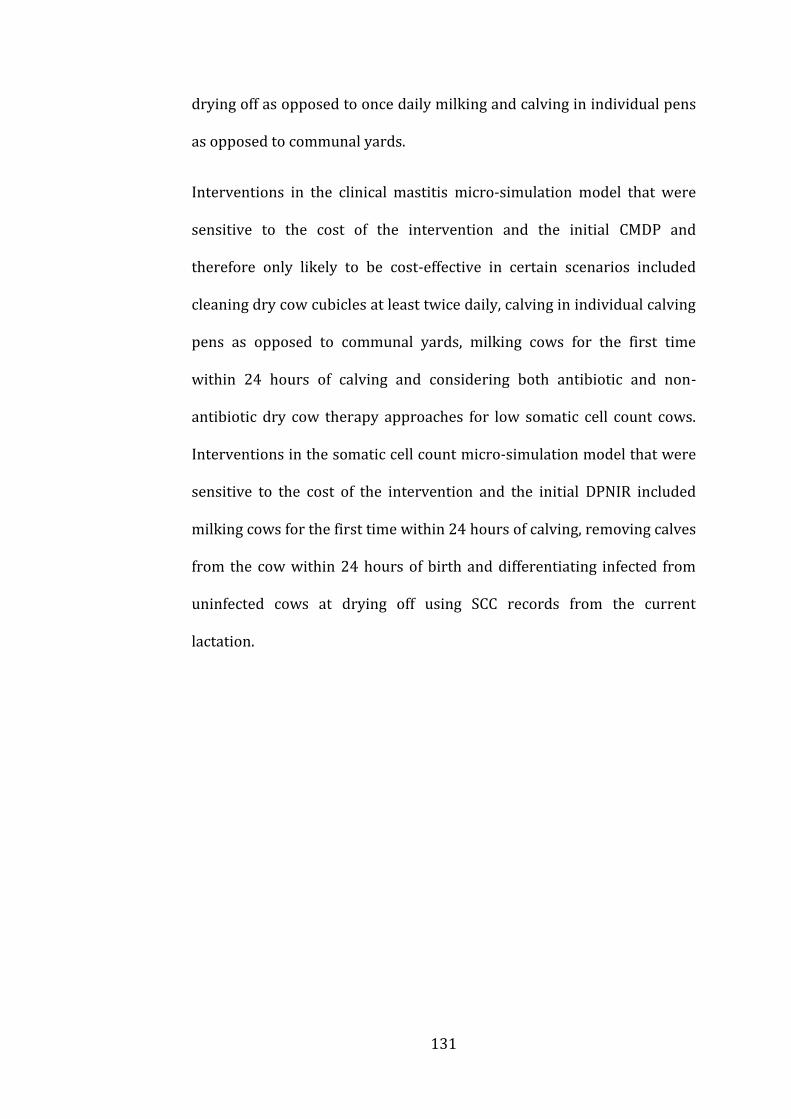
131
drying off as opposed to once daily milking and calving in individual pens
as opposed to communal yards.
Interventions in the clinical mastitis micro-simulation model that were
sensitive to the cost of the intervention and the initial CMDP and
therefore only likely to be cost-effective in certain scenarios included
cleaning dry cow cubicles at least twice daily, calving in individual calving
pens as opposed to communal yards, milking cows for the first time
within 24 hours of calving and considering both antibiotic and non-
antibiotic dry cow therapy approaches for low somatic cell count cows.
Interventions in the somatic cell count micro-simulation model that were
sensitive to the cost of the intervention and the initial DPNIR included
milking cows for the first time within 24 hours of calving, removing calves
from the cow within 24 hours of birth and differentiating infected from
uninfected cows at drying off using SCC records from the current
lactation.

132
Figure 5-4 Probabilistic cost-effectiveness curve for use of individual calving pens. The arrows indicate how to read from the curve with the dashed line representing the probability of saving at least £1000 in 12 months at an intervention cost of £250 in a herd with a CMDP rate of 2 cases/12 cows. The solid arrow represents the probability of saving at least £1000 in 12 months at an intervention cost of £1000 in a herd with a CMDP rate of 2 cases/12 cows. CMDP = incidence rate of clinical mastitis in the first 30 days after calving
Figure 5-5 Probabilistic cost-effectiveness curve for removing dung from dry-cow cubicles at least twice daily. CMDP = incidence rate of clinical mastitis in the first 30
days after calving.
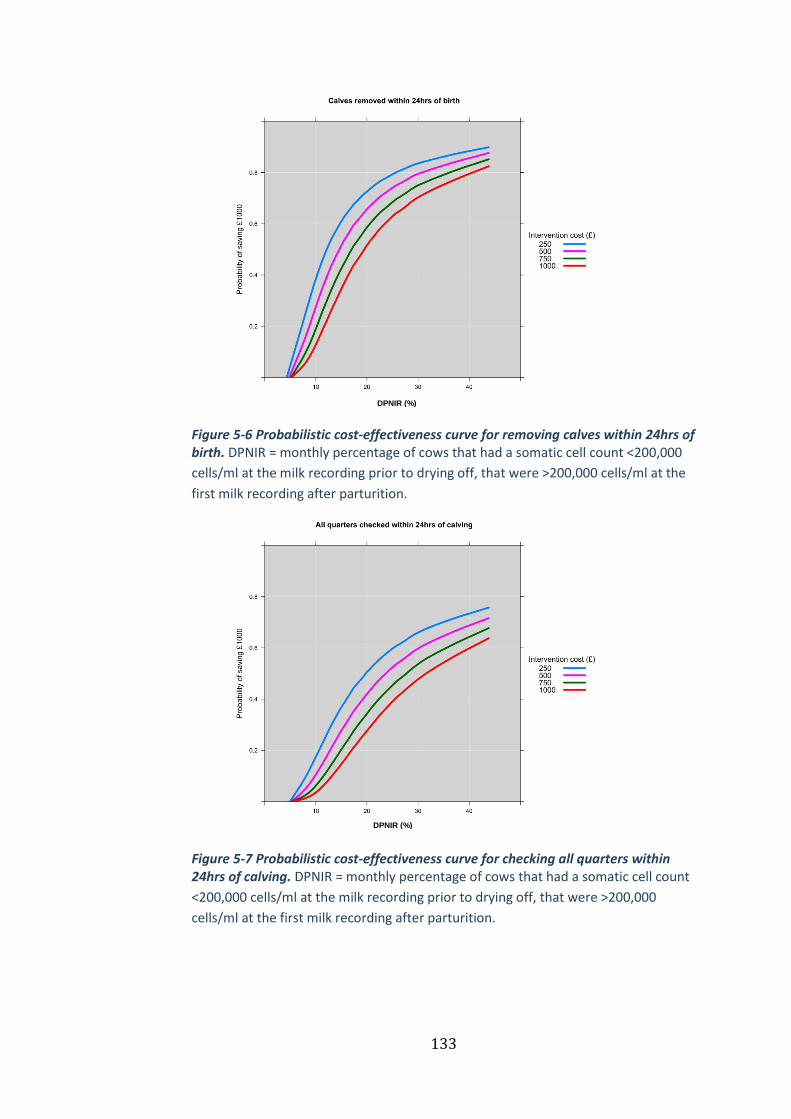
133
Figure 5-6 Probabilistic cost-effectiveness curve for removing calves within 24hrs of birth. DPNIR = monthly percentage of cows that had a somatic cell count <200,000
cells/ml at the milk recording prior to drying off, that were >200,000 cells/ml at the
first milk recording after parturition.
Figure 5-7 Probabilistic cost-effectiveness curve for checking all quarters within 24hrs of calving. DPNIR = monthly percentage of cows that had a somatic cell count
<200,000 cells/ml at the milk recording prior to drying off, that were >200,000
cells/ml at the first milk recording after parturition.
DPNIR (%)
DPNIR (%)

134
Figure 5-8 Scatterplot of observed and predicted values of the percentage change in CMDP. Predicted values were generated from the clinical mastitis regression
CMDP = incidence rate of clinical mastitis in the first 30 days after calving model.
Figure 5-9 Scatterplot of observed and predicted values of the percentage change in DPNIR. Predicted values were generated from the somatic cell count regression model. DPNIR = monthly percentage of cows that had a somatic cell count <200,000 cells/ml at the milk recording prior to drying off, that were >200,000 cells/ml at the first milk recording after parturition.
-100 -50 0 50 100
-10
0-5
00
50
Observed v Predicted values for % change in CMDP
Observed (CMDP)
Pre
dic
ted
(C
MD
P)
R2
0.84
-50 0 50 100
-50
05
01
00
Observed v Predicted values for % change in DPIMI
Observed (DPIMI)
Pre
dic
ted
(D
PIM
I)
R2
0.78
Observed (DPNIR)
Pre
dic
ted (
DP
NIR
)
Observed v Predicted values for % change in DPNIR
135
Table 5-1 Probability of saving at least £1000 after 12 months as predicted by the micro-simulation model. The probabilities are given for different incidence rates of clinical mastitis in the first 30 days after calving (CMDP) and different costs of implementing the intervention. Interventions listed in order of cost-effectiveness
Cost of Intervention (£)
Intervention n CMDP
(cases/12 cows)
250 500 750 1000
Dry cow rations should be formulated by a suitably qualified nutritional advisor
1.5 0.92 0.89 0.85 0.80 2 2.0 0.95 0.94 0.92 0.89 3.0 0.98 0.97 0.96 0.95
Dry cow therapy (DCT) should be selected at the cow level (a suitable product for each cow) rather than herd level
1.5 0.84 0.76 0.67 0.57 8 2.0 0.92 0.88 0.83 0.77 3.0 0.97 0.96 0.93 0.91
Calcium and magnesium should be balanced to prevent milk fever
1.5 0.77 0.71 0.65 0.58 4 2.0 0.85 0.81 0.77 0.71 3.0 0.90 0.88 0.86 0.84
Cows must not be dried off during foot-trimming
1.5 0.76 0.70 0.63 0.56 2 2.0 0.83 0.79 0.75 0.70 3.0 0.89 0.87 0.85 0.82
Cubicles should be designed such that at least 90% of dry cows will lie in them correctly at all times
1.5 0.74 0.67 0.60 0.54 2 2.0 0.82 0.78 0.73 0.68 3.0 0.88 0.86 0.84 0.81
Dung, soiling and wet bedding should be removed at least twice daily from dry cow cubicles
1.5 0.70 0.59 0.48 0.38 6 2.0 0.83 0.76 0.68 0.60 3.0 0.92 0.89 0.85 0.80
Cows should be milked for the first time within 24 hours of calving
1.5 0.70 0.60 0.50 0.40 7 2.0 0.81 0.75 0.68 0.60 3.0 0.90 0.87 0.83 0.79
Cows should calve in individual pens rather than yards rather than communal yards
1.5 0.65 0.56 0.47 0.39 3 2.0 0.76 0.70 0.63 0.56 3.0 0.86 0.82 0.78 0.74
Both antibiotic and non-antibiotic DCT approaches should be considered for low somatic cell count cows
1.5 0.50 0.39 0.29 0.21 7 2.0 0.65 0.56 0.47 0.39 3.0 0.80 0.74 0.68 0.62
Clean bedding material should be applied to dry cow cubicles at least once daily if using organic bedding
1.5 0.46 0.36 0.27 0.20 9 2.0 0.61 0.52 0.44 0.36 3.0 0.76 0.70 0.64 0.58
Straw yards for calving cows should be cleaned out completely at least once per month
1.5 0.40 0.28 0.20 0.13 15 2.0 0.58 0.47 0.37 0.29
3.0 0.74 0.67 0.60 0.53 Pasture must not be grazed for more than two consecutive weeks and must be rested for at least four weeks before cows are returned to graze
1.5 0.41 0.33 0.26 0.20 6 2.0 0.52 0.45 0.39 0.33
3.0 0.63 0.59 0.54 0.49
Calves must only be allowed to suckle their own dam to prevent the possible transfer of pathogens in milk between cows
1.5 0.28 0.19 0.12 0.07 14 2.0 0.44 0.35 0.26 0.19
3.0 0.64 0.56 0.48 0.41
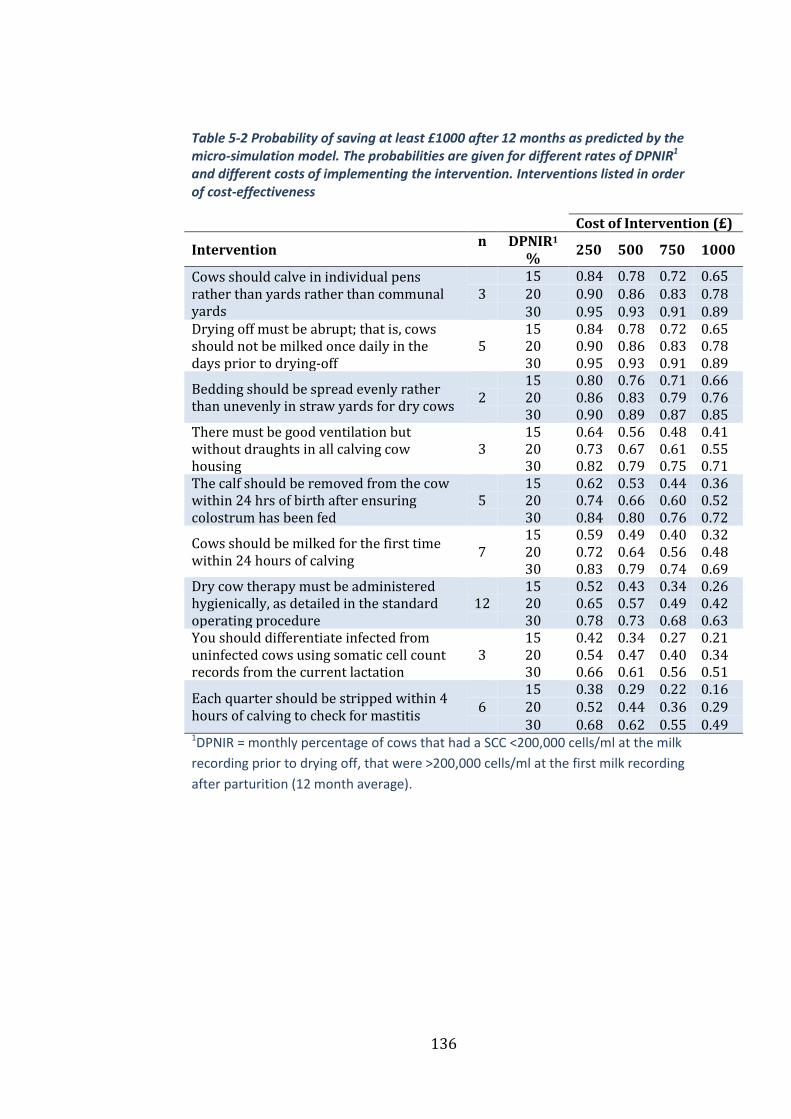
136
Table 5-2 Probability of saving at least £1000 after 12 months as predicted by the micro-simulation model. The probabilities are given for different rates of DPNIR1 and different costs of implementing the intervention. Interventions listed in order of cost-effectiveness
Cost of Intervention (£)
Intervention n DPNIR1
% 250 500 750 1000
Cows should calve in individual pens rather than yards rather than communal yards
15 0.84 0.78 0.72 0.65 3 20 0.90 0.86 0.83 0.78 30 0.95 0.93 0.91 0.89
Drying off must be abrupt; that is, cows should not be milked once daily in the days prior to drying-off
15 0.84 0.78 0.72 0.65 5 20 0.90 0.86 0.83 0.78 30 0.95 0.93 0.91 0.89
Bedding should be spread evenly rather than unevenly in straw yards for dry cows
15 0.80 0.76 0.71 0.66 2 20 0.86 0.83 0.79 0.76 30 0.90 0.89 0.87 0.85
There must be good ventilation but without draughts in all calving cow housing
15 0.64 0.56 0.48 0.41 3 20 0.73 0.67 0.61 0.55 30 0.82 0.79 0.75 0.71
The calf should be removed from the cow within 24 hrs of birth after ensuring colostrum has been fed
15 0.62 0.53 0.44 0.36 5 20 0.74 0.66 0.60 0.52 30 0.84 0.80 0.76 0.72
Cows should be milked for the first time within 24 hours of calving
15 0.59 0.49 0.40 0.32 7 20 0.72 0.64 0.56 0.48 30 0.83 0.79 0.74 0.69
Dry cow therapy must be administered hygienically, as detailed in the standard operating procedure
15 0.52 0.43 0.34 0.26 12 20 0.65 0.57 0.49 0.42
30 0.78 0.73 0.68 0.63 You should differentiate infected from uninfected cows using somatic cell count records from the current lactation
15 0.42 0.34 0.27 0.21 3 20 0.54 0.47 0.40 0.34 30 0.66 0.61 0.56 0.51
Each quarter should be stripped within 4 hours of calving to check for mastitis
15 0.38 0.29 0.22 0.16 6 20 0.52 0.44 0.36 0.29 30 0.68 0.62 0.55 0.49
1DPNIR = monthly percentage of cows that had a SCC <200,000 cells/ml at the milk
recording prior to drying off, that were >200,000 cells/ml at the first milk recording
after parturition (12 month average).
137
Discussion 5.4
This study illustrates how the clinical efficacy of specific mastitis
interventions can be quantified and incorporated into a Bayesian cost-
effectiveness model using a one-stage micro-simulation. This is the first
intervention study to explore cost-effectiveness of mastitis interventions
within a Bayesian framework, the results of which are to be incorporated
into a decision support tool that will be made available to
veterinarians/advisors involved with implementing the AHDB Dairy
Mastitis Control Plan in the United Kingdom.
Interventions relating to the design and comfort of dry cow cubicles such
as designing cubicles in such a way that cows lie in them correctly and
removing dung and wet bedding from cubicles at least twice daily were
potentially cost-effective interventions in the clinical mastitis micro-
simulation, and aspects of management related to these have been
highlighted previously (Barkema et al., 1999b). This earlier study
identified type of cubicle divider and thickness of cubicle bedding to be
associated with the incidence rate of clinical mastitis. The hygiene of dry
cow cubicles has been associated with changes in bulk milk somatic cell
count (Barkema et al., 1998a) and clinical mastitis incidence rate
(Schukken et al., 1991; Green et al., 2007b), and this highlights the need to
provide comfortable, clean cubicles for dry cows as well as lactating cows.
Another aspect of the dry cow environment which is important but
commonly overlooked is the grazing management and specifically the
rotation of paddocks. In this study a ‘graze 2, rest 4’ policy was used
138
(paddocks are grazed for no more than 2 consecutive weeks and then
rested for no less than 4 weeks), and whilst the effect of this intervention
was relatively small in each of the micro-simulation models, the combined
predicted reduction in clinical mastitis and somatic cell count would make
this an intervention likely to be cost-effective, providing the cost to
implement it was modest. This is in agreement with two previous studies
that found this intervention to be associated with reduced somatic cell
counts and clinical mastitis incidence in UK dairy herds (Green et al.,
2007b, 2008), and emphasises the need to consider pasture
contamination and ways to mitigate these risks.
The use of individual calving pens as opposed to communal yards had a
high probability of cost-effectiveness, and this has been identified as an
important risk factor by previous studies (Hutton et al., 1991; Bartlett et
al., 1992; Barkema et al., 1998; Barnouin et al., 2004; O’Reilly et al., 2006).
This effect may be due to a reduction in pathogen exposure but may also
reflect indirectly, the negative impact of cross-suckling calves which has
been associated with clinical mastitis incidence in the current study and
previously (Green et al., 2007a). Cross-suckling would also be less likely
to occur when calves are removed within 24 hours of calving and this
intervention was associated with a moderate probability of a £1000
return in the somatic cell count micro-simulation model.
Selecting dry cow therapy at cow level was associated with a reduced
CMDP rate, as has been reported previously (Green et al., 2007b). Since
neither the products used nor the criteria applied to select between cows
139
was specified in this study, it remains unclear whether some approaches
to selective dry cow therapy are superior to others.
Having a policy of using both antibiotic and non-antibiotic approaches
when drying-off low somatic cell count cows was predicted to reduce the
rate of CMDP and was very likely to be a cost-effective intervention.
Importantly, such a policy will also reduce the quantity of antimicrobial
usage on farm. With the increasing concerns about antibiotic resistance
comes an increasing pressure on dairy farmers to reduce antibiotic usage
(Call et al., 2008; Oliver et al., 2011). In herds such as these with a low
prevalence of contagious mastitis and a relatively low bulk milk somatic
cell count, the targeting of antibiotic dry cow therapy at cows infected at
drying off and use of non-antibiotic teat-sealants in uninfected cows is a
rational and effective approach to dry cow therapy (Huxley et al., 2002;
Green et al., 2008; Bradley et al., 2010; Cameron et al., 2015). Irrespective
of which dry cow therapy products are used at drying-off, interventions
affecting the hygiene of the procedure itself, and the cleanliness of the
environment in which it is performed, were shown to be potentially cost-
effective in both models and confirms previous study findings (Peeler et
al., 2000; Barnouin et al., 2004, 2005; Green et al., 2008).
Two interventions in the clinical mastitis micro-simulation model that
were predicted to be highly cost-effective in most scenarios were the
formulation of dry cow rations by a suitably qualified nutritional adviser
and the balancing of calcium and magnesium to prevent milk fever. This is
also in agreement with other studies investigating the role of nutrition in

140
mastitis control (Kremer et al., 1993; Oltenacu and Ekesbo, 1994;
O’Rourke, 2009). These studies reported that mastitis was more likely to
occur in cows diagnosed with clinical ketosis and cows deficient in
vitamins and trace elements such as selenium, vitamin E, copper, zinc,
vitamin A and β-carotene.
The uncertainty in clinical and financial outcome for an individual farm is
important and illustrates the usefulness of using a probability distribution
for anticipated financial returns. The integrated Bayesian model used in
this analysis simultaneously derived the joint posterior distribution for all
unknown parameters and propagated the effects through the predictive
cost-effectiveness model. In this example, uncertainty in the cost of
mastitis for each herd is included as well as the uncertainty of the effects
of the interventions. There are several advantages of this approach, which
have been outlined previously (Spiegelhalter and Best, 2003;
Spiegelhalter et al., 2004). The main disadvantages of the unified Bayesian
approach include the need for full MCMC software in order to obtain a
solution although this is currently freely available (Lunn et al., 2000) and
it can also be difficult to evaluate or check model accuracy (Green et al.,
2010). Such unified Bayesian models are used widely in human medicine
(Parmigiani, 2002; Spiegelhalter et al., 2004), but there are few examples
in the veterinary literature (Green et al., 2010; Archer et al., 2014). They
provide a useful method to improve the understanding of the
uncertainties involved in clinical decision making and therefore have
141
much to offer the decision analyst and decision-maker (Cooper et al.,
2004).
The results of this research were incorporated into a spreadsheet-based
decision support tool to enable vets and farmers to explore different
scenarios applicable to them. Farm-specific parameters can be entered
and required savings specified, resulting in predictions that are relevant
to each individual farm. For example, information regarding the herd size,
current clinical and subclinical mastitis performance and costs can be
inputted in addition to the cost of implementing each intervention. The
level of saving required after 12 months is then specified according to the
farmers needs and the decision support tool calculates the probability of
making the specified level of return and displays this as a probability
distribution so the uncertainty can be visualised. The decision support
tool also allows different combinations of interventions to be evaluated
simultaneously so that many different scenarios can be explored.
This research measured the cost-effectiveness of mastitis interventions in
herds specifically with an ‘EDP’ diagnosis and as such it is difficult to
know how these findings would translate to herds more generally. The
results may have been influenced by participation bias due to
characteristics common to the plan deliverers that submitted data
compared with those that didn’t. It is also likely that the results are biased
towards herds seeking veterinary input with respect to mastitis control
rather than being representative of the national herd as a whole.
However, the data most likely provides a true reflection of dairy herds
142
seeking veterinary input with respect to mastitis control and is, therefore,
of value to those involved in the delivery of these services.
Conclusions 5.5
In this study, data from 77 UK dairy herds were used to explore the cost-
effectiveness of specific mastitis control interventions in herds with a
particular problem with IMI’s acquired during the dry period. The results
from the Bayesian micro-simulation models were incorporated in a
decision support tool that will assist optimal decision making by
veterinary practitioners in the field.
143
Chapter 6
A Bayesian micro-simulation to
evaluate the cost-effectiveness of
specific interventions for mastitis
control during lactation
Introduction 6.1
In the previous chapter, Bayesian micro-simulation models were used to
explore the cost-effectiveness of specific mastitis control interventions in
herds with a particular problem with IMI’s acquired during the dry-
period (EDP). In this chapter, the same methodology was applied to
explore the cost-effectiveness of specific mastitis control interventions in
herds with a particular problem with intramammary infections acquired
during lactation (EL).
As discussed previously, the historical approach to mastitis control
centred around generic advice, focussing on a few specific control
measures such as the 5-point plan and the National Mastitis Council 10-
point plan (National Mastitis Council, 2006). More recently, veterinarians
have started to monitor somatic cell count records to manage individually
infected cows (Biggs, 2005; Schukken et al., 2003), and to focus on
milking routines and hygiene to manage the overall prevalence of
infection within the herd. However, by focussing on the prevalence of

144
infection and controlling the risks of cow-to-cow transmission, there is a
danger that the large number of risk factors associated with housing and
pasture management, which are likely to be more important for most UK
dairy herds, might be overlooked (Bradley et al., 2008b, 2007a). By
measuring the cost-effectiveness of specific interventions implemented by
EL herds in many different simulated scenarios, mastitis control
interventions can be better prioritised according to each individual EL
herds’ circumstances.
The aim of this chapter was to investigate the cost-effectiveness of
specific mastitis control interventions aimed at reducing IMI’s caused by
pathogens acquired from the environment, during lactation. As in the
previous chapter, an integrated Bayesian cost-effectiveness framework
was used to construct a probabilistic decision model that could be used to
inform clinical decision making.
Materials and methods 6.2
Data collection 6.2.1
The data collection process was described in the previous two chapters
(Sections 4.2.3 and 5.2.1)and the data used for this chapter came
exclusively from herds in the dataset that were assigned an EL diagnosis.
From the 212 herds with complete data, 75 herds were assigned an ‘EL’
diagnosis and therefore used in this study.
145
Data analysis 6.2.2
The clinical and subclinical mastitis data for each of the 75 herds were
initially checked for completeness, and any herds with incomplete
records were excluded from the analysis. 73 herds out of the 75 had
complete SCC data and were used for the SCC analysis and 66 herds out of
the 75 had complete CM data and were therefore used for the CM analysis.
In total, data from all 75 herds was used as some herds had complete SCC
data and incomplete CM data and vice versa.
The outcome of interest in this research was mastitis originating from
infections acquired during lactation as reflected by clinical mastitis and
somatic cell count records. To measure this, the incidence rate of clinical
mastitis after the first 30 days of lactation (CMLP) was used (reported by
DMCP participants as the number of cases/12 cows/month), as was the
monthly percentage of cows that had a SCC > 200,000 cells/ml at the
monthly milk recording, that were < 200,000 cells/ml at the previous
monthly milk recording (LNIR).
The outcome variable used for the clinical mastitis regression model was
the percentage change in CMLP during the 12 month period from
implementation of the recommended interventions and the outcome
variable used in the somatic cell count regression model was the
percentage change in the LNIR during this 12 month period. Both of these
variables were approximately normally distributed (Figure 6-1 and
Figure 6-2), and the influence of any outlying residuals was assessed
using the Cook’s D value.

146
𝐂𝐥𝐢𝐧𝐢𝐜𝐚𝐥 𝐦𝐚𝐬𝐭𝐢𝐭𝐢𝐬 𝐫𝐞𝐠𝐫𝐞𝐬𝐬𝐢𝐨𝐧 𝐦𝐨𝐝𝐞𝐥 𝐨𝐮𝐭𝐜𝐨𝐦𝐞
= 𝐂𝐌𝐋𝐏(𝟏𝟐 𝐦𝐨𝐧𝐭𝐡𝐬) − 𝐂𝐌𝐋𝐏(𝐢𝐧𝐢𝐭𝐢𝐚𝐥)
𝐂𝐌𝐋𝐏(𝐢𝐧𝐢𝐭𝐢𝐚𝐥) 𝐱 𝟏𝟎𝟎
Where CMLP(12months) = the mean CMLP during the first 12 months
after the mastitis control plan started and CMLP(initial) = the mean CMLP
during the 12 months before the mastitis control plan started.
𝐒𝐨𝐦𝐚𝐭𝐢𝐜 𝐜𝐞𝐥𝐥 𝐜𝐨𝐮𝐧𝐭 𝐫𝐞𝐠𝐫𝐞𝐬𝐬𝐢𝐨𝐧 𝐦𝐨𝐝𝐞𝐥 𝐨𝐮𝐭𝐜𝐨𝐦𝐞
= 𝐋𝐍𝐈𝐑(𝟏𝟐 𝐦𝐨𝐧𝐭𝐡𝐬) − 𝐋𝐍𝐈𝐑(𝐢𝐧𝐢𝐭𝐢𝐚𝐥)
𝐋𝐍𝐈𝐑(𝐢𝐧𝐢𝐭𝐢𝐚𝐥) 𝐱 𝟏𝟎𝟎
Where LNIR(12months) = the mean monthly LNIR during the first 12
months after the mastitis control plan started and LNIR(initial) = the mean
monthly LNIR during the 12 months before the mastitis control plan
started.
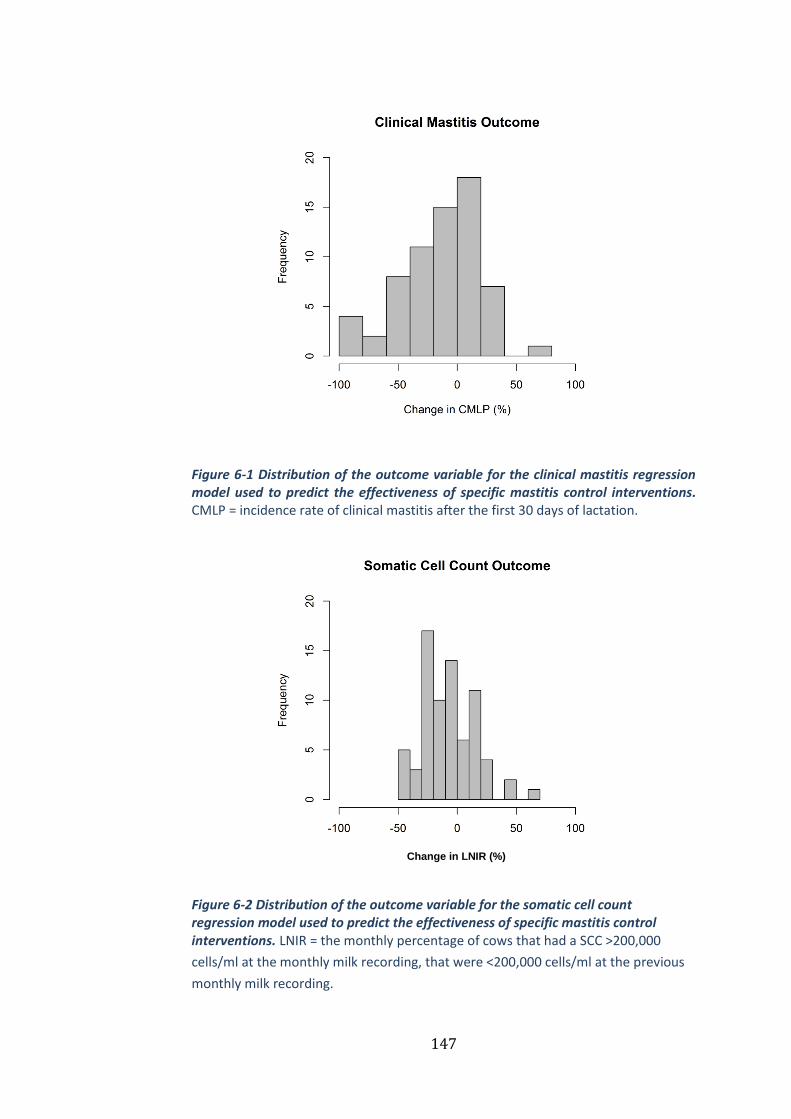
147
Figure 6-1 Distribution of the outcome variable for the clinical mastitis regression model used to predict the effectiveness of specific mastitis control interventions. CMLP = incidence rate of clinical mastitis after the first 30 days of lactation.
Figure 6-2 Distribution of the outcome variable for the somatic cell count regression model used to predict the effectiveness of specific mastitis control interventions. LNIR = the monthly percentage of cows that had a SCC >200,000
cells/ml at the monthly milk recording, that were <200,000 cells/ml at the previous
monthly milk recording.
Change in LNIR (%)
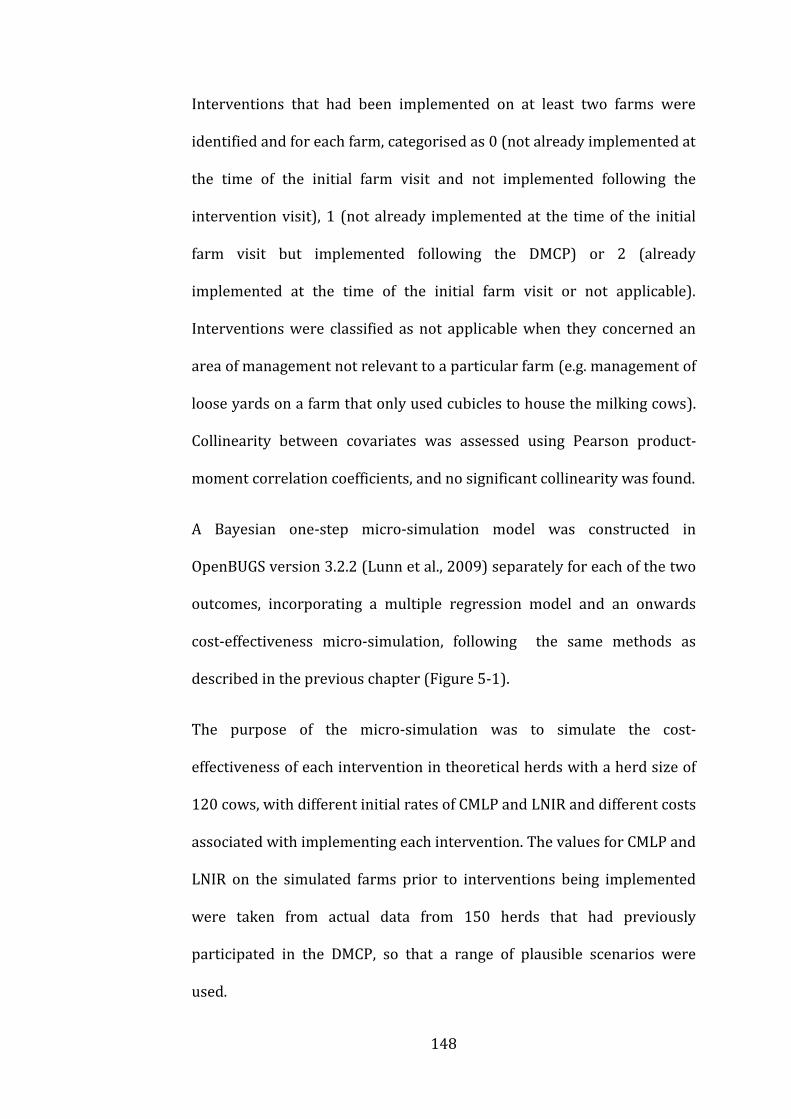
148
Interventions that had been implemented on at least two farms were
identified and for each farm, categorised as 0 (not already implemented at
the time of the initial farm visit and not implemented following the
intervention visit), 1 (not already implemented at the time of the initial
farm visit but implemented following the DMCP) or 2 (already
implemented at the time of the initial farm visit or not applicable).
Interventions were classified as not applicable when they concerned an
area of management not relevant to a particular farm (e.g. management of
loose yards on a farm that only used cubicles to house the milking cows).
Collinearity between covariates was assessed using Pearson product-
moment correlation coefficients, and no significant collinearity was found.
A Bayesian one-step micro-simulation model was constructed in
OpenBUGS version 3.2.2 (Lunn et al., 2009) separately for each of the two
outcomes, incorporating a multiple regression model and an onwards
cost-effectiveness micro-simulation, following the same methods as
described in the previous chapter (Figure 5-1).
The purpose of the micro-simulation was to simulate the cost-
effectiveness of each intervention in theoretical herds with a herd size of
120 cows, with different initial rates of CMLP and LNIR and different costs
associated with implementing each intervention. The values for CMLP and
LNIR on the simulated farms prior to interventions being implemented
were taken from actual data from 150 herds that had previously
participated in the DMCP, so that a range of plausible scenarios were
used.

149
Due to the way in which LNIR is calculated (i.e. the percentage of new
intramammary infections/month), the number of cases prevented was
multiplied by 12 to convert it from a monthly figure to an annual figure.
This was the only difference between the SCC model in Chapter 5 and the
SCC model in this chapter.
Results 6.3
Herd parameters 6.3.1
The median size of the 75 herds selected for analysis was 199 cows
(range 76-973), and the median 305-day milk yield was 8424 kg (range
4770-12410). The median incidence rate of CM in the 12 months prior to
mastitis interventions was 58.5 cases/100 cows/year (range 6-133), and
the median 12-month average calculated BMSCC was 203,000 cells/ml
(range 103,000-425,000). The median CMLP at the time of the initial herd
visit was 26 cases/100 cows/month (12-month average, range 1.17-53.4)
and the median LNIR rate was 9.7%/month (12-month average, range
4.4-21.4).
Interventions 6.3.2
A total of 131 interventions were evaluated in the analysis and the
number of farms implementing each of the interventions ranged from 2-
28 (Table 6-1 and Table 6-2). The interventions could be broadly grouped
into three categories: hygiene of the milking cow environment, the
milking routine and access to food and water.

150
Micro-simulation models 6.3.3
Regression model fit
Both regression models demonstrated a good ability to predict the
incidence rate of CMLP and LNIR for a given farm, with the model
predictions explaining 57% of the variability in the observed data in the
clinical mastitis regression model (Figure 6-3) and 52% in the somatic
cell count regression model (Figure 6-4).
Cost-effectiveness outcome
The probability of an incremental net benefit of at least £1000 for
different interventions is provided in Table 6-1, Table 6-2, Figure 6-5,
Figure 6-6, Figure 6-7 and Figure 6-8. Interventions in the clinical mastitis
micro-simulation model that were cost-effective for most farms (>75%
probability of saving £1000 with initial CMLP of 3.5 cases/12 cows and a
COSTINT of £500) were ensuring good fly control for all lactating cows and
heifers through the summer period when flies are expected or apparent,
use of drying agents to improve the dryness of cubicle beds for the
milking cows and keeping the herd closed, with barriers to outside
animals and people. All of the reported interventions in the somatic cell
count micro-simulation model were cost-effective for most farms (>75%
probability of saving £1000 with initial LNIR rate of 15% and a COSTINT of
£500) except giving cows access to water at all times (not be denied
access for more than 1 hour in a 24 hour period).
Interventions in the clinical mastitis micro-simulation model that were
less likely to be cost-effective included avoiding the milking cows from
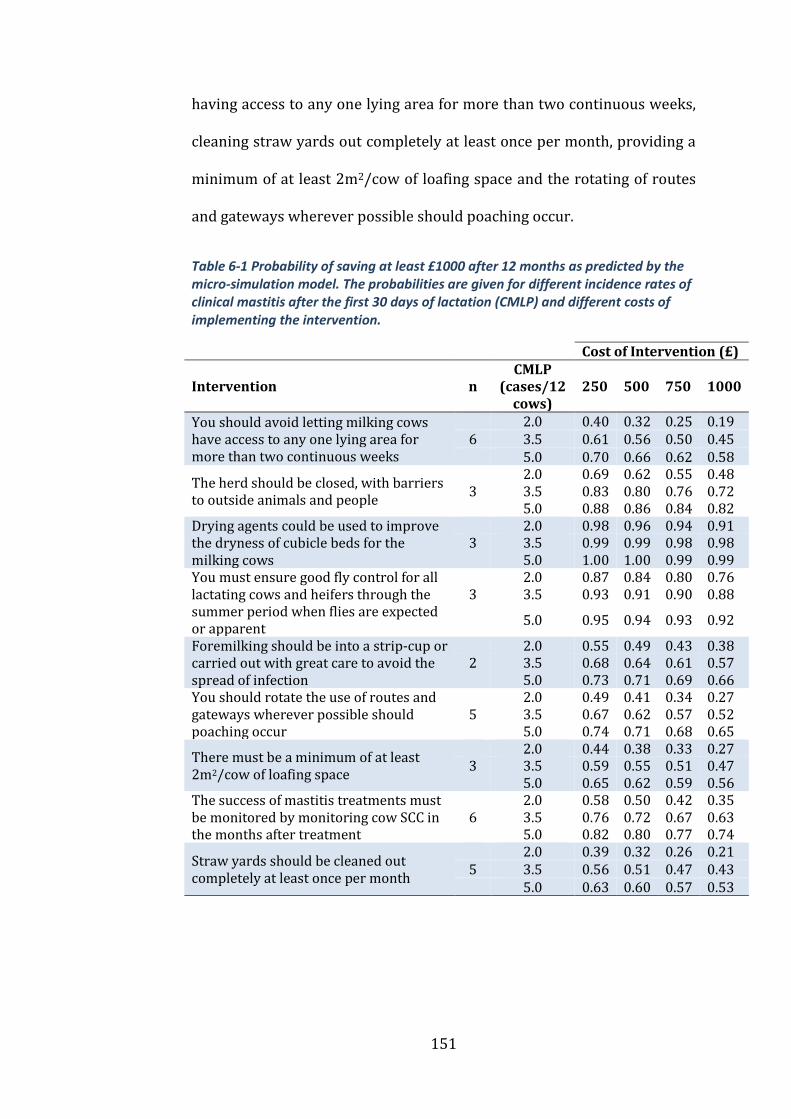
151
having access to any one lying area for more than two continuous weeks,
cleaning straw yards out completely at least once per month, providing a
minimum of at least 2m2/cow of loafing space and the rotating of routes
and gateways wherever possible should poaching occur.
Table 6-1 Probability of saving at least £1000 after 12 months as predicted by the micro-simulation model. The probabilities are given for different incidence rates of clinical mastitis after the first 30 days of lactation (CMLP) and different costs of implementing the intervention.
Cost of Intervention (£)
Intervention n CMLP
(cases/12 cows)
250 500 750 1000
You should avoid letting milking cows have access to any one lying area for more than two continuous weeks
2.0 0.40 0.32 0.25 0.19 6 3.5 0.61 0.56 0.50 0.45 5.0 0.70 0.66 0.62 0.58
The herd should be closed, with barriers to outside animals and people
2.0 0.69 0.62 0.55 0.48 3 3.5 0.83 0.80 0.76 0.72 5.0 0.88 0.86 0.84 0.82
Drying agents could be used to improve the dryness of cubicle beds for the milking cows
2.0 0.98 0.96 0.94 0.91 3 3.5 0.99 0.99 0.98 0.98 5.0 1.00 1.00 0.99 0.99
You must ensure good fly control for all lactating cows and heifers through the summer period when flies are expected or apparent
2.0 0.87 0.84 0.80 0.76 3 3.5 0.93 0.91 0.90 0.88
5.0 0.95 0.94 0.93 0.92
Foremilking should be into a strip-cup or carried out with great care to avoid the spread of infection
2.0 0.55 0.49 0.43 0.38 2 3.5 0.68 0.64 0.61 0.57 5.0 0.73 0.71 0.69 0.66
You should rotate the use of routes and gateways wherever possible should poaching occur
2.0 0.49 0.41 0.34 0.27 5 3.5 0.67 0.62 0.57 0.52 5.0 0.74 0.71 0.68 0.65
There must be a minimum of at least 2m2/cow of loafing space
2.0 0.44 0.38 0.33 0.27 3 3.5 0.59 0.55 0.51 0.47 5.0 0.65 0.62 0.59 0.56
The success of mastitis treatments must be monitored by monitoring cow SCC in the months after treatment
2.0 0.58 0.50 0.42 0.35 6 3.5 0.76 0.72 0.67 0.63 5.0 0.82 0.80 0.77 0.74
Straw yards should be cleaned out completely at least once per month
2.0 0.39 0.32 0.26 0.21 5 3.5 0.56 0.51 0.47 0.43 5.0 0.63 0.60 0.57 0.53
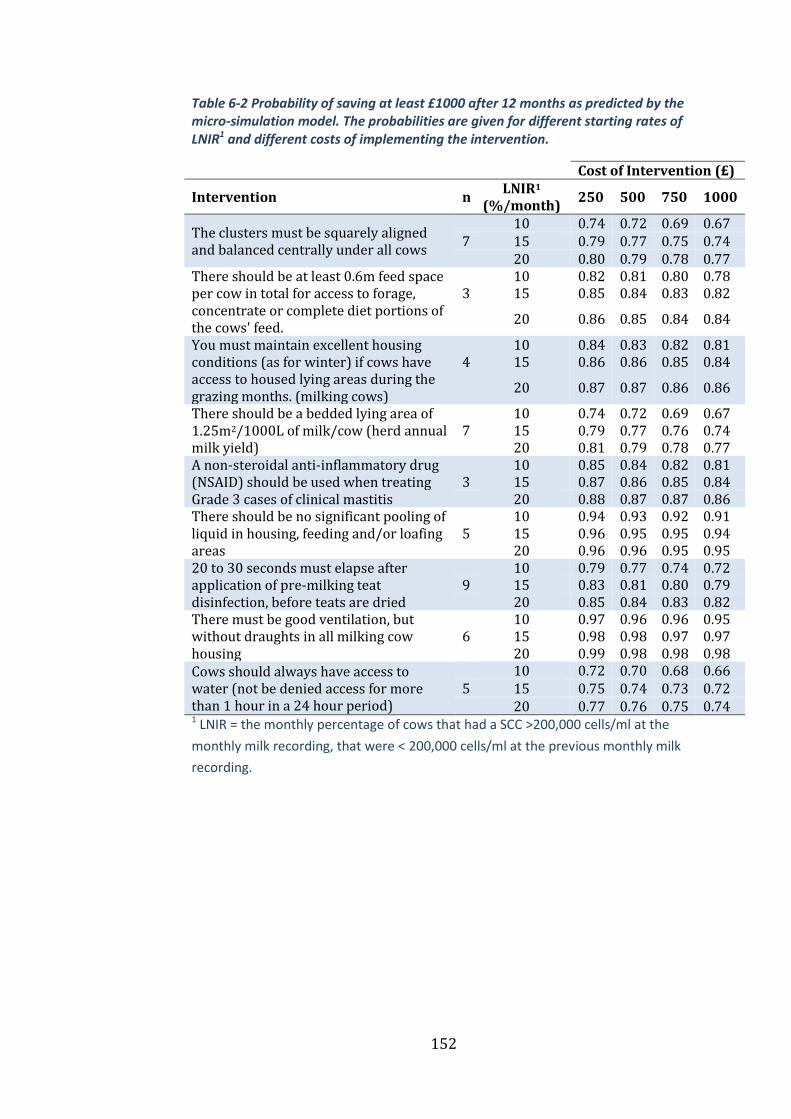
152
Table 6-2 Probability of saving at least £1000 after 12 months as predicted by the micro-simulation model. The probabilities are given for different starting rates of LNIR1 and different costs of implementing the intervention.
Cost of Intervention (£)
Intervention n LNIR1
(%/month) 250 500 750 1000
The clusters must be squarely aligned and balanced centrally under all cows
10 0.74 0.72 0.69 0.67 7 15 0.79 0.77 0.75 0.74 20 0.80 0.79 0.78 0.77
There should be at least 0.6m feed space per cow in total for access to forage, concentrate or complete diet portions of the cows' feed.
10 0.82 0.81 0.80 0.78 3 15 0.85 0.84 0.83 0.82
20 0.86 0.85 0.84 0.84
You must maintain excellent housing conditions (as for winter) if cows have access to housed lying areas during the grazing months. (milking cows)
10 0.84 0.83 0.82 0.81 4 15 0.86 0.86 0.85 0.84
20 0.87 0.87 0.86 0.86
There should be a bedded lying area of 1.25m2/1000L of milk/cow (herd annual milk yield)
10 0.74 0.72 0.69 0.67 7 15 0.79 0.77 0.76 0.74 20 0.81 0.79 0.78 0.77
A non-steroidal anti-inflammatory drug (NSAID) should be used when treating Grade 3 cases of clinical mastitis
10 0.85 0.84 0.82 0.81 3 15 0.87 0.86 0.85 0.84 20 0.88 0.87 0.87 0.86
There should be no significant pooling of liquid in housing, feeding and/or loafing areas
10 0.94 0.93 0.92 0.91 5 15 0.96 0.95 0.95 0.94 20 0.96 0.96 0.95 0.95
20 to 30 seconds must elapse after application of pre-milking teat disinfection, before teats are dried
10 0.79 0.77 0.74 0.72 9 15 0.83 0.81 0.80 0.79 20 0.85 0.84 0.83 0.82
There must be good ventilation, but without draughts in all milking cow housing
10 0.97 0.96 0.96 0.95 6 15 0.98 0.98 0.97 0.97 20 0.99 0.98 0.98 0.98
Cows should always have access to water (not be denied access for more than 1 hour in a 24 hour period)
10 0.72 0.70 0.68 0.66 5 15 0.75 0.74 0.73 0.72 20 0.77 0.76 0.75 0.74
1 LNIR = the monthly percentage of cows that had a SCC >200,000 cells/ml at the
monthly milk recording, that were < 200,000 cells/ml at the previous monthly milk
recording.
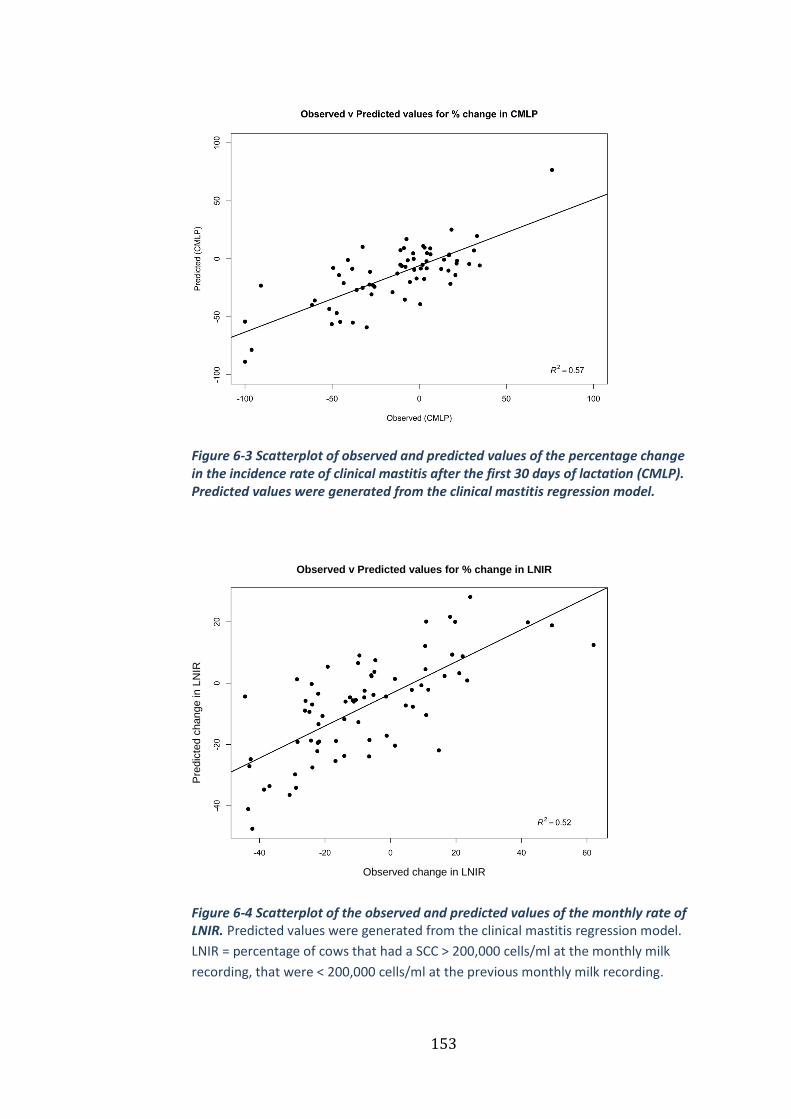
153
Figure 6-3 Scatterplot of observed and predicted values of the percentage change in the incidence rate of clinical mastitis after the first 30 days of lactation (CMLP). Predicted values were generated from the clinical mastitis regression model.
Figure 6-4 Scatterplot of the observed and predicted values of the monthly rate of LNIR. Predicted values were generated from the clinical mastitis regression model.
LNIR = percentage of cows that had a SCC > 200,000 cells/ml at the monthly milk
recording, that were < 200,000 cells/ml at the previous monthly milk recording.
Observed change in LNIR
Pre
dic
ted c
hange in
LN
IR
Observed v Predicted values for % change in LNIR

154
Figure 6-5 Probabilistic cost-effectiveness curve for keeping a closed herd. The arrows indicate how to read from the curve with the dashed line representing the probability of saving at least £1000 in 12 months at an intervention cost of £250 in a herd with a CMLP rate of 2 cases/12 cows. The solid arrow represents the probability of saving at least £1000 in 12 months at an intervention cost of £1000 in a herd with a CMLP rate of 3 cases/12 cows. CMLP = incidence rate of clinical mastitis after the first 30 days of lactation.
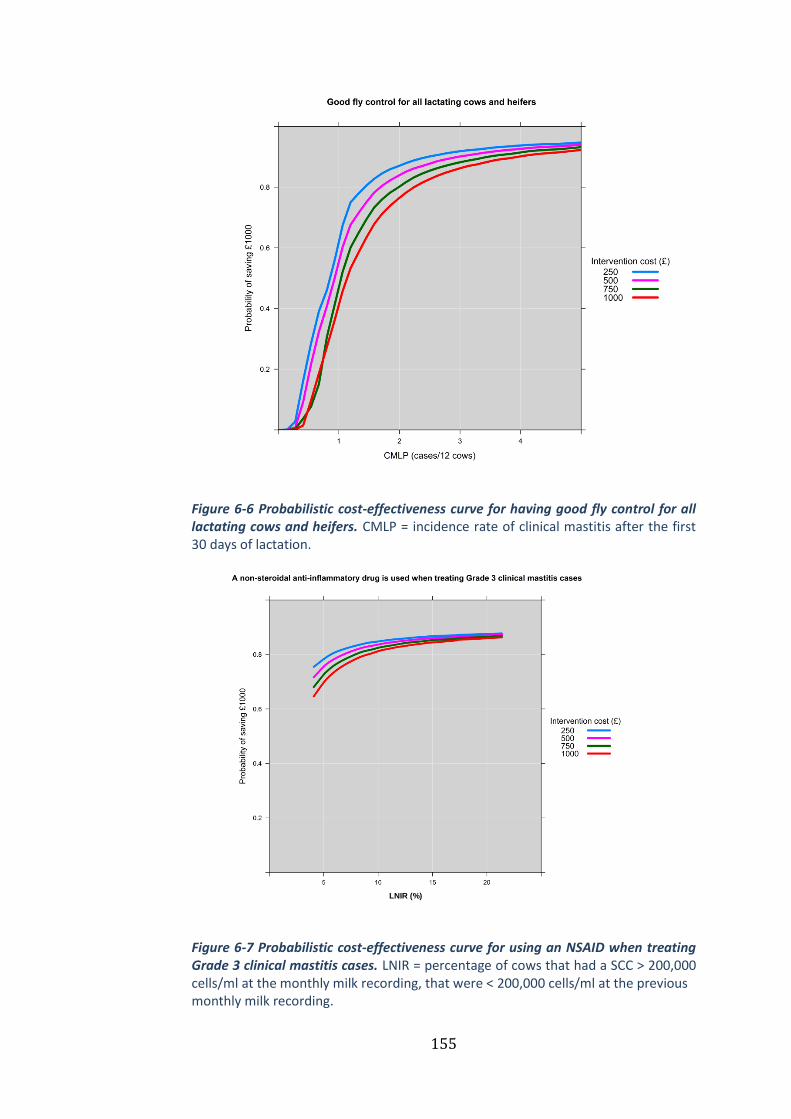
155
Figure 6-6 Probabilistic cost-effectiveness curve for having good fly control for all lactating cows and heifers. CMLP = incidence rate of clinical mastitis after the first 30 days of lactation.
Figure 6-7 Probabilistic cost-effectiveness curve for using an NSAID when treating Grade 3 clinical mastitis cases. LNIR = percentage of cows that had a SCC > 200,000 cells/ml at the monthly milk recording, that were < 200,000 cells/ml at the previous monthly milk recording.
LNIR (%)

156
Figure 6-8 Probabilistic cost-effectiveness curve for having a bedded lying area of 1.25m2/1000L of milk/cow. LNIR = percentage of cows that had a SCC > 200,000 cells/ml at the monthly milk recording, that were < 200,000 cells/ml at the previous monthly milk recording.
Discussion 6.4
This chapter illustrates how the clinical efficacy of specific mastitis
interventions can be quantified and incorporated into a Bayesian cost-
effectiveness model using a one-stage micro-simulation. The results of
this and the previous chapter are to be incorporated into a decision
support tool that will be made available to veterinarians/advisors
involved with implementing the DMCP in the United Kingdom.
Interventions concerning the management of the milking cow
environment featured prominently among those likely to be cost-effective
for most dairy farmers, which is unsurprising given the epidemiology of
the herds selected for this study. The loose-housing of milking cows in
LNIR (%)
157
straw yards has been frequently associated with an increased risk of
clinical mastitis and increased somatic cell count (Bareille et al., 1998;
Barnouin et al., 2005, 2004; O’Reilly et al., 2006). The results of this study
would indicate that some of this risk could be mitigated cost-effectively by
completely cleaning out straw yards at least once monthly and providing
a bedded lying area of at least 1.25m2/1000L of milk/cow (herd annual
milk yield). This is in agreement with previous studies that have reported
associations between the stocking density of straw yards (Bareille et al.,
1998; Green et al., 2008) and the frequency at which straw yards are
cleaned out (O’Reilly et al., 2006; Peeler et al., 2000) with somatic cell
counts.
Other interventions more generally related to the milking cow
environment that were likely to be cost-effective for most producers
included avoiding any significant pooling of liquid in housing, feeding
and/or loafing areas, ensuring good ventilation in all milking cow
accommodation and maintaining excellent housing conditions when cows
have access to housed lying areas during the grazing months. Access to
and cleanliness of loafing areas has been associated with reduced herd
somatic cell count previously (Barnouin et al., 2004; Bartlett et al., 1992),
as has good ventilation (Schukken et al., 1991), but the maintenance of
housing during the grazing period has not been directly linked with
mastitis before. However, giving dry cows access to housing whilst
grazed has been associated with increased somatic cell counts in early
lactation (Green et al., 2008), and it could be that this reflects the sub-

158
optimal housing conditions that are likely to manifest when the
accommodation is not in full-time use.
Other grazing-related interventions likely to be cost-effective in some
circumstances included not letting milking cows have access to any one
lying area for more than two continuous weeks and rotating the use of
routes and gateways wherever possible should poaching occur. This
finding is supported by previous work that has reported Strep. uberis
surviving for extended periods on pasture (Lopez-Benavides et al., 2007)
and farm tracks, especially in wet conditions (Lopez-Benavides et al.,
2005). This is also in agreement with two previous studies that have
demonstrated a reduced incidence of clinical mastitis and increased
somatic cell count in the first 30 days of lactation by restricting the access
of dry-cows to any one grazing area to less than 2 weeks followed by
stock not grazing the pasture for a minimum of 4 weeks (Green et al.,
2008, 2007a).
Several interventions related to the milking process were also found
likely to be cost-effective for many producers, including allowing at least
20-30 seconds to elapse before wiping-off pre-milking teat disinfectant,
ensuring that clusters are squarely aligned and balanced centrally under
all cows and foremilking (into a strip-cup or at least carried out with great
care to avoid the spread of infection). The application of pre-milking teat
disinfection to reduce new intramammary infections, especially those
caused by pathogens behaving in an environmental manner, is well
established (Bennett, 1982; Oliver et al., 2001, 1993; Pankey et al., 1987;
159
Sérieys and Poutrel, 1996) although previous cost-effectiveness studies
have failed to demonstrate an overall cost-benefit (Morton et al., 2014;
Ruegg and Dohoo, 1997). Due to the time pressures associated with the
milking process, milking staff may attempt to save time by reducing the
interval between the application of pre-milking teat disinfection, and
subsequent wiping of the teats, thereby potentially reducing the product
efficacy. The results of this study suggest that allowing at least 20-30
seconds to elapse before wiping-off pre-milking teat disinfectant is likely
to be cost effective for the majority of dairy farmers, and that cutting this
contact time short may prove to be a false economy.
The practice of foremilking as a means of detecting cases of clinical
mastitis has frequently been associated with an increased incidence rate
of clinical mastitis (Elbers et al., 1998; O’Reilly et al., 2006; Peeler et al.,
2000; Schukken et al., 1991) as has the use of a strip-cup when doing so
(Bartlett et al., 1992). However, from these studies, it is not possible to
establish if the practice of foremilking/using a strip-cup is causally
related to the incidence of clinical mastitis or simply that herds that
practice foremilking are more effective at diagnosing, and, as a
consequence, report more cases of clinical mastitis. This intervention was
only implemented by 2 herds, and therefore some caution should be
exercised when considering the implications of this finding. However, it
would seem prudent to practice foremilking in such a manner that any
risk of transmitting infections to neighbouring cows is minimised, and
this study provides some evidence that by doing so, any resulting increase
160
in labour could well be offset by reductions in the incidence of clinical
mastitis.
Ensuring good fly control for all lactating cows and heifers through the
summer period when flies are expected or apparent was very cost-
effective in most scenarios due to the resulting reduction in clinical
mastitis. Previous studies have demonstrated the ability of flies to
transmit intramammary infections to heifers (Gillespie et al., 1999; Owens
et al., 1998), and effective fly control has been associated with reduced
risk of intramammary infections in heifers (Nickerson et al., 1995; Piepers
et al., 2011). Whilst effective fly control is now a well-established aspect
of heifer management, this study provides some much-needed evidence of
the cost-effectiveness of effective fly control for the adult milking herd as
well.
The cost-effectiveness of the use of drying agents to improve the dryness
of cubicle beds for the milking cows was an interesting finding. The
positive association between the moisture content of cubicle bedding and
bacterial load is well accepted, as is the relationship between the number
of bacteria present in cubicle bedding and the incidence of intramammary
infections (Hogan et al., 1990, 1989). However, to date, evidence
supporting the use of drying agents as an effective means of reducing the
risk of mastitis has been lacking, and one previous study that reported an
association between the use of drying agents and an increased somatic
cell count (Bareille et al., 1998). Whilst no specific products can be
161
recommended, this study provides some evidence that they may play a
useful and cost-effective role in some herds with a specific EL problem.
The use of a non-steroidal anti-inflammatory drug (NSAID) when treating
grade 3 cases of clinical mastitis (defined as milk and udder changes and
also signs of systemic illness) was likely to be cost-effective for the
majority of dairy farmers due to an associated reduction in the rate of
new IMI’s as measured by SCC. Previous experimental E. coli and
endotoxin models have demonstrated improved clinical parameters (e.g.
reduced rectal temperature, reduced clinical signs and improved rumen
function) associated with the administration of carprofen, flunixin
meglumine and ketoprofen (Anderson et al., 1986; Banting et al., 2008;
Shpigel et al., 1994; Vangroenweghe et al., 2005). One previous study
reported a reduction in somatic cell count in cows with clinical mastitis
(grades 1 or 2) treated with a parenteral antibiotic and meloxicam,
compared with cows treated with a parenteral antibiotic only (McDougall
et al., 2009), however, this finding was not accompanied by a cost-
effectiveness analysis to help justify such an approach.
Interventions related to nutrition such as the provision of at least 60cm of
feed-space per cow and not denying cows access to water for any more
than 1hr/day resulted in reductions in the LNIR and were cost-effective in
many circumstances. Whilst this is the first study to find a relationship
between either of these interventions and somatic cell count, one
previous study found an association between the increased number of
feeding spaces/cow with a reduced incidence of E.coli mastitis (Barkema

162
et al., 1999a), and another study reported an increase in individual cow
somatic cell count following a period of water deprivation (Reneau,
1986).
Two interventions that were cost-effective due to reductions in the
incidence rate of clinical mastitis were having a closed herd, with barriers
to people and other animals and the monitoring of the success of mastitis
treatments by monitoring cow SCC in the months after treatment. The
risks posed to a dairy herd by people, other animals and the purchasing of
new animals are well known (Barkema et al., 2009), but, despite this,
there is evidence that biosecurity measures, in general, are poorly
implemented on cattle farms (Brennan and Christley, 2012) with poor or
inappropriate knowledge-transfer often cited as a potential cause (Sayers
et al., 2014). Given that the herd veterinarian remains a highly valued
advisor to most dairy farmers (Hall and Wapenaar, 2012), there is a clear
opportunity for the profession to engage more in the discussion
concerning biosecurity measures and for effective biosecurity measures -
including the monitoring of disease and having a closed herd; being
established in more herds.
The fit of the regression models was not as good as the models reported
in the previous chapter. This probably reflects the increased number of
interventions implemented by EL herds compared with EDP herds
meaning that interventions that were implemented by EL herds, were
done so by fewer farmers, resulting in increased uncertainty in the
predicted effect.

163
Conclusions 6.5
In this study, data from 75 UK dairy herds were used to explore the cost-
effectiveness of specific mastitis control interventions in herds with a
particular problem with IMI’s originating from the cows’ environment,
acquired during lactation. The results from the Bayesian micro-simulation
models demonstrate the probability of cost-effectiveness under different
scenarios, which were incorporated in a decision support tool that will
assist optimal decision making by veterinary practitioners in the field.

164
Chapter 7
Discussion and Conclusions
Discussion 7.1
This research used PSA and integrated Bayesian micro-simulation to
explore factors affecting the cost of clinical mastitis, the cost-effectiveness
of an on-farm culture approach for the treatment of mastitis and the cost-
effectiveness of specific mastitis control interventions. For livestock
health and disease-control decisions, information is needed on: (i) the
disease and production system; (ii) the physical effects of disease and its
subsequent effects on the production system; (iii) the incidence and/or
prevalence of disease; (iv) technologies and options available to control
disease and improve health and productivity; (v) the impact of disease
and control options on other systems (e.g. on human health); (vi)
evaluations of the effects of disease and of strategies for control (Bennett,
1992). The results described in this thesis have a particular role to play in
providing information on the last of these aspects, informing decisions
about the costs associated with mastitis treatment and describing the
potential savings that are possible with specific mastitis interventions.
Treatment of clinical mastitis 7.1.1
Whilst the current incidence rate of clinical mastitis in the UK is unknown,
it is likely to be approximately 47-65 cases/100 cows/year (Bradley et al.,
2007b). There are currently around 1.9 million dairy cows in the UK

165
(AHDB Dairy, 2015), meaning that approximately 855,000-1,235,000
cases of clinical mastitis are treated every year in the UK. Given this large
number of mastitis treatments each year and the associated financial,
emotional and welfare implications, it is important that farmers and vets
understand the relative importance of the factors affecting the cost of
mastitis so that better decisions can be made about how to minimise any
losses. In Chapter 2, the cost of a case of clinical mastitis was modelled for
5 different treatment protocols and a rate of transmission was included to
simulate scenarios ranging from low-risk to high-risk of transmission.
PSA was used so that all model input parameters were specified as
probability distributions, thereby, capturing some of the uncertainty
surrounding their true value. The rate of transmission was identified as
the most important determinant of the total cost of a case of clinical
mastitis, which was perhaps unsurprising, but what was arguably more
surprising was the lack of available evidence on which to base the
transmission rate input parameter on. The few studies that have included
transmission rate parameters in mastitis models (Barlow et al., 2009;
Halasa, 2012; Halasa et al., 2010; Swinkels et al., 2005; Swinkels et al.,
2005; van den Borne et al., 2010a) have all based them on the results of a
small number of studies (Lam et al., 1996a; Zadoks et al., 2002, 2001).
Despite this limitation, some of this inherent uncertainty surrounding the
likelihood of transmission is captured by the probability distribution,
propagated through the model and reflected in model outputs.
166
Another interesting finding from Chapter 2 was that treatment protocol 1
(3 days of intramammary antibiotics) was the most cost-effective
approach on average compared with the other more aggressive treatment
regimes. This is in agreement with Steeneveld et al. (2011), as one might
expect, given that many of the model inputs were common to both
studies. Some caution needs to be exercised concerning this finding
because the evidence for the bacteriological cure rates associated with
treatment protocols 2-5 was minimal. As a result, the distributions used
for protocols 3-5 were based entirely on the opinions of expert colleagues,
which may be considered a weakness. However, it is known that the
treatment of clinical mastitis during lactation typically results in modest
bacteriological cure rates (Roberson, 2012), although this is clearly
dependent on cow and pathogen factors (Barkema et al., 2006; Bradley
and Green, 2009; McDougall et al., 2007), and it is therefore unlikely that
more evidence would have altered the overall conclusions of this study.
There will, of course, remain situations when a more aggressive
treatment protocol is justified, based on specific cow or pathogen factors,
and the more risk-averse dairy farmers may opt to treat for longer in
return for a marginally increased certainty of bacteriological cure.
Irrespective of the treatment protocol used, the study in Chapter 2 serves
to highlight how important transmission is, relative to the other factors
affecting the cost of clinical mastitis, which should be a key consideration
when deciding how to manage cows with clinical mastitis.
167
The PSA model developed in Chapter 2 was adapted in Chapter 3 to
compare the cost-effectiveness of the treatment of clinical mastitis based
on the results of an on-farm culture approach (OFC) compared with a
‘standard’ treatment protocol of 3 days of intramammary antibiotic
administered to all cases. To the authors knowledge, this is the first cost-
effectiveness analysis to have been reported concerning the OFC system
despite the first OFC studies being published in 2011 (Lago et al., 2011a,
2011b). On average, approximately 6 million intramammary tubes are
used each year in the UK, which equates to approximately 1500 kg of
active ingredient (Eckford et al., 2013). The use of OFC has the potential
to reduce this figure quite considerably, but questions remain with
respect to economic and ethical considerations given the reduction in
bacteriological cure rates that may be associated with its use. In a recent
report highlighting some of the challenges facing the future provision of
farm animal veterinary services in the UK, one thing that farmers
wanted/expected from their vets was the introduction of new technology
and R&D support (Lowe, 2009). Given the high level of trust that most
dairy farmers still have in the veterinary profession (Hall and Wapenaar,
2012), it is important that new technologies like OFC are introduced in
light of comprehensive cost-effectiveness analyses that incorporate
uncertainty in transparent and intuitive ways. The study in Chapter 3
concluded that despite reducing antibiotic usage, the OFC approach was
unlikely to be more cost-effective than the standard approach for most
dairy farms and should, therefore, only be adopted after careful
consideration of the predominant pathogens present in each herd and an

168
honest discussion about the uncertainty surrounding its overall cost-
effectiveness. A limitation of this study was the sparse evidence available
on which to base the bacteriological cure model input parameter for the
OFC-branch of the model. Given how sensitive the model outputs were to
this parameter, it would have been preferable to have had more than one
relatively small-scale study (Lago et al., 2011a) on which to base this
distribution. The study by Lago et al. (2011a) reported an overall
bacteriological cure risk of 71% for cows treated conventionally and 60%
for those treated according to the results of OFC. At the pathogen level,
the OFC-associated reduction in bacteriological cure risk for all Gram-
negative infections was 16 percentage points (86% v 70%) and 25
percentage points (43% v 18%) for Staph. aureus infections. Similar
differences were reported in an unpublished study performed in Canada
which found an OFC-associated reduction in bacteriological cure risk of
13 percentage points for Staph. aureus infections (53% v 40%) and 18
percentage points for infections caused by Gram-positive pathogens other
than Staph. aureus (71% v 53%) (MacDonald, 2011). A wide distribution
was used in Chapter 3 to capture this uncertainty but clearly more
research is needed to better understand the impact of OFC on
bacteriological cure rates, the reasons for such reductions and ways in
which they can be mitigated. At this time, as the OFC approach begins to
be adopted by an increasing number of UK dairy farms and interest in the
approach grows, the cost-effectiveness analysis from Chapter 3 will
provide much-needed and timely support to practitioners when deciding
how best to apply this new technology.

169
Mastitis control 7.1.2
Having highlighted the significant cost of mastitis in Chapter 2 and the
concerns about the quantity of antimicrobial drugs used to treat mastitis
in Chapter 3, the focus of the remainder of the thesis was on the control
and prevention of mastitis which is, of course, the most effective way of
reducing the cost of mastitis and the quantity of antimicrobial drugs used.
All of the data used in these chapters came from UK dairy farms that had
participated in the AHDB Dairy Mastitis Control Plan (DMCP, see 1.2.4)
since it began in 2009. The DMCP is a rare example of an evidence-based,
farm-specific approach to mastitis control that has been proven to reduce
the risk of clinical and subclinical mastitis in the field (Green et al.,
2007b). Other countries have tried similar initiatives, but have either
failed to demonstrate any significant improvements in udder health as a
result (Tschopp et al., 2015) or reported some improvements but were
unable to provide a control group with which to compare the results (Lam
et al., 2013). Since the DMCP was launched in 2009, over 300 plan
deliverers have been trained, and over 2000 farms have had some
involvement with the plan, representing approximately 20% of the
national herd.
What was most disappointing given the success of the DMCP was the
difficulty in acquiring data from participating vets and dairy herds and the
variation in the quality of data that were provided. Much of the first 18
months of this project was spent contacting plan deliverers in a variety of
different ways and persistently encouraging them to submit ePlan, farm
170
performance and intervention data for the herds that they had been
involved with. By the end of the data collection period, complete data
were submitted for 212 herds, which equated to approximately 20% of
the herds that were eligible at the time, and far fewer than had been
hoped for at the start of the project. The reasons for this are complex and
multifactorial but relate generally to the broad, collaborative approach of
the DMCP delivery model which is both a strength and a weakness.
Firstly, the DMCP was not developed in such a way as to facilitate the
comprehensive and robust collation of outcomes. During 2009-2012,
there was no obligation for plan deliverers to upload ePlan and farm
performance data to a central database (this has subsequently changed),
and so it was not possible to know how much data really existed before
the data collection phase began. Secondly, there was a significant problem
with poor data quality and evidence of a lack of appreciation of the
importance of data in understanding mastitis patterns on-farm. A lot of
data was ‘lost’ due to the absence of clinical mastitis records and due to
multiple diagnoses having been selected in the ePlan data (e.g. EDP and
EL). As clinical mastitis cases are detected and recorded by the dairy
farmers, there is a great deal of variation in the quantity and quality of
these records, and when cases are not recorded in an electronic format
they can be difficult to access by vets and researchers. Incomplete or
absent clinical mastitis records hinder the ability of the plan deliverer to
make an accurate assessment of the mastitis epidemiology for a particular
dairy farm, which may explain why some of the farms were assigned
multiple diagnoses. Equally, the somatic cell count and clinical mastitis

171
data may present a mixed picture, and deciding between an EDP and EL
diagnosis, for example, might be challenging. The importance of assigning
only one diagnosis is emphasised, however, during the plan deliverer
training days, and so it was disappointing to find so many examples
where this recommendation had not been followed. Thirdly, the plan
deliverers themselves vary considerably in terms of occupation, IT and
herd health skills and general enthusiasm for the scheme itself. A
significant number of plan deliverers would have viewed the training as a
form of continuing professional development and would not necessarily
be in a position to implement any/many plans directly. Also, some plan
deliverers may have found they struggled with the IT aspects of the DMCP
approach or were unable to ‘sell’ it to their clients. As a result, the
majority of plans implemented are delivered by a relatively small number
of enthusiastic plan deliverers, which may explain to some extent why
only 87 of the 265 plan deliverers contributed any data at all.
One of the consequences of obtaining fewer data than hoped is that of
reduced study power and potentially fewer interventions to analyse in the
study. The advantage of using a Bayesian framework in this context is that
it doesn’t rely on frequentist measures of statistical significance, and any
uncertainty resulting from low study power should be reflected in the
width of the posterior distributions. By adopting Bayesian methods, less
potentially clinically useful information is discarded, leaving the clinical
decision makers with more evidence on which to base their decisions. The
limited amount of data also meant that it wasn’t possible to investigate

172
the cost-effectiveness of combined interventions to see if there was any
extra benefit derived by implementing two or more specific interventions
in certain scenarios. One example of this was in Chapter 5, when 3
interventions related to the ‘graze 2, rest 4’ (paddocks are not grazed for
more than 2 continuous weeks and at least 4 weeks must elapse before
cows are returned to graze) intervention were combined as one
parameter. This showed a greater effect when all three were implemented
as opposed to each of them singly, and other such relationships may have
been apparent with more data.
The limited amount of data from CDP/CL herds precluded them from the
cost-effectiveness analysis, but given the significant amount already
known about the effective control of contagious pathogens (Barkema et
al., 2006) and the fact that CDP/CL herds only account for approximately
5% of herds participating in the DMCP (Bradley et al., 2012), there is
arguably less of a need for this analysis at present.
Despite the challenges posed by the data collection process, the resulting
dataset was the largest and most comprehensive of its kind and the first
to have such detailed information on the mastitis epidemiology for each
farm as well as current farm management practices. This has made it
possible to investigate the cost-effectiveness of a large number of mastitis
control interventions under different scenarios, which has not been done
previously. Whilst we knew that the DMCP was effective overall, we
hadn’t previously had any means of knowing which interventions were
most likely to be cost-effective for specific herds and, therefore, the

173
decision about which interventions to implement has, up until now, been
based largely on practical considerations and intuition. Using the results
from Chapter 5 and Chapter 6, it will now be possible to rank a selection
of mastitis control interventions based on the probability of a specific
return by way of a decision support tool, which will offer much needed
evidence-based support to those delivering mastitis control services in
the UK. This serves to highlight one of the key strengths of the Bayesian
approach in that the resulting posterior distributions can be used to
provide clinically relevant and direct answers to important questions
including the probability that a particular hypothesis is correct.
The results of the descriptive analysis presented in Chapter 4 highlight
that the average herd size and milk yield of the study farms were slightly
higher than the current national averages. Given that the study farms
were drawn from a convenience sample of farms that had participated in
the national mastitis control scheme, there were inherent biases within
the dataset and one might question how representative they are of the
national population. However, they are likely to be representative of other
herds participating in the DMCP at present or in the future and, therefore,
the cost-effectiveness analysis should be of relevance to a large number of
dairy herds in the UK and wider.
Potential future work 7.1.3
In general, approaches to providing advice on mastitis control may be
divided into two types; ‘reactive’ and ‘prospective’. The most prevalent
approach historically has been the reactive approach, whereby a

174
veterinary practitioner or advisor is asked to assess a problem situation,
whether long-standing or a sudden outbreak. Investigations typically
include the analysis of farm records, and current management strategies
including a farm assessment and some milk samples may be taken to
assess pathogen involvement. A prospective approach to mastitis control
incorporates many of the principles of herd health management; setting
goals, on-going monitoring of disease and updating of management
practices when goals are not achieved (Green, 2012; National Mastitis
Council, 2006). The advantage of prospective mastitis management is that
problems should be identified sooner than with reactive approaches and,
as the average herd size gets larger and skilled farm labour units per cow
are reduced, should ensure that resources and effort are directed to the
areas that give the greatest returns.
The problem with both reactive and prospective approaches to mastitis
control is that they rely on current farm information to define what is
happening and therefore what to change. In this sense, they are both in
fact ‘reactive’. What the studies in Chapter 5 and Chapter 6 exemplify is a
different approach that is likely to become more prevalent in the future,
whereby current data are used to predict what is likely to happen in the
future. In what might be termed ‘predictive’ mastitis control, accurate
biological predictions would be made from current farm information.
With advances in on-farm technologies, scientific approaches and data
handling capabilities, ‘predictive’ mastitis control is becoming a reality
especially as the advancement of computer technology means that value

175
can now be derived from complex datasets to drive decision making in the
so-called ‘big data’ revolution (Hudson, 2015).
The key to success with ‘predictive’ mastitis control approaches will be to
make use of readily available information and to ensure results are
relevant and accessible to the end user. The provision of appropriate (in
terms of quantity, quality and form) and timely information to decision
makers is vital if 'good' decisions (i.e. those which best achieve the
objectives) are to be made (Bennett, 1992). The need for ‘real-time’
decision support tools has never been greater, as the sheer volume of data
being generated on dairy farms can mean that ‘good’ decisions are not
always intuitive. The results from Chapter 5 and Chapter 6 will be
incorporated into a decision support tool that will facilitate the
prioritisation of interventions based on the probability of cost-
effectiveness in a way that is completely customisable to each individual
farm’s circumstances.
Conclusions 7.2
Chapter 2 7.2.1
The rate of transmission was found to be by far the most influential
parameter in a PSA investigating the factors affecting the cost of CM at the
individual cow level. This was followed by bacteriological cure rate, the
cost of culling and loss of yield. The results from this study suggested that
more emphasis should be placed on the reduction in the risk of
176
transmission in dairy herds when seeking to minimise the economic
impact of CM.
Chapter 3 7.2.2
The results of this study indicated that the proportion of Gram-positive
cases and the difference in bacteriological cure rate between the two
treatment approaches had the greatest impact on the probability that an
OFC approach would be more cost-effective than a standard approach for
the treatment of clinical mastitis. The OFC approach appeared to be
suitable for herds in which Gram-negative pathogens were responsible
for most clinical mastitis and where the treatment of cows according to
the results of an OFC approach resulted in minimal reductions in
bacteriological cure rates.
Chapter 4 7.2.3
This study provided data on performance and management of UK dairy
herds, grouped according to the main putative origin of new cases of
mastitis. Many aspects of management that might be considered to be
important in mastitis control were not being practiced by a large
proportion of these herds. A better understanding of those practices not
widely adopted by UK dairy farmers at present may aid practitioners in
identifying and overcoming potential barriers to improved mastitis
control in UK dairy herds.

177
Chapter 5 7.2.4
In this study, data from 77 UK dairy herds were used to explore the cost-
effectiveness of specific mastitis control interventions in herds with a
particular problem with mastitis acquired during the dry period. The
results from the Bayesian micro-simulation identified many specific
mastitis control interventions that were likely to be cost-effective in many
different scenarios.
Chapter 6 7.2.5
In this study, data from 75 UK dairy herds were used to explore the cost-
effectiveness of specific mastitis control interventions in herds with a
particular problem with mastitis originating from the cows’ environment,
acquired during lactation. The results from the Bayesian micro-simulation
models demonstrated the probability of cost-effectiveness under different
scenarios, which were incorporated in a decision support tool that would
assist optimal decision making by veterinary practitioners in the field.
Overall 7.2.6
The overall aim of the thesis was to explore the cost of clinical mastitis
and cost-effectiveness of different approaches to mastitis treatment and
specific mastitis control interventions using probabilistic methods that
incorporated uncertainty. Bayesian approaches were used throughout the
thesis to capture and propagate sources of uncertainty that were
identifiable. The results from Chapters 2 and 3 highlight the need to
consider the risk of transmission and the potential impact of delayed
treatment when deciding how best to treat cases of clinical mastitis. The

178
results of the decision analytic models presented in Chapters 5 and 6
should facilitate decision making by allowing direct statements of
probability to be inferred about specific mastitis control interventions.
The research presented in this thesis as a whole, provides a greater
understanding of the economics of the treatment and control of mastitis
and aspects of this research will be made applicable to veterinary
practitioners and dairy farmers through the development of a decision
support tool.

179
References
Abel, U., Koch, A., 1999. The role of randomization in clinical studies:
myths and beliefs. J. Clin. Epidemiol. 52, 487–97.
Ades, A.E., Claxton, K., Sculpher, M., 2006a. Evidence synthesis, parameter
correlation and probabilistic sensitivity analysis. Health Econ. 15,
373–81.
Ades, A.E., Sculpher, M., Sutton, A., Abrams, K., Cooper, N., Welton, N., Lu,
G., 2006b. Bayesian Methods for Evidence Synthesis in Cost-
Effectiveness Analysis. Pharmacoeconomics 24, 1–19.
AHDB Dairy, 2014. GB Average Herd Size [WWW Document]. URL
http://dairy.ahdb.org.uk/resources-library/market-
information/farming-data/average-herd-size/ (accessed 1.11.16).
AHDB Dairy, 2015. UK Cow numbers [WWW Document]. URL
http://dairy.ahdb.org.uk/market-information/farming-data/cow-
numbers/uk-cow-numbers/ (accessed 1.12.16).
Algers, B., Blokhuis, H.J., Botner, A., Broom, D.M., Costa, P., Greiner, M.,
Hartung, J., Koenen, F., Müller-graf, C., Mohan, R., Morton, D.B.,
Osterhaus, A., Pfeiffer, D.U., Roberts, R., Sanaa, M., Salman, M., Sharp,
M., Vannier, P., Wierup, M., 2009. Scientific Opinion on the overall
effects of farming systems on dairy cow welfare and disease. EFSA J.
1143, 1–38.
180
Anderson, K.L., Smith, A.R., Shanks, R.D., Davis, L.E., Gustafsson, B.K., 1986.
Efficacy of flunixin meglumine for the treatment of endotoxin-
induced bovine mastitis. Am. J. Vet. Res. 47, 1366–72.
Anon, 2009. Veterinary Investigation Surveillance Report, Veterinary
Investigation Surveillance Report.
Archer, S.C., Mc Coy, F., Wapenaar, W., Green, M.J., 2013a. Association
between somatic cell count early in the first lactation and the
longevity of Irish dairy cows. J. Dairy Sci. 96, 2939–50.
Archer, S.C., Mc Coy, F., Wapenaar, W., Green, M.J., 2013b. Association
between somatic cell count early in the first lactation and the lifetime
milk yield of cows in Irish dairy herds. J. Dairy Sci. 96, 2951–9.
Archer, S.C., Mc Coy, F., Wapenaar, W., Green, M.J., 2014a. Association
between somatic cell count during the first lactation and the
cumulative milk yield of cows in Irish dairy herds. J. Dairy Sci. 97,
2135–44.
Archer, S.C., Mc Coy, F., Wapenaar, W., Green, M.J., 2014b. Bayesian
evaluation of budgets for endemic disease control: An example using
management changes to reduce milk somatic cell count early in the
first lactation of Irish dairy cows. Prev. Vet. Med. 113, 80–7.
Bach, A., Valls, N., Solans, A., Torrent, T., 2008. Associations between
nondietary factors and dairy herd performance. J. Dairy Sci. 91,
3259–67.
Banting, A., Banting, S., Heinonen, K., Mustonen, K., 2008. Efficacy of oral

181
and parenteral ketoprofen in lactating cows with endotoxin-induced
acute mastitis. Vet. Rec. 163, 506–9.
Bar, D., Tauer, L.W., Bennett, G., González, R.N., Hertl, J.A., Schukken, Y.H.,
Schulte, H.F., Welcome, F.L., Gröhn, Y.T., 2008. The cost of generic
clinical mastitis in dairy cows as estimated by using dynamic
programming. J. Dairy Sci. 91, 2205–14.
Bareille, N., Seegers, H., Fourichon, C., Beaudeau, F., Malher, X., 1998.
Survenue et expression des mammites cliniques et subcliniques en
troupeaux bovins laitiers: Facteurs de risque liés à la conception et à
l’utilisation du bâtiment., Rencontres Autour des Recherches sur les
Ruminants. Paris, France.
Barkema, H.W., Green, M.J., Bradley, A.J., Zadoks, R.N., 2009. Invited
review: The role of contagious disease in udder health. J. Dairy Sci.
92, 4717–29.
Barkema, H.W., Schukken, Y.H., Lam, T.J., Beiboer, M.L., Benedictus, G.,
Brand, A., 1998a. Management practices associated with low,
medium, and high somatic cell counts in bulk milk. J. Dairy Sci. 81,
1917–27.
Barkema, H.W., Schukken, Y.H., Lam, T.J., Beiboer, M.L., Benedictus, G.,
Brand, A., 1999a. Management practices associated with the
incidence rate of clinical mastitis. J. Dairy Sci. 82, 1643–54.
Barkema, H.W., Schukken, Y.H., Lam, T.J., Beiboer, M.L., Benedictus, G.,
Brand, A., 1999b. Management practices associated with the

182
incidence rate of clinical mastitis. J. Dairy Sci. 82, 1643–54.
Barkema, H.W., Schukken, Y.H., Lam, T.J., Beiboer, M.L., Wilmink, H.,
Benedictus, G., Brand, A., 1998b. Incidence of clinical mastitis in dairy
herds grouped in three categories by bulk milk somatic cell counts. J.
Dairy Sci. 81, 411–9.
Barkema, H.W., Schukken, Y.H., Zadoks, R.N., 2006. Invited Review: The
role of cow, pathogen, and treatment regimen in the therapeutic
success of bovine Staphylococcus aureus mastitis. J. Dairy Sci. 89,
1877–95.
Barlow, J.W., White, L.J., Zadoks, R.N., Schukken, Y.H., 2009. A
mathematical model demonstrating indirect and overall effects of
lactation therapy targeting subclinical mastitis in dairy herds. Prev.
Vet. Med. 90, 31–42.
Barnouin, J., Bord, S., Bazin, S., Chassagne, M., 2005. Dairy management
practices associated with incidence rate of clinical mastitis in low
somatic cell score herds in France. J. Dairy Sci. 88, 3700–9.
Barnouin, J., Chassagne, M., Bazin, S., Boichard, D., 2004. Management
practices from questionnaire surveys in herds with very low somatic
cell score through a national mastitis program in France. J. Dairy Sci.
87, 3989–99.
Bartlett, P.C., Miller, G.Y., Lance, S.E., Heider, L.E., 1992. Environmental
and managerial determinants of somatic cell counts and clinical
mastitis incidence in Ohio dairy herds. Prev. Vet. Med. 14, 195–207.
183
Bennett, R.H., 1982. Teat dip as a component of coliform mastitis control.
Dairy Food Sanitizer 2, 110–114.
Bennett, R.M., 1992. The use of “economic” quantitative modelling
techniques in livestock health and disease-control decision making: a
review. Prev. Vet. Med. 13, 63–76.
Benson, K., Hartz, A.J., 2000. A comparison of observational studies and
randomized, controlled trials. N. Engl. J. Med. 342, 1878–86.
Berry, E.A., 1998. Mastitis incidence in straw yards and cubicles. Vet. Rec.
142, 517–8.
Berry, E.A., Hillerton, J.E., 2002. The effect of selective dry cow treatment
on new intramammary infections. J. Dairy Sci. 85, 112–21.
Berry, E.A., Scrivens, M., Hillerton, J.E., 2005. Milking machine test survey
of UK herds. Vet. Rec. 157, 147–8.
Bewley, J., Palmer, R.W., Jackson-Smith, D.B., 2001. A comparison of free-
stall barns used by modernized Wisconsin dairies. J. Dairy Sci. 84,
528–41.
Biggs, A., 2005. Getting the most from cell counts. Cattle Pract. 13, 177–
184.
Blowey, R., Edmondson, P., 2010. Mastitis Control in Dairy Herds, 2nd ed.
CABI International.
Booth, J.M., 1997. Progress in mastitis control-an evolving problem. Proc.
Br. Mastit. Conf. 3–9.
184
Boshuizen, H.C., van Baal, P.H.M., 2009. Probabilistic sensitivity analysis:
be a Bayesian. Value Health 12, 1210–4.
Bradley, A.J., 2002. Bovine Mastitis: An Evolving Disease. Vet. J. 164, 116–
128.
Bradley, A.J., Breen, J.E., Green, M.J., 2007a. Management: Mastitis pattern
analysis - a fresh look at the analysis of bovine mastitis: Part I -
somatic cell count data. Livestock 12, 29–35.
Bradley, A.J., Breen, J.E., Green, M.J., 2008a. Management: Mastitis pattern
analysis—a fresh look at the analysis of bovine mastitis: Part 2—
Clinical mastitis data. Livestock 13, 1–5.
Bradley, A.J., Breen, J.E., Green, M.J., 2008b. Management: Mastitis pattern
analysis - a fresh look at the analysis of bovine mastitis: Part 2 -
Clinical mastitis data. Livestock 13, 30–35.
Bradley, A.J., Breen, J.E., Payne, B., White, V., Green, M.J., 2015. An
investigation of the efficacy of a polyvalent mastitis vaccine using
different vaccination regimens under field conditions in the United
Kingdom. J. Dairy Sci. 98, 1706–1720.
Bradley, A.J., Breen, J.E., Payne, B., Williams, P., Green, M.J., 2010. The use
of a cephalonium containing dry cow therapy and an internal teat
sealant , both alone and in combination. J. Dairy Sci. 93, 1566–1577.
Bradley, A.J., Green, M.J., 2000. A study of the incidence and significance of
intramammary enterobacterial infections acquired during the dry
period. J. Dairy Sci. 83, 1957–65.

185
Bradley, A.J., Green, M.J., 2001a. Adaptation of Escherichia coli to the
bovine mammary gland. J. Clin. Microbiol. 39, 1845–9.
Bradley, A.J., Green, M.J., 2001b. Aetiology of clinical mastitis in six
Somerset dairy herds. Vet. Rec. 148, 683–686.
Bradley, A.J., Green, M.J., 2001c. An investigation of the impact of
intramammary antibiotic dry cow therapy on clinical coliform
mastitis. J. Dairy Sci. 84, 1632–9.
Bradley, A.J., Green, M.J., 2004. The importance of the nonlactating period
in the epidemiology of intramammary infection and strategies for
prevention. Vet. Clin. North Am. Food Anim. Pract. 20, 547–68.
Bradley, A.J., Green, M.J., 2005. Use and interpretation of somatic cell
count data in dairy cows. In Pract. 27, 310–315.
Bradley, A.J., Green, M.J., 2009. Factors affecting cure when treating
bovine clinical mastitis with cephalosporin-based intramammary
preparations. J. Dairy Sci. 92, 1941–53.
Bradley, A.J., Green, M.J., Breen, J.E., Hudson, C.D., 2012. DairyCo Mastitis
Control Plan - three year report 2008-2012. Warwickshire.
Bradley, A.J., Green, M.J., Huxley, J.N., 2002. Making better use of milk
samples: monitoring and investigating herd mastitis. Cattle Pract.
2002 10, 105–112.
Bradley, A.J., Leach, K.A., Breen, J.E., Green, L.E., Green, M.J., 2007b. Survey
of the incidence and aetiology of mastitis on dairy farms in England
and Wales. Vet. Rec. 160, 253–258.

186
Bravo Vergel, Y., Palmer, S., Asseburg, C., Fenwick, E., de Belder, M.,
Abrams, K., Sculpher, M., 2007. Is primary angioplasty cost effective
in the UK? Results of a comprehensive decision analysis. Heart 93,
1238–43.
Breen, J.E., Green, M.J., Bradley, A.J., 2009. Quarter and cow risk factors
associated with the occurrence of clinical mastitis in dairy cows in
the United Kingdom. J. Dairy Sci. 92, 2551–61.
Brennan, M.L., Christley, R.M., 2012. Biosecurity on cattle farms: a study in
north-west England. PLoS One 7, e28139.
Briggs, A.H., 2000. Handling uncertainty in cost-effectiveness models.
Pharmacoeconomics 17, 479–500.
Briggs, A.H., Goeree, R., Blackhouse, G., O’Brien, B.J., 2002. Probabilistic
Analysis of Cost-Effectiveness Models: Choosing between Treatment
Strategies for Gastroesophageal Reflux Disease. Med. Decis. Making
22, 290–308.
Briggs, A.H., Gray, A.M., 1999. Handling uncertainty when performing
economic evaluations of health care interventions: a systematic
review with special reference to the variance and distributional form
of cost data. Health Technol. Assess. (Rockv). 3.
Brolund, L., 1985. Cell counts in bovine milk. Causes of variation and
applicability for diagnosis of subclinical mastitis. Acta Vet. Scand.
Suppl. 80, 1–123.
Brooks, S.P.B., Gelman, A.G., 1998. General Methods for Monitoring
187
Convergence of Iterative Simulations. J. Comput. Graph. Stat. 7, 434–
455.
Brown, J., Welton, N.J., Bankhead, C., Richards, S.H., Roberts, L., Tydeman,
C., Peters, T.J., 2006. A Bayesian approach to analysing the cost-
effectiveness of two primary care interventions aimed at improving
attendance for breast screening. Health Econ. 15, 435–45.
Burton, P.R., Gurrin, L.C., Campbell, M.J., 1998. Clinical significance not
statistical significance: a simple Bayesian alternative to p values. J.
Epidemiol. Community Health 52, 318–23.
Bushe, T., Oliver, S.P., 1987. Natural protective factors in bovine
mammary secretions following different methods of milk cessation. J.
Dairy Sci. 70, 696–704.
Buxton, M.J., Drummond, M.F., Van Hout, B.A., Prince, R.L., Sheldon, T.A.,
Szucs, T., Vray, M., 1997. Modelling in economic evaluation: an
unavoidable fact of life. Health Econ. 6, 217–227.
Byar, D.P., Simon, R.M., Friedewald, W.T., Schlesselman, J.J., DeMets, D.L.,
Ellenberg, J.H., Gail, M.H., Ware, J.H., 1976. Randomized clinical trials.
Perspectives on some recent ideas. N. Engl. J. Med. 295, 74–80.
Call, D.R., Davis, M.A., Sawant, A.A., 2008. Antimicrobial resistance in beef
and dairy cattle production. Anim. Health Res. Rev.
Cameron, M., Keefe, G.P., Roy, J.-P., Stryhn, H., Dohoo, I.R., McKenna, S.L.,
2015. Evaluation of selective dry cow treatment following on-farm
culture: Milk yield and somatic cell count in the subsequent lactation.

188
J. Dairy Sci. 98, 2427–36.
Chassagne, M., Barnouin, J., Chacornac, J.P., 1998. Biological predictors for
early clinical mastitis occurrence in Holstein cows under field
conditions in France. Prev. Vet. Med. 35, 29–38.
Claxton, K., Sculpher, M., McCabe, C., Briggs, A., Akehurst, R., Buxton, M.,
Brazier, J., O’Hagan, T., 2005. Probabilistic sensitivity analysis for
NICE technology assessment: not an optional extra. Health Econ. 14,
339–47.
Concato, J., Shah, N., Horwitz, R.I., 2000. Randomized, controlled trials,
observational studies, and the hierarchy of research designs. N. Engl.
J. Med. 342, 1887–92.
Cook, N.B., Bennett, T.B., Emery, K.M., Nordlund, K. V, 2002. Monitoring
nonlactating cow intramammary infection dynamics using DHI
somatic cell count data. J. Dairy Sci. 85, 1119–26.
Cooper, N.J., Abrams, K.R., Sutton, A.J., Turner, D., Lambert, P.C., 2003. A
Bayesian approach to Markov modelling in cost-effectiveness
analyses: application to taxane use in advanced breast cancer. J. R.
Stat. Soc. Ser. A (Statistics Soc. 166, 389–405.
Cooper, N.J., Sutton, A.J., Abrams, K.R., Turner, D., Wailoo, A., 2004.
Comprehensive decision analytical modelling in economic
evaluation: a Bayesian approach. Health Econ. 13, 203–26.
DairyCo, 2012a. GB farmgate milk prices [WWW Document]. URL
http://www.dairyco.org.uk/market-information/milk-prices-

189
contracts/farmgate-prices/uk,-gb-and-ni-farmgate-prices/
DairyCo, 2012b. http://www.dairyco.org.uk/market-information/farm-
expenses/cow-heifer-prices/gb-cow-heifer-prices/ [WWW
Document]. URL http://www.dairyco.org.uk/library/market-
information/datum/hygienic-quality.aspx
DairyCo, 2013. Dairy Statistics: An Insider’s Guide 2013.
DairyCo, 2014. DairyCo Mastitis Control Plan [WWW Document]. URL
http://www.mastitiscontrolplan.co.uk/
DairyCo, 2015. DairyCo data: GB Hygienic Quality [WWW Document]. URL
http://www.dairyco.org.uk/resources-library/market-
information/supply-production/gb-hygienic-quality/ (accessed
2.19.15).
De Vliegher, S., Barkema, H.W., Opsomer, G., de Kruif, A., Duchateau, L.,
2005. Association between somatic cell count in early lactation and
culling of dairy heifers using cox frailty models. J. Dairy Sci. 88, 560–
8.
De Vliegher, S., Laevens, H., Barkema, H.W., Dohoo, I.R., Stryhn, H.,
Opsomer, G., de Kruif, A., 2004. Management practices and heifer
characteristics associated with early lactation somatic cell count of
Belgian dairy heifers. J. Dairy Sci. 87, 937–47.
Derks, M., van Woudenbergh, B., Boender, M., Kremer, W., van Werven, T.,
Hogeveen, H., 2013. Veterinarian awareness of farmer goals and
attitudes to herd health management in The Netherlands. Vet. J. 198,
190
224–228.
Detilleux, J.C., 2004. Javelin diagrams: applications in veterinary medical
decision analysis. Vet. Res. 35, 617–24.
Dingwell, R.T., Leslie, K.E., Schukken, Y.H., Sargeant, J.M., Timms, L.L.,
Duffield, T.F., Keefe, G.P., Kelton, D.F., Lissemore, K.D., Conklin, J.,
2004. Association of cow and quarter-level factors at drying-off with
new intramammary infections during the dry period. Prev. Vet. Med.
63, 75–89.
Dohoo, I.R., Leslie, K.E., 1991. Evaluation of changes in somatic cell counts
as indicators of new intramammary infections. Prev. Vet. Med. 10,
225–237.
Döpfer, D., Barkema, H.W.W., Lam, T.J.G.M.J., Schukken, Y.H.H., Gaastra, W.,
1999. Recurrent Clinical Mastitis Caused by Escherichia coli in Dairy
Cows. J. Dairy Sci. 82, 80–85.
Dufour, S., Fréchette, A., Barkema, H.W., Mussell, A., Scholl, D.T., 2011.
Invited review: effect of udder health management practices on herd
somatic cell count. J. Dairy Sci. 94, 563–79.
Eberhart, R.J., Buckalew, J.M., 1977. Intramammary infections in a dairy
herd with a low incidence of Streptococcus agalactiae and
Staphylococcus aureus infections. J. Am. Vet. Med. Assoc. 171, 630–4.
Eckford, S., Grace, K., Harris, C., Reeves, H., Teale, C., Tallentire, C., 2013.
UK Veterinary Antibiotic Resistance and Sales Surveillance. Surrey,
UK.

191
EFSA, 2011. Scientific Opinion on the public health risks of bacterial
strains producing extended-spectrum β-lactamases and / or AmpC β-
lactamases in food and food producing animals. EFSA J. 9, 2322.
Elbers, A.R., Miltenburg, J.D., De Lange, D., Crauwels, A.P., Barkema, H.W.,
Schukken, Y.H., 1998. Risk factors for clinical mastitis in a random
sample of dairy herds from the southern part of The Netherlands. J.
Dairy Sci. 81, 420–6.
Erskine, R.J., Eberhart, R.J., 1991. Post-milking teat dip use in dairy herds
with high or low somatic cell counts. J. Am. Vet. Med. Assoc. 199,
1734–6.
Erskine, R.J., Eberhart, R.J., Hutchinson, L.J., Spencer, S.B., 1987. Herd
management and prevalence of mastitis in dairy herds with high and
low somatic cell counts. J. Am. Vet. Med. Assoc. 190, 1411–6.
Erskine, R.J., Eberhart, R.J., Hutchinson, L.J., Spencer, S.B., Campbell, M.A.,
1988. Incidence and types of clinical mastitis in dairy herds with high
and low somatic cell counts. J. Am. Vet. Med. Assoc. 192, 761–5.
Espejo, L.A., Endres, M.I., 2007. Herd-level risk factors for lameness in
high-producing holstein cows housed in freestall barns. J. Dairy Sci.
90, 306–14.
European Commission, 2004. REGULATION (EC) No. 853/2004 OF THE
EUROPEAN PARLIAMENT AND OF THE COUNCIL.
Farm Animal Welfare Council, 2009. OPINION ON THE WELFARE OF THE
DAIRY COW. www.fawc.org.uk.
192
Farm Animal Welfare Council Press Statement, 1979.
Feinstein, A.R., 1984. Current problems and future challenges in
randomized clinical trials. Circulation 70, 767–74.
Feinstein, A.R., 1989. Epidemiologic analyses of causation: the unlearned
scientific lessons of randomized trials. J. Clin. Epidemiol. 42, 481–9;
discussion 499–502.
Felli, J., Hazen, G., 1999. A Bayesian approach to sensitivity analysis.
Health Econ. 263–268.
Fenlon, D.R., Logue, D.N., Gunn, J., Wilson, J., 1995. A study of mastitis
bacteria and herdmanagement practices to identify their relationship
to high somatic cell counts in bulk tank milk. Br. Vet. J. 151, 17–25.
Fitzpatrick, J., Young, F.J., Eckersall, D., Logue, D.N., Knight, C.J., Nolan, A.,
1998. Recognising and controlling pain and inflammation in mastitis,
in: British Mastitis Conference 1998. pp. 36–44.
Fox, L.K., Gay, J.M., 1993. Contagious mastitis. Vet. Clin. North Am. Food
Anim. Pract. 9, 475–87.
Gelman, A., Rubin, D.B., 1992. Inference from Iterative Simulation Using
Multiple Sequences. Stat. Sci. 7, 457–472.
Geman, S., Geman, D., 1984. Stochastic Relaxation, Gibbs Distributions,
and the Bayesian Restoration of Images. IEEE Trans. Pattern Anal.
Mach. Intell. PAMI-6, 721–741.
Gilks, W.R., Richardson, S., Spiegelhalter, D.J., 1995. Markov Chain Monte
Carlo in Practice. CRC Press.
193
Gillespie, B.E., Owens, W.E., Nickerson, S.C., Oliver, S.P., 1999.
Deoxyribonucleic acid fingerprinting of Staphylococcus aureus from
heifer mammary secretions and from horn flies. J. Dairy Sci. 82,
1581–5.
Gillies, C.L., Lambert, P.C., Abrams, K.R., Sutton, A.J., Cooper, N.J., Hsu, R.T.,
Davies, M.J., Khunti, K., 2008. Different strategies for screening and
prevention of type 2 diabetes in adults: cost effectiveness analysis.
BMJ 336, 1180–5.
González, S.M., Steiner, A., Gassner, B., Regula, G., 2010. Antimicrobial use
in Swiss dairy farms: quantification and evaluation of data quality.
Prev. Vet. Med. 95, 50–63.
Green, M.J., 2012. Dairy herd health. CABI, Wallingford.
Green, M.J., Bradley, A.J., Medley, G.F., Browne, W.J., 2007a. Cow, farm, and
management factors during the dry period that determine the rate of
clinical mastitis after calving. J. Dairy Sci. 90, 3764–76.
Green, M.J., Bradley, A.J., Medley, G.F., Browne, W.J., 2008. Cow, farm, and
herd management factors in the dry period associated with raised
somatic cell counts in early lactation. J. Dairy Sci. 91, 1403–15.
Green, M.J., Green, L.E., Medley, G.F., Schukken, Y.H., Bradley, A.J., 2002.
Influence of dry period bacterial intramammary infection on clinical
mastitis in dairy cows. J. Dairy Sci. 85, 2589–99.
Green, M.J., Hudson, C.D., Breen, J.E., Bradley, A.J., 2009. The true costs of
mastitis. Br. Mastit. Conf. 2009, Stoneleigh Park. Warwickshire, UK,
194
14th Oct. 2009; 2009.
Green, M.J., Leach, K.A., Breen, J.E., Green, L.E., Bradley, A.J., 2007b.
National intervention study of mastitis control in dairy herds in
England and Wales. Vet. Rec. 160, 287–293.
Green, M.J., Medley, G.F., Bradley, A.J., Browne, W.J., 2010. Management
interventions in dairy herds: exploring within herd uncertainty using
an integrated Bayesian model. Vet. Res. 41, 22.
Greenland, S., Poole, C., 2013. Living with p values: resurrecting a
Bayesian perspective on frequentist statistics. Epidemiology 24, 62–
8.
Gurrin, L.C., Kurinczuk, J.J., Burton, P.R., 2000. Bayesian statistics in
medical research: an intuitive alternative to conventional data
analysis. J. Eval. Clin. Pract. 6, 193–204.
Hagnestam, C., Emanuelson, U., Berglund, B., 2007. Yield losses associated
with clinical mastitis occurring in different weeks of lactation. J. Dairy
Sci. 90, 2260–70.
Hagnestam-Nielsen, C., Ostergaard, S., 2009. Economic impact of clinical
mastitis in a dairy herd assessed by stochastic simulation using
different methods to model yield losses. Animal 3, 315–28.
Halasa, T., 2012. Bioeconomic modeling of intervention against clinical
mastitis caused by contagious pathogens. J. Dairy Sci. 1–10.
Halasa, T., Huijps, K., Østerås, O., Hogeveen, H., 2007. Economic effects of
bovine mastitis and mastitis management: a review. Vet. Q. 29, 18–

195
31.
Halasa, T., Nielen, M., Huirne, R.B.M., Hogeveen, H., 2009. Stochastic bio-
economic model of bovine intramammary infection. Livest. Sci. 124,
295–305.
Halasa, T., Nielen, M., Werven, T. Van, Hogeveen, H., 2010. A simulation
model to calculate costs and benefits of dry period interventions in
dairy cattle. Livest. Sci. 129, 80–87.
Hall, J., Wapenaar, W., 2012. Opinions and practices of veterinarians and
dairy farmers towards herd health management in the UK. Vet. Rec.
170, 441.
Hastings, W.K., 1970. Monte Carlo sampling methods using Markov chains
and their applications. Biometrika 57, 97–109.
Heikkilä, A.-M., Nousiainen, J.I., Pyörälä, S., 2012. Costs of clinical mastitis
with special reference to premature culling. J. Dairy Sci. 95, 139–150.
Hess, J.L., Neuder, L.M., Sears, P.M., 2003. Rethinking clinical mastitis
therapy, in: Proceedings of the National Mastitis Council. Madison,
WI, pp. 372–373.
Hill, A.W., Shears, A.L., 1979. Recurrent coliform mastitis in the dairy cow.
Vet. Rec. 105, 299–301.
Hillerton, J.E., Semmens, J.E., 1999. Comparison of Treatment of Mastitis
by Oxytocin or Antibiotics Following Detection According to Changes
in Milk Electrical Conductivity Prior to Visible Signs. J. Dairy Sci. 82,
93–98.

196
Hogan, J.S., Harmon, R.J., Langlois, B.E., Hemken, R.W., Crist, W.L., 1984.
Efficacy of an iodine backflush for preventing new intramammary
infections. J. Dairy Sci. 67, 1850–9.
Hogan, J.S., Smith, K.L., Hoblet, K.H., Todhunter, D.A., Schoenberger, P.S.,
Hueston, W.D., Pritchard, D.E., Bowman, G.L., Heider, L.E., Brockett,
B.L., 1989. Bacterial counts in bedding materials used on nine
commercial dairies. J. Dairy Sci. 72, 250–8.
Hogan, J.S., Smith, K.L., Todhunter, D.A., Schoenberger, P.S., 1990. Bacterial
counts associated with recycled newspaper bedding. J. Dairy Sci. 73,
1756–61.
Hudson, C.D., 2015. Big data and the dairy cow: Factors affecting fertility
in UK herds. University of Nottingham.
Hudson, C.D., Bradley, A.J., Breen, J.E., Green, M.J., 2015. Dairy herd
mastitis and reproduction: using simulation to aid interpretation of
results from discrete time survival analysis. Vet. J. 204, 47–53.
Hudson, C.D., Huxley, J.N., Green, M.J., 2014. Using simulation to interpret
a discrete time survival model in a complex biological system:
fertility and lameness in dairy cows. PLoS One 9, e103426.
Huijps, K., Hogeveen, H., Lam, T.J.G.M., Oude Lansink, A.G.J.M., 2010. Costs
and efficacy of management measures to improve udder health on
Dutch dairy farms. J. Dairy Sci. 93, 115–24.
Huijps, K., Lam, T.J., Hogeveen, H., 2008. Costs of mastitis: facts and
perception. J. Dairy Res. 75, 113–20.
197
Hunink, M.G.M., Weinstein, M.C., Wittenberg, E., Drummond, M.F., Pliskin,
J.S., Wong, J.B., Glasziou, P.P., 2014. Decision Making in Health and
Medicine: Integrating Evidence and Values. Cambridge University
Press.
Hutton, C.T., Fox, L.K., Hancock, D.D., 1990. Mastitis control practices:
differences between herds with high and low milk somatic cell
counts. J. Dairy Sci. 73, 1135–43.
Hutton, C.T., Fox, L.K., Hancock, D.D., 1991. Risk factors associated with
herd-group milk somatic cell count and prevalence of coagulase-
positive staphylococcal intramammary infections. Prev. Vet. Med. 11,
25–35.
Huxley, J.N., Green, M.J., Green, L.E., Bradley, A.J., 2002. Evaluation of the
Efficacy of an Internal Teat Sealer During the Dry Period. J. Dairy Sci.
85, 551–561.
Huxley, J.N., Whay, H.R., 2007. Is mastitis painful? Br. Mastit. Conf. 2007,
Warwickshire, UK, 10th Oct. 2007; 2007.
Jayarao, B.M., Pillai, S.R., Sawant, A.A., Wolfgang, D.R., Hegde, N. V, 2004.
Guidelines for monitoring bulk tank milk somatic cell and bacterial
counts. J. Dairy Sci. 87, 3561–73.
Keefe, G., 2012. Update on control of Staphylococcus aureus and
Streptococcus agalactiae for management of mastitis. Vet. Clin. North
Am. Food Anim. Pract. 28, 203–16.
Khaitsa, M.L., Wittum, T.E., Smith, K.L., Henderson, J.L., Hoblet, K.H., 2000.
198
Herd characteristics and management practices associated with
bulk-tank somatic cell counts in herds in official Dairy Herd
Improvement Association programs in Ohio. Am. J. Vet. Res. 61,
1092–8.
Kingwill, R.G., Neave, F.K., Dodd, F.H., Griffin, T.K., Westgarth, D.R., Wilson,
C.D., 1970. The effect of a mastitis control system on levels of
subclinical and clinical mastitis in two years. Vet. Rec. 87, 94–100.
Kossaibati, M.A., Esslemont, R.J., 1997. The costs of production diseases in
dairy herds in England. Vet. J. 154, 41–51.
Kossaibati, M.A., Esslemont, R.J., 2000. The costs of clinical mastitis in UK
dairy herds. Cattle Pract. 8, 323–327.
Kossaibati, M.A., Hovi, M., Esslemont, R.J., 1998. Incidence of clinical
mastitis in dairy herds in England. Vet. Rec. 143, 649–53.
Kremer, W.D., Noordhuizen-Stassen, E.N., Grommers, F.J., Schukken, Y.H.,
Heeringa, R., Brand, A., Burvenich, C., 1993. Severity of experimental
Escherichia coli mastitis in ketonemic and nonketonemic dairy cows.
J. Dairy Sci. 76, 3428–36.
Lago, A., Godden, S.M., Bey, R., Ruegg, P.L., Leslie, K., 2011a. The selective
treatment of clinical mastitis based on on-farm culture results: I.
Effects on antibiotic use, milk withholding time, and short-term
clinical and bacteriological outcomes. J. Dairy Sci. 94, 4441–56.
Lago, A., Godden, S.M., Bey, R., Ruegg, P.L., Leslie, K., 2011b. The selective
treatment of clinical mastitis based on on-farm culture results: II.
199
Effects on lactation performance, including clinical mastitis
recurrence, somatic cell count, milk production, and cow survival. J.
Dairy Sci. 94, 4457–67.
Lam, T.J., DeJong, M.C., Schukken, Y.H., Brand, A., 1996a. Mathematical
modeling to estimate efficacy of postmilking teat disinfection in split-
udder trials of dairy cows. J. Dairy Sci. 79, 62–70.
Lam, T.J., Lipman, L.J., Schukken, Y.H., Gaastra, W., Brand, A., 1996b.
Epidemiological characteristics of bovine clinical mastitis caused by
Staphylococcus aureus and Escherichia coli studied by DNA
fingerprinting. Am. J. Vet. Res. 57, 39–42.
Lam, T.J., van Vliet, J.H., Schukken, Y.H., Grommers, F.J., van Velden-
Russcher, A., Barkema, H.W., Brand, A., 1997. The effect of
discontinuation of postmilking teat disinfection in low somatic cell
count herds. II. Dynamics of intramammary infections. Vet. Q. 19, 47–
53.
Lam, T.J.G.M., van den Borne, B.H.P., Jansen, J., Huijps, K., van Veersen,
J.C.L., van Schaik, G., Hogeveen, H., 2013. Improving bovine udder
health: a national mastitis control program in the Netherlands. J.
Dairy Sci. 96, 1301–11.
Langford, F.M., Rutherford, K.M., Jack, M.C., Sherwood, L., Lawrence, A.B.,
Haskell, M.J., 2009. A comparison of management practices, farmer-
perceived disease incidence and winter housing on organic and non-
organic dairy farms in the UK. J. Dairy Res. 76, 6–14.

200
Lee, C.S., Wooding, F.B., Kemp, P., 1980. Identification, properties, and
differential counts of cell populations using electron microscopy of
dry cows secretions, colostrum and milk from normal cows. J. Dairy
Res. 47, 39–50.
Leslie, K.E., Petersson-Wolfe, C.S., 2012. Assessment and management of
pain in dairy cows with clinical mastitis. Vet. Clin. North Am. Food
Anim. Pract. 28, 289–305.
Lopez-Benavides, M., Williamson, J., Cursons, R., 2005. Associations
between Streptococcus uberis populations on farm races and climatic
changes during a twelve-month period. Proc. New Zeal. Soc. Anim.
Prod. 65, 153 – 156.
Lopez-Benavides, M.G., Williamson, J.H., Pullinger, G.D., Lacy-Hulbert, S.J.,
Cursons, R.T., Leigh, J.A., 2007. Field observations on the variation of
Streptococcus uberis populations in a pasture-based dairy farm. J.
Dairy Sci. 90, 5558–66.
Lowe, P., 2009. Unlocking potential: A report on veterinary expertise in
food animal production.
Lunn, D., Spiegelhalter, D., Thomas, A., Best, N., 2009. The BUGS project:
Evolution, critique and future directions. Stat. Med. 28, 3049–67.
Lunn, D.J., Thomas, A., Best, N., Spiegelhalter, D., 2000. WinBUGS - A
Bayesian modelling framework: Concepts, structure, and
extensibility, Statistics and Computing. Springer Netherlands.
MacDonald, K., 2011. Evaluation of a 3M Petrifilm on-farm mastitis
201
culture system and treatment decision algorithm for clinical mastitis
in Canada. University of Prince Edward Island.
Martin, W., 2013. Making valid causal inferences from observational data.
Prev. Vet. Med. 113, 281–297.
McDonald, J.S., Anderson, A.J., 1981. Experimental intramammary
infection of the dairy cow with Escherichia coli during the
nonlactating period. Am. J. Vet. Res. 42, 229–31.
McDougall, S., Arthur, D.G., Bryan, M.A. V, Ermunt, J.J., Weir, A.M., 2007.
Clinical and bacteriological response to treatment of clinical mastitis
with one of three intramammary antibiotics. N. Z. Vet. J. 55, 10.
McDougall, S., Bryan, M.A., Tiddy, R.M., 2009. Effect of treatment with the
nonsteroidal antiinflammatory meloxicam on milk production,
somatic cell count, probability of re-treatment, and culling of dairy
cows with mild clinical mastitis. J. Dairy Sci. 92, 4421–31.
Mein, G.A., 2012. The role of the milking machine in mastitis control. Vet.
Clin. North Am. Food Anim. Pract. 28, 307–20.
Metropolis, N., 1987. The beginning of the Monte Carlo method. Los
Alamos Sci. 15, 125–130.
Metropolis, N., Rosenbluth, A.W., Rosenbluth, M.N., Teller, A.H., Teller, E.,
1953. Equation of State Calculations by Fast Computing Machines. J.
Chem. Phys. 21, 1087.
Middleton, J.R., Fox, L.K., Smith, T.H., 2001. Management strategies to
decrease the prevalence of mastitis caused by one strain of

202
Staphylococcus aureus in a dairy herd. J. Am. Vet. Med. Assoc. 218,
1615–8, 1581–2.
Milne, M., Barret, D., Fitzpatrick, J., Biggs, A., 2002. Prevalence and
aetiology of clinical mastitis on dairy farms in Devon. Vet. Rec. 151,
241.
Morton, J.M., Penry, J.F., Malmo, J., Mein, G.A., 2014. Premilking teat
disinfection: Is it worthwhile in pasture-grazed dairy herds? J. Dairy
Sci. 97, 7525–7537.
National Mastitis Council, 2006. NMC 10-point plan [WWW Document].
URL http://www.nmconline.org/documents.html (accessed 1.8.16).
Neave, F.K., Dodd, F.H., Kingwill, R.G., 1966. A method of controlling udder
disease. Vet. Rec. 78, 521–3.
Neave, F.K., Dodd, F.H., Kingwill, R.G., Westgarth, D.R., 1969. Control of
mastitis in the dairy herd by hygiene and management. J. Dairy Sci.
52, 696–707.
Neeser, N.L., Hueston, W.D., Godden, S.M., Bey, R.F., 2006. Evaluation of
the use of an on-farm system for bacteriologic culture of milk from
cows with low-grade mastitis. J. Am. Vet. Med. Assoc. 228, 254–60.
Nickerson, S.C., Owens, W.E., Boddie, R.L., 1995. Mastitis in dairy heifers:
initial studies on prevalence and control. J. Dairy Sci. 78, 1607–18.
Nuzzo, R., 2014. Scientific method: statistical errors. Nature 506, 150–2.
Nyman, A.-K., Ekman, T., Emanuelson, U., Gustafsson, A.H., Holtenius, K.,
Waller, K.P., Sandgren, C.H., 2007. Risk factors associated with the

203
incidence of veterinary-treated clinical mastitis in Swedish dairy
herds with a high milk yield and a low prevalence of subclinical
mastitis. Prev. Vet. Med. 78, 142–60.
O’Brien, B.J., Drummond, M.F., Labelle, R.J., Willan, A., 1994. In search of
power and significance: issues in the design and analysis of
stochastic cost-effectiveness studies in health care. Med. Care 32,
150–63.
O’Hagan, A., 2003. A primer on Bayesian statistics in Health Economics
and Outcomes Research. London Medtap Int. Inc.
O’Hagan, A., Stevens, J.W., 2001. A framework for cost-effectiveness
analysis from clinical trial data. Health Econ. 10, 303–15.
O’Neill, J., 2015. Antimicrobials in agriculture and the environment:
reducing unnecessary use and waste.
O’Reilly, K., Green, M., Peeler, E., 2006. Investigation of risk factors for
clinical mastitis in British dairy herds with bulk milk somatic cell
counts less than 150,000 cells/ml. Vet. Rec. 158, 649–653.
O’Rourke, D., 2009. Nutrition and udder health in dairy cows: a review. Ir.
Vet. J. 62 Suppl 4, S15–20.
Odensten, M.O., Berglund, B., Persson Waller, K., Holtenius, K., 2007.
Metabolism and udder health at dry-off in cows of different breeds
and production levels. J. Dairy Sci. 90, 1417–28.
Olde Riekerink, R.G.M., Barkema, H.W., Scholl, D.T., Poole, D.E., Kelton, D.F.,
2010. Management practices associated with the bulk-milk
204
prevalence of Staphylococcus aureus in Canadian dairy farms. Prev.
Vet. Med. 97, 20–8.
Oliver, S.P., Gillespie, B.E., Lewis, M.J., Ivey, S.J., Almeida, R.A., Luther, D.A.,
Johnson, D.L., Lamar, K.C., Moorehead, H.D., Dowlen, H.H., 2001.
Efficacy of a new premilking teat disinfectant containing a phenolic
combination for the prevention of mastitis. J. Dairy Sci. 84, 1545–9.
Oliver, S.P., Lewis, M.J., Ingle, T.L., Gillespie, B.E., Matthews, K.R., 1993.
Prevention of bovine mastitis by a premilking teat disinfectant
containing chlorous acid and chlorine dioxide. J. Dairy Sci. 76, 287–
92.
Oliver, S.P., Mitchell, B.A., 1983. Susceptibility of bovine mammary gland
to infections during the dry period. J. Dairy Sci. 66, 1162–6.
Oliver, S.P., Murinda, S.E., Jayarao, B.M., 2011. Impact of antibiotic use in
adult dairy cows on antimicrobial resistance of veterinary and
human pathogens: a comprehensive review. Foodborne Pathog. Dis.
8, 337–55.
Oltenacu, P.A., Ekesbo, I., 1994. Epidemiological study of clinical mastitis
in dairy cattle. Vet. Res. 25, 208–12.
Owens, W.E., Oliver, S.P., Gillespie, B.E., Ray, C.H., Nickerson, S.C., 1998.
Role of horn flies (Haematobia irritans) in Staphylococcus aureus-
induced mastitis in dairy heifers. Am. J. Vet. Res. 59, 1122–4.
Paape, M., Mehrzad, J., Zhao, X., Detilleux, J., Burvenich, C., 2002. Defense
of the bovine mammary gland by polymorphonuclear neutrophil

205
leukocytes. J. Mammary Gland Biol. Neoplasia 7, 109–21.
Page, S.W., 1991. Chloramphenicol 1. Hazards of use and the current
regulatory environment. Aust. Vet. J. 68, 1–2.
Pankey, J.W., Wildman, E.E., Drechsler, P.A., Hogan, J.S., 1987. Field trial
evaluation of premilking teat disinfection. J. Dairy Sci. 70, 867–72.
Parmigiani, G., 2002. Modeling in Medical Decision Making: A Bayesian
Approach. Wiley, Chichester, UK.
Peeler, E.J., Green, M.J., Fitzpatrick, J.L., Green, L.E., 2002. Study of clinical
mastitis in British dairy herds with bulk milk somatic cell counts less
than 150,000 cells/ml. Vet. Rec. 151, 170–6.
Peeler, E.J., Green, M.J., Fitzpatrick, J.L., Morgan, K.L., Green, L.E., 2000.
Risk factors associated with clinical mastitis in low somatic cell count
British dairy herds. J. Dairy Sci. 83, 2464–72.
Piepers, S., De Vliegher, S., de Kruif, A., Opsomer, G., Barkema, H.W., 2009.
Impact of intramammary infections in dairy heifers on future udder
health, milk production, and culling. Vet. Microbiol. 134, 113–20.
Piepers, S., Peeters, K., Opsomer, G., Barkema, H.W., Frankena, K., De
Vliegher, S., 2011. Pathogen group specific risk factors at herd, heifer
and quarter levels for intramammary infections in early lactating
dairy heifers. Prev. Vet. Med. 99, 91–101.
Pol, M., Ruegg, P.L.L., 2007. Treatment practices and quantification of
antimicrobial drug usage in conventional and organic dairy farms in
Wisconsin. J. Dairy Sci. 90, 249–61.

206
R Development Core Team, 2012. R: A Lanuage and Environment for
Statistical Computing. R Foundation for Statistical Computing,
Vienna, Austria.
Radostits, O.M., Leslie, K.E., Fetrow, J., 1994. Herd Health - Food Animal
Production Medicine. W.B. Saunders.
Raiffa, H., 1968. Decision analysis: introductory lectures on choices under
uncertainty. Random House.
Rajala-Schultz, P.J., Hogan, J.S., Smith, K.L., 2005. Short communication:
association between milk yield at dry-off and probability of
intramammary infections at calving. J. Dairy Sci. 88, 577–9.
Reneau, J.K., 1986. Effective use of dairy herd improvement somatic cell
counts in mastitis control. J. Dairy Sci. 69, 1708–20.
Roberson, J.R., 2012. Treatment of clinical mastitis. Vet. Clin. North Am.
Food Anim. Pract. 28, 271–88.
Rodrigues, A.C.O., Caraviello, D.Z., Ruegg, P.L., 2005. Management of
Wisconsin dairy herds enrolled in milk quality teams. J. Dairy Sci. 88,
2660–71.
Rubin, D.B., 2007. The design versus the analysis of observational studies
for causal effects: parallels with the design of randomized trials. Stat.
Med. 26, 20–36.
Ruegg, P.L., Dohoo, I.R., 1997. A benefit to cost analysis of the effect of
premilking teat hygiene on somatic cell count and intramammary
infections in a commercial dairy herd. Can. Vet. J. 38, 632–6.
207
Sacks, H., Chalmers, T.C., Smith, H., 1982. Randomized versus historical
controls for clinical trials. Am. J. Med. 72, 233–40.
Sayers, R.G., Good, M., Sayers, G.P., 2014. A survey of biosecurity-related
practices, opinions and communications across dairy farm
veterinarians and advisors. Vet. J. 200, 261–9.
Schepers, A.J., Lam, T.J., Schukken, Y.H., Wilmink, J.B., Hanekamp, W.J.,
1997. Estimation of variance components for somatic cell counts to
determine thresholds for uninfected quarters. J. Dairy Sci. 80, 1833–
40.
Scherpenzeel, C.G.M., den Uijl, I.E.M., van Schaik, G., Olde Riekerink, R.G.M.,
Keurentjes, J.M., Lam, T.J.G.M., 2014. Evaluation of the use of dry cow
antibiotics in low somatic cell count cows. J. Dairy Sci. 97, 3606–14.
Schukken, Y.H., Grommers, F.J., Van de Geer, D., Erb, H.N., Brand, A., 1990.
Risk factors for clinical mastitis in herds with a low bulk milk somatic
cell count. 1. Data and risk factors for all cases. J. Dairy Sci. 73, 3463–
71.
Schukken, Y.H., Grommers, F.J., van de Geer, D., Erb, H.N., Brand, A., 1991.
Risk factors for clinical mastitis in herds with a low bulk milk somatic
cell count. 2. Risk factors for Escherichia coli and Staphylococcus
aureus. J. Dairy Sci. 74, 826–32.
Schukken, Y.H., Wilson, D.J., Welcome, F., Garrison-Tikofsky, L., Gonzalez,
R.N., 2003. Monitoring udder health and milk quality using somatic
cell counts. Vet. Res. 34, 579–96.
208
Sears, P.M., McCarthy, K.K., 2003. Management and treatment of
staphylococcal mastitis. Vet. Clin. North Am. Food Anim. Pract. 19,
171–185.
Sérieys, F., Poutrel, B., 1996. Field trial evaluation of two teat dips
containing nisin or polyvinylpyrrolidone iodophor designed for use
before and after milking. Vet. Res. 27, 295–303.
Shpigel, N.Y., Chen, R., Winkler, M., Saran, A., Ziv, G., Longo, F., 1994. Anti-
inflammatory ketoprofen in the treatment of field cases of bovine
mastitis. Res. Vet. Sci. 56, 62–8.
Smith, Peter, Sculpher, Mark, Ginnelly, Laura, 2004. Health Policy And
Economics: Opportunities And Challenges: Opportunities and
Challenges. McGraw-Hill Education (UK).
Smith, A., Neave, F.K., Dodd, F.H., 1966. Methods of reducing the incidence
of udder infection in dry cows. Vet. Rec. 79, 233–6.
Smith, A., Westgarth, D.R., Jones, M.R., Neave, F.K., Dodd, F.H., Brander,
G.C., 1967. Methods of reducing the incidence of udder infection in
dry cows. Vet. Rec. 81, 504–10.
Smith, J.W., Ely, L.O., 1997. The Influence of Feeding and Housing Systems
on Production, Reproduction, and Somatic Cell Count Scores of
Southern Holstein Herds. Prof. Anim. Sci. 13, 155–161.
Smith, K.L., Todhunter, D.A., Schoenberger, P.S., 1985. Environmental
pathogens and intramammary infection during the dry period. J.
Dairy Sci. 68, 402–17.

209
Smith, T.W., Eberhart, R.J., Spencer, S.B., Kesler, E.M., Hargrove, G.L.,
Wilson, R.W., Heald, C.W., 1985. Effect of automatic backflushing on
number of new intramammary infections, bacteria on teatcup liners,
and milk iodine. J. Dairy Sci. 68, 424–32.
Sordillo, L.M., Shafer-Weaver, K., DeRosa, D., 1997. Immunobiology of the
mammary gland. J. Dairy Sci. 80, 1851–65.
Sorge, U., Kelton, D., Lissemore, K., Godkin, a, Hendrick, S., Wells, S., 2010.
Attitudes of Canadian dairy farmers toward a voluntary Johne’s
disease control program. J. Dairy Sci. 93, 1491–1499.
Sox, H.C., Blatt, M.A., Higgins, M.C., 1988. Medical Decision Making. ACP
Press.
Spiegelhalter, D.J., 2004. Incorporating Bayesian Ideas into Health-Care
Evaluation. Stat. Sci. 19, 156–174.
Spiegelhalter, D.J., Abrams, K.R., Myles, J.P., 2004. Bayesian Approaches to
Clinical Trials and Health-Care Evaluation. John Wiley & Sons, Ltd,
Chichester, UK.
Spiegelhalter, D.J., Best, N.G., 2003. Bayesian approaches to multiple
sources of evidence and uncertainty in complex cost-effectiveness
modelling. Stat. Med. 22, 3687–709.
Steeneveld, W., van Werven, T., Barkema, H.W., Hogeveen, H., 2011. Cow-
specific treatment of clinical mastitis: an economic approach. J. Dairy
Sci. 94, 174–88.
Swinkels, J.M., Hogeveen, H., Zadoks, R.N., 2005. A partial budget model to
210
estimate economic benefits of lactational treatment of subclinical
Staphylococcus aureus mastitis. J. Dairy Sci. 88, 4273–87.
Swinkels, J.M., Rooijendijk, J.G., Zadoks, R.N., Hogeveen, H., 2005. Use of
partial budgeting to determine the economic benefits of antibiotic
treatment of chronic subclinical mastitis caused by Streptococcus
uberis or Streptococcus dysgalactiae. J. Dairy Res. 72, 75–85.
Thomas, A., O’Hara, B., Ligges, U., Sturtz, S., 2006. Making BUGS Open. R
News 6, 12–17.
Thomson, K., Rantala, M., Hautala, M., Pyörälä, S., Kaartinen, L., 2008.
Cross-sectional prospective survey to study indication-based usage
of antimicrobials in animals: results of use in cattle. BMC Vet. Res. 4,
15.
Todhunter, D.A., Smith, K.L., Hogan, J.S., 1995. Environmental
streptococcal intramammary infections of the bovine mammary
gland. J. Dairy Sci. 78, 2366–74.
Todhunter, D.A., Smith, K.L., Hogan, J.S., Schoenberger, P.S., 1991. Gram-
negative bacterial infections of the mammary gland in cows. Am. J.
Vet. Res. 52, 184–8.
Tschopp, A., Reist, M., Kaufmann, T., Bodmer, M., Kretzschmar, L.,
Heiniger, D., Berchtold, B., Wohlfender, F., Harisberger, M., Boss, R.,
Strabel, D., Cousin, M.-E., Graber, H.U., Steiner, A., van den Borne,
B.H.P., 2015. A multiarm randomized field trial evaluating strategies
for udder health improvement in Swiss dairy herds. J. Dairy Sci. 98,
211
840–60.
Tucker, C.B., Lacy-Hulbert, S.J., Webster, J.R., 2009. Effect of milking
frequency and feeding level before and after dry off on dairy cattle
behavior and udder characteristics. J. Dairy Sci. 92, 3194–203.
van den Borne, B.H.P., Halasa, T., van Schaik, G., Hogeveen, H., Nielen, M.,
2010a. Bioeconomic modeling of lactational antimicrobial treatment
of new bovine subclinical intramammary infections caused by
contagious pathogens. J. Dairy Sci. 93, 4034–44.
van den Borne, B.H.P., van Schaik, G., Lam, T.J.G.M., Nielen, M., 2010b.
Therapeutic effects of antimicrobial treatment during lactation of
recently acquired bovine subclinical mastitis: two linked randomized
field trials. J. Dairy Sci. 93, 218–33.
Vangroenweghe, F., Duchateau, L., Boutet, P., Lekeux, P., Rainard, P.,
Paape, M.J., Burvenich, C., 2005. Effect of carprofen treatment
following experimentally induced Escherichia coli mastitis in
primiparous cows. J. Dairy Sci. 88, 2361–76.
Wagner, A.M., Ruegg, P.L., 2002. The effect of manual forestripping on
milking performance of Holstein dairy cows. J. Dairy Sci. 85, 804–9.
Watts, J.L., 1988. Etiological agents of bovine mastitis. Vet. Microbiol. 16,
41–66.
Welton, N.J., Johnstone, E.C., David, S.P., Munafò, M.R., 2008. A cost-
effectiveness analysis of genetic testing of the DRD2 Taq1A
polymorphism to aid treatment choice for smoking cessation.

212
Nicotine Tob. Res. 10, 231–40.
Wenz, J.R., Jensen, S.M., Lombard, J.E., Wagner, B.A., Dinsmore, R.P., 2007.
Herd management practices and their association with bulk tank
somatic cell count on United States dairy operations. J. Dairy Sci. 90,
3652–9.
White, D.G., McDermott, P.F., 2001. Emergence and Transfer of
Antibacterial Resistance. J. Dairy Sci. 84, E151–E155.
Wilesmith, J.W., Francis, P.G., Wilson, C.D., 1986. Incidence of clinical
mastitis in a cohort of British dairy herds. Vet. Rec. 118, 199–204.
Williamson, J.H., Woolford, M.W., Day, A.M., 1995. The prophylactic effect
of a dry-cow antibiotic against Streptococcus uberis. N. Z. Vet. J. 43,
228–34.
Wilson, C.D., Kingwill, R.G., 1975. A practical mastitis control routine. Int.
Dairy Fed. Annu. Bull. 85, 422–438.
Wilson, D.J., Gonzalez, R.N., Sears, P.M., 1995. Segregation or use of
separate milking units for cows infected with Staphylococcus aureus:
effects on prevalence of infection and bulk tank somatic cell count. J.
Dairy Sci. 78, 2083–5.
Zadoks, R.N., Allore, H.G., Hagenaars, T.J., Barkema, H.W., Schukken, Y.H.,
2002. A mathematical model of Staphylococcus aureus control in
dairy herds. Epidemiol. Infect. 129, 397–416.
Zadoks, R.N., Gillespie, B.E., Barkema, H.W., Sampimon, O.C., Oliver, S.P.,
Schukken, Y.H., 2003. Clinical, epidemiological and molecular

213
characteristics of Streptococcus uberis infections in dairy herds.
Epidemiol. Infect. 130, 335–49.
Zadoks, R.N., Schukken, Y.H., 2006. Use of molecular epidemiology in
veterinary practice. Vet. Clin. North Am. Food Anim. Pract. 22, 229–
61.
Zadoks, R.N.N., Allore, H.G.G., Barkema, H.W.W., Sampimon, O.C.C., Gröhn,
Y.T.T., Schukken, Y.H.H., 2001. Analysis of an outbreak of
Streptococcus uberis mastitis. J. Dairy Sci. 84, 590–9.
Zecconi, A., Piccinini, R., Fox, L.K., 2003. Epidemiologic study of
intramammary infections with Staphylococcus aureus during a
control program in nine commercial dairy herds. J. Am. Vet. Med.
Assoc. 223, 684–8.

214
Appendices
Appendix 1
Example of the WinBUGS code for the cost of clinical mastitis model
from Chapter 2.
{
#Optimal bacterial cure rates for the 5 treatment protocols bacticure1 <- pathogencurerate1 pathogencurerate1~dunif(0.40, 0.80) bacticure2 <- pathogencurerate2 pathogencurerate2~dunif (0.6, 0.8) bacticure3 <- pathogencurerate3 pathogencurerate3~dunif(0.6,0.8) bacticure4 <-pathogencurerate4 pathogencurerate4~dunif(0.63,0.83) bacticure5 <- pathogencurerate5 pathogencurerate5~dunif(0.7,0.9) #Cure rates if given extended tx i.e. range increased by +-0.1 bacticure1a <- pathogencurerate1a pathogencurerate1a~dunif(0.30, 0.90) bacticure2a <- pathogencurerate2a pathogencurerate2a~dunif (0.5, 0.9) bacticure3a <- pathogencurerate3a pathogencurerate3a~dunif(0.5,0.9) bacticure4a <-pathogencurerate4a pathogencurerate4a~dunif(0.53,0.93) bacticure5a <- pathogencurerate5a pathogencurerate5a~dunif(0.6,0.99) # CALCULATE PARITY NUMBER, DIM, ILL, REPEAT CASE, SCC

215
whichparity~dunif(0,1) whichdim~dunif(0,305) systillness~dunif(0,1) whichcase~dunif(0,1) rand~dunif(0,1) parity2 <- step(whichparity-0.17) *parityeffect dimover60<-step(whichdim-60)*dimeffect systill<-step(systillness-0.85)*illeffect repeatcase<-step(whichcase-0.92)*repeateffect sccless200<-step(0.7-rand) btwn200500<-(step(rand-0.7) - step(rand-0.9))*btwn200500effect gt500<- step(rand-0.9)*gt500effect #CALC COW EFFECTS ON BACTICURE RATE parityeffect~dunif(-0.15, -0.05) dimeffect~dunif(-0.15,-0.05) illeffect~dunif(-0.25,-0.15) repeateffect~dunif(-0.25,-0.15) btwn200500effect~dunif(-0.15,-0.05) gt500effect~dunif(-0.25,-0.15) #Probability of bacterial cure apcowbacticure1 <- bacticure1 + (parity2+dimover60+systill+repeatcase+btwn200500+gt500) apcowbacticure2 <-bacticure2 + (parity2+dimover60+systill+repeatcase+btwn200500+gt500) apcowbacticure3 <-bacticure3 + (parity2+dimover60+systill+repeatcase+btwn200500+gt500) apcowbacticure4 <-bacticure4 + (parity2+dimover60+systill+repeatcase+btwn200500+gt500) apcowbacticure5 <-bacticure5 + (parity2+dimover60+systill+repeatcase+btwn200500+gt500) pcowbacticure1<-step(apcowbacticure1)*apcowbacticure1 pcowbacticure2<-step(apcowbacticure2)*apcowbacticure2

216
pcowbacticure3<-step(apcowbacticure3)*apcowbacticure3 pcowbacticure4<-step(apcowbacticure4)*apcowbacticure4 pcowbacticure5<-step(apcowbacticure5)*apcowbacticure5 #Probability of no cure pnoncure1 <- 1-pcowbacticure1 pnoncure2 <- 1-pcowbacticure2 pnoncure3 <- 1-pcowbacticure3 pnoncure4 <- 1-pcowbacticure4 pnoncure5 <- 1-pcowbacticure5 #Probability of non bacterial but clinical cure pcowclincure1 <- pnoncure1*0.8 pcowclincure2 <- pnoncure2*0.8 pcowclincure3 <- pnoncure3*0.8 pcowclincure4 <- pnoncure4*0.8 pcowclincure5 <- pnoncure5*0.8 #Probability of no bacterial or no clinical cure pcownoncure1 <- 1-(pcowbacticure1 + pcowclincure1) pcownoncure2 <- 1-(pcowbacticure2 + pcowclincure2) pcownoncure3 <- 1-(pcowbacticure3 + pcowclincure3) pcownoncure4 <- 1-(pcowbacticure4 + pcowclincure4) pcownoncure5 <- 1-(pcowbacticure5 + pcowclincure5) #CALCULATE TREATMENT COSTS ASSOCIATED WITH FIRST CASE #cost in pounds costofdrugs1~dunif(5.58,6.97) costofdrugs2~dunif(9.30,11.62) costofdrugs3~dunif(32,36) costofdrugs4~dunif(43,47) costofdrugs5~dunif(36,40) #total treatment time in hours treatmenttime1~dunif(0.53,0.87) treatmenttime2~dunif(0.87,1.2) treatmenttime3~dunif(0.58,0.92) treatmenttime4~dunif(0.63,0.97) treatmenttime5~dunif(0.92,1.25) #hourly rate in pounds labourcost~dunif(1,15.87) #total cost of labour (£) costoflabour1<-treatmenttime1*labourcost costoflabour2<-treatmenttime2*labourcost costoflabour3<-treatmenttime3*labourcost
217
costoflabour4<-treatmenttime4*labourcost costoflabour5<-treatmenttime5*labourcost #Length of milk discard in days milkwithdrawal1~dunif(5,9) milkwithdrawal2~dunif(7,11) milkwithdrawal3~dunif(5,9) milkwithdrawal4~dunif(5,10) milkwithdrawal5~dunif(7,11) #Amount of milk discarded each day (Kg) dailymilkdiscard~dunif(5,50) #Milk price (£/kg) milkprice~dunif(0.23,0.27) #Cost of milk production (£/Kg) milkprodcost~dunif(0.03,0.1) #Total cost of milk discard (£) costofdiscard1<-milkwithdrawal1*dailymilkdiscard*milkprice costofdiscard2<-milkwithdrawal2*dailymilkdiscard*milkprice costofdiscard3<-milkwithdrawal3*dailymilkdiscard*milkprice costofdiscard4<-milkwithdrawal4*dailymilkdiscard*milkprice costofdiscard5<-milkwithdrawal5*dailymilkdiscard*milkprice #Total cost of FIRST treatment (£) txcost1<-costofdrugs1 + costoflabour1 + costofdiscard1 txcost2<-costofdrugs2 + costoflabour2 + costofdiscard2 txcost3<-costofdrugs3 + costoflabour3 + costofdiscard3 txcost4<-costofdrugs4 + costoflabour4 + costofdiscard4 txcost5<-costofdrugs5 + costoflabour5 + costofdiscard5 #CALCULATION OF COSTS ASSOCIATED WITH COWBACTICURE #parameters taken from Hagnestam 2007/Steeneveld/Madouasse herd305yield~dunif(7000,10000) parity2Beffect~dunif(0,0.02) parity2B <- step(whichparity-0.17) *parity2Beffect btwn3and6yieldloss~dunif(-0.04,-0.01) gt6yieldloss~dunif(-0.07,-0.05) btwn3and6lact<-(herd305yield*-0.23) gt6lact<-(herd305yield*-0.67) casemonth1or2<-step(0.6-rand)

218
btwn3and6<-(step(rand-0.6) - step(rand-0.9))*btwn3and6yieldloss gt6<- step(rand-0.9)*gt6yieldloss btwn3and6effect<-(step(rand-0.6)-step(rand-0.9))*btwn3and6lact gt6effect<-step(rand-0.9)*gt6lact yieldloss~dunif(0.07,0.09) totalyieldloss<-herd305yield*(yieldloss+parity2B+btwn3and6+gt6) costoftotalyieldloss<-(milkprice*totalyieldloss)-(milkprodcost*totalyieldloss) #Can either end lactation or be culled. Cost of cull = 420 +- 300 pcull1~dunif(0.04,0.06) costofcull~dunif(120,720) pculltotal1<-pcull1+systill1 cull1a<-pculltotal1*pcowbacticure1 cull2a<-pculltotal1*pcowbacticure2 cull3a<-pculltotal1*pcowbacticure3 cull4a<-pculltotal1*pcowbacticure4 cull5a<-pculltotal1*pcowbacticure5 pendlactation1<-1-pculltotal1 endlactation1a<-pendlactation1*pcowbacticure1 endlactation2a<-pendlactation1*pcowbacticure2 endlactation3a<-pendlactation1*pcowbacticure3 endlactation4a<-pendlactation1*pcowbacticure4 endlactation5a<-pendlactation1*pcowbacticure5 cull1acosts<-cull1a*(costofcull+txcost1) cull2acosts<-cull2a*(costofcull+txcost2) cull3acosts<-cull3a*(costofcull+txcost3) cull4acosts<-cull4a*(costofcull+txcost4) cull5acosts<-cull5a*(costofcull+txcost5) endlactcosts1a<-endlactation1a*(costoftotalyieldloss+txcost1) endlactcosts2a<-endlactation2a*(costoftotalyieldloss+txcost2) endlactcosts3a<-endlactation3a*(costoftotalyieldloss+txcost3) endlactcosts4a<-endlactation4a*(costoftotalyieldloss+txcost4) endlactcosts5a<-endlactation5a*(costoftotalyieldloss+txcost5) #CALCULATE TREATMENT COSTS AFTER FAILURE TO CURE (cownoncure)

219
# i.e Extended Treatment resulting in 3 outomes - cowbacticure1a, cowclincure1a and cownoncure1a (range for cure rates increased due to increased uncertainty) #Probability of bacterial cure apcowbacticure1a <- bacticure1a + (parity2+dimover60+systill+repeatcase+btwn200500+gt500) apcowbacticure2a <-bacticure2a + (parity2+dimover60+systill+repeatcase+btwn200500+gt500) apcowbacticure3a <-bacticure3a + (parity2+dimover60+systill+repeatcase+btwn200500+gt500) apcowbacticure4a <-bacticure4a + (parity2+dimover60+systill+repeatcase+btwn200500+gt500) apcowbacticure5a <-bacticure5a + (parity2+dimover60+systill+repeatcase+btwn200500+gt500) pcowbacticure1a<-step(apcowbacticure1a)*apcowbacticure1a pcowbacticure2a<-step(apcowbacticure2a)*apcowbacticure2a pcowbacticure3a<-step(apcowbacticure3a)*apcowbacticure3a pcowbacticure4a<-step(apcowbacticure4a)*apcowbacticure4a pcowbacticure5a<-step(apcowbacticure5a)*apcowbacticure5a cowbacticure1a<-pcowbacticure1a*pcownoncure1 cowbacticure2a<-pcowbacticure2a*pcownoncure2 cowbacticure3a<-pcowbacticure3a*pcownoncure3 cowbacticure4a<-pcowbacticure4a*pcownoncure4 cowbacticure5a<-pcowbacticure5a*pcownoncure5 #Probability of no cure pnoncure1a<-1-pcowbacticure1a pnoncure2a<-1-pcowbacticure2a pnoncure3a<-1-pcowbacticure3a pnoncure4a<-1-pcowbacticure4a pnoncure5a<-1-pcowbacticure5a #Probability of Clinical cure pcowclincure1a<-pnoncure1a*0.8 pcowclincure2a<-pnoncure2a*0.8 pcowclincure3a<-pnoncure3a*0.8 pcowclincure4a<-pnoncure4a*0.8 pcowclincure5a<-pnoncure5a*0.8
220
cowclincure1a<-pcowclincure1a*pcownoncure1 cowclincure2a<-pcowclincure2a*pcownoncure2 cowclincure3a<-pcowclincure3a*pcownoncure3 cowclincure4a<-pcowclincure4a*pcownoncure4 cowclincure5a<-pcowclincure5a*pcownoncure5 #Probability of Non bacterial and Non clinical cure pcownoncure1a <- 1-(pcowbacticure1a + pcowclincure1a) pcownoncure2a <- 1-(pcowbacticure2a + pcowclincure2a) pcownoncure3a <- 1-(pcowbacticure3a + pcowclincure3a) pcownoncure4a <- 1-(pcowbacticure4a + pcowclincure4a) pcownoncure5a <- 1-(pcowbacticure5a + pcowclincure5a) cownoncure1a<-pcownoncure1a*pcownoncure1 cownoncure2a<-pcownoncure2a*pcownoncure2 cownoncure3a<-pcownoncure3a*pcownoncure3 cownoncure4a<-pcownoncure4a*pcownoncure4 cownoncure5a<-pcownoncure5a*pcownoncure5 #Calculation of costs associated with cowbacticurea (cull or endlactation) cull1b<-pculltotal1*cowbacticure1a cull2b<-pculltotal1*cowbacticure2a cull3b<-pculltotal1*cowbacticure3a cull4b<-pculltotal1*cowbacticure4a cull5b<-pculltotal1*cowbacticure5a endlactation1b<-pendlactation1*cowbacticure1a endlactation2b<-pendlactation1*cowbacticure2a endlactation3b<-pendlactation1*cowbacticure3a endlactation4b<-pendlactation1*cowbacticure4a endlactation5b<-pendlactation1*cowbacticure5a cull1bcosts<-cull1b*(costofcull+(2*txcost1)) cull2bcosts<-cull2b*(costofcull+(2*txcost2)) cull3bcosts<-cull3b*(costofcull+(2*txcost3)) cull4bcosts<-cull4b*(costofcull+(2*txcost4)) cull5bcosts<-cull5b*(costofcull+(2*txcost5)) endlactcosts1b<-endlactation1b*(costoftotalyieldloss+(2*txcost1)) endlactcosts2b<-endlactation2b*(costoftotalyieldloss+(2*txcost1)) endlactcosts3b<-endlactation3b*(costoftotalyieldloss+(2*txcost1)) endlactcosts4b<-endlactation4b*(costoftotalyieldloss+(2*txcost1)) endlactcosts5b<-endlactation5b*(costoftotalyieldloss+(2*txcost1)) #Calculation of costs aasociated with cownoncurea (death or dry off) costofdeath~dunif(1200,2000) pdeath~dunif(0.04,0.06)
221
death1<-pdeath*cownoncure1a death2<-pdeath*cownoncure2a death3<-pdeath*cownoncure3a death4<-pdeath*cownoncure4a death5<-pdeath*cownoncure5a costofdeath1<-death1*(costofdeath+(2*txcost1)) costofdeath2<-death2*(costofdeath+(2*txcost2)) costofdeath3<-death3*(costofdeath+(2*txcost3)) costofdeath4<-death4*(costofdeath+(2*txcost4)) costofdeath5<-death5*(costofdeath+(2*txcost5)) pdryoff<-1-pdeath dryoff1<-pdryoff*cownoncure1a dryoff2<-pdryoff*cownoncure2a dryoff3<-pdryoff*cownoncure3a dryoff4<-pdryoff*cownoncure4a dryoff5<-pdryoff*cownoncure5a pdryoffcull~dunif(0.27,0.39) #range added to steeneveld value of 0.33 dryoffcull1<-pdryoffcull*dryoff1 dryoffcull2<-pdryoffcull*dryoff2 dryoffcull3<-pdryoffcull*dryoff3 dryoffcull4<-pdryoffcull*dryoff4 dryoffcull5<-pdryoffcull*dryoff5 costofdryoffcull1<-dryoffcull1*(costofcull+(2*txcost1)) costofdryoffcull2<-dryoffcull2*(costofcull+(2*txcost2)) costofdryoffcull3<-dryoffcull3*(costofcull+(2*txcost3)) costofdryoffcull4<-dryoffcull4*(costofcull+(2*txcost4)) costofdryoffcull5<-dryoffcull5*(costofcull+(2*txcost5)) pdryoffsurvive<-1-pdryoffcull dryoffsurvive1<-pdryoffsurvive*dryoff1 dryoffsurvive2<-pdryoffsurvive*dryoff2 dryoffsurvive3<-pdryoffsurvive*dryoff3 dryoffsurvive4<-pdryoffsurvive*dryoff4 dryoffsurvive5<-pdryoffsurvive*dryoff5 dryoffyieldloss~dunif(0.13,0.17) #range added to steeneveld value of 15% loss if 3 quarted dryofftotalyieldloss<-herd305yield*dryoffyieldloss costofdryofftotalyieldloss<-(milkprice*dryofftotalyieldloss)-(milkprodcost*dryofftotalyieldloss)

222
costofdryoffsurvive1<-dryoffsurvive1*(costofdryofftotalyieldloss+(2*txcost1)) costofdryoffsurvive2<-dryoffsurvive2*(costofdryofftotalyieldloss+(2*txcost2)) costofdryoffsurvive3<-dryoffsurvive3*(costofdryofftotalyieldloss+(2*txcost3)) costofdryoffsurvive4<-dryoffsurvive4*(costofdryofftotalyieldloss+(2*txcost4)) costofdryoffsurvive5<-dryoffsurvive5*(costofdryofftotalyieldloss+(2*txcost5)) #Calculation of costs associated with pcowclincure (cullc, endlactationc or cm2) pcull1c~dunif(0,0.32) illeffect1~dunif(0.05,0.15) systill1<-step(systillness-0.85)*illeffect1 pcull1ctotal<-(pcull1c+systill1) cowclincure1total<-pcowclincure1+cowclincure1a cowclincure2total<-pcowclincure2+cowclincure2a cowclincure3total<-pcowclincure3+cowclincure3a cowclincure4total<-pcowclincure4+cowclincure4a cowclincure5total<-pcowclincure5+cowclincure5a xcull1c<-pcull1ctotal*pcowclincure1 xcull2c<-pcull1ctotal*pcowclincure2 xcull3c<-pcull1ctotal*pcowclincure3 xcull4c<-pcull1ctotal*pcowclincure4 xcull5c<-pcull1ctotal*pcowclincure5 ycull1c<-pcull1ctotal*cowclincure1a ycull2c<-pcull1ctotal*cowclincure2a ycull3c<-pcull1ctotal*cowclincure3a ycull4c<-pcull1ctotal*cowclincure4a ycull5c<-pcull1ctotal*cowclincure5a xcostcull1c<-xcull1c*(costofcull+txcost1) xcostcull2c<-xcull1c*(costofcull+txcost1) xcostcull3c<-xcull1c*(costofcull+txcost1) xcostcull4c<-xcull1c*(costofcull+txcost1) xcostcull5c<-xcull1c*(costofcull+txcost1) ycostcull1c<-ycull1c*(costofcull+(2*txcost1)) ycostcull2c<-ycull1c*(costofcull+(2*txcost1)) ycostcull3c<-ycull1c*(costofcull+(2*txcost1)) ycostcull4c<-ycull1c*(costofcull+(2*txcost1)) ycostcull5c<-ycull1c*(costofcull+(2*txcost1))

223
pendlactation2<-1-(pcull1ctotal+pcm2) xendlactation1c<-pendlactation2*pcowclincure1 xendlactation2c<-pendlactation2*pcowclincure2 xendlactation3c<-pendlactation2*pcowclincure3 xendlactation4c<-pendlactation2*pcowclincure4 xendlactation5c<-pendlactation2*pcowclincure5 yendlactation1c<-pendlactation2*cowclincure1a yendlactation2c<-pendlactation2*cowclincure2a yendlactation3c<-pendlactation2*cowclincure3a yendlactation4c<-pendlactation2*cowclincure4a yendlactation5c<-pendlactation2*cowclincure5a xcostofendlactation1c<-xendlactation1c*(costoftotalyieldloss+txcost1) xcostofendlactation2c<-xendlactation2c*(costoftotalyieldloss+txcost2) xcostofendlactation3c<-xendlactation3c*(costoftotalyieldloss+txcost3) xcostofendlactation4c<-xendlactation4c*(costoftotalyieldloss+txcost4) xcostofendlactation5c<-xendlactation5c*(costoftotalyieldloss+txcost5) ycostofendlactation1c<-yendlactation1c*(costoftotalyieldloss+(2*txcost1)) ycostofendlactation2c<-yendlactation2c*(costoftotalyieldloss+(2*txcost2)) ycostofendlactation3c<-yendlactation3c*(costoftotalyieldloss+(2*txcost3)) ycostofendlactation4c<-yendlactation4c*(costoftotalyieldloss+(2*txcost4)) ycostofendlactation5c<-yendlactation5c*(costoftotalyieldloss+(2*txcost5)) pcm2~dunif(0.05,0.12) #Taken from Steeneveld 2010 cm2tx1<-pcm2*(pcowclincure1+cowclincure1a) cm2tx2<-pcm2*(pcowclincure2+cowclincure2a) cm2tx3<-pcm2*(pcowclincure3+cowclincure3a) cm2tx4<-pcm2*(pcowclincure4+cowclincure4a) cm2tx5<-pcm2*(pcowclincure5+cowclincure5a) costofcm2tx1<-cm2tx1*txcost1 costofcm2tx2<-cm2tx2*txcost2 costofcm2tx3<-cm2tx3*txcost3 costofcm2tx4<-cm2tx4*txcost4 costofcm2tx5<-cm2tx5*txcost5 #Costs associated with CM2 bpcowbacticure1b<-pcowbacticure1-0.2

224
bpcowbacticure2b<-pcowbacticure2-0.2 bpcowbacticure3b<-pcowbacticure3-0.2 bpcowbacticure4b<-pcowbacticure4-0.2 bpcowbacticure5b<-pcowbacticure5-0.2 pcowbacticure1b<-step(bpcowbacticure1b)*bpcowbacticure1b pcowbacticure2b<-step(bpcowbacticure2b)*bpcowbacticure2b pcowbacticure3b<-step(bpcowbacticure3b)*bpcowbacticure3b pcowbacticure4b<-step(bpcowbacticure4b)*bpcowbacticure4b pcowbacticure5b<-step(bpcowbacticure5b)*bpcowbacticure5b #cure rates assoc with extended tx bpcowbacticure1z<-pcowbacticure1a-0.2 bpcowbacticure2z<-pcowbacticure2a-0.2 bpcowbacticure3z<-pcowbacticure3a-0.2 bpcowbacticure4z<-pcowbacticure4a-0.2 bpcowbacticure5z<-pcowbacticure5a-0.2 pcowbacticure1z<-step(bpcowbacticure1z)*bpcowbacticure1z pcowbacticure2z<-step(bpcowbacticure2z)*bpcowbacticure2z pcowbacticure3z<-step(bpcowbacticure3z)*bpcowbacticure3z pcowbacticure4z<-step(bpcowbacticure4z)*bpcowbacticure4z pcowbacticure5z<-step(bpcowbacticure5z)*bpcowbacticure5z # reduction of 0.2 taken from Steeneveld (as repeat case) cowbacticure1b<-cm2tx1*pcowbacticure1b cowbacticure2b<-cm2tx2*pcowbacticure2b cowbacticure3b<-cm2tx3*pcowbacticure3b cowbacticure4b<-cm2tx4*pcowbacticure4b cowbacticure5b<-cm2tx5*pcowbacticure5b #Probability of no cure pnoncure1b<- 1-pcowbacticure1b pnoncure2b<- 1-pcowbacticure2b pnoncure3b<- 1-pcowbacticure3b pnoncure4b<- 1-pcowbacticure4b pnoncure5b<- 1-pcowbacticure5b #Probability of non bacterial but clinical cure pcowclincure1b<- pnoncure1b*0.8 pcowclincure2b<- pnoncure2b*0.8 pcowclincure3b<- pnoncure3b*0.8 pcowclincure4b<- pnoncure4b*0.8 pcowclincure5b<- pnoncure5b*0.8 cowclincure1b<-cm2tx1*pcowclincure1b
225
cowclincure2b<-cm2tx2*pcowclincure2b cowclincure3b<-cm2tx3*pcowclincure3b cowclincure4b<-cm2tx4*pcowclincure4b cowclincure5b<-cm2tx5*pcowclincure5b #Probability of no bacterial or no clinical cure pcownoncure1b <- 1-(pcowbacticure1b + pcowclincure1b) pcownoncure2b <- 1-(pcowbacticure2b + pcowclincure2b) pcownoncure3b <- 1-(pcowbacticure3b + pcowclincure3b) pcownoncure4b <- 1-(pcowbacticure4b + pcowclincure4b) pcownoncure5b <- 1-(pcowbacticure5b + pcowclincure5b) cownoncure1b<-cm2tx1*pcownoncure1b cownoncure2b<-cm2tx2*pcownoncure2b cownoncure3b<-cm2tx3*pcownoncure3b cownoncure4b<-cm2tx4*pcownoncure4b cownoncure5b<-cm2tx5*pcownoncure5b #Costs assoc. with cowbacticure()b (either cull or endlactation) pcull2~dunif(0.10,0.20) systill2<-step(systillness-0.85)*illeffect1 cull1d<-(pcull2+systill2)*cowbacticure1b cull2d<-(pcull2+systill2)*cowbacticure2b cull3d<-(pcull2+systill2)*cowbacticure3b cull4d<-(pcull2+systill2)*cowbacticure4b cull5d<-(pcull2+systill2)*cowbacticure5b costofcull1d<-cull1d*costofcull costofcull2d<-cull2d*costofcull costofcull3d<-cull3d*costofcull costofcull4d<-cull4d*costofcull costofcull5d<-cull5d*costofcull pendlactation3<-1-(pcull2+systill2) endlactation1d<-pendlactation3*cowbacticure1b endlactation2d<-pendlactation3*cowbacticure2b endlactation3d<-pendlactation3*cowbacticure3b endlactation4d<-pendlactation3*cowbacticure4b endlactation5d<-pendlactation3*cowbacticure5b endlactcost1d<-endlactation1d*costoftotalyieldloss endlactcost2d<-endlactation2d*costoftotalyieldloss endlactcost3d<-endlactation3d*costoftotalyieldloss endlactcost4d<-endlactation4d*costoftotalyieldloss endlactcost5d<-endlactation5d*costoftotalyieldloss

226
#CALCULATE TREATMENT COSTS AFTER FAILURE TO CURE (extended tx) #Probability of bacterial cure pcowbacticure1c<-pcowbacticure1z pcowbacticure2c<-pcowbacticure2z pcowbacticure3c<-pcowbacticure3z pcowbacticure4c<-pcowbacticure4z pcowbacticure5c<-pcowbacticure5z cowbacticure1c<-pcowbacticure1c*cownoncure1b cowbacticure2c<-pcowbacticure2c*cownoncure2b cowbacticure3c<-pcowbacticure3c*cownoncure3b cowbacticure4c<-pcowbacticure4c*cownoncure4b cowbacticure5c<-pcowbacticure5c*cownoncure5b #Probability of no cure pnoncure1c<-1-pcowbacticure1c pnoncure2c<-1-pcowbacticure2c pnoncure3c<-1-pcowbacticure3c pnoncure4c<-1-pcowbacticure4c pnoncure5c<-1-pcowbacticure5c #Probability of Clinical cure pcowclincure1c<-pnoncure1c*0.8 pcowclincure2c<-pnoncure2c*0.8 pcowclincure3c<-pnoncure3c*0.8 pcowclincure4c<-pnoncure4c*0.8 pcowclincure5c<-pnoncure5c*0.8 cowclincure1c<-pcowclincure1c*cownoncure1b cowclincure2c<-pcowclincure2c*cownoncure2b cowclincure3c<-pcowclincure3c*cownoncure3b cowclincure4c<-pcowclincure4c*cownoncure4b cowclincure5c<-pcowclincure5c*cownoncure5b #Probability of Non bacterial and Non clinical cure pcownoncure1c <- 1-(pcowbacticure1c + pcowclincure1c) pcownoncure2c <- 1-(pcowbacticure2c + pcowclincure2c) pcownoncure3c <- 1-(pcowbacticure3c + pcowclincure3c) pcownoncure4c <- 1-(pcowbacticure4c + pcowclincure4c) pcownoncure5c <- 1-(pcowbacticure5c + pcowclincure5c) cownoncure1c<-cownoncure1b*pcownoncure1c cownoncure2c<-cownoncure2b*pcownoncure2c cownoncure3c<-cownoncure3b*pcownoncure3c cownoncure4c<-cownoncure4b*pcownoncure4c cownoncure5c<-cownoncure5b*pcownoncure5c
227
#Calculation of costs associated with cowbacticure c (cull or endlactation) cull1e<-(pcull2+systill2)*cowbacticure1c cull2e<-(pcull2+systill2)*cowbacticure2c cull3e<-(pcull2+systill2)*cowbacticure3c cull4e<-(pcull2+systill2)*cowbacticure4c cull5e<-(pcull2+systill2)*cowbacticure5c endlactation1e<-pendlactation3*cowbacticure1c endlactation2e<-pendlactation3*cowbacticure2c endlactation3e<-pendlactation3*cowbacticure3c endlactation4e<-pendlactation3*cowbacticure4c endlactation5e<-pendlactation3*cowbacticure5c cull1ecosts<-cull1e*(costofcull+(2*txcost1)) cull2ecosts<-cull2e*(costofcull+(2*txcost2)) cull3ecosts<-cull3e*(costofcull+(2*txcost3)) cull4ecosts<-cull4e*(costofcull+(2*txcost4)) cull5ecosts<-cull5e*(costofcull+(2*txcost5)) endlactcosts1e<-endlactation1e*(costoftotalyieldloss+(2*txcost1)) endlactcosts2e<-endlactation2e*(costoftotalyieldloss+(2*txcost1)) endlactcosts3e<-endlactation3e*(costoftotalyieldloss+(2*txcost1)) endlactcosts4e<-endlactation4e*(costoftotalyieldloss+(2*txcost1)) endlactcosts5e<-endlactation5e*(costoftotalyieldloss+(2*txcost1)) #Calculation of costs aasociated with cownoncurec (death or dry off) death1c<-pdeath*cownoncure1c death2c<-pdeath*cownoncure2c death3c<-pdeath*cownoncure3c death4c<-pdeath*cownoncure4c death5c<-pdeath*cownoncure5c costofdeath1c<-death1c*(costofdeath+(2*txcost1)) costofdeath2c<-death2c*(costofdeath+(2*txcost2)) costofdeath3c<-death3c*(costofdeath+(2*txcost3)) costofdeath4c<-death4c*(costofdeath+(2*txcost4)) costofdeath5c<-death5c*(costofdeath+(2*txcost5)) pdryoffc<-1-pdeath dryoff1c<-pdryoffc*cownoncure1c dryoff2c<-pdryoffc*cownoncure2c dryoff3c<-pdryoffc*cownoncure3c dryoff4c<-pdryoffc*cownoncure4c dryoff5c<-pdryoffc*cownoncure5c dryoffcull1c<-pdryoffcull*dryoff1c

228
dryoffcull2c<-pdryoffcull*dryoff2c dryoffcull3c<-pdryoffcull*dryoff3c dryoffcull4c<-pdryoffcull*dryoff4c dryoffcull5c<-pdryoffcull*dryoff5c costofdryoffcull1c<-dryoffcull1c*(costofcull+(2*txcost1)) costofdryoffcull2c<-dryoffcull2c*(costofcull+(2*txcost2)) costofdryoffcull3c<-dryoffcull3c*(costofcull+(2*txcost3)) costofdryoffcull4c<-dryoffcull4c*(costofcull+(2*txcost4)) costofdryoffcull5c<-dryoffcull5c*(costofcull+(2*txcost5)) pdryoffsurvivec<-1-pdryoffcull dryoffsurvive1c<-pdryoffsurvivec*dryoff1c dryoffsurvive2c<-pdryoffsurvivec*dryoff2c dryoffsurvive3c<-pdryoffsurvivec*dryoff3c dryoffsurvive4c<-pdryoffsurvivec*dryoff4c dryoffsurvive5c<-pdryoffsurvivec*dryoff5c costofdryoffsurvive1c<-dryoffsurvive1c*(costofdryofftotalyieldloss+(2*txcost1)) costofdryoffsurvive2c<-dryoffsurvive2c*(costofdryofftotalyieldloss+(2*txcost2)) costofdryoffsurvive3c<-dryoffsurvive3c*(costofdryofftotalyieldloss+(2*txcost3)) costofdryoffsurvive4c<-dryoffsurvive4c*(costofdryofftotalyieldloss+(2*txcost4)) costofdryoffsurvive5c<-dryoffsurvive5c*(costofdryofftotalyieldloss+(2*txcost5)) #Calculation of costs associated with cowclincure b pcull3~dunif(0.04,0.36) #figure of 0.2 given by steeneveld cowclincure1bctotal<-cowclincure1b+cowclincure1c cowclincure2bctotal<-cowclincure2b+cowclincure2c cowclincure3bctotal<-cowclincure3b+cowclincure3c cowclincure4bctotal<-cowclincure4b+cowclincure4c cowclincure5bctotal<-cowclincure5b+cowclincure5c xcull1d<-(pcull3+systill2)*cowclincure1b xcull2d<-(pcull3+systill2)*cowclincure2b xcull3d<-(pcull3+systill2)*cowclincure3b xcull4d<-(pcull3+systill2)*cowclincure4b xcull5d<-(pcull3+systill2)*cowclincure5b ycull1d<-(pcull3+systill2)*cowclincure1c ycull2d<-(pcull3+systill2)*cowclincure2c

229
ycull3d<-(pcull3+systill2)*cowclincure3c ycull4d<-(pcull3+systill2)*cowclincure4c ycull5d<-(pcull3+systill2)*cowclincure5c xcostcull1d<-xcull1d*(costofcull+txcost1) xcostcull2d<-xcull2d*(costofcull+txcost2) xcostcull3d<-xcull3d*(costofcull+txcost3) xcostcull4d<-xcull4d*(costofcull+txcost4) xcostcull5d<-xcull5d*(costofcull+txcost5) ycostcull1d<-ycull1d*(costofcull+(2*txcost1)) ycostcull2d<-ycull2d*(costofcull+(2*txcost2)) ycostcull3d<-ycull3d*(costofcull+(2*txcost3)) ycostcull4d<-ycull4d*(costofcull+(2*txcost4)) ycostcull5d<-ycull5d*(costofcull+(2*txcost5)) pendlactation4<-1-(pcull3+systill2+pcm3) xendlactation1d<-pendlactation4*cowclincure1b xendlactation2d<-pendlactation4*cowclincure2b xendlactation3d<-pendlactation4*cowclincure3b xendlactation4d<-pendlactation4*cowclincure4b xendlactation5d<-pendlactation4*cowclincure5b yendlactation1d<-pendlactation4*cowclincure1c yendlactation2d<-pendlactation4*cowclincure2c yendlactation3d<-pendlactation4*cowclincure3c yendlactation4d<-pendlactation4*cowclincure4c yendlactation5d<-pendlactation4*cowclincure5c xcostofendlactation1d<-xendlactation1d*(costoftotalyieldloss+txcost1) xcostofendlactation2d<-xendlactation2d*(costoftotalyieldloss+txcost2) xcostofendlactation3d<-xendlactation3d*(costoftotalyieldloss+txcost3) xcostofendlactation4d<-xendlactation4d*(costoftotalyieldloss+txcost4) xcostofendlactation5d<-xendlactation5d*(costoftotalyieldloss+txcost5) ycostofendlactation1d<-yendlactation1d*(costoftotalyieldloss+(2*txcost1)) ycostofendlactation2d<-yendlactation2d*(costoftotalyieldloss+(2*txcost2)) ycostofendlactation3d<-yendlactation3d*(costoftotalyieldloss+(2*txcost3)) ycostofendlactation4d<-yendlactation4d*(costoftotalyieldloss+(2*txcost4)) ycostofendlactation5d<-yendlactation5d*(costoftotalyieldloss+(2*txcost5)) pcm3~dunif(0.05,0.12) #Taken from Steeneveld 2010

230
cm3tx1<-pcm3*(cowclincure1b+cowclincure1c) cm3tx2<-pcm3*(cowclincure2b+cowclincure2c) cm3tx3<-pcm3*(cowclincure3b+cowclincure3c) cm3tx4<-pcm3*(cowclincure4b+cowclincure4c) cm3tx5<-pcm3*(cowclincure5b+cowclincure5c) costofcm3tx1<-cm3tx1*txcost1 costofcm3tx2<-cm3tx2*txcost2 costofcm3tx3<-cm3tx3*txcost3 costofcm3tx4<-cm3tx4*txcost4 costofcm3tx5<-cm3tx5*txcost5 #Costs associated with cm3 (Page 3 model) cpcowbacticure1d<-pcowbacticure1b-0.2 cpcowbacticure2d<-pcowbacticure2b-0.2 cpcowbacticure3d<-pcowbacticure3b-0.2 cpcowbacticure4d<-pcowbacticure4b-0.2 cpcowbacticure5d<-pcowbacticure5b-0.2 pcowbacticure1d<-step(cpcowbacticure1d)*cpcowbacticure1d pcowbacticure2d<-step(cpcowbacticure2d)*cpcowbacticure2d pcowbacticure3d<-step(cpcowbacticure3d)*cpcowbacticure3d pcowbacticure4d<-step(cpcowbacticure4d)*cpcowbacticure4d pcowbacticure5d<-step(cpcowbacticure5d)*cpcowbacticure5d # reduction of 0.2 taken from Steeneveld (as repeat case) cowbacticure1d<-cm3tx1*pcowbacticure1d cowbacticure2d<-cm3tx2*pcowbacticure2d cowbacticure3d<-cm3tx3*pcowbacticure3d cowbacticure4d<-cm3tx4*pcowbacticure4d cowbacticure5d<-cm3tx5*pcowbacticure5d #Probability of no cure pnoncure1d<- 1-pcowbacticure1d pnoncure2d<- 1-pcowbacticure2d pnoncure3d<- 1-pcowbacticure3d pnoncure4d<- 1-pcowbacticure4d pnoncure5d<- 1-pcowbacticure5d #Probability of non bacterial but clinical cure pcowclincure1d<- pnoncure1d*0.8 pcowclincure2d<- pnoncure2d*0.8 pcowclincure3d<- pnoncure3d*0.8 pcowclincure4d<- pnoncure4d*0.8 pcowclincure5d<- pnoncure5d*0.8

231
cowclincure1d<-cm3tx1*pcowclincure1d cowclincure2d<-cm3tx2*pcowclincure2d cowclincure3d<-cm3tx3*pcowclincure3d cowclincure4d<-cm3tx4*pcowclincure4d cowclincure5d<-cm3tx5*pcowclincure5d #Probability of no bacterial or no clinical cure pcownoncure1d <- 1-(pcowbacticure1d + pcowclincure1d) pcownoncure2d <- 1-(pcowbacticure2d + pcowclincure2d) pcownoncure3d <- 1-(pcowbacticure3d + pcowclincure3d) pcownoncure4d <- 1-(pcowbacticure4d + pcowclincure4d) pcownoncure5d <- 1-(pcowbacticure5d + pcowclincure5d) cownoncure1d<-cm3tx1*pcownoncure1d cownoncure2d<-cm3tx2*pcownoncure2d cownoncure3d<-cm3tx3*pcownoncure3d cownoncure4d<-cm3tx4*pcownoncure4d cownoncure5d<-cm3tx5*pcownoncure5d #Costs assoc. with cowbacticure d (either cull or endlactation) pcull4~dunif(0.20,0.30) # pcull taken from steeneveld (p=0.25) systill4<-step(systillness-0.85)*illeffect1 cull1f<-(pcull4+systill4)*cowbacticure1d cull2f<-(pcull4+systill4)*cowbacticure2d cull3f<-(pcull4+systill4)*cowbacticure3d cull4f<-(pcull4+systill4)*cowbacticure4d cull5f<-(pcull4+systill4)*cowbacticure5d costofcull1f<-cull1f*costofcull costofcull2f<-cull2f*costofcull costofcull3f<-cull3f*costofcull costofcull4f<-cull4f*costofcull costofcull5f<-cull5f*costofcull pendlactation5<-1-(pcull4+systill4) endlactation1f<-pendlactation5*cowbacticure1d endlactation2f<-pendlactation5*cowbacticure2d endlactation3f<-pendlactation5*cowbacticure3d endlactation4f<-pendlactation5*cowbacticure4d endlactation5f<-pendlactation5*cowbacticure5d endlactcost1f<-endlactation1f*costoftotalyieldloss endlactcost2f<-endlactation2f*costoftotalyieldloss endlactcost3f<-endlactation3f*costoftotalyieldloss
232
endlactcost4f<-endlactation4f*costoftotalyieldloss endlactcost5f<-endlactation5f*costoftotalyieldloss #CALCULATE TREATMENT COSTS AFTER FAILURE TO CURE (cull) cull1g<-cownoncure1d cull2g<-cownoncure2d cull3g<-cownoncure3d cull4g<-cownoncure4d cull5g<-cownoncure5d cull1gcosts<-cull1g*(costofcull+txcost1) cull2gcosts<-cull2g*(costofcull+txcost2) cull3gcosts<-cull3g*(costofcull+txcost3) cull4gcosts<-cull4g*(costofcull+txcost4) cull5gcosts<-cull5g*(costofcull+txcost5) #Calculation of costs associated with cowclincure d cull1h<-cowclincure1d cull2h<-cowclincure2d cull3h<-cowclincure3d cull4h<-cowclincure4d cull5h<-cowclincure5d cull1hcosts<-cull1h*(costofcull+txcost1) cull2hcosts<-cull2h*(costofcull+txcost2) cull3hcosts<-cull3h*(costofcull+txcost3) cull4hcosts<-cull4h*(costofcull+txcost4) cull5hcosts<-cull5h*(costofcull+txcost5) #Transmission 1a trans0~dunif(0.002,0.25) ptrans0<-trans0*(population0/100) ptrans2<-ptrans0*(population2/100) ptrans4<-ptrans0*(population4/100) ptrans6<-ptrans0*(population6/100) ptrans8<-ptrans0*(population8/100) ptrans10<-ptrans0*(population10/100) population0<-99 population2<-99-total2 population4<-99-total4 population6<-99-total6 population8<-99-total8 population10<-99-total10 trans1<-pcowclincure1+cowclincure1a

233
trans2<-ptrans0*trans1 trans3<-trans2*ptrans2 trans4<-ptrans2*trans1 trans5<-ptrans4*trans1 trans6<-trans4*ptrans4 trans7<-trans2*ptrans4 trans8<-trans3*ptrans4 trans9<-ptrans6*trans1 trans10<-trans5*ptrans6 trans11<-trans4*ptrans6 trans12<-trans6*ptrans6 trans13<-trans2*ptrans6 trans14<-trans7*ptrans6 trans15<-trans3*ptrans6 trans16<-trans8*ptrans6 trans17<-ptrans8*trans1 trans18<-trans9*ptrans8 trans19<-trans5*ptrans8 trans20<-trans10*ptrans8 trans21<-trans4*ptrans8 trans22<-trans11*ptrans8 trans23<-trans6*ptrans8 trans24<-trans12*ptrans8 trans25<-trans2*ptrans8 trans26<-trans13*ptrans8 trans27<-trans7*ptrans8 trans28<-trans14*ptrans8 trans29<-trans3*ptrans8 trans30<-trans15*ptrans8 trans31<-trans8*ptrans8 trans32<-trans16*ptrans8 trans33<-ptrans10*trans1 trans34<-trans17*ptrans10 trans35<-trans9*ptrans10 trans36<-trans18*ptrans10 trans37<-trans5*ptrans10 trans38<-trans19*ptrans10 trans39<-trans10*ptrans10 trans40<-trans20*ptrans10 trans41<-trans4*ptrans10 trans42<-trans21*ptrans10 trans43<-trans11*ptrans10 trans44<-trans22*ptrans10 trans45<-trans6*ptrans10 trans46<-trans23*ptrans10 trans47<-trans12*ptrans10 trans48<-trans24*ptrans10 trans49<-trans2*ptrans10 trans50<-trans25*ptrans10

234
trans51<-trans13*ptrans10 trans52<-trans26*ptrans10 trans53<-trans7*ptrans10 trans54<-trans27*ptrans10 trans55<-trans14*ptrans10 trans56<-trans28*ptrans10 trans57<-trans3*ptrans10 trans58<-trans29*ptrans10 trans59<-trans15*ptrans10 trans60<-trans30*ptrans10 trans61<-trans8*ptrans10 trans62<-trans31*ptrans10 trans63<-trans16*ptrans10 trans64<-trans32*ptrans10 total2<-trans2 total4<-total2+trans3+trans4 total6<-total4+trans5+trans6+trans7+trans8 total8<-total6+trans9+trans10+trans11+trans12+trans13+trans14+trans15+trans16 total10<-total8+trans17+trans18+trans19+trans20+trans21+trans22+trans23+trans24+trans25+trans26+trans27+trans28+trans29+trans30+trans31+trans32 total12<-total10+trans33+trans34+trans35+trans36+trans37+trans38+trans39+trans40+trans41+trans42+trans43+trans44+trans45+trans46+trans47+trans48+trans49+trans50+trans51+trans52+trans53+trans54+trans55+trans56+trans57+trans58+trans59+trans60+trans61+trans62+trans63+trans64 #Transmission 2a bptrans0<-trans0*(bpopulation0/100) bptrans2<-bptrans0*(bpopulation2/100) bptrans4<-bptrans0*(bpopulation4/100) bptrans6<-bptrans0*(bpopulation6/100) bptrans8<-bptrans0*(bpopulation8/100) bptrans10<-bptrans0*(bpopulation10/100) bpopulation0<-99 bpopulation2<-99-btotal2 bpopulation4<-99-btotal4 bpopulation6<-99-btotal6 bpopulation8<-99-btotal8 bpopulation10<-99-btotal10 btrans1<-pcowclincure2+cowclincure2a

235
btrans2<-bptrans0*btrans1 btrans3<-btrans2*bptrans2 btrans4<-bptrans2*btrans1 btrans5<-bptrans4*btrans1 btrans6<-btrans4*bptrans4 btrans7<-btrans2*bptrans4 btrans8<-btrans3*bptrans4 btrans9<-bptrans6*btrans1 btrans10<-btrans5*bptrans6 btrans11<-btrans4*bptrans6 btrans12<-btrans6*bptrans6 btrans13<-btrans2*bptrans6 btrans14<-btrans7*bptrans6 btrans15<-btrans3*bptrans6 btrans16<-btrans8*bptrans6 btrans17<-bptrans8*btrans1 btrans18<-btrans9*bptrans8 btrans19<-btrans5*bptrans8 btrans20<-btrans10*bptrans8 btrans21<-btrans4*bptrans8 btrans22<-btrans11*bptrans8 btrans23<-btrans6*bptrans8 btrans24<-btrans12*bptrans8 btrans25<-btrans2*bptrans8 btrans26<-btrans13*bptrans8 btrans27<-btrans7*bptrans8 btrans28<-btrans14*bptrans8 btrans29<-btrans3*bptrans8 btrans30<-btrans15*bptrans8 btrans31<-btrans8*bptrans8 btrans32<-btrans16*bptrans8 btrans33<-bptrans10*btrans1 btrans34<-btrans17*bptrans10 btrans35<-btrans9*bptrans10 btrans36<-btrans18*bptrans10 btrans37<-btrans5*bptrans10 btrans38<-btrans19*bptrans10 btrans39<-btrans10*bptrans10 btrans40<-btrans20*bptrans10 btrans41<-btrans4*bptrans10 btrans42<-btrans21*bptrans10 btrans43<-btrans11*bptrans10 btrans44<-btrans22*bptrans10 btrans45<-btrans6*bptrans10 btrans46<-btrans23*bptrans10 btrans47<-btrans12*bptrans10 btrans48<-btrans24*bptrans10 btrans49<-btrans2*bptrans10 btrans50<-btrans25*bptrans10

236
btrans51<-btrans13*bptrans10 btrans52<-btrans26*bptrans10 btrans53<-btrans7*bptrans10 btrans54<-btrans27*bptrans10 btrans55<-btrans14*bptrans10 btrans56<-btrans28*bptrans10 btrans57<-btrans3*bptrans10 btrans58<-btrans29*bptrans10 btrans59<-btrans15*bptrans10 btrans60<-btrans30*bptrans10 btrans61<-btrans8*bptrans10 btrans62<-btrans31*bptrans10 btrans63<-btrans16*bptrans10 btrans64<-btrans32*bptrans10 btotal2<-btrans2 btotal4<-btotal2+btrans3+btrans4 btotal6<-btotal4+btrans5+btrans6+btrans7+btrans8 btotal8<-btotal6+btrans9+btrans10+btrans11+btrans12+btrans13+btrans14+btrans15+btrans16 btotal10<-btotal8+btrans17+btrans18+btrans19+btrans20+btrans21+btrans22+btrans23+btrans24+btrans25+btrans26+btrans27+btrans28+btrans29+btrans30+btrans31+btrans32 btotal12<-btotal10+btrans33+btrans34+btrans35+btrans36+btrans37+btrans38+btrans39+btrans40+btrans41+btrans42+btrans43+btrans44+btrans45+btrans46+btrans47+btrans48+btrans49+btrans50+btrans51+btrans52+btrans53+btrans54+btrans55+btrans56+btrans57+btrans58+btrans59+btrans60+btrans61+btrans62+btrans63+btrans64 #Transmission 3a cptrans0<-trans0*(cpopulation0/100) cptrans2<-cptrans0*(cpopulation2/100) cptrans4<-cptrans0*(cpopulation4/100) cptrans6<-cptrans0*(cpopulation6/100) cptrans8<-cptrans0*(cpopulation8/100) cptrans10<-cptrans0*(cpopulation10/100) cpopulation0<-99 cpopulation2<-99-ctotal2 cpopulation4<-99-ctotal4 cpopulation6<-99-ctotal6 cpopulation8<-99-ctotal8 cpopulation10<-99-ctotal10 ctrans1<-pcowclincure3+cowclincure3a

237
ctrans2<-cptrans0*ctrans1 ctrans3<-ctrans2*cptrans2 ctrans4<-cptrans2*ctrans1 ctrans5<-cptrans4*ctrans1 ctrans6<-ctrans4*cptrans4 ctrans7<-ctrans2*cptrans4 ctrans8<-ctrans3*cptrans4 ctrans9<-cptrans6*ctrans1 ctrans10<-ctrans5*cptrans6 ctrans11<-ctrans4*cptrans6 ctrans12<-ctrans6*cptrans6 ctrans13<-ctrans2*cptrans6 ctrans14<-ctrans7*cptrans6 ctrans15<-ctrans3*cptrans6 ctrans16<-ctrans8*cptrans6 ctrans17<-cptrans8*ctrans1 ctrans18<-ctrans9*cptrans8 ctrans19<-ctrans5*cptrans8 ctrans20<-ctrans10*cptrans8 ctrans21<-ctrans4*cptrans8 ctrans22<-ctrans11*cptrans8 ctrans23<-ctrans6*cptrans8 ctrans24<-ctrans12*cptrans8 ctrans25<-ctrans2*cptrans8 ctrans26<-ctrans13*cptrans8 ctrans27<-ctrans7*cptrans8 ctrans28<-ctrans14*cptrans8 ctrans29<-ctrans3*cptrans8 ctrans30<-ctrans15*cptrans8 ctrans31<-ctrans8*cptrans8 ctrans32<-ctrans16*cptrans8 ctrans33<-cptrans10*ctrans1 ctrans34<-ctrans17*cptrans10 ctrans35<-ctrans9*cptrans10 ctrans36<-ctrans18*cptrans10 ctrans37<-ctrans5*cptrans10 ctrans38<-ctrans19*cptrans10 ctrans39<-ctrans10*cptrans10 ctrans40<-ctrans20*cptrans10 ctrans41<-ctrans4*cptrans10 ctrans42<-ctrans21*cptrans10 ctrans43<-ctrans11*cptrans10 ctrans44<-ctrans22*cptrans10 ctrans45<-ctrans6*cptrans10 ctrans46<-ctrans23*cptrans10 ctrans47<-ctrans12*cptrans10 ctrans48<-ctrans24*cptrans10 ctrans49<-ctrans2*cptrans10 ctrans50<-ctrans25*cptrans10

238
ctrans51<-ctrans13*cptrans10 ctrans52<-ctrans26*cptrans10 ctrans53<-ctrans7*cptrans10 ctrans54<-ctrans27*cptrans10 ctrans55<-ctrans14*cptrans10 ctrans56<-ctrans28*cptrans10 ctrans57<-ctrans3*cptrans10 ctrans58<-ctrans29*cptrans10 ctrans59<-ctrans15*cptrans10 ctrans60<-ctrans30*cptrans10 ctrans61<-ctrans8*cptrans10 ctrans62<-ctrans31*cptrans10 ctrans63<-ctrans16*cptrans10 ctrans64<-ctrans32*cptrans10 ctotal2<-ctrans2 ctotal4<-ctotal2+ctrans3+ctrans4 ctotal6<-ctotal4+ctrans5+ctrans6+ctrans7+ctrans8 ctotal8<-ctotal6+ctrans9+ctrans10+ctrans11+ctrans12+ctrans13+ctrans14+ctrans15+ctrans16 ctotal10<-ctotal8+ctrans17+ctrans18+ctrans19+ctrans20+ctrans21+ctrans22+ctrans23+ctrans24+ctrans25+ctrans26+ctrans27+ctrans28+ctrans29+ctrans30+ctrans31+ctrans32 ctotal12<-ctotal10+ctrans33+ctrans34+ctrans35+ctrans36+ctrans37+ctrans38+ctrans39+ctrans40+ctrans41+ctrans42+ctrans43+ctrans44+ctrans45+ctrans46+ctrans47+ctrans48+ctrans49+ctrans50+ctrans51+ctrans52+ctrans53+ctrans54+ctrans55+ctrans56+ctrans57+ctrans58+ctrans59+ctrans60+ctrans61+ctrans62+ctrans63+ctrans64 #Transmission 4a dptrans0<-trans0*(dpopulation0/100) dptrans2<-dptrans0*(dpopulation2/100) dptrans4<-dptrans0*(dpopulation4/100) dptrans6<-dptrans0*(dpopulation6/100) dptrans8<-dptrans0*(dpopulation8/100) dptrans10<-dptrans0*(dpopulation10/100) dpopulation0<-99 dpopulation2<-99-dtotal2 dpopulation4<-99-dtotal4 dpopulation6<-99-dtotal6 dpopulation8<-99-dtotal8 dpopulation10<-99-dtotal10 dtrans1<-pcowclincure4+cowclincure4a

239
dtrans2<-dptrans0*dtrans1 dtrans3<-dtrans2*dptrans2 dtrans4<-dptrans2*dtrans1 dtrans5<-dptrans4*dtrans1 dtrans6<-dtrans4*dptrans4 dtrans7<-dtrans2*dptrans4 dtrans8<-dtrans3*dptrans4 dtrans9<-dptrans6*dtrans1 dtrans10<-dtrans5*dptrans6 dtrans11<-dtrans4*dptrans6 dtrans12<-dtrans6*dptrans6 dtrans13<-dtrans2*dptrans6 dtrans14<-dtrans7*dptrans6 dtrans15<-dtrans3*dptrans6 dtrans16<-dtrans8*dptrans6 dtrans17<-dptrans8*dtrans1 dtrans18<-dtrans9*dptrans8 dtrans19<-dtrans5*dptrans8 dtrans20<-dtrans10*dptrans8 dtrans21<-dtrans4*dptrans8 dtrans22<-dtrans11*dptrans8 dtrans23<-dtrans6*dptrans8 dtrans24<-dtrans12*dptrans8 dtrans25<-dtrans2*dptrans8 dtrans26<-dtrans13*dptrans8 dtrans27<-dtrans7*dptrans8 dtrans28<-dtrans14*dptrans8 dtrans29<-dtrans3*dptrans8 dtrans30<-dtrans15*dptrans8 dtrans31<-dtrans8*dptrans8 dtrans32<-dtrans16*dptrans8 dtrans33<-dptrans10*dtrans1 dtrans34<-dtrans17*dptrans10 dtrans35<-dtrans9*dptrans10 dtrans36<-dtrans18*dptrans10 dtrans37<-dtrans5*dptrans10 dtrans38<-dtrans19*dptrans10 dtrans39<-dtrans10*dptrans10 dtrans40<-dtrans20*dptrans10 dtrans41<-dtrans4*dptrans10 dtrans42<-dtrans21*dptrans10 dtrans43<-dtrans11*dptrans10 dtrans44<-dtrans22*dptrans10 dtrans45<-dtrans6*dptrans10 dtrans46<-dtrans23*dptrans10 dtrans47<-dtrans12*dptrans10 dtrans48<-dtrans24*dptrans10 dtrans49<-dtrans2*dptrans10 dtrans50<-dtrans25*dptrans10

240
dtrans51<-dtrans13*dptrans10 dtrans52<-dtrans26*dptrans10 dtrans53<-dtrans7*dptrans10 dtrans54<-dtrans27*dptrans10 dtrans55<-dtrans14*dptrans10 dtrans56<-dtrans28*dptrans10 dtrans57<-dtrans3*dptrans10 dtrans58<-dtrans29*dptrans10 dtrans59<-dtrans15*dptrans10 dtrans60<-dtrans30*dptrans10 dtrans61<-dtrans8*dptrans10 dtrans62<-dtrans31*dptrans10 dtrans63<-dtrans16*dptrans10 dtrans64<-dtrans32*dptrans10 dtotal2<-dtrans2 dtotal4<-dtotal2+dtrans3+dtrans4 dtotal6<-dtotal4+dtrans5+dtrans6+dtrans7+dtrans8 dtotal8<-dtotal6+dtrans9+dtrans10+dtrans11+dtrans12+dtrans13+dtrans14+dtrans15+dtrans16 dtotal10<-dtotal8+dtrans17+dtrans18+dtrans19+dtrans20+dtrans21+dtrans22+dtrans23+dtrans24+dtrans25+dtrans26+dtrans27+dtrans28+dtrans29+dtrans30+dtrans31+dtrans32 dtotal12<-dtotal10+dtrans33+dtrans34+dtrans35+dtrans36+dtrans37+dtrans38+dtrans39+dtrans40+dtrans41+dtrans42+dtrans43+dtrans44+dtrans45+dtrans46+dtrans47+dtrans48+dtrans49+dtrans50+dtrans51+dtrans52+dtrans53+dtrans54+dtrans55+dtrans56+dtrans57+dtrans58+dtrans59+dtrans60+dtrans61+dtrans62+dtrans63+dtrans64 #Transmission5a eptrans0<-trans0*(epopulation0/100) eptrans2<-eptrans0*(epopulation2/100) eptrans4<-eptrans0*(epopulation4/100) eptrans6<-eptrans0*(epopulation6/100) eptrans8<-eptrans0*(epopulation8/100) eptrans10<-eptrans0*(epopulation10/100) epopulation0<-99 epopulation2<-99-etotal2 epopulation4<-99-etotal4 epopulation6<-99-etotal6 epopulation8<-99-etotal8 epopulation10<-99-etotal10 etrans1<-pcowclincure5+cowclincure5a
241
etrans2<-eptrans0*etrans1 etrans3<-etrans2*eptrans2 etrans4<-eptrans2*etrans1 etrans5<-eptrans4*etrans1 etrans6<-etrans4*eptrans4 etrans7<-etrans2*eptrans4 etrans8<-etrans3*eptrans4 etrans9<-eptrans6*etrans1 etrans10<-etrans5*eptrans6 etrans11<-etrans4*eptrans6 etrans12<-etrans6*eptrans6 etrans13<-etrans2*eptrans6 etrans14<-etrans7*eptrans6 etrans15<-etrans3*eptrans6 etrans16<-etrans8*eptrans6 etrans17<-eptrans8*etrans1 etrans18<-etrans9*eptrans8 etrans19<-etrans5*eptrans8 etrans20<-etrans10*eptrans8 etrans21<-etrans4*eptrans8 etrans22<-etrans11*eptrans8 etrans23<-etrans6*eptrans8 etrans24<-etrans12*eptrans8 etrans25<-etrans2*eptrans8 etrans26<-etrans13*eptrans8 etrans27<-etrans7*eptrans8 etrans28<-etrans14*eptrans8 etrans29<-etrans3*eptrans8 etrans30<-etrans15*eptrans8 etrans31<-etrans8*eptrans8 etrans32<-etrans16*eptrans8 etrans33<-eptrans10*etrans1 etrans34<-etrans17*eptrans10 etrans35<-etrans9*eptrans10 etrans36<-etrans18*eptrans10 etrans37<-etrans5*eptrans10 etrans38<-etrans19*eptrans10 etrans39<-etrans10*eptrans10 etrans40<-etrans20*eptrans10 etrans41<-etrans4*eptrans10 etrans42<-etrans21*eptrans10 etrans43<-etrans11*eptrans10 etrans44<-etrans22*eptrans10 etrans45<-etrans6*eptrans10 etrans46<-etrans23*eptrans10 etrans47<-etrans12*eptrans10 etrans48<-etrans24*eptrans10 etrans49<-etrans2*eptrans10 etrans50<-etrans25*eptrans10
242
etrans51<-etrans13*eptrans10 etrans52<-etrans26*eptrans10 etrans53<-etrans7*eptrans10 etrans54<-etrans27*eptrans10 etrans55<-etrans14*eptrans10 etrans56<-etrans28*eptrans10 etrans57<-etrans3*eptrans10 etrans58<-etrans29*eptrans10 etrans59<-etrans15*eptrans10 etrans60<-etrans30*eptrans10 etrans61<-etrans8*eptrans10 etrans62<-etrans31*eptrans10 etrans63<-etrans16*eptrans10 etrans64<-etrans32*eptrans10 etotal2<-etrans2 etotal4<-etotal2+etrans3+etrans4 etotal6<-etotal4+etrans5+etrans6+etrans7+etrans8 etotal8<-etotal6+etrans9+etrans10+etrans11+etrans12+etrans13+etrans14+etrans15+etrans16 etotal10<-etotal8+etrans17+etrans18+etrans19+etrans20+etrans21+etrans22+etrans23+etrans24+etrans25+etrans26+etrans27+etrans28+etrans29+etrans30+etrans31+etrans32 etotal12<-etotal10+etrans33+etrans34+etrans35+etrans36+etrans37+etrans38+etrans39+etrans40+etrans41+etrans42+etrans43+etrans44+etrans45+etrans46+etrans47+etrans48+etrans49+etrans50+etrans51+etrans52+etrans53+etrans54+etrans55+etrans56+etrans57+etrans58+etrans59+etrans60+etrans61+etrans62+etrans63+etrans64 #Transmission 1b xptrans0<-trans0*(xpopulation0/100) xptrans2<-xptrans0*(xpopulation2/100) xptrans4<-xptrans0*(xpopulation4/100) xptrans6<-xptrans0*(xpopulation6/100) xptrans8<-xptrans0*(xpopulation8/100) xptrans10<-xptrans0*(xpopulation10/100) xpopulation0<-99 xpopulation2<-99-xtotal2 xpopulation4<-99-xtotal4 xpopulation6<-99-xtotal6 xpopulation8<-99-xtotal8 xpopulation10<-99-xtotal10

243
xtrans1<-cowclincure1b+cowclincure1c xtrans2<-xptrans0*xtrans1 xtrans3<-xtrans2*xptrans2 xtrans4<-xptrans2*xtrans1 xtrans5<-xptrans4*xtrans1 xtrans6<-xtrans4*xptrans4 xtrans7<-xtrans2*xptrans4 xtrans8<-xtrans3*xptrans4 xtrans9<-xptrans6*xtrans1 xtrans10<-xtrans5*xptrans6 xtrans11<-xtrans4*xptrans6 xtrans12<-xtrans6*xptrans6 xtrans13<-xtrans2*xptrans6 xtrans14<-xtrans7*xptrans6 xtrans15<-xtrans3*xptrans6 xtrans16<-xtrans8*xptrans6 xtrans17<-xptrans8*xtrans1 xtrans18<-xtrans9*xptrans8 xtrans19<-xtrans5*xptrans8 xtrans20<-xtrans10*xptrans8 xtrans21<-xtrans4*xptrans8 xtrans22<-xtrans11*xptrans8 xtrans23<-xtrans6*xptrans8 xtrans24<-xtrans12*xptrans8 xtrans25<-xtrans2*xptrans8 xtrans26<-xtrans13*xptrans8 xtrans27<-xtrans7*xptrans8 xtrans28<-xtrans14*xptrans8 xtrans29<-xtrans3*xptrans8 xtrans30<-xtrans15*xptrans8 xtrans31<-xtrans8*xptrans8 xtrans32<-xtrans16*xptrans8 xtrans33<-xptrans10*xtrans1 xtrans34<-xtrans17*xptrans10 xtrans35<-xtrans9*xptrans10 xtrans36<-xtrans18*xptrans10 xtrans37<-xtrans5*xptrans10 xtrans38<-xtrans19*xptrans10 xtrans39<-xtrans10*xptrans10 xtrans40<-xtrans20*xptrans10 xtrans41<-xtrans4*xptrans10 xtrans42<-xtrans21*xptrans10 xtrans43<-xtrans11*xptrans10 xtrans44<-xtrans22*xptrans10 xtrans45<-xtrans6*xptrans10 xtrans46<-xtrans23*xptrans10 xtrans47<-xtrans12*xptrans10 xtrans48<-xtrans24*xptrans10 xtrans49<-xtrans2*xptrans10

244
xtrans50<-xtrans25*xptrans10 xtrans51<-xtrans13*xptrans10 xtrans52<-xtrans26*xptrans10 xtrans53<-xtrans7*xptrans10 xtrans54<-xtrans27*xptrans10 xtrans55<-xtrans14*xptrans10 xtrans56<-xtrans28*xptrans10 xtrans57<-xtrans3*xptrans10 xtrans58<-xtrans29*xptrans10 xtrans59<-xtrans15*xptrans10 xtrans60<-xtrans30*xptrans10 xtrans61<-xtrans8*xptrans10 xtrans62<-xtrans31*xptrans10 xtrans63<-xtrans16*xptrans10 xtrans64<-xtrans32*xptrans10 xtotal2<-xtrans2 xtotal4<-xtotal2+xtrans3+xtrans4 xtotal6<-xtotal4+xtrans5+xtrans6+xtrans7+xtrans8 xtotal8<-xtotal6+xtrans9+xtrans10+xtrans11+xtrans12+xtrans13+xtrans14+xtrans15+xtrans16 xtotal10<-xtotal8+xtrans17+xtrans18+xtrans19+xtrans20+xtrans21+xtrans22+xtrans23+xtrans24+xtrans25+xtrans26+xtrans27+xtrans28+xtrans29+xtrans30+xtrans31+xtrans32 xtotal12<-xtotal10+xtrans33+xtrans34+xtrans35+xtrans36+xtrans37+xtrans38+xtrans39+xtrans40+xtrans41+xtrans42+xtrans43+xtrans44+xtrans45+xtrans46+xtrans47+xtrans48+xtrans49+xtrans50+xtrans51+xtrans52+xtrans53+xtrans54+xtrans55+xtrans56+xtrans57+xtrans58+xtrans59+xtrans60+xtrans61+xtrans62+xtrans63+xtrans64 #Transmission 2b yptrans0<-trans0*(ypopulation0/100) yptrans2<-yptrans0*(ypopulation2/100) yptrans4<-yptrans0*(ypopulation4/100) yptrans6<-yptrans0*(ypopulation6/100) yptrans8<-yptrans0*(ypopulation8/100) yptrans10<-yptrans0*(ypopulation10/100) ypopulation0<-99 ypopulation2<-99-ytotal2 ypopulation4<-99-ytotal4 ypopulation6<-99-ytotal6 ypopulation8<-99-ytotal8 ypopulation10<-99-ytotal10

245
ytrans1<-cowclincure2b+cowclincure2c ytrans2<-yptrans0*ytrans1 ytrans3<-ytrans2*yptrans2 ytrans4<-yptrans2*ytrans1 ytrans5<-yptrans4*ytrans1 ytrans6<-ytrans4*yptrans4 ytrans7<-ytrans2*yptrans4 ytrans8<-ytrans3*yptrans4 ytrans9<-yptrans6*ytrans1 ytrans10<-ytrans5*yptrans6 ytrans11<-ytrans4*yptrans6 ytrans12<-ytrans6*yptrans6 ytrans13<-ytrans2*yptrans6 ytrans14<-ytrans7*yptrans6 ytrans15<-ytrans3*yptrans6 ytrans16<-ytrans8*yptrans6 ytrans17<-yptrans8*ytrans1 ytrans18<-ytrans9*yptrans8 ytrans19<-ytrans5*yptrans8 ytrans20<-ytrans10*yptrans8 ytrans21<-ytrans4*yptrans8 ytrans22<-ytrans11*yptrans8 ytrans23<-ytrans6*yptrans8 ytrans24<-ytrans12*yptrans8 ytrans25<-ytrans2*yptrans8 ytrans26<-ytrans13*yptrans8 ytrans27<-ytrans7*yptrans8 ytrans28<-ytrans14*yptrans8 ytrans29<-ytrans3*yptrans8 ytrans30<-ytrans15*yptrans8 ytrans31<-ytrans8*yptrans8 ytrans32<-ytrans16*yptrans8 ytrans33<-yptrans10*ytrans1 ytrans34<-ytrans17*yptrans10 ytrans35<-ytrans9*yptrans10 ytrans36<-ytrans18*yptrans10 ytrans37<-ytrans5*yptrans10 ytrans38<-ytrans19*yptrans10 ytrans39<-ytrans10*yptrans10 ytrans40<-ytrans20*yptrans10 ytrans41<-ytrans4*yptrans10 ytrans42<-ytrans21*yptrans10 ytrans43<-ytrans11*yptrans10 ytrans44<-ytrans22*yptrans10 ytrans45<-ytrans6*yptrans10 ytrans46<-ytrans23*yptrans10 ytrans47<-ytrans12*yptrans10 ytrans48<-ytrans24*yptrans10 ytrans49<-ytrans2*yptrans10

246
ytrans50<-ytrans25*yptrans10 ytrans51<-ytrans13*yptrans10 ytrans52<-ytrans26*yptrans10 ytrans53<-ytrans7*yptrans10 ytrans54<-ytrans27*yptrans10 ytrans55<-ytrans14*yptrans10 ytrans56<-ytrans28*yptrans10 ytrans57<-ytrans3*yptrans10 ytrans58<-ytrans29*yptrans10 ytrans59<-ytrans15*yptrans10 ytrans60<-ytrans30*yptrans10 ytrans61<-ytrans8*yptrans10 ytrans62<-ytrans31*yptrans10 ytrans63<-ytrans16*yptrans10 ytrans64<-ytrans32*yptrans10 ytotal2<-ytrans2 ytotal4<-ytotal2+ytrans3+ytrans4 ytotal6<-ytotal4+ytrans5+ytrans6+ytrans7+ytrans8 ytotal8<-ytotal6+ytrans9+ytrans10+ytrans11+ytrans12+ytrans13+ytrans14+ytrans15+ytrans16 ytotal10<-ytotal8+ytrans17+ytrans18+ytrans19+ytrans20+ytrans21+ytrans22+ytrans23+ytrans24+ytrans25+ytrans26+ytrans27+ytrans28+ytrans29+ytrans30+ytrans31+ytrans32 ytotal12<-ytotal10+ytrans33+ytrans34+ytrans35+ytrans36+ytrans37+ytrans38+ytrans39+ytrans40+ytrans41+ytrans42+ytrans43+ytrans44+ytrans45+ytrans46+ytrans47+ytrans48+ytrans49+ytrans50+ytrans51+ytrans52+ytrans53+ytrans54+ytrans55+ytrans56+ytrans57+ytrans58+ytrans59+ytrans60+ytrans61+ytrans62+ytrans63+ytrans64 #Transmission 3b zptrans0<-trans0*(zpopulation0/100) zptrans2<-zptrans0*(zpopulation2/100) zptrans4<-zptrans0*(zpopulation4/100) zptrans6<-zptrans0*(zpopulation6/100) zptrans8<-zptrans0*(zpopulation8/100) zptrans10<-zptrans0*(zpopulation10/100) zpopulation0<-99 zpopulation2<-99-ztotal2 zpopulation4<-99-ztotal4 zpopulation6<-99-ztotal6 zpopulation8<-99-ztotal8 zpopulation10<-99-ztotal10
247
ztrans1<-cowclincure3b+cowclincure3c ztrans2<-zptrans0*ztrans1 ztrans3<-ztrans2*zptrans2 ztrans4<-zptrans2*ztrans1 ztrans5<-zptrans4*ztrans1 ztrans6<-ztrans4*zptrans4 ztrans7<-ztrans2*zptrans4 ztrans8<-ztrans3*zptrans4 ztrans9<-zptrans6*ztrans1 ztrans10<-ztrans5*zptrans6 ztrans11<-ztrans4*zptrans6 ztrans12<-ztrans6*zptrans6 ztrans13<-ztrans2*zptrans6 ztrans14<-ztrans7*zptrans6 ztrans15<-ztrans3*zptrans6 ztrans16<-ztrans8*zptrans6 ztrans17<-zptrans8*ztrans1 ztrans18<-ztrans9*zptrans8 ztrans19<-ztrans5*zptrans8 ztrans20<-ztrans10*zptrans8 ztrans21<-ztrans4*zptrans8 ztrans22<-ztrans11*zptrans8 ztrans23<-ztrans6*zptrans8 ztrans24<-ztrans12*zptrans8 ztrans25<-ztrans2*zptrans8 ztrans26<-ztrans13*zptrans8 ztrans27<-ztrans7*zptrans8 ztrans28<-ztrans14*zptrans8 ztrans29<-ztrans3*zptrans8 ztrans30<-ztrans15*zptrans8 ztrans31<-ztrans8*zptrans8 ztrans32<-ztrans16*zptrans8 ztrans33<-zptrans10*ztrans1 ztrans34<-ztrans17*zptrans10 ztrans35<-ztrans9*zptrans10 ztrans36<-ztrans18*zptrans10 ztrans37<-ztrans5*zptrans10 ztrans38<-ztrans19*zptrans10 ztrans39<-ztrans10*zptrans10 ztrans40<-ztrans20*zptrans10 ztrans41<-ztrans4*zptrans10 ztrans42<-ztrans21*zptrans10 ztrans43<-ztrans11*zptrans10 ztrans44<-ztrans22*zptrans10 ztrans45<-ztrans6*zptrans10 ztrans46<-ztrans23*zptrans10 ztrans47<-ztrans12*zptrans10 ztrans48<-ztrans24*zptrans10 ztrans49<-ztrans2*zptrans10
248
ztrans50<-ztrans25*zptrans10 ztrans51<-ztrans13*zptrans10 ztrans52<-ztrans26*zptrans10 ztrans53<-ztrans7*zptrans10 ztrans54<-ztrans27*zptrans10 ztrans55<-ztrans14*zptrans10 ztrans56<-ztrans28*zptrans10 ztrans57<-ztrans3*zptrans10 ztrans58<-ztrans29*zptrans10 ztrans59<-ztrans15*zptrans10 ztrans60<-ztrans30*zptrans10 ztrans61<-ztrans8*zptrans10 ztrans62<-ztrans31*zptrans10 ztrans63<-ztrans16*zptrans10 ztrans64<-ztrans32*zptrans10 ztotal2<-ztrans2 ztotal4<-ztotal2+ztrans3+ztrans4 ztotal6<-ztotal4+ztrans5+ztrans6+ztrans7+ztrans8 ztotal8<-ztotal6+ztrans9+ztrans10+ztrans11+ztrans12+ztrans13+ztrans14+ztrans15+ztrans16 ztotal10<-ztotal8+ztrans17+ztrans18+ztrans19+ztrans20+ztrans21+ztrans22+ztrans23+ztrans24+ztrans25+ztrans26+ztrans27+ztrans28+ztrans29+ztrans30+ztrans31+ztrans32 ztotal12<-ztotal10+ztrans33+ztrans34+ztrans35+ztrans36+ztrans37+ztrans38+ztrans39+ztrans40+ztrans41+ztrans42+ztrans43+ztrans44+ztrans45+ztrans46+ztrans47+ztrans48+ztrans49+ztrans50+ztrans51+ztrans52+ztrans53+ztrans54+ztrans55+ztrans56+ztrans57+ztrans58+ztrans59+ztrans60+ztrans61+ztrans62+ztrans63+ztrans64 #Transmission 4b rptrans0<-trans0*(rpopulation0/100) rptrans2<-rptrans0*(rpopulation2/100) rptrans4<-rptrans0*(rpopulation4/100) rptrans6<-rptrans0*(rpopulation6/100) rptrans8<-rptrans0*(rpopulation8/100) rptrans10<-rptrans0*(rpopulation10/100) rpopulation0<-99 rpopulation2<-99-rtotal2 rpopulation4<-99-rtotal4 rpopulation6<-99-rtotal6 rpopulation8<-99-rtotal8 rpopulation10<-99-rtotal10
249
rtrans1<-cowclincure4b+cowclincure4c rtrans2<-rptrans0*rtrans1 rtrans3<-rtrans2*rptrans2 rtrans4<-rptrans2*rtrans1 rtrans5<-rptrans4*rtrans1 rtrans6<-rtrans4*rptrans4 rtrans7<-rtrans2*rptrans4 rtrans8<-rtrans3*rptrans4 rtrans9<-rptrans6*rtrans1 rtrans10<-rtrans5*rptrans6 rtrans11<-rtrans4*rptrans6 rtrans12<-rtrans6*rptrans6 rtrans13<-rtrans2*rptrans6 rtrans14<-rtrans7*rptrans6 rtrans15<-rtrans3*rptrans6 rtrans16<-rtrans8*rptrans6 rtrans17<-rptrans8*rtrans1 rtrans18<-rtrans9*rptrans8 rtrans19<-rtrans5*rptrans8 rtrans20<-rtrans10*rptrans8 rtrans21<-rtrans4*rptrans8 rtrans22<-rtrans11*rptrans8 rtrans23<-rtrans6*rptrans8 rtrans24<-rtrans12*rptrans8 rtrans25<-rtrans2*rptrans8 rtrans26<-rtrans13*rptrans8 rtrans27<-rtrans7*rptrans8 rtrans28<-rtrans14*rptrans8 rtrans29<-rtrans3*rptrans8 rtrans30<-rtrans15*rptrans8 rtrans31<-rtrans8*rptrans8 rtrans32<-rtrans16*rptrans8 rtrans33<-rptrans10*rtrans1 rtrans34<-rtrans17*rptrans10 rtrans35<-rtrans9*rptrans10 rtrans36<-rtrans18*rptrans10 rtrans37<-rtrans5*rptrans10 rtrans38<-rtrans19*rptrans10 rtrans39<-rtrans10*rptrans10 rtrans40<-rtrans20*rptrans10 rtrans41<-rtrans4*rptrans10 rtrans42<-rtrans21*rptrans10 rtrans43<-rtrans11*rptrans10 rtrans44<-rtrans22*rptrans10 rtrans45<-rtrans6*rptrans10 rtrans46<-rtrans23*rptrans10 rtrans47<-rtrans12*rptrans10 rtrans48<-rtrans24*rptrans10 rtrans49<-rtrans2*rptrans10

250
rtrans50<-rtrans25*rptrans10 rtrans51<-rtrans13*rptrans10 rtrans52<-rtrans26*rptrans10 rtrans53<-rtrans7*rptrans10 rtrans54<-rtrans27*rptrans10 rtrans55<-rtrans14*rptrans10 rtrans56<-rtrans28*rptrans10 rtrans57<-rtrans3*rptrans10 rtrans58<-rtrans29*rptrans10 rtrans59<-rtrans15*rptrans10 rtrans60<-rtrans30*rptrans10 rtrans61<-rtrans8*rptrans10 rtrans62<-rtrans31*rptrans10 rtrans63<-rtrans16*rptrans10 rtrans64<-rtrans32*rptrans10 rtotal2<-rtrans2 rtotal4<-rtotal2+rtrans3+rtrans4 rtotal6<-rtotal4+rtrans5+rtrans6+rtrans7+rtrans8 rtotal8<-rtotal6+rtrans9+rtrans10+rtrans11+rtrans12+rtrans13+rtrans14+rtrans15+rtrans16 rtotal10<-rtotal8+rtrans17+rtrans18+rtrans19+rtrans20+rtrans21+rtrans22+rtrans23+rtrans24+rtrans25+rtrans26+rtrans27+rtrans28+rtrans29+rtrans30+rtrans31+rtrans32 rtotal12<-rtotal10+rtrans33+rtrans34+rtrans35+rtrans36+rtrans37+rtrans38+rtrans39+rtrans40+rtrans41+rtrans42+rtrans43+rtrans44+rtrans45+rtrans46+rtrans47+rtrans48+rtrans49+rtrans50+rtrans51+rtrans52+rtrans53+rtrans54+rtrans55+rtrans56+rtrans57+rtrans58+rtrans59+rtrans60+rtrans61+rtrans62+rtrans63+rtrans64 #Transmission 5b gptrans0<-trans0*(gpopulation0/100) gptrans2<-gptrans0*(gpopulation2/100) gptrans4<-gptrans0*(gpopulation4/100) gptrans6<-gptrans0*(gpopulation6/100) gptrans8<-gptrans0*(gpopulation8/100) gptrans10<-gptrans0*(gpopulation10/100) gpopulation0<-99 gpopulation2<-99-gtotal2 gpopulation4<-99-gtotal4 gpopulation6<-99-gtotal6 gpopulation8<-99-gtotal8 gpopulation10<-99-gtotal10
251
gtrans1<-cowclincure5b+cowclincure5c gtrans2<-gptrans0*gtrans1 gtrans3<-gtrans2*gptrans2 gtrans4<-gptrans2*gtrans1 gtrans5<-gptrans4*gtrans1 gtrans6<-gtrans4*gptrans4 gtrans7<-gtrans2*gptrans4 gtrans8<-gtrans3*gptrans4 gtrans9<-gptrans6*gtrans1 gtrans10<-gtrans5*gptrans6 gtrans11<-gtrans4*gptrans6 gtrans12<-gtrans6*gptrans6 gtrans13<-gtrans2*gptrans6 gtrans14<-gtrans7*gptrans6 gtrans15<-gtrans3*gptrans6 gtrans16<-gtrans8*gptrans6 gtrans17<-gptrans8*gtrans1 gtrans18<-gtrans9*gptrans8 gtrans19<-gtrans5*gptrans8 gtrans20<-gtrans10*gptrans8 gtrans21<-gtrans4*gptrans8 gtrans22<-gtrans11*gptrans8 gtrans23<-gtrans6*gptrans8 gtrans24<-gtrans12*gptrans8 gtrans25<-gtrans2*gptrans8 gtrans26<-gtrans13*gptrans8 gtrans27<-gtrans7*gptrans8 gtrans28<-gtrans14*gptrans8 gtrans29<-gtrans3*gptrans8 gtrans30<-gtrans15*gptrans8 gtrans31<-gtrans8*gptrans8 gtrans32<-gtrans16*gptrans8 gtrans33<-gptrans10*gtrans1 gtrans34<-gtrans17*gptrans10 gtrans35<-gtrans9*gptrans10 gtrans36<-gtrans18*gptrans10 gtrans37<-gtrans5*gptrans10 gtrans38<-gtrans19*gptrans10 gtrans39<-gtrans10*gptrans10 gtrans40<-gtrans20*gptrans10 gtrans41<-gtrans4*gptrans10 gtrans42<-gtrans21*gptrans10 gtrans43<-gtrans11*gptrans10 gtrans44<-gtrans22*gptrans10 gtrans45<-gtrans6*gptrans10 gtrans46<-gtrans23*gptrans10 gtrans47<-gtrans12*gptrans10 gtrans48<-gtrans24*gptrans10 gtrans49<-gtrans2*gptrans10
252
gtrans50<-gtrans25*gptrans10 gtrans51<-gtrans13*gptrans10 gtrans52<-gtrans26*gptrans10 gtrans53<-gtrans7*gptrans10 gtrans54<-gtrans27*gptrans10 gtrans55<-gtrans14*gptrans10 gtrans56<-gtrans28*gptrans10 gtrans57<-gtrans3*gptrans10 gtrans58<-gtrans29*gptrans10 gtrans59<-gtrans15*gptrans10 gtrans60<-gtrans30*gptrans10 gtrans61<-gtrans8*gptrans10 gtrans62<-gtrans31*gptrans10 gtrans63<-gtrans16*gptrans10 gtrans64<-gtrans32*gptrans10 gtotal2<-gtrans2 gtotal4<-gtotal2+gtrans3+gtrans4 gtotal6<-gtotal4+gtrans5+gtrans6+gtrans7+gtrans8 gtotal8<-gtotal6+gtrans9+gtrans10+gtrans11+gtrans12+gtrans13+gtrans14+gtrans15+gtrans16 gtotal10<-gtotal8+gtrans17+gtrans18+gtrans19+gtrans20+gtrans21+gtrans22+gtrans23+gtrans24+gtrans25+gtrans26+gtrans27+gtrans28+gtrans29+gtrans30+gtrans31+gtrans32 gtotal12<-gtotal10+gtrans33+gtrans34+gtrans35+gtrans36+gtrans37+gtrans38+gtrans39+gtrans40+gtrans41+gtrans42+gtrans43+gtrans44+gtrans45+gtrans46+gtrans47+gtrans48+gtrans49+gtrans50+gtrans51+gtrans52+gtrans53+gtrans54+gtrans55+gtrans56+gtrans57+gtrans58+gtrans59+gtrans60+gtrans61+gtrans62+gtrans63+gtrans64 totalcosts1<-cull1acosts+endlactcosts1a+xcostcull1c+xcostofendlactation1c+ycostofendlactation1c+ycostcull1c+cull1bcosts+endlactcosts1b+costofdeath1+costofdryoffsurvive1+costofdryoffcull1+costofcull1d+endlactcost1d+xcostcull1d+xcostofendlactation1d+ycostcull1d+ycostofendlactation1d+cull1ecosts+endlactcosts1e+costofdeath1c+costofdryoffsurvive1c+costofdryoffcull1c+costofcull1f+endlactcost1f+cull1hcosts+cull1gcosts totalcosts2<-cull2acosts+endlactcosts2a+xcostcull2c+xcostofendlactation2c+ycostofendlactation2c+ycostcull2c+cull2bcosts+endlactcosts2b+costofdeath2+costofdryoffsurvive2+costofdryoffcull2+costofcull2d+endlactcost2d+xcostcull2d+xcostofendlactation2d+ycostcull2d+ycostofendlactation2d+cull2ecosts+endlactcosts2e+costofdeath2c+costofdryoffsurvive2c+costofdryoffcull2c+costofcull2f+endlactcost2f+cull2hcosts+cull2gcosts
253
totalcosts3<-cull3acosts+endlactcosts3a+xcostcull3c+xcostofendlactation3c+ycostofendlactation3c+ycostcull3c+cull3bcosts+endlactcosts3b+costofdeath3+costofdryoffsurvive3+costofdryoffcull3+costofcull3d+endlactcost3d+xcostcull3d+xcostofendlactation3d+ycostcull3d+ycostofendlactation3d+cull3ecosts+endlactcosts3e+costofdeath3c+costofdryoffsurvive3c+costofdryoffcull3c+costofcull3f+endlactcost3f+cull3hcosts+cull3gcosts totalcosts4<-cull4acosts+endlactcosts4a+xcostcull4c+xcostofendlactation4c+ycostofendlactation4c+ycostcull4c+cull4bcosts+endlactcosts4b+costofdeath4+costofdryoffsurvive4+costofdryoffcull4+costofcull4d+endlactcost4d+xcostcull4d+xcostofendlactation4d+ycostcull4d+ycostofendlactation4d+cull4ecosts+endlactcosts4e+costofdeath4c+costofdryoffsurvive4c+costofdryoffcull4c+costofcull4f+endlactcost4f+cull4hcosts+cull4gcosts totalcosts5<-cull5acosts+endlactcosts5a+xcostcull5c+xcostofendlactation5c+ycostofendlactation5c+ycostcull5c+cull5bcosts+endlactcosts5b+costofdeath5+costofdryoffsurvive5+costofdryoffcull5+costofcull5d+endlactcost5d+xcostcull5d+xcostofendlactation5d+ycostcull5d+ycostofendlactation5d+cull5ecosts+endlactcosts5e+costofdeath5c+costofdryoffsurvive5c+costofdryoffcull5c+costofcull5f+endlactcost5f+cull5hcosts+cull5gcosts totalcostplustransmission1<-totalcosts1+(totalcosts1*(total12+xtotal12)) totalcostplustransmission2<-totalcosts2+(totalcosts2*(btotal12+ytotal12)) totalcostplustransmission3<-totalcosts3+(totalcosts3*(ctotal12+ztotal12)) totalcostplustransmission4<-totalcosts4+(totalcosts4*(dtotal12+rtotal12)) totalcostplustransmission5<-totalcosts5+(totalcosts5*(etotal12+gtotal12)) }
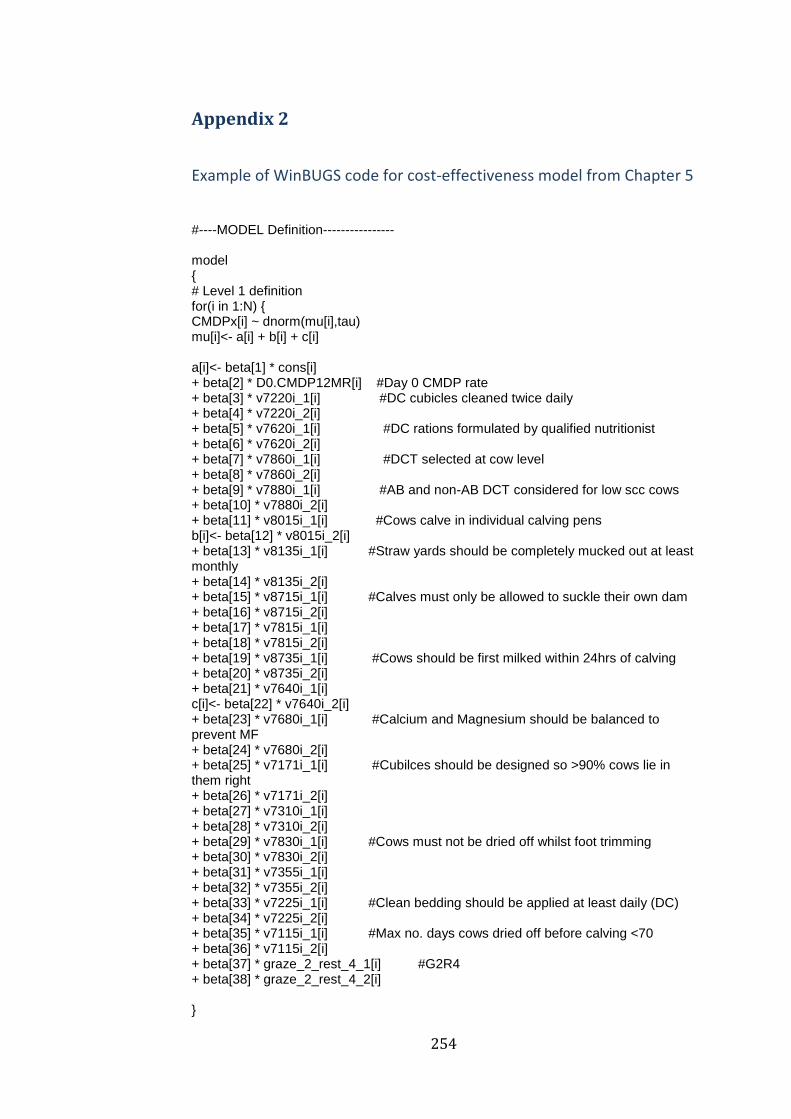
254
Appendix 2
Example of WinBUGS code for cost-effectiveness model from Chapter 5
#----MODEL Definition---------------- model { # Level 1 definition for(i in 1:N) { CMDPx[i] ~ dnorm(mu[i],tau) mu[i]<- a[i] + b[i] + c[i] a[i]<- beta[1] * cons[i] + beta[2] * D0.CMDP12MR[i] #Day 0 CMDP rate + beta[3] * v7220i_1[i] #DC cubicles cleaned twice daily + beta[4] * v7220i_2[i] + beta[5] * v7620i_1[i] #DC rations formulated by qualified nutritionist + beta[6] * v7620i_2[i] + beta[7] * v7860i_1[i] #DCT selected at cow level + beta[8] * v7860i_2[i] + beta[9] * v7880i_1[i] #AB and non-AB DCT considered for low scc cows + beta[10] * v7880i_2[i] + beta[11] * v8015i_1[i] #Cows calve in individual calving pens b[i]<- beta[12] * v8015i_2[i] + beta[13] * v8135i_1[i] #Straw yards should be completely mucked out at least monthly + beta[14] * v8135i_2[i] + beta[15] * v8715i_1[i] #Calves must only be allowed to suckle their own dam + beta[16] * v8715i_2[i] + beta[17] * v7815i_1[i] + beta[18] * v7815i_2[i] + beta[19] * v8735i_1[i] #Cows should be first milked within 24hrs of calving + beta[20] * v8735i_2[i] + beta[21] * v7640i_1[i] c[i]<- beta[22] * v7640i_2[i] + beta[23] * v7680i_1[i] #Calcium and Magnesium should be balanced to prevent MF + beta[24] * v7680i_2[i] + beta[25] * v7171i_1[i] #Cubilces should be designed so >90% cows lie in them right + beta[26] * v7171i_2[i] + beta[27] * v7310i_1[i] + beta[28] * v7310i_2[i] + beta[29] * v7830i_1[i] #Cows must not be dried off whilst foot trimming + beta[30] * v7830i_2[i] + beta[31] * v7355i_1[i] + beta[32] * v7355i_2[i] + beta[33] * v7225i_1[i] #Clean bedding should be applied at least daily (DC) + beta[34] * v7225i_2[i] + beta[35] * v7115i_1[i] #Max no. days cows dried off before calving <70 + beta[36] * v7115i_2[i] + beta[37] * graze_2_rest_4_1[i] #G2R4 + beta[38] * graze_2_rest_4_2[i] }

255
# Higher level definitions # Priors for fixed effects for (k in 1:38) { beta[k] ~ dflat() } # Priors for random terms tau ~ dgamma(0.001000,0.001000) sigma2 <- 1/tau for (j in 1: P) { cmcost[j] ~ dnorm(313, 0.00009803)I(0, ) #cost of a case of CM (Green et al 2009) #cost benefit analysis of cleaning cubicles twice daily cleancubicleseffect[j] <- y[j] * (beta[3]/100) #predicted effect of clean cubicles on CMDP cleancubiclescost1[j] <- 250 #cost of using instslling calving pens (£) cleancubiclescost2[j] <- 500 cleancubiclescost3[j] <- 750 cleancubiclescost4[j] <- 1000 cleancubiclessaving[j] <- (cmcost[j] * cleancubicleseffect[j]) * 10 #Savings made/yr for 120 cow herd inbCLEANCUBICLES1[j] <- cleancubiclessaving[j] + cleancubiclescost1[j] #INB (£) inbCLEANCUBICLES2[j] <- cleancubiclessaving[j] + cleancubiclescost2[j] inbCLEANCUBICLES3[j] <- cleancubiclessaving[j] + cleancubiclescost3[j] inbCLEANCUBICLES4[j] <- cleancubiclessaving[j] + cleancubiclescost4[j] p500.cleancubicles1[j]<-step(-(inbCLEANCUBICLES1[j]+500)) #probability of saving £500 after 1 year p500.cleancubicles2[j]<-step(-(inbCLEANCUBICLES2[j]+500)) p500.cleancubicles3[j]<-step(-(inbCLEANCUBICLES3[j]+500)) p500.cleancubicles4[j]<-step(-(inbCLEANCUBICLES4[j]+500)) p1000.cleancubicles1[j]<-step(-(inbCLEANCUBICLES1[j]+1000)) p1000.cleancubicles2[j]<-step(-(inbCLEANCUBICLES2[j]+1000)) p1000.cleancubicles3[j]<-step(-(inbCLEANCUBICLES3[j]+1000)) p1000.cleancubicles4[j]<-step(-(inbCLEANCUBICLES4[j]+1000)) #cost benefit analysis of ration rationeffect[j] <- y[j] * (beta[5]/100) #predicted effect of ration on CMDP rationcost1[j] <- 250 #cost of ration (£) rationcost2[j] <- 500 rationcost3[j] <- 1000 rationcost4[j] <- 2000 rationsaving[j] <- (cmcost[j] * rationeffect[j]) * 10 #Savings made/yr for 120 cow herd inbRATION1[j] <- rationsaving[j] + rationcost1[j] #INB (£) inbRATION2[j] <- rationsaving[j] + rationcost2[j] #INB (£) inbRATION3[j] <- rationsaving[j] + rationcost3[j] #INB (£) ( inbRATION4[j] <- rationsaving[j] + rationcost4[j] #INB (£) (negative means saving money) p1000.ration1[j]<-step(-(inbRATION1[j]+1000)) #probability of saving £1000 after 1 year p1000.ration2[j]<-step(-(inbRATION2[j]+1000)) p1000.ration3[j]<-step(-(inbRATION3[j]+1000)) p1000.ration4[j]<-step(-(inbRATION4[j]+1000)) }
256
Appendix 3
EDP Interventions investigated in Chapter 5
Alleyways, loafing and feed areas should be scraped at least twice daily.
(dry cows)
Straw yards should be cleaned out completely at least once per month.
(dry cows)
As a general principle the environment of dry cows should be managed at
least as well as for milking cows.
There should be a bedded lying area of 1.25sq.m. Per 1000 litres of milk
per cow (herd annual milk yield) (dry cows)
Calves must only be allowed to suckle their own mother to prevent the
possible transfer of pathogens in milk between cows.
Alleyways, loafing and feed areas should be scraped at least twice daily.
(calving cows)
Straw yards should be cleaned out completely at least once per month.
(calving cows)
New, clean, dry straw should be put in yards or pens at least once daily.
(calving cows)
You must monitor indices describing udder health in conjunction with the
attending veterinary surgeon.
Dry cow therapy must be administered hygienically, as detailed in the
standard operating procedure provided with the training materials.
Cows are sometimes or always dried off during the milking process.

257
Cows must be observed for signs of disease at least every 6 hours for the
first 24hrs, to ensure early detection of mastitis (or any other disease).
New clean, dry straw should be put in the yards at least once daily. (dry
cows)
Cows sometimes have access to the same lying area (e.g. Loafing paddock,
paddock near the farm or sheltered area) for more than two continuous
weeks. (dry cows)
At least 250kg of straw per cow should be used to bed cows per month
housed (~1.5 tonnes straw per dry cow per winter). (dry cows)
Cows are sometimes on the same pasture, paddock or field for two or
more weeks. (dry cows)
There should be 15sq.m. Per cow, whether cows calve in pens or yards.
You must monitor mastitis indices at least every three months.
If limited space is available, priority should be given to the space
allowances for transition cows and bedding frequency should be
increased. (dry cows)
Heifers must be kept in clean, dry environmental conditions at all times.
Calves must be fed 3 litres colostrum in the first 6 hours of life to
minimize the risk of general disease.
Milk yield should be reduced to less than 15 litres by the time of drying
off, and preferably to less than 10 litres.
You should monitor mastitis indices on a monthly basis.
Mixing maiden heifers and dry cows should be avoided since this has
been associated with an increased risk of mastitis after calving.
258
Clean bedding material should be applied at least once daily for organic
bedding. (dry cows)
An aseptic milk sample must be collected from every case of clinical
mastitis.
Cows sometimes return to a grazing, loafing or rest area within 4 weeks
after it has last been used by cattle. (dry cows)
An aseptic treatment procedure and partial insertion of the
intramammary tube into the teat end must be used (as for dry cow
therapy administration).
Cows should be milked for the first time within 24 hours of calving.
The success of mastitis treatments must be monitored (in consultation
with the attending veterinary surgeon) by monitoring cow scc in the
months after treatment.
Cows should be dried off in the parlour, (but not during milking) since
this gives best access for udder preparation.
Dry cow therapy should be selected at the cow level (a suitable product
for each cow) in consultation with the attending veterinary surgeon.
Both antibiotic and non-antibiotic approaches should be considered for
low scc cows.
Pens must be cleaned out between each cow calving.
Each quarter should be stripped within 4 hours of calving to check for
mastitis.
There should be a separate transition cow group from approximately 3
weeks before calving.
Clinical mastitis incidence per quarter and per cow (indices to monitor)
259
Dung, soiling and wet bedding should be removed at least twice per day
from dry cow cubicles. (dry cows)
Sometimes cows have to share calving pens or there are insufficient pens
to allow them to be cleaned out between calvings.
There should be water trough space of >10cm per cow for all cows at all
stages of the production cycle, including availability in the yards before
and after milking.
Quarters must be fore-milked at each milking to look for milk changes
(clots, watery, changes in colour).
You must move to a different field or move feeders if severe poaching of
the land and/or gateways occurs. (dry cows)
There must be good ventilation, but without draughts in all dry cow
housing.
New, clean sand should be put in yards or pens at least daily (aim to get
cows onto a straw bed during calving).
A minimum of 10 milk samples must be cultured and the incidence of
specific pathogens monitored in conjunction with a veterinary advisor.
Responses to treatment. (indices to monitor)
Drying off must be abrupt; that is, cows should not be milked once daily.
The calf should be removed from the cow within 24 hrs of birth after
ensuring colostrum has been fed.
The high scc cow decision support tool should be used in consultation
with the attending veterinary surgeon to decide the best course of action
for each cow.

260
Drying agents should be used to improve the dryness of the cubicle beds.
(dry cows)
All early dry period cows should have an appropriate dry cow mineral
supplement.
In-line filters (if present) must be checked after each cow is milked.
There must be at least 2sq.m. loafing space/cow. (dry cows)
Inorganic bedding materials should be used wherever possible. (dry
cows)
Surface flooding or severe poaching sometimes occurs at pasture. (dry
cows)
A cmt (california mastitis test) test should be carried out on all quarters of
each cow within 7 days of calving.
You should never exceed a stocking density of 100 cows/acre/day in a
two week period. (dry cows)
Vitamin E - 1200 iu /cow/day (dry cows)
Heifers must have clean legs, udders and tails at all times.
All clinical cases of mastitis must be treated with antibiotics.
Significant pooling of liquid in housing, feeding and/or loafing areas
occurs.
Straw, sawdust or paper products should be stored under a waterproof
cover and kept dry at all times.
You should consider an extended antibiotic therapy regime. (treatment of
high scc cows)
261
There should be at least 0.6m feedspace per cow in total for access to
forage, concentrate or complete diet portions of the cows' feed. (dry
cows)
There must be good ventilation but without draughts in all calving cow
housing.
Calcium and magnesium should be balanced to prevent milk fever,
whether calcium restriction or DCAB manipulation are used.
Cows with milk yields that have dropped below 5 litres should be dried
off immediately.
Pre-milking teat disinfection must be carried out.
You should take a pre-treatment sample. (treatment of high scc cows)
20 to 30 seconds must elapse after application of pre-milking teat
disinfection, before teats are dried.
There should be a brisket board in the cubicles at a distance of
approximately 75% of the cubicle length (1.82m) to ensure that at least
90% of the dry cows dung into the passageway. (dry cows)
Cows should calve in individual pens rather than yards.
The yards or pens should have a base with sand on top of hardcore or
concrete. (calving cows)
However many of the following items are performed, they must be done
in this order: wash and dry teats, foremilk, pre-milking teat disinfection,
dry teats with individual towels.
A CMT should be used to assess milk from quarters when in doubt over
the presence of mastitis.

262
A J5 vaccination protocol could be used if the herd is suffering from
uncontrollable severe coliform mastitis.
You should differentiate infected from uninfected cows using scc records
from the current lactation.
The base of the straw yard should have excellent drainage, possibly with
sand on top of hardcore or concrete. (dry cows)
There must be good ventilation, but without draughts in all milking cow
housing.
Each quarter must be foremilked to detect mastitis.
Sufficient bedding should be used to keep surface conditions dry but also
to retain cow comfort. (dry cows)
There should be at least 3sq.m. Per cow. (dry cows)
Individual cow somatic cell counts and trends. (indices to monitor)
Collecting yards must be scraped before or after every milking.
Dry cow rations should be formulated by a suitably qualified nutritional
advisor.
All cases of clinical mastitis must be recorded according to a defined
protocol.
Concrete floors must be grooved where and floors must be non-slip in all
areas. (calving cows)
A non- steroidal anti-inflammatory drug should be used. (treatment of
grade 2 cases)
Exit to parlour must be stress-free (no operator pressure or poor design
features such as excessive slopes or bends).
Bedding should be spread evenly. (dry cows)

263
Ideally the dry period should be between 42 and 70 days in length.
Cubicles should be designed such that at least 90% of dry cows will lie in
them correctly at all times. (dry cows)
The milking staff must assess cows for dullness, depression, anorexia.
Cows must not be dried off when foot-trimming.
Ideally the dry period should be between 42 and 70 days in length.
New bedding should be spread evenly. (calving cows)

264
Appendix 4
EL Interventions investigated in Chapter 6
Liners must be changed at least every 2500 milkings or 6 monthly
(whichever occurs first) - unless the manufacturer specifies otherwise.
Clusters must be applied within 1 minute of the end of teat preparation.
There should be less than 5% of cows with moderate/severe teat end
damage (hyperkeratosis).
An aseptic milk sample must be collected from every case of clinical
mastitis.
Collecting yards must be scraped before or after every milking.
Each quarter must be foremilked to detect mastitis.
A six monthly machine test must be carried out by an independent,
suitably qualified technician to ISO standard.
However many of the following items are performed, they must be done
in this order: wash and dry teats, foremilk, pre-milking teat disinfection,
dry teats with individual towels.
Quarters must be fore-milked at each milking to look for milk changes
(clots, watery, changes in colour).
Pre-milking teat disinfection must be carried out.
An aseptic treatment procedure and partial insertion of the
intramammary tube into the teat end must be used (as for dry cow
therapy administration).

265
Cows with clinical mastitis and high scc must be milked last to stop the
spread of infection to other cows.
20 to 30 seconds must elapse after application of pre-milking teat
disinfection, before teats are dried.
There should be water trough space of >10cm per cow for all cows at all
stages of the production cycle, including availability in the yards before
and after milking.
There must be a clean yard on exit, which is scraped before and during
milking if necessary.
You must monitor mastitis indices at least every three months.
You must monitor indices describing udder health in conjunction with the
attending veterinary surgeon.
The clusters must be squarely aligned and balanced centrally under all
cows.
Hot disinfectant should be used to clean clusters that become dirty during
milking.
You should avoid returning cows to any one grazing, loafing or rest area
for at least 4 weeks after it has been used by cattle. (milking cows)
Hot disinfectant must be used to wash clusters after milking a cow with
clinical mastitis or a high somatic cell count, whether or not a separate
cluster is used and, where possible, the plant back to the recording
jar/meter must also be back-flushed with hot disinfectant.
The routine should take around 1 minute from start of preparation to
putting units on.

266
Calves must be fed 3 litres colostrum in the first 6 hours of life to
minimize the risk of general disease.
Damp bales should be discarded or at least used for the animals at lowest
risk, such as youngstock.
Dump clusters/lines/buckets should be tested as a part of the plant
assessment and included in a dynamic test.
Alleyways, loafing and feeding areas must be scraped out at least twice
daily. (milking cows)
The success of mastitis treatments must be monitored (in consultation
with the attending veterinary surgeon) by monitoring cow scc in the
months after treatment.
There must be good ventilation, but without draughts in all milking cow
housing.
There should be sufficient grip and grooving of concrete in all areas to
prevent the risk of slipping and injury.
You should avoid letting cows have access to any one lying area (for
example loafing paddocks near to the farm or sheltered areas) for more
than two continuous weeks. (milking cows)
Dump bucket/line cluster liners must be changed when parlour liners are
changed – and should be changed more frequently if necessary.
You should actively manage gateways/walkways by using bark, hardcore,
shavings etc to minimize the risk of poaching. (milking cows)
A minimum of 10 milk samples must be cultured and the incidence of
specific pathogens monitored in conjunction with a veterinary advisor.

267
All high scc cows (as a guide >200,000 cells/ml for two of the last three
months) should be clearly marked (using tail tape, leg bands, sprays etc),
so that care can be taken to avoid their milk contaminating hands or other
cows through splashes or aerosols.
As a second best to the above, cows with clinical mastitis and high somatic
cell counts should at least be milked with a separate cluster (this cluster
should not be used to milk fresh calved cows or cows with milk out of the
tank for reasons other than mastitis).
All wet areas must be dried with clean paper/laundered towel, with one
clean / fresh part used per teat.
Straw, sawdust or paper products should be stored under a waterproof
cover and kept dry at all times.
A rapid kill disinfection product must be used. (pre-milking teat
disinfection)
Straw yards should be cleaned out completely at least once per month.
(milking cows)
The acr removal flow rate should be checked at six monthly intervals by a
suitably trained technician.
A wash with hot water and disinfectant should be carried out after every
milking.
When a house is re-bedded after cleaning out, the environment must be
totally clean, preferably disinfected and copious amounts of bedding used
to ensure the cows do not become dirty. (milking cows)
There should be a bedded lying area of 1.25 sq.m. Per 1000 litres of milk
per cow (herd annual milk yield). For example, an 8,000 litre cow needs
268
approximately 10 sq.m., whilst a 10,000 litre cow needs 12.5 sq.m.
(milking cows)
You should rotate the use of routes and gateways wherever possible
should poaching occur. (milking cows)
Cases which are doubtful but that have an increased cmt reading (or
conductivity) must be treated.
You should group cows with a high scc and cows with clinical cases of
mastitis separately to the main herd and milk them last at each milking.
Cows should always have access to water (not be denied access for more
than 1 hour in a 24 hour period).
Clean bedding material must be applied at least once daily for organic
bedding. (milking cows)
Significant pooling of liquid in housing, feeding and/or loafing areas
occurs.
Clinical mastitis incidence per quarter and per cow (indices to monitor)
All clinical cases of mastitis must be treated with antibiotics.
You should monitor mastitis indices on a monthly basis.
If limited space is available, priority should be given to the space
allowances for the high yielding cows and bedding frequency should be
increased.
The high scc cow decision support tool should be used in consultation
with the attending veterinary surgeon to decide the best course of action
for each cow.
269
The milking machine should be washed with hot water and a full
disinfection cycle, following the manufacturers recommendations, after
every milking.
Responses to treatment. (indices to monitor)
You should avoid having cows on the same pasture, paddock or field for
more than two continuous weeks. (milking cows)
Significant poaching of pastures, gateways, walkways, shelter or feed
areas sometimes occurs.
Air bleed holes must remain open and clear throughout the milking
process.
You must maintain excellent housing conditions (as for winter) if cows
have access to housed lying areas during the grazing months. (milking
cows)
Sufficient bedding must be used to keep surface conditions dry and also
retain cow comfort. (milking cows)
You must show due diligence with milk withdrawal when using off-label
products by using the standard milk withdrawal period (at least 7 days)
and then also testing the milk to ensure freedom from antibiotic residues
before allowing it back into the bulk tank.
Fresh food should be provided after each milking to encourage the cows
to stand for >30 minutes after milking and to prevent access to the lying
area.
The herd should have a written farm policy for biosecurity made in
consultation with the attending veterinary surgeon.

270
As a second best measure, you should at least group cows with clinical
mastitis separately to the main herd.
Hands and gloves should be washed and dried during milking if they
become dirty.
A CMT should be used to assess milk from quarters when in doubt over
the presence of mastitis.
Cows must not be over-milked.
Cows are sometimes on the same pasture, paddock or field for two or
more weeks. (dry cows)
There should be well designed yards and alleys that minimise the risk of
slipping and injury.
The herd should be closed, with barriers to outside animals and people.
You must move to a different field if severe poaching of the land and/or
gateways occurs. (milking cows)
A static and dynamic machine test must be performed by an independent
qualified technician if a new parlour or extension is fitted.
You must ensure good fly control for all lactating cows and heifers
through the summer period when flies are expected or apparent.
You should take a pre-treatment sample. (treatment of high scc cows)
Cows sometimes have to wait more than one hour to be milked.
Drying agents could be used to improve the dryness of cubicle beds, but
they are not clinically proven to reduce mastitis. (milking cows)
The base of the straw yard should have excellent drainage, possibly with
sand on top of hardcore or concrete. (milking cows)

271
There should be at least 0.6m feedspace per cow in total for access to
forage, concentrate or complete diet portions of the cows' feed. (milking
cows)
The straw for bedding should be unchopped. (milking cows)
Dry straw only should be harvested or purchased. Prior to bedding, straw
should contain no more than 15% moisture and this can be checked using
a moisture meter if in doubt.
If teats are dirty they must be washed up to base of the udder with warm
potable water.
In-line filters (if present) must be checked after each cow is milked.
Inorganic bedding materials should be used wherever possible. (milking
cows)
You could use ‘off-label’ approaches to treatment in consultation with the
attending veterinary surgeon.
Clusters that become dirty during milking must be washed using potable
(ie water of drinking quality) water.
The scrapers must work sufficiently often to keep alleyways clean.
(milking cows)
There must be access to ad lib water in the post milking yard.
Affected quarters must be stripped out thoroughly.
Selenium - 3.6 mg /cow/day (dry cows)
There should be 5% more cubicles than cows for each group. (milking
cows)
There should be a brisket board in the cubicles at a distance of
approximately 75% of the cubicle length (but should be adjustable) to

272
ensure that at least 90% of the cows dung into the passageway. (milking
cows)
The milking staff must assess cows for dullness, depression, anorexia.
Foremilking should be into a strip cup or carried out with great care to
avoid the spread of infection.
A non- steroidal anti-inflammatory drug should used. (treatment of grade
3 cases)
Cubicle partitions must be safe and in good condition and unlikely to
cause teat or udder injury. (milking cows)
You must have sufficient pasture drainage to never allow surface flooding
or severe poaching. (milking cows)
Water troughs must not be sited in the bedded area, and must be
surrounded by a clean, well-drained surface in the loafing or feed areas.
(milking cows)
New, clean, dry straw should be put in yards or pens at least once daily.
(calving cows)
Pre-milking teat disinfection should be applied with a cup rather than a
spray.
Copper 11 mg/kg dm in diet (milking cows)
Dogs should not be used to move cows, when cows are housed.
A non- steroidal anti-inflammatory drug should be used. (treatment of
grade 2 cases)
There should be less than 5% of cows with liner slip.
273
At least 250kg of straw per cow should be used to bed cows per month
housed (approximately 1.5 tonnes straw per milking cow per winter).
(milking cows)
Some cows show signs of discomfort during milking.
The cow must be cmt negative for 3 consecutive days if purchased in early
lactation. (cows being bought)
cubicles should be designed such that at least 90% cows will lie in them
correctly, at all times. (milking cows)
Alleyways, loafing and feed areas should be scraped at least twice daily.
(dry cows)
In general, the highest flow rate acr setting at removal should be used that
allows effective milk out, to minimize the time clusters are on the cows.
Cows sometimes have access to the same lying area (e.g. Loafing paddock,
paddock near the farm or sheltered area) for more than two continuous
weeks. (dry cows)
There must be a minimum of at least 2sq.m./cow. (loafing space for
milking cows)
The milking staff must look at/feel the udder for signs of inflammation
(heat, swelling, redness, pain).
Less than 5% cows should leak milk while waiting to be milked.
Vitamin E - 550 iu / cow / day (milking cows)
There must be at least as many cubicles as cows for each group. (milking
cows)
Selenium 0.3 mg/kg dm in diet (milking cows)
There should be less than 2% of cows with other teat lesions.

274
A licensed antibiotic product must be used for treatment according to
datasheet recommendations.
Collecting yards should have sufficient drainage to prevent excessive
pooling of liquid and footbaths should not be used just before milking.
Grade three cases should be treated in close consultation with the
attending veterinary surgeon.
Collecting yards should have sufficient grip and grooving to prevent the
risk of slipping and injury.
Zinc 50 mg/kg dm in diet (milking cows)
During milking, the vacuum should not drop by more than 2kpa when one
more cluster than the number of milking staff is open.
You should consider an extended antibiotic therapy regime. (treatment of
high scc cows)
You must follow the manufacturer’s recommendations regarding the
wash such as the quantity/temperature of water required and the
types/concentrations/frequency of chemicals used.
Clean bedding material must be applied at least once every other day for
inorganic bedding. (milking cows)
Exit to parlour must be stress-free (no operator pressure or poor design
features such as excessive slopes or bends).
Dogs should be used with extreme care to move cows.
Pooling of liquid in the post milking yard sometimes occurs.
Cows with clinical mastitis must be milked to a dump line where possible.


![City: Fort Myers State: FL Zip:33913 · 11000 Terminal Access Road, Suite 8671, Fort Myers, FL 33913 [2] Email: tallstructure@flylcpa.com / Phone: 239.590.4609 / FAX: 239.590.4688](https://img.pdfslide.net/doc/110x75/5fbb7c9f2afb87600815820b/city-fort-myers-state-fl-zip33913-11000-terminal-access-road-suite-8671-fort.jpg)