Embed Size (px)
Citation preview

Acta Oceanol. Sin., 2013, Vol. 32, No. 9, P. 50-61
DOI: 10.1007/s13131-013-0352-y
http://www.hyxb.org.cn
E-mail: [email protected]
Down-scaled regional ocean modeling system (ROMS) forhigh-resolution coastal hydrodynamics in KoreaLIM Hak-Soo1∗ , KIM Chang S1, PARK Kwang-Soon1, SHIM Jae Seol1, CHUN Insik2
1 Korea Institute of Ocean Science and Technology, Ansan 426–744, Republic of Korea2 Konkuk University, Seoul 143–701, Republic of Korea
Received 2 March 2012; accepted 10 December 2012
©The Chinese Society of Oceanography and Springer-Verlag Berlin Heidelberg 2013
AbstractA down-scaled operational oceanographic system is developed for the coastal waters of Korea using a re-gional ocean modeling system (ROMS). The operational oceanographic modeling system consists of at-mospheric and hydrodynamic models. The hydrodynamic model, ROMS, is coupled with wave, sedimenttransport, and water quality modules. The system forecasts the predicted results twice a day on a 72 h basis,including sea surface elevation, currents, temperature, salinity, storm surge height, and wave informationfor the coastal waters of Korea. The predicted results are exported to the web-GIS-based coastal informa-tion system for real-time dissemination to the public and validation with real-time monitoring data usingvisualization technologies. The ROMS is two-way coupled with a simulating waves nearshore model, SWAN,for the hydrodynamics and waves, nested with the meteorological model, WRF, for the atmospheric surfaceforcing, and externally nested with the eutrophication model, CE-QUAL-ICM, for the water quality. The op-erational model, ROMS, was calibrated with the tidal surface observed with a tide-gage and verified withcurrent data observed by bottom-mounted ADCP or AWAC near the coastal waters of Korea. To validatethe predicted results, we used real-time monitoring data derived from remote buoy system, HF-radar, andgeostationary ocean color imager (GOCI). This down-scaled operational coastal forecasting system will beused as a part of the Korea operational oceanographic system (KOOS) with other operational oceanographicsystems.Key words: down-scaled operational oceanographic system, regional ocean modeling system, wave coupled
model, real-time monitoring system
Citation: Lim Hak-Soo, Kim Chang S, Park Kwang-Soon, Shim Jae Seol, Chun Insik. 2013. Down-scaled regional ocean modelingsystem (ROMS) for high-resolution coastal hydrodynamics in Korea. Acta Oceanologica Sinica, 32(9): 50–61, doi: 10.1007/s13131-013-0352-y
1 IntroductionMany operational oceanographic systems have been de-
veloped for the global ocean data assimilation experiment (GO-DAE) in the past decade. The operational systems consist ofreal-time observing systems, including satellite data and as-similative ocean circulation model systems to produce fore-casts for public service. In the USA, there are several sys-tems, such as ECCO (estimating the circulation and climateof the ocean) operated by the JPL (Jet Propulsion Laborato-ry) in NASA (National Aeronautics and Space Administration),HYCOM (hybrid coordinate ocean model) operated by the USNavy, and RTOFS (real-time ocean forecast system) operat-ed at NOAA (National Oceanic and Atmospheric Administra-tion). In Europe, similar systems are in operation, such asFOAM (forecasting ocean assimilation model) operated by theMet Office in UK, MERCATOR operated by Mercator Ocean inFrance, MFS (Mediterranean ocean forecasting system) oper-ated by INGV (National Institute of Geophysics and Volcanol-ogy) in Italy, and TOPAZ (towards an operational prediction
system for the North Atlantic European coastal zones) oper-ated by NERSC (National Energy Research Scientific Comput-ing Center) in Norway. The data assimilative model, HYCOM,(Hurlburt et al., 2009) provides 14 d forecasts with an eddy-resolving global model for the mesoscale ocean features, withnear-real-time global HYCOM/NCODA (Navy coupled oceandata assimilation) based ocean prediction output. This glob-al ocean prediction system provides initial and boundary con-ditions to nested regional and coastal models. The FOAM is aglobal ocean model with a 1◦ resolution grid and 20 layers inthe vertical dimension. The model is a data assimilative fore-casting system (Bell et al., 2000) that has provided 5 d forecastsby the Met Office since 1997. Several down-scaled nested mod-els covering the Baltic Sea, the Atlantic, Arctic, Antarctic, andIndian Oceans, and the Arabian and Mediterranean Seas havebeen operated for 5 day forecasts on a daily basis. A pressurecorrection technology (Bell et al., 2004) using a data assimila-tion method is employed to improve the dynamical balance n-ear the equator.
Foundation item: The project entitled Cooperation on the Development of Basic Technologies for the Yellow Sea and East China Sea OperationalOceanographic System funded by the China-Korea Joint Ocean Research Center; the project entitled “Development of Korea Operational Oceano-graphic System” funded by the Ministry of Oceans and Fisheries, Korea; the project Functional Improvement of Korea Ocean Satellite Center andDevelopment of the Marine Environment Impact Prediction Program funded by the Korea Institute of Ocean Science and Technology.*Corresponding author, E-mail: [email protected]
1

LIM Hak-Soo et al. Acta Oceanol. Sin., 2013, Vol. 32, No. 9, P. 50-61 51
The use of forecasting systems for coastal waters has re-cently increased in other countries, such as Australia, Japan,and China. The purpose of the systems is to forecast the hy-drodynamics in the regional and coastal waters for the man-agement of fishery and marine activities, pollution control,search and rescue, and prevention of coastal disasters fromstorm surges or inundation. The Australian Bureau of Meteo-rology (ABoM) supports the Bluelink system, which consists ofthe Bluelink ocean data assimilation system (BODAS; Oke et al.,2008) and the ocean forecasting Australia model (OFAM; Griffieset al., 2004), a global ocean general circulation model based onthe modular ocean model (MOM4). Since 2007, these systemshave predicted the ocean circulation in the region around Aus-tralia and adjacent basins. The National Marine EnvironmentalForecasting Center (NMEFC), which is a government institutesupported by the State Oceanic Administration (SOA) in China,developed an operational forecasting system using the Prince-ton ocean model (POM) for the western North Pacific and smal-l coastal regions. The NMEFC system predicts a 72 h forecastdaily for the western North Pacific and coastal waters to preventmarine disasters from storm surges along the China’s coasts, seawaves, and tsunamis, as well as sea-ice conditions in the BohaiGulf and northern Yellow Sea.
The first operational oceanographic system in Korea wasthe operational storm surge prediction system, KOSY (Park etal., 2009), which was developed by the Korea Institute of O-cean Science and Technology (KIOST) and funded by the Min-istry of Land, Transport and Maritime Affairs (MLTM), Korea.KOSY has been in operation for the coastal waters of Korea toforecast sea surface elevation in stormy weather. The systemis nested with the CE atmospheric model, which is based onthe US Army Corps of Engineers (USACE) wind model. Stormsurge signals were successfully reproduced around the coastalwaters of Korea for a selection of four major typhoons. The sys-tem responds correctly to the given typhoon information andthe low-pressure event and predicts storm surge occurrence ap-proximately 68 h ahead.
The Saemangeum operational oceanographic networks(SOON), a suite of model systems for the Saemangeum (SMG)tidal lake and coastal waters located off the mid-western coastof Korea, has been developed exclusively for the SMG opera-tional oceanographic system (Lim et al., 2011). The modelingsystem of the SOON comprises atmospheric and hydrodynamicmodels coupled with 3-D hydrodynamic, wave, sediment trans-port, and water quality modules. The hydrodynamic variablesare forecasted twice a day on a 72 h basis and exported to theweb-GIS system for real-time dissemination to the public. Theearlier version of the SOON coastal operational oceanograph-ic system uses monthly mean temperature and salinity fromthe World Ocean Atlas 2005 (WOA 2005) for the boundary con-ditions. The external linkage module between the hydrody-namic model of ROMS and the eutrophication model of CE-QUAL-ICM was developed for the water quality modeling of S-MG coastal waters of Korea (Kim et al., 2011).
With the experience of developing the SOON system, wehave been developing a down-scaled operational coastal mod-eling system for high-resolution coastal hydrodynamics in Ko-rea using the regional ocean modeling system (ROMS). Thiscoastal operational model system utilizes a fine grid coveringthe western and southern coastal waters of Korea, and is nestedwith the predicted results derived from the Yellow Sea opera-tional model ROMS (Kwon et al., 2011). This model has been
operated by Kunsan National University of Korea for the openboundary condition and is in turn nested with the predicted re-sults generated from the regional atmospheric model, WRF[A6],which has been operated by KIOST for surface forcing. With12 h of advanced surface and boundary conditions, the oper-ational model predicts tides, wind-driven circulation, tempera-ture, salinity, storm surge height, wave information, and waterquality, twice a day on a 72 h basis as a part of the KOOS system.
2 The operational modelThe regional ocean model, ROMS, has various compu-
tational pathways, such as stand-alone or coupled opera-tion to atmospheric or wave models. The model is a three-dimensional, free-surface, terrain-following numerical modelthat solves the Reynolds-averaged Navier-Stokes (RANS) equa-tions using the hydrostatic and Boussinesq assumption devel-oped as a community model by Rutgers University, USA (Haid-vogel et al., 2008). The model uses a horizontal curvilineargrid system and stretched terrain-following coordinate in a ver-tical array. It has been widely used for the prediction of hy-drodynamic variables as well as the sediment transport studywith highly resolving tidal flat dynamics in Korea (Kim and Lim,2007, 2009; Lim et al., 2011).
Using the model coupling tool-kit (MCT), the hydrody-namic model, ROMS, is mutually coupled with the simulatingwaves nearshore model (SWAN; Ris et al., 1999), which is awave-averaged model that solves transport equations for waveaction density, N , which is the energy density divided by a rel-ative frequency. The MCT is an open-source software library,distributed as a set of Fortran 90 modules for constructing acoupled modeling system from individual component models(Warner et al., 2008). Through the MCT library, the ROMS pro-vides hydrodynamic information, such as surface elevation andflow information, to the SWAN. Then, SWAN simulates waves,including wave height, wave direction, and wave period, withupdated hydrodynamic data, and sends the wave informationto the ROMS to calculate bottom wave current-combined radi-ation stress terms resolving the wave-current interaction. Dataexchange between the ROMS and the SWAN, which both use thesame grid in their current implementation, is defined in a cou-pling input file.
The governing equations of wave-current interaction arepresented in flux form, in Cartesian horizontal and vertical co-ordinates. The momentum equations are
∂ (Hz u )∂ t
+∂ (u Hz u )∂ x
+∂ (v Hz u )∂ y
+∂ (ΩHz u )∂ s
− f Hz v
=−Hz
ρ0
∂ p
∂ x−Hz g
∂ ζ
∂ x− ∂∂ s
�u ′w ′ − v
Hz
∂ u
∂ s
�−
∂ (Hz Sx x )∂ x
− ∂ (Hz Sx y )∂ y
+∂ Spx
∂ s,
∂ (Hz v )∂ t
+∂ (u Hz v )∂ x
+∂ (v Hz v )∂ y
+∂ (ΩHz v )∂ s
+ f Hz u
=−Hz
ρ0
∂ p
∂ y−Hz g
∂ ζ
∂ y− ∂∂ s
�v ′w ′ − v
Hz
∂ v
∂ s
�−
∂ (Hz Sx y )∂ x
− ∂ (Hz Sy y )∂ y
+∂ Spy
∂ s,
0=− 1
ρ0
∂ p
∂ s− g
ρ0Hzρ,

52 LIM Hak-Soo et al. Acta Oceanol. Sin., 2013, Vol. 32, No. 9, P. 50-61
with the continuity as:
∂ ζ
∂ t+∂ (Hz u )∂ x
+∂ (Hz v )∂ y
+∂ (HzΩ)∂ s
= 0
and scalar transport:
∂ (Hz C )∂ t
+∂ (u Hz C )∂ x
+∂ (v Hz C )∂ y
+∂ (ΩHz C )∂ s
=− ∂∂ S
�c ′w ′ − vθ
Hz
∂ C
∂ s
�+Cs,
where u , v, and Ω are the mean components of velocity in thehorizontal (x and y ) and vertical (s ) directions, respectively;ζ is the wave-averaged free-surface elevation; Hz is a verticalstretching factor; and f is the Coriolis parameter; an overbarindicates a time average; a prime (′) indicates a fluctuating tur-bulent quantity; pressure is p ; ρ and ρ0 are total and referencedensities for seawater, respectively; g is acceleration due togravity; v and vθ are molecular viscosity and diffusivity, respec-tively; C represents a tracer quantity (for example, salt, tem-perature, and suspended-sediment); Cs are tracer source/sinkterms; and a function ρ = f (C ) is required to close the equa-tion of state. These equations are closed by parameterizing theReynolds stresses and turbulent tracer fluxes as:
u ′w ′ =−KM∂ u
∂ z,
v ′w ′ =−KM∂ v
∂ z,
c ′w ′ =−Kh∂ ρ
∂ z,
where KM is eddy viscosity for momentum, and Kh is the ed-dy diffusivity for tracers. Eddy viscosities and eddy diffusiv-ities are calculated using MY-2.5, GLS(k-e), LMD, or KPP asturbulence-closure models, depending on the application pro-cess (Warner et al., 2008). The wave-coupled model, ROMS, in-cludes a radiation stress term for the nearshore bottom bound-ary condition. The horizontal/vertical radiation stress terms(Sx x , Sx y , Sy y /Spx , Spy ) added to the momentum equations arebased on Mellor (2003, 2005). The radiation stress terms weredescribed by Warner et al. (2008).
The eutrophication model, CE-QUAL-ICM (Cerco andCole, 1993; Cerco et al., 2010), is linked with the hydrodynam-ic model, ROMS, with external linkage code (Kim et al., 2011).ROMS, which uses a structured grid system, has been linked bythese linkage codes with ICM, which uses an unstructured gridsystem. The ROMS-ICM water quality has been tested success-fully for calibration and verification by application to the SMGtidal lake and coastal waters for the year 2009. The model val-idation has been tested with the field data of water quality pa-rameters, such as temperature, salinity, chlorophyll, dissolvedoxygen, phosphorus, and nitrogen observed in 2010. The op-erational ROMS-ICM modeling system has been conducted toverify the operational purpose of validating predictability withhourly acquired chlorophyll data derived from the geostation-ary ocean color imager (GOCI) images using the geostationarydata processing system (GDPS).
The ICM provides a solution to the three-dimensionalmass-conservation equation for a control volume. The CE-QUAL-ICM solves the following equation for each volume andstate variable:
δVj C j
δt=
n∑k=1
Qk Ck +n∑
k=1
Ak DkδC
δxk+∑
Sj ,
where Vj is the volume (m3) of the j th control volume; C j is theconcentration(g/m3) in the j th control volume; t and x are tem-poral and spatial coordinates, respectively; n is the number offlow faces attached to the j th control volume; Qk is the volu-metric flow (g/m3) across the flow face k ; Ak is the area (m2) ofthe flow face k ; Dk is the diffusion coefficient (m2/s) at the flowface k ; and Sj is the external loads and kinetic sources and sinks(g/s) in the j control volume.
The ICM requires grid structure information to be speci-fied in two input files referred to as the “geometry” and “map”files. These two files contain all of the grid structure informa-tion required by the ICM transport algorithms. An additionalfile, called the “hydro” file, contains the time-varying flow-fielddata generated by the hydrodynamic model, ROMS. These threefiles provide all the data needed to drive the ICM model. The hy-drodynamic file contains time-varying cell volumes, cell dimen-sions, face flow rates and areas, and calculated vertical diffusiv-ities that must be generated by ROMS-ICM linkage codes as thegrid evolves through time. The linkage code currently requiresthe explicit specification of all open ocean boundaries and riv-er outflow boundaries that are embedded within the extractingboundary flow face information from the existing ROMS datastructures.
3 The operational oceanographic systemThe Korea Operational Oceanographic System (KOOS),
funded by the Ministry of Land, Transport and Maritime Affairs(MLTM), is under development to support ocean activities andvarious problems of regional and coastal waters in Korea. Themain objective of this project is to provide users with predict-ed information needed to resolve various problems, such as oilspills and search and rescue, around the coastal waters of Kore-a. The KOOS system has been in development by the KIOSTsince August 2009, and is supposed to finish its first stage in2013. Presently, major efforts are focused on setting and testingthe operational system with data management, including infor-mation services. The KOOS uses real-time observing networks,such as buoy systems, HF-radar systems, geostationary satel-lite, and ocean observatory towers. Now, ten numerical mod-els are being tested, including two numerical weather models(WRF and UM), two wave models (SWAN and WAM), and six o-cean/coastal models [ROMS, MOM3, KOSY (Park et al. 2009),FVCOM (Chen et al., 2006), MOHID, and ADCIRC]. To supportthe KOOS system, we developed a down-scaled operational o-ceanographic system for the coastal waters of Korea using thewave coupled model, ROMS.
The down-scaled operational coastal modeling system forthe coastal waters of Korea uses four different domains with acell size of 1.5 km. Two domains are for the western coastalwaters (W-1 and W-2) covering 34.6◦–38.4◦N, 124.0◦–127.0◦E,and the other two domains are for the southern coastal waters(S-3 and S-4) covering 32.8◦–35.8◦N, 125.0◦–130.5◦E. Each do-main is also nested into a high-resolution domain to resolve thecoastal waters of Korea, such as Incheon Ports on the north-western coast, the SMG on the mid-western coast, and Yeo-su, Masan, and Busan Ports, which are located on the south-ern coast of Korea (Fig. 1). In a vertical array, we used 20 levelswith significant stretching near the surface and bottom to re-solve surface-suspended transport and bottom sediment trans-port. For the tides at the open boundary, we used eight majortidal constituents with semidiurnal tidal constituents (M2, S2,N2, K2) and diurnal tidal constituents (K1, O1, P1, Q1) derived
LIM Hak-Soo et al. Acta Oceanol. Sin., 2013, Vol. 32, No. 9, P. 50-61 53
from the regional ocean tide model, NAO. 99jb, which has 5 res-olution (Matsumoto et al., 2000). The initial conditions of themodel were computed with 2 a simulation results using month-ly mean temperature and salinity derived from the World O-cean Atlas 2005 (WOA 2005), and the monthly mean surfaceforcing derived from the comprehensive ocean-atmosphere da-ta set (COADS). The surface forcing includes wind stress, heatflux, and water flux, obtained twice a day (04:30 and 16:30 lo-cal standard time) from the operational WRF, which has a 4 kmfine mesh and has been operated for the East China Sea andEast Sea. This surface forcing was automatically converted in-to atmospheric forcing for the down-scaled coastal model. Theopen boundary condition was nested with the predicted results(05:00 and 17:00) from another operational model, ROMS, with9 km resolution, which has been in operation for the Yellow Sea,predicting the wind-driven circulation, the temperature, andthe salinity twice a day on a 72 h basis. For restarting the op-erational system, the model uses the previous result simulat-ed 12 hours before as an initial condition. The operational o-ceanographic system for the coastal waters also needs to adop-t a data-assimilative method to forecast the temperature, thesalinity, and the circulation on a 72 h basis. This down-scaledprediction system currently focuses on the tidal currents andwave prediction. Until we developed a data-assimilative coastalforecasting system with available satellite and in-situ data, wemade the initial condition by computing the surface boundaryconditions for the temperature and salinity involving relaxationusing the monthly mean climatology data (WOA 2005).
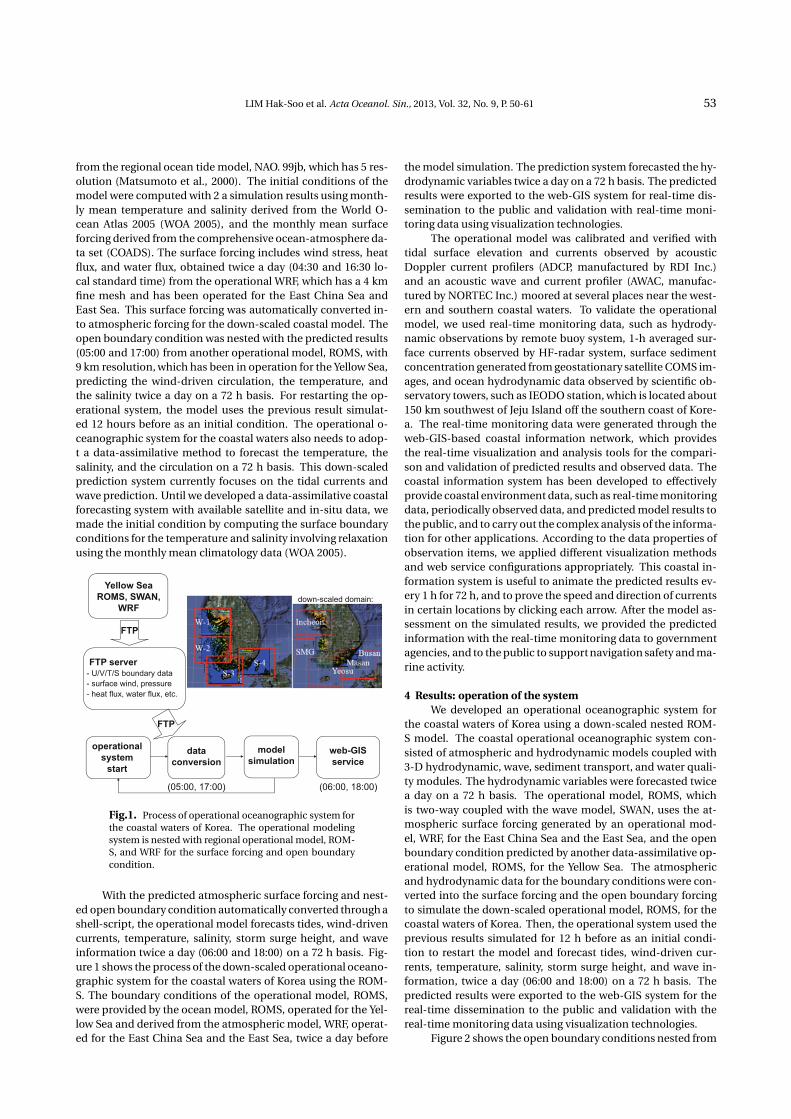
Fig.1. Process of operational oceanographic system forthe coastal waters of Korea. The operational modelingsystem is nested with regional operational model, ROM-S, and WRF for the surface forcing and open boundarycondition.
With the predicted atmospheric surface forcing and nest-ed open boundary condition automatically converted through ashell-script, the operational model forecasts tides, wind-drivencurrents, temperature, salinity, storm surge height, and waveinformation twice a day (06:00 and 18:00) on a 72 h basis. Fig-ure 1 shows the process of the down-scaled operational oceano-graphic system for the coastal waters of Korea using the ROM-S. The boundary conditions of the operational model, ROMS,were provided by the ocean model, ROMS, operated for the Yel-low Sea and derived from the atmospheric model, WRF, operat-ed for the East China Sea and the East Sea, twice a day before
the model simulation. The prediction system forecasted the hy-drodynamic variables twice a day on a 72 h basis. The predictedresults were exported to the web-GIS system for real-time dis-semination to the public and validation with real-time moni-toring data using visualization technologies.
The operational model was calibrated and verified withtidal surface elevation and currents observed by acousticDoppler current profilers (ADCP, manufactured by RDI Inc.)and an acoustic wave and current profiler (AWAC, manufac-tured by NORTEC Inc.) moored at several places near the west-ern and southern coastal waters. To validate the operationalmodel, we used real-time monitoring data, such as hydrody-namic observations by remote buoy system, 1-h averaged sur-face currents observed by HF-radar system, surface sedimentconcentration generated from geostationary satellite COMS im-ages, and ocean hydrodynamic data observed by scientific ob-servatory towers, such as IEODO station, which is located about150 km southwest of Jeju Island off the southern coast of Kore-a. The real-time monitoring data were generated through theweb-GIS-based coastal information network, which providesthe real-time visualization and analysis tools for the compari-son and validation of predicted results and observed data. Thecoastal information system has been developed to effectivelyprovide coastal environment data, such as real-time monitoringdata, periodically observed data, and predicted model results tothe public, and to carry out the complex analysis of the informa-tion for other applications. According to the data properties ofobservation items, we applied different visualization methodsand web service configurations appropriately. This coastal in-formation system is useful to animate the predicted results ev-ery 1 h for 72 h, and to prove the speed and direction of currentsin certain locations by clicking each arrow. After the model as-sessment on the simulated results, we provided the predictedinformation with the real-time monitoring data to governmentagencies, and to the public to support navigation safety and ma-rine activity.
4 Results: operation of the systemWe developed an operational oceanographic system for
the coastal waters of Korea using a down-scaled nested ROM-S model. The coastal operational oceanographic system con-sisted of atmospheric and hydrodynamic models coupled with3-D hydrodynamic, wave, sediment transport, and water quali-ty modules. The hydrodynamic variables were forecasted twicea day on a 72 h basis. The operational model, ROMS, whichis two-way coupled with the wave model, SWAN, uses the at-mospheric surface forcing generated by an operational mod-el, WRF, for the East China Sea and the East Sea, and the openboundary condition predicted by another data-assimilative op-erational model, ROMS, for the Yellow Sea. The atmosphericand hydrodynamic data for the boundary conditions were con-verted into the surface forcing and the open boundary forcingto simulate the down-scaled operational model, ROMS, for thecoastal waters of Korea. Then, the operational system used theprevious results simulated for 12 h before as an initial condi-tion to restart the model and forecast tides, wind-driven cur-rents, temperature, salinity, storm surge height, and wave in-formation, twice a day (06:00 and 18:00) on a 72 h basis. Thepredicted results were exported to the web-GIS system for thereal-time dissemination to the public and validation with thereal-time monitoring data using visualization technologies.
Figure 2 shows the open boundary conditions nested from

54 LIM Hak-Soo et al. Acta Oceanol. Sin., 2013, Vol. 32, No. 9, P. 50-61
Fig.2. Distributions of surface temperature (top) and salinity (bottom) of the Yellow Sea (left), western coastal waters (W-2) ofKorea (center), and down-scaled SMG (right). The figure shows that the open boundary of the down-scaled model SMG system isnested with the results derived from the western coastal model, which is already nested with the data assimilative model resultsoperated for the Yellow Sea at 13:00 on January 4, 2012 (KST).
Fig.3. Predicted results of surface salinity for the western and southern coastal waters of Korea simulated by the coastal operationalmodeling system on a 72 h basis starting at 21:00 on June 12, 2012 (KST).

LIM Hak-Soo et al. Acta Oceanol. Sin., 2013, Vol. 32, No. 9, P. 50-61 55
Fig.4. Predicted results of surface temperature for the coastal waters of main ports (Incheon, SMG, Yeosu, Masan, and Busan) ofKorea simulated by the high-resolution down-scaled operational modeling system on a 72 h basis starting at 21:00 on June 12, 2012(KST).
the data assimilative Yellow Sea ocean model with a coarsegrid to the down-scaled model SMG coastal model with a high-resolution grid for temperature and salinity. The figure showsthat the open boundary of the down-scaled model, SMG, isnested with the predicted results derived from the westerncoastal model (W-2), which is already nested from the region-al model results operated for the Yellow Sea. Figure 3 showsthe predicted results of surface salinity for the western andsouthern coastal waters of Korea operated by the coastal oper-ational oceanographic system on a 72 h basis starting at 21:00on June 12, 2012 (KST). Figure 4 shows the predicted results ofsurface temperature for the coastal waters near the main ports(Incheon, SMG, Yeosu, Masan, and Busan) of Korea simulatedby the high-resolution down-scaled operational oceanographicsystem on a 72 h basis starting at 21:00 on June 12, 2012 (KST).
The hydrodynamic model, ROMS, used in this down-scaled operational modeling system was calibrated and verifiedwith the AWAC data observed over 1 a near the water gates con-necting the coastal waters and SMG tidal lake (Lim et al., 2011).The estimation of the residual flows in the complex tidal regimeof the Kyunggi Bay estuary derived from the bottom-mountedAWAC proved the applicability of the instrument by showing thedistinguished seasonal variation of river discharge in the Seok-mo and Jangbong Channels during the monsoon season (Kimet al., 2009). To conduct the calibration and verification of eachmodel for the western and southern coastal waters of Korea,we observed the hydrodynamics of the coastal waters near thecoastal ports of Incheon, SMG, Yeosu, Masan, and Busan withthe ADCP or the AWAC from 2011 to 2013. Figure 5 shows themodel calibration with tidal elevation observed by moored tide-gage from April 26 to June 9, 2011 at Sta. DS1 deployed at thebottom of Dolsan Bridge, which is located about 2 km from theYeosu Port on the southern coast of Korea. The surface eleva-
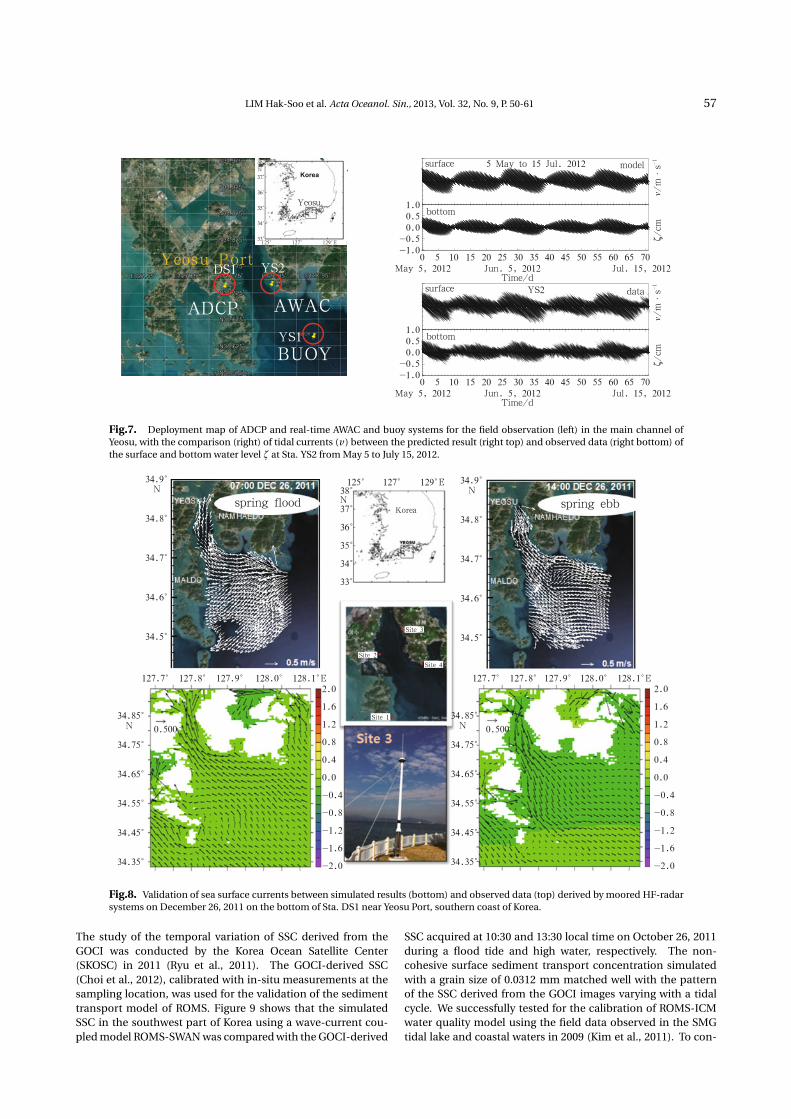
tion observed for 43 d showed a strong correlation to the sim-ulated result, with a correlation coefficient of 0.93 (Fig. 5). Fig-ure 6 shows the model verification with currents observed bymoored ADCP at Sta. DS1. The surface currents observed atthe bottom of the DS1 showed good agreement with the sim-ulated results representing strong southward currents in floodtides and northward currents in ebb tides through the DolsanChannel. The maximum flood and ebb current speeds observedthrough the channel were approximately 1.6 and 1.5 m/s, re-spectively, during spring tides. To validate the predicted results,we used the real-time monitoring data from the hydrodynam-ic measurements observed by the operational AWAC and buoy,1-h averaged surface currents measured by the HF-radar, andthe suspended sediment concentrations (SSC) obtained hourlyand derived from GOCI images. For the model validation of thecurrents, we operated the real-time observation system, suchas real-time AWAC-Prolog, remote buoy, and observatory towersystem. Figure 7 shows the model validation with currents ob-served by the real-time AWAC-prolog system (YS2) at the mainchannel of Yeosu. The predicted results on the surface and bot-tom matched well with the real-time monitored currents fromMay 5 to July 15, 2012.
For the validation of the circulation, we used the real-timesurface current data monitored by the HF-radar system. Figure8 shows the predicted surface currents simulated by the oper-ational model validated with 1 h averaged surface currents ob-served by the HF-radar System in the main channel of YeosuPort on December 26, 2011 during the spring tides. The HF-radar system is one of the real-time monitoring systems for vali-dating down-scaled coastal operational oceanographic system.The model validation will be serviced through web-GIS-basedcoastal information system. For the validation of surface sus-pended sediment, we used geostationary ocean satellite data.

56 LIM Hak-Soo et al. Acta Oceanol. Sin., 2013, Vol. 32, No. 9, P. 50-61
Fig.5. The top panel shows the location of DS1 observed by tide-gage and ADCP through Dolsan Channel near the Yeosu Port,southern coast of Korea, and the bottom panel shows the calibration of the surface elevation between the predicted result (thick redline) and observed data (dashed line) derived from bottom-mounted tide-gage at Sta. DS1 from April 26 to June 9, 2011.
Fig.6. The top panel shows the simulated surface currents in flood and ebb tides through Dolsan Channel, and the bottom panelshows the verification of surface currents between predicted results (top) and observed data (bottom) derived from moored ADCPat Sta. DS1 from April 26 to June 9, 2011.
LIM Hak-Soo et al. Acta Oceanol. Sin., 2013, Vol. 32, No. 9, P. 50-61 57
Fig.7. Deployment map of ADCP and real-time AWAC and buoy systems for the field observation (left) in the main channel ofYeosu, with the comparison (right) of tidal currents (v ) between the predicted result (right top) and observed data (right bottom) ofthe surface and bottom water level ζ at Sta. YS2 from May 5 to July 15, 2012.
Fig.8. Validation of sea surface currents between simulated results (bottom) and observed data (top) derived by moored HF-radarsystems on December 26, 2011 on the bottom of Sta. DS1 near Yeosu Port, southern coast of Korea.
The study of the temporal variation of SSC derived from theGOCI was conducted by the Korea Ocean Satellite Center(SKOSC) in 2011 (Ryu et al., 2011). The GOCI-derived SSC(Choi et al., 2012), calibrated with in-situ measurements at thesampling location, was used for the validation of the sedimenttransport model of ROMS. Figure 9 shows that the simulatedSSC in the southwest part of Korea using a wave-current cou-pled model ROMS-SWAN was compared with the GOCI-derived
SSC acquired at 10:30 and 13:30 local time on October 26, 2011during a flood tide and high water, respectively. The non-cohesive surface sediment transport concentration simulatedwith a grain size of 0.0312 mm matched well with the patternof the SSC derived from the GOCI images varying with a tidalcycle. We successfully tested for the calibration of ROMS-ICMwater quality model using the field data observed in the SMGtidal lake and coastal waters in 2009 (Kim et al., 2011). To con-

58 LIM Hak-Soo et al. Acta Oceanol. Sin., 2013, Vol. 32, No. 9, P. 50-61
duct validation of the ROMS-ICM for the SMG tidal lake withthe observed data in 2010, the existing condition of averagestate of December 2009 was set for the initial condition. Fig-ure 10 shows the comparison of the surface total phosphorus(TP) and surface total nitrogen (TN) between the water qualitymodel and the observed data obtained from a station M3 of the
SMG tidal lake in 2010. The figure shows that the computationof TP and TN was consistent with the observed data in 2010.
It is generally known that the wave-induced mixing andbottom friction simulated by the wave-current coupled mod-el are enhanced due to the wave-induced oscillatory boundaryeffect and the combined wave-current bottom stresses. The
Fig.9. Comparison of SSC generated by GOCI SS algorithm and simulated by ROMS-SWAN. The SSC distribution obtained fromGOCI images acquired at 10:30 (a) and 13:30 (b) local time on October 26, 2011 during flood tide and high water, respectively, wascompared with wave-current coupled model ROMS-SWAN at 11:00 (c) and 14:00 (d).
Fig.10. The top panel shows the locations of observed water quality data in the SMG tidal lake, and the bottom panel shows thecomparison of the surface total phosphorus (left bottom) and total nitrogen (right bottom) between simulated results (line) andfield data (dot) observed at Sta. M3 in the SMG tidal lake in 2010.

LIM Hak-Soo et al. Acta Oceanol. Sin., 2013, Vol. 32, No. 9, P. 50-61 59
wave-current interaction near the surf zone is one of the impor-tant factors for predictability of the operational model, ROMS-SWAN, especially for the prediction of the storm surge heightand the suspended sediment transport simulated in the coastalwaters of Korea. Figure 11 shows the maximum storm surgeheight and wave height for the regional domain in the upperpanel, with a comparison of the storm surge height for the west-ern coastal waters of Korea predicted by South ROMS withoutthe wave simulation and ROMS-SWAN with wave-coupled sim-ulation when typhoon KOMPASU (2010) approached the west-
ern coast of Korea at 20:00 on September 1, 2010 (KST). With-out the wave coupling, the surge heights in the coastal grid wereunderestimated compared with the results with wave couplingcondition. In the wave-coupled system, surge heights near thecoastal waters affected by the wave-current interaction were en-hanced due to combined bottom stress and the radiation stressin the momentum equation terms in the ROMS. For the vali-dation of the wave-current coupled effect on the storm surgeheight we need more analysis or comparison with available ob-served data in further studies.
Fig.11. Simulated results of maximum storm surge height (a) and maximum wave height (b) using ROMS and SWAN for theTyphoon KOMPASU (2011). A comparison of storm surge height between without wave simulation (c) and with wave-coupledsimulation (d) is shown in western coastal waters of Korea when Typhoon KOMPASU approached the western coast of Korea at20:00 on September 1, 2011 (KST).
The operating ROMS-SWAN system, as down-scaled tospatial resolution compatible with the scale of tidal channelsin the coastal area, improved the predicting performance forcoastal currents. Also, the horizontal scale of tens of metersallowed the system to couple the currents and waves. The wave-current interaction implemented by the ROMS and SWAN cou-pling was a great benefit for the investigation of tidal mod-
ulation of the wind wave height along with a tidal cycle inthe Yellow Sea. The wave-current interaction module has thecapability to resolve the bottom shear stress enhanced by acombined field of wave and current. The combined bottomshear stress is a crucial parameter controlling the sedimenttransport in the bottom boundary layer.

60 LIM Hak-Soo et al. Acta Oceanol. Sin., 2013, Vol. 32, No. 9, P. 50-61
5 Summary and conclusionsWe developed a down-scaled operational oceanographic
system for the coastal waters of Korea using the operationalmodel, ROMS. The operational modeling system consists ofatmospheric and hydrodynamic models coupled with three-dimensional hydrodynamic, wave, sediment transport, and wa-ter quality modules. This system forecasts hydrodynamic vari-ables twice a day on a 72 h basis, including sea surface elevation,currents, temperature, salinity, storm surge height, and wave in-formation for the coastal waters of Korea. The predicted resultsare exported to the web-GIS-based coastal information systemfor real-time dissemination to the public, and validation withreal-time monitoring data.
This operational coastal modeling system used the oceanmodel, ROMS, coupled with a wave model, SWAN, for the hy-drodynamics and waves, nested with a meteorological model,WRF, for the atmospheric surface forcing, and externally nest-ed with a eutrophication model, CE-QUAL-ICM, for the waterquality. The surface forcing for the model was derived from thepredicted results for the East China Sea and East Sea simulatedby the atmospheric model, WRF. The open boundary condition-s were nested with the predicted results simulated by the data-assimilative operational ocean model, ROMS, which has beenin operation for the Yellow Sea. To restart the operational sys-tem, the model used previous results simulated 12 h before asinitial conditions.
The operational model, ROMS, has been calibrated withthe observed tidal surface elevation derived from the mooredtide-gage, and the model was verified with the current data ob-served by the bottom-mounted ADCP or AWAC near the coastalwaters of Korea. To validate the operational model, we used thereal-time monitoring data derived from buoy systems, HF-radarsystems, geostationary satellite, and ocean observatory tow-ers compared with the simulated hydrodynamic results. Thesuspended sediment concentrations (SSC) retrieved by a geo-stationary ocean color imager (GOCI) from the satellite COMSwere used for the validation of the operational coastal sedimen-t transport modeling system and showed good agreement withthe predicted results.
We have shown the applicability of the down-scaled oper-ational oceanographic system for the coastal waters of Korea us-ing the operational model, ROMS. The ROMS has been adoptedfor this down-scaled operational coastal modeling system be-cause it is two-way coupled with the wave model, SWAN, andis externally nested with the water quality model, ICM, for thecoastal waters of Korea. In stormy conditions, the prediction ofstorm surge height was enhanced by the effect of wave-currentinteraction and combined radiation stress in the momentumequation terms in the ROMS. The wave-current effect on thecoastal waters must still be verified with available observed da-ta during the typhoon approach in further studies. The waterquality model, ROMS-ICM, developed by the KIOST (Kim et al,2011) has been used for the validation of water quality in the S-MG tidal lake with the observed data in 2010, in order to extendthe model for the entire coastal waters of Korea as an opera-tional water quality model.
In summary, the operating down-scaled ROMS system isan advanced system for operational oceanography that pro-vides useful information to the public and experts on a 72 h pre-diction time. This operational coastal modeling system will beused as a part of the Korea operational oceanographic system(KOOS) and will be in operation by the end of 2013.
Ac k now l e d g e m e n t sThis research was a part of the project entitled “Cooper-
ation on the Development of Basic Technologies for the Yel-low Sea and East China Sea Operational Oceanographic Sys-tem (YOOS)”, funded by the China-Korea Joint Ocean ResearchCenter. This research was also supported by the project en-titled “Development of Korea Operational Oceanographic Sys-tem (KOOS)”, funded by the Ministry of Oceans and Fisheries,Korea; and partially supported by the projects “Satellite Appli-cation Techniques for Coastal Ocean Environment Monitoringand “Development of the Marine Environmental Impact Pre-diction System Following the Disastrous Environmental Event”,funded by the Korea Institute of Ocean Science and Technology(KIOST), which is greatly appreciated.
ReferencesBell M J, Forbes R M, Hines A. 2000. Assessment of the FOAM global
data assimilation system for real-time operational ocean fore-casting. Journal of Marine System, 20: 1–22
Bell M J, Martin M J, Nichols N K. 2004. Assimilation of data into anocean model with systematic errors near the equator. QuarterlyJournal of the Royal Meteorological Society, 130: 873–893
Cerco C F, Cole T. 1993. Three-dimensional eutrophication model forChesapeake Bay. Journal of Environmental Engineering, 119(6):1006–1025
Cerco C F, Tillman D, Hagy J D. 2010. Coupling and comparing a s-patially and temporally detailed eutrophication model with anecosystem network model: an initial application to ChesapeakeBay. Environmental Modelling & Software, 25: 562–572
Choi J K, Park Y J, Ahn J H, et al. 2012. GOCI, the worldars first geosta-tionary ocean color observation satellite, for the monitoring oftemporal variability in coastal water turbidity. Journal of Geo-physical Research, 117 (C09004)
Griffies S M, Pacanowski R C, Rosati A. 2004. A technical guideto MOM4. GFDL Ocean Group Technical Report No. 5.NOAA/Geophysical Fluid Dynamics Laboratory, 371
Haidvogel D B, Arango H, Budgell W P, et al. 2008. Ocean forecasting interrain-following coordinates: formulation and skill assessmentof the regional ocean modeling system. Journal of Computa-tional Physics, 227: 3595–3624
Hurlburt H E, Brassington G B, Drillet Y, et al. 2009. High-resolutionglobal and basin-scale ocean analyses and forecasts. Oceanog-raphy, 22(3): 110–127
Kim C S, Lim H S. 2007. Safety criteria on water depth, offshore dis-tance and dredging volume in marine sand mining operation inKyunggi-Bay, Korea. Journal of Coastal Research, SI50: 507–510
Kim C S, Lim H S. 2009. Sediment dispersal and deposition due tosand mining in the coastal waters of Korea. Continental ShelfResearch, 29: 194–204
Kim C S, Lim H S, Kim J A, et al. 2009. Residual flow and its implicationto macro-tidal flats in Kyunggi Bay estuary of Korea. Journal ofCoastal Research, SI56: 976–980
Kim C S, Lim H S, Cerco C F. 2011. Three-dimensional water quali-ty modeling for tidal lake and coastal waters with ROMS-ICM.Journal of Coastal Research, SI60: 1068–1072
Kwon K M, Choi B J, Lee S H, et al. 2011 Coastal current along theeastern boundary of the Yellow Sea in summer: numerical sim-ulations. Journal of the Korean Society of Oceanography, 16(4):155–168
Lim H S, Kim J A, Kim C S, et al. 2011. SOON: the Saemangeum op-erational oceanography networks. Journal of Coastal Research,SI64: 1095–1100
Matsumoto K, Takanezawa T, Ooe M. 2000. Ocean tide models de-veloped by assimilating TOPEX/POSEIDON altimeter data intohydrodynamical model: a global model and a regional modelaround Japan. Journal of Oceanography, 55: 569–581
Mellor G L. 2003. The three-dimensional current and surface waveequations. Journal of Physical Oceanography, 33: 1978–1989
Mellor G L. 2005. Some consequences of the three-dimensional cur-rents and surface wave equations. Journal of Physical Oceanog-raphy, 35: 2291–2298

LIM Hak-Soo et al. Acta Oceanol. Sin., 2013, Vol. 32, No. 9, P. 50-61 61
Oke P R, Brassington G B, Griffin D A, et al. 2008. The Bluelink oceandata assimilation system (BODAS). Ocean Modelling, 21: 46–70
Park K S, Lee J C, Jun K C, et al. 2009. Development of an operationalstorm surge prediction system for Korean coast. Ocean and Po-lar Research, 31(4): 369–377
Ris R C, Booij N, Holthuijsen L H. 1999. A third-generation wave modelfor coastal regions: Partcò: Verification. Journal of GeophysicalResearch, 104(C4): 7667–7681
Ryu J H, Choi J K, Eom J, et al. 2011. Temporal variation in Koreancoastal waters using geostationary ocean color imager. Journalof Coastal Research, SI60: 1731–1735
Warner J C, Sherwood C R, Signell R P, et al. 2008, Developmentof a three-dimensional, regional, coupled wave, current, andsediment-transport model. Computers & Geosciences, 34:1284–1306