Embed Size (px)
Citation preview

Munich Personal RePEc Archive
Has Growth in Senegal After the 1994
Devaluation Been Pro-Poor?
Azam, Jean-Paul and Dia, Magueye and Tsimpo, Clarence
and Wodon, Quentin
World Bank
January 2007
Online at https://mpra.ub.uni-muenchen.de/11110/
MPRA Paper No. 11110, posted 16 Oct 2008 01:37 UTC

CHAPTER 3
Has Growth in Senegal After the 1994 Devaluation
Been Pro-Poor?*
By Jean-Paul Azam, Magueye Dia, Clarence Tsimpo, and Quentin Wodon
The devaluation of the CFA Franc in 1994 generated a public investment boom
in Senegal. The increase in public investment was made possible thanks to an
improved budgetary situation related to the reduction in real terms of the public
wage bill which had been too large for some time. The rise in public investment
was subsequently accompanied by a (smaller) increase in private investment due
in part to the attractiveness of Senegal as a place to do business within West
Africa, at least compared to other West African nations. In turn, higher public,
and to some extent private, investment led to higher growth rates and substan-
tial poverty reduction, with the share of the population living in poverty declin-
ing from 67.9 to 57.1 percent. Poverty in urban areas was reduced faster than in
rural areas, as most of the investment benefited the manufacturing and services
sectors. Also, a few years of poor rainfall in the second half of the 1990s coupled
with an initial drop in the real prices of crops in the aftermath of the devaluation
affected negatively rural incomes. As a result, while virtually all segments of the
population (including the rural poor) benefited from improved standards of liv-
ing in 2001 as compared to 1994, growth was not strictly speaking “pro-poor”
because the growth in consumption per equivalent adult in the upper half of the
distribution was larger than that observed among the poor.
Senegal has witnessed a fairly high level of growth over the last decade, which has led
to a substantial reduction in poverty (Siaens, Sylla, Toure, and Wodon 2005). This
paper analyzes Senegal’s growth experience, with a focus on its impact on the poor.
Beside some special features of the country by African standards (including a higher level of
45
*This paper was prepared as part of a global study on pro-poor growth managed by Louise Cord at theWorld Bank. The authors gratefully acknowledge support from AFD (Agence Française de Développe-ment), as well as comments from Jacques Morisset. The views expressed here are those of the authors andneed not reflect those of the World Bank, its Executive Directors or the countries they represent.

urbanization and a lower share of agriculture in GDP), Senegal’s economic features reflect
largely those of the other countries belonging to the West African Economic and Monetary
Union (UEMOA in French). The major macroeconomic event that took place in the
UEMOA countries was the 1994 devaluation of the CFA Franc, their common currency
unit. In many respects, this event draws a clear dividing line between a “before” and an
“after” for the affected countries, two periods characterized by a very different macro-
economic adjustment strategy. Nationally representative household survey data available
for 1994/95 and 2001 enable us to assess whether the growth performance observed after
the devaluation has been pro-poor or not.
Senegal’s economy shares some of the features of the Sahelian countries, like its agri-
culture dominated by groundnut exports, and frequent droughts. However, its coastal
position gives it a definite advantage for industrial development. It is the closest Sub-
Saharan African economy to the main European markets by sea. This has also given rise to
a long tradition of out-migration, with a resulting large inflow of remittances (Manchuelle
1997). Hence, many non agricultural sources of income have allowed this country to be
one of the most urbanized one in Africa, with almost 50 percent of its population living in
the urban sector. Its capital city, Dakar, was the capital city of the French AOF (Afrique
Occidentale Française) in the colonial days, and still plays a prominent role in the
UEMOA. It hosts in particular the headquarters of the BCEAO (Central Bank of West
African States).
Being a medium-sized country by the standards of West Africa, Senegal reflects the evo-
lutions of the UEMOA economies, as far as its macroeconomic experience is concerned,
without affecting them much in return. At the same time, its relatively high level of indus-
trial development and of urbanization give this country some relevant idiosyncratic features.
In particular, in contrast to many neighboring countries, agriculture plays here a secondary
role in determining growth, while manufacturing and services are playing a central part.
Another characteristic of Senegal is the fact that it is the most democratic country of
the region, with competitive elections taking place on schedule with very limited vio-
lence (Ka and Van de Walle 1994; Azam, Dia, and N’Guessan 2002). The first two pres-
idents after independence, Leopold Senghor and Abdou Diouf were members of the socialist
party. However, the latter was a more technocratic “modernizer” than the poet-president
Senghor, whose development strategy was more focused on cementing national unity than
on the development of an efficient economy. Until 1993, the ballot was not really secret,
and a lot of social pressure were exerted on the voters, especially in the groundnut basin
(Schaffer 1998). There, the Mouride brotherhood was controlling the votes, and benefited
from a long-lasting relationship with the government (Boone 2003). The re-introduction
of the secret ballot in 1993 improved the working of the democratic institutions. The last
presidential elections saw the replacement of the socialist Abdou Diouf by the liberal
Abdoulaye Wade, who took over in April 2000.
The only serious stain on the democratic reputation of the Senegalese government since
independence has been the problem of lower Casamance (Boone 2003). This region is pre-
dominantly peopled by an ethnic minority, the Diola, whose social system is very different
from the hierarchical Sahelian social organization characteristic of the other ethnic groups.
The latter is based on a typical caste system, with a well-defined ruling elite. The numeri-
cally dominant Wolof group is already marginally different from the typical Sahelian type.
Their religious leaders have overthrown the traditional aristocracy in the course of the
46 World Bank Working Paper
18th century, giving rise to the current domination by the Sufi brotherhoods. Yet the Diola,
like the smaller groups also present in the area, are radically different. They have no tradi-
tional hierarchy, and are resisting any type of authority. The Muslim brotherhoods, which
play a crucial role in the political control of the rest of the country, are powerless in this
region. There is thus no basis on which the typical African system of political management,
relying on the co-optation of the traditional elite into the government-sponsored system,
can be grafted onto such an ethnic group (Boone 2003). The attempts made by the differ-
ent governments in Dakar to control administratively this area, with an increasing military
presence, ended up in a low-intensity civil war. Many civilians were killed by both sides in
the 1980s and 1990s. Hence, this potentially rich region, fit for export agriculture as well as
for tourism and fishery, has remained relatively under-developed. A peace agreement has
however been signed in March 2001, but lower Casamance is the region of Senegal with the
highest incidence of poverty (République du Sénégal 2004).
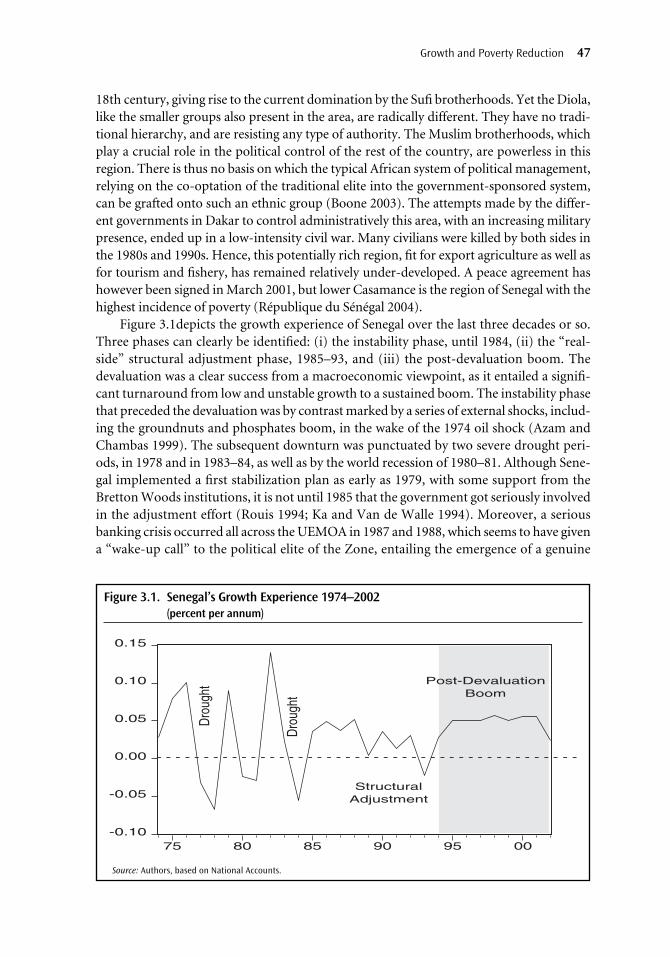
Figure 3.1depicts the growth experience of Senegal over the last three decades or so.
Three phases can clearly be identified: (i) the instability phase, until 1984, (ii) the “real-
side” structural adjustment phase, 1985–93, and (iii) the post-devaluation boom. The
devaluation was a clear success from a macroeconomic viewpoint, as it entailed a signifi-
cant turnaround from low and unstable growth to a sustained boom. The instability phase
that preceded the devaluation was by contrast marked by a series of external shocks, includ-
ing the groundnuts and phosphates boom, in the wake of the 1974 oil shock (Azam and
Chambas 1999). The subsequent downturn was punctuated by two severe drought peri-
ods, in 1978 and in 1983–84, as well as by the world recession of 1980–81. Although Sene-
gal implemented a first stabilization plan as early as 1979, with some support from the
Bretton Woods institutions, it is not until 1985 that the government got seriously involved
in the adjustment effort (Rouis 1994; Ka and Van de Walle 1994). Moreover, a serious
banking crisis occurred all across the UEMOA in 1987 and 1988, which seems to have given
a “wake-up call” to the political elite of the Zone, entailing the emergence of a genuine
Growth and Poverty Reduction 47
-0.10
-0.05
0.00
0.05
0.10
0.15
75 80 85 90 95 00
Post-Devaluation
Boom
- - - - - - - - - - - - - - - - - - - - - - - - - - - - - - - - - - - - - - - - - - - - -
Dro
ught
Dro
ught
Structural
Adjustment
Source: Authors, based on National Accounts.
Figure 3.1. Senegal’s Growth Experience 1974–2002(percent per annum)
“ownership of reforms” in some of these countries (Azam, Biais, and Dia 2004). As a result,
structural adjustment really got started in Senegal in the late 1980s, and included among
other reforms the privatization of several parastatals (Azam, Dia, and N’Guessan 2002).
In most countries of the CFA Zone, before the 1994 devaluation, the main problem of the
“real-side” adjustment policy (i.e. without changing the exchange rate) was the inability of the
governments to cut significantly their wage bills. The wages and salaries of the civil servants
and the public sector employees have been cut only in some countries, during that period, and
only by a marginal percentage. The high level of these wages was correctly perceived as the
main adjustment problem by many analysts (for example, van de Walle 1991; Azam 1995;
Rama 2000). This problem had two important dimensions. One was that the government
wage bill was then consuming an excessive share of fiscal resources, while these wages were
also exerting a strong influence on those of the formal sector. For example, the wage rates in
the civil service and the public sector may play a leading role in the determination of the cost
of labor for the whole formal sector, thus affecting significantly its competitiveness.
Unfortunately, while reforms were seriously starting in some of the countries of the
Zone, the terms of trade of the most important CFA economies deteriorated markedly, and
for several years from 1987 onward (Azam 1997). In particular, the terms of trade of Côte
d’Ivoire deteriorated severely, with a depressing influence on the whole UEMOA area (then
UMOA). The early 1990s thus witnessed a relatively disappointing growth experience, which
ended up in a serious recession in 1993, affecting more or less the whole UEMOA zone.
Together with some uninspired policy decisions, which are spelt out in Azam (1997), this
made the 1994 devaluation unavoidable. The latter had been postponed for a long period,
and was largely anticipated by the relevant agents in the area.
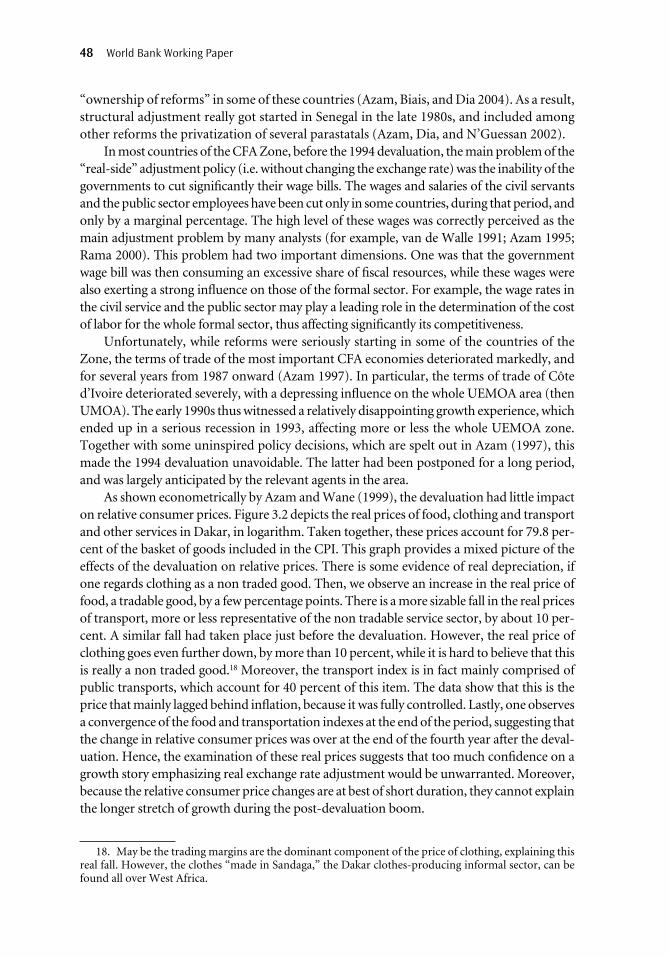
As shown econometrically by Azam and Wane (1999), the devaluation had little impact
on relative consumer prices. Figure 3.2 depicts the real prices of food, clothing and transport
and other services in Dakar, in logarithm. Taken together, these prices account for 79.8 per-
cent of the basket of goods included in the CPI. This graph provides a mixed picture of the
effects of the devaluation on relative prices. There is some evidence of real depreciation, if
one regards clothing as a non traded good. Then, we observe an increase in the real price of
food, a tradable good, by a few percentage points. There is a more sizable fall in the real prices
of transport, more or less representative of the non tradable service sector, by about 10 per-
cent. A similar fall had taken place just before the devaluation. However, the real price of
clothing goes even further down, by more than 10 percent, while it is hard to believe that this
is really a non traded good.18 Moreover, the transport index is in fact mainly comprised of
public transports, which account for 40 percent of this item. The data show that this is the
price that mainly lagged behind inflation, because it was fully controlled. Lastly, one observes
a convergence of the food and transportation indexes at the end of the period, suggesting that
the change in relative consumer prices was over at the end of the fourth year after the deval-
uation. Hence, the examination of these real prices suggests that too much confidence on a
growth story emphasizing real exchange rate adjustment would be unwarranted. Moreover,
because the relative consumer price changes are at best of short duration, they cannot explain
the longer stretch of growth during the post-devaluation boom.
48 World Bank Working Paper
18. May be the trading margins are the dominant component of the price of clothing, explaining thisreal fall. However, the clothes “made in Sandaga,” the Dakar clothes-producing informal sector, can befound all over West Africa.

Much more significant is the change in real wages and salaries in the formal sector. The
main effect of the devaluation was indeed a highly significant cut in the real wage rates in the
formal sector. The formal-sector wage cut may have led to a deterioration in the poverty sit-
uation of urban areas (Azam 2004; Azam, Dia, Tsimpo, and Wodon 2005), as has been the
case in Côte d’Ivoire and Niger. However, the survey data for Senegal used in this paper do
not allow a thorough analysis of the dynamics of poverty before and after the devaluation at
the national level, because the two high-quality surveys available were both implemented
after the devaluation, in 1994/95 (ESAM 1) and in 2001 (ESAM 2).
Still, we can analyze the impact on poverty of the growth spur that took place after the
devaluation, and analyze whether this post-devaluation boom was pro-poor or not. As
shown in Figure 3.1, the post-devaluation boom was remarkably long lasting. In particular,
together with Benin, another democratic regime among the UEMOA countries, Senegal did
not experience the recession of the year 2000 that plagued the economies of the zone.
In the next section, we provide general background on Senegal’s growth experience
after the devaluation, suggesting that a public investment boom, made possible by the
improved budgetary situation entailed by the devaluation, played a crucial part in boost-
ing growth and keeping it going after 1997. It is only after this additional and lasting
impulse was given by the government that private investment picked up (in absolute
terms rather than as a share of GDP), turning the post-devaluation boom into a lasting
growth episode. Hence, the expected competitive effect of the devaluation did not mate-
rialize entirely, as export agriculture did not respond as expected, and its share in GDP
shrunk. In the meantime, its fiscal effect played the central part, through the fall in the
real value of the government wage bill (nominal wages were not adjusted to reflect the
reduction in the value of public servants’ pay after the devaluation), which in turn freed
the resources that financed the increased public investment. In other words, the devalua-
Growth and Poverty Reduction 49
-0.3
-0.2
-0.1
0.0
0.1
0.2
90 91 92 93 94 95 96 97
Food
Clothing
Transport
Transport
Food
Clothing
Source: Azam and Wane (1999).
Figure 3.2. Real Consumer Prices

tion of the CFA Franc in 1994 generated a public investment boom, and this rise in public
investment was subsequently accompanied by an increase in private investment (in
absolute terms, rather than a share of GDP) due in part to the attractiveness of Senegal as
a place to do business within West Africa.
In turn, higher public, and to some extent private, investment led to higher growth
rates and substantial poverty reduction, with the share of the population living in poverty
declining from 67.9 percent to 57.1 percent. However, as shown in the second section,
poverty in urban areas was reduced faster than in rural areas, as most of the investment
benefited the manufacturing and services sectors. Also, a few years of poor rainfall in the
second half of the 1990s coupled with an initial drop in the real prices of crops in the after-
math of the devaluation probably affected negatively rural incomes. As a result, while vir-
tually all segments of the population (including the rural poor) benefited from improved
standards of living in 2001 as compared to 1994, growth was not strictly speaking “pro-
poor” because the growth in consumption per equivalent adult in the upper half of the dis-
tribution was larger than that observed among the poor. This was observed at the national
level as well as within urban areas.
Patterns of Growth in Senegal After the Devaluation
This section aims at identifying the main determinants of the overall growth observed in
Senegal after the devaluation, and the resulting fall in poverty between 1994 and 2001. The
analysis starts with a simple sectoral decomposition of GDP growth, which brings out some
significant structural change. Berthélemy and others (1996) have shown that the change in
the allocation of labor among the different production sectors was the key determinant of
aggregate growth in Senegal. The following analysis provides some support to this view.
Production Sector Effects
As will be discussed in the next section, a particularly good performance towards poverty
reduction has been observed in urban areas after the devaluation. In rural areas by con-
trast, poverty reduction has been reduced to a lower extent, in part because of a fairly irreg-
ular growth path of the agricultural and livestock sector. The latter experienced a serious
depression in 1997 and 1998, followed by a brisk recovery in 2000 and 2001.
Figure 3.3 shows a decomposition of GDP (at constant 1987 prices, in log) over the
1991–2001 decade. It shows that the tertiary sector, which comprises mainly transporta-
tion, commerce and other services, experienced a pretty fast growth since the devaluation.
In real terms, several of its component sectors experienced some very fast growth episodes
during this period, like transportation for example, which grew by 8.1 percent per annum
on average over 1997–2001. This tertiary sector claims more than half of total GDP in this
country (nearly 60 percent in fact). It includes also the telecommunication sector, which
was profoundly reformed during that period in Senegal, and grew quite fast subsequently
(Azam, Dia, and N’Guessan 2002).
Similarly, the secondary sector experienced a fast growth of output after the devalua-
tion. The chart shows that this sector, which comprises mainly industry and construction
and public works (in addition to the relatively negligible mining and oil milling sectors),
50 World Bank Working Paper

benefited markedly from the devaluation. It experienced two years of negative growth in
1993 and 1994, during and just after the recession that affected the whole UEMOA area,
and recovered briskly after that. In fact, its growth was uninterrupted until 2001.
By contrast, the primary sector, mainly agriculture and livestock, experienced a slower
growth, and its relative share went down. Its growth rate was negative in 1997 and 1998
(−10.6 percent and −7.4 percent, respectively), while it had a very fast recovery in 2000 and
2001, with two digit growth rates (21.3 percent and 13.8 percent, respectively). These wide
fluctuations are largely due to the vagaries of the Sahelian climate, while price effects do
not seem to have been very significant determinants of the supply response. This comes
out pretty clearly from the following two charts.
Figure 3.4 represents the level of rainfall on three of the main production areas of the
groundnut basin. This chart shows clearly that 1992–93 and 1997–98 were pretty dry years,
while 2000–01 were exceptionally good years. By contrast, Figure 3.5 shows that producer
prices were recovering from the real shock induced by the devaluation during the period
1997–98. This confirms the well-known result in agricultural economics that price effects
on agricultural productions are drawn out, while climatic shocks have immediate effects.
On the other hand, the income effects of these real price changes are felt immediately by the
farmers.19 Figure 3.5 also shows that the real price of millet, which is not exported on the
Growth and Poverty Reduction 51
5.5
6.0
6.5
7.0
7.5
91 92 93 94 95 96 97 98 99 00 01
Tertiary
Secondary
Primary
Source: Authors, based on National Accounts.
Figure 3.3. GDP per Sector(1987 Constant CFA Francs)
19. It is likely that the fall in the real prices of the crops that occurred in 1994 resulted in an increasein poverty in rural areas, and an analysis of the household survey data for 1991 and 1994/95 suggestsso. However, the poor quality of the 1991 household survey makes it difficult to have full confidencein the results.

52 World Bank Working Paper
0
200
400
600
800
1000
91 92 93 94 95 96 97 98 99 00 01
Louga
Sine Saloum
Diourbel
Source: Authors, based on rainfall data.
Figure 3.4. Rainfall on the Groundnut Basin(millimeters during the rainy season [May-October] preceding the crop year shown)
international market, except by cross-border trade, fell in 1993, reflecting the recession
observed that year for the whole UEMOA. The fall in the real price of the two export crops
at the time of the devaluation suggests that the pass-through rate was pretty low, so that the
marketing sector benefited most from this policy move, rather than the farmers. In other
words, the tertiary sector benefited from an implicit subsidy from the farmers, in the wake
of the devaluation. This probably explains to some extent the fast growth of the tertiary sec-
tor observed above (see Figure 3.3). Then, real producer prices picked up somewhat, but
hardly recovered their pre-devaluation levels. It is only during the drought years that the
real price of groundnut went above its pre-1994 level.
To conclude, two factors would suggest that the pace in the reduction in poverty in the
rural sector is likely to have been lower than in urban areas after the devaluation. First,
the growth rate in the agriculture and livestock sector was lower than in the secondary and
tertiary sectors, in part due to bad weather in selected years in the second half of the 1990s.
Second, farmers suffered from a drop in real value for their crops after the devaluation.
However, the difficulties in rural areas in the few years after of the devaluation did not prevent
the country as a whole to experience a high level of growth. It is among others likely that there
was a demand-driven migration into the urban areas, where industry and services were thriv-
ing, and this could have helped to reduce rural poverty as well. The drought that took place at
the end of the century, which revived certainly the memories of the 1970s and 1980s, also
provided some incentive for labor to migrate to the more progressive sectors.
These insights are consistent with those of Berthélemy and others (1996) showing that
over the period 1961–90, the increase in total factor productivity, which can be estimated
using an aggregate production function, is in fact entirely due to the reallocation of labor
from the low productivity primary sector to the higher productivity secondary and tertiary
sectors. Poverty thus probably fell in the rural sector because the least productive farmers

migrated to the cities, where they found higher productivity jobs. Hence, in the case of Sene-
gal, it seems that the rural sector can be viewed as a fairly stagnant reserve of labor, some-
how in the spirit of the seminal Lewis model (Lewis 1954). The difference with the latter is
that such a diagnosis is true despite the fact that the primary sector is not just a “subsistence
sector”, but is also exporting a large share of its output. Azam (1993) presents an extension
of the Lewis model, motivated by an analysis of Côte d’Ivoire, which brings out the impor-
tance for growth of the taxation of the high wages, assumed to accrue to skilled labor, and
the productive use of the resulting tax proceeds by the government. The analysis in the next
section suggests that the experience of Senegal provides some support to this view, inter-
preting the outcome of the devaluation as a massive increase in the taxation of the high
wages, which was used to boost public investment, with some spillover effects on private
investments and a gain in overall growth.
The Investment Boom
Figure 3.6 shows that the post-devaluation recovery was boosted by a major effort con-
cerning public investment. As a percentage of GDP, it went up from an average share of
4.6 percent of GDP in 1991–93 to an average share of 6.8 percent of GDP over 1996–2001.
The resumption of private investment is also quite remarkable, although its time profile is
less smooth. It increased from below 10 percent of GDP in 1991–93, to above 10 percent
in 1996–2001. It is highly probable that the former played a part in creating the appropri-
ate climate for the latter. The time profile of the private investment share suggests that the
devaluation took some time before it elicited a positive response from private investors.
This is clearly one of the predictions of the theoretical framework sketched in Azam
Growth and Poverty Reduction 53
0.6
0.8
1.0
1.2
1.4
1.6
1.8
2.0
91 92 93 94 95 96 97 98 99 00 01
Cotton
Groundnut
Millet
Source: Authors.
Figure 3.5. Real Producer Prices

(2004). Private saving declines in the wake of the devaluation, and because of the low level
of intermediation, this affects private investment simultaneously.
However, other mechanisms have also probably been at work. The pre-devaluation
slow growth and recession had probably left quite a lot of productive capacity idle, so that
firms had to cut significantly in the latter before the creation of new capital stock became a
priority. Moreover, the private sector was also waiting for more information to come about
the effects of the devaluation, and about the true intentions of the government regarding
the management of the post-devaluation boom. The option value of waiting was then prob-
ably enhanced by the unprecedented violence taking place in lower Casamance in 1995. This
is epitomized by the disappearance of four French tourists between Ziguinchor and Cap
Skirring, widely interpreted as a kidnapping by the Casamance rebellion. The military
response to this event triggered a lot of violence all over Casamance, with both civilian and
military casualties, followed by a relatively calm period until June 1997.
It seems quite likely that the significant increase in public investment, which occurred
from 1996 onward, was the main driver of growth, but it also triggered a private investment
recovery. In a financially open economy like Senegal, with a fixed exchange rate, there is no
crowding-out effect to be feared, while the demand-boosting and productivity-enhancing
effects of public investments are dominant. This central role of public investment, marking
the end of a period of falling private investment, does not mean that the devaluation had no
useful effect. It means instead that the positive impact took a more roundabout channel than
usually expected.
The improved situation of the government budget, and in particular the fall in the real
wages of the civil servants and other government employees, triggered by the devaluation,
freed some fiscal resources that the government was able to use for investing. This is the main
cause of the investment boom described above. The real wage effect was reinforced by a slight
fall in the number of civil servants, which fell from 66,696 in 1994 to 65,259 in 2001, so that
54 World Bank Working Paper
4
6
8
10
12
91 92 93 94 95 96 97 98 99 00 01
Public
Private
Source: Authors, based on National Accounts.
Figure 3.6. Private and Public Investment(percent of GDP)

the civil service wage bill fell from 7.4 percent of GDP in 1994 to 5.2 percent in 2001. How-
ever, other policy measures have been adopted by the Senegalese government to create an
investor-friendly environment. In particular, the tax burden on firms is lighter than elsewhere
in comparable countries.
Although it had a self-proclaimed socialist government ever since independence, until
the March 2000 election, Senegal has adopted an investor-friendly policy during the course
of the reform period, particularly from the end of the 1980s onward. A wave of privatiza-
tion took place, mainly in the utilities sector, and sent a good signal to investors (Azam,
Dia, and N’Guessan 2002). The main incentive comes from the fiscal burden, which is low
by African standards. Table 3.1 represents the scores given to various countries in the
UEMOA and its neighborhood by the experts of the Heritage Foundation. This is a com-
posite index that takes into account the highest rate of income tax, as well as the average
one, and the most relevant marginal income tax rate for the average tax payer. Addition-
ally, as a check on the credibility of these tax rates, the share of public expenditures in GDP
is also taken into account.
Table 3.1 shows that in general, the UEMOA countries have a slightly more favorable
score than the comparison countries, which are taken both from North Africa and from
non-UEMOA West Africa. Out of these 15 countries, Senegal has by far the best perfor-
Growth and Poverty Reduction 55
UEMOA Members Fiscal Burden Score Other African Countries Fiscal Burden Score
Senegal 2.5 Gambia 3
Mali 3 Ghana 3.5
Niger 3 Guinea 3
Togo 3 Nigeria 3.5
Benin 3.5 Algeria 3.5
Burkina Faso 3.5 Morocco 4
Côte d’Ivoire 3.5 Tunisia 4
Guinea-Bissau 4
Maximum Corporate Maximum Corporate
UEMOA Members Tax Rate (%) Other African Countries Tax Rate (%)
Senegal 35 Gambia 35
Mali 35 Ghana 32.5
Niger 42.5 Guinea 35
Togo 40 Nigeria 30
Benin 35 Algeria 30
Burkina Faso 35 Morocco 35 (39.6 for banks and insurance)
Côte d’Ivoire 35 Tunisia 35
Guinea-Bissau 35 (50 for oil)
Table 3.1. Fiscal Burden Scores and Maximum Corporate Tax Rate, 2003
Note: The fiscal burden index is coded from 1 (low taxation of profits and incomes) to 5 (high taxation).Source: Heritage Foundation (http://www.heritage.org/research/features/index/), with tax dataoriginally from Ernst & Young 2002 Worldwide Corporate Tax Guide.

mance, even among the UEMOA countries. Hence, the boosting effect of the public invest-
ment boom described above was supported by a highly favorable tax framework. As a result
of the investor-friendly climate that the Senegalese government has created over the last
few years of the century, its rating has improved significantly. Since 2001, Senegal is rated
B+ by Standard & Poors, a score that only South Africa and Botswana are also getting in
Sub-Saharan Africa.
Table 3.1 also shows the maximum corporate tax rate among the same group of coun-
tries. Most of them have a maximum rate of 35 percent, with the exception of Niger and
Togo, within the UEMOA, which have a slightly higher rate, and the oil producing Algeria
and Nigeria, which have a lower rate aimed at compensating for the “Dutch Disease”
effect due to oil exports, as well as Ghana. The latter is also a coastal country with a poten-
tial comparative advantage in non traditional exports, like Senegal, which pursues quite
an aggressive policy aimed at attracting foreign investors.
A further relevant piece of information regarding the investment incentive structure is
provided by Figure 3.7. It shows the ratio of public debt to GDP, which is a major indicator
of macroeconomic stability in the CFA Zone (Azam, 1997). This ratio can be viewed by
investors as a threat of future tax increases, according to the mechanisms described in Cohen
(1993) and Eaton (1993). The intuition for this effect is that a high public debt ratio now
may be regarded by potential investors as entailing a future increase in taxation, for finan-
cing the corresponding debt service. This chart clearly shows that the Senegalese government
made a sustained effort for reducing that threat, the so-called “debt overhang” effect, as the
ratio fell from 86.2 in 1994 to 65.8 in 2001. A major dent in this series shows up in 1998,
when Senegal reached a Paris Club agreement worth about CFAF 23 billion. Moreover,
56 World Bank Working Paper
65
70
75
80
85
90
94 95 96 97 98 99 00 01
Source: Authors, based on World Bank and IMF data.
Figure 3.7. Public Debt to GDP Ratio(percent)

Senegal will benefit from some debt reduction within the HIPC initiative, as decided in June
2000. The latter will be effective only outside the period under analysis, but has probably a
positive effect on expectations. All these developments are taking place against a background
of sustained reduction of the debt-to-GDP ratio.
Senegal thus comes out as a particularly attractive investment destination among the
countries from North and West Africa. It does not seem that the few breaches of privatiza-
tion contracts have much damaged this country’s good reputation. An example is provided
by the re-negotiation of the licenses for the mobile telephone operators Alizée and Sentel
(see Azam, Dia, and N’Guessan 2002), which ended up in a surcharge being imposed on
them. Its attractiveness is also supported unwittingly by Côte d’Ivoire, whose political insta-
bility (the 1999 coup d’état, the 2000 uprising, and the civil war as of 2002) has destroyed
its own attractiveness. In many ways, Senegal is left as the unique investment opportunity
among Francophone countries.
It is also important to note that the sustained growth of the post-devaluation boom
was not hampered by a shortage of human capital. Berthélemy and others (1996) have a
fairly negative diagnosis about the education policy pursued by Senegal between indepen-
dence and the early 1990s. Yet, they acknowledge that the enrollment rate has increased
massively. Between 1960 and 1990, it went from 22 percent to 57 percent in 1990, as far as
primary education is concerned, from 2 percent to 16 percent, in secondary education.
They estimate, however, that the quality of education is poor and deteriorating, and not
fitted for sustaining economic development. They criticize in particular the Senegalese edu-
cation policy for putting too much emphasis on classical education. By contrast, Diagne and
others (2002) estimate that human capital was not a brake on the resumption of growth
after the devaluation. They find a positive and nearly significant impact of enrolment in
primary education on growth, with a nine-year lag. This effort has not been reduced dur-
ing the post-devaluation boom, and the gross rate of enrolment went from 54.3 percent in
1993 to 69 percent in 2000 (Loum 2001).
Poverty Reduction Between 1994 and 2001
The discussion of the previous section suggests that poverty reduction is likely to have been
larger in Senegal’s urban areas after the devaluation. This section tests this hypothesis by
providing measures of poverty for Senegal for the survey years 1994/95 and 2001. The over-
all poverty measures and the measurement methodology follow the work by Siaens and
others. (2005), which was used in a recent report prepared jointly by the Republic of Sene-
gal and the World Bank (2005). In addition, we provide poverty measures for various
groups of households. Then, in the second subsection below, we analyze whether Senegal’s
growth experience has been pro-poor. Not surprisingly, we find that growth was not
strictly speaking pro-poor, even though the poor did benefit a lot from growth. Finally, we
briefly comment on the perceptions of poverty of the population, again drawing on work
by Siaens and others (2005).
Poverty Trend
We restrict here our attention to the family of decomposable poverty measures, which allow
the partitioning of the population according to various criteria, while providing a consistent
Growth and Poverty Reduction 57

set of poverty measures for each group in such partitions. This approach provides some
deeper insights into the changes in poverty, by bringing out the change in poverty occurring
within some selected groups, deemed relevant because of the criteria used for partitioning
(socio-economic categories, gender, and so forth).
Two main classes of decomposable poverty measures have emerged from the litera-
ture. The most widely used is the so-called FGT measure, due to Foster and others (1984).
Denote by yi the consumption level per equivalent adult of household i, and assume that
the individuals are ordered by increasing income, and denote by z the poverty line. House-
hold i’s consumption gap may be defined as the percentage shortfall of consumption level
below the poverty line: Gi = (z − yi)/z. More generally, the FGT measures are given by:
where n is the size of the population, q the index identifying the individual whose con-
sumption level lies just on the poverty line, and α is a parameter capturing the analyst’s
concern for the depth of poverty. If α = 0 is chosen, then this index is just the head-count
index H = q / n. If α = 1 is chosen instead, the poverty measure that we get is the product
of the head-count index by the average consumption gap among the poor H–G , where
. This index thus takes into account not only the incidence of poverty, but its
average depth also. More emphasis can be put on the depth of poverty by weighing each
individual’s consumption shortfall by itself, that is, by choosing α = 2. These three mea-
sures are computed for Senegal in Table 3.3 for 1994 and 2001, and are respectively pre-
sented under the headings FGT0 (head-count), FGT1 (consumption gap) and FGT2
(distribution sensitive).
Another decomposable poverty measure has been re-discovered recently, originally
created by Watts (1968). This Watts measure is:
By using a Taylor expansion of logci about z, up to the third order, one can show that
W ≅ FGT1 + (1/2)FGT2 + (1/6)FGT3, suggesting that the Watts measure is in fact highly
sensitive to the distribution of income among the poor.
Table 3.2 presents the results of the computations of these different poverty measures
for Senegal in 1994 and in 2001. As mentioned earlier, the poverty lines used are the “offi-
cial” ones computed for the Direction de la Prévision et de la Statistique and the World Bank
by Siaens and others (2005). They are defined according to the “cost of basic needs”
approach (using a fixed basket of goods, the same one in 1994 and 2001). Three different
poverty lines have been defined in order to take account of the differential cost of living in
Dakar, the other urban areas, and the rural sector, respectively. In all the decompositions
presented in Table 3.3, each household’s consumption shortfall has been computed using
the relevant poverty line, depending on the household’s location.
Table 3.3 shows that the growth observed after the devaluation had a dramatic impact
towards the reduction of poverty. At the national level, the head-count index decreased
from 67.8 percent in 1994/95 to 57.1 percent in 2001, which represents a reduction in the
Wn
z
ci
q
i
=
=
∑12
1
log ( ).
G G qii
q
==∑ 1
/
Pn
z y
z
i
i
q
α
α
=
−
=
∑11
1
( ),
58 World Bank Working Paper

proportion of the population in poverty of 10.8 percentage points (the share of households
in poverty decreased similarly, from 61.4 percent to 48.5 percent.) The estimates suggest
that poverty measures are much higher in rural areas than in urban areas as expected, and
lower in Dakar than in other urban areas. Importantly, poverty decreased more in urban
areas than in rural areas, as expected given the discussion in the previous section. The trend
for the poverty gap, the squared poverty gap, and the Watts measures are similar to those
observed for the head count. Inequality has apparently increased slightly, not only at the
national level (again as expected given the more rapid growth in urban centres), but also
within urban and rural areas.
In Table 3.3, several partitions of the population are presented, defining the relevant
groups according to their sector of activity, their socioeconomic category (type of occu-
pation), location, gender of the household head, and literacy level. It is remarkable, but
not surprising given the overall high level of growth in the country, that poverty has fallen
in all the groupings so defined over this period. In most cases, the fall in poverty is large,
but there are exceptions. First, the reduction in poverty observed for Government
employees has been lower than for other groups, probably because Government employ-
ees suffered the most from the devaluation (while immediately after the devaluation, cor-
responding to the period of the first survey in 1994/95, these employees may have been
able to maintain high levels of consumption thanks to savings, this ability to cope with
Growth and Poverty Reduction 59
1994/95
Dakar Urban Rural National
Sample size (number of households) 1,098 865 1,313 3,276
Mean consumption per person 1,177.3 697.4 387.4 632.4
Mean consumption per equivalent adult 1,416.2 857.3 495.7 781.3
Head-count index 56.4% 70.7% 70.9% 67.8%
Poverty gap 17.7% 24.4% 25.3% 23.5%
Squared poverty gap 7.4% 10.8% 11.7% 10.6%
Watts poverty index 23.5% 33.0% 35.1% 32.3%
Gini index of inequality 0.3663 0.3403 0.2934 0.3258
2001
Dakar Urban Rural National
Sample size (number of households) 1,977 1,397 3,191 6,565
Mean consumption per person 1,334.0 778.2 391.1 710.3
Mean consumption per equivalent adult 1,638.8 1,034.4 538.9 919.8
Head-count index 42.0% 50.1% 65.2% 57.1%
Poverty gap 12.0% 16.1% 21.4% 18.3%
Squared poverty gap 4.7% 6.9% 9.4% 7.9%
Watts poverty index 15.6% 21.7% 29.0% 24.6%
Gini index of inequality 0.3728 0.3523 0.3011 0.3417
Table 3.2. Mean Consumption, Poverty, and Inequality Measures, Senegal 1994/95 and 2001
Source: Authors’ estimation, following methodology in Siaens and others (2005).

the loss in real wages must have faded overtime, leading to higher poverty in this group
for a while before it started to benefit as did other groups from the growth observed after
the devaluation). The reduction in poverty among households self-employed in farming
activities was also limited, probably for the reasons mentioned above, including the
impact of poor weather in selected years, the fact that growth was somewhat lower in agri-
culture than in other sectors, and the fact that it took some time for nominal crop prices
to adjust to the devaluation.
Table 3.4 provides decompositions of the changes in poverty due to growth in con-
sumption per equivalent adult and changes in inequality (see Datt and Ravallion 1992 on
60 World Bank Working Paper
WATTS FGT 0 FGT 1 FGT 2
1994 2001 1994 2001 1994 2001 1994 2001
Sectir of activity
Government 12.16 8.31 31.30 28.09 9.49 6.82 3.69 2.14
Parastatal or Private Company 33.27 16.99 70.48 43.45 24.34 12.80 10.92 5.24
Self-employee or Family Helper 51.04 26.94 88.18 61.53 36.23 19.94 18.03 8.68
Others 34.23 24.20 68.18 55.96 24.42 18.14 11.48 7.72
Unknown 26.51 23.12 64.80 51.43 20.05 17.68 8.23 7.30
Socio-economic category
Self-employed Non-Farming 29.51 24.31 69.29 56.22 22.26 18.19 9.35 7.74
Self-employed Farming 36.94 30.31 73.98 69.03 26.62 22.48 12.34 9.76
Management 5.71 5.19 21.06 19.24 4.78 4.27 1.39 1.31
Intermediary Professions 10.38 6.91 32.76 19.10 8.37 5.12 2.87 2.22
Workers 36.24 23.77 74.90 56.91 26.61 17.61 12.05 7.58
Employees 9.07 7.57 27.48 23.00 7.40 6.16 2.44 2.05
Others 34.10 23.65 68.73 54.67 24.38 17.58 11.39 7.58
Region
Dakar 23.50 15.65 56.39 41.98 17.74 12.04 7.44 4.72
Others Cities 33.01 21.71 70.71 50.09 24.40 16.10 10.79 6.92
All Urban Areas 27.88 18.44 62.98 45.72 20.81 13.91 8.98 5.74
Rural 35.12 28.95 70.94 65.16 25.27 21.44 11.69 9.36
Gender
Male HH 32.89 26.02 68.70 59.54 23.94 19.36 10.84 8.34
Female HH 28.98 17.40 63.04 44.79 21.26 13.07 9.49 5.39
Literacy
Literate 25.12 20.05 58.41 48.68 18.91 15.07 7.96 6.29
Non-Literate 36.75 27.38 73.40 62.27 26.41 20.31 12.29 8.81
Unknown 19.33 23.17 61.58 47.41 14.49 17.77 5.92 7.44
Senegal 32.30 24.60 67.83 57.10 23.53 18.32 10.63 7.86
Table 3.3. Head-count Index of Poverty by Subgroup, Senegal 1994/95 and 2001
Source: Authors’ estimation, following methodology in Siaens and others (2005).

Growth and Poverty Reduction 61
Growth Redistribution
1994 2001 Change Component Component Residual
Head-count Index of Poverty
National
Base year 1994 −13.15 2.03 0.39
Base year 2001 67.84 57.11 −10.73 −12.76 2.43 −0.39
Average effect −12.96 2.23 0.00
Urban
Base year 1994 −15.45 −1.25 −0.56
Base year 2001 62.98 45.72 −17.26 −16.02 −1.81 0.56
Average effect −15.74 −1.53 0.00
Rural
Base year 1994 −7.59 1.41 0.4
Base year 2001 70.94 65.16 −5.78 −7.19 1.81 −0.4
Average effect −7.39 1.61 0
Poverty Gap
National
Base year 1994 −7.40 2.24 −0.05
Base year 2001 23.53 18.32 −5.21 −7.45 2.19 0.05
Average effect −7.43 2.22 0.00
Urban
Base year 1994 −7.68 0.39 0.39
Base year 2001 20.81 13.91 −6.90 −7.29 0.78 −0.39
Average effect −7.48 0.58 0.00
Rural
Base year 1994 −4.51 0.75 −0.064
Base year 2001 25.27 21.44 −3.83 −4.58 0.68 0.064
Average effect −4.54 0.71 0
Squared Poverty Gap
National
Base year 1994 −4.01 1.53 −0.30
Base year 2001 10.63 7.86 −2.78 −4.31 1.23 0.30
Average effect −4.16 1.38 0.00
Urban
Base year 1994 −4.01 0.69 0.08
Base year 2001 8.98 5.74 −3.25 −3.93 0.76 −0.08
Average effect −3.97 0.72 0.00
Rural
Base year 1994 −2.56 0.32 −0.09
Base year 2001 11.69 9.36 −2.33 −2.65 0.23 0.09
Average effect −2.61 0.27 0
Table 3.4. Growth-Inequality Decomposition of Changes in Poverty, Senegal 1994/95 and 2001
Source: Authors’ estimation, following methodology in Siaens and others (2005).

62 World Bank Working Paper
National Urban areas Rural areas
Growth rate in the mean 2,59 2,90 1,46
Growth rate at median 1,99 2,89 1,22
Mean percentile growth rate 2,16 2,71 1,38
Head-count index Rate of pro-poor growth
10 1,88 1,38 2,21
15 1,61 1,77 1,88
20 1,50 2,00 1,66
25 1,46 2,15 1,50
30 1,46 2,27 1,42
40 1,53 2,48 1,32
50 1,61 2,59 1,32
100 2,12 2,67 1,36
Table 3.5. Rate of Pro-poor Growth, Senegal 1994/95 and 2001
Source: Authors’ estimation, following methodology in Siaens and others (2005).
the methodology). As expected, the fact that there was an increase in inequality limited to
some extent the reduction in poverty that was obtained through growth. At the national
level for example, an additional reduction in the head-count index of poverty of about
2 percentage points would have been obtained if inequality had not increased.
The fact that inequality increased tends to suggest that growth in consumption was higher
in the upper part of the distribution. Table 3.5 and Figures 3.8, 3.9 and 3.10 provide an analy-
sis of the extent to which growth did benefit the poor, as summarized by computing the pro-
poor growth rate over the post-devaluation period, and presenting the Growth incidence curve
(Ravallion and Chen 2003) at the national level and for urban and rural areas. The pro-poor
growth rate is computed as the mean growth rate for the poor, or the percentage change in the
Watts index of poverty. It can be clearly seen that the rate of growth in the consumption per
equivalent adult at the bottom of the distribution has been below that observed for the popu-
lation as a whole, suggesting that growth has not been strictly speaking pro-poor. This is con-
firmed by Figures 3.8, 3.9 and 3.10 that provide the growth incidence curves at the national,
urban and rural levels. The growth rates in consumption are much lower at the bottom of the
distribution than in the upper half of the distribution, confirming that growth has been
stronger among better off households (in rural areas, this is not the case for the poorest, but
this may be a data issue, and for the poor as a whole, the conclusion remains valid). Of course,
the fact that growth was not “pro-poor” does not mean that poverty was not reduced, even
among the poor. Rather, the conclusion is simply that proportional gains in consumption after
the devaluation were higher for the non-poor than for the poor.
The Persistence of Perceived Poverty
Despite the remarkable fall in poverty documented above, based on the change in consump-
tion experienced by Senegalese households over 1994–2001, perceived poverty has increased
significantly in this country. This result comes out of the EPPS 2001 survey (Enquête sur la

Growth and Poverty Reduction 63
0
0.5
1
1.5
2
2.5
3
3.5
0 10 20 30 40 50 60 70 80 90 100
Percentile of the population ranked by household expenditure per eq. adult
Growth Incidence Curve
Growth rate in mean
Growth rate in median
Source: Authors’ estimation.
Figure 3.8. Pro-poor Growth Diagnostic, National
perception de la pauvreté au Sénégal). This is a survey on subjective perceptions of poverty
by Senegalese households, which used the same sample as ESAM 2.
Siaens and Wodon (2005) show that a vast majority of the household surveyed did not
perceive any improvement in the poverty situation. Indeed more than 85 percent of them
estimate that poverty remained stable or deteriorated during the five years preceding the
survey. This is particularly noticeable among the “objective” poor or among those who per-
ceive themselves as poor. Almost two thirds of the sample households perceive themselves
as poor, which is a proportion of the same order of magnitude as the objective (consumption-
based) estimates of poverty. However, the survey shows that these two groups of households
are somewhat different, as the overlap between the two categories is imperfect, and a sig-
nificant share of the objectively poor did not perceive themselves as poor. Note that this
imperfect overlap between subjective and objective poverty is not based on a conceptually
different view about poverty. Indeed, more than 50 percent of the respondents to the sur-
vey consider “the inability to feed one’s family” as the main correlate of poverty, which
broadly consistent with the consumption-based approach for measuring poverty adjusted
by the number of adult equivalent household members used to measure objective poverty.
The data from the EPPS 2001 survey suggests that there is a strong persistence in the
perception of poverty. This disconnection between the subjective and the objective changes
in poverty has been observed in other West African countries, and it raises a political prob-
lem. In a democratic country like Senegal, this disconnection may reduce the incentive faced

Figure 3.9. Pro-poor Growth Diagnostic, Urban
-0.5
0
0.5
1
1.5
2
2.5
3
3.5
Percentile of the population ranked by household expenditure per eq. adult
Growth Incidence Curve
Growth rate in mean
Growth rate in median
0 10 20 30 40 50 60 70 80 90 100
Source: Authors’ estimation.
Figure 3.10. Pro-poor Growth Diagnostic, Rural
0
0.5
1
1.5
2
2.5
3
Percentile of population ranked by household expenditure per eq. adult
Growth Incidence Curve
Growth rate in mean
Growth rate in median
0 10 20 30 40 50 60 70 80 90 100
Source: Authors’ estimation.
64

by the government to actively fight poverty, as the resulting improvement may not be cor-
rectly perceived as such by the voters. President Diouf, who presided over the implementa-
tion of the growth-boosting policy in the late 1990s, was beaten at the March 2000 elections,
while a sense of “crisis” was widespread in the electorate. However, nothing proves that the
perception by the voters of the absence of a positive change in poverty played any part in
determining this outcome.
Conclusion
In 1994, the devaluation of the CFA Franc in Senegal as in other UEMOA countries led to
a drop in the real wages of formal, and especially public sector workers. During the three
years following the devaluation, despite the fast recovery of GDP growth, and the fall in the
real wage rates in the urban sector, private investment did not pick up. It is only after 1996,
when the government used the fiscal resources freed by the reduction in the real value of
its wage bill for financing a major increase in public investment that the former picked up.
The resulting investment boom stretched out the post-devaluation boom in time, and
managed to tide the Senegalese economy over the regional recession of the year 2000. It is
during this phase, from 1996 to 2001, that the poverty effect of the accelerated growth must
have been the largest, although we cannot check this empirically since we have data only
for 1994 and 2001.
The road which led from a cut in the incomes of the rich to an increase in the incomes
of the population as a whole was complex. This is probably true also in most countries of
the world. The direct impact, which was dominant in the short run but not observed as
such in this paper, because we did not have nationally representative survey data prior to
the devaluation, entailed a fall in the incomes, especially among formal sector workers,
including workers from the public sector. However, the indirect subsequent effect through
public and private investment did reduce poverty in the long run. The latter effect is by no
means mechanical, and many other governments could have wasted the fiscal windfall cre-
ated by the devaluation. The bottom line is that poverty reducing growth occurred at the
end of the century because the government engineered a sustainable change in the func-
tional distribution of income, from wages to profits. This change was obtained by an
increase in public investment and the creation of an “investor-friendly” environment,
based on low corporate taxation and low public debt. While the growth observed after the
devaluation was not “pro-poor” strictly speaking, all segments of the population benefited
from higher standards of living in 2001, as compared to those that prevailed in 1994.
This core lesson of Senegal’s growth and poverty reduction experience is simply that
investment, both public and private, is the engine of sustained growth, and that profitability
and growth themselves boost investment levels. This simple message has been emphasized
time and again in the literature (for example, Malinvaud 1980). As the former chancellor of
West Germany Helmut Schmit used to say: “The profits of today are the investments of
tomorrow and the investments of tomorrow make the employment of the day after tomor-
row” (cited in Malinvaud 1980). As poverty reduction may lag by some time behind improve-
ments in profitability and growth, it thus takes a sustained effort in favor of profitability to
pull a significant number of people out of poverty. The Senegalese experience shows that
devaluation was one of the possible means that could be used for that purpose, acting like a
Growth and Poverty Reduction 65

tax on formal sector wages, which had been too high for some time. Senegal’s experience also
suggests that efficient public investment was quite important, as it was important to cut the
public debt overhang and improve the business environment.
These are probably not the only ways that profitability can be supported, and other
means to the same end should be sought in different institutional and political settings. The
unprecedented stretch of fast economic growth that resulted from this strategy managed to
pull a large share of the Senegalese population out of poverty. Unfortunately, from the point
of view of the incumbent government, the objective reduction in poverty was not correctly
perceived by the voters. This was shown by the survey performed in 2001 on the subjective
perception of poverty. Maybe, in a democratic polity like Senegal, one of the political chal-
lenges faced by administrations is to find a strategy for reducing the subjective as well as objec-
tive perceptions of poverty. More generally, subjective perceptions may matter as much as
objectively measured trends in standards of living in order to achieve genuine “ownership”
of long-term poverty reduction policies in democratic countries.
References
Azam, Jean-Paul. 1993. “The ‘Côte d’Ivoire’ Model of Economic Growth.” European Eco-
nomic Review 37:566–76.
———. 1995. “L’Etat auto-géré en Afrique.” Revue d’économie du développement
1995/4:1–19.
———. 1997. “Public Debt and the Exchange rate in the CFA Franc Zone.” Journal of
African Economies 6(1):54–84.
———. 2004. “Poverty and Growth in the WAEMU after the 1994 Devaluation.” Journal
of African Economies (forthcoming).
Azam, Jean-Paul, Bruno Biais, and Magueye Dia. 2004. “Privatization versus Regulation
in Developing Economies: The Case of West African Banks.” Journal of African
Economies 13(3):361–94.
Azam, Jean-Paul, and Gérard Chambas. 1999. “The Groundnuts and Phosphates Boom in
Sénégal (1974–1977).” In Paul Collier and Jan Willem Gunning, eds. Temporary Trade
Shocks in Developing Countries, Vol. 1. Oxford: Oxford University Press.
Azam, Jean-Paul, Magueye Dia, and Tchétché N’Guessan. 2002. “Telecom Sector Reform
in Senegal.” World Bank Working Paper, WPS 2894 , Washington, D.C. (http://
www.worldbank.org/html/dec/Publications/Workpapers/home.html) (Reproduced
in: International Training Program on Utility Regulation and Strategy, CD-ROM,
Public Utility Research Center, University of Florida, 2003).
Azam, Jean-Paul, Magueye Dia, Clarence Tsimpo, and Quentin Wodon. 2005. “Poverty
Reduction Without Net Growth: The Impact of Senegal’s 1994 Devaluation on Urban
Poverty.” World Bank, Washington, D.C. Processed.
Azam, Jean-Paul, and Waly Wane. 1999. “The Impact of the Devaluation of the CFA Franc
on Poverty in the WAEMU.” World Bank, Washington, D.C. Processed.
Berthélemy, Jean-Claude, Abdoulaye Seck, and Ann Vourc’h. 1996. La croissance au Séné-
gal: un pari perdu? Etudes du centre de développement de l’OCDE. Paris: OCDE.
Boone, Catherine. 2003. Political Topographies of the African State. Cambridge: Cambridge
University Press.
66 World Bank Working Paper

Cohen, Daniel. 1993. “Low Investment and Large LDC Debt in the 1980s.” American Economic
Review 83:437–49.
Datt, G., and M. Ravallion. 1992. “Growth and Redistribution Components of Changes in
Poverty Measures: A Decomposition with Applications to Brazil and India in the
1980’s.” Journal of Development Economics 38:275–95.
Diagne, Abdoulaye, and Gaye Daffé, eds. 2002. Le Sénégal en quête d’une croissance durable.
Paris: CREA–Karthala.
Eaton, Jonathan. 1993. “Sovereign Debt: A Primer.” World Bank Economic Review
7:137–172.
Foster, James, Joel Greer, and Erik Thorbecke. 1984. “A Class of Decomposable Poverty
Measures.” Econometrica 52:761–66.
Ka, Samba, and Nicolas Van de Walle. 1994. “Senegal: Stalled Reform in a Dominant Party
System.” In Stephan Haggard and Steven B. Webb, eds., Voting for Reform: Democracy,
Political Liberalization, and Economic Adjustment. Oxford: Oxford University Press.
Lewis, W. Arthur. 1954. “Economic Development with Unlimited Supplies of Labour.”
Manchester School 22:139–191.
Loum, Mamadou Lamine. 2001. La Sénégal au 1er avril 2000. Dakar: EXCAF Editions.
Malinvaud, Edmond. 1980. Profitability and Unemployment. Cambridge: Cambridge Uni-
versity Press.
Manchuelle, François. 1997. Willing Migrants: Soninke Labor Diasporas, 1848–1960.
Athens, Ohio: Ohio University Press.
Rama, Martin. 2000. “Wage Misalignment in CFA Countries: Were Labour Market Policies
to Blame?” Journal of African Economies 9(4):475–511.
Ravallion, Martin, and Shaohua Chen. 2003. “Measuring Pro-Poor Growth.” Economics
Letters 78:93–99.
République du Sénégal. 2004. “La pauvreté au Sénégal: de la dévaluation de 1994 à
2001–2002.” Ministère de l’économie et des finances, Direction de la prévision et de la
statistique, version préliminaire, Dakar, janvier.
Rouis, Mustapha. 1994. “Senegal: Stabilization, Partial Adjustment, and Stagnation.” In
Ishrat Husain and Rashid Faruqee, eds., Adjustment in Africa: Lessons from case Studies.
Washington, D.C.: The World Bank.
Schaffer, Frederic C. 1998. Democracy in Translation. Ithaca, N.Y.: Cornell University Press.
Siaens, Corinne, Mohamed Sylla, Adama Toure, and Quentin Wodon. 2005. “Poverty
trends and determinants in Senegal: 1994–2001.” World Bank, Washington, D.C.
Processed.
Siaens, Corinne, and Quentin Wodon. 2005. “Perceptions of Poverty in Senegal.” World
Bank, Washington, D.C. Processed.
Van de Walle, Nicolas. 1991. “The Decline of the Franc Zone: Monetary Politics in Fran-
cophone Africa.” African Affairs 90:383–405.
Watts, H. W. 1968. “An Economic Definition of Poverty.” In D. P. Moynihan, ed., On
Understanding Poverty. New York, Basic Books.
World Bank. 2005. “Senegal: Poverty and Human Development.” Report No. 26189-SN,
The World Bank, Washington D.C.
Growth and Poverty Reduction 67