Embed Size (px)
Citation preview

1
Preliminary estimates of nanoparticle number emissions
from road vehicles in megacity Delhi and associated
health impacts
Prashant Kumara, b, *
, B.R. Gurjarc, d
, A.S. Nagpured, Roy M. Harrison
e
aDivision of Civil, Chemical and Environmental Engineering, Faculty of Engineering and Physical
Sciences (FEPS), University of Surrey, Guildford GU2 7XH, United Kingdom
bEnvironmental Flow (EnFlo) Research Centre, FEPS, University of Surrey, Guildford GU2 7XH,
United Kingdom
cCivil Engineering Department, Indian Institute of Technology Roorkee, Roorkee # 247667,
Uttarakhand, India
dCentre for Transportation Systems (CTRANS), Indian Institute of Technology Roorkee, Roorkee # 247
667, Uttarakhand, India
eDivision of Environmental Health and Risk Management, School of Geography, Earth and
Environmental Sciences, University of Birmingham, Edgbaston, Birmingham B15 2TT, United
Kingdom
Abstract. Rapid urbanisation in developing megacities like Delhi has resulted in an increased number of
road vehicles and hence total particle number (ToN) emissions. For the first time, this study presents
preliminary estimates of ToN emissions from road vehicles, roadside and ambient ToN concentrations,
and exposure related excess deaths in Delhi in current and two future scenarios; business as usual
*Corresponding author. Tel.: +44 1483 682762; fax: +44 1483 682135. Email addresses:
[email protected], [email protected]

2
(BAU) and best estimate scenario (BES). Annual ToN emissions are estimated as 1.37×1025
for 2010
which are expected to increase by ~4 times in 2030–BAU, but to decrease by ~18 times in 2030–BES.
Such reduction is anticipated due to a larger number of compressed natural gas driven vehicles and
assumed retrofitting of diesel particulate filters to all diesel vehicles by 2020. Heavy duty vehicles emit
the majority (~65%) of ToN for only ~4% of total vehicle kilometres travelled in 2010. Their
contribution remains dominant under both scenarios in 2030, clearly requiring major mitigation efforts.
Roadside and ambient ToN concentrations were up to a factor of 30 and 3 higher to those found in
respective European environments. Exposure to ambient concentrations resulted in ~508, 1888 and 31
mortalities per million people in 2010, 2030–BAU and 2030–BES, respectively.
1. Introduction
Rapid urbanisation has resulted in a considerably increased number of road vehicles in megacities
over the past few decades, making their inhabitants vulnerable to air pollution induced health risks [1].
Atmospheric nanoparticles are one of the air pollutants which are currently not regulated through air
quality standards in any developing or developed megacities. Up to ~85% of total particle number (ToN)
concentrations in polluted urban environments originates from road vehicles [2]. More than 80% of ToN
concentrations in atmospheric urban environments reside in the ultrafine size range (i.e. <100 nm in
diameter) that contribute almost negligibly to particle mass concentrations [3]. The particle size range
below 300 nm (referred here as nanoparticles) constitute over 99% of ToN concentrations in urban
environments [2]. Therefore, in what follows, the terms ToN and nanoparticles are used interchangeably
as are the terms ambient, airborne and atmospheric (according to the context). New sources such as
manufactured nanomaterials [4] have recently emerged but road vehicles remain the largest contributors
to the ToN emissions [5]. The vehicle population in developing megacities like Delhi is expected to
increase substantially in future years. This means an increased level of ToN release into the urban
atmospheric environment resulting in adverse effect on human health, urban visibility and global climate
[2, 6].
3
Currently, there are no air quality standards in any part of the world to limit public exposure of
atmospheric particles on a number basis since current regulations are based on mass concentrations of
PM10 (Dp ≤ 10 µm) and PM2.5 (Dp ≤ 2.5 µm) [5]. Recent inclusion of particle number emission limits for
vehicles in Euro–5 and Euro–6 standards for light duty diesel vehicles is the first ever initiative to
control them at source in European countries [2]. Stricter emission standards, cleaner fuels, advances in
engine and after–treatment emission technologies and introduction of cleaner (hybrid) vehicles have
significantly reduced emissions of particulate mass and gaseous pollutants in developed urban cities [5,
7]. However, implementation of such emission policies and control measures may take decades to come
in force in developing countries.
Delhi’s population in 2010 were about 22.16 million which was distributed over a surface area of
1483 km2 [8] – this is about 2.6 times larger than the London population dispersed over 0.86 times the
surface area of Delhi [8]. This indicates a much higher integrated exposure of Delhi’s inhabitants to
atmospheric nanoparticles compared with developed megacities. Since nanoparticles exposure is often
positively related with respiratory and cardiovascular diseases and increased rates of mortality [6], a
large number of morbidity and mortality cases can be attributed to nanoparticles which have not been
quantified for Delhi until now.
So far, only a small number of emission inventories for fine particulate matter have been constructed.
Most of these have been for the UK [15-17] or Australia [9] but none of them corresponds to a
developing country. Moreover, these inventories restrict their scope to estimation of PM10 and PM2.5
emissions, except Keogh et al [9], who recently published a comprehensive emission inventory for
urban South–East Queensland in Australia considering both particulate mass (PM10 and PM2.5) and
numbers. For the first time, our study makes preliminary estimates of ToN emissions, roadside and
ambient ToN concentrations and associated total mortality in Delhi under two future scenarios: business
as usual (BAU), and best estimate scenario (BES). We have used the word ‘preliminary’ because a
number of assumptions are used in estimations due to the lack of location specific data. Also note that

4
our study only focuses on particle number emissions only from road vehicles in the megacity Delhi;
other emission sources are not considered.
2. Methodology
This section briefly presents key information on study area, modelled scenarios, estimates of
vehicle types, their population and vehicle kilometre travelled (VKT). A detailed description on the
topics covered below can be seen in supplementary Sections S.1 and S.2.
2.1 Description of the study area
Delhi (28°38'17"N, 77°15'51"E) is among the foremost developing megacities in the world. Its
inhabitant population increased by 21.5% in 2006 from the 2001 levels compared with 7.5% increase in
national population [8]. The population is further expected to increase by about 54% in 2030 from the
2006 levels [8]. Delhi’s transport system mainly relies on roads. In 2008, Delhi had about 31,183 km
road length with 100’s of flyovers [10] which is growing with the ongoing development of a bus rapid
transit system (BRT). A total of 26 (7, 3 and 16) BRT corridors are planned in three five–yearly phases
starting from 2005; these will cover a total length of 310 km by the year 2020 [11]. The surface area
used by roads is about 21% of Delhi’s total land area [12], covering about 1749 km of road length per
100 km2.
Buses are the dominant mode (~42% of total personal trips in 2007–2008) of transportation that is
followed by cars, 2–wheelers (2Ws; motorcycles and scooters), 3–wheelers (3Ws; auto–rickshaw) and
bicycles [11]. Considerable efforts are being made to reduce air pollution levels in the city by
implementing a clean fuel policy and developing transport infrastructure (e.g. BRT and metro). For
instance, the majority of vehicles were operating on diesel and gasoline fuels prior to 2001. In 2001, the
Delhi government strictly implemented compressed natural gas (CNG) fuel for operation of buses and
3Ws, which was applicable for light duty vehicles (LDVs; those <3.5t in weight) from 2006. Following
the orders of the Supreme Court in April 2001, transport such as buses, 3Ws and all commercial
vehicles including taxis aged over 15 years were required to be changed to CNG. These orders also

5
included introduction of Euro–I emission standards for private passenger cars (cars and jeeps), use of
unleaded petrol, and premixing of 2T (two stroke) oil with petrol for 2Ws.
Delhi is surrounded by two states (Uttar Pradesh and Haryana) and is also a central point for buses to
transport the passengers to other states in India. Consequently, a considerable amount of inter–state
traffic (mainly diesel–fuelled buses and heavy duty vehicles, HDVs) enters and passes through the city
everyday.
2.2 Modelled scenarios
Emission estimates of ToN concentrations are made between 1991 and 2030 but the levels of
2010 are considered as a baseline figure to compare with 2030 estimates in two modelled scenarios
(BAU and BES). BAU is a base case scenario in which no policy interventions are considered. Detailed
construction of the BAU gives 5.40 and 5.58 times increase in total vehicle population and VKT,
respectively, in 2030 from the 2010 levels. The LDVs, buses and 3Ws registered in Delhi after 2006 are
assumed to running on CNG, except those coming in from the outside states and passing through Delhi.
The phasing out of vehicles after the retirement age of 15 years (public) and 17 years (commercial),
together with complete removal of 2–stroke 2Ws by 2015, is considered as per Delhi Government
norms. Whereas, BES considers promising reduction measures in nanoparticle emissions due to
interventions by transport and emission control policies and infrastructural development for road
transport. Detailed construction of this scenario results in 3.09 and 4.03 times increase in total vehicle
population and VKT, respectively, in 2030 from the 2010 levels. Other considerations include
hypothetical implementation of emission control technologies, changes in fuel and vehicle types,
improved vehicle speeds due to implementation of multi mode mass transit system (MRTS) and BRT
corridors, phasing out of both public and commercial vehicles after a short retirement age and complete
phasing out of 2–stroke 2Ws by 2012, as suggested by Clean Air Initiative for Asian cities. Detailed
methodology describing the construction of these scenarios is presented in Sections S.1 and S.2.

6
2.3 Modelling ToN emissions
The ToN emissions (# yr–1
) are estimated using the Eq. (1) which is a product of PNEF (# veh–1
km–1
) and VKT by each vehicle type in a year.
)1()()()
()()()( 3322
−−−−−−−−−−−−−−×+×+
×+×+×+×=
LGVsLGVsHGVsHGVsBuses
BusesWWwwcarscars
VKTPNEFVKTPNEFVKT
PNEFVKTPNEFVKTPNEFVKTPNEFToN
Six vehicle categories are considered for the estimates: passenger cars and jeeps (gasoline, diesel and
CNG), 2Ws (gasoline; two and four strokes), 3Ws (gasoline and CNG), Buses (diesel and CNG), LDVs
(diesel, petrol and cars, and HDVs (diesel; those >3.5t in weight). Subsequent sub–sections illustrate the
details of collected PNEF and VKT data.
2.3.1 PNEFs
There are no PNEF studies available for road vehicles running in Indian or Asian countries. The
majority of available studies are either from the European, American or Australian region [9]. To
account for a variety of vehicles driven by CNG, diesel or gasoline fuels, an extensive review of PNEF
studies published in the last two decades is carried out (Table S.1) and representative PNEFs are
selected for our use (see Table S.2). Under both scenarios, PNEFs were selected for individual vehicle
types according to their corresponding speeds during the following designated time periods: morning
and evening peaks (0800–1200h; 1600–2000h), morning and evening off–peaks (0600–0800; 1200–
1600h; 2000–2200h) and free flow (2200–06:00). Different values of PNEFs are chosen under the BES
due to the change in fuel types, speeds and retrofitting of diesel particulate trap (DPF), as illustrated in
Table S.2 and Section S.2.3.
2.3.2 Modelling vehicle population, speed and fuel types
Modelling of vehicle population in the BAU (Nv,BAU) and BES (Nv,BES) is required to accurately
quantify the annual VKT. Since there is no consolidated database available for this purpose, we have
constructed this data after considering the findings of relevant published studies and sensible
assumptions using the following equations:
Nv,BAU = Number of registered road vehicles + External vehicles coming in and passing through
the city – Phased out old vehicles as described in Section 2.2
7
Nv,BES = Nv,BAU – Vehicles off the road due to MRTS and Bus Rapid Transit (BRT) corridors in
Delhi
Vehicle population between 1991 and 2030 is compiled using the vehicle registration data for past
years and applying a growth factor for future years. Firstly, vehicle registration data in Delhi between
1991 and 2006 are used as a base data for vehicle population [13]. Future growth of vehicles was then
estimated based on the socio–economic analysis between the annual gross domestic product (GDP)
growth and total cumulative number of annually registered vehicles for the years between 2001 and
2006. This trend was then extended to project vehicle population after 2006 by assuming a 10% annual
growth in GDP that is suggested by the Planning Commission of Delhi. The estimated average annual
growth was found to be 10.8, 13.3, 13.6, 6.7, 8.2 and 9.5% for 3Ws, taxis, buses, goods vehicle (i.e.
LDVs and HDVs), cars and jeeps, and 2Ws, respectively. Our estimates are higher than those suggested
by Murthy et al. [14] for 3Ws (8%), taxis (5%), buses (7%), cars and jeeps (10%), and 2Ws (9.8%) due
to consideration of higher GDP growth than anticipated in past years. Detailed procedure for estimating
the Nv,BAU and Nv,BES are provided in supplementary Section S.2.1.
2.3.3 Total VKT under both scenarios
For both scenarios, the annual VKT for each vehicle category are estimated by multiplying the
VKT per day with the total number of days in a year. The VKT per day were assumed to be 41 (cars), 27
(2Ws), 110 (3Ws), 164 (Buses), 82 (HDVs and taxis) and 110 (LDVs) [14-15]. Total VKTs are then
divided into the periods described in Section 2.3.1, i.e. peak (53%), off–peak (40%) and free flow (7%)
for choosing vehicle–speed specific PNEFs during these periods. Average vehicle speeds during peak
hours were assumed to be 26 (cars and jeeps, taxis), 27 (2Ws), 23 (3Ws), 17 (buses), 25 (HDVs) and 10
km h–1
(LDVs) [16]. An increase of 11% from peak hours is considered for off peak hours [16-17].
During the free flow traffic conditions, which usually occur at night, the maximum permissible speed for
vehicles was capped at 60 km h–1
under both scenarios [18]. Under the BES, average vehicle speed is
taken as the vehicle speeds during the BAU plus the increase due to infrastructural development as
explained in Sections 2.2 and S.2.2.

8
2.4 Estimation of total mortality related to changes in ToN concentrations
In order to calculate the numbers of deaths brought forward (total mortality) as a result of
exposure to airborne nanoparticles as described by particle number count, it is necessary to use an
exposure–response coefficient which relates a change in particle number count to the number of
associated deaths. Whilst these are abundant in the literature for the effects of exposure to PM10
concentration, they are almost non–existent for particle number. The very few values available include
that reported by Atkinson et al. [6] from a time series study conducted in London, and by Stolzel et al.
[19] for Erfurt, Germany. As reliable data were not available from Delhi for either cause–specific
mortality in the general population or hospital admissions, the calculation has been conducted only for
the effects on total mortality. Our calculations assume that death rates for 2008 are applicable to Delhi’s
population in 2010 and 2030 and that the exposure–response coefficient remains unchanged. The
population data for the calculation were derived from the World Health Organisation [8] and the
mortality rate from the Annual Report on Registrations of Births and Deaths for Delhi [20]. Detailed
description of the estimation method and the data used is provided in Section S.5.
3. Results and discussion
3.1 Modelled estimates of ToN emissions
Annual ToN emissions in 2010 are estimated as 1.37×1025
which is expected to increase ~4.21
times in 2030–BAU (Table 1). This increase was anticipated since the VKT values increased due to
~5.58 times growth in vehicle population in 2030–BAU compared with 2010 levels. One way to
compare the results in chosen scenarios is to normalise the emissions by the VKT values. The emissions
to VKT ratio was 1.99×10¹⁴
km–1
in 2010 which slightly decreased to 1.43×10¹⁴
km–1
in 2030–BAU due
to the replacement of retired vehicles with the new CNG vehicles in traffic fleet.
Under the 2030–BES, annual ToN emissions decreased by about two orders of magnitude (7.8×10²³
yr–1
) from the 2010 levels. This resulted in about three orders of magnitude smaller emissions to VKT
ratio (6.02×10¹¹
) than those in 2010 (1.99×10¹⁴
). The main reasons for these countable reductions were
the rapid phasing out of gasoline and diesel driven taxis, buses and LDVs and their replacement with the

9
new CNG vehicles. The other key factor responsible for this reduction was assumed retrofitting of DPFs
on all diesel vehicles by 2020 since these can decrease the ToN emissions by about two orders of
magnitude or more compared with non–DPF diesel engines [21].
Dividing the ToN emissions by inhabitant population gives per capita per day emissions. This was
found to be 1.70×10¹⁵
in 2010 which increases by about 3 times in the 2030–BAU but decreased
substantially (i.e. 243 times) under the 2030–BES due to a favourable combination of both increased
inhabitant population and decreased emissions. These observations also indicate that a considerable
reduction in the ToN emissions can be achieved if the assumptions considered in the BES are
implemented, benefiting both the local air quality and public health (see Section 3.6).
3.2 Contribution of different vehicle types to ToN emissions
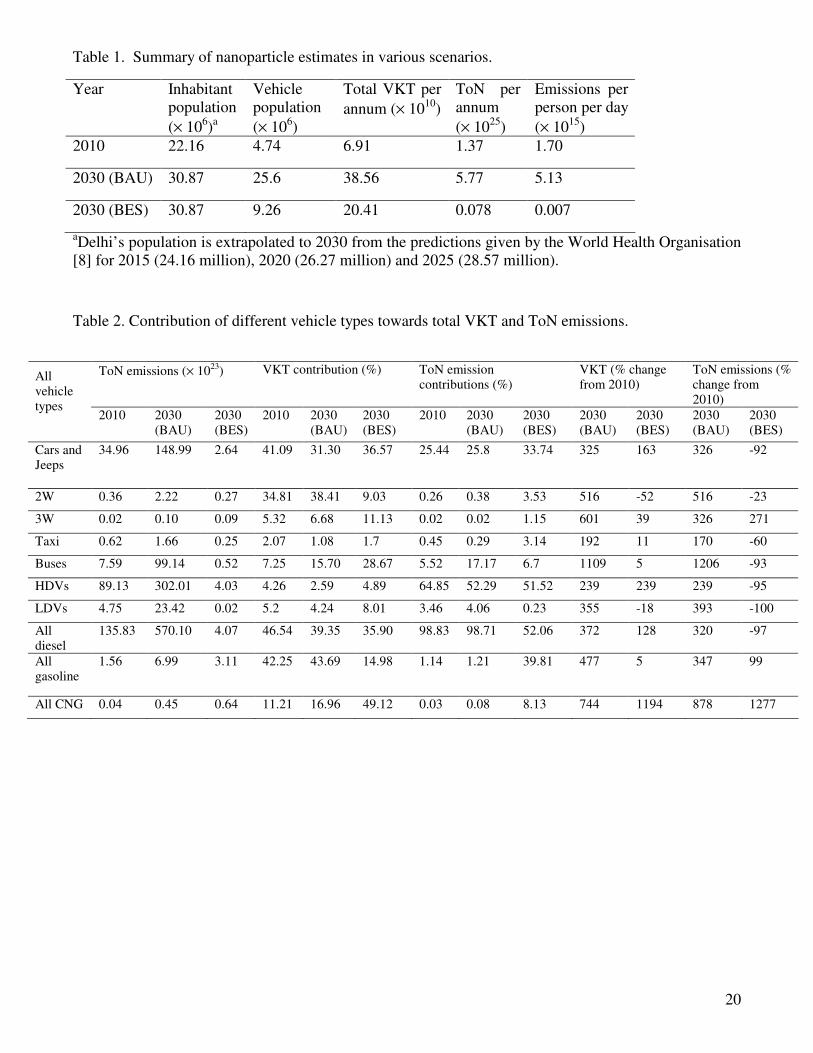
Table 2 illustrates the VKT and ToN emissions contributed by different vehicle types. As opposed
to the VKT contribution by CNG driven vehicles, the share of diesel and gasoline vehicle driven VKTs
decreased in future years due to a favourable shift towards the CNG fuel. Despite this, contribution to
ToN emissions from all diesel vehicles remains dominant in both future scenarios; emissions from
gasoline and CNG vehicles follow. The BES targets the largest contributor to ToN emissions (i.e. diesel
vehicles) and brings about 34 times decrease in 2030–BES from the 2010 levels and an increase in CNG
and gasoline contributions to about 13 and 2 times, respectively (Table 2).
If we look at the different vehicle categories in 2010 and 2030–BAU, passenger cars (taxis, cars and
jeeps) are the highest contributor to the VKTs, followed by the 2Ws, buses, 3Ws, HDVs and LDVs.
Passenger cars are however the second largest contributor (25–34%) to ToN emissions after the HDVs
in all scenarios, mainly due to their larger population running on gasoline and diesel fuel. Contributions
of 2Ws towards the VKTs are second largest (35–39%) but they contribute substantially less (0.26–
0.38%) to the ToN emissions in 2010 and 2030–BAU. One of the findings in accordance with a recently
published study [9] is the contribution of the HDVs to the ToN emissions. The HDVs contributed 4.26%
of total VKT in 2010 but they alone emitted ~65% of ToN emissions. Consistent with this were the
observations in 2030–BAU and 2030–BES where the HDVs added to ~2.59 and 4.89% of total VKT,

10
but corresponded to ~52 and 51% of ToN emissions, respectively. The HDV population is expected to
be tripled (3.39 times) in 2030 over the 2010 values under both scenarios, suggesting that emissions
control from the HDVs require major mitigation efforts in future. Contribution to ToN emissions from
the HDVs remain dominant even when the after–treatment systems (i.e. DPF) are assumed to be used
under the BES. One of the predominant reasons for the HDVs to be the largest contributor is their much
larger PNEFs compared with other vehicles (see Table S.2). This is presumably a leading explanation
that our estimates of annual ToN emissions (1.37×1025
) compared well with those estimated (1.08×1025
)
by Keogh et al. [9] for South–East Queensland in Australia. The HDVs contributed to about 54% of
their annual ToN emissions although they added only 6% to total VKT.
3.3 Estimating ToN concentrations
Equation (2), which is based on a simplified box model (see Section S.3 for detailed formulation),
is used to convert the annual ToN emissions into the hourly averaged roadside and ambient ToN
concentrations:
Hourly averaged ToN concentrations (# cm–3
) rmsrm UHA
LToN
UH
LQ
××
×=
×
×≈ (2)
where ToN is in # s–1
and L (=47.53 km) is the assumed length of the Delhi which is derived from the
Fig. S.2. Hm is the mixing height which is computed as 200 m (see Section S.3); Q is particle number
flux (# cm–2
s–1
) which is defined as the net number of particles passing through per unit surface area
(As; in cm2) per unit time; Ur (cm s
–1) is the hourly average synoptic (i.e. above urban canopy) wind
speed. Two different values of As are considered for mimicking the ambient (~15m) and roadside (~2m)
concentrations. Detailed description of data used for these estimates are provided in Section S.3.1.
The resultant ToN concentrations from the Eq. (2) are presented in Table 3. It is worth noting that
these concentrations are derived from the road vehicles only. The contribution from other sources (e.g.
background, light petroleum gas, wood and biomass burning for cooking, small–scale industries, power
plants and exhaust–emissions from non–road construction machinery) can not be neglected while
speculating upon the total ToN population in Delhi’s ambient environment [22-23]. A recent source

11
apportionment study for Barcelona city found about 35% of total ToN emissions from other sources [24]
but such contributions are largely unknown for Delhi and are expected to be much larger [22-23]. Our
ambient ToN concentrations are still up to 3 times larger compared with overall concentrations in the
ambient urban environments of European [25] or American [26] cities. If we compare the vehicle–
derived component of our ambient ToN concentrations (3.27×104 cm
–3), these were ~3 times higher to
those observed (1.14×104 cm
–3) by Pey et al. [24] in the ambient environment of Barcelona as a
contribution from road vehicles. Furthermore, our ambient ToN concentrations compare well with a
unique study for Delhi by Monkkonen et al. [23]. In 2002, they measured ToN concentrations in the 3–
800 nm range at a height of 15 m and close to a traffic lane in a residential area adjacent to India Habitat
centre (New Delhi). They found highest measured 24–h average concentrations in the range of
(6.28±1.78)×104 cm
–3, with the lowest and highest concentrations being 2×10
4 and 2.5×10
5 cm
–3,
respectively. We mimicked our ambient ToN concentrations to the 2002 levels for making a
comparison. As expected, our estimates, 3.17(2.02–7.33)×104 cm
–3, are at the lower end of the
concentrations measured by Monkkonen et al. [23] since these exclude contributions from above–
described sources.
Our roadside ToN concentrations are generally about a factor of 23 times larger than our ambient ToN
concentrations. These turns out to be about 23, 26 and 29 times larger than those found along the
roadsides in London, UK [27], Stockholm, Sweden [36] and Cambridge, UK [3], respectively. Roadside
ToN concentrations are expected to grow about 4–fold in 2030–BAU, but about 18–fold decrease in
2030–BES, from the 2010 levels (Table 3). The 2030–BES remarkably bring down both the ambient and
roadside ToN concentrations to well below the corresponding current levels found in a developed
megacity like London [28].
3.4 Effects of transformation processes on estimated ToN concentrations
Health impacts are quantified due to exposure of ambient ToN concentrations (Section 3.5).
Separate estimates are not made for the roadside concentrations because of the unavailability of
population exposure data along the roadsides in Delhi. To avoid chances of extreme health impact

12
estimates, the ambient ToN concentrations are corrected for the possible losses due to transformation
processes such as dry deposition, coagulation and nucleation since these can have a substantial effect
[29] in scenarios (e.g. 2030–BAU) with high ToN concentrations. Other processes like condensation and
evaporation are ignored due to the following reasons. These are reversely acting simultaneous processes
and partly negate each other’s effect and condensation does not affect ToN concentrations [2]. Majority
of evaporation occurs to the nucleation mode liquid particles immediately after their formation near the
tail pipe by nucleation and condensation during initial dilution and cooling [30]. A recent study by
Dall’Osto et al. [31] for London found that evaporation is substantially important to remove the sub–30
nm particles on distance scales of the order of 1 km and travel times of around 5 minutes upon moving
away from major sources. Since ambient ToN concentrations used for health impacts analysis in our
study are estimated at about 15 m height above the ground level, our distance and time scales to reach to
this height are much smaller than those suggested by Dall’Osto et al. [31]. There could be a small
increase (~1% of tailpipe emissions; Dahl et al., [32]) in ToN concentrations due to the particles
generated by the road–tyre interaction and brake wear which is also neglected.
Our estimated ambient ToN concentrations do not provide information on the size distributions which
is required for making loss estimates due to coagulation and dry deposition. Therefore, we have adopted
the particle size distributions which were measured by Monkkonen et al. [23] for Delhi. They found
geometrical mean diameters (GMD) in nucleation, Aitken and accumulation modes as ~11, 44 and 147
nm, respectively, with distributions of ToN concentration in these modes as ~8, 58 and 34%,
respectively (Table S.3). For approximating the losses, coagulation coefficients and dry deposition
velocities for these GMDs were estimated by assuming monodisperse distributions in each mode (see
Section S.4). Formation rate of 3 nm particles were found to be varying between 3.3 and 13.9 cm−3
s−1
in
Delhi’s environment [23], which represent typical formation rates of new particles in urban conditions
[33]. We used 3.3 cm−3
s−1
for making a conservative estimate for the production of new particles due to
nucleation. Percent changes in ToN concentrations due to coagulation, condensation and nucleation in

13
different scenarios are illustrated in Table S.4, and corrected ToN concentrations in ambient
environment of Delhi are shown in Table 3.
As expected, coagulation losses were highest (~13% of ToN concentrations) due to the largest ToN
concentrations in 2030–BAU (Table 3) compared with ~4 and ~0.2% in 2010 and 2030–BES,
respectively. Dry deposition losses were about ~11% in all cases. Formation of new particles due to
nucleation was highest for the 2030–BAU (~3% of ToN concentrations), followed by negligible
contributions in 2010 (~0.2%) and 2030–BES (~0.1%) which is expected due to a large condensation
sink and background particle loading in Delhi. The net losses during all scenarios ranged between 10
and 22% compared with inert treatment of particles (Table S.4). These losses are identical with the
detailed modelling studies of Ketzel and Berkowicz [34-35] for Copenhagen city where they found net
losses between 10 and 30%, and of Gidhagen et al. [36] for Stockholm city where they found
coagulation and dry deposition losses up to 3 and 25%, respectively.
3.5 ToN exposure in megacity Delhi and in typical urban locations
Exposure to high ToN concentrations may aggravate existing pulmonary and cardiovascular
diseases due to efficient alveolar deposition of tiny particles and their potential to enter the pulmonary
vascular space [37-38]. Fresh vehicular exhaust contains many nanosized particles that take a few
seconds of travelling time to reach to the roadside [39] where people living, walking or travelling by
motor vehicles, bicycles and 2Ws are exposed [40]. Concentration levels of exposure can vary up to two
orders of magnitude or more depending on the exposed location. For instance, concentration levels for
exposure can be to ~106
cm–3
while travelling in car in urban or tunnel routes [41], ~105
cm–3
during
cycling, walking or travelling in buses in heavily trafficked area [40, 42], and ~104
cm–3
in typical street
canyon conditions [43]. Our estimated roadside concentrations in 2005 were 6.95(4.43–16.08)×105
cm–
3; these are about 6–10 times larger than those measured by Kaur et al. [42] at a heavily trafficked route
in London during their exposure assessment study for the people walking (0.68×10⁵
cm–3
), cycling
(0.94×10⁵
cm–3
), travelling in buses (1.01×105 cm
–3), cars (0.99×10
5 cm
–3) and taxis (0.88×10
5 cm
–3).

14
For Delhi inhabitants, current exposure to ambient and road side concentrations are of the order of ~104
and ~105 cm
–3, respectively (Table 3).
3.5.1 Total mortality due to exposure of ambient ToN concentrations
Using the methodology described in Section 2.4, estimates of deaths brought forward (total
mortality) are made due to the exposure of corrected ambient ToN concentrations in different scenarios
using the exposure model of Atkinson et al. [6] for a 1 day lag and Stölzel et al. [19] for a 4 day lag (see
Table 3, and Section S.5 for model details). Consistently lowest estimates are produced by the model of
Atkinson et al. [6] while the largest derive from the polynomial distributed lag (pdl) model of Stölzel et
al. [19]. All the models show a large uncertainty which is reflected in the long 95% confidence interval
(CI) range in Table 3. Inter–comparison of average mortalities derived from different models indicates a
factor of 1.42 to 3.31 differences. This is evident from the following averaged mortalities over all the
modelled results in each scenario which are used for further discussions: 11252(95% CI=2872–19580),
58268(14871–101394), and 952(243–1657) in 2010, 2030–BAU and 2030–BES, respectively.
Total mortality attributable to nanoparticle exposure in 2010 is anticipated to increase to about 5
times in 2030–BAU. Because of much lower ambient ToN concentrations (Table 3) in the 2030–BES,
total mortalities are expected to decrease about 12 and 61 fold compared with 2010 and 2030–BAU
levels, respectively. Our mortality figures should be interpreted as ‘lower estimates’ since these are
based on the corrected ambient ToN concentrations, much lower than those expected at a breathing
height of ~2 m, and are derived from road–vehicles only. We have chosen ambient ToN concentrations
for mortality estimates because these are most relevant to exposure of the entire Delhi population,
including the people living in high rise buildings.
These are the first ever mortality estimates associated with nanoparticle exposure for Delhi. In fact, no
such mortality figures are currently available for a megacity in any part of the world. This also strips the
opportunity to directly compare our estimates with the published literature. Therefore, we have selected
few Delhi specific studies, which have made mortality estimates for other air pollutants, for discussing
the relative health impact of so far overlooked nanoparticles. For instance, a recent study by Gurjar et al
15
[1] estimated mortalities due to exposure of air pollutants for a number of megacities, including Delhi.
They found the total mortality due to nitrogen dioxide (NO2) and total suspended particulate matter
(TSP) exposure as 167 and 11424, respectively, for the year 2005 (i.e. 10 and 680 mortalities per million
people for NO2 and TSP, respectively). For the same year in Delhi, a recent study estimated total
number of cardiopulmonary related deaths between 1700 and 2600 for the people aged over 30 years
due to PM2.5 exposure; these gives an average mortality for this age group as 251 per million people
[44]. We mimicked our mortality estimates to 2005 levels for comparing the mortalities due to other air
pollutants in Delhi. These turned out to be 7943 (i.e. 473 mortality per million people) based on
corrected ambient ToN concentrations in 2005. Normalisation of above mortalities figures provides an
approximately 0.69, 1.88 and 48 times relative mortality impact by vehicle–derived nanoparticles in
Delhi than those by all sources derived TSP, PM2.5 and NO2, respectively. These normalised figures
should not be seen as a general impact of nanoparticle related mortalities compared with other air
pollutants since concentrations of nanoparticles and other air pollutants can vary in different cities
depending on the types of emission sources, geographical and meteorological conditions, and so will be
their relative impact on total mortalities. However, the above discussions clearly indicate that exposure
to nanoparticles leads to a considerable number of excess deaths in Delhi which has never been
accounted before. Furthermore, a countable increase in total mortalities is expected in future years (e.g.
1888 per million people in 2030–BAU), indicating a serious need to control the nanoparticle emissions
at source by considering associated mitigation measures. Total mortalities under the 2030–BES turns out
to be modest (i.e. 31 per million people) as a consequence of considered assumptions, mainly the use of
DPF for diesel vehicles.
4. Synthesis and future research challenges
This study presents the first published preliminary estimates of road vehicles derived ToN
emissions and concentrations in the roadside and ambient environments of megacity Delhi. Total
mortalities due to exposure of ambient ToN concentrations to Delhi inhabitants are also made for the
first time. All these estimates are made under the current and future years in two different scenarios

16
(BAU and BES). The study also identifies predominant source of nanoparticle emissions in the Delhi
traffic fleet, besides suggesting possible measures through the BES for mitigating their impacts on
public health and the environment.
Passenger cars contribute to the largest VKT in all scenarios but their contribution to the ToN
emissions was second to the HDVs which emit more than half of the ToN emissions for only ~5% VKT.
From the 2010 levels, ToN emissions are expected to increase ~4 times in 2030–BAU compared with
~18 times reduction in 2030–BES, mainly due to assumed implementation of emission control
technology (DPF in all diesel vehicles) and greater use of clean fuels (CNG) in future years. Future
developments of public infrastructure (MRTS and BRT) modestly influence the results of our studied
scenarios. This is mainly because of a marginal increase in the vehicles speed due to decongestion on
roads, leading to a negligible change in applied PNEFs and the ToN estimates.
The annual ToN emissions were found to be 1.37, 5.77 and 0.078 (×1025
), and corresponded to ~105,
~106 and ~10
4 # cm
–3 roadside concentrations, in 2010, 2030–BAU and 2030–BES, respectively. The
ambient ToN concentrations were about 23 times smaller than those found at roadside, and
corresponded to about 508, 1888 and 31 mortalities per million people, in 2010, 2030–BAU and 2030–
BES, respectively. Because of a peculiar combination of densely populated inhabitants and high ToN
concentrations, health impacts related to nanoparticle exposure are expected to be much greater in Delhi
than in any developed megacity. Diminishing emissions from the HDVs have appeared as one of the
most imperative mitigation strategies for limiting nanoparticle exposure to Delhi public.
The study also revealed several difficulties to carry out such investigation. First and foremost is the
lack of location specific data (e.g. PNEFs, relative–risks) which are crucial for imputing ToN emissions
and mortalities. This has prompted us to use the word ‘preliminary’ in the title. Although there is no
obvious reason to suspect our results as estimates are justifiable and compare well to infrequent studies
on this topic (see Section 3). Moreover, the study develops novel methodologies to back–calculate
ambient and roadside ToN concentrations, and associated total mortalities. Concepts of these
methodologies are transferable to any developing megacity where measurements of nanoparticles are
17
scarce and health impacts due to nanoparticles exposure have rarely been assessed. Evaluation of
emissions and health impacts in different scenarios also provide a sound basis for the local regulatory
authorities to assess the future ToN emissions and accordingly design mitigation strategies for limiting
their impact on public health and the environment.
5. Acknowledgements
PK greatly acknowledges the receipt of EPSRC grant EP/H026290/1 for supporting this work.
BRG and ASN acknowledge the support received from the Max Planck Partner Group for Megacities
and Global Change, IIT Roorkee, India.
6. Supporting information
Please see Sections S.1–S.5.
7. Literature Cited
1. Gurjar, B. R.; Jain, A.; Sharma, A.; Agarwal, A.; Gupta, P.; Nagpure, A. S.; Lelieveld, J., Human
health risks in megacities due to air pollution. Atmos. Environ. 2010, 44, (36), 4606-4613.
2. Kumar, P.; Robins, A.; Vardoulakis, S.; Britter, R., A review of the characteristics of nanoparticles
in the urban atmosphere and the prospects for developing regulatory control. Atmos. Environ.
2010, 44, 5035-5052.
3. Kumar, P.; Fennell, P.; Hayhurst, A.; Britter, R. E., Street versus rooftop level concentrations of
fine particles in a Cambridge street canyon. Boundary-Layer Meteorol. 2009, 131, 3-18.
4. Kumar, P.; Fennell, P.; Robins, A., Comparison of the behaviour of manufactured and other
airborne nanoparticles and the consequences for prioritising research and regulation activities. J
Nanoparticle Res. 2010, 12, 1523-1530.
5. Kumar, P.; Robins, A.; ApSimon, H., Nanoparticle emissions from biofuelled vehicles - their
charcterstics and impact on the number-based regulation of atmospheric particles. Atmos. Sci. Lett.
2010, 11, 327-331.
6. Atkinson, R. W.; Fuller, G. W.; Anderson, H. R.; Harrison, R. M.; Armstrong, B., Urban Ambient
Particle Metrics and Health: A Time-series Analysis. Epidemiol. 2010, 21, (4), 501-511.
7. Kumar, P.; Britter, R.; Gupta, N., Hydrogen fuel: opportunities and barriers. ASME Journal of
Fuel Cell Sci. Technol. 2009, 6, 0210009.
8. UN, Department of Economics and Social affairs, Population Division. World Urbanization
Prospects : The 2009 Revision. POP/ DB/WUP/Rev.2009) 2010.
9. Keogh, D. U.; Ferreira, L.; Morawska, L., Development of a particle number and particle mass
vehicle emissions inventory for an urban fleet. Environ. Modell. Softw. 2009, 24, (11), 1323-1331.
10. Jalihal, S. A.; Reddy, T. S., CNG: An alternative fuel for public transport. J. Sci. Ind. Res. 2006,
65, 426-431.

18
11. DT, Bus Rapid Transit system in Delhi. A Joint Venture of The Government of National Capital
Territory of Delhi & The Infrastructure Development Finance Company Ltd. 2009.
12. Advani, M.; Tiwari, G., Evaluation of public transport systems: case study of Delhi metro.
Proceeding in START-2005 Conference held at IIT Kharagpur, India 2005, pp. 8.
13. DSA, Delhi Statistical Abstract, Government of NCT Delhi. Directorate of Economics & Statistics
2006-2008.
14. Murty, M. N.; Dhavala, K. K.; Ghosh, M.; Singh, R., Social Cost-Benefit Analysis of Delhi Metro,
Munich Personal RePEc Archive (MPRA). Institute of Economic Growth 2006, MPRA Paper No.
1658.
15. CPCB, Transport fuel quality of the year 2005, 2005. PROBES/78/2000-01, CPCB. 2005.
16. TRIPP, Transportation Research and Injury Prevention Programme: First Delhi BRT corridor a
design summary. A reort by IIT, Delhi 2005, pp. 70.
17. DUD, Chapter-11: Review of Road Network & Transport System. A report for Department of
Urban Development, Goverment of Delhi by EL&FS Ecosmart Limited Consultants 2007, pp. 23.
18. Arasan, V. T.; Vedgiri, P.; Manu, S., Development of speed-flow relationship for heterogeneous
traffic using computer simulation. J. Institution Engineers, India 2009, 89, 3-5.
19. Stölzel, M.; Breitner, S.; Cyrys, J.; Pitz, M.; Wölke, G.; Kreyling, W.; Heinrich, J.; Wichmann, H.
E.; Peters, A., Daily mortality and particulate matter in different size classes in Erfurt, Germany. J.
Exposure Sci. Environ. Epidemiol. 2007, 17, (5), 458-467.
20. DES, Directorate of Economic and social statistics (DES) & Office of Chief Registrar (Births &
Deaths). National Capital Territory of Delhi, Annual Report on Registration of Births and Deaths
for the year 2008. 2008, (27th issue), pp. 131.
21. Lee, H.; Myung, C.-L.; Park, S., Time-resolved particle emission and size distribution
characteristics during dynamic engine operation conditions with ethanol-blended fuels. Fuel 2009,
88, (9), 1680-1686.
22. Monkkonen, P.; Pai, P.; Maynard, A.; Lehtinen, K. E. J.; Hameri, K.; Rechkemmer, P.;
Ramachandran, G.; Kulmala, M., Fine particle number and mass concentration measurements in
urban Indian households. Sci. Total Environ. 2005, 347, (1-3), 131-147.
23. Monkkonen, P.; Koponen, I. K.; Lehtinen, K. E. J.; Hameri, K.; Uma, R.; Kulmala, M.,
Measurements in a highly polluted Asian mega city: observations of aerosol number size
distribution, modal parameters and nucleation events. Atmos. Chem. Phys. 2005, 5, 57-66.
24. Pey, J.; Querol, X.; Alastuey, A.; Rodríguez, S.; Putaud, J. P.; Van Dingenen, R., Source
apportionment of urban fine and ultra fine particle number concentration in a Western
Mediterranean city. Atmos. Environ. 2009, 43, 4407-4415.
25. Paatero, P.; Aalto, P.; Picciotto, S.; Bellander, T.; Castano, G.; Cattani, G.; Cyrys, J.; Koster, M.,
Estimating time series of aerosol particle number concentrations in the five HEAPSS cities on the
basis of measured air pollution and meteorological variables. Atmos. Environ. 2005, 39, (12),
2261-2273.
26. Stanier, C.; Khlystov, A.; Pandis, S., Ambient aerosol size distributions and number
concentrations measured during the Pittsburgh Air Quality Study (PAQS). Atmos. Environ. 2004,
38, 3275-3284.
27. Shi, P. J.; Khan, A. A.; Harrison, R. M., Measurements of ultra fine particle concentration and size
distribution in the urban atmosphere. Sci. Total Environ. 1999, 235, 51-64.

19
28. Jones, A. M.; Harrison, R. M., Estimation of the emission factors of particle number and mass
fractions from traffic at a site where mean vehicle speeds vary over short distances. Atmos.
Environ. 2006, 40, 7125-7137.
29. Gidhagen, L.; Johansson, C.; Langner, J.; Olivares, G., Simulation of NOx and ultrafine particles
in a street canyon in Stockholm, Sweden. Atmos. Environ. 2004, 38, (14), 2029-2044.
30. Jacobson, M. Z.; Kittelson, D. B.; Watts, W. F., Enhanced coagulation due to evaporation and its
effect on nanoparticle evolution. Environ. Sci. Technol. 2005, 39 9486-9492.
31. Dall’Osto, M.; Thorpe, A.; Beddows, D. C. S.; Harrison, R. M.; Barlow, J. F.; Dunbar, T.;
Williams, P. I.; Coe, H., Remarkable dynamics of nanoparticles in the urban atmosphere. Atmos.
Chem. Phys. Discuss. 2010, 10, 1-39.
32. Dahl, A.; Gharibi, A.; Swietlicki, E.; Gudmundsson, A.; Bohgard, M.; Ljungman, A.; Blomqvist,
G.; Gustafsson, M., Traffic-generated emissions of ultrafine particles from pavement-tire
interface. Atmos. Environ. 2006, 40, 1314-1323.
33. Kulmala, M.; Vehkamaki, H.; Petaja, T.; Dal Maso, M.; Lauri, A.; Kerminen, V.-M.; Birmili, W.;
McMurry, P. H., Formation and growth rates of ultrafine particles: a review of observations. J
Aerosol Sci. 2004, 35, 143-176.
34. Ketzel, M.; Berkowicz, R., Modelling the fate of ultrafine particles from exhaust pipe to rural
background: an analysis of time scales for dilution, coagulation and deposition. Atmos. Environ.
2004, 38, (17), 2639-2652.
35. Ketzel, M.; Berkowicz, R., Multi-plume aerosol dynamics and transport model for urban scale
particle pollution. Atmos. Environ. 2005, 39, 3407-3420.
36. Gidhagen, L.; Johansson, C.; Langner, J.; Foltescu, V. L., Urban scale modeling of particle
number concentration in Stockholm. Atmos. Environ. 2005, 39, 1711-1725.
37. Shah, A. P.; Pietropaoli, A. P.; Frasier, L. M.; Speers, D. M.; Chalupa, D. C.; Delehanty, J. M.;
Huang, L. S.; Utell, M. J.; Frampton, M. W., Effect of inhaled carbon ultrafine particles on
reactive hyperemia in healthy human subjects. Environ. Health Perspect. 2008, 116, (3), 375-380.
38. ICRP, ICRP Publication 66: Human respiratory tract model for radiological protection A Report of
a task group of the International Commission on Radiological Protection 1994, (24(1-3)), 1-482.
39. Kumar, P.; Robins, A.; Britter, R., Fast response measurements for the dispersion of nanoparticles
in a vehicle wake and in a street canyon. Atmos. Environ. 2009, 43, 6110-6118.
40. Kaur, S.; Clark, R. D. R.; Walsh, P. T.; Arnold, S. J.; Colvile, R. N.; Nieuwenhuijsen, M. J.,
Exposure visualisation of ultrafine particle counts in a transport microenvironment. Atmos.
Environ. 2006, 40, (2), 386-398.
41. Gouriou, F.; Morin, J.-P.; Weill, M.-E., On-road measurements of particle number concentrations
and size distributions in urban and tunnel environments. Atmos. Environ. 2004, 38, 2831-2840.
42. Kaur, S.; Nieuwenhuijsen, M.; Colvile, R., Personal exposure of street canyon intersection users to
PM2.5, ultrafine particle counts and carbon monoxide in Central London, UK. Atmos. Environ.
2005, 39, (20), 3629-3641.
43. Kumar, P.; Fennell, P.; Langley, D.; Britter, R., Pseudo-simultaneous measurements for the
vertical variation of coarse, fine and ultra fine particles in an urban street canyon. Atmos. Environ.
2008, 42, (18), 4304-4319.
44. Hossain, S.; Khan, A. A.; Bodhke, S.; Kumar, P., Quantitative estimation of cardiopulmonary
mortality due to fine particulate matters: a case study on Delhi city. Indian J Environ. Prot. 2007,
27, (1), 58-64.
20
Table 1. Summary of nanoparticle estimates in various scenarios.
Year Inhabitant
population
(× 106)a
Vehicle
population
(× 106)
Total VKT per
annum (× 1010
)
ToN per
annum
(× 1025
)
Emissions per
person per day
(× 1015
)
2010 22.16 4.74 6.91 1.37 1.70
2030 (BAU) 30.87 25.6 38.56 5.77 5.13
2030 (BES) 30.87 9.26 20.41 0.078 0.007
aDelhi’s population is extrapolated to 2030 from the predictions given by the World Health Organisation
[8] for 2015 (24.16 million), 2020 (26.27 million) and 2025 (28.57 million).
Table 2. Contribution of different vehicle types towards total VKT and ToN emissions.
ToN emissions (× 1023
) VKT contribution (%) ToN emission contributions (%)
VKT (% change from 2010)
ToN emissions (% change from 2010)
All vehicle types
2010 2030 (BAU)
2030 (BES)
2010 2030 (BAU)
2030 (BES)
2010 2030 (BAU)
2030 (BES)
2030 (BAU)
2030 (BES)
2030 (BAU)
2030 (BES)
Cars and Jeeps
34.96 148.99 2.64 41.09 31.30 36.57 25.44 25.8 33.74 325 163 326 -92
2W 0.36 2.22 0.27 34.81 38.41 9.03 0.26 0.38 3.53 516 -52 516 -23
3W 0.02 0.10 0.09 5.32 6.68 11.13 0.02 0.02 1.15 601 39 326 271
Taxi 0.62 1.66 0.25 2.07 1.08 1.7 0.45 0.29 3.14 192 11 170 -60
Buses 7.59 99.14 0.52 7.25 15.70 28.67 5.52 17.17 6.7 1109 5 1206 -93
HDVs 89.13 302.01 4.03 4.26 2.59 4.89 64.85 52.29 51.52 239 239 239 -95
LDVs 4.75 23.42 0.02 5.2 4.24 8.01 3.46 4.06 0.23 355 -18 393 -100
All diesel
135.83 570.10 4.07 46.54 39.35 35.90 98.83 98.71 52.06 372 128 320 -97
All gasoline
1.56 6.99 3.11 42.25 43.69 14.98 1.14 1.21 39.81 477 5 347 99
All CNG 0.04 0.45 0.64 11.21 16.96 49.12 0.03 0.08 8.13 744 1194 878 1277

21
Table 3. Averaged ambient and roadside ToN concentrations in different scenarios; figures in
parenthesis represent standard deviation related lower and upper values of concentrations. Excess deaths
are derived from the ambient ToN concentrations (after losses) and figures in parenthesis are 95% CI
values.
ToN concentrations (×104 # cm
-3) Excess deaths (total mortality)
Ambient Roadside Year
Estimated After losses Estimated
Atkinson et al.
[7] – lag 1
Stolzel et al.
[25] – lag 4
Stolzel et al.
[25] – lag 4
(pdl model)
2010 3.27 [2.08–7.56]
2.81 [1.82–6.17]
74.60 [47.58–172.60]
5091 [1958–8615]
11826 [1175–21930]
16839 [5482–28195]
2030
(BAU)
13.73 [8.76–31.78]
10.44 [7.05–20.05]
311.23 [198.50–720.30]
26362 [10139–44613]
61242 [6084–113561]
87199 [28390–146007]
2030
(BES)
0.19 [0.12–0.43]
0.17 [0.11–0.39]
4.21 [2.69–9.75]
431 [166–729]
1001 [99–1856]
1425 [464–2387]

22
TOC GRAPHIC
Traffic emissions
Atm
osp
he
ric tran
sform
atio
n
1 10 100 1000 10000
D p (nm)
PM2.5
Dp ≤2.5 µm
PM10
Dp ≤10 µm
Ultrafine Particles
Dp ≤100 nm
Nanoparticles
Dp ≤300 nm
PM1
Dp ≤1 µm
0
0.2
0.4
0.6
0.8
1
Measured
Deposition
0.0
0.2
0.4
0.6
0.8
1.0
1 10 100 1000 10000
D p (nm)
PM2.5
Dp ≤2.5 µm
PM2.5
Dp ≤2.5 µm
PM10
Dp ≤10 µm
PM10
Dp ≤10 µm
Ultrafine Particles
Dp ≤100 nm
Nanoparticles
Dp ≤300 nm
PM1
Dp ≤1 µm
PM1
Dp ≤1 µm
0
0.2
0.4
0.6
0.8
1
Measured
Deposition
0.0
0.2
0.4
0.6
0.8
1.0
Alveolar and trancheo-bronchail deposition
Typical particle size distribution
Evolving size distribution
Dep
osi
tio
n
Norm
ali
sed d
istr
ibu
tion (
1/C
tota
l) d
N/d
logD
p
Ex
po
sure
–H
ea
lth
im
pa
cts