Embed Size (px)
Citation preview
ePubWU Institutional Repository
Salim Chahine and Johnathan D. Arthurs and Igor Filatotchev and Robert E.Hoskisson
The effects of venture capital syndicate diversity on earnings managementand performance of IPOs in the US and UK: An institutional perspective
Article (Submitted)(Refereed)
Original Citation:
Chahine, Salim and Arthurs, Johnathan D. and Filatotchev, Igor and Hoskisson, Robert E.
(2012)
The effects of venture capital syndicate diversity on earnings management and performance of IPOsin the US and UK: An institutional perspective.
Journal of Corporate Finance, 18 (1).
pp. 179-192. ISSN 0929-1199
This version is available at: https://epub.wu.ac.at/3486/Available in ePubWU: March 2012
ePubWU, the institutional repository of the WU Vienna University of Economics and Business, isprovided by the University Library and the IT-Services. The aim is to enable open access to thescholarly output of the WU.
This document is the version that has been submitted to a publisher. There are minor differencesbetween this and the publisher version which could however affect a citation.
http://epub.wu.ac.at/
1
The effects of venture capital syndicate diversity on earnings management and performance of IPOs in the US and UK: An institutional perspective
Salim Chahine The Olayan School of Business American University of Beirut Bliss Street, P.O. Box: 11-0236
Beirut, Lebanon Email: [email protected]
Jonathan D. Arthurs College of Business
Washington State University PO Box 644750; Pullman, WA 99164-4750, USA
Tel: 509-335-5628 Email: [email protected]
Igor Filatotchev Cass Business School
City University London, and Vienna University of Economics and Business, Austria
106 Bunhill Row, London EC1Y 8TZ, UK Tel: +44(0)20 7040 5278 Fax: +44(0)20 7040 8328
Email: [email protected]
Robert E. Hoskisson♣ Jones Graduate School of Business
Rice University 6100 Main Street
Houston, Texas 77005-1892, USA Tel: 713-348-2059 Fax: 713-348-6296
E-Mail: [email protected]
Revised September 8 2011
♣ Corresponding author. We are grateful to Donald Siegel (the Guest Editor), the participants of the conference on “Financial and Real Effects of Alternative Investments: Hedge Funds, Venture Capital, Private Equity, Infrastructure, Real Estate, and Sovereign Wealth Funds” (May 20, 2011, New York, USA) and anonymous reviewer for their insightful comments.
2
The effects of venture capital syndicate diversity on earnings management and performance of IPOs in the US and UK: An institutional perspective
ABSTRACT This study examines the extent to which principal-principal agency conflicts within venture capital (VC) syndicates lead to additional principal-agent conflicts in IPO firms in two institutional contexts. Using a matched sample of 274 VC-backed IPOs in the US and the UK, it shows that the diversity of a VC syndicate increases pre-IPO discretionary current accruals, used as a proxy for earnings management, but the impact of such diversity is higher in the US. There is also evidence of higher underpricing and lower aftermarket performance in firms with higher earnings management and VC diversity, and these negative performance effects are also higher in the US. Our findings indicate that local and informal institutions have a significant effect on multiple agency conflicts in IPO firms and performance outcomes. Keywords: earnings management, initial public offerings, venture capital, conflicts of interest, institutions JEL: G14; G32; M41

3
1. Introduction
We have recently witnessed the emergence of an active class of private equity investors,
venture capital (VC) firms, who invest in privately held firms with a successful business model
and take them public. However, the governance roles of VCs and their impact on performance
during and after an initial public offering (IPO) are not well understood. More specifically, there
is very little research on multiple agency problems associated with VC syndicates, e.g. VC
backing of an IPO firm that involves two or more venture capitalists. In this paper we seek to not
only understand how diversity among VCs in a syndicate might influence various performance
indicators at the time of the IPO, but also how these effects may depend on institutional
environments surrounding an IPO.
Prior research grounded within an agency framework documents that issuers frequently
manage their earnings around the IPO (Teoh et al., 1998a; 1998b) since they are motivated to
improve the short-term performance of their firms when approaching the IPO. Accordingly, they
may exercise some accounting discretion when the opportunity is present. This opportunity also
reflects the existence of a principal-agent conflict of interest between the insiders and public
market investors. A number of researchers argue that managers’ discretion is affected by the
presence of VC firms (Cummings et al., 2007). VCs usually screen their portfolio companies and
prepare them to go public. As sophisticated investors, they employ an extensive set of covenants
to protect their investments (Barry et al., 1990), and their active involvement in portfolio
companies is likely to deter earnings management and strengthen the corporate governance of
their firms (Morsfield and Tan, 2006; Brau and Johnson, 2009). However, venture capital firms
are subject to different pressures from their limited partners (Bruton et al., 2010) and, as
syndicate members, they have different objectives which can result in principal-principal

4
conflicts of interests among members of a VC syndicate, and thus adversely affect the quality of
the monitoring of their portfolio companies (Hochberg et al., 2007). Some syndicate members
are likely to encourage earnings management which is consistent with the grandstanding
hypothesis (Gompers, 1996). Although previous studies have explored separate effects of
principal-agent and principal-principal conflicts on performance of VC-backed IPOs, there has
been no analysis of inter-dependencies between these two types of agency relationships and their
combined impact on IPO performance.
In addition, while VC incentives can impact their portfolio firms, recent research is
beginning to recognize the importance of contextual issues in VC investments. More specifically,
the institutional environment in a particular country can have a significant impact on governance
and firm valuation (Banerjee et al., 2011; La Porta et al., 2002). For example, VC investors in the
UK operate within a closer network economy where “relationship” governance is underpinned
by extensive networking and trust considerations that may mitigate opportunism within VC
syndicates. In contrast, although VC syndicates in the US network based on trusted relationships
in an industry rife with potential asymmetric information, there is an incentive to develop more
extensive networks to identify and source new potential venture ideas, which requires more
distant relationship in both industry and geography (Sorenson and Stuart, 2008). Although this
diversity is also found in the UK among VC syndicates, the informal institutional relationship
mechanism we note in the UK VC industry is lacking in the US as syndicate diversity increases.
The informal networks and voluntary behavior codes in the UK capital market have allowed for
the development of a ‘gentlemanly capitalism’ model that characterizes the intermingled
economic, social, and political power centered geographically in the confines of the City of
London (Cain and Hopkins, 1986). This concept is driven by voluntary normative behavior over

5
law, where agents (usually concentrated in a geographically small area that reinforces ties and
social networks) act collectively to regulate affairs and develop norms and codes of practice.
Such social ties and networks might help to overcome conflicts of interest and reduce goal
incongruence among VCs within a networked syndicate (e.g., Jones et al., 1997).
The goal of this paper, therefore, is to bring together these two strands of agency research
and examine the effects of goal incongruence among VC syndicate members on earnings
management and performance of IPO firms. In our analysis of VC syndicates, we focus on the
diversity of VCs within the syndicate. We consider this diversity as a potential source of
principal-principal conflicts. We also examine the simultaneous effects of both types of agency
problems on short- and long-term performance of IPO firms. Finally, our analysis explores how
institutional differences between the US and UK can moderate complex inter-relationships
among VC syndicate diversity, earnings management and IPO performance.
Combining finance research with an institutional perspective, we argue that the impact of
the ‘gentlemanly capitalism’ in the UK and its associated informal institutional context
strengthen the homogeneity of interests among VCs in any syndicate. This reduces the potential
gains from principal-principal conflict and improves collective monitoring of managers within an
IPO firm. As a result, VC-syndicated firms in the UK are less likely to realize any rent from
conflicting principal-principal relationships and thus have weaker opportunities to manage their
earnings at IPO than their US peers. Within this networked environment, the effects of a negative
reputation on future relations for UK VCs will be stronger, and is thus likely to provide a
safeguard against opportunistic behavior (Jones et al., 1997). This issue of reputational effects on
earnings management in the IPO setting has been raised in the literature (e.g., Ball and
Shivakumar, 2008), but has not been theoretically or empirically explored in previous research.

6
Our empirical results strongly support our arguments. More specifically, VC syndicate diversity
is positively associated with earnings management in an IPO firm, and the effect is much
stronger in the U.S. context. Both earnings management and syndicate diversity have a mutually
enforcing and negative impact on IPO performance, and this performance decline is much worse
among U.S. compared to U.K. IPOs.
2. Review of Literature
Although VCs often do not have detailed scientific knowledge about the specific
technology in their portfolio firms, they are able to economize on their selection and monitoring
costs by focusing their investments in certain industries. By specializing in these industries, they
are able to develop a comparative advantage over other investors (Cumming et al., 2007).
Additionally, their experience helps them to rapidly bring these ventures to a successful exit
through an IPO and aids them in generating added value beyond the capital provided (Hsu,
2004). Successful VC experience is valuable in at least two ways. First, this experience leads to
the development of a reputation for quality (Lerner 1994) which allows VCs to command a
premium (i.e. more ownership for less capital extended) from future entrepreneurs (Hsu, 2004)
and makes future investment fund-raising easier (Nahata, 2008). Second, the reputation for
quality also helps VCs to certify the value of ventures (Megginson and Weiss, 1991).
The effects of these governance roles of VCs become particularly important in the
context of potential manipulation of information provided to the public market investors by
managers of IPO firms. Information asymmetry between insiders and outside investors offers
managers the incentives and opportunity to engage in earnings management behavior to increase
the attractiveness of the IPO for potential investors (Teoh et al., 1998a; 1998b). Prior research
suggests that IPO firms often use income-increasing accruals in the most current statements of

7
the prospectus (DuCharme et al., 2001). This type of behavior is a typical manifestation of the
principal-agent problem between IPO insiders and incoming public market investors. Given the
importance of an experience-based reputation in the VC industry, VC firms may play a
monitoring role which constrains opportunistic earnings management at IPO (Morsfield and Tan,
2006).
2.1 Effects of VC Syndicate Diversity on Earnings Management
Because VCs often syndicate their investments, however, the effect of any single VC
firm on earnings management in an IPO may be uncertain (Lerner, 1994). Syndicates include
diverse VC firms investing in a portfolio company. Sorenson and Stuart (2008) provide research
which suggests that, while VCs prefer to syndicate with firms that are like themselves with
similar industry experience, there is growing VC syndicate diversity, for example, due to fashion
for certain types of deals (as an example one can mention the number of IPOs recently focused
on social networks such as LinkedIn and the interest in a potential IPO for Facebook). Sorenson
and Stuart (2008) also note that there is continual need to expand partner networks in order to
gain access to future deals, and VC firms with broader networks obtain better financial returns
(Hochberg et al., 2007). Moreover, Sorenson and Stuart (2008) argue that with large numbers of
diverse members there are less potential reputation effects because it is harder to tell what a
member’s contribution to the network is; “the negative consequences of a social loafer for the
outcome of a team-based initiative fall with the size of the team” (p. 273).
While syndication can help individual VCs to diversify firm-specific risks and benefit
from potential synergies between their areas of expertise in screening and selection of
investments, they may create an additional set of agency conflicts, especially at the IPO stage.
For example, VC syndication leads to a less concentrated ownership and thus lower incentives

8
for individual syndicate members to monitor, thus resulting in potential free-riding behavior
(Cumming, 2006). Diversity within the VC syndicate may also create high co-ordination costs
that make collective monitoring of managerial discretion and timely response to managerial
opportunism difficult. It may also increase costs related to coordination and timing difficulties
regarding decision making (Cumming et al., 2007).
Syndication diversity also creates a situation where the individual interests among the
VCs in the syndicate may diverge (Filatotchev et al., 2006) and where information asymmetries
may result in potential conflicts of interest between lead and other syndicate members
(Cumming, 2006). More specifically, while experienced VCs have a stronger reputation to
protect and therefore are likely to discourage earnings management behavior, younger VC firms
which have a “grandstanding” motive may encourage earnings management (Gompers, 1996).
These VCs may collude with managers and encourage them to manipulate earnings in a run-up
to the IPO. By bringing a venture to IPO sooner, these young VC firms can demonstrate their
ability to deliver results, and they can speed the development of their own reputation. Earnings
management by the IPO firm could help to successfully float the shares and may not have any
deleterious effects for them as long as it did not impact their ability to successfully exit the
investment at the expiration of the lockup period. The more diverse is the syndicate, the more
difficult it would be for a lead VC to restrain potential opportunism not only of IPO insiders, but
also of other syndicate members.
The diversity of VC firms involved in a VC syndicate could therefore lead to principal-
principal conflicts of interest, offering a new opportunity for managers to use earnings
management at the time of IPO. Therefore, we test whether principal-principal conflict of
interest proxied by the diversity of the syndicate is associated with the principal-agent problem

9
proxied by earnings management behavior. We conjecture that in an IPO firm, the extent of EM
is positively associated with VC syndicate diversity.
2.2 Earnings Management and Institutional Effects
Earlier we discussed the importance of the institutional context on governance outcomes.
Even though the UK and the US both maintain a common law tradition (La Porta et al. 2002), the
informal institutional context which arose over time in the UK within the VC industry is
different from the US context. More specifically, Sorenson and Stuart (2001) emphasize the
importance of geographic and industry spaces on information flows and investment decisions
attributed to VC networks. UK venture capitalists are located within close proximity of each
other in the City of London. They normally engage in later stage investments and buy-outs
brokered within their network (Renneboog et al., 2007). Although VC networks are present in
the US, these rather unique characteristics of the UK VC industry tend to create a unity of
interests among VCs and make their intra-network reputation even more important for
subsequent activities.
This investment system underpins the development of an informal type of reputation that
is embedded in social networks with strong ties, such as the City of London. Networks may
provide structural and/or relational safeguards against opportunistic behavior, because of the
impact that a negative reputation can have on future relations. This unity of interests will
therefore reduce the likelihood of significant principal-principal conflict. Without this conflict,
monitoring and oversight should be relatively more effective among VCs in the UK syndicate
compared to the US syndicate, and this should subsequently reduce the likelihood of a principal-
agent problem associated with earnings management behavior. Although reputation effects are
also likely to be prevalent in the US, it will be harder to discern who may be responsible for

10
these effects in a US VC syndicate because the same network effects do not apply given, for
example, great geographic distances among VCs. In this situation, the UK institutional context
can reduce principal-principal conflict and this should reduce principal-agent conflict. Therefore
we hypothesize that the positive association between EM and VC diversity will be stronger in the
US.
2.3 Syndicate Diversity, Earnings Management and IPO performance
Previous research indicates that IPO valuation is positively related to pre-IPO earnings
(Purnanandam and Swaminathan, 2004). As shown by Sloan (1996), a failure to distinguish
between the different properties of the accrual and cash flow components of earnings can result
in stock mispricing. Given the significant information asymmetries between insiders and
potential investors in the IPO process, the former have incentives to manage earnings
opportunistically in the financial statements in the IPO prospectus.1 This appears to be fairly
effective in raising the valuation of the IPO, which is likely to trade at overvalued prices
(DuCharme et al., 2001), and it is also likely to increase IPO underpricing (Zheng and
Stangeland, 2007). However, as accounting accruals eventually reverse, poor-quality firms suffer
from lower performance in the longer-term (Teoh et al., 1998b). Previous research shows that
earnings management negatively affects performance (DuCharme et al., 2001; Teoh et al.,
1998a, 1998b), and those IPOs with greater earnings management in the IPO year are more
likely to delist and to do so sooner (Zhou et al., 2005).
In addition, principal-principal conflict, apart from influencing the principal-agent
problem in earnings managements, may also have a direct negative effect on performance.
Previous research on ‘conflicting voices’ (e.g, Hoskisson et al., 2002) indicates that diversity of
1 Recent evidence in Ball and Shivakumar (2008) indicates that more than 40% of issuers exhibit positive discretionary accruals in the year prior to the IPO.

11
block-holders’ interests and decision-making horizons may lead to goal incongruence among
them which, in turn, may have a negative impact on the firm’s value. In the IPO context, some
VCs have an incentive to establish a longer-term relationship with a prestigious underwriter who
helps them to bring portfolio companies to an IPO. In a diverse VC syndicate, it is likely that
some members would have a long-term relationship with a specific underwriter while others in
the syndicate would not. This creates a conflict of interests among syndicate members: VCs with
a long-term relationship with the bank-underwriter may align their interests with the bank rather
than with other members of the syndicate (Arthurs et al., 2008).
In sum, the two types of agency conflicts may be mutually re-enforcing, and greater
syndicate diversity not only allows for increased potential principal-agent problems through
weaker oversight and monitoring of IPO managers, but it also reduces the ability of the syndicate
to align interests of its members. The two agency problems combined should have a negative
effect on performance. Therefore we conjecture that VC syndication increases the negative
impact of EM on performance. That is, the negative association between EM and performance
will be stronger in IPOs with more diverse VC syndicates.
Finally, as we argued above, national institutions may have a significant moderating
effect on the two aforementioned relationships. The UK network economy can reduce goal
incongruence among VCs and, therefore, reduce the extent of principal-principal conflict.
Moreover, as we previously argue, the impact of VC diversity on earnings management will also
be lower in the UK. Ball and Shivakumar (2008), for example, provide evidence that earnings
management in UK IPOs seems to be lower than in their US counterparts. On the other hand, US
venture capital syndicates will suffer from stronger principal-principal conflict which will only
exacerbate earnings management activity. This is especially true at the time of the IPO because

12
syndicate member have more allegiance to other syndicate members to pursue repeat IPO deals
in the future than to the IPO firm which has become a short-term relationship subject only to a
lockup period (Arthurs et al., 2008). As such, without the informal institutions found in the UK,
the deleterious effects of this behavior will be worse for performance among those IPO firms
listed in the US. Therefore we suggest that the negative association between EM and
performance will be stronger in US IPO firms with more diverse VC syndicates.
3. Data and Methodology
3.1. Data Sources
To construct our sample, we use a multi-stage data collection procedure. We first
compiled the list of all IPOs floated in the US, from Security Data Corporation (SDC) New
Issues database, and in the UK, from the London Stock Exchange New Issues files, from 1996 to
2006. In line with prior research, we excluded de-mergers, corporate spin-offs, equity carve-outs,
reverse take-over vehicles, and special purpose vehicles (SPVs), which do not usually have
private equity backing. We excluded re-admissions and transfers from AIM to the main market,
investment and acquisition vehicles and IPOs of unit and investment trusts that have very
specific governance characteristics. Finally, we selected firms that have been backed by VC
firms prior to their IPO.
In order to capture risk differences between US and UK IPOs and better examine their
performance, we identified matched IPOs based on size (market capitalization) to reduce
possible selection bias (Bruton et al., 2010), date of listing to control for market timing and
conditions (Chahine et al., 2007), and industry membership, using the SIC 3-digit codes controls
for possible clusters by industry in VC activity (Bruton et al., 2010). We concentrated our study
on firms for which we were able to identify all the required accounting information to calculate

13
the quarterly discretionary current accruals immediately prior to IPO date from the Compustat
Global database. This resulted in a final sample of 274 IPOs (matched sample of 137 firms from
each country).
Our variables of interest come from information provided in the aforementioned
databases and IPO listing prospectuses, which contain detailed information on insiders and early
stage investors such as VCs.
3.2. Methodology
Prior research on earnings management concentrates on accounting accruals which
represent the difference between reported earnings and cash flows from operations. Total
accruals include both current and non-current (or long-term) accruals. While the current accruals
would result from adjustments in short-term assets and liabilities of the firm, long-term accruals
relate mainly to depreciation and equity income of unconsolidated subsidiaries which are not
expected to affect taxable income. Managers are thus likely to have more discretion over current
accruals, where they may for example advance the recognition of revenues and delay the
recognition of expenses, than over long-term accruals (Teoh et al., 1998b). Current accruals
include both non-discretionary current accruals determined by firms’ economic fundamentals,
and discretionary current accruals that are unrelated to fundamental factors. Earnings
management has thus been usually proxied by discretionary current accruals (DCA), which are
subject to manager discretion (Teoh et al., 1998a, 1998b). We first examined the association
between pre-IPO discretionary current accruals (DCA-1) and VC diversity. We then examined
the effects of DCA-1 and VC diversity on IPO performance. More specifically, we estimated the
following regression equations:
DCA-1 = α + β1 US dummy + β2 VC Diversity + β3 VC Diversity x US dummy

14
+ β4 VC Syndicate Age + Controls + ε1 (1)
IPO Performance = α + β1 US dummy + β2 DCA-1 + β3 VC Diversity + β4 DCA-1 x VC Diversity
+ β5 DCA-1 x VC Diversity x US dummy + β6 VC Syndicate Age + Controls + ε2 (2)
where IPO Performance is measured by underpricing and the buy-and-hold abnormal return
(BHAR). Underpricing is the first day stock price return, and further empirical tests use the
logarithm of (1+ Underpricing) to control for the skewness of underpricing. The Buy-and-Hold
Abnormal Return (BHAR) is adjusted using the value weighted CRSP index in the US and FTSE
all shares index in the UK. It is calculated over one- and two-year periods following the closing
price of the first day of trading.
In order to calculate DCA-1, we need to generate a benchmark for accruals values in the
absence of manipulation (Ball and Shivakumar, 2008). After generating this benchmark, we
exclude the non-discretionary current accruals usually driven by firm and industry conditions.
The residual represents discretionary accrual that cannot be observed directly from financial
statements. Accordingly, we first calculated the current accruals (CA) as the difference between
the change in noncash current assets and the change in operating current liabilities (Morsfield
and Tan, 2006):
CA = Δ [accounts receivables + inventory +other current assets] –
Δ [accounts payable + tax payable + other current liabilities]. (3)
Second, we used the cross-sectional adaptation of the modified Jones (1991) model,
where current accruals (CA) are regressed on the change in sales in a cross-sectional regression
using all firms with the same two-digit SIC code as the issuer in the same calendar period, but
excluding the issuer and other IPO firms. Consistent with prior research in DuCharme et al.
(2001), we also required that each IPO firm have at least 10 industry-matched firms. To reduce

15
heteroskedasticity in the data, all variables in the regression were scaled by beginning assets for
the quarter. The specific form of the model is as follows:
CAj, t / TAj, t-1 = α0 (1/TAj, t-1) + α1 (Δ Salesj,t / TAj,t-1) + εj,t, (4)
where j∈estimated samples, Δ Sales is the change in sales, and TA is total assets.
We then used the estimates of coefficients in equation (4) to compute the
nondiscretionary current accruals as follows:
NDCAi, t = ∧
α 0 (1/TAi, t-1) + ∧
α 1 [(Δ Salesi, t - Δ TR i, t-1) / TAi, t-1], (5)
where ∧
α 0 is the estimated intercept and ∧
α 1 is the slope coefficient for IPO firm i in quarter t, and
Δ TRi, t is the change in trade receivables in quarter t for issuer i. The increase in trade
receivables is subtracted from the change in sales to control for possible manipulation of credit
sales by the IPO firm. The discretionary current accruals (DCA) are measured as the difference
between CA and nondiscretionary current accruals. This is defined as follows:
DCAi, t = CAi, t / TAi, t-1 – NDCAi, t = CAi, t / TAi, t-1 – NDCAi, t, (6)
where DCAi,t, discretionary current accruals, represents the abnormal accruals for an IPO firm i
in quarter t.
To measure VC diversity per IPO firm, we collected data on affiliation, age, and origin
for each member of the VC syndicate.2 We therefore collected detailed information on the VC
affiliation (e.g., an independent VC, bank-affiliated VC, financial/non-bank affiliated VC,
corporate VC, University endowment/spin-out unit, VC owned by public authorities and VC
owned by a pension fund). We also collected data on VC age range using 6 years as a cut-off
2 Venture Capital firms were identified from the British Venture Capital Association Directory, Pratt’s Guide to Venture Capital Sources, and Venture Capital Report Guide to Venture Capital in the UK, and from the Venture Expert database and Pratt’s Guide to Venture Capital Sources in the US. The data also includes Venture Capital Trusts (VCTs) managed by established venture capital firms.

16
period (e.g., below 6 years, between 6 and 13 years, between 13 and 19 years etc.) and country of
origin (e.g., US, UK, Europe, Japan, Australia & Asia, Canada and the rest of the World). We
then counted the number of sub-groupings in terms of affiliation, age and origin for each member
of the VC syndicates. For example, if a syndicate includes independent, bank-affiliated and
corporate VCs, the affiliation number would be 3. The same procedure was applied to age and
origin sub-groupings. The overall VC diversity is measured as the sum of numbers for the three
types of sub-groupings within a particular VC syndicate, with a lower bound of zero for non-VC-
backed IPOs.3 We also controlled for VC reputation by adding VC Age collected from the SDC
Platinum Venture Expert database. The age of the VC firm is equal to the difference between the
IPO date and the founding date of the VC firm, and we use the cumulative age of the VC firms
for a specific IPO. To address the possibility of the effects of institutional differences between
the UK and US IPOs in the sample, we use a dummy variable equal to 1 for the US and zero
otherwise. To test our country-specific hypotheses we use interactions between the US dummy
and explanatory variables.
Our regression models control for a number of factors used in the earnings management
and IPO literature. In terms of IPO firm characteristics, this includes IPO firm age which is equal
to the number of years between the inception date of the IPO firm and the IPO date. We also
control for IPO firm size, measured as the firm’s market capitalization in US dollars. Old and
large companies which usually have established internal control and accounting systems are
expected to have lower earnings management (DCA-1) and underpricing and higher long-run
BHAR (Lee and Masulis, 2011). We also add a hi-tech dummy that is equal to 1 if the firm was
3 In further robustness tests, we replaced VC diversity by adjusted VC diversity, i.e., VC diversity divided by the total number of VCs within a particular syndicate. The results remained consistent with the present findings of the paper.

17
from the information technology and software sector, zero otherwise.4 Hi-tech firms face greater
information asymmetry and have more growth options, they are more likely to manage earnings
and they are harder to value (Bruton et al., 2010). Since firms with a greater book-to-market
value are likely to be more established, have larger tangible assets, and fewer incentives to
manipulate accounting earnings, we add a Pre-IPO Book to Market ratio, which is expected to
be negatively related to earnings management and underpricing, but positively related to long-
run aftermarket performance. Since debt holders usually provide their borrowers with greater
monitoring, we use Pre-IPO leverage, measured by total debt to total assets ratio, which is
expected to be negatively related to DCA-1 and underpricing, but positively related to long-run
BHAR. Since firms with operational losses are likely to manage earnings (Kothari et al., 2005),
we use a Loss dummy which is equal to 1 if the operating performance (earnings before interest
and taxes) in the last quarter prior to IPO date is negative, zero otherwise. We expect DCA-1 and
underpricing to increase and the long-run BHAR to decrease in firms with pre-IPO losses.
Moreover, there is evidence that firms with higher current assets are more likely to experience
fraud (Persons, 1993). As such, we control for the Current assets to total asset ratio and expect
firms with higher current assets to have more opportunities to use accruals to manage earnings.
We also control for possible monitoring effects of top auditors and prestigious
underwriters. We therefore expect a negative association between DCA-1 and the reputation of
IPO auditor and underwriter (Brau and Johnson, 2009; Chang et al., 2010). We use a Top auditor
dummy that is equal to 1 if the IPO firm hires the audit services of a big 6 reputable auditor, zero
otherwise. We also calculate the cumulative market share over a five-year period prior to the
4 In line with Loughran and Ritter (2004), hi-tech firms as those with the following SIC codes: 3571, 3572, 3575, 3577, 3578 (computer hardware), 3661, 3663, 3669 (communications equipment), 3671, 3672, 3674, 3675, 3677, 3678, 3679 (electronics), 3812 (navigation equipment), 3823, 3825, 3826, 3827, 3829 (measuring and controlling devices), 3841, 3845 (medical instruments), 4812, 4813 (telephone equipment), 4899 (communications services), 7371, 7372, 7373, 7374, 7375, 7378, and 7379 (software).
18
IPO date as a proxy for underwriter reputation (Chahine et al., 2007). Empirical tests use a
dummy variable, Underwriter Reputation, which is equal to one if the underwriter is part of the
top 10 underwriters in the U.K. or the U.S. IPO markets, based on their cumulative market share,
zero otherwise. Empirical investigations also include VC Lead Ownership Power to control for
the potential governance roles played by a powerful lead VC within the VC syndicate. VC Lead
Ownership Power is the pre-IPO ownership of lead VC firm as a fraction of the pre-IPO
ownership of all VC syndicate members.
Finally, we control for the bubble period of rapid growth which can affect valuations
using Bubble dummy, which is equal to 1 if the IPO occurred during the period 1999-2000, zero
otherwise5. We also use a Market Return variable which is equal to the buy-and-hold return of
the market index of the respective country index (Value Weighted CRSP Index in the US, FTSE
all shares in the UK) during the one-month period prior to the IPO date to control for high
market inflows immediately prior to the IPO.
To test our hypotheses we use OLS regression analysis with White heteroskedasticity
consistent standard errors and covariance. However, since we expect that DCA-1 depends on the
level of VC diversity, empirical analysis of the association between IPO performance and both
DCA-1 and VC diversity using OLS estimations may be biased. To address this concern, we
control for the potential endogeneity of DCA-1 using a two-stage least squares (2SLS) regression.
To deal with potential endogeneity, this procedure requires an instrument that is not included in
IPO performance regressions, and which is correlated with the endogenous variable (DCA-1), but
is not correlated with the error term. We use the Current assets to total assets ratio during the
5 Cohen et al. (2008) also document a significant decline in accrual-based earnings management after the passage of the Sarbanes-Oxley Act of 2002. They argue that firms switched from accrual-based to real earnings management methods following SOX. Therefore, we introduced a SOX dummy to account for this important change in the US regulation. However, its effects were insignificant.

19
last quarter prior to IPO date, as an instrument. This variable satisfies the necessary conditions
for a valid instrument for a number of reasons. On the one hand, pre-IPO discretionary current
accruals are expected to be positively related to the current assets to total assets ratio. On the
other hand, the current assets to total assets ratio is not directly related to IPO performance, and
we find low correlation coefficients between the current asset to total assets ratio and both
underpricing and the buy-and-hold abnormal return over a one year period (0.04 and -0.05,
respectively).
4. Empirical Results
4.1. Descriptive Statistics
Table 1 indicates an average underpricing of 25.2%, which is negatively skewed when
compared to its median value of 7.9%, and which is significantly higher in US IPOs (p=1%). In
terms of firm characteristics, an average firm goes public 11.8 years after its inception, and has
an average market capitalization of $364.8 million. The liabilities (current assets) of an average
IPO firm represent 52% (29.7%) of its total assets during the last quarter preceding the IPO date,
and its book value of equity reaches 42% of the market value of equity. Around 41% of studied
IPOs are hi-tech firms, and a small fraction of firms going public experience operating losses
prior to their IPOs (24.5%), but this is significantly higher in the US (p=1%). The average
lockup period is equal to 274 days, and this is significantly longer in UK IPOs (359 days)
compared to 188 days in US IPOs (p=1%). Top auditors are involved in a significant fraction of
our sample (83.9% of IPO firms), and almost half of our IPO sample is underwritten by reputable
investment bankers. An average IPO firm usually goes public following a positive market return
of 1% during 20 days prior to the IPO date.
Table 1 Near Here

20
In terms of VC involvement, the average ownership of Lead VC firms represent 62% of
shares held by VC syndicate members at the IPO date, and this is significantly higher in UK
IPOs (p=1%). An average IPO firm’s syndicate involves 2.54 VC firms, with a cumulative VC
age of 35.6 years. The average VC syndicate diversity is equal to 4.72, and this is mainly the
result of age diversity (1.938), followed by affiliation diversity (1.522) and origin diversity
(1.259). US VC-backed IPOs exhibit higher age and affiliation diversities than UK VC-backed
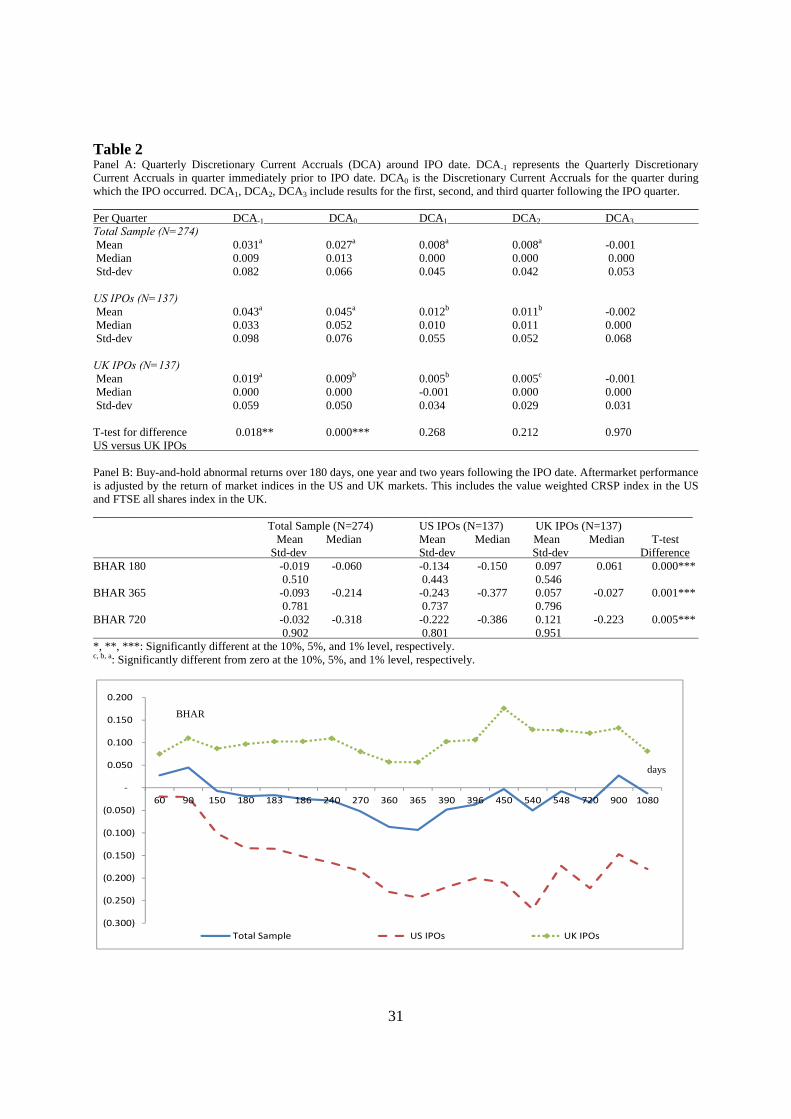
IPOs (at the 5% and 10% levels, respectively). In line with prior research, Panel A in Table 2
indicates that the average discretionary current accruals during the quarter that precedes IPO
(DCA-1) are equal to 3.1% of the total assets, and this is significantly different from zero at the
1% level. Moreover, US IPOs exhibit a significantly higher DCA-1 than UK IPOs (p=5%), which
may reflect the existence of higher principal-agent conflicts. Table 2 also shows an overall
decreasing average DCA following the IPO date (from 2.7% during the IPO quarter to -0.1% at
the end of the 3rd quarter following the IPO date). In line with Chang et al., (2010), the reversed
trend following the IPO suggests that the increase in DCA is not completely attributable to
changes in business operations and working capital, as suggested by Ball and Shivakumar
(2008).
Table 2 Near Here
Panel B in Table 2 examines the long-run aftermarket performance of IPOs. It presents
the buy-and-hold abnormal return of US and UK IPOs adjusted by their respective market
indices. Table 2 indicates a negative BHAR of -1.9% during the 180 days following the IPO date
for the entire sample. BHAR is equal to -9.3% over a one-year period and -3.2% over a two-year
period following the IPO date. This however hides two contrasting trends where US IPOs
significantly underperform their market index (-13.4% on average), whereas UK IPOs

21
significantly outperform their market index (9.7%) during the 180 days following IPOs. The
difference in both trends continues during the one- and two-year periods following the IPO date.
4.2. Earnings Management and VC Diversity
Table 3 includes the regressions for pre-IPO discretionary current accruals as a dependent
variable. Models (1a) to (4a) presents the linear effects of the various proxies of VC diversity
(affiliation, age, origin and the total of three), whereas Models (1b) to (4b) control for the
moderating effects of the US dummy on the association between DCA-1 and the various proxies
for VC diversity.
Table 3 Near Here
Models (1a) to (4a) show a positive association between DCA-1 and US dummy (p=1%),
thus suggesting higher pre-IPO discretionary current accruals in US IPOs. In line with our
predictons, DCA-1 is positively related to the four proxies of VC diversity at the 5% level or
higher. Model (4a), for example, shows that DCA-1 increases by 0.14% for every 10% increase
in VC diversity. This is consistent with our prediction of a positive effect of principal-principal
conflicts of interests on DCA-1.
There is also evidence of a positive and significant moderating effect of the US dummy
on the association between DCA-1 and VC diversity at the 10% level or higher. Model (4b)
indicates that for every 10% increase in VC diversity, DCA-1 is 0.12% higher in UK IPOs, and
the incremental effect of VC diversity is 0.06% higher in US IPOs. This indicates that, compared
to UK IPOs, DCA-1 is more positively related to VC diversity in US IPOs, which is consistent
with our predictions.
In terms of control variables, Models (3a,b) and (4a,b) indicate a negative and significant
association between VC age and DCA-1 (at the 10% level or higher). This suggests that IPOs

22
backed by older VC firms, used as a proxy for reputation, are less likely to face agency problems
related to earnings management. All models in Table 3 show a negative association between
DCA-1 and firm size, top auditor dummy, and lockup period (at the 10% level or higher). Larger
firms, firms with more reputable auditors and with longer commitment of their initial
shareholders are less likely to engage in earnings management. On the contrary, DCA-1 is higher
in IPO firms with pre-IPO operating losses and firms with higher current assets to total assets
ratio (at the 10% level or higher).
4.3. Underpricing, Earnings Management and VC Diversity
Table 4 examines the association between underpricing and both pre-IPO discretionary
current accruals and VC diversity. Models (5a,b) control for both the linear and interaction
effects of DCA-1 and VC diversity on underpricing, and Models (6a,b) control for the moderating
country effect on the association between underpricing and the interaction between DCA-1 and
VC diversity. Models (5a) and (6a) use OLS regressions, whereas Models (5b) and (6b) present
2SLS regressions controlling for the endogenous determination of DCA-1. Specifically, the 2SLS
regressions in Models (5b) and (6b) use the results in Model (4a) as a first stage and the current
assets to total assets ratio as an instrumental variable. In line with our expectations, a Hausman
(1978) specification test indicates potential endogeneity of DCA-1 (at the 1% significance level).
Based on Staiger and Stock (1997), both the high R-square and F-statistic (which is higher than
10 in Model (4a)) confirm the strength and the reliability of the current assets to total assets ratio
as an instrument for pre-IPO discretionary current accruals.
Table 4 Near Here
Both OLS and 2SLS models in Table 4 show a positive and significant association
between underpricing and the US dummy variable (at the 5% level or higher), which suggests

23
that the first day return is significantly higher in US IPOs compared to UK IPOs. Underpricing is
positively related to pre-IPO discretionary current accruals (at the 5% level or higher). It is also
positively related to VC diversity (p=1%). There is also a positive association between
underpricing and the interaction term between DCA-1 and VC diversity (at the 5% level or
higher). In line with our expectations, this suggests that investors are likely to require a higher
risk premium in firms where both principal-agent and principal-principal conflicts of interests are
likely to be higher. The results in Models (6a,b) confirm our expectations and show that,
compared to UK IPOs, the effect of the interaction between DCA-1 and VC diversity on
underpricing is significantly higher in US IPOs. This is consistent with our prediction that
network-based relationships among VC firms in the UK are likely to reduce the extent to which
investors expect agency problems at IPO.
In terms of control variables, all models in Table 4 show results that are consistent with
prior research. Specifically, underpricing is negatively related to the cumulative age of VC
syndicate, firm size, auditor reputation, and lockup period (at the 5% level or higher). Moreover,
underpricing is higher in hi-tech firms, those with a pre-IPO operating loss (p=10%), those
underwritten by more reputable investment bankers, firms that went public during the bubble
period 1999-2000 (p=1%), and following a positive market index return.
4.4. Long-run Aftermarket Performance, Earnings Management and VC Diversity
Table 5 includes regression analysis for buy-and-hold returns over one-year and two-year
periods following the IPO date (BHAR 1Y and BHAR 2Y, respectively). Models (7a,b) examine
both the linear and interaction effects of DCA-1 and VC diversity on BHAR 1Y, and Models
(8a,b) control for the moderating US dummy effect on the association between BHAR 1Y and
the interaction between DCA-1 and VC diversity. Models (7a) and (8a) use OLS regressions,

24
whereas Models (7b) and (8b) present 2SLS regressions controlling for the endogenous
determination of DCA-1. Model (9) includes the 2SLS results for BHAR 2Y. In line with the
regression analysis in Table 4, the 2SLS regressions in Models (7b), (8b), and (9) use the results
in Model (4a) as a first stage.
Table 5 Near Here
Models (7) to (9) show that the long-run aftermarket performance is lower in US IPO
firms over both the first and second year period (at the 5% level or higher). BHAR 1Y and 2Y
are both negatively related to pre-IPO discretionary current accruals (at the 5% level or higher),
which suggests that aftermarket performance is negatively related to earnings management.
BHAR is also negatively related to VC diversity (at the 5% level or higher), consistent with prior
research in Teoh et al. (1998b). In line with our predictions, the long-run performance is
negatively related to the interaction term between DCA-1 and VC diversity (at the 5% level or
higher). A 10% increase in the interaction between DCA-1 and VC diversity reduces BHAR-1 by
4.1% to 4.7%. The long run performance is even lower in US IPOs with higher VC diversity and
earnings management (at the 10% level or higher), in line with our expectations.
5. Further Robustness Tests
5.1. The Endogenous Choice of VC Diversity
An additional empirical concern relates to potential endogeneity of VC backing itself.
Indeed, VC firms may not randomly decide to syndicate portfolio companies, and syndication
decisions may be related to firm-level characteristics such as riskiness, geographic location,
industry clustering, etc. To deal with potential endogeneity of syndication in further robustness
tests, we use a 2SLS regression procedure with appropriate instrument variables6. Specifically,
6 The Hausman (1978) specification test indicates potential endogeneity of VC diversity (at the 5% level or higher). The high R-square and F-statistic (which is higher than 10 in Model (10)) confirm the strength and the reliability of

25
we follow Lee and Masulis (2011) and argue that IPO firms that are located near VC clusters are
more likely to obtain a syndicated investment. We used three dummies for an IPO firm’s location
in California and Massachusetts in the US, and in Greater London in the UK as instruments for
VC syndication. Controlling for the endogeneity of VC diversity, the overall results confirm our
conclusions in Tables 4 to 6, and they indicate that DCA-1 is positively affected by the extent of
VC diversity. Both sources of agency conflicts are likely to increase underpricing and to reduce
the long-run aftermarket performance and this is more significant in US IPOs.
5.2. Post-lockup Long-run Aftermarket Performance, Earnings Management and VC Diversity
Prior research provides empirical evidence showing a drop in stock prices at the end of
the lockup period when more shares become available to the public (Yung and Zender, 2010).
Since UK IPOs tend to have a longer lockup period than US IPOs, UK VCs may provide a
stronger signal of credible commitment to the venture (and a longer investment horizon) (Arthurs
et al., 2008). Accordingly, UK VCs may be less willing to allow short-term behaviors including
earnings management compared to US VCs. This suggests that post-lockup period long-run
performance is negatively related to pre-IPO earnings management with higher VC diversity,
and this is stronger in US VC syndicated IPOs. Further investigations indicate that the post-
lockup market performance (both over 180 days and one year period following the lockup
period) is negatively and significantly related to US dummy, pre-IPO discretionary current
accruals, VC diversity, as well as the interaction between both variables. Moreover, evidence
about a lower market performance in the interaction term of DCA-1 and VC diversity in US IPOs
suggests that US IPOs are more likely to engage in conflicting behavior prior to exiting their
portfolio companies than UK IPOs.
the geographic location dummies as instruments for VC diversity, which supports the use of a second-stage 2SLS regressions

26
6. Conclusion
Prior research indicates an increase in pre-IPO discretionary current accruals, used as a
proxy for earnings management, around the IPO event. In contrast with prior research on the
certification and monitoring roles played by VC firms, we find evidence that a VC syndicate’s
diversity increases the extent of pre-IPO discretionary current accruals. This is consistent with a
moral hazard perspective, where principal-principal conflicts of interest among syndicate
members are likely to amplify principal-agent problems between the IPO firm and public market
investors. We also show that prior results on the association between earnings management and
IPO performance are intensified in firms with higher VC diversity. Specifically, underpricing
increases, and long-run aftermarket performance decreases, in IPO firms with higher earnings
management and VC diversity. Besides showing consistent results between different measures of
performance, we also show that our results are robust to alternative measures for earnings
management while taking into account endogeneity issues. Using a matched sample of US and
UK IPOs, our analysis indicates that our hypothesized relationships between VC diversity,
earnings management and performance are moderated by the US country dummy. This suggests
that the extent of agency conflicts among VC syndicate members investing in IPO firms may
differ based on the institutional setting in which they occur. Examining how institutional
settings create different incentives and disincentives among competing firms (Wan and
Hoskisson, 2003) should be an area of continued future research. Likewise, how institutions
evolve over time and thereby affect and change the nature of conflicts among owners and
managers and between firms would be of importance as well.

27
References
Arthurs, J.D., Hoskisson, R.E., Busenitz, L.W., Johnson, R.A., 2008. Managerial agents watching other agents: Multiple agency conflicts regarding underpricing in IPO firms. Acad. Manage. J. 51, 277-294.
Ball, R., Shivakumar, L., 2008. Earnings quality at initial public offering. J. Account. Econ. 45, 324-349.
Banerjee, S., Dai, L., Shrestha, K. 2011. Cross-country IPOs: What explains differences in underpricing? J. of Corp. Financ. 17, 1289-1305.
Brau, J.C., Johnson, P.M., 2009. Earnings management in IPOs: Post-engagement third-party mitigation or issuer signaling? Advances in Accounting, 25, 125-135.
Bruton, G., Filatotchev, I., Chahine, S., Wright, M., 2010. Ownership concentration and performance of IPO firms: The impact of different types of private equity investors and legal institutions in two European nations. Strat. Manage. J. 31, 491–509.
Cain, P.J., Hopkins, A., 1986. Gentlemanly capitalism and British expansion overseas II: New imperialism, 1850-1945, Econ. Hist. Rev. 40, 1-26.
Chahine, S., Filatotchev, I., Wright, M., 2007. Venture capitalists, business angels, and performance of entrepreneurial IPOs in the UK and France, J. Bus., Financ. Account. 34, 505-528.
Chang, S-C, Chung, T-Y, Lin, W-C, 2010. Underwriter reputation, earnings management and the long-run performance of Initial Public Offerings. Accounting and Finance 50, 53-78.
Cohen, D.A., Dey, A., Lys, T.Z., 2008. Real and accrual-based earnings management in the pre- and post-Sarbanes Oxley periods, Account. Rev. 83, 757-787.
Cumming, D., 2006. The Determinants of Venture Capital Portfolio Size: Empirical Evidence. J. of Bus. 79, 1083–126.
Cumming, D., Siegel, D.S., Wright, M., 2007. Private equity, leveraged buy-outs and governance. J. of Corp. Financ. 13, 439-460.
DuCharme, L.L., Malatesta, P.H., Sefcik, S.E., 2001. Earnings management IPO valuation and subsequent performance. J. Account. Audit. Financ. 16, 369-396.
Filatotchev, I., Wright, M., Arberk, M., 2006. Venture capitalists, syndication and governance in Initial Public Offerings. Small Bus. Econ. J. 26, 337-350.
Gompers, P., 1996. Grandstanding in the venture capital industry. J. Financ. Econ. 42, 133-156,
Hausman, J.A., 1978. Specification tests in econometrics, Econometrica 46, 1251–71.

28
Hochberg, Y., Ljungqvist, A., Lu, Y., 2007. Whom you know matters: Venture capital networks and investment performance. J. Finance 62, 251-301.
Hoskisson, R.E., Hitt, M.A., Johnson, R.A., Grossman, W., 2002. Conflicting voices: the effects of institutional ownership heterogeneity and internal governance on corporate innovation strategies, Acad. Manage. J. 45, 697-716.
Hsu, D.H., 2004. What do entrepreneurs pay for venture capital? J. Finance 59, 1805-1844.
Jones, C., Hesterly, W.S., Borgatti, S.P., 1997. A general theory of network governance: Exchange conditions and social mechanisms. Acad. Manage. Rev. 22, 911–945.
Jones, J., 1991. Earnings management during import relief investigations, J. Account. Res. 29, 193-228.
Kothari, S.P., Leone, A.J., Wasley, C.E., 2005. Performance matched discretionary accrual measures. Journal of Accounting and Economics 39, 163–197.
La Porta, R., Lopez-de Silanes, F., Shleifer, A., Vishny, R., 2002. Investor protection and corporate valuation. J. Finance 57, 1147-1170.
Lee, G., Masulis, R. 2011. Do more reputable financial institutions reduce earnings management by IPO issuers? J. Corp. Finance. 17(4): 483-501.
Lerner, J., 1994. The syndication of venture capital investments. Financ. Manage. 23, 16-27.
Loughran, T., and Ritter, J.R., 2004. Why has IPO underpricing increased over time? Fin. Manag. 33, 5-37.
Megginson, W., Weiss, K., 1991. Venture capitalist certification in initial public offerings. J. Finance 46, 879-903.
Morsfield, S.G., Tan, C.E.L., 2006. Do venture capitalists influence the decision to manage earnings in initial public offerings? Account. Rev. 81, 1119-1150.
Nahata, R., 2008. Venture capital reputation and investment performance. J. Financ. Econ. 90, 127-151.
Persons, O.S., 1993. The relation between the new corporate governance rules and the likelihood of financial statement fraud. Rev. Account. Financ. 4, 125 -148.
Purnanandam, A.K., Swaminathan, B., 2004. Are IPOs really underpriced? Rev. Financ. Stud. 17, 811-848.
Renneboog, L.D.R., Simons, T., Wright, M., 2007. Why do public firms go private in the UK?, J. Corp. Financ. 13, 591-628.
Sloan, R.G., 1996. Do stock prices fully reflect information in accruals and cash flows about future earnings? Account. Rev. 71, 289-315.

29
Sorenson, O., Stuart, T.E. 2001. Syndication networks and the spatial distribution of venture capital investments. American J. of Sociology 106, 1546-1588.
Sorenson, O., Stuart, T.E. 2008. Bringing the context back in: Settings and the search for syndicate partners in venture capital investment networks. Admin. Sci. Quart. 53, 266-294.
Staiger, D., Stock, J.H., 1997. Instrumental variables regression with weak instruments, Econometrica 65, 557–586.
Teoh, S.H., Wong, T.J., Rao, G.R., 1998a. Are accruals during initial public offerings opportunistic? Rev. Account Stud. 3, 175-208.
Teoh, S.H., Welch, I., Wong, T.J., 1998b. Earnings management and the long-run underperformance of initial public offerings, J. Finance 53, 1935-1974.
Wan, W.P., Hoskisson, R.E., 2003. Home country environments, corporate diversification strategies and firm performance. Acad. Manage. J. 46, 27-45.
White, H.S., 1980. A Heteroskedastic-consistent Covariance Matrix Estimator and a Direct Test of Heteroskedasticity. Econometrica 48, 817-838.
Zheng, S.X., Stangeland, D.A., 2007. IPO underpricing, firm quality, and analyst forecasts. Financ. Manage. 36, 45-64.
Zhou, J., Zhang, L., Li, J., 2005. Earnings management and delisting risk: The case of IPO firms. Working paper, University of Rochester.
Yung, C., Zender, J.F. 2010. Moral Hazard, asymmetric information and IPO lockups. J. of Corp. Financ. 16, 320-332.

30
Table 1
Table 2 presents descriptive statistics in mean, median, and standard deviation for the entire sample as well as both US and UK IPOs. ________________________________________________________________________________________________________ Total Sample (N=274) US IPOs (N=137) UK IPOs (N=137) Mean Median Mean Median Mean Median T-test Std-dev Std-dev Std-dev Difference Underpricing 0.252 0.079 0.401 0.181 0.103 0.033 0.000*** 0.505 0.594 0.338 IPO Firm Characteristics IPO Firm Age 11.847 7.000 9.584 6.000 14.109 7.000 0.029** 17.180 8.452 22.599 Market Capitalization (in $mil) 364.839 183.069 389.576 185.957 340.102 182.422 0.512 622.967 651.341 594.601 Hi-tech dummy 0.409 0.000 0.394 0.000 0.423 0.000 0.625 0.493 0.490 0.496 Pre-IPO Book-to-Market ratio 0.420 0.257 0.334 0.237 0.507 0.299 0.032** 0.668 0.629 0.697 Pre-IPO Leverage 0.524 0.466 0.652 0.618 0.396 0.357 0.000*** 0.377 0.408 0.294 Loss dummy 0.245 0.000 0.358 0.000 0.131 0.000 0.000*** 0.431 0.481 0.339 Current Assets-to-Total Assets 0.297 0.238 0.275 0.216 0.318 0.268 0.099* 0.218 0.214 0.221 Lockup Period (in days) 273.617 365.000 188.438 180.000 358.796 365.000 0.000*** 112.264 91.229 48.566 Top Auditor dummy 0.839 1.000 0.869 1.000 0.810 1.000 0.189 0.368 0.339 0.394 Underwriter Reputation 0.478 0.000 0.453 0.000 0.504 1.000 0.399 0.500 0.500 0.502 Market Conditions Bubble dummy 0.434 0.000 0.467 0.000 0.401 0.000 0.274 0.497 0.501 0.492 Market Return 0.010 0.009 0.020 0.018 0.000 0.004 0.002*** 0.052 0.061 0.039 VC Firms Involvement Lead VC Ownership Power 0.619 0.581 0.545 0.476 0.694 0.800 0.000*** 0.351 0.368 0.317 VC Syndicate 2.544 2.000 2.737 2.000 2.350 2.000 0.083* 1.846 1.820 1.857 VC Syndicate Age 35.577 21.000 34.628 21.000 36.526 21.000 0.719 43.469 39.792 46.987 VC Diversity 4.719 4.000 4.934 4.000 4.504 3.000 0.087* 2.084 2.084 2.069 VC Affiliation Diversity 1.522 1.000 1.599 1.000 1.445 1.000 0.098* 0.766 0.790 0.737 VC Age Diversity 1.938 2.000 2.073 2.000 1.803 1.000 0.046** 1.119 1.116 1.110 VC Origin Diversity 1.259 1.000 1.263 1.000 1.255 1.000 0.904 0.501 0.504 0.500 *, **, ***: Significantly different at the 10%, 5%, and 1% level, respectively.
31
Table 2 Panel A: Quarterly Discretionary Current Accruals (DCA) around IPO date. DCA-1 represents the Quarterly Discretionary Current Accruals in quarter immediately prior to IPO date. DCA0 is the Discretionary Current Accruals for the quarter during which the IPO occurred. DCA1, DCA2, DCA3 include results for the first, second, and third quarter following the IPO quarter. ________________________________________________________________________________________________________ Per Quarter DCA-1 DCA0 DCA1 DCA2 DCA3 Total Sample (N=274) Mean 0.031a 0.027a 0.008a 0.008a -0.001 Median 0.009 0.013 0.000 0.000 0.000 Std-dev 0.082 0.066 0.045 0.042 0.053 US IPOs (N=137) Mean 0.043a 0.045a 0.012b 0.011b -0.002 Median 0.033 0.052 0.010 0.011 0.000 Std-dev 0.098 0.076 0.055 0.052 0.068 UK IPOs (N=137) Mean 0.019a 0.009b 0.005b 0.005c -0.001 Median 0.000 0.000 -0.001 0.000 0.000 Std-dev 0.059 0.050 0.034 0.029 0.031 T-test for difference 0.018** 0.000*** 0.268 0.212 0.970 US versus UK IPOs Panel B: Buy-and-hold abnormal returns over 180 days, one year and two years following the IPO date. Aftermarket performance is adjusted by the return of market indices in the US and UK markets. This includes the value weighted CRSP index in the US and FTSE all shares index in the UK. _______________________________________________________________________________________________________ Total Sample (N=274) US IPOs (N=137) UK IPOs (N=137) Mean Median Mean Median Mean Median T-test Std-dev Std-dev Std-dev Difference BHAR 180 -0.019 -0.060 -0.134 -0.150 0.097 0.061 0.000*** 0.510 0.443 0.546 BHAR 365 -0.093 -0.214 -0.243 -0.377 0.057 -0.027 0.001*** 0.781 0.737 0.796 BHAR 720 -0.032 -0.318 -0.222 -0.386 0.121 -0.223 0.005*** 0.902 0.801 0.951 *, **, ***: Significantly different at the 10%, 5%, and 1% level, respectively. c, b, a: Significantly different from zero at the 10%, 5%, and 1% level, respectively.
(0.300)
(0.250)
(0.200)
(0.150)
(0.100)
(0.050)
‐
0.050
0.100
0.150
0.200
60 90 150 180 183 186 240 270 360 365 390 396 450 540 548 720 900 1080
Total Sample US IPOs UK IPOs
days
BHAR

32
Table 3 Table 3 presents the least squares regressions results for Discretionary Current Accruals in the last quarter prior to the IPO date. Models (1a) to (4a) examine the linear association between pre-IPO discretionary current accruals (DCA-1) and the various types of VC diversity: VC Affiliation Diversity, VC Age Diversity, VC Origin Diversity, and the calculated VC Diversity including all types of diversities. Models (1b) to (4b) examine the differential effect of the country dummy in the relationship between pre-IPO discretionary current accruals (DCA-1) and the various types of VC diversity: VC Affiliation Diversity, VC Age Diversity, VC Origin Diversity, and the calculated VC Diversity including all types of diversities. *, **, *** represent statistical significance at the 10%, 5%, and 1% level respectively, for a two-tailed t tests. All tests use White heteroskedasticity robust standard errors. ________________________________________________________________________________________________________________________________________ (1a) (2a) (3a) (4a) (1b) (2b) (3b) OLS OLS OLS OLS OLS OLS OLSConstant -0.005 0.014 -0.006 -0.024 0.007 0.016 -0.002 -0.015 0.029 0.030 0.027 0.032 0.029 0.030 0.028 0.031 US dummy 0.026*** 0.028*** 0.029*** 0.026*** 0.016** 0.023*** 0.021* 0.018*** 0.009 0.010 0.009 0.009 0.007 0.008 0.012 0.007 VC Affiliation Diversity 0.030*** 0.022*** 0.007 0.008 VC Affiliation Diversity x US dummy 0.015** 0.007 VC Age Diversity 0.014** 0.013** 0.006 0.007 VC Age Diversity x US dummy 0.004* 0.003 VC Origin Diversity 0.042*** 0.038*** 0.009 0.010VC Origin Diversity x US dummy 0.012* 0.007VC Diversity 0.014*** 0.003 VC Diversity x US dummy Lead VC Ownership Power -0.010 -0.014 -0.021 0.000 -0.010 -0.014 -0.021 0.000 0.017 0.020 0.016 0.019 0.017 0.020 0.016 0.019 VC Syndicate Age -0.000 -0.000 -0.000** -0.000* -0.000 -0.000 -0.000** -0.000* 0.000 0.000 0.000 0.000 0.000 0.000 0.000 0.000 IPO Firm Age 0.000 0.000 0.000 0.000 0.000 0.000 0.000 0.000 0.000 0.000 0.000 0.000 0.000 0.000 0.000 0.000 Log(Market Capitalization) -0.008** -0.007** -0.008** -0.008** -0.007** -0.007** -0.008** -0.008** 0.003 0.003 0.003 0.003 0.003 0.003 0.003 0.003 Hi-tech dummy 0.002 0.002 0.004 0.003 0.002 0.002 0.004 0.003 0.008 0.009 0.008 0.008 0.008 0.009 0.008 0.008 Pre-IPO Book-to-Market -0.005 -0.007 -0.011 -0.006 -0.005 -0.006 -0.011 -0.006

33
0.006 0.006 0.006 0.006 0.006 0.006 0.006 0.006 Pre-IPO Leverage 0.006 0.003 0.002 0.006 0.006 0.003 0.002 0.006 0.013 0.013 0.013 0.013 0.013 0.013 0.013 0.013 Loss dummy 0.010 0.011 0.013* 0.013* 0.010 0.011 0.013* 0.013* 0.011 0.012 0.007 0.007 0.012 0.012 0.007 0.008 Current Assets-to-Total Assets 0.138*** 0.148*** 0.142*** 0.134*** 0.132*** 0.147*** 0.140*** 0.129*** 0.020 0.020 0.020 0.020 0.020 0.021 0.021 0.021 Lock-up Period -0.000* -0.000* -0.000* -0.000* -0.000* -0.000* -0.000* -0.000* 0.000 0.000 0.000 0.000 0.000 0.000 0.000 0.000 Top Auditor dummy -0.019* -0.021* -0.013* -0.016* -0.018* -0.021* -0.013* -0.016* 0.011 0.012 0.008 0.009 0.010 0.012 0.008 0.009 Underwriter Reputation -0.001 -0.004 -0.000 -0.000 -0.001 -0.004 -0.000 -0.001 0.009 0.009 0.009 0.009 0.009 0.009 0.009 0.009 Bubble dummy -0.008 -0.006 -0.010 -0.009 -0.009 -0.007 -0.010 -0.010 0.008 0.008 0.008 0.008 0.008 0.008 0.008 0.008 Adjusted R-squared 0.334 0.304 0.335 0.339 0.335 0.301 0.332 0.338 F-statistic 11.836 11.194 11.156 11.342 11.161 10.835 10.649 10.731 Prob(F-statistic) 0.000 0.000 0.000 0.000 0.000 0.000 0.000 0.000 Number of Observations 274 274 274 274 274 274 274

34
Table 4 Table 4 presents the OLS and 2SLS regressions results for underpricing on Pre-IPO discretionary current accruals (DCA-1) and VC diversity. Models (5a) and (5b) control for the interaction effect between both DCA-1 and VC diversity, whereas Models (6a) and (6b) control for the country dummy in affecting the relationship between underpricing and the interaction term between DCA-1 and VC diversity. *, **, *** represent statistical significance at the 10%, 5%, and 1% level respectively, for a two-tailed t tests. All tests use White heteroskedasticity robust standard errors. ________________________________________________________________________________________________________ Log(1+Underpricing) Log(1+Underpricing) (5a) (6a) (5b) (6b) OLS OLS 2SLS 2SLS Constant -0.213* -0.185 -0.287** -0.209 0.123 0.128 0.132 0.137 US dummy 0.147*** 0.111*** 0.200*** 0.104** 0.034 0.033 0.036 0.045 DCA-1 0.654*** 0.461** 0.619*** 0.478** 0.233 0.222 0.228 0.214 VC Diversity 0.052*** 0.053*** 0.064*** 0.062*** 0.015 0.015 0.019 0.020 DCA-1 x VC Diversity 0.118** 0.105** 0.115** 0.100** 0.048 0.049 0.048 0.045 DCA-1 x VC Diversity x US dummy 0.164** 0.158*** 0.083 0.058 Lead VC Ownership Power 0.019 0.017 0.025 0.018 0.053 0.053 0.053 0.053 VC Syndicate Age -0.001** -0.001* -0.001* -0.001** 0.000 0.000 0.000 0.000 IPO Firm Age -0.000 -0.000 -0.001 -0.000 0.001 0.001 0.001 0.001 Log(Market Capitalization) -0.021** -0.022** -0.022** -0.020** 0.010 0.010 0.010 0.010 Hi-tech dummy 0.061* 0.060* 0.065** 0.064** 0.031 0.031 0.032 0.031 Pre-IPO Book-to-Market 0.011 0.009 0.004 0.004 0.022 0.021 0.022 0.021 Pre-IPO Leverage -0.017 -0.014 -0.010 -0.006 0.056 0.057 0.058 0.059 Loss dummy 0.040 0.039 0.061* 0.057* 0.035 0.035 0.036 0.034 Lock-up Period -0.001*** -0.001*** -0.001*** -0.001*** 0.000 0.000 0.000 0.000 Top Auditor dummy -0.096** -0.102** -0.103** -0.108** 0.043 0.044 0.042 0.044 Underwriter Reputation 0.047* 0.051* 0.047* 0.049* 0.027 0.029 0.027 0.029 Bubble dummy 0.093*** 0.081*** 0.085*** 0.075*** 0.027 0.026 0.027 0.027 Market Return 0.640** 0.704** 0.601** 0.698** 0.275 0.278 0.281 0.279 Adjusted R-squared 0.539 0.549 0.528 0.546 F-statistic 19.742 19.483 18.936 19.231 Prob(F-statistic) 0.000 0.000 0.000 0.000 Number of Observations 274 274 274 274 The first-stage regression in Model (4a) in Table 4 provides the fitted value used as instrument in the second-stage regressions in Models (5b) and (6b).

35
Table 5 Table 5 presents the OLS and 2SLS regressions results for the long-run aftermarket performance on Pre-IPO discretionary current accruals (DCA-1) and VC diversity. Models (7a) and (8b) control for the interaction effect between both DCA-1 and VC diversity, whereas Models (8a), (8b), and (9) control for the country dummy in affecting the relationship between long-run aftermarket performance and the interaction term between DCA-1 and VC diversity. Long-run aftermarket performance is measured using the Buy-and-Hold Abnormal Return over a One year and Two year periods (Models (7&8) and Model (9), respectively). *, **, *** represent statistical significance at the 10%, 5%, and 1% level respectively, for a two-tailed t tests. All tests use White heteroskedasticity robust standard errors. ________________________________________________________________________________________________________ BHAR 1Y BHAR 1Y BHAR 1Y BHAR 1Y BHAR 2Y OLS OLS 2SLS 2SLS 2SLS (7a) (8a) (7b) (8b) (9) Constant 0.321** 0.338** 0.536*** 0.432*** 0.935*** 0.151 0.151 0.153 0.160 0.234 US dummy -0.336*** -0.285*** -0.302*** -0.257** -0.305** 0.092 0.100 0.084 0.103 0.144 DCA-1 -1.105*** -0.797** -1.067** -0.727** -2.741*** 0.388 0.389 0.450 0.337 0.827 VC Diversity -0.048*** -0.037** -0.051*** -0.048*** -0.107** 0.016 0.016 0.016 0.015 0.039 DCA-1 x VC Diversity -0.473*** -0.447*** -0.455*** -0.411** -0.229** 0.178 0.166 0.141 0.190 0.104 DCA-1 x VC Diversity x US dummy -0.101*** -0.109*** -0.084* 0.038 0.040 0.049 Lead VC Ownership Power 0.153 0.159 0.153 0.158 0.306* 0.157 0.157 0.157 0.154 0.169 VC Syndicate Age 0.001 0.001 0.001* 0.001* 0.001* 0.001 0.001 0.001 0.001 0.001 IPO Firm Age -0.001 -0.001 -0.001 -0.001 -0.003 0.001 0.001 0.001 0.002 0.003 Log(Market Capitalization) 0.056* 0.055* 0.056* 0.072** 0.063* 0.032 0.032 0.032 0.034 0.036 Hi-tech dummy -0.026 -0.025 -0.026 -0.030 -0.060 0.089 0.089 0.089 0.090 0.104 Pre-IPO Book-to-Market -0.030 -0.031 -0.030 -0.010 -0.045 0.045 0.044 0.045 0.047 0.086 Pre-IPO Leverage -0.069 -0.071 -0.069 -0.048 -0.093 0.108 0.109 0.108 0.107 0.176 Loss dummy -0.176** -0.185** -0.176** -0.213** -0.091 0.087 0.088 0.087 0.088 0.144 Top Auditor dummy -0.276* -0.279* -0.276* -0.257* 0.224 0.151 0.151 0.151 0.155 0.190 Underwriter Reputation 0.133* 0.136* 0.133* 0.133* 0.158* 0.079 0.080 0.079 0.079 0.094 Bubble dummy -0.266*** -0.273*** -0.266*** -0.246*** -0.335*** 0.089 0.090 0.089 0.091 0.109 Adjusted R-squared 0.310 0.309 0.310 0.283 0.276 F-statistic 9.195 8.623 9.195 7.740 6.274 Prob(F-statistic) 0.000 0.000 0.000 0.000 0.000 Number of Observations 274 274 274 274 222 The first-stage regression in Model (4a) in Table 4 provides the fitted value used as instrument in the second-stage regressions in Models (9), (10), and (11).