Embed Size (px)
Citation preview

Clinimetrics and functional outcomeone year after traumatic brain injury
Bianca van Baalen

ISBN: 978-90-8891-073-9Drawing cover: Tom Franken Design / Layout: FraaieDingen, Bergen op Zoom, The Netherlands (Brigitte Wosyka)Printing: Proefschriftmaken.nl, Oisterwijk, The Netherlands
Clinimetrics and functional outcomeone year after traumatic brain injury
Klinimetrie en functionele uitkomstéén jaar na traumatisch hersenletsel
PROEFSCHRIFT
ter verkrijging van de graad van doctor aan de Erasmus Universiteit Rotterdam
op gezag van de rector magnificus
Prof.dr. S.W.J. Lambertsen volgens besluit van het College voor Promoties.
De openbare verdediging zal plaatsvinden op
11 december 2008 om 09.00 uurdoor
Johanna Thomas Maria van Baalengeboren te Bergen op Zoom

PromotorProf.dr. H.J. Stam
Overige ledenProf.dr. J. Passchier Prof.dr. G.J. LankhorstProf.dr. C.M.F. Dirven
Contents
1. General introduction 7
2. Traumatic brain injury: classification of initial severity and determination of 13 functional outcome van Baalen B, Odding E, Maas AIR, Ribbers GM, Bergen MP, Stam HJ. Disabil Rehabil 2003;25(1):9-18.
3. Reliability and sensitivity to change of measurement instruments used in a 33 traumatic brain injury population van Baalen B, Odding E, van Woensel MPC, van Kessel MA, Roebroeck ME, Stam HJ. Clin Rehabil 2006;20:686-700.
4. Assessment of patient’s functioning: correspondence traumatic brain 53 injury patients and their significant others van Baalen B, Odding E, Stam HJ.
5. Selection bias in research on rehabilitation after moderate or severe 67 traumatic brain injury van Baalen B, Odding E, Stam HJ. Submitted for publication.
6. Cognitive status at discharge from the hospital determines discharge 85 destination in traumatic brain injury patients van Baalen B, Odding E, Stam HJ. Brain Inj 2008;22(1):25-32.
7. Participation after a traumatic brain injury is negatively associated with a 101 passive coping style of the caregiver van Baalen B, Ribbers GM, Medema-Meulenpas D, Pas MS, Odding E, Stam HJ. Brain Inj 2007;21(9):925-931.
8. Functional prognosis and quality of life in traumatic brain injury (TBI) patients 117 van Baalen B, Odding E, Stam HJ. Submitted for publication.
9. General discussion 139 Summary 151 Samenvatting 157 Appendix 165 Dankwoord 171 About the author 175


1
Bianca van Baalen
General introduction
8
Chapter 1
The Netherlands has a population of approximately 16.5 million people. It is estimated that in the Netherlands each year 12,500 persons (that is 79 people per 100,000 inhabitants) are admitted to the hospital because of a traumatic brain injury.1 Traumatic brain injury is defined as an injury to the brain caused by an external mechanical force. Nowadays traumatic brain injury is the number one cause of mortality and disability in young adults in modern Western societies.2 The group of patients with a moderate or severe traumatic brain injury numbers 3200 to 4000 (that is an incidence of 20 to 25 per 100,000 persons per year); it more often affects younger age groups and there are more male than female patients.3,4 In 2005 in the Netherlands, about 700 adults with traumatic brain injury were admitted for inpatient rehabilitation, whilst nearly 3000 adult patients with traumatic brain injury (24%) received outpatient rehabilitation.5
In traumatic brain injury, both spontaneous recovery to pre-traumatic status as well as serious long-lasting disability can occur.5-11 Motor problems or dependency in self-care and mobility, although important for most people early after injury and for a few on the longer term, are not typically the most disabling long-term consequences of traumatic brain injury. Traumatic brain injury affects behaviour and disability differently than, for instance, physical or mental health impairments.12,13
Rehabilitation outcomes are highly dependent on the level of severity of the patient’s disability on admission.12 Because factors outside the injury and even outside the person affect the long-term outcome, return to work and/or social activities are correlated with pre-injury employment and/or social activities.14,15
An important issue in traumatic brain injury rehabilitation is the selection of outcome measurement instruments.16 These instruments should incorporate (basic) activities of daily living, cognitive, behavioural and emotional functioning, as well as employment activities. Rehabilitation specialists perceive that, with very few exceptions, the existing outcome monitoring systems in rehabilitation care are technically inadequate to evaluate traumatic brain injury patients. Most of the neurological and neuropsychological tests currently used do not reflect the improvement of functional outcome that can be achieved in patients with a traumatic brain injury.17,18 Because some patients suffer from major cognitive disabilities, outcome measurement tools must be suitable for use in interviewing the patients and their caregivers or ‘significant others’. Measurement tools, which may reflect the consequences of traumatic brain injury for daily life, have not yet been evaluated for their sensitivity to change of function.In the USA, the American Congress of Rehabilitation Medicine has called upon the profession to reach a consensus on the establishment of a national information system for acute and subacute traumatic brain injury rehabilitation services.19 This has led to the “Traumatic brain injury model systems national database”. In the Netherlands there is no consensus on the most suitable outcome measurement instruments for traumatic brain injury, and we are still far away from developing a structured database on this subject.
9
General introduction
Patients and their relatives, as well as rehabilitation professionals, have many questions about prognosis. However, the available information on the determinants of functional outcome is limited by the above-mentioned problems related to outcome measurement instruments, and has mainly focused on outcome at 6 or 12 months post-injury.13,18,20-23 The severity of impairments, limitations in activities, and restrictions in participation are major factors in rehabilitation care, because the final prognosis is mainly dependent on the severity of impairments, limitations and restrictions at the start of the rehabilitation process.13 Furthermore, patients are appointed to different care levels of rehabilitation on the basis of this severity. If determinants of functional prognosis could be identified, this would enable rehabilitation professionals to develop optimal treatment strategies, determine gross functional outcome, and make prognostications for specific functions and specific outcomes.24
The Rotterdam Traumatic Brain Injury Study is a prospective follow-up study on the outcome measurement instruments and determinants of functional outcome among adults who sustained a traumatic brain injury, and was embedded within the research program entitled ‘Functional prognostication and disability study on neurological disorders’ (FuPro). The FuPro research program studied four neurological disorders, multiple sclerosis (MS), stroke, amyotrophic lateral sclerosis (ALS), and traumatic brain injury (TBI). This program was supervised by the Department of Rehabilitation Medicine of the VU Medical Center in Amsterdam and supported by the Netherlands Organization for Health Research and Development (grant no.1435.0001), and Stichting Rotterdams Kinderrevalidatie Fonds Adriaanstichting (KFA). The four projects were individually coordinated by the Department of Rehabilitation Medicine of the VU Medical Center, Amsterdam (MS), by the De Hoogstraat rehabilitation center and the University Medical Center Utrecht (stroke and ALS), and the department of Rehabilitation Medicine of the Erasmus MC, Rotterdam (TBI).
The aim of the study was twofold: first, to establish the most optimal set of measurement instruments for the evaluation of the consequences of a traumatic brain injury and, second, to identify determinants of functional outcome.
10
Chapter 1
Measurement instruments for traumatic brain injury
To establish an optimal set of measurement instruments for the evaluation of traumatic brain injury outcome a literature review was performed, which is described in chapter 2. In chapter 3 we compared the inter-observer reliability and sensitivity to change of the selected measurement instruments in order to compile a data set for use in traumatic brain injury research at different points in time. To assess the usefulness of the ‘significant other’ as rater, in chapter 4 the ratings on the Functional Independence Measurement, the Sickness Impact Profile-68, and the Rand SF 36 of the patient versus the patient’s caregiver were compared.
Determinants of functional outcome in traumatic brain injury
In chapter 5 the Rotterdam traumatic brain injury hospital based cohort is compared with inpatient rehabilitation cohorts and the question of selection bias is addressed. chapter 6 addresses the question as to which factors are associated with discharge destination after leaving the hospital. In chapter 7 the association between the coping style of family members and functional outcome of the patient is described. Finally, chapter 8 presents the determinants of functional outcome one year after trauma.
11
General introduction
References
Hersenletsel hoe nu verder? Prismant 2006.1.
Ribbers, GM. Traumatic brain injury rehabilitation in the Netherlands: dilemmas and challenges. J Head 2.
Trauma Rehabil 2007;22:234-238.
van Balen HGG, Mulder T, Keyser A. Towards a disability-oriented epidemiology of traumatic brain injury. 3.
Disabil Rehabil 1996;1:81-90.
Coronado VG, Johnson RL, Faul M, Kegler SR. Incidence rates of hospitalization related to traumatic brain 4.
injury-12 states 2002. JAMA 2006;295:1764.
van Balen HGG. A disability-oriented approach to long-term sequelae following traumatic brain injury. 5.
Dissertation. 1997.
Saghal V, Heinemann A. Recovery of function during inpatients rehabilitation for moderate traumatic 6.
brain injury. Scand J Rehabil Med 1989;21:71-79.
Dawson DR, Chipman M. The disablement experienced by traumatically brain-injured adults living in the 7.
community. Brain Inj 1995;9:339-353.
Greenspan AI, Wrigley JM, Kresnow M, Branche-Dorsesy CM, Fine PR. Factors influencing failure to return 8.
to work due to traumatic brain injury. Brain Inj 1996;10:207-218.
Ponsford JL, Olver JH, Curran C, Ng K. Prediction of employment status 2 years after traumatic brain 9.
injury. Brain Inj 1995;9:11-20.
Hall KM, Karzmark P, Stevens M, Englander J, O’Hare P, Wright J. Family stressors in traumatic brain injury: 10.
a two-year follow-up. Arch Phys Med Rehabil 1994;75:876-884.
McLean Jr A, Dikmen SS, Temkin NR. Psychosocial recovery after head injury. Arch Phys Med Rehabil 11.
1993;74:1041-1046.
Johnston MV, Hall KM, Carnavale G, Boake G. Functional assessment and outcome evaluation in TBI 12.
rehabilitation. In: Horn LJ, Zasler ND, editors. Medical rehabilitation of traumatic brain injury.
Philadelphia: Hanley and Belfus. 1995;197-226.
Johnston MV, Hall KM. Outcome evaluation in TBI rehabilitation. Part 1: overview and system principles. 13.
Arch Phys Med Rehabil 1994;75:SC-2-9.
Johnston MV. The outcome of community re-entry programs for brain injury survivors. Part 2: further 14.
investigations. Brain Inj 1991;5:155-168.
Dikmen SS, Machamer JE, Powell JM, Temkin NR. Outcome 3 to 5 years after moderate to severe 15.
traumatic brain injury. Arch Phys Med Rehabil 2003;84:1449-1457.
van Baalen B, Odding E, Maas AIR, Ribbers GM, Bergen MP, Stam, HJ. Traumatic brain injury: classification 16.
of initial severity and determination of functional outcome. Disabil Rehabil 2003;25:9-18.
Prigatano GP, Klonoff PS. Psychotherapy and neuropsychological assessment after brain injury. J Head 17.
Trauma Rehabil 1988;3:45-56.
Vieth AZ, Johnstone B, Dawson B. Extent of intellectual, cognitive, and academic decline in adolescent 18.
traumatic brain injury. Brain Inj 1996;10:465-470.
Johnston MV. Towards a national information system for traumatic brain injury: foreword and overview. 19.
Arch Phys Med Rehabil 1997;78(Suppl 4):S1-S4.
Hall KM, Johnston MV. Outcome evaluation in TBI rehabilitation. Part 2: measurement tools for a 20.
nationwide data system. Arch Phys Med Rehabil 1994;75:SC-10-8.
12
Chapter 1
Marshall LF, Gautille T, Klauber MR, Eisenberg HM, Jane JA, Luerssen TG. The outcome of severe closed 21.
head injury. J Neurosurg 1991;75: S28-36.
Teasdale GM, Braakman R, Cohadon F, Dearden M, Iannotti F, Karimi A, Lapierre F, Maas A, Murray G, 22.
Ohman J, Persson L, Servadei F, Stocchetti N, Trojanowski T, Unterberg A. The European Brain Injury
Consortium. Nemo solus satis sapit: nobody knows enough alone. Acta Neurochir 1997;139:797-803.
Maas AIR, Dearden M, Teasdale GM, Braakman R, Cohadon F, Iannotti F, Karimi A, Lapierre F, Murray G, 23.
Ohman J, Persson L, Servadei F, Stocchetti N, Unterberg A. EBIC guidelines for management of severe
head injury in adults. Acta Neurochir 1997;139:286-94.
Zasler ND. Prognostic indicators in medical rehabilitation of traumatic brain injury: a commentary and 24.
review. Arch Phys Med Rehabil 1997;78(Suppl 4):S12-S16.
2
Bianca van BaalenElse Odding
Andrew IR MaasGerard M RibbersMichael P Bergen
Henk J Stam
Disability and Rehabilitation2003;25:9-18
Traumatic brain injury: classification of initial severity and determination of functional outcome
14
Chapter 2
Abstract
Purpose: The aim of the present manuscript is to review current methods for classifying initial severity and final outcome in traumatic brain injury (TBI), and to suggest a direction and form of further research.Method: We reviewed the literature on valid and reliable measurements used in TBI-research for classifying initial severity and final outcome.Results: Classifying initial severity in patients with head injury according to clinical condition or CT-parameters is valid. Classifying outcome according to measurement tools of disability showed adequate validity and reliability.Conclusions: Future research in TBI outcome, particularly in rehabilitation medicine, should focus on determinants of outcome, identifying those patients who will have the greatest chance of benefiting from intensive rehabilitation programs. More research is needed to determine the long-term functional outcome in TBI, the long-term socio-economic costs, and the influence of behavioural problems on family cohesion. Finally, validation of outcome measures is required in the TBI-population; the relative value of various outcome measurement instruments needs to be determined, and the usefulness and applicability of measures for health related quality of life in TBI should be established.
15
TBI: classification of initial severity and determination of functional outcome
Introduction
The disease traumatic brain injury (TBI) has been termed a silent epidemic.1 In the USA approximately 95 per 100,000 inhabitants sustain a fatal or severe enough injury to require hospital admission each year.1 In the Federal Republic of Germany, the annual incidence of severe head injury is estimated at 10,000.2 In the Netherlands the incidence is 79 per 100,000 inhabitants.3 Whilst this incidence, compared to other causes of brain injury, such as stroke, is lower, the long-term effects and socio-economic costs are equal or even higher, as in contrast to the stroke population TBI primarily affects younger age groups.Classification at the two ends of the spectrum of TBI, i.e. at the beginning (initial severity) and at the end (final outcome) may be considered important for a variety of reasons. Classification of initial severity and estimation of risks of complications is important when determining what level of care, and which facilities individual patients require. In studies where treatment effect is investigated, or results of treatment presented, the initial severity is a major prognostic factor which has to be considered. Classifying patients in the initial period is essential when specific therapies require targeting to a subset of the population. Likewise, the results of therapy in the acute or subacute (rehabilitation) phase, or accuracy of prognostic studies can only be evaluated if the final outcome is measured accurately.In rehabilitation medicine, the main goal is to prognosticate for future outcome in order to develop treatment strategies. Functional outcome expressed as the extent of disability and handicap after sustaining a TBI covers a wide range from very minor to very severe. Spontaneous recovery to pre-traumatic level of functioning may occur but, especially in the more severe cases, a complex array of long-term sequelae may persist. All areas of life may be affected by TBI, resulting in various cognitive, social, behavioural, emotional, and/or physical problems. The set of relevant domains is large and there is no direct relation between neurological impairments and long-term disabilities. Most studies focus on functional outcome at six to twelve months post injury (using the Glasgow Outcome Scale and the Disability Rating Scale), and much less is known about the lifelong consequences of TBI.Whatever the focus of interest, outcome in TBI is usually assessed by healthcare professionals, and seldom includes self-assessment. Yet, self-assessment is an essential part in determining quality of life (QoL) in patients surviving TBI. QoL assessment has proven particularly useful in the fields of oncology and cardiovascular disease, but its usefulness and applicability in TBI is still under investigation. Outcome assessment should not so much reflect the interest of health care professionals, but rather integrate the various components of the outcome spectrum, including aspects of physical wellbeing, activities of daily life, neuropsychological impairments, and social reintegration as perceived by health care professionals, as well as by the patients themselves and caregivers. Nevertheless, the focus of outcome will vary according to the time after injury and the specific focus of interest.The aim of the present manuscript is to review currently employed methods for classifying initial severity and final outcome in TBI. This review was carried out to answer our question
16
Chapter 2
about the optimal set of measurement tools needed for a prospective study on the determinants of (future) disability and handicap. We therefore focused on the most used and/or best documented scales.
Classification of initial severity
TBI is a heterogeneous disease, encompassing a wide range of pathologies, including diffuse axonal injury, focal contusions and space occupying intra- and extradural hematomas. Following the primary damage, due to the initial impact, secondary brain damage ensues due to intrinsic pathophysiologic mechanisms, development of mass lesions and is frequently exacerbated by systemic insults. Patients with head injury may be classified according to clinical severity, mechanism of injury, or morphologic changes. Presence of TBI and clinical severity thereof is evidenced by presence and duration of post traumatic amnesia (PTA), and in more severe cases by the degree and duration of a depressed level of consciousness. PTA can be reliably measured with the Galveston Orientation and Amnesia Test and level of consciousness by the Glasgow Coma Scale.
Galveston Orientation and Amnesia TestThe presence of PTA is a prerequisite for the diagnosis of TBI. The duration of PTA is related to the severity of injury and has shown a robust correlation with treatment costs and general outcome.4 The duration of PTA can accurately be measured with the Galveston Orientation and Amnesia Test (GOAT). The GOAT is a short mental status exam devised to evaluate the extent and duration of confusion and amnesia following TBI. Standardised questions are asked relating to orientation to person, to time, to place, and to the possibility to recall events, just prior to and after injury. In administering GOAT each client starts out with 100 points and points are deducted for errors made in answering the questions. A score of 76 to 100 on the GOAT may be considered as normal, a score of 66 to 75 as borderline, patients with a score below 75 may be considered to be still in a state of PTA. A graph of serial scores obtained over time can be depicting the recovery of the TBI patient from the phase of PTA.5 Inter rater reliability has been demonstrated. PTA, as measured by the GOAT, appears capable of predicting specific functional capacity in the population of TBI patients. This predictive value can be enhanced by taking age into account.6
Glasgow Coma ScaleThe Glasgow Coma Scale (GCS) is widely accepted as standardised method for evaluating level of consciousness in patients with acute neurological disorders.7 The GCS is comprised of three response scores (eye opening (E), motor score (M), verbal score (V)), which for purposes of research and classification may be summated to a total EMV score (3-15). Coma is commonly defined as GCS score ≤ 88 and inability to open the eyes. TBI patients with a GCS ≤ 8 on admission are classified as severe head injury, patients with an admission GCS of 9 to 13 as moderate. Formerly, moderate head injury was defined as a GCS of 9-12, but
17
TBI: classification of initial severity and determination of functional outcome
recently it has been suggested to include patients with a GCS of 13 in the moderate head injury group, as the risk of complications is equal to patients with a GCS score of 9 to 12.9
Within the mild head injury (i.e. GCS 14, 15) patients may be recognised to be at high, moderate or low risk for developing intra-cranial mass lesions.10
Inter and intra rater reliability in the use of GCS is high. The GCS score has been shown to be highly associated with acute morbidity and mortality, but less strongly with long term functional outcome.11
Mechanism of injuryAccording to the mechanism of injury patients may be differentiated in closed versus penetrating head injury (PHI). This makes sense, since the type of lesions resulting as also outcome differs significantly. In closed head injury (CHI) acceleration, deceleration forces, such as frequently occur in road traffic accidents cause diffuse injuries and more local impact forces contusions. In PHI the penetrating object primarily causes local destruction and, depending on the kinetic energy transmitted to the tissue, more widespread devastating injuries. In civilian situations PHI is predominantly caused by gunshot wounds, often self-inflicted. The risk of infection and epilepsy are more prominent features in penetrating head injury. Outcome in PHI is much poorer than in CHI. Within the Traumatic Coma Data Bank study, including patients with only severe injuries, overall mortality in the closed head injury group was 32.5%12 and in patients with penetrating head injury 88%.13 Poorer outcome in PHI is primarily determined by mortality. In PHI sequelae are primarily caused by physical disabilities versus more severe cognitive impairment in patients with closed head injury.
MorphologyAssessment of clinical severity of injury according to the GCS is impaired by the fact that many patients today already arrive in the hospital sedated, paralysed, and ventilated. In a survey performed by the European Brain Injury Consortium on severe and moderate TBI, the full GCS was only testable in 77% of patients on admission to hospital.9 For these reasons interest has focused on more technical examinations, such as CT or MRI, for classifying TBI. In the acute phase MRI, though more sensitive, is impractical. CT examinations permit evaluation of structural damage, detection of mass lesions, traumatic subarachnoid hemorrhage, and may show evidence of raised intra-cranial pressure. In 1991 Marshall et al, analysing the US Traumatic Coma Data Bank, proposed a scale for classifying TBI according to CT findings.12 This scale differentiates patients into six categories, according to presence or absence of abnormalities, obliteration of basal cisterns, presence of midline shift, and mass lesions. A clear correlation between CT classification and outcome has been shown. Although the composition of the scale has not been scientifically validated, in practice it has proven validity and demonstrated prognostic significance. Whether a different classification system for PHI is required remains to be investigated.
18
Chapter 2
Determination of outcome
In the various fields of interest of health care professionals, the focus of interest on outcome is different. Acute care physicians, focusing primarily on treatment results, desire a simple general outcome scale. In this field the Glasgow Outcome Scale and Disability Rating Scale are commonly used. In rehabilitation medicine it has become common practice to classify the consequences of disease according to the International Classification of Disabilities and Handicaps (ICIDH).14,15 The first version, developed in 1980, classified impairments, disabilities and handicaps. In December 1999 the 'Beta-2 draft' of the second version was published. The ICIDH-2 provides a description of situations with regard to human functioning and disability. It is organised according to three dimensions: 1) body level, named body functions and structure, 2) individual level, named activities, and 3) society level, named participation. The body functions are the physiological or psychological functions of body systems, and the body structures are anatomical parts of the body. Impairments are problems in body functions or structure as a significant deviation or loss. An activity is the performance of a task or action. Activity limitations are difficulties an individual may have in the performance of activities. Participation is an individual's involvement in the life situations in relation to health conditions, body functions and structures, activities and contextual factors (contextual factors represent the background of an individual's life and living). Participation restrictions are problems an individual may have in the manner or extent of involvement in life situations. What is often called 'functional outcome' should encompass at least the relevant domains of the dimensions activity and participation. The question in TBI rehabilitation is what these relevant domains are. One study classified 55% of patients 3 to 7 years post-traumatic as having a cognitive disability, while 45% had emotional and behavioural disabilities.3 There were less problems with locomotor and personal care functions. It is not difficult to imagine that these cognitive, behavioural and emotional problems may have a major impact on family and social relations, and the ability to lead a gainful life. And not only does the injury affect the patient himself but it can also have large effects on the lives of the people in the immediate environment of the patient like partner, children or parents. In our opinion future scientific research should focus on these aspects.Having defined the area of functional outcome one must establish the manner in which to measure its aspects. The complexity of relevant outcomes, combined with the limited resources for research, has led to the use of assessment tools not specifically developed and validated for the TBI population. The current state of the art leads both researchers and clinical managers to question how function and progress of patients with TBI should be assessed.
19
TBI: classification of initial severity and determination of functional outcome
General outcome scales
Glasgow Outcome ScaleThe Glasgow Outcome Scale (GOS) is widely accepted as measure for general outcome after TBI; prognostic studies have focused on GOS at discharge or six months after injury, and the GOS dichotomised into unfavourable / favourable outcome has been uniformly utilised as primary outcome measure in clinical trials. The full GOS encompasses five outcome categories: death, vegetative state, severe disability, moderate disability, and good recovery.16 Overall recovery is categorised on the basis of the following determinants: consciousness, independence in the home, independence outside the home, work, social & leisure activities, and family & friendships. The GOS has been criticised because there are no guidelines for dealing with commonly encountered problems, such as the effects of extra-cranial injury, epilepsy, and pre-injury unemployment17,18 and because of relative insensitivity in patients with more favourable outcomes. GOS-ratings tend to plateau at 6 months, and therefore the instrument will be insensitive to the gains shown by patients after this period.8 Several schemes for extending the GOS, allowing for further differentiation in the upper categories have been suggested.19-22 Detailed criteria for assessing the extended GOS have been proposed by Wilson et al.23 The extended GOS (GOSE) subdivides the upper three categories of the scale (severe disability, moderate disability and good recovery) in an upper level and a lower level.24 Traditionally, outcome assessed by the GOS, has been assigned after a short interview, usually unstructured and not involving a written protocol. This open-ended format encourages impressionistic use of the scale, sometimes causing variable results between individual assessors21 and there is evidence of systematic bias between different professional groups.18 Assessment of the GOS and GOSE using a standard format with a written protocol is practical and reliable.25 A disadvantage in using the structured interview however is the impossibility to correct for pre-injury deficits. In the original assessment of the GOS a patient was assigned to the category good recovery if he attained the same level of functioning as pre-trauma. The structured interview format however does not allow for taking such aspect into consideration and is limited to a description of the present situation. Consequently, although permitting more standardised assessment, the use of the proposed structured interviews may carry some risk of underestimating the actual degree of recovery in comparison to the pre-trauma level.
Disability Rating ScaleAlthough termed a disability rating scale the Disability Rating Scale (DRS) includes determination of the level of consciousness and degree of social adaptability, and hence is better qualified as general outcome measure. The DRS was developed as an instrument to provide quantitative information to chart the progress of severe head injury patients from coma to community, particularly through the mid-zone of the recovery spectrum, between early arousal from coma and early sentient functioning.25
20
Chapter 2
The DRS measures changes in the following categories:a. level of arousal and awareness - identical to the GCS.b. cognitive ability to deal with problems of feeding, toiletting and grooming.c. degree of physical dependence on others.d. psychosocial adaptability as reflected primarily by the ability to do useful work as independently as possible in a socially relevant context.For each category points are given for the disability present, and summation of these permits defining 10 outcome categories: no disability (0), mild disability (1), partial disability (2-3), moderate disability (4-6), moderately severe disability (7-11), severe disability (12-16), extremely severe disability (17-21), vegetative state (22-24), extremely vegetative state (25-29), death (30). The DRS is a reliable and valid measure, which has been shown to be associated with long-term disability after moderate and severe TBI.19,26-28 In addition, it proved to be significantly associated with neurophysiologic measures of brain dysfunction as reflected in brain evoked potential abnormality scores.29,30 It has however not been shown to be superior to the GOS, in fact results of a recent study evaluating the relative value of GOS and DRS showed the GOS to provide a more complete assessment of disability than obtained by the DRS.31
Measures of Disabilities
A disability refers to any restriction or lack of ability to perform an activity within the manner or the range that is considered normal for a human being. Disability represents a disturbance at the level of the acting person and may arise as a direct consequence of impairment. Disability may result from (psychological) response of the individual to a physical, sensory or other impairment.14,15 Various assessment scales for disabilities have been utilised in TBI, primarily in rehabilitation medicine. These scales include the Barthel Index, the Rancho Los Amigos Levels of Cognitive Functioning Scale, the Functional Independence Measure and Functional Assessment Measure, as well as the Neurobehavioral Rating Scale.
Barthel IndexThe Barthel Index was initially developed to follow progress in self-care and mobility skills during in-patient rehabilitation of stroke patients, and to indicate the amount of care required. It has evolved into one of the commonly employed measures for physical disabilities in rehabilitation in general.32 It is an index of daily living,32 registering the actual performance of a patient. The five outcome categories are: extremely severe disabled (0-4), severe disabled (5-9), disabled (10-14), mildly disabled (15-19), and not disabled (20). The index is however limited in scope: it does not take psychological status, social functioning or household activities into account. Consequently, a ceiling effect prevents the detection of further relevant improvements in TBI-patients.34 The reliability and validity of the Barthel Index in neurological disease has been primarily established in stroke research but not in TBI research.

21
TBI: classification of initial severity and determination of functional outcome
Rancho Los Amigos Levels of Cognitive Functioning ScaleThe Level of Cognitive Functioning Scale (LCFS) was originally designed as a description of the eight stages of cognitive functioning through which brain injured patients typically progress in hospital and acute rehabilitative care.35 The eight levels of functioning cover much of the observable range of psychosocially relevant behaviours.36 The scale ranges from no response, in which the patient is in deep coma and completely unresponsive, to purposeful and appropriate functioning, where the patient is alert and oriented, able to recall and integrate past and recent events, and is aware of and responsive to his environment). Although this scale reflects common trends in recovery, it doesn’t clarify the status of the individual patient’s cognitive processes at a particular time.37 There is some debate about the usefulness of the LCFS in TBI-research. Some state that, because the reliability and validity of the LCFS is less than of the DRS, it should not be used.27 Others argue that, because of the simplicity and clinical utility of the LCFS, and its widespread use in the United States, it is an asset to any data set.11
Functional Independence Measure and Functional Assessment MeasureThe Functional Independence Measure (FIM) was developed to resolve the longstanding problem of lack of uniform measurement and data on disability and rehabilitation outcomes. The FIM is an 18-item ordinal scale, measuring changes in functional status within an individual over the course of a comprehensive medical rehabilitation program.38 The areas examined include: self-care, sphincter control, mobility, locomotion, communication, and social cognition. The FIM item-scores range from 1 (needs total assist, performing less than 25% of the task) to 7 (complete independent). Good reliability across a wide variety of settings, raters, and patients has been reported.38-45 Because of the complex functional sequelae of TBI, ceiling effects of the FIM have been reported. The psychosocial and cognitive disabilities, common in TBI, have therefore led to an extension of the FIM called the Functional Assessment Measure (FAM).46 The twelve FAM-items are: swallowing, car transfer, community access, reading, writing, speech intelligibility, emotional status, adjustment to limitations, employability, orientation, attention, and safety judgement. The scores, like the FIM-items, range from 1 to 7.
Neurobehavioural Rating ScaleThe Neurobehavioural Rating Scale (NRS) is a modification of the Brief Psychiatric Rating Scale.47 This 27-item scale has been developed for head trauma patients, and measures common behavioural and psychiatric symptoms after TBI.48,49 Examples of these symptoms are: inattention/reduced alertness, somatic concern, disorientation, anxiety, conceptual disorganisation, agitation, and motor retardation. Ratings are made on a 7-point scale from non-present to extremely severe. Satisfactory inter-rater reliability was reported and both severity and chronicity of closed head injury was reflected in the NRS. Brief structured interviews or observations in a naturalistic setting can be used to administer the NRS.

22
Chapter 2
Measures of handicaps
Handicap is defined by the disadvantages experienced by the individual at the level of the interaction with the social environment. The WHO-model emphasises that for the same type of impairment and degree of disability, the level of handicap can vary considerably from individual to individual depending on personal background, pre-morbid lifestyle, and circumstances after the illness. It is therefore clear that derivation of a standard against which to measure handicap is not easy.50 Measures of handicap are strongly related to health-related quality of life assessment. Berger et al (1999)51 have discussed the literature on quality of life after traumatic brain injury. In terms of quality of life domains they identified the physical, psychological, social and especially cognitive aspects of quality of life. This review highlighted the lack of standardised definitions and multidimensional assessment of quality of life in TBI.In measuring handicaps and quality of life, disease specific instruments may be identified in contrast to more generic measures. Generic measures include the Sickness Impact Profile, the SF-36, the Wimbledon Self Report Scale and the Coop/Wonca charts. More disease specific scales include the Supervision Rating Scale, Community Integration Questionnaire and the Aachener Life Quality Inventory.
Sickness Impact ProfileThe Sickness Impact Profile (SIP) is a multidimensional general health status instrument, which measures perceived changes in behaviour judged by the patient as the consequence of being sick. The test-retest reliability of the SIP, in terms of various reliability measures, was investigated using different interviewers, forms, administration procedures, and a variety of subjects who differed in terms of type and severity of dysfunction. The results provided evidence of feasibility of collecting reliable data using the SIP under these various conditions. The SIP is comprised of 136 items which are all statements regarding behaviour. Respondents are asked to check those items that both apply to their situation on the day they fill out the list and that are related to their health status.52 The 136 items are divided over 12 categories and result in three scores: the Physical SIP-score, the Psychosocial SIP-score and the Total SIP-score. It has been used in many studies addressing a wide variety of objectives and involving many study populations from various countries.53-56 The SIP has been used in several studies of TBI.57-61 Modifications to make the SIP more sensitive for TBI-patients showed to be very inferior to the original SIP.62 The time needed to assess the SIP has been regarded as an obstacle to routine use.63,64 In order to make the SIP less time-consuming but maintaining its widely accepted internal properties, a short generic version was developed. This so-called SIP-68 was developed in the Netherlands and contains 68 items, which are divided over six sub-scales: somatic autonomy, mobility control, psychic autonomy and communication, social behaviour, emotional stability, and mobility range. These six sub-scales together were able to predict total SIP136-scores almost perfectly. Pearson’s correlation coefficient for the total-scores SIP136-SIP68 is 0.97 in the TBI population.65 No studies on TBI patients using this short form have been published so far.
23
TBI: classification of initial severity and determination of functional outcome
Rand-36-item Health Survey 1.0 / MOS SF-36The Rand-36 is a multidimensional questionnaire measuring health-related quality of life. It is suitable for use in the general population in patients with various conditions.66 The Rand-36 comprises eight sub-scales: physical functioning, role limitations as a result of physical problems, bodily pain, general health perception, social functioning, role limitations as a result of emotional problems, mental health, and health change. It has been tested extensively and has shown good psychometric properties.67-69 Floor and ceiling effects have been reported. Although some health concepts, like sleep, cognitive functioning, health distress, self-esteem, eating, and communication are not measured specifically, the scales of the Rand-36 have been proven to be associated with these concepts.70
Wimbledon Self Report ScaleThe Wimbledon Self-Report Scale (WSRS) provides a measure of emotional state and detects mood disorders. It was standardised on a hospitalised population in which the majority of the patients had neurological disorders, and it provides a general appraisal of mood state rather than being limited to specific symptoms of anxiety and / or depression. Intra-rater reliability is high. The WSRS consists of 30 adjectives and phrases describing feelings (e.g. nervous, rejected, happy, desperate) in which the participant rates the frequency of occurrence in the previous week on a 4-point scale, ranging from ‘never’ to ‘almost always’.71
The Coop/Wonca ChartsThe Dartmouth Coop Functional Health Assessment Charts/Wonca (Coop/Wonca) is a short, self-completed questionnaire and was developed for patients in primary care, specifically for use in office practices.72-74 Additionally, it has been used in other settings, including hospital in-patients, patients in day-care and in nursing homes, and in the general populations. The Coop/Wonca is intended to measure the patient’s functional status by assessing ‘the actual performance (or capacity to perform) of a wide range of physical, social, and work activities that are normal for people in good health.75 The following dimensions are assessed: physical function, emotional status, role function, social function, health change, overall health, and pain. In the Netherlands the Coop/Wonca Charts has been proven valid and reliable and its sensitivity to change has been demonstrated.76
Supervision Rating ScaleThe Supervision Rating Scale (SRS) measures the level of supervision that a patient receives from caregivers. The SRS rates levels of supervision on a 13-point ordinal scale that can optionally be grouped into five ranked categories (independent, overnight supervision, part-time supervision, full-time supervision, and full-time direct supervision).18 SRS ratings are strongly associated with ratings on the DRS and GOS.26 No report of its use or specific validity in TBI has been found since its original publication.
24
Chapter 2
Community Integration QuestionnaireThe assessment of community integration, i.e. the degree to which TBI victims return to life in their families, neighbourhoods, and communities, in spite of impairments and disabilities, is essential to any TBI-outcome study. The Community Integration Questionnaire (CIQ) is a 15-item scale with three sub-scales assessing home integration, social integration, and productive activity in persons with TBI. Home integration includes five items associated with domestic activities, housework, caring for children, shopping, etc. Social integration includes six items related to visiting friends and engaging in leisure activities among others. Higher scores indicate greater integration.77 The productive activity domain contains four items involved with work, school, volunteer activities and the use of transportation, which is found to be the most reliable and sensitive sub-scale. In its current format the CIQ is a measure of the community integration of persons with TBI that appears useful for research and rehabilitation program evaluation. However, the establishment of pre-injury community integration status, and the association of CIQ-scores with impairment and disability have to be investigated yet. No validity studies have been reported.78
The Aachener Life quality InventoryThe Aachener Life Quality Inventory was developed for evaluative and predictive purposes from the SIP, more specifically focusing on patients with brain damage. It concerns a patient self report and relative rated form, also available as an interview. It has been tested for psychometric criteria in neurological patients including those with TBI. This inventory containing 117 items, measuring eight dimensions, has primarily been used in Germany, and to our knowledge an English version is not yet available.79
Discussion and recommendations for future research
Classifying head injury both concerning initial severity as well as long-term outcome, can be considered important. When attempting to classify the ultimate goal of the assessment should be kept in mind. In the early assessment of initial severity both the clinical assessment as well as CT-classification is used for allocation of resources, for reasons of prognosis and inclusion / exclusion criterion for clinical studies. In this regard it has been stated that patients with a GCS < 9, classified as severe, should receive ICP monitoring and be admitted to a specialised centre. But does this mean that other patients with moderate injury require a different approach? Results of recent studies have shown moderate head injury not to be such a benign disease as previously thought: mortality rates of 11 to 15% are reported.9 The coexistence of moderate TBI with extra-cranial injury is associated with a doubling of predicted mortality throughout the injury severity ranges studied.80 Relevant questions when considering allocation of resources, necessity for referral, and admission to ICU are what the risks are for development of problems, such as mass lesion, raised intra-cranial pressure, secondary insults or compromised cerebral perfusion pressure, and whether the possibility exists that such complications can be earlier detected, prevented and treated in
25
TBI: classification of initial severity and determination of functional outcome
the appropriate situation. Such an approach would favour calculation of an individualised risk assessment, rather than an overall classification. In head injury trials the treatment under investigation should be targeted not only to patients in whom the pathophysiologic mechanism at which a new therapy is targeted is active, but equally important to a population in which chances of demonstrating improvement is possible and realistic. Both from a point of view of clinical trial design as also from a prognostic perspective it should be realised that the head injury population includes patients with an a priori poor chance of survival, as well as patients with an a priori high chance of favourable outcome. Although classifying patients with head injury according to clinical condition or according to CT parameters is valid, a different approach, and one which in our opinion deserves more attention, is attempting to classify patients according to prognostic estimates, identifying patients with a certain risk profile. These risk profiles may relate to different endpoints, such as risk of secondary insult, risk of intra-cranial mass lesion, and hence for an evidence based allocation of intensive care facilities to appropriately targeted patients, or to overall outcome measures, permitting better comparisons between series concerning treatment results and affording opportunities for quality assurance. Further studies on prognostic modelling in head injury, cross validating prognostic equations over various databases are necessary to permit classification of patients according to prognostic profiles. Such an approach would further be of value in analysis of future clinical trials on neuroprotective agents and provide possibilities of targeting such therapy to a population in whom effect might be demonstrated. Furthermore, such an approach could be utilised in targeting and evaluating the effect of specific rehabilitation programs in TBI. Whatever the endpoint chosen, a prerequisite is that such an endpoint is appropriate and, clearly defined and evaluation performed at a specific time. Physical and neurological recovery is greatest in the first six months post-injury. Overall outcome measures such as the GOS, the Extended GOS or the DRS are appropriate, when evaluating results of early management and based on results obtained it would seem valid to perform such estimation at six months post injury, as indeed is generally accepted. However, following the first six month period other problems become more apparent, both in the patient and his relatives, particularly concerning aspects of social reintegration and perceived quality of life. Even in mildly injured TBI patients major problems may occur even years after injury. Assessment of long-term functional outcome would ideally require a lifelong follow-up, but this is not a realistic goal for scientific research. Given the available data showing that most problems are revealed during the first three years post-injury, a follow-up of three years would appear appropriate for determining long-term functional outcome.
26
Chapter 2
Future research in outcome in TBI, particularly in rehabilitation medicine, should focus on determinants of outcome, identifying those patients who will have greatest chance of benefiting from intensive rehabilitation programs; more research is needed to determine the long-term functional outcome in TBI, the socio-economic costs involved in the long term, and the influence of behavioural problems on family cohesion. Validation of generic outcome measures is required in the TBI-population; the relative value of various outcome measures needs to be determined, and furthermore the usefulness and applicability of measures for health related quality of life in TBI is required. Such measures should permit differentiation in patient perceived, caregiver perceived and significant other perceived quality of life. To this and more disease specific scales are required.
27
TBI: classification of initial severity and determination of functional outcome
References
Epidemiology of traumatic brain injury in the United States, in Centers for Disease Control and Prevention 1.
(ed): Traumatic brain (head) injury (TBI). http://www.cdc.gov/ncipc/dacrrd/tbi.htm, 1999. National
Center for Injury Prevention and Control.
Lehr D, Baethmann A, and Study Group: Management of patients with severe head injury in the preclinical 2.
phase: a prospective analysis. J Trauma 1997;42:S71-S75.
Van Balen HGG, Mulder Th, Keyser A. Towards a disability-oriented epidemiology of traumatic brain 3.
injury. Disabil Rehabil 1996;18:181-190.
Hall KM, Johnston MV. Outcomes evaluation in TBI rehabilitation. Part 2: measurement tools for a 4.
nationwide data system. Arch Phys Med Rehabil 1994;75:SC10-SC18.
Levin HS, O´Donnell VM, Grossman RG. The Galveston Orientation and Amnesia Test. A practical scale to 5.
assess cognition after head injury. J Nerv Ment Dis 1979;176:675-684.
Zafonte RD, Mann NR, Millis SR, Black KL, Wood DL, Hammond F. Posttraumatic amnesia: its relation to 6.
functional outcome. Arch phys Med Rehabil 1997;78:1101-1106.
Teasdale G, Jennet B. Assessment of coma and impaired consciousness: a practical scale. Lancet 7.
1974;2:81-84.
Hall KM. Establishing a national traumatic brain injury information system based upon a unified data set. 8.
Arch Phys Med Rehabil 1997;78:S5-S11.
Murray GD, Teasdale GM, Braakman R, Cohadon F, Dearden M, Iannotti F, Karimi A, Lapierre F, Maas A, 9.
Ohman J, Persson L, Servadei F, Stocchetti N, Trojanowski T, Unterberg A. The European Brain Injury
Consortium survey of head injuries across Europe. Acta Neurochir 1999;141:223-236.
Gomez PA, Lobato RD, Ortega JM, De La Cruz J. Mild head injury: differences of prognosis among patients 10.
with a Glasgow Coma Scale score of 13 to 15 and analysis of factors associated with abnormal CT findings.
Br J Neurosurg 1996;10(5):453-460.
Zasler ND. Prognostic indicators in medical rehabilitation of traumatic brain injury: a commentary and 11.
review. Arch Phys Med Rehabil 1997;78:S12-S16.
Marshall LF, Bowers Marshall S, Klauber MR, Van Berkum Clark M, Eisenberg HM, Jane JA, Luersson TG, 12.
Mamarou A, Foulkes MA. A new classification of head injury based on computerized tomography. J
Neurosurg 1991;75(Suppl.):S14-S20.
Aldrich EF, Eisenberg HM, Saydjari C, Foulkes MA, Jane JA, Marshall LF, Young H, Marmarou A. Predictors 13.
of mortality in severely head-injured patients civilian gunshot wounds: a report from the NIH Traumatic
Coma Data Bank. Surg Neurol 1992;38:418-423.
World Health Organization: International Classification of Impairments, Disabilities, and Handicaps. 14.
Geneva, World Health Organization, 1980.
World Health Organization: ICIDH-2: International Classification of Impairments, Activities and 15.
Participation. A manual of Dimensions of Disablement and Functioning. Beta-1 draft for field trials,
Geneva, World Health Organization, 1997.
Jennett B, Bond M. Assessment of outcome after severe brain damage. A practical scale. Lancet 16.
1975;1:480-485.
Anderson SI, Housley AM, Jones PA, Slattery J, Miller JD. Glasgow Outcome Scale: an interrater reliability 17.
study. Brain Inj 1993;7:309-317.
28
Chapter 2
Boake C. Supervision Rating Scale: a measure of functional outcome from brain injury. Arch Phys Med 18.
Rehabil 1996;77:765-772.
Smith RM, Fields FRJ, Lenox JL, Morris HO, Nolan JJ. A functional scale of recovery from severe head 19.
trauma. Clin Neuropsychol 1979;1:48-50.
Maas AIR, Braakman R, Schouten HJA, Minderhoud JM, van Zomeren AH. Agreement between physicians 20.
on assessment of outcome following severe head injury. J Neurosurg 1983;8:321-325.
Livingston MG, Livingston HG. The Glasgow Assessment Schedule: clinical and research assessment of 21.
head injury outcome. Int Rehabil Med 1985;7:145-149.
Horne G, Schemitsch E. Assessment of the survivors of major trauma accidents. Aust N Z J Surg 22.
1989;59:465-470.
Wilson JTL, Pettigrew LEL, Teasdale GM. Structured interviews for the Glasgow Outcome Scale and the 23.
Extended Glasgow Outcome Scale. J Neurotrauma 1998;15:573-585.
Jennett B, Snoek J, Bond MR, Brooks N. Disability after severe head injury: observations on the use of the 24.
Glasgow Outcome Scale. J Neurol Neurosurg Psychiatry 1981;44:285-293.
Rappaport M, Hall KM, Hopkins K, Belleza T, Cope DN. Disability Rating Scale for severe head trauma: 25.
coma to community. Arch Phys Med Rehabil 1982;63:118-123.
Gouvier WD, Blanton PD, LaPorte KK, Nepomuceno C. Reliability and validity of the Disability Rating Scale 26.
and the Levels of Cognitive Functioning Scale in monitoring recovery from severe head injury. Arch Phys
Med Rehabil 1987;68:94-97.
Heinemann AW, Linacre JM, Wright BD, Hamilton BB, Granger C. Prediction of rehabilitation outcomes 27.
with disability measures. Arch Phys Med Rehabil 1994;75:133-143.
Fleming JM, Maas F. Prognosis of rehabilitation outcome in head injury using the disability rating scale. 28.
Arch Phys Med Rehabil 1994;75:156-163.
Rappaport M, Hall K, Hopkins K, Belleza T, Berrol S, Reynolds G. Evoked brain potentials and disability in 29.
brain-damaged patients. Arch Phys Med Rehabil 1977;58:333-338.
Rappaport M, Hall K, Hopkins K, Belleza T. Evoked potentials and head injury: 1. Rating of evoked potential 30.
abnormality. Clin Electroencephalogr 1981;12:154-166.
Pettigrew LEL, Wilson JTL, Teasdale GM. Assessing disability after head injury: improved use of the 31.
Glasgow Outcome Scale. J Neurosurg 1998;89:939-943.
Wade DT. Measurement in neurological rehabilitation, Oxford University Press, 1996.32.
Collin C, Wade DT, Davies S, Horne V. The Barthel ADL Index: a reliability study. Int Dis Stud 33.
1988;10:61-63.
Heyink J. The Barthel Index. In: Hutchinson A, Bentzen N, König-Zahn C, eds. Cross Cultural Health 34.
Outcome Assessment: a user´s guide, 1997, pp 99-103.
Hagen C. Language cognitive disorganization following closed head injury: a conceptualization. In: Trexler, 35.
LE, ed. Cognitive rehabilitation: conceptualization and intervention. Plenum Press, 1982, pp 131-151.
Lezak MD. Neuropsychological assessment. (3rd edn). Oxford University Press, 1995.36.
Sohlberg MM, Mateer CA. Introduction to cognitive rehabilitation. Guilford Press, 1989.37.
Granger CV, Hamilton BB, Keith RA, Zielezny M, Sherwin FS. Advances in functional assessment for 38.
medical rehabilitation. Topics Ger Rehabil 1986;1:59-74.

29
TBI: classification of initial severity and determination of functional outcome
Hamilton BB, Granger CV, Sherwin FS, Zielezny M, Tashman JS. A uniform national data system for medical 39.
rehabilitation. In: Fuhrer M, ed. Rehabilitation outcomes: analysis and measurement. Brookes, 1987, pp
137-147.
Hamilton BB, Laughlin JA, Fiedler RC, Granger CV. Interrater reliability of the 7-level functional 40.
independence measure (FIM). Scand J Rehabil Med 1994;26(3):115-119.
Ottenbacher KJ, Hsu Y, Granger CV, Fiedler RC. The reliability of the functional independence measure: a 41.
quantitative review. Arch Phys Med Rehabil 1996;77:1226-1232.
Smith-Knapp K, Corrigan JD, Arnett JA. Predicting functional independence from neuropsychological 42.
tests following traumatic brain injury. Brain Inj 1996;10:651-661.
Granger CV, Cotter AC, Hamilton BB, Fiedler RC, Hens MM. Functional assessment scales: a study of 43.
persons with multiple sclerosis. Arch Phys Med Rehabil 1990;71:870-875.
Granger CV, Cotter AC, Hamilton BB, Fiedler RC. Functional assessment scales: a study of persons after 44.
stroke. Arch Phys Med Rehabil 1993;74:133-138.
Willer B, Rosenthal M, Kreutzer JS, Gordon WA, Rempel R. Assessment of community integration following 45.
rehabilitation for traumatic brain injury. J Head Trauma Rehabil 1993;8:75-87.
Granger CV, Divan N, Fiedler RC. Functional assessment scales: a study of persons after traumatic brain 46.
injury. Am J Phys Med Rehabil 1995;74:107-113.
Overall JE, Gorham DR. The brief psychiatric rating scale. Psychol Rep 1962;10:799-812.47.
Levin HS, High WM, Goethe KE, Sisson RA, Overall JE, Rhoades HM, Eisenberg HM, Kalisky Z, Gary HE. The 48.
neurobehavioral rating scale: assessment of the behavioural sequelae of head injury by the clinician. J
Neurol Neurosurg Psychiatry 1987;50:183-193.
Corrigan JD, Dickerson J, Fisher E, Meyer P. The Neurobehavioural Rating Scale: replication in an acute, 49.
inpatient rehabilitation setting. Brain Inj 1990;4:215-222.
Powell JH, Beckers K, Greenwood RJ. Measuring progress and outcome in community rehabilitation after 50.
brain injury with a new assessment instrument- the BICRO-39 scales. Arch Phys Med Rehabil
1998;79:1213-1225.
Berger E, Leven F, Pirente N, Boullon B, Neugebauer E. Quality of life after traumatic brain injury: a 51.
systematic review of the literature. Restor Neurol Neurosci 1999;14:93-102.
Pollard WE, Bobbit RA, Bergner M, Martin DP, Gilson BS. The sickness impact profile: reliability of a health 52.
status measure. Med Care 1976;14(2):146-155.
Bergner M, Bobbitt RA, Kressel S, Pollard WE, Gilson BS, Morris JR. The Sickness Impact Profile: conceptual 53.
formulation and methodology for the development of a health status measure. Int J Health Serv
1976;6:393-415.
Krenz C, Larson EB, Buchner DM, Canfield CG. Characterizing patient dysfunction in Alzheimer’s-Type 54.
dementia. Med Care 1988;26:453-461.
Hart CG, Evans RW. The functional status of ESRD patients as measured by the Sickness Impact Profile. 55.
J Chronic Dis 1987;40:1175-1305.
Dego R. Pitfalls in measuring the health status of Mexican Americans: comparative validity of the English 56.
and Spanish Sickness Impact Profile. Am J Public Health 1984;74:569-573.
Corrigan JD, Smith-Knapp K, Granger CV. Outcomes in the first 5 years after traumatic brain injury. Arch 57.
Phys Med Rehabil 1998;79(3):298-305.
30
Chapter 2
Smith JL, Magill-Evans J, Brintnell S. Life satisfaction following traumatic brain injury. Can J Rehabil 58.
1998;11(3):131-140.
Van Balen HGG, Mulder Th. Beyond the stereotype: an epidemiological study on the long-term sequelae 59.
of traumatic brain injury. Clin Rehabil 1996;10:259-266.
Moore AD, Stambrook M, Gill DD, Lubusko AA. Differences in long-term quality of life in married and 60.
single TBI patients. Can J Rehabil 1992;6(2):89-98.
Fleming JH, Strong J, Ashton R. Cluster analysis of self-awareness levels in adults with traumatic brain 61.
injury and relationship to outcome. J Head Trauma Rehabil 1998;13(5):39-51.
Temkin N, McLean A, Dikmen S, Gale J, Bergner M, Almes MJ. Development and evaluation of modifications 62.
to the Sickness Impact Profile for head injury. J Clin Epidemiol 1988;41:47-57.
Wilkin D, Hallam L, Doggett MA. Measures of need and outcome for primary health care. Oxford University 63.
Press, 1992.
Keith RA. Functional status and health status. Arch Phys Med Rehabil 1994;75:478-483.64.
de Bruin AF, Diederiks JPM, Witte de LP, Stevens FCJ, Philipsen H. The development of a short generic 65.
version of the Sickness Impact Profile. J Clin Epidemiol 1994;47:407-418.
Ware JE, Sherbourne CD. The MOS 36-Item Short-Form Health Survey (SF-36). I: conceptual framework 66.
and item selection. Med Care 1992;30:473-483.
Brazier JE, Harper R, Jones NM, O’Cathain A, Thomas KJ, Usherwood T, Westlake L. Validating the SF-36 67.
health survey questionnaire: a new outcome measure for primary care. BMJ 1992;305:160-164.
Ware J, Snow KK, Kosinski M, Gandek B. SF-36 Health Survey: manual and interpretation guide (Boston, 68.
MA: The Health Institute, New England Medical Center Hospitals), 1993.
McHorney CA, Ware JE, Raczek AE. The MOS-36-Item Short-Form Health Survey (SF-36). II:psychometric 69.
and clinical tests of validity in measuring physical and mental health constructs. Med Care 1993;31:
247-263.
Hanestad BR. The MOS SF-36/RAND 36-Item Health Survey 1.0/HSQ. In: Hutchinson A, Bentzen N, König-70.
Zahn C, eds. Cross Cultural Health Outcome Assessment: a user´s guide, 1997, pp 60-67.
Coughlan AK, Storey. The Wimbledon Self-Report Scale: emotional and mood appraisal. Clin Rehabil 71.
1988;2:207-213.
Nelson E, Wasson J, Kirk J, Keller A, Clark D, Dietrich A, Stewart A, Zubkoff M. Assessment of function in 72.
routine clinical practice: description of the COOP Chart method and preliminary findings. J Chronic Dis
1987;40:55S-63S.
Scholten JHG, van Weel C. Functional status assessment in family practice: the Dartmouth COOP 73.
Functional Health Assessment Charts/WONCA. Meditekst, 1992.
Measuring functional health status with the COOP/WONCA charts. A manual. NCH series no.7. Groningen: 74.
Northern Centre of Health Care Research, 1995. van Weel C, König-Zahn C, Touw-Otten FWMM, van
Duijn NP, Meyboom-de Jong B.
Nelson EC, Landgraf JM, Hayes RD, Wasson JH, Kirk JW. The functional status of patients: how can it be 75.
measured in physician’s offices? Med Care 1990;28:1111-1126.
König-Zahn C. The COOP/WONCA Charts. In: Hutchinson A, Bentzen N, König-Zahn C, eds. Cross Cultural 76.
Health Outcome Assessment: a user´s guide, 1997, pp 48-53.
31
TBI: classification of initial severity and determination of functional outcome
Willer B, Ottenbacher KJ, Coad, M.L. The community integration questionnaire. A comparitive 77.
examination. Am J Phys Med Rehabil 1994;73:103-111.
Dijkers M. Measuring the long-term outcomes of traumatic brain injury: A review of the community 78.
integration questionnaire. J Head Trauma Rehabil 1997;12:74-91.
Hütter BO, Glisbach JM. Das Aachener Lebensqualitätsinventar (ALQI) für Patienten mit Hirnschädigung: 79.
Erste Ergebnisse zu methodischen Gütekriterien. Zeitschrift für Neuropsychologie 1999;10:38.
McMahon CG, Yates DW, Campbell FM, Hollis S, Woodford M. Unexpected contribution of moderate 80.
traumatic brain injury to death after major trauma. J Trauma 1999;47:891-895.

Reliability and sensitivity to change of measurement instruments used in a traumatic brain injury population
3
Bianca van Baalen Else Odding
Marco PC van Woensel Mike A van Kessel Marij E Roebroeck
Henk J Stam
Clinical Rehabilitation2006;20:686-700
34
Chapter 3
Abstract
Objective: To compile a minimum data set for the follow-up of traumatic brain injury (TBI) patients from discharge from hospital to one year post-injury to assess functioning and participation in the physical, cognitive, and psychosocial domains, and in quality of life.Design: Repeated questionnaire interviews by two observers to establish interobserver reliability of the measurement instruments at discharge and at one year post-injury, as well as their sensitivity to change over time in TBI patients.Setting: Department of neurosurgery of an academic hospital, department of a rehabilitation center, and at the patients’ home in the Netherlands.Subjects: The study at discharge included 25 patients aged 18-50 years with a moderate to severe TBI (Glasgow Coma Scale score 3-14), whereas the one year post-injury study included 14 patients aged 19-51 years.Main (outcome) measures: Physical domain: Barthel Index (BI), Functional Independence Measurement (FIM), Glasgow Outcome Scale (GOS), GOS Extended (GOSE). Cognitive domain: Disability Rating Scale (DRS), Functional Assessment Measurement (FAM), Levels of Cognitive Functioning Scale (LCFS), Neurobehavioural Rating Scale (NRS). Psychosocial domain: Community Integration Questionnaire (CIQ), Employability Rating Scale (ERS), Frenchay Activity Index (FAI), Multi Health Locus of Control (MHLC), Rehabilitation Activities Profile (RAP), Social Support List (SSL), Supervision Rating Scale (SRS), Wimbledon Self Rating Scale (WSRS). Quality of life: Coop/Wonca Charts (Coop), Rand SF-36 (RAND-36), Sickness Impact Profile-68 (SIP-68).Results: At both discharge and at one year post-injury, in the physical domain the FIM showed excellent Squared Weighted Kappa (SWK ranging from 0.75 to 0.80), and Intraclass Correlation Coefficient (ICC ranging from 0.75 to 0.92), and a relatively small Standard Error of Measurement (SEM 3.22) and Smallest Detectable Difference (SDD 8.92). In the cognitive domain the FAM and the NRS showed excellent SWK, and ICC, and a relatively small SEM and SDD. In the psychosocial domain the FAI showed excellent SWK (0.89), and ICC (0.87), and a relatively small SEM (2.64) and SDD (7.31). For quality of life, at both discharge and at one year post-injury the SIP-68 and the Coop showed excellent SWK (0.87), and ICC (0.89), and a relatively small SEM (3.79) and SDD (10.51). At both time points SWK and ICC ranged from 0.80 to 0.89, SEM ranged from 1.47 to 1.98, and the SDD was 4.07.Conclusions: An example of a reliable minimum data set that is also able to detect changes over time is: the FIM, the FAM and the Coop for the early stages in recovery, extended with the NRS, the FAI, and the SIP-68 later in recovery, thereby covering all relevant domains after TBI.
35
Reliability and sensitivity to change of measurement instruments used in a TBI population
Introduction
Functional outcome after sustaining a traumatic brain injury (TBI) can cover a wide range of limitations and restrictions. Spontaneous recovery to pre-traumatic status as well as serious long-lasting activity limitations and participation restrictions can occur.1-6 Motor problems or dependencies in self-care and mobility, although important for most individuals early after injury and for a few individuals over the longer term, are not typically the most disabling of long-term consequences of TBI. TBI mainly gives rise to distinct cognitive impairments (e.g., memory, attention, and problem-solving limitations). TBI affects behaviours and disability differently than, for instance, physical or mental health impairments.7,8 Until recently, outcome studies in TBI usually focussed on outcome at 6 or 12 months post-injury using rather global measurement instruments like the Glasgow Outcome Scale (GOS) or return to work.9-12 In the last decade, however, knowledge on the determinants of functional outcome, i.e. prognostic factors, has increased.7,13-15
The long-term consequences of TBI often become apparent long after the patient has left hospital and/or rehabilitation care, i.e. when the subject returns to his or her community. To investigate these long-term consequences, measurement has to start early in recovery, preferably at the moment of discharge from hospital, and be continued when admitted to rehabilitation care and/or when returned home16. Functional outcome studies need to start early in recovery in order to make an accurate prediction of functional prognosis. Because TBI patients usually have a short concentration span early in recovery and problems in concentration have also been reported later in recovery, it is important to have short interviews using a minimum set of measurement instruments. Relevant in TBI rehabilitation are the physical, cognitive, and psychosocial domains, as well as quality of life. An important step in TBI research on functional outcome is to check the validity, interobserver reliability and sensitivity to change of the measurement instruments used at different time points in order to select the most appropriate measurement instruments.Prior to the present study a literature review was performed to determine which measurement instruments might be useful to assess the different aspects of TBI outcome at various times post-injury.17 To investigate whether or not certain measurement instruments can be considered reliable to assess the consequences of TBI over time the present study assessed the interobserver reliability at hospital discharge, and at one year post-injury, as well as the sensitivity to change of the measurement instruments to assess functioning and participation in the physical, cognitive, and psychosocial domains, and in quality of life.At hospital discharge nine measurement instruments were tested for their reliability to assess TBI patients on (basic) activities of daily living, and on cognitive, behavioural and emotional functioning. The one year post-injury study was performed to investigate the interobserver reliability of 19 measurement instruments; the same nine measurement instruments used in the hospital discharge study were used to assess the level of activity as well as 10 additional measurement instruments to assess different aspects of personal, social and work-related participation and quality of life. The sensitivity to change study was
36
Chapter 3
performed to judge whether the measurement error is small enough to justify the use of the measurement instruments to detect change over time at the level of activity, participation and quality of life.
Methods
PatientsThe Rotterdam TBI study is a prospective follow-up study on the determinants of long-term functional outcome in patients who sustained a TBI. The source population is formed by all TBI patients (aged 18-65 years) admitted to the department of Neurosurgery of the Erasmus MC with a (on arrival at the Emergency Unit of the hospital) Glasgow Coma Scale (GCS) score of 14 (with brain damage on CT) or less. This study was approved by the hospital’s Medical Ethical Committee, and written informed consent was obtained from all patients either directly or by legal proxy. The study’s psychologist (BvB) recruits the patients. From our literature review we established measurement instruments used in the physical, cognitive, psychosocial and socio-economic domain to classify functional status at discharge from the hospital, rehabilitation center or nursing home, as well as at 3, 6, 12, 18, 24 and 36 months after injury.17
Interobserver study at hospital dischargeTwenty-five consecutive respondents to the main study (described above) were invited to participate in the present study. In addition to the study’s psychologist (BvB), a resident in rehabilitation medicine (MvW) also interviewed the patients 1 to 4 days before or after discharge from the hospital. Time between the two assessments ranged from 1 to 7 (mean 3) days. Each interviewer used the same nine measurement instruments.
Interobserver study one year post-injuryFourteen patients were invited to participate. In addition to the study’s psychologist (BvB), another psychologist (MvK) also visited the patients one year post-injury at their homes. Time between the two assessments ranged from 6 to 31 (mean 13) days. Each psychologist used the same 19 measurement instruments.Prior to the start of both interobserver studies, the two observers reached consensus on how the various measurement instruments should be applied. During the assessment interviews they were not aware of each other’s assessments.
Sensitivity to change studySensitivity to change was assessed by using the data from the interobserver study one year post-injury.
37
Reliability and sensitivity to change of measurement instruments used in a TBI population
Measurement instrumentsWe categorized the measurement instruments into the physical, cognitive and psychosocial domains, and the quality of life. More information about the measurement instruments is given in the Appendix.
Physical domain1. Barthel Index.17,18
2. Functional Independence Measurement.17,19-23
3. The Glasgow Outcome Scale.17,24
4. Glasgow Outcome Scale Extended.17,25
Cognitive domain5. Disability Rating Scale.17,26
6. Functional Assessment Measurement.17,27
7. The Rancho Los Amigos Levels of Cognitive Functioning Scale.17,28
Psychosocial domain8. Rehabilitation Activities Profile.29
Quality of life9. The Dartmouth Coop Functional Health Assessment Charts/Wonca.17,30
Additional measurement instruments used for the one year post-injury studyFor the one year post-injury study 19 measurement instruments were used. In addition to the nine measurement instruments mentioned above, the following 10 measurement instruments were used:
Cognitive domain10. Neurobehavioural Rating Scale.17,31
Psychosocial domain11. Community Integration Questionnaire.17,32
12. Employability Rating Scale.33
13. Frenchay Activities Index.34
14. Multi- dimensional Health Locus of Control Scale.35
15. Social Support List Interactions and Social Support List Discrepancies.36
16. Supervision Rating Scale.17,37
17. Wimbledon Self Reporting Scale.17,38
Quality of life18. Rand-36.17,39-42
19. Sickness Impact Profile-68.17,43-48
38
Chapter 3
Statistical analysesInterobserver studiesThe percentage of agreement was determined by calculating the percentage of patients rated identically by the two observers. To determine whether a measurement instrument is capable of differentiating between patients, the Squared Weighted Kappa statistic (SWK) was calculated. The Kappa statistic is defined as the percentage of the total agreement that occurs beyond the contribution by chance. The SWK also takes into account the amount of disagreement between the two observers.49 Statistical analysis for SWKs was done using the Dos Academic Agree program.The Intraclass Correlation Coefficient (ICC) is the preferred method to quantify reproducibility taking systematic variability into account.50 ICC is calculated as the ratio of the variance between subjects (i.e. variance of interest) over the total variance (composed of variance of interest and error variance). If Varp is the amount of variance between subjects, Varo the amount of variance between observers, and Varpo the variance attributed to the interaction between patient and observer, the ICC is calculated as: Varp/(Varp + Varo + Varpo).
51,52 ICC can only be calculated for measurement instruments with sumscores (BI, DRS sumscore, FIM, FAM, NRS, RAP, WSRS, CIQ, Coop, Rand, SIP-68, and SSL).The amount of measurement error can be expressed as the Standard Error of Measurement (SEM), which is derived by taking the square root of the error variance, i.e. Varo + Varpo. Similar to the ICC, the error variance and SEM include both random and systematic components of measurement error. The advantage of the SEM is that it is expressed in the metric unit of the measurement instrument. Assuming that measurement errors are distributed normally, the 95% confidence interval (CI) of the SEM (± 1.96 x SEM) can be used to express the expected distribution of error around a measurement result.51,52
To determine whether a measurement instrument can be considered reliable we followed a commonly used ranking of the estimates, i.e. values of SWK and ICC ≥ 0.75 are excellent, from 0.60 to 0.74 are good, from 0.40 to 0.59 are moderate, and values less than 0.40 are poor.53
A disadvantage of the SEM is that no clear criteria for an acceptable value are available. In this study we expressed the SEM as a percentage of the total possible range of the instrument, and stated that a percentage lower than 10 is satisfactory.
Sensitivity to change studyThe smallest detectable difference (SDD) is an indicator of sensitivity to change. The SDD can only be calculated for the measurement instruments with sumscores. Based on the SEM, the SDD with 95% confidence is calculated as 1.96 X √2 X SEM. Only differences between two consecutive measurements greater than the SDD can be interpreted with 95% certainty as real change. There is an essential difference between “clinically relevant change” and SDD. The SDD is a clinimetric property of a measurement instrument, while the “clinically relevant change” is the change which clinicians and researchers minimally expect or judge as being an important change.50,54 However, for the domains of functional outcome measured with the instruments in the present study, the “clinically relevant
39
Reliability and sensitivity to change of measurement instruments used in a TBI population
change” is not known.Therefore, we used an alternative approach to judge whether the measurement error is small enough to make a test valuable in clinical practice; for this judgment different methods have been proposed,55,56 but no criteria exist. We expressed the SDD as a percentage of the total possible range of the measurement instrument to get a relative value. We judged that a measurement instrument with an SDD percentage smaller than 15 shows an acceptable sensitivity to change, as it can distinguish 7 steps in the total measurement range.57,58 In addition, we calculated the differences between the data at discharge and at one year post-injury, to estimate clinically relevant changes for this phase of recovery. We also checked whether the SDD of the measurement instrument is small enough to detect this difference.
Results
Interobserver study at hospital dischargeTwenty-five patients (17 males and 8 females) were invited to participate. Two patients were excluded from the analyses because the time between the two interviews was considered too long (over three weeks); another patient was excluded because one observer interviewed him at the hospital and the other 7 days later at the rehabilitation center. Finally, data on 22 patients (14 males and 8 females) were available for this interobserver study. The mean length of stay at the hospital was 35 days with a standard deviation (SD) of 19 days. Eleven patients were discharged home, 9 to a rehabilitation center, and 2 patients to a nursing home. The mean age of the participants was 35.3 years (SD 12.8), and the median GCS score was 7 (interquartile range 6.5). Table 1 gives the (observed) score ranges, the percentage of agreement, SWK values, ICCs, and SEMs of the measurement instruments for 22 patients at discharge from the hospital.
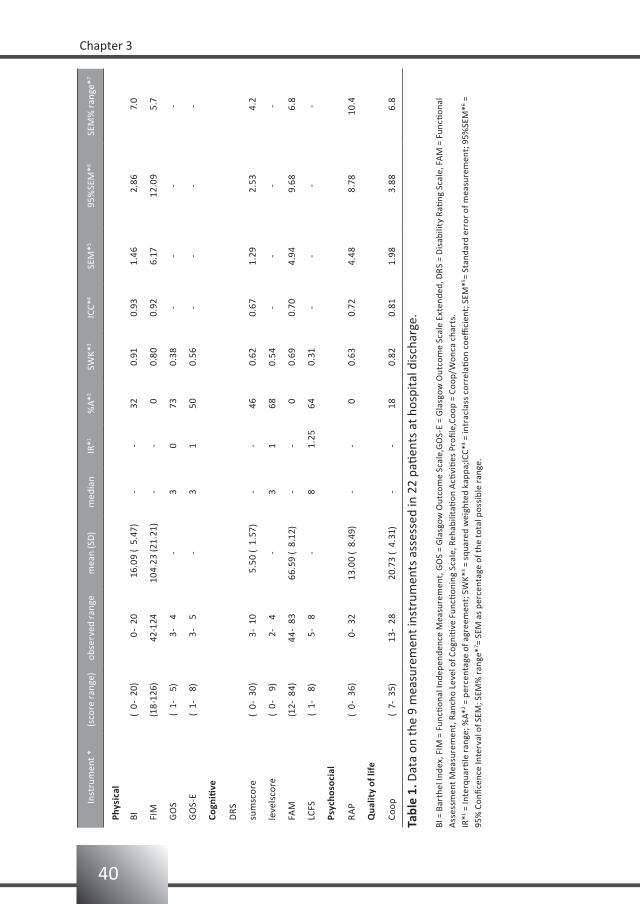
40
Chapter 3
Inst
rum
ent *
(sco
re r
ange
)ob
serv
ed r
ange
mea
n (S
D)
med
ian
IR*1
%A*
2SW
K*3
ICC*
4SE
M*5
95%
SEM
*6SE
M%
ran
ge*7
Phys
ical
BI(
0- 2
0) 0
- 20
16.
09 (
5.4
7)-
-32
0.91
0.93
1.46
2.8
6 7
.0
FIM
(18-
126)
42-1
2410
4.23
(21.
21)
--
00.
800.
926.
1712
.09
5.7
GO
S(
1-
5)
3-
4-
30
730.
38-
--
-
GO
S-E
( 1-
8
) 3
- 5
-3
150
0.56
--
--
Cogn
itive
DRS
sum
scor
e(
0- 3
0) 3
- 10
5
.50
( 1.
57)
--
460.
620.
671.
29 2
.53
4.2
leve
lsco
re(
0-
9)
2-
4-
31
680.
54-
--
-
FAM
(12-
84)
44-
8366
.59
( 8.
12)
--
00.
690.
704.
94 9
.68
6.8
LCFS
( 1-
8
) 5
- 8
-8
1.25
640.
31-
--
-
Psyc
hoso
cial
RA
P(
0- 3
6) 0
- 32
13.0
0 (
8.49
)-
- 0
0.63
0.72
4.48
8.7
810
.4
Qua
lity
of li
fe
Coop
( 7-
35)
13-
2820
.73
( 4.
31)
--
180.
820.
811.
98 3
.88
6.8
Tabl
e 1.
Dat
a on
the
9 m
easu
rem
ent i
nstr
umen
ts a
sses
sed
in 2
2 pa
tient
s at
hos
pita
l dis
char
ge.
BI =
Bar
thel
Inde
x, F
IM =
Fun
ction
al In
depe
nden
ce M
easu
rem
ent,
GO
S =
Gla
sgow
Out
com
e Sc
ale,
GO
S-E
= G
lasg
ow O
utco
me
Scal
e Ex
tend
ed, D
RS =
Dis
abili
ty R
ating
Sca
le, F
AM
= F
uncti
onal
A
sses
smen
t Mea
sure
men
t, R
anch
o Le
vel o
f Cog
niti
ve F
uncti
onin
g Sc
ale,
Reh
abili
tati
on A
ctivi
ties
Pro
file,
Coop
= C
oop/
Won
ca c
hart
s.IR
*1 = In
terq
uarti
le r
ange
; %A*
2 = p
erce
ntag
e of
agr
eem
ent;
SW
K*3 =
squ
ared
wei
ghte
d ka
ppa;
ICC*
4 = in
trac
lass
cor
rela
tion
coe
ffici
ent;
SEM
*5 = St
anda
rd e
rror
of m
easu
rem
ent;
95%
SEM
*6 =
95%
Con
ficen
ce In
terv
al o
f SEM
; SEM
% r
ange
*7 = SE
M a
s pe
rcen
tage
of t
he to
tal p
ossi
ble
rang
e.

41
Reliability and sensitivity to change of measurement instruments used in a TBI population
In the physical domain, a low percentage of agreement was found for the FIM (i.e. 0), but the FIM shows excellent SWK and ICC. Table 1 also gives the SEMs and the 95% CI of the measurement instruments. For example, the SEM for the FIM is 6.17, and the 95% CI is+/- 12.09. This implies that when a patient is scored 80 on the FIM one can be 95% sure that this patient’s real score ranges from 67 to 93. By expressing the SEM as a percentage of the total possible range in the last column of Table 1, the measurement instruments can be compared according to their measurement error. The FIM has the smallest measurement error. In the cognitive domain, a low percentage of agreement was found for the FAM (i.e. 0), but the FAM shows excellent SWK and ICC.
Interobserver study one year post-injuryFourteen patients (9 males and 5 females) participated in the interobserver study one year post-injury. The mean length of stay at the hospital was 38 days with a SD of 33 days. At the time of hospital discharge (one year earlier) 6 persons were discharged home, 7 to a rehabilitation center, and 1 patient was discharged to a nursing home. The mean age of the participants was 34.6 years (SD 11.1), and the median GCS score was 7 (interquartile range 6.5).Table 2 gives the (observed) score ranges, the percentage of agreement, SWK values, ICCs, and SEMs of the measurement instruments one year post-injury.
In the physical domain a low percentage of agreement, but excellent SWK and ICC was found for the FIM. The SEM for the FIM one year post-injury is 3.22, and the 95% CI is +/- 6.31. Now, when a patient is scored 80 on the FIM one can be 95% sure that this patient’s real score ranges from 73 to 87. For the cognitive scores a low percentage of agreement was found for the NRS, but excellent SWK, ICC with satisfactory SEM percentages were found for the FAM, and the NRS. In the psychosocial domain a perfect agreement was found for the SRS-5 (i.e. percentage of agreement is 100) and excellent SWK for the SRS-5. For the quality of life scales excellent SWK, ICC and satisfactory SEM percentage was found for the SIP-68.

42
Chapter 3
Inst
rum
ent *
(sco
re r
ange
)ob
serv
ed r
ange
mea
n (s
d)m
edia
nIR
*1%
A*2
SWK*
3IC
C *4
SEM
*5
95%
SEM
*6
SEM
%ra
nge
*7
Phys
ical
BI(
0-
0)
0
- 20
20.
00 (
0.0
)-
-93
1.00
0.00
0.76
1.4
8 3
.6
FIM
(18-
126)
101-
126
1
18.5
4 (
7.3)
--
210.
750.
753.
22 6
.31
3.0
GO
S(
1-
5)
4
- 5
-4
0
.571
0.25
--
--
GO
S-E
( 1-
8
)
5-
7-
6
1.5
570.
57-
--
-
Cogn
itive
DRS
sum
-sco
re( 0
- 30
)
0-
4
1.6
9 (
1.5)
--
360.
030.
860.
66 1
.29
2.1
leve
l-sc
ore
( 0-
9
)
0-
3-
12
360.
04-
--
-
FAM
(12-
84)
64-
84
76.
15 (
6.2
)-
-29
0.95
0.95
1.32
2.5
9 1
.8
LCFS
( 1-
8
)
7-
8-
80
710.
32-
--
-
NRS
NRS
ener
gy(
0- 4
2)
0-
15-
3
6.5
360.
85-
--
-
NRS
met
acog
niti
on(
0- 3
6)
0-
7-
03
430.
03-
--
-
NRS
anxi
ety
( 0-
36)
0
- 8
-1
3
.521
0.58
--
--
NRS
lang
uage
( 0-
18)
0
- 7
-1
4
.557
0.74
--
--
NRS
-sco
re(
0-16
2)
0-
40
1
1.62
(12.
2)-
-21
0.85
0.77
4.79
9.3
9 2
.5
Psyc
hoso
cial
RA
P(
0- 3
6)
0-
3
0.7
1 (
1.4)
--
500.
470.
441.
91 3
.74
4.9
CIQ
9
- 20
16.
77 (
3.2
)-
-21
0.64
0.69
2.23
4.3
7 7
.4
CIQ
hi(
0- 1
0)
2-
8-
44
360.
92-
--
-
CIQ
si(
0- 1
2)
4-
12-
83
140.
7-
--
-
CIQ
p(
0-
7)
1
- 6
-5
457
0.78
--
--
ERS
( 1-
10)
1
- 10
-9
957
0.45
--
--
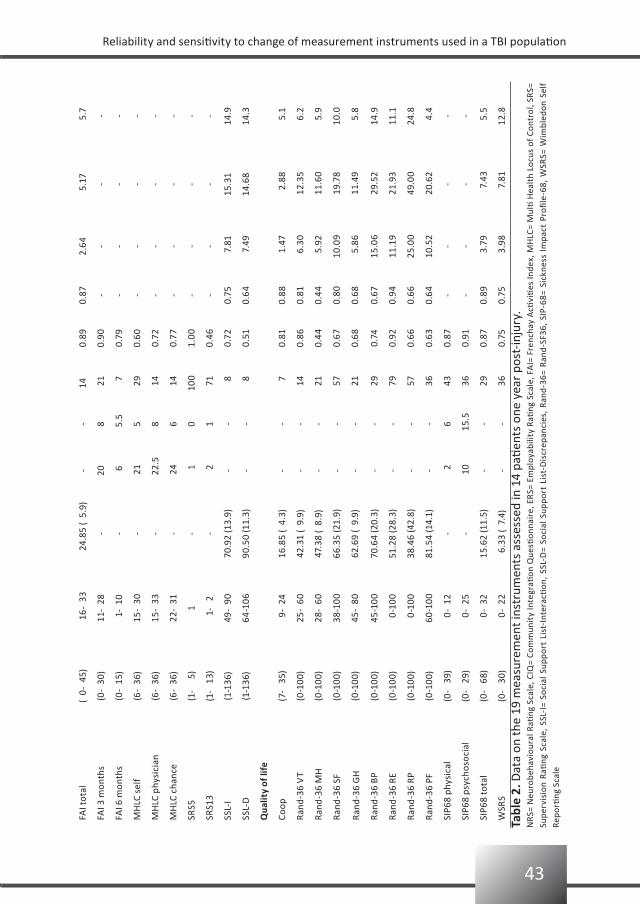
43
Reliability and sensitivity to change of measurement instruments used in a TBI population
FAI t
otal
( 0-
45)
16-
33
24.
85 (
5.9
)-
-14
0.89
0.87
2.64
5.1
7 5
.7
FAI 3
mon
ths
(0-
30)
11-
28-
208
21
0.90
--
--
FAI 6
mon
ths
(0-
15)
1-
10-
6
5.5
7
0.79
--
--
MH
LC s
elf
(6-
36)
15-
30-
21
5 2
9
0.
60-
--
-
MH
LC p
hysi
cian
(6-
36)
15-
33-
2
2.5
8 1
40.
72-
--
-
MH
LC c
hanc
e(6
- 36
)22
- 31
- 2
46
14
0.77
--
--
SRS5
(1-
5)
1-
1
010
0
1.
00-
--
-
SRS1
3(1
- 1
3) 1
- 2
-
21
71
0.46
--
--
SSL-
I(1
-136
)49
- 90
70.9
2 (1
3.9)
--
8
0.72
0.75
7.8
115
.31
14.9
SSL-
D(1
-136
)64
-106
90.5
0 (1
1.3)
--
8
0.51
0.64
7.4
914
.68
14.3
Qua
lity
of li
fe
Coop
(7-
35)
9-
2416
.85
( 4.
3)-
-
70.
810.
88 1
.47
2.
88 5
.1
Rand
-36
VT
(0-1
00)
25-
6042
.31
( 9.
9)-
- 1
40.
860.
81 6
.30
12.
35 6
.2
Rand
-36
MH
(0-1
00)
28-
6047
.38
( 8.
9)-
- 2
10.
440.
44 5
.92
11.
60 5
.9
Rand
-36
SF(0
-100
)38
-100
66.3
5 (2
1.9)
--
57
0.67
0.80
10.0
9 1
9.78
10.0
Rand
-36
GH
(0-1
00)
45-
8062
.69
( 9.
9)-
- 2
10.
680.
68 5
.86
11.
49 5
.8
Rand
-36
BP(0
-100
)45
-100
70.6
4 (2
0.3)
--
29
0.74
0.67
15.0
6 2
9.52
14.9
Rand
-36
RE(0
-100
) 0
-100
51.2
8 (2
8.3)
--
79
0.92
0.94
11.1
9 2
1.93
11.1
Rand
-36
RP(0
-100
) 0
-100
38.4
6 (4
2.8)
--
57
0.66
0.66
25.0
0 4
9.00
24.8
Rand
-36
PF(0
-100
)60
-100
81.5
4 (1
4.1)
--
36
0.63
0.64
10.5
2 2
0.62
4.4
SIP6
8 ph
ysic
al(0
- 3
9) 0
- 12
-
2 6
43
0.87
--
--
SIP6
8 ps
ycho
soci
al(0
- 2
9) 0
- 25
- 1
0 1
5.5
36
0.91
--
--
SIP6
8 to
tal
(0-
68)
0-
3215
.62
(11.
5)-
- 2
90.
870.
89 3
.79
7
.43
5.5
WSR
S(0
- 3
0) 0
- 22
6.3
3 (
7.4)
--
36
0.75
0.75
3.9
8
7.8
112
.8
Tabl
e 2.
Dat
a on
the
19 m
easu
rem
ent i
nstr
umen
ts a
sses
sed
in 1
4 pa
tient
s on
e ye
ar p
ost-
inju
ry.
NRS
= N
euro
beha
viou
ral R
ating
Sca
le, C
IQ=
Com
mun
ity
Inte
grati
on Q
uesti
onna
ire,
ERS
= Em
ploy
abili
ty R
ating
Sca
le, F
AI=
Fre
ncha
y A
ctivi
ties
Inde
x, M
HLC
= M
ulti
Hea
lth
Locu
s of
Con
trol
, SR
S=
Supe
rvis
ion
Ratin
g Sc
ale,
SSL
-I=
Soci
al S
uppo
rt L
ist-
Inte
racti
on,
SSL-
D=
Soci
al S
uppo
rt L
ist-
Dis
crep
anci
es,
Rand
-36=
Ran
d-SF
36,
SIP-
68=
Sick
ness
Im
pact
Pro
file-
68,
WSR
S= W
imbl
edon
Sel
f Re
porti
ng S
cale
44
Chapter 3
Sensitivity to change studyTable 3 presents the SDDs for all the measurement instruments. The 95% SDD for the BI is 2.11, meaning that for the BI a change of at least 3 points is needed between two sessions to be 95% confident that a real change has occurred.
Based on the SDD expressed as a percentage of the total possible range, measurement instruments with a satisfactory SDD in the physical domain are the FIM and the BI. For the cognitive domain satisfactory SDDs were found for the FAM, the DRS sumscore and the NRS sumscore. In the psychosocial domain the RAP sumscore and the FAI sumscore had satisfactory SDDs. For the quality of life domain, Rand-physical Functioning, Coop and the SIP-68 had satisfactory SDDs.Only for the BI, FIM, DRS, FAM and Coop was it possible to calculate the differences between the scores at hospital discharge and at one year follow-up. Except for the Coop, differences between these scores were larger than the calculated SDDs (see Table 3).Therefore, in this study a clinically relevant change was detected by all the measurement instruments, with the exception of the Coop.
Discussion
Because of the importance of having short interviews among TBI patients, we identified interobserver reliability and sensitivity to change of different measurement instruments at different time points to form a minimum data set.
Reliability at dischargeBased on the results of this study, at the time of discharge from hospital the limitations in the physical domain can be assessed with the BI and the FIM, in the cognitive domain with the FAM, and the Coop is most appropriate for assessing quality of life.
Reliability one year post-injuryAt one year post-injury, limitations in the physical domain can be assessed with the FIM and in the cognitive domain with the FAM and the NRS. Restrictions in the psychosocial domain can be assessed with the FAI, the CIQ, and the WSRS, whereas the Coop, all Rand subscales (except Rand mental health), and the SIP-68 are reliable measurement instruments for quality of life.
Sensitivity to changeThe measurement instruments most sensitive to clinically relevant change are the BI, the FIM, the DRS and the FAM. In addition, the NRS, the Coop and the SIP-68 are promising regarding sensitivity to change, as they are able to detect relatively small differences in a patient over time.
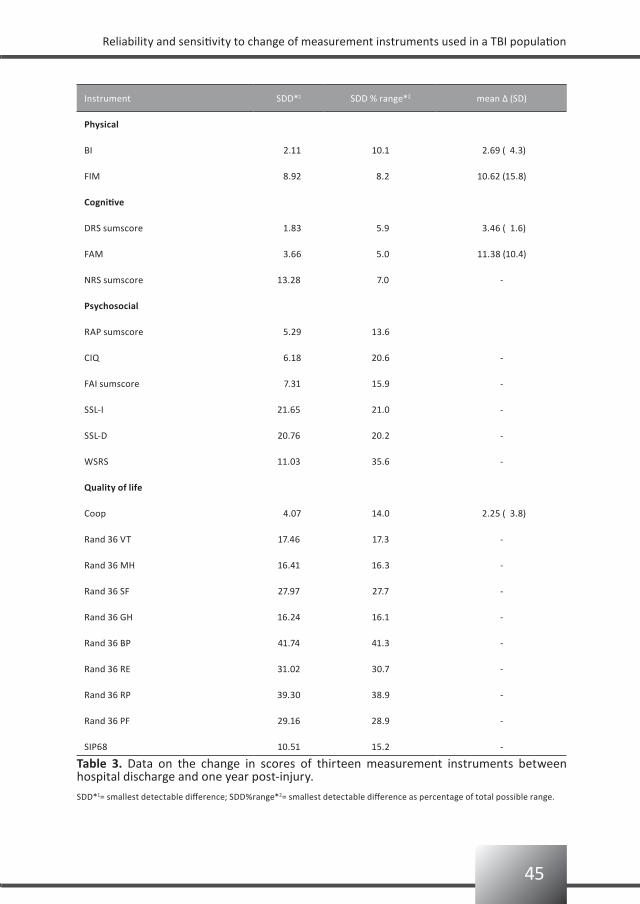
45
Reliability and sensitivity to change of measurement instruments used in a TBI population
Instrument SDD*1 SDD % range*2 mean Δ (SD)
Physical
BI 2.11 10.1 2.69 ( 4.3)
FIM 8.92 8.2 10.62 (15.8)
Cognitive
DRS sumscore 1.83 5.9 3.46 ( 1.6)
FAM 3.66 5.0 11.38 (10.4)
NRS sumscore 13.28 7.0 -
Psychosocial
RAP sumscore 5.29 13.6
CIQ 6.18 20.6 -
FAI sumscore 7.31 15.9 -
SSL-I 21.65 21.0 -
SSL-D 20.76 20.2 -
WSRS 11.03 35.6 -
Quality of life
Coop 4.07 14.0 2.25 ( 3.8)
Rand 36 VT 17.46 17.3 -
Rand 36 MH 16.41 16.3 -
Rand 36 SF 27.97 27.7 -
Rand 36 GH 16.24 16.1 -
Rand 36 BP 41.74 41.3 -
Rand 36 RE 31.02 30.7 -
Rand 36 RP 39.30 38.9 -
Rand 36 PF 29.16 28.9 -
SIP68 10.51 15.2 -
Table 3. Data on the change in scores of thirteen measurement instruments between hospital discharge and one year post-injury.
SDD*1= smallest detectable difference; SDD%range*2= smallest detectable difference as percentage of total possible range.
46
Chapter 3
Other clinimetric criteriaAlthough establishing interobserver reliability and sensitivity to change are important steps in deciding which measurement instruments to use in a prospective follow-up study, they are not the only criteria:First, the measurement instrument must cover the whole range of long-term consequences after the injury. Traditionally, outcome after TBI is assessed by the GOS. However, because the GOS ratings tend to plateau at 6 months this measurement instrument will be insensitive to the gains shown by patients after this period23. The BI is also limited in scope because it does not take into account psychological status, social functioning or household activities. Again, a ceiling effect will prevent the detection of further relevant improvements in TBI patients (one year post-injury mean BI score is 19). Our one year post-injury study shows that for the BI there is no variance between patients (Var P is zero) and therefore it follows that the ICC is zero. So, despite excellent SWK and a BI score with a small SEM and a small SDD, the BI is not the preferred measurement instrument in TBI follow-up research.Second, measurement instruments must be uni-directional. For example, in the relationship domain the RAP does not indicate the direction of a change in quality. Early after injury personal and social relationships tend to be better, but they can worsen later on. In both cases, the score will be 3 (i.e. great change in relationships), but without clarifying the direction of the change. Therefore, we did not use the domain relationship in the present study.Third, the simplicity and clinical utility of a measurement instrument can be important in deciding which measurement instrument to use. An example is the LCFS which has achieved almost universal acceptance in the United States.59
Limitations of the present studyThe main limitation is the small sample sizes; however, having additional subjects would not change the mean values but would only make the confidence interval smaller.Another limitation is that we used different observers at different time points, and these observers were not experienced in using these measurement instruments. However, we believe that the statistical data of this study can only be improved by using the same observers (with the same amount of experience as the study psychologist) at both hospital discharge and one year post-injury.In this study all our TBI patients had been admitted to the neurosurgery unit. Because the rehabilitation population is part of the neurosurgical population, the reliability data, and sensitivity to change would be even better when measured in the rehabilitation population only.

47
Reliability and sensitivity to change of measurement instruments used in a TBI population
Conclusion
In this study, at hospital discharge the FIM is the most appropriate measurement instrument to assess limitations in the physical domain, the FAM is most appropriate for assessing limitations in the cognitive domain, and the Coop for assessing quality of life. At later stages of recovery this minimum data set can best be extended with the NRS for assessing the limitations in the cognitive domain, the FAI for assessing restrictions in the psychosocial domain, and the SIP-68 for assessing quality of life.
Clinical message
Because of the small concentration span often reported in TBI patients, it is 1. important to have short interviews with a minimum data set.At the moment of discharge from hospital a reliable minimum set is the FIM, the 2. FAM, and the Coop.At follow-up the data set can be extended with the NRS, the FAI and the SIP-68 which 3. are most sensitive to change, thereby covering all relevant domains of functioning and participation after TBI.
48
Chapter 3
References
Sahgal V, Heinemann A. Recovery of function during inpatient rehabilitation for moderate traumatic brain 1.
injury. Scand J Rehabil Med 1989;21:71-79.
Dawson DR, Chipman M. The disablement experienced by traumatically brain-injured adults living in the 2.
community. Brain Inj 1995;9:339-353.
Greenspan AI, Wrigley JM, Kresnow M, Branche-Dorsey CM, Fine PR. Factors influencing failure to return 3.
to work due to traumatic brain injury. Brain Inj 1996;10:207-218.
Ponsford JL, Olver JH, Curran C. Ng K. Prediction of employment status 2 years after traumatic brain 4.
injury. Brain Inj 1995;9:11-20.
Hall KM, Karzmark P, Stevens M. Englander J, O’Hare P, Wright J. Family stressors in traumatic brain injury: 5.
a two-year follow-up. Arch Phys Med Rehabil 1994;75:876-884.
McLean AJr, Dikmen SS, Temkin NR. Psychosocial recovery after head injury. Arch Phys Med Rehabil 6.
1993;74:1041-1046.
Johnston MV, Hall K, Carnevale G, Boake C.: Functional assessment and outcome in traumatic brain injury 7.
rehabilitation. In: L.J. Horn and N.D Zasler (editors) Medical rehabilitation of traumatic brain injury
(Philadelphia: Hanley & Belfus), pp. 197-226,1996.
Johnston MV, Hall KM. Outcomes evaluation in TBI Rehabilitation. Part I: overview and system principles. 8.
Arch Phys Med Rehabil 1994;75:SC1-9; discussion SC27-28.
Marshall LF, Gautille T, Klauber MR, Eisenberg HM, Jane JA, Luerssen TG. The outcome of severe closed 9.
head injury. J Neurosurg 1991;75: S28-36.
Teasdale GM, Braakman R, Cohadon F, Dearden M, Iannotti F, Karimi A, Lapierre F, Maas A, Murray G, 10.
Ohman J, Persson L, Servadei F, Stocchetti N, Trojanowski T, Unterberg A. The European Brain Injury
Consortium. Nemo solus satis sapit: nobody knows enough alone. Acta Neurochir 1997;139:797-803.
Maas AIR, Dearden M, Teasdale GM, Braakman R, Cohadon F, Iannotti F, Karimi A, Lapierre F, Murray G, 11.
Ohman J, Persson L, Servadei F, Stocchetti N, Unterberg A. EBIC guidelines for management of severe
head injury in adults. Acta Neurochir 1997;139:286-294.
Novack TA, Bush BA, Meythaler JM, Canupp K. Outcome after traumatic brain injury: pathway analysis of 12.
contributions from premorbid, injury severity, and recovery variables. Arch Phys Med Rehabil
2001;82:300-305.
Dikmen SS, Machamer MA, Powell JM, Temkin NR. Outcome 3 to 5 years after moderate to severe 13.
traumatic brain injury. Arch Phys Med Rehabil 2003;84:1449-1457.
Bushnik T, Hanks RA, Kreutzer J, Rosenthal M. Etiology of traumatic brain injury: characterization of 14.
differential outcomes up to 1 year postinjury. Arch Phys Med Rehabil 2003;84: 255-262.
Hammond FM, Grattan KD, Sasser H, Corrigan JD, Rosenthal M, Bushnik T, Shull W. Five years after 15.
traumatic brain injury: a study of individual outcomes and predictors of change in function.
NeuroRehabilitation 2004;19:25-35.
Turner-Stokes, L. Outcome measurement in brain injury rehabilitation-towards a common language. Clin 16.
Rehabil 1991;13:273-275.
Van Baalen B, Odding E, Maas AIR, Ribbers GM, Bergen MP, Stam HJ. Traumatic brain injury: classification 17.
of initial severity and determination of functional outcome. Disabil Rehabil 2003;25:9-18.
49
Reliability and sensitivity to change of measurement instruments used in a TBI population
Collin C, Wade DT, Davies S, Home, V. The Barthel Index: a reliability study. Int Disabil Stud 1988;10:61-63.18.
Granger CV, Hamilton BB, Keith RA, Zielezny M, Sherwin FS. Advances in functional assessment for 19.
medical rehabilitation. Topics Ger Rehabil 1986;1:59-74.
Granger CV, Cotter AC, Hamilton BB, Fiedler RC, Hens MM. Functional assessment scales: a study of 20.
persons with multiple sclerosis. Arch Phys Med Rehabil 1990;71:870-875.
Granger CV, Cotter AC, Hamilton BB, Fiedler RC. Functional assessment scales: a study of persons after 21.
stroke. Arch Phys Med Rehabil 1993;74:133-138.
Granger CV, Divan N, Fiedler RC. Functional assessment scales. A study of persons after traumatic brain 22.
injury. Am J Phys Med Rehabil 1995;74:107-113.
Ottenbacher KJ, Hsu Y, Granger CV, Fiedler RC. The reliability of the functional independence measure: a 23.
quantitative review. Arch Phys Med Rehabil 1996;77:1226-1232.
Jennett B, Bond M. Assessment of outcome after severe brain damage. A practical scale. Lancet 24.
1975;1:480-484.
Wilson JT, Pettigrew LE, Teasdale GM. Structured interviews for the Glasgow Outcome Scale and the 25.
extended Glasgow Outcome Scale: guidelines for their use. J Neurotrauma 1998;15:573-585.
Rappaport M, Hall KM, Hopkins K, Belleza T, Cope DN. Disability rating scale for severe head trauma: 26.
coma to community. Arch Phys Med Rehabil 1982;63:118-123.
Donaghy S, Wass PJ. Interrater reliability of the functional assessment measure in a brain injury 27.
rehabilitation program. Arch Phys Med Rehabil 1998;79:1231-1236.
Zasler ND. Prognostic indicators in medical rehabilitation of traumatic brain injury: a commentary and 28.
review. Arch Phys Med Rehabil 1997;78:S12-S16.
Jelles F, Van Bennekom CA, Lankhorst GJ, Sibbel CJ, Bouter LM. Inter- and intra-rater agreement of the 29.
Rehabilitation Activities Profile. J Clin Epidemiol 1995;48:407-416.
König-Zahn C.: The COOP/WONCA Charts. In: A. Hutchinson, AN. Bentzen and C. König-Zahn (editors) 30.
Cross Cultural Health Outcome Assessment: a user´s guide, pp 48-53, 1997.
Levin HS, High WM, Goethe KE, Sisson RA, Overall JE, Rhoades HM, Eisenberg HM, Kalisky Z, Gary HE. The 31.
neurobehavioural rating scale: assessment of the behavioural sequelae of head injury by the clinician. J
Neurol Neurosurg Psychiatry 1987;50:183-193.
Willer B, Ottenbacher KJ, Coad ML. The community integration questionnaire. A comparitive examination. 32.
Am J Phys Med Rehabil 1994;73:103-111.
Ben-Yishay Y, Silver SM, Piasetsky E, Rattok J. Relationship between employability and vocational 33.
outcome after intensive holistic cognitive rehabilitation. J Head Trauma Rehabil 1987;2:35-48.
Holbrook M, Skilbeck CE. An activities index for use with stroke patients. Age Ageing 1983;12:166-170.34.
Wallston KA, Wallston BS, DeVellis R. Development of the Multidimensional Health Locus of Control 35.
Scales. Health Educ Monogr 1978;6:160-166.
Van Sonderen E. Sociale Steun Lijst - Interakties (SSL-I) en Sociale Steun Lijst – Discrepanties (SSL-D). 36.
Groningen: Noordelijk Centrum voor Gezondheidsvraagstukken Rijksuniversiteit Groningen, 1997.
Boake C. Supervision Rating Scale: a measure of functional outcome from brain injury. Arch Phys Med 37.
Rehabil 1996;77:765-772.

50
Chapter 3
Coughlan AK, Storey P. The Wimbledon Self-Report Scale: emotional and mood appraisal. Clin Rehabil 38.
1988; 2: 207-213.
Ware JE, Sherbourne CD. The MOS 36-Item Short-Form Health Survey (SF-36). I: Conceptual framework 39.
and item selection. Med Care 1992;30:473-483.
Brazier JE, Harper R, Jones NM, O’Cathain A, Thomas KJ, Usherwood T, Westlake L. Validating the SF-36 40.
health survey questionnaire: a new outcome measure for primary care. BMJ 1992;305:160-164.
Ware J, Snow KK, Kosinski M, Gandeck B.: SF-36 Health Survey: manual and interpretation guide (Boston, 41.
MA: The Health Institute, New England Medical Center Hospitals),1993.
McHorney CA, Ware JE, Raczek AE. The MOS-36-Item Short-Form Health Survey (SF-36)II:Psychometric 42.
and clinical tests of validity in measuring physical and mental health constructs. Med Care
1993;31:247-263.
Corrigan JD, Smith-Knapp K, Granger CV. Outcomes in the first 5 years after traumatic brain injury. Arch 43.
Phys Med Rehabil 1998;79(3):298-305.
Smith JL, Magill-Evans J, Brintnell S. Life satisfaction following traumatic brain injury. Can J Rehabil 44.
1998;11(3):131-140.
Van Balen HGG, Mulder Th. Beyond the stereotype: an epidemiological study on the long-term sequelae 45.
of traumatic brain injury. Clin Rehabil 1996;10:259-266.
Moore AD, Stambrook M, Gill DD, Lubusko AA. Differences in long-term quality of life in married and 46.
single TBI patients. Can J Rehabil 1992;6(2):89-98.
Fleming JH, Strong J, Ashton R. Cluster analysis of self-awareness levels in adults with traumatic brain 47.
injury and relationship to outcome. J Head Trauma Rehabil 1998;13(5):39-51.
De Bruin AF, Diederik JPM, Witte de LP, Stevens FCJ, Philipsen H. The development of a short generic 48.
version of the Sickness Impact Profile. J Clin Epidemiol 1994;47:407-418.
Sacket DL, Haynes RB, Guyatt GH, Tugwell P.: Clinical Epidemiology: A basic science for clinical medicine 49.
(2nd ed). (Boston/Toronto/London: Little, Brown and Company), 1991.
Beckerman H, Roebroeck ME, Lankhorst GJ, Becher JG, Bezemer PD, Verbeek AL. Smallest real difference, 50.
a link between reproducibility and responsiveness. Qual Life Res 2001;10:571-578.
Streiner DL. and Norman GR.: Health measurement scales:a practical guide to their development and use 51.
(2nd ed). (Oxford, Oxford University Press), 1995.
Roebroeck ME, Harlaar J, Lankhorst GJ. Reliability assessment of isometric knee extension measurement 52.
with computer-assisted hand-held dynamometer. Arch Phys Med Rehabil 1998;79:442-448.
Fleiss JL.: Statistical methods for rates and proportions (New York: Wiley), 1981.53.
Schreuders TAR, Roebroeck ME, Goumans J, van Nieuwenhuijzen JF, Stijnen TH, Stam HJ. Measurement 54.
error in grip and pinch force measurements in patients with hand injuries. Phys Ther 2003;83:806-815.
Geertzen JH, Dijkstra PU, Stewart RE, Groothoff JW, Ten Duis HJ, Eisma WH. Variation in measurements of 55.
grip strength: a study in reflex sympathetic dystrophy patients. Acta Orthop Scand Suppl. 1998;279:4-11.
Smidt N, van der Windt DA, Assendelft WJ, Mourits AJ, Deville WL, de Winter AF, Bouter LM. 56.
Interobserver reproducibility of the assessment of severity of complaints, grip strength, and pressure
pain threshold in patients with lateral epicondylitis. Arch Phys Med Rehabil 2002;83:1145-1150.
51
Reliability and sensitivity to change of measurement instruments used in a TBI population
Norman GR, Sloan JA, Wyrwich KW. Point/Counterpoint. Interpretation of changes in health-related 57.
quality of life. The remarkable universality of half a standard deviation. Med Care 2003;41:582-592.
MacDermid JC, Stratford P. Applying evidence on outcome measures to hand therapy practice. J Hand 58.
Ther 2004;17:165-173.
Hall KM, Bushnik T, Lakisic-Kazazic B, Wright J, Cantagallo A. Assessing traumatic brain injury outcome 59.
measures for long-term follow-up of community-based individuals. Arch Phys Med Rehabil
2001;82(3):367-374.


Assessment of the patient’s functioning: correspondence between traumatic brain injury patients and their significant others
4
Bianca van Baalen Else Odding Henk J Stam
54
Chapter 4
Abstract
Background: In traumatic brain injury (TBI) the presence of cognitive and linguistic problems may make it difficult to complete measurement instruments or to set realistic rehabilitation goals. Therefore, in both the research and clinical setting, the patient’s family is often asked to complete questionnaires or to set rehabilitation goals. It is, however, unknown whether assessment of the functional level and quality of life of TBI patients and their significant others correspond. Therefore, this study examined the level of agreement between TBI patients and their proxies in the first year post-injury, and investigated whether proxies underestimate or overestimate compared with the patient’s own rating, and whether these differences change in the first year post-injury.Methods: In this random sample 26 pairs (the patient and his/her proxy) completed the Functional Independence Measurement (FIM), the Sickness Impact Profile 68 (SIP68), and the Rand SF-36. For the patients the questionnaires were read aloud, whereas the caregivers filled in the questionnaires themselves. Results: The level of agreement between the FIM motor score, the FIM cognition score, the SIP68, and the Rand SF-36 were moderate for the Rand subscale social functioning; good to excellent agreement was found for all the other measurement instruments. No clinically relevant underestimation or overestimation of the proxy compared with the patient’s own rating was found.Conclusion: In the first year post-injury, the FIM, the SIP68 and the RAND SF-36 can be used either by the TBI patient or by the patient’s proxy to assess the patient’s functioning.
55
Assessment of patient’s functioning: correspondence TBI patients and their significant others
Introduction
Traumatic brain injury (TBI) often results in long-term physical, cognitive, emotional and psychosocial impairments. As a consequence, TBI patients may experience activity limitations and restrictions in participation in many domains of their lives, as well as a lowered quality of life. Several measurement instruments can be used to determine the functional level and quality of life of these patients.1,2 Although it is generally agreed that patients themselves are the best raters of their own functioning, in the presence of cognitive and linguistic problems it may be difficult for them to complete measurement instruments. For example, in the early phase after TBI the patient’s awareness may be reduced or the patient may not be able to concentrate for more than about 30 minutes. Therefore, in TBI research and clinical practice, the patient’s family is often asked by researchers, physicians and therapists to complete questionnaires or to set rehabilitation goals. However, it is unknown whether assessment of the functional level and quality of life of TBI patients and their significant others actually correspond.Earlier reports in other patient populations have shown that proxies tend to overestimate the limitations experienced by the patients and underestimate the quality of life experienced by the patient,3-6 with highest agreement usually found for the concrete, observable domains.7 Most of those studies were conducted in an attempt to minimize exclusion bias when investigating health-related quality of life as an outcome measure. Others were performed to evaluate the proxy rater’s accuracy in rating the patient’s problems for use in care situations when the patient can no longer speak for himself.8
Underestimation/overestimation of the patient’s functioning may have consequences for the interpretation of the outcome measurement instruments, as well as for the planning of interventions and for functional prognosis of the individual patient in the subacute and chronic phase.The purpose of the present study was: 1) to examine the level of agreement between the Functional Independence Measurement (FIM) motor-score, the FIM cognition-score, the Sickness Impact Profile-68 (SIP68), and the Rand SF-36 ratings provided by TBI patients and by their proxies in the first year post-injury, 2) to examine whether proxies underestimate or overestimate when compared with the patient’s own rating, and 3) to examine whether these differences change in the first year post-injury.
Material and methods
The population for the present study is a random sample of 26 patient/proxy pairs, drafted from the 126 patients that were included in the longitudinal Rotterdam TBI study. The Rotterdam TBI study is a prospective follow-up study in which patients are followed for up to three years post-injury. The patients were recruited between January 1999 and June 2004 from either the neurosurgery intensive care unit of the Erasmus MC in Rotterdam (January 1999 to March 2004), the intensive care unit of the Medical Center Haaglanden
56
Chapter 4
location Westeinde in The Hague (September 2002 to June 2004), or the neurosurgery unit of the Utrecht University MC in Utrecht (January 2003 to June 2004). All participating hospitals are level-one trauma centers with protocol-guided acute care facilities, including intracranial pressure monitoring.Inclusion criteria were: (1) admittance to hospital for moderate or severe TBI due to a blunt or penetrating trauma. A moderate TBI is defined as having a Glasgow Coma Scale (GCS) score of 9-13 (13 wíth visible brain damage on CT scan), and a severe TBI is defined as having a GCS score of 3-8;9 (2) age at time of injury between 18 and 65 years; (3) having a primary caregiver. Exclusion criteria were: (1) insufficient knowledge of the Dutch or English language to participate in the study; (2) serious (pre-traumatic) co-morbidity which may interfere with the assessment of TBI-related disability.
Patient characteristicsPatient characteristics included gender, age (in years), TBI severity (i.e. moderate or severe), discharge destination, and patient’s status at the time of being discharged from the hospital. Patient’s physical status was assessed with the Barthel Index (BI)10 and dichotomised into: not limited (BI 19-20) or limited (BI <19).11 Patient’s cognitive status was assessed with the Rancho Level of Cognitive Functioning Scale (LCFS)12 and dichotomised into: not limited (LCFS=8) or limited (LCFS <8).13
This study was approved by the hospital’s Medical Ethics Committee. Primary caregivers were invited to participate by the researcher and were provided with both written and verbal information.
Procedure of testingCaregivers completed part of the measurement instruments used for the longitudinal Rotterdam TBI study, namely the FIM, the SIP-68, and the Rand SF-36. The research psychologist (BvB) read the questionnaires aloud to all the patients; the caregivers filled in the questionnaires themselves. The proxy forms asked caregivers to choose the answers that best described their ‘partner’s/child’s/parent’s situation’. In all other respects, the wording and format of the items were identical for the caregiver and the patient.
Measurement instrumentsFunctional independence measurement (FIM)The FIM measures changes in functional status. This 18-item ordinal scale includes 13 motor items and 5 cognition items. The score ranges from 18 -126; the higher the score the higher the functional level.14
The FIM was administered at all points in time.
Sickness Impact Profile-68 (SIP68)The SIP68 measures on the level of participation and consists of 68 statements. The SIP68 can be divided into SIP-physical and SIP-psychosocial. The psychometric properties of the

57
Assessment of patient’s functioning: correspondence TBI patients and their significant others
SIP68 have been described previously.15-17
The SIP68 was not used at the time of being discharged from the hospital.
Rand SF-36The Rand SF-36 is a questionnaire measuring health-related quality of life comprising 36 questions in 8 categories: physical functioning, role-physical, bodily pain, general health, vitality, social functioning, role-emotional and mental health. The psychometric properties of the Rand SF-36 are reported to be good.18
The Rand SF-36 was not used at the time of being discharged from the hospital.
Data analysis
First, descriptive statistics were collected regarding patients’ age, severity of TBI, and the study measurement instruments.Intraclass correlation coefficients (ICCs) were calculated to estimate the inter-rater reliability of patient and proxy responses to the FIM motor-score, FIM cognition-score, SIP68, and Rand SF-36. The ICC is the preferred method to quantify reproducibility taking systematic variability into account;19 it is calculated as the ratio of the variance between subjects (i.e. variance of interest) over the total variance (composed of variance of interest and error variance).20,21 ICC values less than 0.4 were considered to indicate poor agreement, values ranging from 0.4-0.75 indicate moderate to good agreement, and values greater than 0.75 indicate excellent agreement.22
The amount of measurement error can be expressed as the Standard Error of Measurement (SEM), which is derived by taking the square root of the error variance, i.e. Varo + Varpo. Similar to the ICC, the error variance and SEM include both random and systematic components of measurement error. The advantage of the SEM is that it is expressed in the metric unit of the measurement instrument. Assuming that measurement errors are distributed normally, the 95% confidence interval (CI) of the SEM (± 1.96 x SEM) can be used to express the expected distribution of error around a measurement result. A disadvantage of the SEM is that no clear criteria for an acceptable value are available. In the present study, as well as in our previous study,2 we expressed the SEM as a percentage of the total possible range of the instrument, and stated that a percentage less than 10 is satisfactory.To evaluate any systematic tendency for proxy respondents to overestimate or underestimate health status compared to the patients’ reports, the patient/proxy mean differences on the FIM motor-score, FIM cognition-score, SIP68, and Rand SF-36 were computed. A mean difference significantly above or below (using the Wilcoxon rank sign test at a 0.05 level) provides evidence of systematic bias. Because of the structure of the FIM and Rand SF-36, a mean difference score less than zero indicates that proxy respondents tend to underestimate the health status of the patient, and a mean difference score higher than zero indicates that the proxy overestimates. For the SIP68 a mean difference score above zero indicates that proxy respondents tend to underestimate, whilst a mean difference score less than zero overestimates.
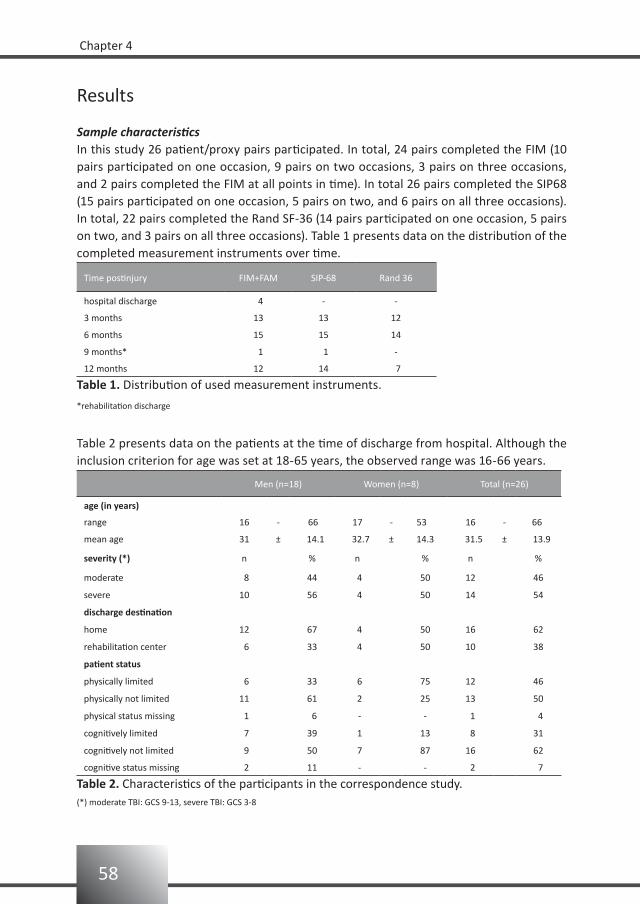
58
Chapter 4
Results
Sample characteristicsIn this study 26 patient/proxy pairs participated. In total, 24 pairs completed the FIM (10 pairs participated on one occasion, 9 pairs on two occasions, 3 pairs on three occasions, and 2 pairs completed the FIM at all points in time). In total 26 pairs completed the SIP68 (15 pairs participated on one occasion, 5 pairs on two, and 6 pairs on all three occasions). In total, 22 pairs completed the Rand SF-36 (14 pairs participated on one occasion, 5 pairs on two, and 3 pairs on all three occasions). Table 1 presents data on the distribution of the completed measurement instruments over time.
Time postinjury FIM+FAM SIP-68 Rand 36
hospital discharge 4 - -
3 months 13 13 12
6 months 15 15 14
9 months* 1 1 -
12 months 12 14 7
Table 1. Distribution of used measurement instruments.
*rehabilitation discharge
Table 2 presents data on the patients at the time of discharge from hospital. Although the inclusion criterion for age was set at 18-65 years, the observed range was 16-66 years.
Men (n=18) Women (n=8) Total (n=26)
age (in years)
range 16 - 66 17 - 53 16 - 66
mean age 31 ± 14.1 32.7 ± 14.3 31.5 ± 13.9
severity (*) n % n % n %
moderate 8 44 4 50 12 46
severe 10 56 4 50 14 54
discharge destination
home 12 67 4 50 16 62
rehabilitation center 6 33 4 50 10 38
patient status
physically limited 6 33 6 75 12 46
physically not limited 11 61 2 25 13 50
physical status missing 1 6 - - 1 4
cognitively limited 7 39 1 13 8 31
cognitively not limited 9 50 7 87 16 62
cognitive status missing 2 11 - - 2 7
Table 2. Characteristics of the participants in the correspondence study.(*) moderate TBI: GCS 9-13, severe TBI: GCS 3-8
59
Assessment of patient’s functioning: correspondence TBI patients and their significant others
No gender effect was found for severity.Twice as many men were discharged home compared to a rehabilitation center, whereas the number of women discharged home was the same as that discharged to a rehabilitation center.According to our definition of being physically and cognitively limited, 46% of the patients were physically limited and 31% of the patients could be considered cognitively limited. More women than men were physically limited (75% versus 33%), while more men than women were cognitively limited (39% versus 13%). Women were five times more likely to be physically than cognitively limited.
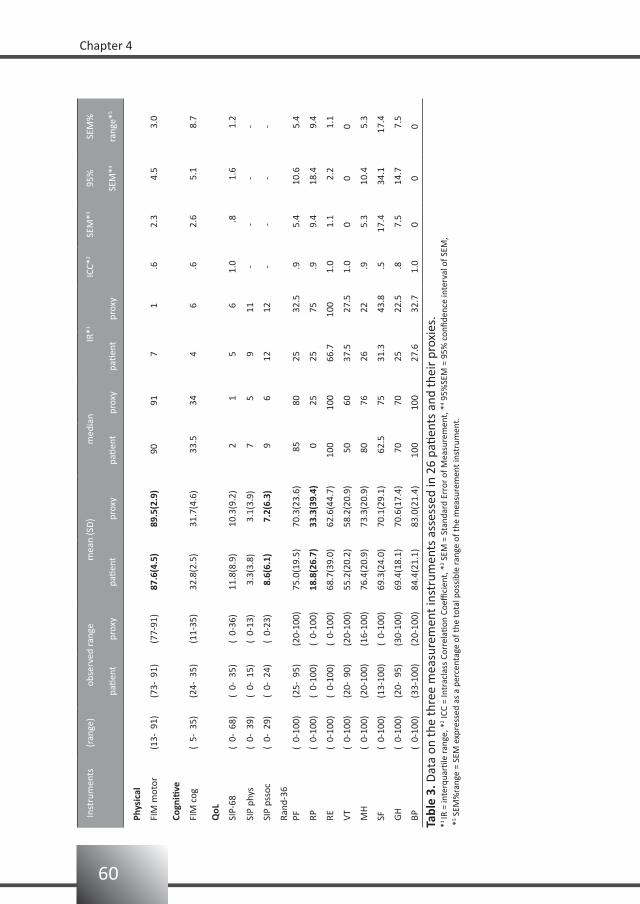
60
Chapter 4
Inst
rum
ents
(ran
ge)
obse
rved
rang
em
ean
(SD
)m
edia
nIR
*1IC
C*2
SEM
*395
%SE
M%
patie
ntpr
oxy
patie
ntpr
oxy
patie
ntpr
oxy
patie
ntpr
oxy
SEM
*4ra
nge*
5
Phys
ical
FIM
mot
or(1
3- 9
1)(7
3- 9
1)(7
7-91
)87
.6(4
.5)
89.5
(2.9
) 9
0 9
1 7
1 .6
2.
3
4.5
3
.0
Cogn
itive
FIM
cog
( 5-
35)
(24-
35)
(11-
35)
32.8
(2.5
)31
.7(4
.6)
3
3.5
34
4
6
.6
2.6
5
.1
8.7
QoL
SIP-
68
( 0-
68)
( 0-
35)
( 0-
36)
11.8
(8.9
)10
.3(9
.2)
2
1
5
6
1.0
.
8
1.6
1
.2
SIP
phys
( 0-
39)
( 0-
15)
( 0-
13)
3.3
(3.8
) 3
.1(3
.9)
7
5
9
11
--
--
SIP
psso
c (
0- 2
9)(
0- 2
4)(
0-23
) 8
.6(6
.1)
7.2
(6.3
)
9
612
1
2-
--
-
Rand
-36
PF(
0-10
0)(2
5- 9
5)(2
0-10
0) 7
5.0(
19.5
) 7
0.3(
23.6
)
85 8
025
3
2.5
.9
5.4
10.
6
5.4
RP(
0-10
0)(
0-10
0)(
0-10
0) 1
8.8(
26.7
) 3
3.3(
39.4
)
0 2
525
7
5 .9
9.
4 1
8.4
9
.4
RE(
0-10
0)(
0-10
0)(
0-10
0) 6
8.7(
39.0
) 6
2.6(
44.7
)10
010
0
66.7
10
01.
0
1.1
2
.2
1.1
VT(
0-10
0)(2
0- 9
0)(2
0-10
0) 5
5.2(
20.2
) 5
8.2(
20.9
) 5
0 6
0
37.5
2
7.5
1.0
00
0
MH
( 0-
100)
(20-
100)
(16-
100)
76.
4(20
.9)
73.
3(20
.9)
80
76
26
22
.9
5.3
10.
4
5.3
SF(
0-10
0)(1
3-10
0)(
0-10
0) 6
9.3(
24.0
) 7
0.1(
29.1
)
62.
5 7
5
31.3
4
3.8
.5 1
7.4
34.
1 1
7.4
GH
( 0-
100)
(20-
95)
(30-
100)
69.
4(18
.1)
70.
6(17
.4)
70
70
25
22.
5 .8
7.
5 1
4.7
7
.5
BP(
0-10
0)(3
3-10
0)(2
0-10
0) 8
4.4(
21.1
) 8
3.0(
21.4
)10
010
0
27.6
3
2.7
1.0
00
0
Tabl
e 3.
Dat
a on
the
thre
e m
easu
rem
ent i
nstr
umen
ts a
sses
sed
in 2
6 pa
tient
s an
d th
eir
prox
ies.
*1 IR
= in
terq
uarti
le ra
nge,
*2 IC
C =
Intr
acla
ss C
orre
latio
n Co
effici
ent,
*3 S
EM =
Sta
ndar
d Er
ror
of M
easu
rem
ent,
*4 9
5%SE
M =
95%
con
fiden
ce in
terv
al o
f SEM
, *
5 SEM
%ra
nge
= SE
M e
xpre
ssed
as
a pe
rcen
tage
of t
he to
tal p
ossi
ble
rang
e of
the
mea
sure
men
t ins
trum
ent.

61
Assessment of patient’s functioning: correspondence TBI patients and their significant others
Table 3 gives the (observed) score ranges, ICCs, and SEMs of the administered measurement instruments.Significant differences (alpha = 0.05) in scoring of the total group between patient and proxy were found on the FIM motor-score, SIP psychosocial, and Rand role physical functioning.Good ICCs were found for both the FIM motor-score and FIM cognition-score. The SEM for the FIM motor-score is 2.3 and the 95% CI is +/- 4.5. This implies that when a patient scored 65 on the FIM motor-score, it is 95% certain that this patient’s real score ranges from 60-70.Excellent ICCs and a satisfactory SEM percentage were found for the SIP68 and both subscales.A moderate ICC was found for the Rand-SF, whereas all other subscales showed excellent ICCs. All but the Rand-SF showed satisfactory SEM percentages.
Table 4 presents the mean differences (and CIs) between patients and significant others for the FIM motor-score, FIM cognition-score, SIP68 and Rand-36 in the first year post-injury.At 3 months post-injury there was a significant difference between patient and proxy for the FIM motor-items, with the proxy scoring higher than the patient; at later measurement times this difference no longer exists.The differences on the SIP68 score between patients and significant others also change over time; however, the differences are not significant. Patients are less positive at 3 months post-injury, but the differences gradually lessen and at one year post-injury patients and proxies have the same scores.The Rand-36 subscales vary inconsistently over time but with no significant differences. Rand-physical functioning, Rand-social functioning, and Rand-general health show a positive difference at 3 months post-injury (i.e. the proxy underestimates), a negative difference at 6 months (i.e. the proxy overestimates), and a positive difference at 12 months. The difference found on the Rand-role physical functioning becomes less negative over time; patient and proxy tend to agree. For the Rand-bodily pain, Rand-mental health and Rand-vitality the differences change from negative at 3 and 6 months post-injury to positive at 12 months post-injury; over time the proxies tend to change from an overestimation to an underestimation compared with the patient’s own rating. Again, none of these differences were significant.
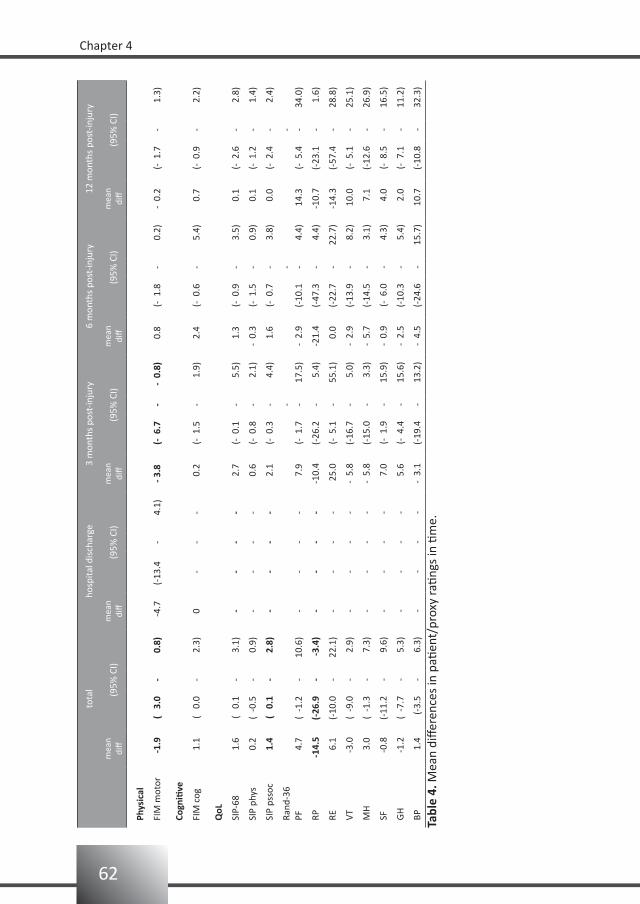
62
Chapter 4
to
tal
hosp
ital d
isch
arge
3 m
onth
s po
st-in
jury
6 m
onth
s po
st-in
jury
12 m
onth
s po
st-in
jury
m
ean
diff
(95%
CI)
mea
n di
ff(9
5% C
I)m
ean
diff
(95%
CI)
mea
n di
ff(9
5% C
I)m
ean
diff
(95%
CI)
Phys
ical
FIM
mot
or
-1.9
( 3
.0-
0.8)
-4.
7(-
13.4
-4.
1)- 3
.8(-
6.7
--
0.8)
0.
8(-
1.8
-0.
2)-
0.2
(- 1
.7-
1.3)
Cogn
itive
FIM
cog
1
.1(
0.0
-2.
3)0
--
-
0.2
(- 1
.5-
1.9)
2.
4(-
0.6
-5.
4)
0.7
(- 0
.9-
2.2)
QoL
SIP-
68
1
.6(
0.1
-3.
1)-
--
-
2.7
(- 0
.1-
5.5)
1.
3(-
0.9
-3.
5)
0.1
(- 2
.6-
2.8)
SIP
phys
0
.2(
-0.5
-0.
9)-
--
-
0.6
(- 0
.8-
2.1)
- 0.
3(-
1.5
-0.
9)
0.1
(- 1
.2-
1.4)
SIP
psso
c
1.4
( 0
.1-
2.8)
--
--
2.
1(-
0.3
-4.
4)
1.6
(- 0
.7-
3.8)
0.
0(-
2.4
-2.
4)
Rand
-36
--
-PF
4
.7(
-1.2
-10
.6)
--
--
7.
9(-
1.7
-17
.5)
- 2.
9(-
10.1
-4.
4) 1
4.3
(- 5
.4-
34.0
)
RP -1
4.5
(-26
.9-
-3.
4)-
--
--1
0.4
(-26
.2-
5.4)
-21.
4(-
47.3
-4.
4)-1
0.7
(-23
.1-
1.6)
RE
6.1
(-10
.0-
22.1
)-
--
- 2
5.0
(- 5
.1-
55.1
)
0.0
(-22
.7-
22.7
)-1
4.3
(-57
.4-
28.8
)
VT
-3.0
( -9
.0-
2.9
)-
--
--
5.8
(-16
.7-
5.0)
- 2.
9(-
13.9
-8.
2) 1
0.0
(- 5
.1-
25.1
)
MH
3
.0(
-1.3
- 7
.3)
--
--
- 5.
8(-
15.0
-3.
3)-
5.7
(-14
.5-
3.1)
7.
1(-
12.6
-26
.9)
SF
-0.8
(-11
.2-
9.6)
--
--
7.
0(-
1.9
-15
.9)
- 0.
9(-
6.0
-4.
3)
4.0
(- 8
.5-
16.5
)
GH
-1
.2(
-7.7
- 5
.3)
--
--
5.
6(-
4.4
-15
.6)
- 2.
5(-
10.3
-5.
4)
2.0
(- 7
.1-
11.2
)
BP
1.4
(-3.
5-
6.3)
--
--
- 3.
1(-
19.4
-13
.2)
- 4.
5(-
24.6
-15
.7)
10.
7(-
10.8
-32
.3)
Tabl
e 4.
Mea
n di
ffere
nces
in p
atien
t/pr
oxy
ratin
gs in
tim
e.
63
Assessment of patient’s functioning: correspondence TBI patients and their significant others
Discussion
The present study found a high level of agreement between patient and proxy on rating of the patient’s functioning, and quality of life. Only at 3 months post-injury was a significant difference found on the FIM-motor score, with proxies rating the patients higher than the patients rated themselves. After 3 months no significant differences were found between ratings of the patient and proxy on the measurement instruments used in this study. No significant change in overestimation or underestimation over time was found between patients and their proxies in rating the motor functioning, cognitive functioning, or experienced quality of life of the patient.Concerning limitations of the study; information and confounding bias are risks in all studies. Selection bias could have occurred in the present study because of the random factor, i.e. we randomly asked all family members, but generally only those who were present at the interview. Information bias is also a matter of concern. Interviews with the patient were frequently held together with the caregiver in the same room; therefore, the caregiver may have been influenced by the interview when filling in the questionnaires at a later time. Finally, confounding bias due to differences in the relationship with the patient should be taken into account. A good relationship and frequently seeing the patient in daily life will promote seeing things in the same way.Unlike results from earlier reports, in the present study no underestimation or overestimation of the patient’s limitations by the proxies was found. Most of the differences found here were only trends and not significant. Moreover, because the differences found between patients and their proxies are very small, they are not of clinical importance.
Conclusion
In the first year post-injury the FIM, the SIP68 and the RAND SF-36 can be used either by the TBI patient or by the patient’s proxy to assess the patient’s functioning.
64
Chapter 4
References
van Baalen B, Odding E, Maas AIR, Ribbers GM, Bergen MP, Stam HJ. Traumatic brain injury: classification 1.
of initial severity and determination of functional outcome. Disabil Rehabil 2003;25(1):9-18.
van Baalen B, Odding E, van Woensel MPC, van Kessel MA, Roebroeck ME, Stam HJ. Reliability and sensitivity 2.
to change of measurement instruments used in a traumatic brain injury population. Clin Rehabil 2006;20:
686-700.
Fleming A, Cook KF, Nelson ND, Lai EC. Proxy reports in Parkinson’s disease: caregiver and patient self-3.
reports of quality of life and physical activity. Mov Disord 2005;20(11):1462-1468.
Sneeuw KCA, Sprangers MAG, Aaronson NK. The role of health care providers and significant others in 4.
evaluating the quality of life of patients with chronic disease. J Clin Epidemiol 2002;55:1130-1143.
Chatterjee A, Anderson KE, Moskowitz CB, Hauser WA, Marder KS. A comparison of self-report and 5.
caregiver assessment of depression, apathy, and irritability in Huntington's disease. J Neuropsychiatry Clin
Neuroscience 2005;17:378-383.
Sneeuw KCA, Aaronson NK, de Haan RJ, Limburg M. Assessing quality of life after stroke. The value and 6.
limitations of proxy ratings. Stroke 1997;28:1541-1549.
Von Essen L. Proxy ratings of patient quality of life-factors related to patient-proxy agreement. Acta Oncol 7.
2004;43(3):229-234.
Wennman-Larsen ARN, Tishelman CRN, Wengström YOCN, Gustavsson P. Factors influencing agreement in 8.
symptom ratings by lung cancer patients and their significant others. J Pain Symptom Manage
2007;33(2):146-155.
Teasdale G, Jennet B. Assessment of coma and impaired consciousness: a practical scale. Lancet 9.
1974;2:81-84.
Collin C, Wade DT, Davies S, Horne V. The Barthel ADL Index: a reliability study. Int Disabil Stud 10.
1988;10:61-63.
Weimar C, Ziegler A, Konig IR, Diener HC. Predicting functional outcome and survival after acute ischemic 11.
stroke. J Neurol 2002;249:888-895.
Hagen C. Language cognitive disorganization following closed head injury: a conceptualization. In: Trexler, 12.
LE (ed). Cognitive rehabilitation: conceptualization and intervention. Plenum Press, 1982, pp 131-151.
Hall KM, Bushnik T, Lakisic-Kazazic B, Wright J, Cantanagallo A. Assessing traumatic brain injury outcome 13.
measures for long-term follow-up of community-based individuals. Arch phys Med Rehabil 2001;82:
367-374.
Granger CV, Hamilton BB, Keith RA, Zielezny M, Sherwin FS. Advances in functional assessment for medical 14.
rehabilitation. Topics in Geriatric Rehabil 1986;1:59-74.
de Bruin AF, Buys M, de Witte LP, Diederiks JP. The Sickness Impact Profile: SIP68, a short generic version. J 15.
Clin Epidemiol 1994;47:863-871.
Post MW, de Bruin AF, de Witte L, Schrijvers A. The SIP68: a measure of health-related functional status in 16.
rehabilitation medicine. Arch Phys Med Rehabil 1996;77:440-445.
Nanda, U, McLendon PM, Andresen EM, Armbrecht E. The SIP68: an abbreviated sickness impact profile for 17.
disability outcomes research. Qual Life Res 2003;12:583-895.
Ware JE, Sherbourne CD. The MOS 36-Item Short-Form Health Survey (SF-36). I: Conceptual framework and 18.
item selection. Med Care 1992;30:473-483.
65
Assessment of patient’s functioning: correspondence TBI patients and their significant others
Beckerman H, Roebroeck ME, Lankhorst GJ, Becher JG, Bezemer PD, Verbeek AL. Smallest real difference, 19.
a link between reproducibility and responsiveness. Qual Life Res 2001;10:571-578.
Streiner DL, Norman GR: Health measurement scales: a practical guide to their development and use (220. nd
ed). Oxford University Press, 1995.
Roebroeck ME, Harlaar J, Lankhorst GJ. Reliability assessment of isometric knee extension measurement 21.
with computer-assisted hand-held dynamometer. Arch Phys Med Rehabil 1998;79:442-448.
Fleiss JL. Statistical methods for rates and proportions. New York: John Wiley, 1981.22.

Selection bias in research on rehabilitation after moderate orsevere traumatic brain injury
5
Bianca van BaalenElse OddingHenk J Stam
Submitted for publication

68
Chapter 5
Abstract
Objectives: To examine whether the inclusion of only inpatient rehabilitation traumatic brain injury (TBI) patients results in selection bias.Design: Cross-sectional study.Setting: Level I trauma centers.Participants: One hundred twenty six TBI patients from a hospital-based cohort in the Netherlands.Interventions: Not applicable.Main outcome measures: Glasgow Outcome Scale, Disability Rating Scale, Barthel Index, Functional Independence Measurement, Functional Assessment Measurement, Rancho Level of Cognitive Functioning Scale, Neurobehavioural Rating Scale.Results: Patients in this hospital-based cohort were younger, and more patients were married and/or working pre-injury compared with the Traumatic Brain Injury Model Systems data. Differences were also found for cause of injury. GCS score was higher, and a prolonged length of stay as well as a better general, physical, and cognitive functioning was found in the hospital-based cohort.Conclusion: In this study, 46% of our TBI cohort is discharged home and will not be taken into account in the usual prognostic studies on TBI in rehabilitation medicine. The hospital-based cohort described here is different from inpatient rehabilitation cohorts. Studies which include only those patients that are in an inpatient rehabilitation setting, result in a selection bias.Key words: Traumatic brain injury, rehabilitation setting, selection bias.
69
Selection bias in research on rehabilitation after moderate or severe TBI
Introduction
In rehabilitation medicine there is a growing interest in performing prognostic studies. Since traumatic brain injury (TBI) has been termed a silent epidemic,1 knowledge about prognosis is relevant. TBI is a common cause of death, disability and handicap among young adults in modern Western societies.2,3 In Europe, an average hospitalized TBI rate of 235 per 100,000 is assumed,4 and with a current European Community population of about 330 million, 775,500 new TBI patients per year are to be expected. When assuming an average duration of disability of 10 years (which is a conservative figure) the prevalence of disability after TBI in Europe will be about 7,775,000.4 Prognostic studies are, obviously, important for patients and their families to provide information about future functioning. They are, however, also important for health care organizations in planning health care programs; it enables health care professionals to evaluate and adjust treatments in order to minimize long-lasting limitations in activity or restrictions in participation, as well as health care costs.Different health care professionals have a different focus on outcome. Acute care physicians, focusing primarily on treatment results (e.g. intracranial pressure monitoring), require a simple general outcome scale; in this field the Glasgow Outcome Scale (GOS) and Disability Rating Scale (DRS) are commonly used. In rehabilitation medicine, as well as in rehabilitation research, the focus is on activity and participation.The group under study in rehabilitation medicine is generally a selection of the patients, i.e. the patients referred to inpatient rehabilitation treatment. By including only the inpatient rehabilitation TBI patients, who are probably more limited in activities and restricted in participation than the patients discharged home, the consequences after TBI may be overestimated.The USA has a national database called the Traumatic Brain Injury Model Systems (TBIMS) national database. The TBIMS inclusion criteria limit the dataset to persons 16 years and older who receive comprehensive inpatient rehabilitation as part of a systematic continuum of care, including acute neurotrauma services in a designated TBIMS center. A series of prognostic studies have emerged from this database.5-11 However, because the TBIMS studies only those patients who receive inpatient rehabilitation, the results can not be representative for the entire population of TBI patients.3 Therefore, TBIMS studies were compared with acute care studies from the South Carolina TBI Follow-up Registry (SCTBIFR). As hypothesized, TBIMS participants showed greater initial injury severity and frequency of abnormal CT scans, as well as longer periods of acute care hospitalization. Counter to a priori hypotheses, there were also differences in racial and ethnic background and source of insurance payer. Unfortunately it was not possible to compare functional outcome between the cohorts because, although both databases assessed functional outcome, the variables were not comparable.3
70
Chapter 5
The present study was designed to explore the question of selection bias. Specifically, does a hospital-based cohort of TBI patients differ from the inpatient rehabilitation cohorts of TBI patients regarding: 1) basic demographic characteristics, 2) injury variables, and 3) functional status at the time of being discharged from the acute care hospital.
Material and methods
The Rotterdam TBI studyThe Rotterdam TBI study is a prospective follow-up investigation on determinants of daily functioning in patients with a moderate or severe TBI. TBI is defined as an injury to the brain caused by an external mechanical force.
PopulationThe study population consists of all patients aged 18 to 65 years with a moderate or severe TBI, who were admitted to one of three hospitals between January 1999 and June 2004. The participating hospitals were the Erasmus University Medical Center (Erasmus MC), Rotterdam (January 1999 to March 2004), the Medical Center Haaglanden, location Westeinde, The Hague (September 2002 to June 2004), and the Utrecht University Medical Center (UMC) (January 2003 to June 2004). Patients were classified as having a severe TBI when the worst Glasgow Coma Scale score (GCS-score) within 24 hours post-injury was 3 to 8. Moderate TBI was defined as a GCS-score of 9-13.12,13 Furthermore, patients with a GCS-score 14 or 15 ánd mass lesion on the head CT-scan were also classified as having a moderate TBI.14
Patients were followed-up from the emergency department of the hospital up to three years post-trauma.
RecruitmentDuring the study period all consecutive TBI patients admitted to the hospital were eligible to participate in the study. That is, all consecutive admitted patients, irrespective of severity, were screened for eligibility. Patients were not included in the study when they had serious (pre-traumatic) neurological, psychiatric, oncological or internal impairments expected to interfere with TBI-related disabilities. Also, if the patient or their next of kin/caregiver did not speak Dutch or English they were not invited to participate in the study. All patients were recruited by two psychologists who also carried out the study.All eligible patients and their next of kin/caregiver were given oral and written information about the goal and research methods of the study. Participating patients signed the informed consent form; in some cases this was after their legal representative had signed the informed consent form at an earlier stage. The study was approved by the Medical Ethical Committees of the participating hospitals.
71
Selection bias in research on rehabilitation after moderate or severe TBI
MethodsMost data were collected during interviews with the patient and/or their next of kin/caregiver. Data on the cause of injury, TBI severity (GCS-score), and length of stay were retrieved from the patient files.The patient’s physical and cognitive functioning was assessed with a set of measurement instruments that we selected based on a review of the literature.15
Measurement instrumentsGlasgow Outcome Scale (GOS)The GOS measures the consequences of a TBI and categorizes them in five categories of severity: 0 = dead, 1 = vegetative state, 2 = severely limited, 3 = moderately limited and 4 = good recovery.16 For the GOS a standard form and written protocol was used.17
Disability Rating Scale (DRS)The DRS measures changes in four categories: 1) level of arousal and awareness (identical to GCS score), 2) cognitive ability to deal with problems of feeding, toileting and grooming, 3) degree of physical dependence on others, and 4) the ability to do useful work as independently as possible. The total score ranges from 0-30, where 0 = no disability, 1 = mild disability, 2,3 = partial disability, 4-6 = moderate disability, 7-11 = moderately severe disability, 12-16 = severe disability, 17-21 = extremely severe disability, 22-24 = vegetative state, 25-29 = extreme vegetative state, and 30 = death.18
Barthel Index (BI)The BI was initially developed to follow progress during inpatient rehabilitation of stroke patients. This measurement instrument has evolved into one of the most commonly employed instruments for physical disabilities in rehabilitation in general; it measures the actual performance of daily activities of a patient.19,20 The score ranges from 0-20. Although a ceiling effect exists, the BI can reliably be used in a TBI population.21
Functional Independence Measurement (FIM)The FIM was developed to measure changes in functional status within an individual over the course of a comprehensive medical rehabilitation program. The 18-item ordinal scale examines the following functions: self-care, sphincter control, mobility, locomotion, communication, and social cognition.22 The score ranges from 18-126.
Functional Assessment Measurement (FAM)The FAM (an extension of the FIM) measures the psychosocial and cognitive disabilities that are common in TBI.23 The 12 FAM items are: swallowing, car transfer, community access, reading, writing, speech intelligibility, emotional status, adjustment to limitations, employability, orientation, attention, and safety judgment. The score ranges from 12-84.
72
Chapter 5
Rancho Los Amigos Levels of Cognitive Functioning Scale (LCFS)The LCFS describes the eight stages of cognitive functioning through which a TBI patient typically progress in hospital and acute rehabilitation, and can range from no response = 1 (in which the patient is in deep coma and completely unresponsive), to purposeful and appropriate functioning = 8 (where the patient is alert and oriented, able to recall and integrate past and recent events, and is aware of and responsive to his environment).24,25
Neurobehavioural Rating Scale (NRS)The NRS is a modification of the Brief Psychiatric Rating Scale.26 This 27-item scale has been developed for TBI patients and measures common behavioural and psychiatric symptoms after TBI. Examples of these symptoms are inattention/reduced alertness, somatic concern, disorientation, anxiety, conceptual disorganization, agitation, and motor retardation. The NRS gives 4 subscales: energy, meta-cognition, anxiety, and language.27 The score ranges from 0-162.
Data analysis
Descriptive statistics of mean, standard deviation, median, percentage, and/or range were generated to describe the variables under study, the Student’s t-test for comparisons with data from the literature (a p-value < 0.05 was considered significant).From the various measurement instruments, measures for general functional status, physical and cognitive functional status at hospital discharge were constructed.In order to present prevalence data, the measurement instruments were dichotomized. From the dichotomized measurement instruments the three functional status categories were calculated and dichotomized.
General functioningGeneral functioning (GF) is reflected by the scores on the GOS and DRS. Those scores were dichotomized as: GOS-score 5 = not limited, and GOS < 5 = limited. DRS-score 0 = not limited and DRS > 0 = limited.The dichotomized scores of the GOS and DRS were taken together and categorized into: GF not limited = not limited on GOS and DRS, GF limited = limited on one of these two, GF severely limited = limited on both these measurement instruments.
Physical functioningPhysical functioning (PF) is measured with the BI and FIM. The BI was dichotomized as: BI-score 19/20 = not limited and BI<19 = limited,28 and the FIM-score as ≥108 = not limited and FIM< 108 = limited.29
For PF the following categories were formed: PF not limited = not limited on BI and FIM, PF moderately limited = limited on one of these measurement instruments, PF severely limited = limited on both the BI and FIM.

73
Selection bias in research on rehabilitation after moderate or severe TBI
Cognitive functioningCognitive functioning (CF) is measured with LCFS, FAM and NRS. The LCFS-score was dichotomized as 8 = not limited, and LCFS <8 = limited.29 A score on the FAM ≥72 = not limited and FAM <72 = limited.29 The NRS was cut-off at 28, in which a score <28 = not limited and ≥28 = limited.For CF this generated the following categories: CF not limited = not limited on FAM, LCFS, and NRS; CF mildly limited = limited on one of these measurement instruments; moderately limited = limited on two of these measurement instruments; and CF severely limited = limited on all three of these measurement instruments.
Results
ResponseErasmus University Medical Center (Erasmus MC)From January 1999 to March 2004, 549 patients with a TBI were admitted to the Erasmus MC. Figure 1 describes why a large part of them (n=420) was not eligible for our study. Besides death (28%) and age (16%), patients were not recruited because they had a mild TBI (i.e. GCS-score >13) without CT-abnormalities (11%), went to another country or remote part of the Netherlands (8%), had so much co-morbidity that it would interfere with the TBI-related consequences (8%), or the patient did not speak Dutch or English (1%). In a period of 5.25 years, 167 patients (549 minus 382; i.e. 30%) admitted to the Erasmus MC were eligible to participate in this study. Of these 167 patients, 38 (23%) were not reported to us during their stay at the hospital and could not be located by us after their discharge from the hospital. Of the remaining 129 eligible participants, 14 refused to participate (11% of 129). Finally, 115 patients from the Erasmus MC participated in the study.
Medical Center Haaglanden, location WesteindeThe total number of TBI patients admitted could not be provided. From September 2002 to June 2004 we included two patients from The Hague.
Utrecht University Medical CenterThe total number of TBI patients admitted could not be provided. From January 2003 to June 2004 we included nine patients from Utrecht.
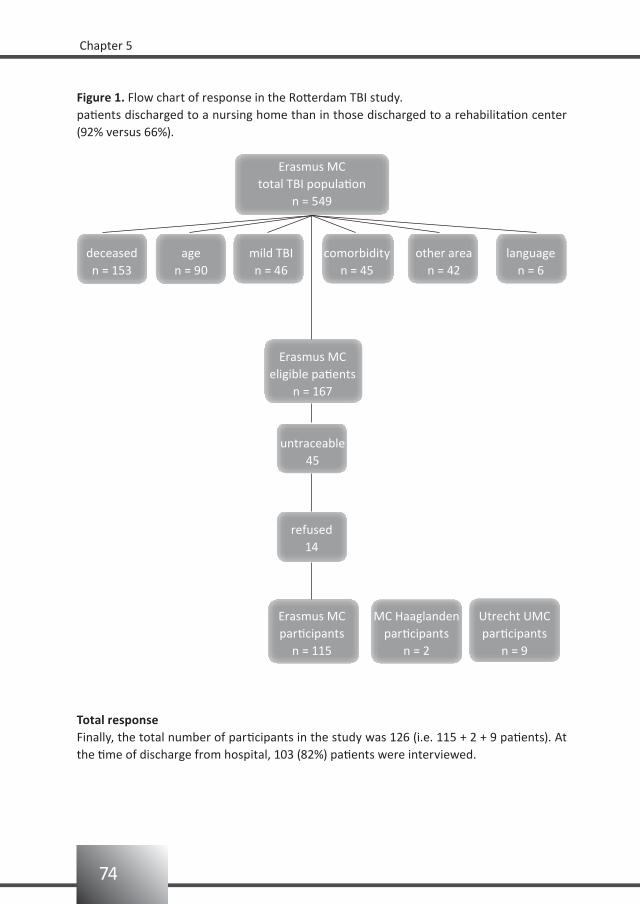
74
Chapter 5
Figure 1. Flow chart of response in the Rotterdam TBI study.
Erasmus MCtotal TBI population
n = 549
comorbidityn = 45
Erasmus MCeligible patients
n = 167
MC Haaglandenparticipants
n = 2
Utrecht UMCparticipants
n = 9
Erasmus MCparticipants
n = 115
refused14
untraceable45
languagen = 6
other arean = 42
mild TBIn = 46
agen = 90
deceasedn = 153
Total responseFinally, the total number of participants in the study was 126 (i.e. 115 + 2 + 9 patients). At the time of discharge from hospital, 103 (82%) patients were interviewed.
patients discharged to a nursing home than in those discharged to a rehabilitation center (92% versus 66%).
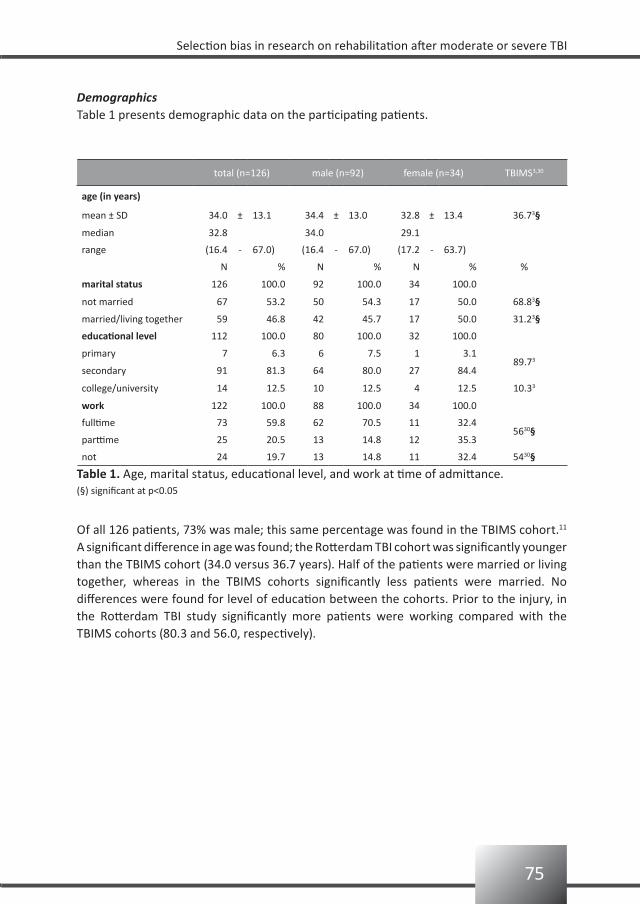
75
Selection bias in research on rehabilitation after moderate or severe TBI
DemographicsTable 1 presents demographic data on the participating patients.
total (n=126) male (n=92) female (n=34) TBIMS3,30
age (in years)
mean ± SD 34.0 ± 13.1 34.4 ± 13.0 32.8 ± 13.4 36.73§
median 32.8 34.0 29.1
range (16.4 - 67.0) (16.4 - 67.0) (17.2 - 63.7)
N % N % N % %
marital status 126 100.0 92 100.0 34 100.0
not married 67 53.2 50 54.3 17 50.0 68.83§
married/living together 59 46.8 42 45.7 17 50.0 31.23§
educational level 112 100.0 80 100.0 32 100.0
primary 7 6.3 6 7.5 1 3.189.73
secondary 91 81.3 64 80.0 27 84.4
college/university 14 12.5 10 12.5 4 12.5 10.33
work 122 100.0 88 100.0 34 100.0
fulltime 73 59.8 62 70.5 11 32.45630§
parttime 25 20.5 13 14.8 12 35.3
not 24 19.7 13 14.8 11 32.4 5430§
Table 1. Age, marital status, educational level, and work at time of admittance.(§) significant at p<0.05
Of all 126 patients, 73% was male; this same percentage was found in the TBIMS cohort.11 A significant difference in age was found; the Rotterdam TBI cohort was significantly younger than the TBIMS cohort (34.0 versus 36.7 years). Half of the patients were married or living together, whereas in the TBIMS cohorts significantly less patients were married. No differences were found for level of education between the cohorts. Prior to the injury, in the Rotterdam TBI study significantly more patients were working compared with the TBIMS cohorts (80.3 and 56.0, respectively).
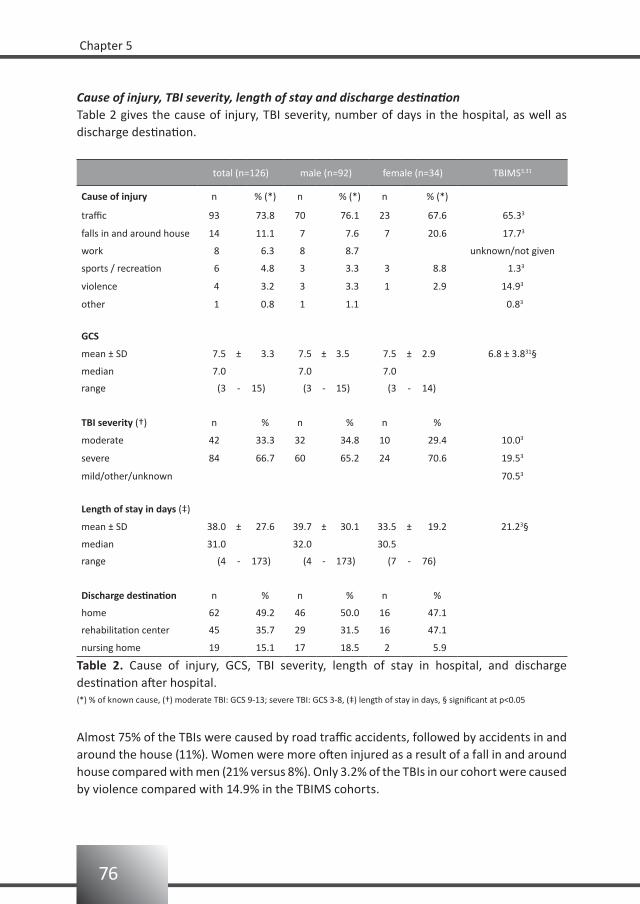
76
Chapter 5
Cause of injury, TBI severity, length of stay and discharge destinationTable 2 gives the cause of injury, TBI severity, number of days in the hospital, as well as discharge destination.
total (n=126) male (n=92) female (n=34) TBIMS3,31
Cause of injury n % (*) n % (*) n % (*)
traffic 93 73.8 70 76.1 23 67.6 65.33
falls in and around house 14 11.1 7 7.6 7 20.6 17.73
work 8 6.3 8 8.7 unknown/not given
sports / recreation 6 4.8 3 3.3 3 8.8 1.33
violence 4 3.2 3 3.3 1 2.9 14.93
other 1 0.8 1 1.1 0.83
GCS
mean ± SD 7.5 ± 3.3 7.5 ± 3.5 7.5 ± 2.9 6.8 ± 3.831§
median 7.0 7.0 7.0
range (3 - 15) (3 - 15) (3 - 14)
TBI severity (†) n % n % n %
moderate 42 33.3 32 34.8 10 29.4 10.03
severe 84 66.7 60 65.2 24 70.6 19.53
mild/other/unknown 70.53
Length of stay in days (‡)
mean ± SD 38.0 ± 27.6 39.7 ± 30.1 33.5 ± 19.2 21.23§
median 31.0 32.0 30.5
range (4 - 173) (4 - 173) (7 - 76)
Discharge destination n % n % n %
home 62 49.2 46 50.0 16 47.1
rehabilitation center 45 35.7 29 31.5 16 47.1
nursing home 19 15.1 17 18.5 2 5.9
Table 2. Cause of injury, GCS, TBI severity, length of stay in hospital, and discharge destination after hospital.(*) % of known cause, (†) moderate TBI: GCS 9-13; severe TBI: GCS 3-8, (‡) length of stay in days, § significant at p<0.05
Almost 75% of the TBIs were caused by road traffic accidents, followed by accidents in and around the house (11%). Women were more often injured as a result of a fall in and around house compared with men (21% versus 8%). Only 3.2% of the TBIs in our cohort were caused by violence compared with 14.9% in the TBIMS cohorts.
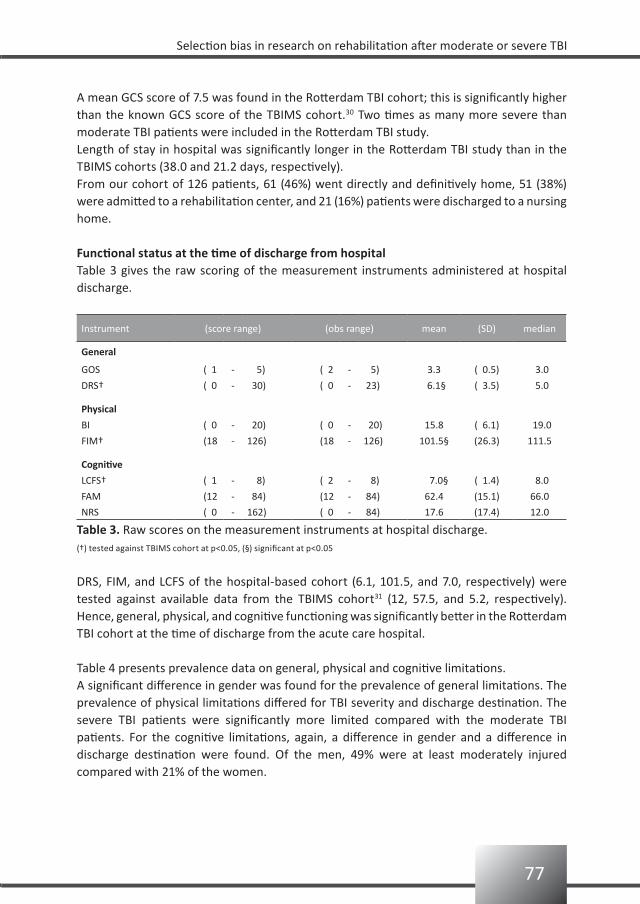
77
Selection bias in research on rehabilitation after moderate or severe TBI
A mean GCS score of 7.5 was found in the Rotterdam TBI cohort; this is significantly higher than the known GCS score of the TBIMS cohort.30 Two times as many more severe than moderate TBI patients were included in the Rotterdam TBI study.Length of stay in hospital was significantly longer in the Rotterdam TBI study than in the TBIMS cohorts (38.0 and 21.2 days, respectively).From our cohort of 126 patients, 61 (46%) went directly and definitively home, 51 (38%) were admitted to a rehabilitation center, and 21 (16%) patients were discharged to a nursing home.
Functional status at the time of discharge from hospitalTable 3 gives the raw scoring of the measurement instruments administered at hospital discharge.
Instrument (score range) (obs range) mean (SD) median
General
GOS ( 1 - 5) ( 2 - 5) 3.3 ( 0.5) 3.0
DRS† ( 0 - 30) ( 0 - 23) 6.1§ ( 3.5) 5.0
Physical
BI ( 0 - 20) ( 0 - 20) 15.8 ( 6.1) 19.0
FIM† (18 - 126) (18 - 126) 101.5§ (26.3) 111.5
Cognitive
LCFS† ( 1 - 8) ( 2 - 8) 7.0§ ( 1.4) 8.0
FAM (12 - 84) (12 - 84) 62.4 (15.1) 66.0
NRS ( 0 - 162) ( 0 - 84) 17.6 (17.4) 12.0
Table 3. Raw scores on the measurement instruments at hospital discharge.(†) tested against TBIMS cohort at p<0.05, (§) significant at p<0.05
DRS, FIM, and LCFS of the hospital-based cohort (6.1, 101.5, and 7.0, respectively) were tested against available data from the TBIMS cohort31 (12, 57.5, and 5.2, respectively). Hence, general, physical, and cognitive functioning was significantly better in the Rotterdam TBI cohort at the time of discharge from the acute care hospital.
Table 4 presents prevalence data on general, physical and cognitive limitations.A significant difference in gender was found for the prevalence of general limitations. The prevalence of physical limitations differed for TBI severity and discharge destination. The severe TBI patients were significantly more limited compared with the moderate TBI patients. For the cognitive limitations, again, a difference in gender and a difference in discharge destination were found. Of the men, 49% were at least moderately injured compared with 21% of the women.
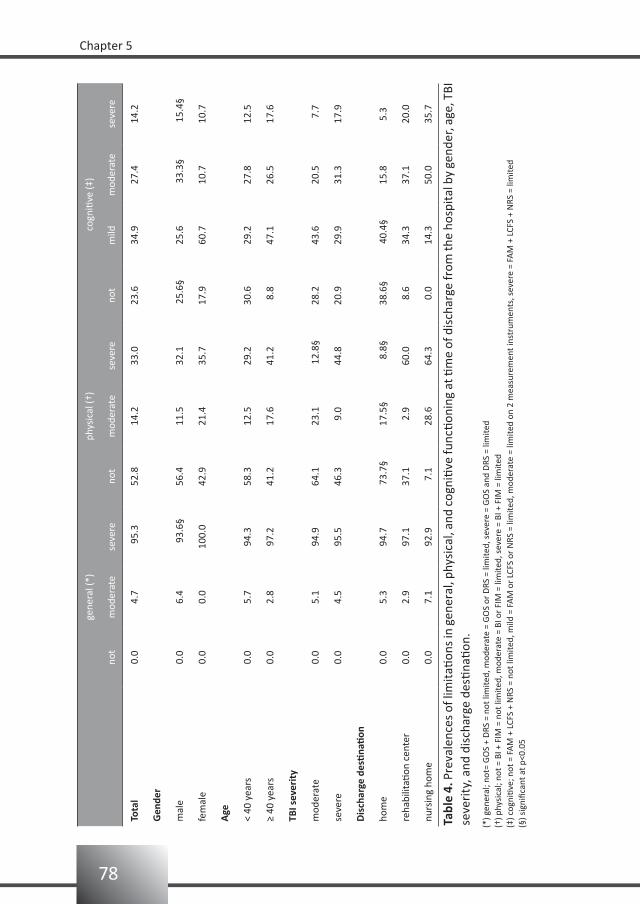
78
Chapter 5
ge
nera
l (*)
phys
ical
(†)
cogn
itive
(‡)
no
tm
oder
ate
seve
reno
tm
oder
ate
seve
reno
tm
ildm
oder
ate
seve
re
Tota
l0.
04.
7 9
5.3
52.8
14.2
33.0
23.6
34.9
27.4
14.2
Gen
der
mal
e0.
06.
4
93.
6§56
.411
.532
.1
25.6
§25
.6
33.3
§
15.4
§
fem
ale
0.0
0.0
100.
042
.921
.435
.717
.960
.710
.710
.7
Age
< 40
yea
rs0.
05.
794
.358
.312
.529
.230
.629
.227
.812
.5
≥ 40
yea
rs0.
02.
897
.241
.217
.641
.2 8
.847
.126
.517
.6
TBI s
ever
ity
mod
erat
e0.
05.
194
.964
.123
.1
12.8
§28
.243
.620
.5 7
.7
seve
re0.
04.
595
.546
.3 9
.044
.820
.929
.931
.317
.9
Dis
char
ge d
esti
nati
on
hom
e0.
05.
394
.7
73.7
§ 1
7.5§
8
.8§
38.
6§
40.4
§15
.85.
3
reha
bilit
ation
cen
ter
0.0
2.9
97.1
37.1
2.9
60.0
8.6
34.3
37.1
20.0
nurs
ing
hom
e0.
07.
192
.9 7
.128
.664
.3 0
.014
.350
.035
.7
Tabl
e 4.
Pre
vale
nces
of l
imit
ation
s in
gen
eral
, phy
sica
l, an
d co
gniti
ve fu
nctio
ning
at ti
me
of d
isch
arge
from
the
hosp
ital
by
gend
er, a
ge, T
BI
seve
rity
, and
dis
char
ge d
estin
ation
.
(*) g
ener
al; n
ot=
GO
S +
DRS
= n
ot li
mite
d, m
oder
ate
= G
OS
or D
RS =
lim
ited,
sev
ere
= G
OS
and
DRS
= li
mite
d(†
) phy
sica
l; no
t = B
I + F
IM =
not
lim
ited,
mod
erat
e =
BI o
r FI
M =
lim
ited,
sev
ere
= BI
+ F
IM =
lim
ited
(‡) c
ogni
tive;
not
= F
AM
+ L
CFS
+ N
RS =
not
lim
ited,
mild
= F
AM
or
LCFS
or
NRS
= li
mite
d, m
oder
ate
= lim
ited
on 2
mea
sure
men
t ins
trum
ents
, sev
ere
= FA
M +
LCF
S +
NRS
= li
mite
d (§
) sig
nific
ant a
t p<0
.05
79
Selection bias in research on rehabilitation after moderate or severe TBI
Discussion
Rehabilitation research on TBI usually includes only a selection of the TBI patients, i.e. the TBI patients admitted for inpatient rehabilitation treatment. In the Rotterdam TBI study, however, we included all moderate and severe TBI patients admitted to an acute care hospital with a regional neurotrauma unit. In the present study, we questioned whether this hospital-based cohort of TBI patients is different from the TBIMS cohorts with regard to demographics, injury-related characteristics and level of functional status.The total number of participants available to be studied in our hospital-based cohort was 126. Gender distribution was the same for both cohorts.3 The hospital-based cohort was significantly younger compared with the TBIMS cohorts; it consists of all patients aged 18 to 65 years, whereas the TBIMS cohorts include all patients aged over 16 years. Significantly more patients were married and working pre-injury in the Rotterdam TBI cohort. Because the TBIMS cohorts also include retired patients (i.e. all patients aged over 16 years), the lower percentage of persons working pre-injury among the TBIMS participants is not surprising. No differences were found for level of education between the cohorts.The TBIMS and hospital-based cohort differ regarding cause of injury. In the TBIMS, in 58% of the cases the injury resulted from road traffic accidents, 18% resulted from a fall, and 15% was caused by violence,3 whereas in the Rotterdam TBI study only 3% of the causes is attributed to violence. These results are, however, in accordance with the European literature; almost 75% of the injuries are reported to be caused by road traffic accidents.4 A significant difference was found for GCS score; a lower mean GCS score was found for the TBIMS compared with the Rotterdam TBI study (6.8 and 7.5, respectively). Classifying TBI patients according to their GCS score into moderate or severe and thereafter comparing them, was not possible due to the large numbers in the category of mild severities, other, or unknown scores (i.e. 70.5%).In this hospital-based study a mean length of stay (LOS) of 38 days (SD 27.6) was found. This is a significantly higher LOS compared with the 21.2 days which was found for the TBIMS studies.3 Very few studies have provided information on LOS in hospital,4 and comparing our results with earlier studies is difficult for a number of reasons. First, the inclusion criteria are different and a mild TBI will of course entail a shorter LOS. When compared with the European studies providing LOS data4 we included more severe TBI patients. Probably most important, however, are the differences in health care systems that have an important effect on LOS. For instance, LOS was significantly higher for patients discharged to an institution than for those patients who were discharged home. Besides the fact that the more severely injured patients need more time to become medically stable, another explanation may be that the institution, to which the patient is referred, has a waiting list. Because relatively few beds are available in rehabilitation centers and nursing homes, a patient may need to stay in the hospital (i.e. in the ‘wrong’ bed) until a bed is available at the appropriate institution.The data derived from the functional measurement instruments differ significantly between the inpatient rehabilitation cohorts and our cohort, with better functioning in our hospital-
80
Chapter 5
based cohort. Unfortunately, because of differences in health care system and study design, the significant differences are probably not clinically significant. In the TBIMS studies the first assessment took place at 22 days post-injury, whilst in our study this was 53 days post-injury. In the TBIMS studies the first assessment took place when being admitted to the inpatient rehabilitation ward. In the Rotterdam TBI study, the first assessment took place when being discharged from the neurological or neurosurgical ward; i.e. when discharged home, discharged to a rehabilitation center, or discharged to a nursing home. As a result, the first assessment was 31 days later than that in the TBIMS studies. In future TBI research standard assessment in both groups, at for example 20 days post-trauma, will provide more insight on this subject.General, physical, and cognitive status was constructed from dichotomized measurement instruments. As was expected, most limitations were mentioned by the patients discharged to a rehabilitation center or nursing home. However, these data also show that about 25% of the patients discharged home were physically limited and over 60% were cognitively limited (ranging from mild to severe). No differences were found for general status; almost all were generally limited.Severe TBI patients were significantly more physically limited compared to the moderate TBI patients. As expected, significant differences were found on physical limitations when considering discharge destination. Patients discharged to a rehabilitation center or nursing home had the highest prevalence of being severely limited; however, even for those discharged home a prevalence of 8.8 was calculated.For the cognitive limitations a gender difference and a difference in discharge destination was found. Of the men, 49% were at least moderately injured while for the women this figure was 21%. Again, as expected, the persons discharged home experienced less cognitive limitations compared with the patients discharged to a rehabilitation center or nursing home.
Limitations of the studyOne limitation of the study is the small sample size (n=126). The greatest limitation, however, is the difficulty in comparing cohorts recruited from different countries. Social and cultural differences may be responsible for differences between the cohorts; for example, the differences in health care system might explain the prolonged LOS in the Netherlands. In both study designs, the first assessment took place at the time of discharge from acute care. Therefore, assessment in the Rotterdam TBI study was 31 days later than in the TBIMS study. Assessment at a standard time (i.e. 20 days post-trauma) may overcome this problem and will allow a more valid comparison of functional status between the cohorts. The difference found between the cohorts for violence-related injury may also be considered as a social or cultural difference, rather than resulting from different inclusion criteria.
81
Selection bias in research on rehabilitation after moderate or severe TBI
Conclusion
The results from this hospital-based cohort indicated that almost half of the moderate or severe TBI population (e.g. 46%) is discharged home, and will not be taken into account in the usual prognostic studies on TBI in rehabilitation medicine. The cohort described here is different from inpatient rehabilitation cohorts with respect to age, marital and working status pre-injury, percentage of violence-related TBIs, mean GCS score, length of stay, and level of functional status. Studies which include only those patients that are in an inpatient rehabilitation setting, suffer from a selection bias.
82
Chapter 5
References
Goldstein M. Traumatic brain injury: a silent epidemic. Ann Neurol 1990;27:327.1.
Ribbers GM. Traumatic brain injury rehabilitation in the Netherlands: dilemma’s and challenges. J Head 2.
Trauma Rehabil 2007;22:234-238.
Corrigan JD, Selassie AW, Lineberry LA, Millis SR, Wood KD, Pickelsimer EE, Rosenthal M. Comparison of the 3.
Traumatic Brain Injury (TBI) Model Systems national dataset to a population-based cohort of TBI
hospitalizations. Arch Phys Med Rehabil 2007;88:418-426.
Tagliaferri F, Compagnone C, Korsic M, Servadei F, Kraus J. A systematic review of brain injury epidemiology 4.
in Europe. Acta Neurochir (Wien) 2006;148:255-268.
Steadman-Pare D, Colantonio A, Ratcliff G, Chase S, Vernich L. Factors associated with perceived quality of 5.
life many years after traumatic brain injury. J Head Trauma Rehabil 2001;16(4):330-342.
Marwitz JH, Cifu DX, Englander J, High Jr WM. A multi-center analysis of rehospitalizations five years after 6.
brain injury. J Head Trauma Rehabil 2001;16(4):307-317.
Foxx-Orenstein A, Kolakowsky-Hayner S, Marwitz JH, Cifu DX, Dunbar A, Englander J, Fransisco G. Incidence, 7.
risk factors, and outcome of fecal incontinence after acute brain injury: findings from the traumatic brain
injury model systems national database. Arch Phys Med Rehabil 2003;84:231-237.
Hanks RA, Wood DL, Millis S, Harrison-Felix C, Pierce CA, Rosenthal M, Bushnik T, High Jr WM, Kreutzer J. 8.
Violent traumatic brain injury: occurrence, patient characteristics, and risk factors from the traumatic
brain injury model systems project. Arch Phys Med Rehabil 2003;84:249-254.
Burnett DM, Kolakowsky-Hayner SA, Slater D, Stringer A, Bushnik T, Zafonte R, Cifu DX. Ethnographic 9.
analysis of traumatic brain injury patients in the national model systems database. Arch Phys Med Rehabil
2003;84:263-267.
Bushnik T, Hanks RA, Kreutzer J, Rosenthal M. Etiology of traumatic brain injury: characterization of 10.
differential outcomes up to 1 year postinjury. Arch Phys Med Rehabil 2003;84(2):255-262.
Johnstone B, Mount D, Schopp LH. Financial and vocational outcome 1 year after traumatic brain inury. 11.
Arch Phys Med Rehabil 2003;84(2):238-242.
Marshall LF, Gautille T, Klauber MR, Eisenberg HM, Jane JA, Luerssen TG. The outcome of severe closed 12.
head injury. J Neurosurg 1991;75:S28-S36.
Hall KM, Establishing a national traumatic brain injury information system based upon a unified data set. 13.
Arch Phys Med Rehabil 1997;78:S12-S16.
Gomez PA, Lobato RD, Ortega JM, De La Cruz J. Mild head injury: differences of prognosis among patients 14.
with a Glasgow Coma Scale score of 13 to 15 and analysis of factors associated with abnormal CT findings.
Br J Neurosurg 1996;10(5):453-460.
van Baalen B, Odding E, Maas AIR, Ribbers GM, Bergen MP, Stam, HJ. Traumatic brain injury: classification 15.
of initial severity and determination of functional outcome. Disabil Rehabil 2003;25:9-18.
Jennett B, Bond M. Assessment of outcome after severe brain damage a practical scale. Lancet 16.
1975;1:480-485.
Wilson JTL, Pettigrew LEL, Teasdale GM. Structured interviews for the Glasgow Outcome Scale and the 17.
Extended Glasgow Outcome Scale. J Neurotrauma 1998;15:573-585.
Rappaport M, Hall KM, Hopkins Belleza T, Cope DN. Disability Rating Scale for severe trauma: coma to 18.
community. Arch Phys Med Rehabil 1982;63:118-123.
83
Selection bias in research on rehabilitation after moderate or severe TBI
Wade DT. Measurement in neurological rehabilitation.Oxford University Press,1996.19.
Collin C, Wade DT, Davies S, Horne V. The Barthel ADL Index: a reliability study. Int Disabil Stud 1988;10: 20.
61-63.
van Baalen B, Odding E, van Woensel MPC, van Kessel MA, Roebroeck ME, Stam HJ. Reliability and sensitivity 21.
to change of measurement instruments used in a traumatic brain injury population. Clin Rehabil 2006;20:
686-700.
Granger CV, Hamilton BB, Keith RA, Zielezny M, Sherwin FS. Advances in functional assessment for medical 22.
rehabilitation. Topics Ger Rehabil 1986;1:59-74.
Hall KM, Hamilton BB, Gordon WA, Zasler ND. Characteristics and comparisons of functional assessment 23.
indices: disability rating scale, functional independence measure, and functional assessment measure. J
Head Trauma Rehabil 1993;8:60-74.
Hagen C. Language cognitive disorganization following closed head injury: a conceptualization. In: Trexler 24.
LE (ed). Cognitive rehabilitation: Conceptualization and Intervention. Plenum Press,1982; pp 131-151.
Lezak MD. Neuropsychological Assessment, third edition. Oxford University Press,1995.25.
Overall JE, Gorham DR. The brief psychiatric rating scale. Psychol Rep 962;10:799-812.26.
Levin HS, High WM, Goethe KE, Sisson RA, Overall JE, Rhoades HM, Eiseberg HM, Kalisky Z, Gary HE. The 27.
neurobehavioural rating scale: assessment of the behavioural sequelae of head injury by the clinician. J
Neurol Neurosurg Psychiatry 1987;50:183-193.
Weimar C, Ziegler A, Konig IR, Diener HC. Predicting functional outcome and survival after acute ischemic 28.
stroke. J Neurol 2002;249:888-895.
Hall KM, Bushnik T, Lakisic-Kazazic B, Wright J, Cantanagallo A. Assessing traumatic brain injury outcome 29.
measures for long-term follow-up of community-based individuals. Arch Phys Med Rehabil 2001;
82:367-374.
Mayer NH, Pelensky J, Whyte J, Fidler-Sheppard R. Characterization and correlates of medical and 30.
rehabilitation charges for traumatic brain injury during acute rehabilitation hospitalization. Arch Phys Med
Rehabil 2003;84:242-248.
Whyte J, Hart T, Bode RK, Malec JF. The Moss Attention Rating Scale for traumatic brain injury: initial 31.
psychometric assessment. Arch Phys Med Rehabil 2003;84:268-276.

6
Bianca van BaalenElse OddingHenk J Stam
Brain Injury2008;22:25-32
Cognitive status at discharge from the hospital determines discharge destination in traumatic brain injury patients
86
Chapter 6
Abstract
Purpose: To determine which basic and functional status characteristics of patients with a moderate or severe traumatic brain injury (TBI) are associated with discharge destination.Method: Cross-sectional study among TBI patients TBI. The study included 111 patients aged 16-67 years with a moderate to severe TBI [Glasgow Coma Scale (GCS) score 3-14]. Functional outcome was assessed with Barthel Index (BI), Functional Independence Measurement (FIM), Level of Cognitive Functioning Scale (LCFS), Functional Assessment Measurement (FAM), Supervision Rating Scale (SRS), and Neurobehavioural Rating Scale (NRS). Patients were interviewed at the time of being discharged from hospital. Outcome variable was discharge destination; 1) home versus institution, and 2) rehabilitation center versus nursing home.Results: Gender, age and length of stay were not associated with discharge destination. TBI severity, physical status, level of arousal and cognitive status were univariately associated. Multivariate analyses, however, showed that the risk of being admitted to an institution was significantly higher for those with severe TBI (adjusted OR = 14), and/or lowered cognitive status at the time of discharge from hospital (adjusted OR = 12).Conclusions: Discharge destination is associated with TBI-severity at admittance to the hospital and cognitive status at discharge from the hospital.
87
Cognitive status at discharge from the hospital determines discharge destination in TBI patients
Introduction Patients experiencing a moderate to severe traumatic brain injury (TBI) are admitted to a hospital, and preferably to an intensive care unit of a hospital specialized in the care of these patients. If the patient survives, additional rehabilitation or nursing care is often required. The discharge destination after hospital admission is a major issue for patients and their relatives.In the Netherlands it is common practice that a rehabilitation specialist is consulted to determine discharge destination after hospital discharge. After a TBI spontaneous recovery to pre-traumatic level of functioning does occur but, especially in the more severe cases, a complex array of long-term sequelae may persist. All areas of life can be affected by a TBI, resulting in various cognitive, social, behavioural, emotional, and/or physical problems. The set of relevant domains is large and there is no direct relation between neurological impairments and long-term limitations or restrictions.1 Nevertheless, the rehabilitation specialist is asked to make a prognosis for the sub-acute phase (that is discharge destination), and preferably also for the chronic phase (for example, adjustments needed for one’s job).In the population of patients sustaining a stroke, decision rules regarding discharge destination are established.2 A patient is discharged home when the functional status is at a level at which he can function safely in daily activities, with or without help, and, if needed, is able to attend to outpatient rehabilitation. Discharge from hospital to inpatient rehabilitation is indicated when the patient is not yet able to live at home and/or to attend outpatient rehabilitation, but returning home is expected to be possible after some weeks of additional rehabilitation care. For referral to inpatient rehabilitation the patient needs an adequate cognition and physical condition to participate in therapy.3 However, well-accepted algorithms to determine “adequate cognition and physical condition” do not exist.4 When the patient is not expected to increase the functional status to such a level that he can live at home, discharge to a nursing home is indicated.2
A first step in determining ‘adequate cognition and physical condition’ is to measure the cognition and physical condition at the time of being discharged from the hospital, and then relate it to the actual discharge destination. This may provide the rehabilitation specialist with a tool in order to make his decision-making more transparent, and based on numbers and/or figures. More transparency will be better for a variety of reasons. Surprisingly, only few studies were found in the literature examining discharge destination of persons with TBI.5,6 To our knowledge, in the Netherlands no study exists on this subject. But with the prospective payment system for rehabilitation medicine starting soon it is important to create more transparency.The Rotterdam TBI study is a prospective follow-up study on the determinants of functional outcome of adult patients sustaining a TBI. In earlier reports we presented the rationale and reliability of the measurement instruments of functional status used in this study.1,7
In this report, we present the association between functional status at discharge from hospital and discharge destination. We hypothesized that the three destination groups (i.e. home, rehabilitation center, and nursing home) can be distinguished according to their scores on functional outcome.
88
Chapter 6
Patients and methods
The Rotterdam TBI studyThe Rotterdam TBI study is a prospective follow-up study on the determinants of functional outcome of adult patients sustaining a TBI7. The Rotterdam TBI study focuses on moderate and severe TBI. Patients are followed-up from admission at the emergency department up to three years post-injury.
RecruitmentThis study was approved by the hospital’s Medical Ethical Committee, and written informed consent was obtained from all patients either directly or by legal proxy. The study’s psychologist (BvB) recruited the patients. Most were capable to give informed consent themselves, whereas some had to be recruited by asking the legal proxy for informed consent.
PopulationThe study population constists of all adult consecutive patients with a moderate or severe TBI, admitted to the Erasmus MC Rotterdam (January 1999 - March 2004).Exclusion criteria were: (1) insufficient knowledge of Dutch or English language to participate in the study; (2) serious (pre-traumatic) co-morbidity which may interfere with the assessment of TBI-related disability.
Demographic variablesAge was assessed in years. Marital status was scored as never married, married, living together, divorced, or widowed. Level of education had three categories; ranging from primary school to university. Work status was scored as not having a job, having a part-time job, or a full-time job.
Severity of TBITBI was defined as the result of an external mechanical force causing damage to brain tissue. The worst Glasgow Coma Scale (GCS) score, administered in the first 24 hours after trauma, was used for categorization. Patients are classified as having a severe TBI when their GCS-score on admittance to the hospital is 3 to 8. Moderate TBI is defined as a GCS-score of 9-13.8,9,10 Furthermore patients with a GCS-score 14 or 15 ánd mass lesion on the head CT-scan were also classified as having a moderate TBI.11
Length of stayLength of stay at the hospital was assessed in days.
ComorbidityComorbidity as a consequence of the trauma (i.e. cardiovascular, locomotor, nervous senses, internal, psychiatric or other) was recorded at the time of trauma, during hospital stay, and at time of discharge from hospital.
89
Cognitive status at discharge from the hospital determines discharge destination in TBI patients
Functional outcome measurement instrumentsVarious valid and reliable measurement instruments of functional outcome are available for different time points after a TBI. A detailed description of the measurement instruments and their pros and cons is given elsewhere.1,7 For this study the following measurement instruments were used.
Physical functioningBarthel Index (BI). The BI is an index of daily living, registering the actual performance of a patient.12 It measures self-care, mobility skills and indicates the amount of care required. The score ranges from 0 to 20.Functional Independence Measurement (FIM). The FIM measures changes in functional status. This 18-item ordinal scale includes: self-care, sphincter control, mobility, locomotion, communication, and social cognition.13 The score ranges from 18 to 126.
Cognitive functioningRancho Los Amigos Level of Cognitive Functioning Scale (LCFS). The LCFS gives a description of the eight stages of cognitive functioning through which brain injured patients typically progress in hospital and acute rehabilitative care. The scale ranges from 1 to 8.14,15
Functional Assessment Measurement (FAM). The psychosocial and cognitive disabilities, common in TBI have led to the FAM (which is an extension of the FIM). The 12 FAM items are swallowing, car transfer, community access, reading, writing, speech intelligibility, emotional status, adjustment to limitations, employability, orientation, attention, and safety judgment.16 The score ranges from 12 to 84.Supervision Rating Scale (SRS). The SRS measures the level of supervision that a patient receives from the caregivers. The SRS rates levels of supervision on a 13-point ordinal scale that can optionally be grouped into five ranked categories, i.e. independent, overnight supervision, part-time supervision, full-time supervision, and full-time direct supervision.17
Neurobehavioural Rating Scale (NRS). This 27-item scale measures common behavioural and psychiatric symptoms after TBI. Examples of these symptoms are inattention/reduced alertness, somatic concern, disorientation, anxiety, conceptual disorganization, agitation, and motor retardation. The score ranges from 0 to 162.18
Data analysis
First, the distribution of discharge destination by gender, age, and initial severity of the TBI was investigated.Second, the prevalence of limitations in activity was estimated by gender, age, initial severity, and discharge destination. For this purpose the total scores of the various outcome measurements were dichotomized. The BI score was dichotomized into 19/20 (‘not physically limited’) and <19 (‘physically limited’).19 The FIM score into ≥108 (‘not limited in activities’) and <108 (‘limited in activities’; another person is needed).20 The LCFS score
90
Chapter 6
into 8 (‘not limited’; alert and oriented, aware and responsive to environment) and <8 (‘limited’; from coma to automatic responding).21 The FAM score into ≥72 (‘not limited’) and <72 (‘limited’).20 The ranked categories (1-5) of the SRS were dichotomized into 1 (‘not limited’; no supervision is required) and >1 (‘limited’; supervision is required).20 The NRS score was dichotomized into <28 (‘not cognitively limited’) and ≥28 (‘cognitively limited’).Univariate odds ratios of discharge destination were calculated for demographic variables, comorbidities, severity of TBI (GCS score) and the various outcome measurement instruments (BI, FIM, LCFS, FAM, SRS, and NRS). Discharge destination was dichotomized into 0= home, and 1= institution (rehabilitation center or nursing home). The demographic variables were dichotomized as follows: gender; men= 0, women= 1, age; < 40= 0, ≥ 40= 1. Work status was dichotomized into no job= 0, and having a job = 1. Marital status was dichotomized as living alone= 0 and living together= 1. Level of education was dichotomized into high (bachelor’s or master’s degree) score = 1, or low (=0). The median length of stay was 31 days; a score < 31 was considered as a short stay=0, while a score ≥ 31 was considered as a long stay=1. Comorbidity was dichotomized into no comorbidity = 0 and comorbidity = 1. The GCS score was dichotomized into moderate= 0 and severe= 1. The outcome measurement instruments were dichotomized as described above.To determine which variables are independently associated with discharge destination, the adjusted odds of discharge destination were calculated in a multivariate logistic regression model. The variables that were significantly associated with discharge destination in the univariate analyses were used in a backward multivariate logistic regression model of discharge destination. The backward removal criterion was F ≥ 0.05.
Results
Basic characteristics of the study groupThe Rotterdam TBI study recruited 111 patients. The main characteristics of the study population are given in table 1. There were 82 (74%) men and 29 (26%) women. The age at time of injury ranged from 16.4 to 66.2 years; mean 34.0 years (SD 12.5).The GCS scores ranged from 3 to 14; 35% of the patients were classified as having a moderate TBI and 65% as having a severe TBI. The distribution of TBI severity was not significantly different for gender and age.The length of stay at the hospital ranged from 4 to 173 days. Again, no significant differences were found for gender and age.
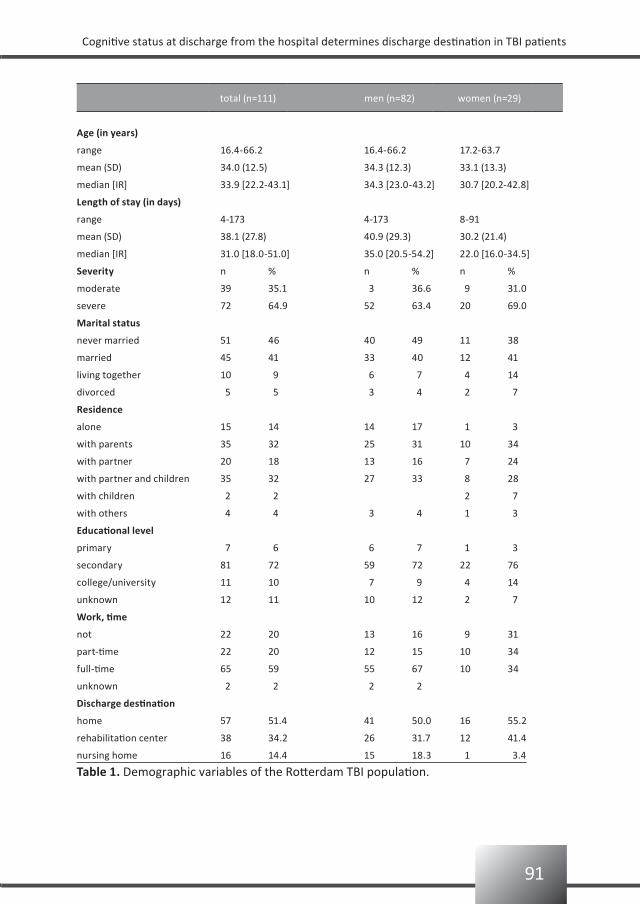
91
Cognitive status at discharge from the hospital determines discharge destination in TBI patients
total (n=111) men (n=82) women (n=29)
Age (in years)
range 16.4-66.2 16.4-66.2 17.2-63.7
mean (SD) 34.0 (12.5) 34.3 (12.3) 33.1 (13.3)
median [IR] 33.9 [22.2-43.1] 34.3 [23.0-43.2] 30.7 [20.2-42.8]
Length of stay (in days)
range 4-173 4-173 8-91
mean (SD) 38.1 (27.8) 40.9 (29.3) 30.2 (21.4)
median [IR] 31.0 [18.0-51.0] 35.0 [20.5-54.2] 22.0 [16.0-34.5]
Severity n % n % n %
moderate 39 35.1 3 36.6 9 31.0
severe 72 64.9 52 63.4 20 69.0
Marital status
never married 51 46 40 49 11 38
married 45 41 33 40 12 41
living together 10 9 6 7 4 14
divorced 5 5 3 4 2 7
Residence
alone 15 14 14 17 1 3
with parents 35 32 25 31 10 34
with partner 20 18 13 16 7 24
with partner and children 35 32 27 33 8 28
with children 2 2 2 7
with others 4 4 3 4 1 3
Educational level
primary 7 6 6 7 1 3
secondary 81 72 59 72 22 76
college/university 11 10 7 9 4 14
unknown 12 11 10 12 2 7
Work, time
not 22 20 13 16 9 31
part-time 22 20 12 15 10 34
full-time 65 59 55 67 10 34
unknown 2 2 2 2
Discharge destination
home 57 51.4 41 50.0 16 55.2
rehabilitation center 38 34.2 26 31.7 12 41.4
nursing home 16 14.4 15 18.3 1 3.4
Table 1. Demographic variables of the Rotterdam TBI population.
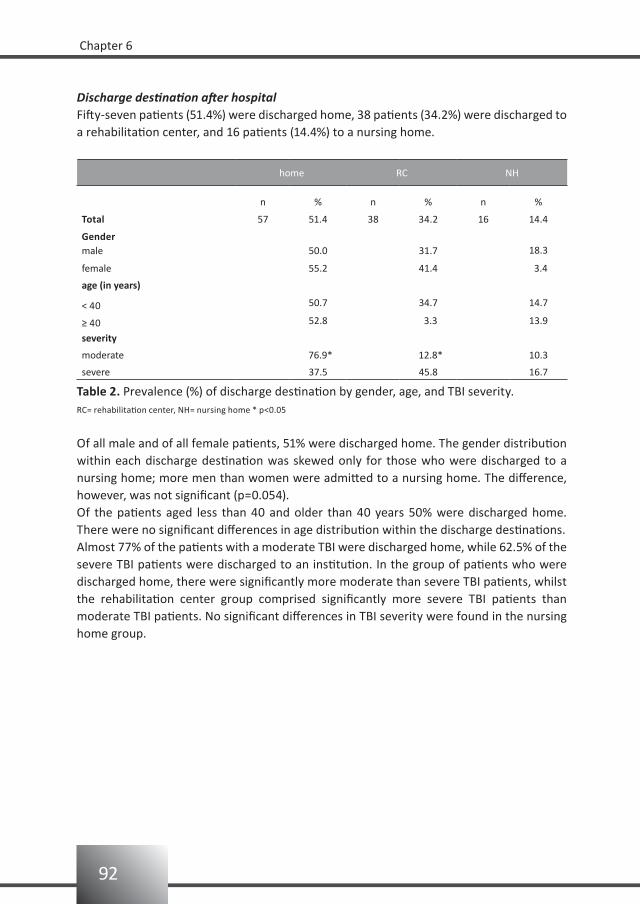
92
Chapter 6
Discharge destination after hospitalFifty-seven patients (51.4%) were discharged home, 38 patients (34.2%) were discharged to a rehabilitation center, and 16 patients (14.4%) to a nursing home.
home RC NH
n % n % n %
Total 57 51.4 38 34.2 16 14.4
Gendermale 50.0 31.7 18.3
female 55.2 41.4 3.4
age (in years)
< 40 50.7 34.7 14.7
≥ 40 52.8 3.3 13.9
severity
moderate 76.9* 12.8* 10.3
severe 37.5 45.8 16.7
Table 2. Prevalence (%) of discharge destination by gender, age, and TBI severity.RC= rehabilitation center, NH= nursing home * p<0.05
Of all male and of all female patients, 51% were discharged home. The gender distribution within each discharge destination was skewed only for those who were discharged to a nursing home; more men than women were admitted to a nursing home. The difference, however, was not significant (p=0.054).Of the patients aged less than 40 and older than 40 years 50% were discharged home. There were no significant differences in age distribution within the discharge destinations.Almost 77% of the patients with a moderate TBI were discharged home, while 62.5% of the severe TBI patients were discharged to an institution. In the group of patients who were discharged home, there were significantly more moderate than severe TBI patients, whilst the rehabilitation center group comprised significantly more severe TBI patients than moderate TBI patients. No significant differences in TBI severity were found in the nursing home group.
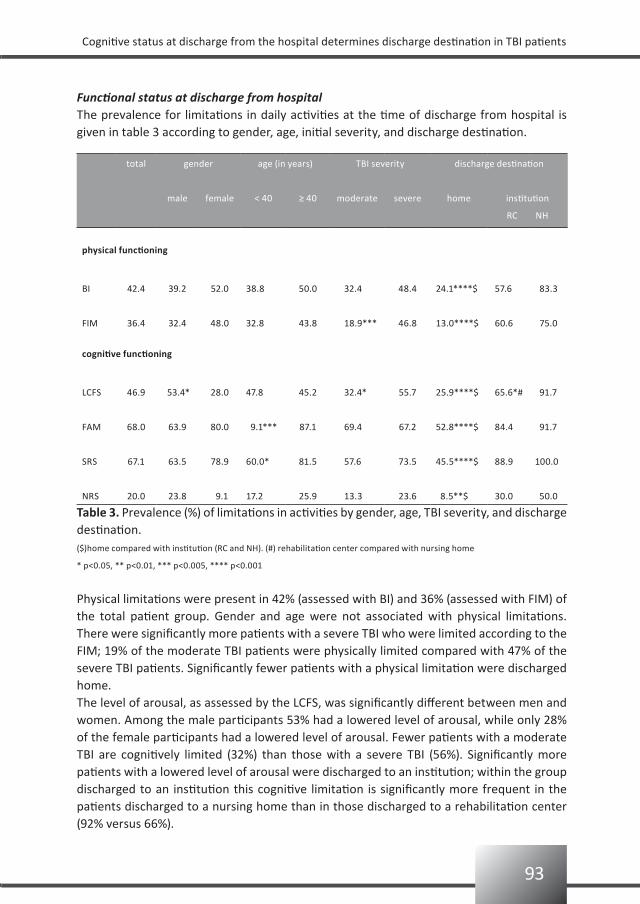
93
Cognitive status at discharge from the hospital determines discharge destination in TBI patients
total gender age (in years) TBI severity discharge destination
male female < 40 ≥ 40 moderate severe home institution
RC NH
physical functioning
BI 42.4 39.2 52.0 38.8 50.0 32.4 48.4 24.1****$ 57.6 83.3
FIM 36.4 32.4 48.0 32.8 43.8 18.9*** 46.8 13.0****$ 60.6 75.0
cognitive functioning
LCFS 46.9 53.4* 28.0 47.8 45.2 32.4* 55.7 25.9****$ 65.6*# 91.7
FAM 68.0 63.9 80.0 9.1*** 87.1 69.4 67.2 52.8****$ 84.4 91.7
SRS 67.1 63.5 78.9 60.0* 81.5 57.6 73.5 45.5****$ 88.9 100.0
NRS 20.0 23.8 9.1 17.2 25.9 13.3 23.6 8.5**$ 30.0 50.0
Functional status at discharge from hospitalThe prevalence for limitations in daily activities at the time of discharge from hospital is given in table 3 according to gender, age, initial severity, and discharge destination.
Table 3. Prevalence (%) of limitations in activities by gender, age, TBI severity, and discharge destination.($)home compared with institution (RC and NH). (#) rehabilitation center compared with nursing home
* p<0.05, ** p<0.01, *** p<0.005, **** p<0.001
Physical limitations were present in 42% (assessed with BI) and 36% (assessed with FIM) of the total patient group. Gender and age were not associated with physical limitations. There were significantly more patients with a severe TBI who were limited according to the FIM; 19% of the moderate TBI patients were physically limited compared with 47% of the severe TBI patients. Significantly fewer patients with a physical limitation were discharged home.The level of arousal, as assessed by the LCFS, was significantly different between men and women. Among the male participants 53% had a lowered level of arousal, while only 28% of the female participants had a lowered level of arousal. Fewer patients with a moderate TBI are cognitively limited (32%) than those with a severe TBI (56%). Significantly more patients with a lowered level of arousal were discharged to an institution; within the group discharged to an institution this cognitive limitation is significantly more frequent in the patients discharged to a nursing home than in those discharged to a rehabilitation center (92% versus 66%).
94
Chapter 6
Higher cognitive functioning, as assessed with the FAM, differed significantly between the age categories. Of the patients younger than 40 years 59% is cognitively limited, whereas 87% of the patients being 40 years or older was classified as cognitively limited. Again, the prevalence of cognitive limitations was significantly lower in patients discharged home.The need for supervision, as assessed by the SRS, is significantly higher when a patient is 40 years or older (82%) as opposed to when he or she is younger than 40 years (60%); significantly more patients needing supervision are discharged to an institution.Gender, age, and TBI severity were not associated with neurobehavioural disturbances as measured with the NRS. In the group of patients discharged to an institution the prevalence of disturbances was significantly higher than in the group that was discharged home.
Table 4 shows odds ratios of the basic characteristics and functional status for discharge destination (i.e. home versus institution). The first column gives the univariate odds ratios of the various variables. For the basic characteristics, the odds ratios were not significant. However, patients discharged to an institution had significantly lower GCS scores, and were more physically and cognitively limited than patients discharged home.The last column of table 4 shows the significant multivariate odds ratios. Only the variables that were univariately significantly associated were entered in the backward multivariate analyses. The GCS score and cognitive status were independently significantly associated with discharge destination. Patients with a moderate TBI were 14 times more likely to be discharged home than those classified with a severe TBI. Patients with cognitive limitations (i.e. FAM score < 72 or NRS score <28) were 12 times more likely to be discharged to an institution.In order to understand the differences between those who were discharged to a rehabilitation center and those discharged to a nursing home, the analyses were re-run but then with destination being rehabilitation center as opposed to nursing home. The odds ratios for the basic characteristics and functional status at the time of being discharged were not significant.

95
Cognitive status at discharge from the hospital determines discharge destination in TBI patients
univariate multivariate
OR 95%CI OR 95%CI
basic characteristics
gender 0.8 [0.3 - 1.9]
age category 1.1 [0.5 - 2.4]
work status 2.3 [0.9 - 6.2]
marital status 1.4 [0.7 - 2.9]
level of education 2.0 [0.7 - 6.1]
length of stay in days 0.7 [0.3 - 1.5]
comorbidity
at time of injury 0.8 [0.5 - 1.4]
during hospital stay 1.0 [0.8 - 1.4]
at discharge from hospital 1.1 [0.9 - 1.4]
measurement instruments
GCS 5.6 [2.3 - 13.5] 13.9 [2.9 - 58.7]
BI 5.7 [2.4 - 13.7]
LCFS 7.6 [3.1 - 18.7]
FIM 12.2 [4.5 - 33.1]
FAM 5.7 [2.0 - 15.6] 11.9 [2.7 - 52.0]
SRS 14.0 [3.7 - 52.4]
NRS 5.6 [1.6 - 19.0] 11.9 [1.6 - 89.4]
Table 4. Odds ratios for discharge destination home versus institution.
96
Chapter 6
Discussion
The present study investigated the association between functional status at discharge from the hospital and discharge destination. We hypothesized that three destination groups (i.e. home, rehabilitation center, and nursing home) could be distinguished according to their scores on functional outcome.Discharge destination was significantly associated with severity of TBI and level of cognitive functioning at discharge from the hospital. Gender, age, length of stay and physical functioning were not independently associated with discharge destination, which is in contrast with the results known from other studies, where age was associated with discharge destination.5,6 More specific, a higher percentage of elderly patients (i.e 60-99 years) went to inpatient rehabilitation or to long term care facilities. In our study patients over 66 years were not included, which may be the explanation of not finding an age-effect. Discharge home was also found to be less probable for mild TBI patients with positive cerebral imaging.6 In our study, only mild TBI patients with positive cerebral imaging were included.Selection and information bias is a risk in all studies. By recruiting all consecutive patients from the academic hospital, the Erasmus MC, we believe to have avoided the risk of recruitment selection. We are reassured by the fact that the basic characteristics of the present cohort is in accordance with other published TBI populations. It is a relatively young group (68% is younger than 40 years; mean age is 34.0 SD 12.5) and there is an overrepresentation of men (men: women is 2.8:1). Information bias is also not likely to have been occurred because all data were assessed using validated questionnaires in a standardized interview setting.The GCS score is strongly associated with acute morbidity and mortality, but less strongly with long-term functional outcome. Because of this low association with long-term functional outcome, the use of GCS scores in rehabilitation medicine is still under debate.21 However, in this study we looked at the subacute phase and, again, for this relatively early phase it seems to be an adequate instrument since it is significantly associated with the discharge destination.Physical and cognitive status at the time of being discharged from hospital is univariately associated with discharge destination. Patients discharged home are significantly less limited than those discharged to a rehabilitation center or nursing home. However, the multivariate analysis, in which the association between the independent variables was accounted for, revealed that only TBI severity and cognitive status were associated with discharge destination.Furthermore, the patients discharged to a nursing home seem more likely to be cognitively impaired than those who attend a rehabilitation center. The nursing home group is, however, small (n= 16) and therefore no firm conclusions should be drawn. Despite the small numbers in the nursing home group, the results for this subgroup are valuable as they confirm our common sense; i.e. patients with a lowered level of arousal are more likely to be discharged to a nursing home.
97
Cognitive status at discharge from the hospital determines discharge destination in TBI patients
Conclusion
In TBI patients the initial severity according to the worst GCS score in the first 24 hours after the trauma and the cognitive status at the time of being discharged from the hospital are significantly associated with the patient either being discharged home or admitted to an institution. The physical status of the TBI patient is not associated with discharge destination. There is an indication that the group discharged to an institution can be subdivided into a rehabilitation center group and a nursing home group; with the patients discharged to a nursing home being more cognitively limited. Further research in larger studies (with more patients in the nursing home group) is needed to substantiate the association.
98
Chapter 6
References
van Baalen B, Odding E, Maas AIR, Ribbers GM, Bergen MP, Stam HJ. Traumatic brain injury: classification 1.
of initial severity and determination of functional outcome. Disabil Rehabil 2003;25:9-18.
Unsworth CA, Thomas SA. Information use in discharge accommodation recommendations for stroke 2.
patients. Clin Rehabil 1993;7:181-188.
Dobkin BH. Rehabilitation after stroke. New Engl J Med 2005;352:1677-1684.3.
Ribbers GM. Traumatic brain injury rehabilitation in the Netherlands. J Head Trauma Rehabil 2007;22(4): 4.
234-238.
Tooth L, McKenna K, Strong J, Ottenbacher K, Connell J, Cleary M. Rehabilitation outcomes for brain injured 5.
patients in Australia: functional status, length of stay and discharge destination. Brain Inj 2001;15:
613-631.
de Guise E, LeBlanc J, Feyz M, Lamoureux J. Prediction of outcome at discharge from acute care following 6.
traumatic brain injury. J Head Trauma Rehabil 2006;21(6):527-536.
van Baalen B, Odding E, van Woensel MPC, van Kessel MA, Roebroeck ME, Stam HJ. Reliability and sensitivity 7.
to change of measurement instruments used in a traumatic brain injury population. Clin Rehabil 2006;20:
686-700.
Teasdale G, Jennet B. Assessment of coma and impaired consciousness: a practical scale. Lancet 1974;2: 8.
81-84.
Marshall LF, Gautille T, Klauber MR, Eisenberg HM, Jane JA, Luerssen TG. The outcome of severe closed 9.
head injury. J Neurosurg 1991;75:S28-36.
Hall KM. Establishing a national traumatic brain injury information system based upon a unified data set. 10.
Arch Phys Med Rehabil 1997;78:S12-S16.
Gomez PA, Lobato RD, Ortega JM, De La Cruz J. Mild head injury: differences of prognosis among patients 11.
with a Glasgow Coma Scale score of 13 to 15 and analysis of factors associated with abnormal CT findings.
Br J Neurosurg 1996;10(5):453-60.
Collin C, Wade DT, Davies S, Horne V. The Barthel ADL Index: a reliability study. Int Disabil Stud 1988;10: 12.
61-63.
Granger CV, Hamilton BB, Keith RA, Zielezny M, Sherwin FS. Advances in functional assessment for medical 13.
rehabilitation. Topics Ger Rehabil 1986;1:59-74.
Hagen C. Language cognitive disorganization following closed head injury: a conceptualization. In: Trexler 14.
LE (ed). Cognitive rehabilitation: conceptualization and intervention. Plenum Press,1982,pp 131-151.
Lezak MD. Neuropsychological assessment. (3rd edn). Oxford University Press, 1995.15.
Granger CV, Divan N, Fiedler RC. Functional assessment scales. A study of persons after traumatic brain 16.
injury. Am J Phys Med Rehabil 1995;74:107-113.
Boake C. Supervision Rating Scale: a measure of functional outcome from brain injury. Arch Phys Med 17.
Rehabil 1996;77:765-772.
Levin HS, High WM, Goethe KE, Sisson RA, Overall JE, Rhoades HM, Eisenberg HM, Kalisky Z, Gary HE. The 18.
neurobehavioral rating scale: assessment of the behavioural sequelae of head injury by the clinician.
J Neurol Neurosurg Psychiatry 1987;50:183-193.
Weimar C, Ziegler A, Konig IR, Diener HC. Predicting functional outcome and survival after acute ischemic 19.
stroke. J Neurol 2002;249:888-895.
99
Cognitive status at discharge from the hospital determines discharge destination in TBI patients
Hall KM, Bushnik T, Lakisic-Kazazic B, Wright J, Cantanagallo A. Assessing traumatic brain injury outcome 20.
measures for long-term follow-up of community-based individuals. Arch Phys Med Rehabil 2001;82:
367-374.
Zasler ND. Prognostic indicators in medical rehabilitation of traumatic brain injury: a commentary and 21.
review. Arch Phys Med Rehabil 1997;78:S12-S16.

Participation after a traumatic brain injury is negatively associated with a passive coping style of the caregiver
7
Bianca van BaalenGerard M Ribbers
Dorien Medema-MeulenpasMartijn S PasElse OddingHenk J Stam
Brain Injury2007;21:925-931
102
Chapter 7
Abstract
Purpose: To examine whether the caregivers’ coping style is associated with the functional outcome of the traumatic brain injury (TBI) patient one year post-injury. Method: A cross sectional study among patients with a TBI, including their primary caregivers. The study included 51 patients aged 17-64 years with a moderate to severe TBI, and 51 caregivers (23 parents and 28 partners) aged 23-67 years. The coping preferences of the caregivers were assessed at minimum 6 and maximum 12 months post-injury, by filling out the Utrecht Coping List (UCL) and were related to limitations in activity, as measured with the Frenchay Activities Index and with restrictions in participation as measured with the Sickness Impact Profile-68 of TBI patients one year post-injury. The patients were interviewed at their homes; the caregivers received and returned the UCL by mail.Results: The patients’ age and the caregivers’ coping style are independently associated with restrictions in participation one year post-injury.Conclusions: A passive coping style of the primary caregiver is negatively associated with the patient’s functional outcome in terms of participation in society.
103
Participation after a TBI is negatively associated with a passive coping style of the caregiver
Introduction
In the Netherlands the annual incidence of severe traumatic brain injury (TBI) is estimated at 79 per 10,000 inhabitants. Whilst this incidence is much lower compared to other causes of brain injury such as stroke, the long-term effects in terms of limitations in activity and restrictions in participation are often much higher. In contrast with the stroke population, TBI affects younger age groups with a longer life expectancy and therefore the socio-economic costs will consequently be higher.1
TBI not only affects the person who sustains the injury, but also has a large impact on the entire family system of the subject as well.2-4 Caregivers report substantial perceived stress or injury-related burden, which increases during the first year and may persist up to 7 years post-injury.5 Family functioning, and the support the family offers to the patient, is an important key to success in rehabilitation.6 The family supports the patient to cope with the stressful realities ensuing from chronic physical, cognitive, emotional, and behavioural problems.7-10 It is well-known that the caregivers’ coping styles and perceptions of social support are more predictive of their emotional distress than the injury severity or disability level of the person that they take care of.5,11
To our knowledge no studies exist that examine the association of the caregivers’ coping style and the functional outcome in terms of level of activity and/or level of participation of the adult TBI patient. The present study therefore investigated whether the coping style of a caregiver can be of influence on the functional outcome of the patient.Coping is defined as the cognitive, emotional, and social behavioural response of a person to an adjustment-demanding situation. Coping strategies are not considered to be invariable, but are the preference of a person for certain combinations of coping behaviours used in different situations: i.e. the coping style.12
We hypothesized that patient characteristics as well as caregiver characteristics may be associated with the functional outcome of the patient: the type of caregiver (i.e. being a partner or a parent), and the preferred coping style of the caregiver.
Population and methods
PopulationThe population for the present cross-sectional study is a sample of the first 51 consecutive patients with a primary caregiver, drafted from the 125 patients that were included in the longitudinal Rotterdam TBI study.1 The Rotterdam TBI study is a prospective follow-up study in which patients are followed up to three years post-injury. The patients were recruited from January 1999 to June 2004 from either the neurosurgery intensive care unit of the Erasmus MC in Rotterdam (January 1999 till March 2004), the intensive care unit of the Medical Center Haaglanden location Westeinde in The Hague (September 2002 to June 2004), or the neurosurgery unit of the Utrecht University Medical Center in Utrecht (January 2003 to June 2004). All participating hospitals are level-one trauma centres with protocol-guided acute care facilities, including intracranial pressure monitoring.
104
Chapter 7
Inclusion criteria were: (1) admittance in hospital for moderate or severe TBI due to a blunt or penetrating trauma. A moderate TBI is defined as having a Glasgow Coma Scale (GCS) score of 9-13 (13 wíth visible brain damage on CT-scan), and a severe TBI is defined as having a GCS score of 3-8;13 (2) age at time of injury between 18 and 65 years; (3) having a primary caregiver. Exclusion criteria were: (1) insufficient knowledge of Dutch or English language to participate in the study; (2) serious (pre-traumatic) co-morbidity which may interfere with the assessment of TBI-related disability.This study was approved by the hospital’s medical ethical committee. Primary caregivers were invited to participate by the researcher (BvB) and were given written and oral information. The caregivers signed an informed consent before participating in the study. A total of 51 caregivers participated in the study, i.e. 28 partners and 23 parents.
MethodsDependent variablesFrenchay Activities Index (FAI)The FAI measures activities that reflect a higher level of independence and social survival.14 It consists of 15 items measuring complex activities in categories of household, recreation, transportation, and work. The items deal with activities that require some decision making and organizing on the part of the patient both in the home and outside. The FAI scoring is based on the frequency with which an activity has been performed in the preceding 3 or 6 months and ranges from 0 (inactive) to 45 (highly active).15 Data were collected by interviewing the patient. The mean pre-morbid FAI score of all 125 patients in the Rotterdam TBI study was 29. This is comparable with FAI scores found in the general population which range from 26 to 28.15-17 We dichotomized our data according to the mean pre-morbid score of 29. A FAI score ≥ 29 was considered as not limited in activities.
Sickness Impact Profile 68 (SIP-68)The SIP-6818 is a shortened version of the original Sickness Impact Profile (SIP) of 136 items. The SIP is a multidimensional general health status instrument, which measures perceived changes in behaviour judged by the patient as the consequence of being sick.19 The SIP-68 was developed in order to get a more concise yet reliable measurement instrument. It contains 68 items which are divided over six subscales: somatic autonomy, mobility control, psychological autonomy and communication, social behaviour, emotional stability, and mobility range that proved to be valid and reliable.1 The SIP68 totalscore was used as a measure of level of participation in society. To dichotomize the SIP-68 we used the median score.20 In our study the median score at 12 months was 9, and therefore a SIP-68 score < 9 was considered as not being restricted in participation, whereas a score ≥9 was considered as being restricted.
105
Participation after a TBI is negatively associated with a passive coping style of the caregiver
Independent variablesPatient characteristicsPatient characteristics included gender, age (younger/older than 40 years), TBI severity,21 and level of education. Level of education was dichotomised into high (bachelor’s or master’s degree = 1) or low (=0).Patient’s physical status at one year was assessed with Barthel Index (BI) and dichotomised into not limited (BI 19-20) or limited (BI <19). Patient’s cognitive status at one year was assessed with Rancho Level of Cognitive Functioning Scale (LCFS) and dichotomised into not limited (LCFS=8) or limited (LCFS <8).
Caregiver characteristicsPrimary caregivers were defined as the persons taking the primary responsibility for the care of the patients after discharge. With respect to caregiver type, we distinguished parents and partners. Coping style is defined as the preference of a person to respond in a certain way to different situations.11 The coping style of the caregiver was assessed at minimum 6 and maximum 12 months after injury with the Utrecht Coping List (UCL). The UCL is a Dutch coping questionnaire with well-documented validity and reliability.11,22 It consists of 49 items, with 7 subscales: the Palliative score (Pal), representing seeking distraction (e.g. trying to relax, going out, decreasing pressure by smoking and/or drinking); the Expressive score (Exp), representing expressing emotions (e.g. showing anger and letting off steam); the Social support score (Soc), representing seeking social support (e.g. asking for help and sharing worries with someone); the Avoidance score (Avo), representing avoiding (e.g. let things take their course and waiting to see which way the wind blows); the Reassurance score (Rea), representing fostering reassuring thoughts (e.g. encouraging oneself, telling oneself everything will be alright); the Passive score (Pas), representing passive coping (e.g. isolating oneself from others, worrying about the past, and taking refuge in fantasies); and finally the Active score (Act), representing active coping (e.g. tackling a problem at once, seeing problems as a challenge, and remaining calm in difficult situations). Caregivers were asked to score on a four-point scale how often they made use of certain coping behaviours (‘seldom or never/ sometimes/ often/ very often’).
Data analysis
First, we estimated the mean scores for FAI and SIP-68 for the patients by gender, severity of injury (moderate or severe), and for age category (below and above 40 years) and were tested on their differences. Second, we estimated the prevalence of limitations in activity and restrictions in participation. Scores for the UCL-subscales were estimated by gender.Univariate logistic regression analyses were carried out for all independent variables, i.e. education, gender, age-category, severity of injury (GCS score), physical (BI score) and cognitive (LCFS score) status of the patient, and UCL scores on all 7 scales, and age, gender,
106
Chapter 7
and type of caregiver (parent or partner).The independent variables significantly associated with the dependent variable were introduced in a stepwise logistic regression at a 0.05 level. Backward elimination was used to keep the variable in the model.
Results
Table 1 presents some basic characteristics of the patients and their primary caregivers.Although the inclusion criterion for age was set at 18 to 65 years, here the observed range was 17 to 64 years of age. Within the patient-group there were as many children as partners. There were more patients with a low education than with a high education (78% versus 14%). According to our definition of physically and cognitively limited only 12% of the patients were physically limited and only 16% of the patients could be considered cognitively limited.There were more female caregivers in this group than male caregivers (34 versus 17). In the male caregiver group there were more partners than parents (i.e. 64% versus 35%); partners and parents were equally distributed among female caregivers.
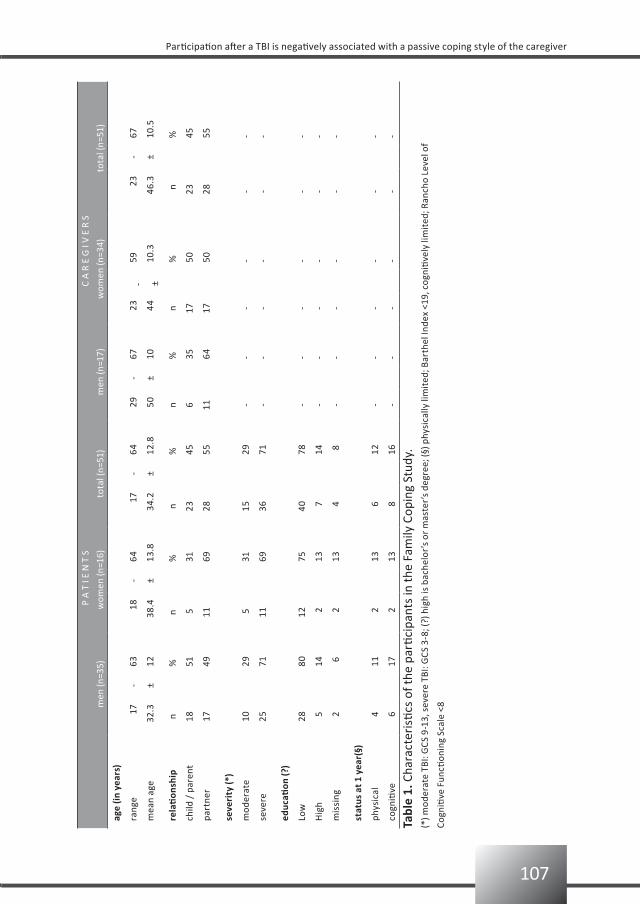
107
Participation after a TBI is negatively associated with a passive coping style of the caregiver
P
A T
I E
N T
SC
A R
E G
I V
E R
S
m
en (n
=35)
wom
en (n
=16)
tota
l (n=
51)
men
(n=1
7)w
omen
(n=3
4)to
tal (
n=51
)
age
(in y
ears
)
rang
e17
-63
18-
6417
-64
29-
6723
-59
23-
67
mea
n ag
e32
.3±
1238
.4±
13.8
34.2
±12
.850
±10
44±
10.3
46.3
±10
.5
rela
tion
ship
n%
n%
n%
n%
n%
n
%
child
/ p
aren
t18
51 5
3123
456
3517
50 2
345
part
ner
1749
1169
2855
1164
1750
28
55
seve
rity
(*)
mod
erat
e10
29 5
3115
29-
--
--
-
seve
re25
7111
6936
71-
--
--
-
educ
ation
(?)
Low
2880
1275
4078
--
--
--
Hig
h 5
14 2
13 7
14-
--
--
-
mis
sing
2 6
213
4 8
--
--
--
stat
us a
t 1 y
ear(
§)
phys
ical
411
213
612
--
--
--
cogn
itive
6
17 2
13
8
16-
-
-
--
-
Tabl
e 1.
Cha
ract
eris
tics
of th
e pa
rtici
pant
s in
the
Fam
ily C
opin
g St
udy.
(*) m
oder
ate
TBI:
GCS
9-1
3, s
ever
e TB
I: G
CS 3
-8; (
?) h
igh
is b
ache
lor’
s or
mas
ter’
s de
gree
; (§)
phy
sica
lly li
mit
ed; B
arth
el In
dex
<19,
cog
niti
vely
lim
ited
; Ran
cho
Leve
l of
Cogn
itive
Fun
ction
ing
Scal
e <8
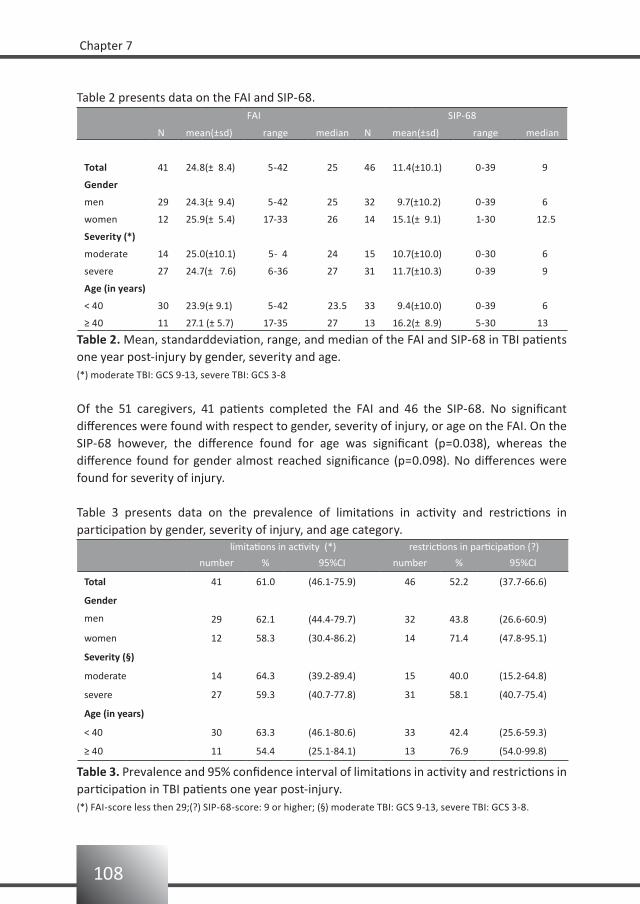
108
Chapter 7
Table 2 presents data on the FAI and SIP-68. FAI SIP-68
N mean(±sd) range median N mean(±sd) range median
Total 41 24.8(± 8.4) 5-42 25 46 11.4(±10.1) 0-39 9
Gender
men 29 24.3(± 9.4) 5-42 25 32 9.7(±10.2) 0-39 6
women 12 25.9(± 5.4) 17-33 26 14 15.1(± 9.1) 1-30 12.5
Severity (*)
moderate 14 25.0(±10.1) 5- 4 24 15 10.7(±10.0) 0-30 6
severe 27 24.7(± 7.6) 6-36 27 31 11.7(±10.3) 0-39 9
Age (in years)
< 40 30 23.9(± 9.1) 5-42 23.5 33 9.4(±10.0) 0-39 6
≥ 40 11 27.1 (± 5.7) 17-35 27 13 16.2(± 8.9) 5-30 13
Table 2. Mean, standarddeviation, range, and median of the FAI and SIP-68 in TBI patients one year post-injury by gender, severity and age.(*) moderate TBI: GCS 9-13, severe TBI: GCS 3-8
Of the 51 caregivers, 41 patients completed the FAI and 46 the SIP-68. No significant differences were found with respect to gender, severity of injury, or age on the FAI. On the SIP-68 however, the difference found for age was significant (p=0.038), whereas the difference found for gender almost reached significance (p=0.098). No differences were found for severity of injury. Table 3 presents data on the prevalence of limitations in activity and restrictions in participation by gender, severity of injury, and age category.
limitations in activity (*) restrictions in participation (?)
number % 95%CI number % 95%CI
Total 41 61.0 (46.1-75.9) 46 52.2 (37.7-66.6)
Gender
men 29 62.1 (44.4-79.7) 32 43.8 (26.6-60.9)
women 12 58.3 (30.4-86.2) 14 71.4 (47.8-95.1)
Severity (§)
moderate 14 64.3 (39.2-89.4) 15 40.0 (15.2-64.8)
severe 27 59.3 (40.7-77.8) 31 58.1 (40.7-75.4)
Age (in years)
< 40 30 63.3 (46.1-80.6) 33 42.4 (25.6-59.3)
≥ 40 11 54.4 (25.1-84.1) 13 76.9 (54.0-99.8)
Table 3. Prevalence and 95% confidence interval of limitations in activity and restrictions in participation in TBI patients one year post-injury.(*) FAI-score less then 29;(?) SIP-68-score: 9 or higher; (§) moderate TBI: GCS 9-13, severe TBI: GCS 3-8.
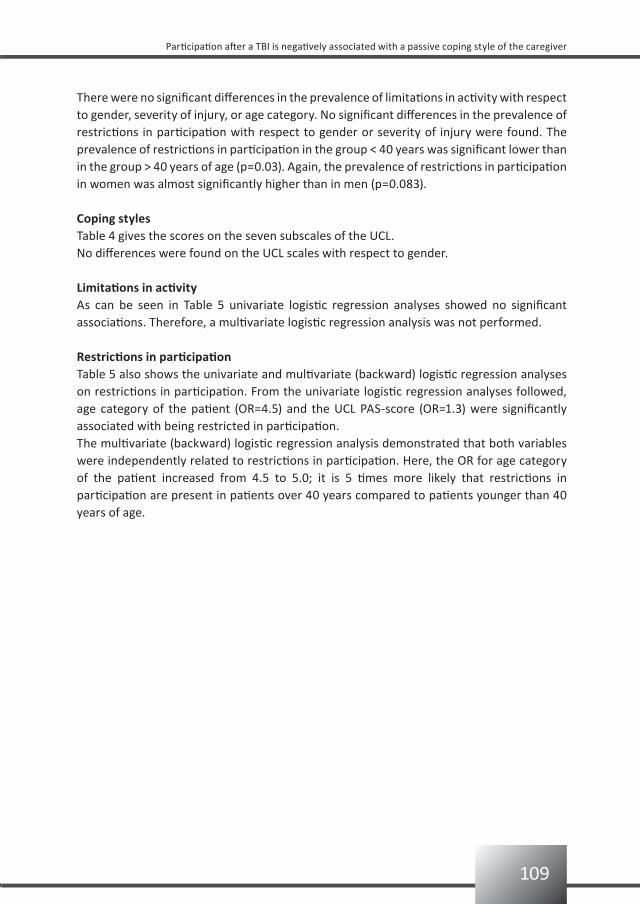
109
Participation after a TBI is negatively associated with a passive coping style of the caregiver
There were no significant differences in the prevalence of limitations in activity with respect to gender, severity of injury, or age category. No significant differences in the prevalence of restrictions in participation with respect to gender or severity of injury were found. The prevalence of restrictions in participation in the group < 40 years was significant lower than in the group > 40 years of age (p=0.03). Again, the prevalence of restrictions in participation in women was almost significantly higher than in men (p=0.083).
Coping stylesTable 4 gives the scores on the seven subscales of the UCL.No differences were found on the UCL scales with respect to gender.
Limitations in activityAs can be seen in Table 5 univariate logistic regression analyses showed no significant associations. Therefore, a multivariate logistic regression analysis was not performed.
Restrictions in participationTable 5 also shows the univariate and multivariate (backward) logistic regression analyses on restrictions in participation. From the univariate logistic regression analyses followed, age category of the patient (OR=4.5) and the UCL PAS-score (OR=1.3) were significantly associated with being restricted in participation. The multivariate (backward) logistic regression analysis demonstrated that both variables were independently related to restrictions in participation. Here, the OR for age category of the patient increased from 4.5 to 5.0; it is 5 times more likely that restrictions in participation are present in patients over 40 years compared to patients younger than 40 years of age.
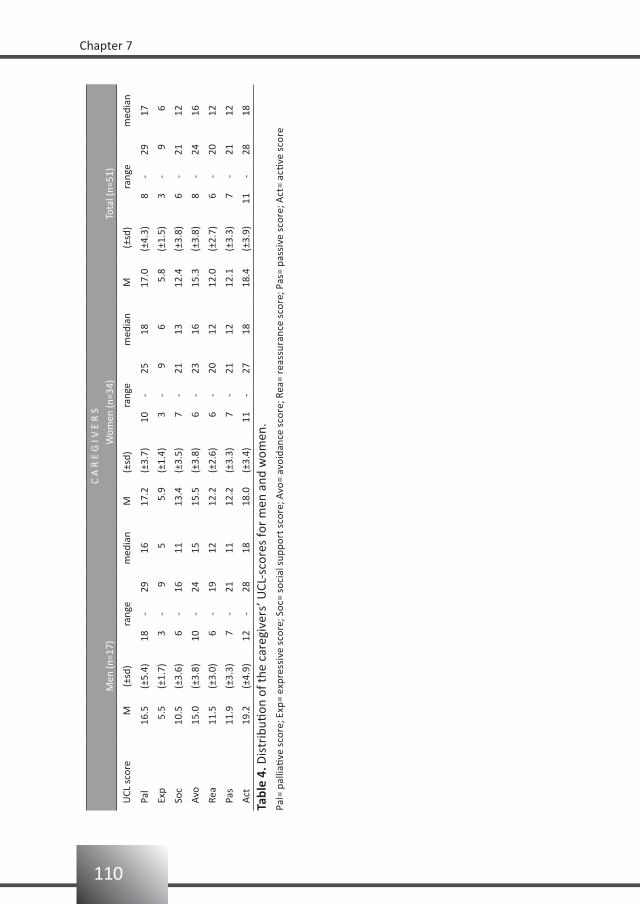
110
Chapter 7
C A
R E
G I
V E
R S
Men
(n=1
7)W
omen
(n=3
4)To
tal (
n=51
)
UCL
sco
reM
(±
sd)
rang
em
edia
nM
(±sd
)ra
nge
med
ian
M (±
sd)
rang
em
edia
n
Pal
16.5
(±5.
4)18
-29
1617
.2(±
3.7)
10-
2518
17.0
(±4.
3)8
-29
17
Exp
5.5
(±1.
7)3
-9
55.
9(±
1.4)
3-
9 6
5.8
(±1.
5)3
-9
6
Soc
10.5
(±3.
6)6
-16
1113
.4(±
3.5)
7-
2113
12.4
(±3.
8)6
-21
12
Avo
15.0
(±3.
8)10
-24
1515
.5(±
3.8)
6-
2316
15.3
(±3.
8)8
-24
16
Rea
11.5
(±3.
0)6
-19
1212
.2(±
2.6)
6-
2012
12.0
(±2.
7)6
-20
12
Pas
11.9
(±3.
3)7
-21
1112
.2(±
3.3)
7-
2112
12.1
(±3.
3)7
-21
12
Act
19.2
(±4.
9)12
-28
1818
.0(±
3.4)
11-
2718
18.4
(±3.
9)11
-28
18
Tabl
e 4.
Dis
trib
ution
of t
he c
areg
iver
s’ U
CL-s
core
s fo
r m
en a
nd w
omen
.Pa
l= p
allia
tive
sco
re; E
xp=
expr
essi
ve s
core
; Soc
= so
cial
sup
port
sco
re; A
vo=
avoi
danc
e sc
ore;
Rea
= re
assu
ranc
e sc
ore;
Pas
= pa
ssiv
e sc
ore;
Act
= ac
tive
sco
re
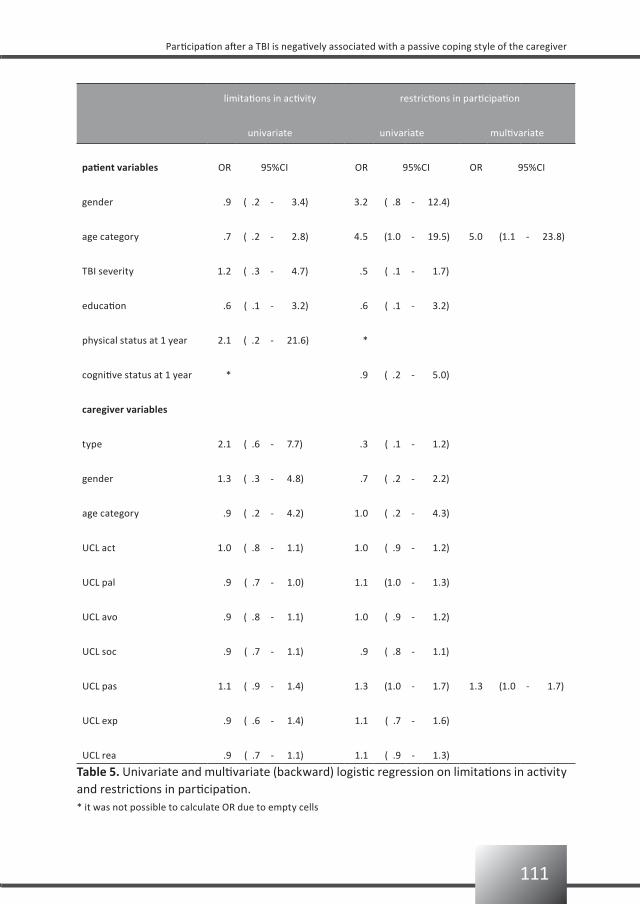
111
Participation after a TBI is negatively associated with a passive coping style of the caregiver
limitations in activity restrictions in participation
univariate univariate multivariate
patient variables OR 95%CI OR 95%CI OR 95%CI
gender .9 ( .2 - 3.4) 3.2 ( .8 - 12.4)
age category .7 ( .2 - 2.8) 4.5 (1.0 - 19.5) 5.0 (1.1 - 23.8)
TBI severity 1.2 ( .3 - 4.7) .5 ( .1 - 1.7)
education .6 ( .1 - 3.2) .6 ( .1 - 3.2)
physical status at 1 year 2.1 ( .2 - 21.6) *
cognitive status at 1 year * .9 ( .2 - 5.0)
caregiver variables
type 2.1 ( .6 - 7.7) .3 ( .1 - 1.2)
gender 1.3 ( .3 - 4.8) .7 ( .2 - 2.2)
age category .9 ( .2 - 4.2) 1.0 ( .2 - 4.3)
UCL act 1.0 ( .8 - 1.1) 1.0 ( .9 - 1.2)
UCL pal .9 ( .7 - 1.0) 1.1 (1.0 - 1.3)
UCL avo .9 ( .8 - 1.1) 1.0 ( .9 - 1.2)
UCL soc .9 ( .7 - 1.1) .9 ( .8 - 1.1)
UCL pas 1.1 ( .9 - 1.4) 1.3 (1.0 - 1.7) 1.3 (1.0 - 1.7)
UCL exp .9 ( .6 - 1.4) 1.1 ( .7 - 1.6)
UCL rea .9 ( .7 - 1.1) 1.1 ( .9 - 1.3)
Table 5. Univariate and multivariate (backward) logistic regression on limitations in activity and restrictions in participation.* it was not possible to calculate OR due to empty cells
112
Chapter 7
Discussion
How caregivers cope with a TBI patient has a huge bearing on the caregivers themselves, but also on the outcome of the TBI patient. The more adept caregivers deal with the situation, the better the patients recover.23 The importance of including family functioning as a variable in models to predict rehabilitation outcome, as well as the importance of family intervention as part of the rehabilitation process is already emphasized in previous studies. Less improvement on the Disability Rating Scale, level of functioning, and employability scores was measured in TBI patients when their family functioning was unhealthy.24 Furthermore, problem-solving and behavioural coping strategies in response to TBI of a proxy was significantly related to lower levels of depression in TBI patients.25 The results of our study seem to underscore the importance of caregiver characteristics on functional outcome of the TBI-patient. After correcting for age of the patient, our data show that when the primary caregiver has a preference for passive coping, the patient is more prone to restrictions in participation. However, because of several limitations the present study doesn’t allow firm conclusions. Because of a small sample size, we had to leave out potential predictors of the patient, such as co morbidity, period of posttraumatic amnesia, or having children at home. Only the GCS score, physical and cognitive status, patients’ gender, age and education, and the caregivers’ type (parent or partner), gender and age were used as independent variables. The use of the GCS score to predict long-term functional outcome is still under debate, but is probably not a good predictor for rehabilitation purposes.26-28
Information bias is a second limitation of the study. Some data were missing: data on FAI were available for only 41 patients; these missing data for 10 patients might explain not finding a significant association between being limited in activities and the independent variables.A third limitation may be found in the assessment scales used. The FAI originally was developed for use in the stroke population and not for the TBI population. The BI was used for expressing the physical status and the LCFS for expressing the cognitive status. According to the BI one year post-injury 12% is physically limited, whereas the LCFS categorizes 16% as cognitively limited which are low numbers. Possibly the BI and the LCFS lack the sensitivity to detect long term sequelae of TBI.

113
Participation after a TBI is negatively associated with a passive coping style of the caregiver
Conclusion
From this study we can conclude that when patients are aged over 40 years they are 5 times more likely to be restricted than when the patient is younger than 40. Furthermore, from this study we can also conclude that TBI patients with a caregiver with a preference for a passive coping style are more restricted in participation than TBI patients with a caregiver with another preference for coping.Therefore, sub-acute TBI rehabilitation should probably focus on both the patient and the primary caregiver. A passive coping style of the primary caregiver is negatively associated with the patient’s functional outcome in terms of participation. Counselling the caregiver aimed at changing ones’ coping style into a less passive coping style may be an effective intervention. Further research however, in larger studies, with more independent variables, is needed to clarify the associations found here.
114
Chapter 7
References
van Baalen B, Odding E, Maas AIR, Ribbers GM, Bergen MP, Stam HJ. Traumatic brain injury: classification 1.
of initial severity and determination of functional outcome. Disabil Rehabil 2003;25:9-18.
Kosciulek JF. Relationship of family schema to family adaptation to brain injury. Brain Inj 2.
1997;11:821-830.
de Jong G, Batavia AI, Williams JM. Who is responsible for the lifelong well-being of a person with a head 3.
injury? J Head Trauma Rehabil 1990;5:9-22.
Hanks RA, Rapport LJ, Vangel S. Caregiving appraisal after traumatic brain injury: the effects of functional 4.
status, coping style, social support and family functioning. NeuroRehabil 2007;22(1):43-52.
Sander AM, Sherer M, Malec JF, High WM Jr, Thompson RN, Moessner AM, Josey J. Preinjury emotional 5.
and family functioning in caregivers of persons with traumatic brain injury. Arch Phys Med Rehabil
2003;84:197-203.
Kwasnica CM, Heinemann A. Coping with traumatic brain injury: representative case studies. Arch Phys 6.
Med Rehabil 1994;75:384-389.
Rivara JB, Jaffe KM, Fay GC, Pollisar NL, Martin KM, Shurtleff HA, Liao S. Family functioning and injury 7.
severity as predictors of child functioning one year following traumatic brain injury. Arch Phys Med
Rehabil 1993;74:1047-1055.
Rivara JB, Fay GC, Jaffe KM, Polissar NL, Shurtleff HA, Martin KM. Predictors of family functioning one 8.
year following traumatic brain injury in children. Arch Phys Med Rehabil 1992;73:899-910.
Rivara JM, Jaffe KM, Polissar NL, Fay GC, Liao S, Martin KM. Predictors of family functioning and change 3 9.
years after traumatic brain injury in children. Arch Phys Med Rehabil 1996;77:754-764.
Wade SL, Borawski EA, Taylor HG, Drotar D, Yeates KO, Stancin T. The relationship of caregiver coping to 10.
family outcomes during the initial year following pediatric traumatic injury. J Consult Clin Psychol 2001;69:
406-415.
Douglas JM, Spellacy FJ. Indicators of long-term family functioning following severe traumatic brain injury 11.
in adults. Brain Inj 1996;10:819-839.
Schreurs PJG, Willige van de G, Tellegen B, Brosschot JF. Handleiding Utrechtse Coping Lijst: UCL. Swets 12.
en Zeitlinger, 1988.
Marshall LF, Bowers, Marshall S, Klauber MR, van Berkum Clark M, Eisenberg HM, Jane JA, Luersson, TG, 13.
Mamarou A, Foulkes MA. A new classification of head injury based on computerized tomography.
J Neurosurg 1991;75:S14-S20.
Holbrook M, Skilbeck CE. An activities index for use with stroke patients. Age ageing 1983;12:166-170.14.
Schuling J, de Haan R, Limburg M, Groenier KH. The Frenchay Activities Index. Assessment of functional 15.
status in stroke patients. Stroke 1993;24:1173-1177.
Hachisuka K, Saeki S, Tsutsui Y, Chisaka H, Ogata H, Iwata N, Negayama, S. Gender-related differences in 16.
scores of the Barthel Index and Frenchay Activities Index in randomly sampled elderly persons living at
home in Japan. J Clin Epidemiol 1999;52:1089-1094.
Turnbull JC, Kersten P, Habib M, McLellan L, Mullee MA, George S. Validation of the Frenchay Activities 17.
Index in a general population aged 16 years and older. Arch Phys Med Rehabil 2000;81:1034-1038.
de Bruin AF, Diederiks JPM, de Witte LP, Stevens FCJ, Philipsen H. The development of a short generic 18.
version of the Sickness Impact Profile. J Clin Epidemiol 1994;47:407-418.
115
Participation after a TBI is negatively associated with a passive coping style of the caregiver
Gilson BS, Gilson JS, Bergner M, Bobbitt RA, Kressel S, Pollard WE, Vesselago M. The Sickness Impact 19.
Profile: development of an outcome measure of health care. Am J Public Health 1975;65:1304-1310.
Stalenhoef PA, Diederiks JPM, Knottnerus JA, de Witte LP, Crebolder HFJM. The construction of a patient 20.
record-based risk model for recurrent falls among elderly people living in the community. Fam Pract
2000;17:490-496.
Poon WS, Zhu XL, Ng SC, Wong GK. Predicting one year clinical outcome in traumatic brain injury (TBI) at 21.
the beginning of rehabilitation. Acta Neurochir Suppl. 2005;93:207-208.
Sanderman R, Ormel J. De Utrechtse Copinglijst (UCL): validiteit en betrouwbaarheid. Gedrag en 22.
Gezondheid 1992;20:32-37.
Verhaeghe S, Defloor T, Grypdonck M. Stress and coping among family of patients with traumatic brain 23.
injury: a review of the literature. J Clin Nurs 2005;14:1004-1012.
Sander AM, Caroselli JS, High WM, Becker C, Neese L, Scheibel R. Relationship of family functioning to 24.
progress in a post-acute rehabilitation programme following traumatic brain injury. Brain Inj 2002; 16(8):
649-657.
Leach LR, Frank RG, Bouman DE, Farmer J. Family functioning, social support and depression after 25.
traumatic brain injury. Brain Inj 1994;8(7):599-606.
Udekwu P, Kromhout-Schiro S, Vaslef S, Baker C, Oller D. Glasgow Coma Scale score, mortality, and 26.
functional outcome in head-injured patients. J Trauma 2004;56:1084-1089.
Vitaz TW, Jenks J, Raque GH, Shields CB. Outcome following moderate traumatic brain injury. Surg Neurol 27.
2003;60:285-291.
Toschlog EA, MacElligot J, Sagraves SG, Schenarts PJ, Brard MR, Goettler CE, Rotondo MF, Swanson MS. 28.
The relationship of Injury Severity Score and Glasgow Coma Score to rehabilitative potential in patients
suffering traumatic brain injury. Am Surg 2003;69:491-497.

Functional prognosis and quality of life in traumatic brain injury (TBI) patients
8
Bianca van BaalenElse OddingHenk J Stam
submitted for publication
118
Chapter 8
Abstract
Objectives: To study the prognosis of functioning and quality of life (QoL) in patients one year after having sustained a moderate or severe traumatic brain injury (TBI).Design: Prospective hospital-based cohort study.Setting: Level I trauma centers.Interventions: Not applicable.Participants: One hundred twenty six TBI patients from a hospital-based cohort in the Netherlands.Main outcome measures: Glasgow Outcome Scale, Disability Rating Scale, Barthel Index, Functional Independence Measurement, Functional Assessment Measurement, Rancho Level of Cognitive Functioning Scale, Neurobehavioural Rating Scale, Wimbledon Self-Reporting Scale, Frenchay Activity Index, Community Integration Questionnaire, Sickness Impact Profile-68 and the Rand SF-36.Results: One year post-injury 75% of the patients reported problems in their general functioning, 13% in physical functioning, 35% in cognitive functioning, and 26% in their emotional functioning. In total, 76% of the patients were limited in psychosocial activities, 72% experienced work restrictions, and 91% of all patients reported a reduced QoL. General functioning was predicted by physical and cognitive limitations at discharge (Risk Ratio (RR) 0.3). Physical functioning was predicted by physical limitations at discharge only (RR 0.4). Cognitive functioning was predicted by severity of TBI (RR -0.2), and physical and cognitive limitations at discharge (RR 0.3 and 0.4, respectively). Psychosocial functioning was predicted by gender (RR 0.3) and physical limitations at discharge (RR 0.3). Return to work was predicted by severity of TBI (RR -0.2), and physical and cognitive limitations at discharge (RR 0.3 and 0.4, respectively). QoL was only predicted by physical limitations at discharge (RR 0.3).Conclusion: Gender, severity of TBI, as well as physical and cognitive status at discharge from hospital, are important variables in predicting functional outcome and QoL one year after TBI. Key words: traumatic brain injury (TBI), functional prognosis, quality of life.
119
Functional prognosis and quality of life in traumatic brain injury (TBI) patients
Introduction
An important question frequently asked by patients and their families after a traumatic brain injury (TBI) is: what can we expect regarding recovery? Early after injury the questions mainly concern survival and complications. At a later stage, however, the focus shifts to the patient’s functioning in the community. Apart from the patient and their family, also therapists, insurance companies and employers are interested in the patient’s prognosis of future outcome. Functional prognosis helps in the planning of healthcare programs or projects specifically aimed at job reintegration.Although the number of studies on functional prognosis has increased over the last decade, the results are not uniform.1-6 For instance, productivity and success in return to work, return to school, handicap and social integration, and even life satisfaction, are examples of outcomes that are reported to be influenced by the severity of initial injury.4 Other studies, however, suggest that the Glasgow Coma Scale (GCS) score is strongly associated with acute morbidity and mortality, but less strongly with long-term functional outcome.5 Corrigan and colleagues found that outcome could not be predicted based on premorbid characteristics, injury severity, and initial functional abilities.6
Knowledge on the determinants of functional outcome would support rehabilitation physicians in their task to develop more ‘tailor-made’ treatment protocols and give a more detailed prognosis on specific disabilities.5
The Rotterdam Traumatic Brain Injury Study investigates functional prognosis in TBI patients. A prospective hospital-based cohort is followed up to one year post-injury; patients are between 18 and 65 years with a moderate or severe TBI.Our previous reports have described the measurement instruments used to determine functional outcome, as well as the functional status and discharge destination after admittance to the hospital.7-9
The present study aims to establish which factors are predictive of the patient’s functioning and quality of life (QoL) one year post-injury. In order to place the results in a meaningful context, the following secondary questions were formulated, 1) what is the prevalence of problems in general, physical, cognitive, and emotional functioning, 2) what is the prevalence of being limited in psychosocial activities, 3) what is the prevalence of work restrictions, and 4) what is the prevalence of a lowered QoL.
Patients and methods
The Rotterdam TBI studyThe Rotterdam TBI study is a prospective follow-up study on determinants of daily functioning in patients with a moderate or severe TBI. TBI was defined as an injury to the brain caused by an external mechanical force.
120
Chapter 8
PopulationPatients were eligible for the study if they were aged between 18 and 65 years, sustained a moderate or severe TBI, and were admitted to one of three hospitals from January 1999 to June 2004. The participating hospitals were the Erasmus Medical Center (Erasmus MC), Rotterdam (January 1999 to March 2004), the Medical Center Haaglanden, location Westeinde, The Hague (September 2002 to June 2004) and the Utrecht University Medical Center (UMC) (January 2003 to June 2004).Exclusion criteria were: 1) insufficient knowledge of the Dutch or English language to participate in the study, and 2) serious (pre-traumatic) neurological, psychiatric, oncological or internal impairments that were expected to interfere with TBI-related disabilities.
RecruitmentDuring the study period all consecutive TBI patients admitted to the hospital, irrespective of the severity of TBI, were screened for eligibility. All patients were recruited by two psychologists who also carried out the study.All eligible patients and their partner or caregiver were given oral and written information about the goal and research methods of the study. Participating patients signed the informed consent form (sometimes after their legal representative had signed the informed consent form previously). The study was approved by the Medical Ethical Review Committee of the Erasmus MC.
MethodsData on demographics were collected during interviews with the patient and/or their proxies.Interviews were held at the time of discharge from hospital and at one year after injury. To assess the physical, cognitive, and psychosocial limitations we used a set of questionnaires based on a review of the literature.7
The three participating hospitals provided data about the origin and severity of the trauma (GCS score), as well as length of stay at the hospital.
Demographic variablesAge was assessed in years and two groups were formed: i.e. those aged < 40 years and an older group aged ≥ 40 years. Marital status was classified as: not married, or married/living together. Level of education was categorized in: only primary education, secondary education, or college/university. Work status was categorized in: not working or working.
Severity of TBIPatients were classified as having a severe TBI when their worst GCS score in the first 24 hours after TBI was 3-8. Moderate TBI was defined as a worst GCS score of 9-13.10,11 Furthermore, patients with a GCS score of 14 or 15 ánd with mass lesion on the head CT scan were also classified as having a moderate TBI.12,13
121
Functional prognosis and quality of life in traumatic brain injury (TBI) patients
Measurement instrumentsGeneral functioning Glasgow Outcome Scale (GOS)The GOS measures the consequences of a TBI and categorizes them in five categories of severity: 0 = dead, 1 = vegetative state, 2 = severely limited, 3 = moderately limited, and 4 = good recovery.14 For the GOS a standard form and written protocol was used.15
Disability Rating Scale (DRS)The DRS measures changes in four categories: 1) level of arousal and awareness (identical to the GCS score), 2) cognitive ability to deal with problems of feeding, toileting and grooming, 3) degree of physical dependence on others, and 4) the ability to do useful work as independently as possible. The total score ranges from 0-30, where 0 = no disability, 1 = mild disability, 2, 3 = partial disability, 4-6 = moderate disability, 7-11 = moderately severe disability, 12-16 = severe disability, 17-21 = extremely severe disability, 22-24 = vegetative state, 25-29 = extreme vegetative state, and 30 = death.16
Physical functioningBarthel Index (BI)The BI was initially developed to follow progress during inpatient rehabilitation of stroke patients. This measurement instrument has evolved into one of the most commonly employed instruments for physical disabilities in rehabilitation in general; it measures the actual performance of daily activities of a patient.17,18 The score ranges from 0-20. Although a ceiling effect exists, the BI can reliably be used in a TBI population.8
Functional Independence Measurement (FIM)The FIM was developed to measure changes in functional status within an individual over the course of a comprehensive medical rehabilitation program. The 18-item ordinal scale examines the following functions: self-care, sphincter control, mobility, locomotion, communication, and social cognition.19 The score ranges from 18-126.
Cognitive functioning:Functional Assessment Measurement (FAM)The FAM (an extension of the FIM) measures the psychosocial and cognitive disabilities that are common in TBI.20 The 12 FAM items are: swallowing, car transfer, community access, reading, writing, speech intelligibility, emotional status, adjustment to limitations, employability, orientation, attention, and safety judgment. The score ranges from 12-84.Rancho Los Amigos Levels of Cognitive Functioning Scale (LCFS)The LCFS describes the eight stages of cognitive functioning through which a TBI patient typically progress in hospital and acute rehabilitation, and can vary from no response = 1 (in which the patient is in deep coma and completely unresponsive), to purposeful and appropriate functioning = 8 (where the patient is alert and oriented, able to recall and integrate past and recent events, and is aware of and responsive to his environment).21,22
122
Chapter 8
Neurobehavioural Rating Scale (NRS)The NRS is a modification of the Brief Psychiatric Rating Scale.23 This 27-item scale has been developed for TBI patients and measures common behavioural and psychiatric symptoms after TBI. Examples of these symptoms are inattention/reduced alertness, somatic concern, disorientation, anxiety, conceptual disorganization, agitation, and motor retardation. The NRS gives 4 sub-scales: energy, meta-cognition, anxiety, and language.24 The score ranges from 0–162.
Emotional functioningWimbledon Self-Reporting Scale (WSRS)The WSRS gives a measure for the emotional status and detects mood disturbances. The WSRS comprises 30 adjectives and sentences describing feelings (i.e. nervous, rejected, happy, desperate). The patient rates on a 4-point scale (ranging from never to almost always) the frequency of occurrence in the past 4 weeks.25
Rand-36 mental health (Rand MH)Rand MH is a subscale of the Rand-36. The Rand-36 is a multidimensional questionnaire measuring health-related QoL. The measurement instrument is suitable for use in the general population as well as in specific patient populations. The Rand-36 is comprised of eight subscales: physical functioning (PF), bodily pain (BP), general health perception (GH), social functioning (SF), vitality (VT), mental health (MH), and role limitations as a consequence of physical (RP) or emotional problems (RE).26
Psychosocial functioningFrenchay Activities Index (FAI)The FAI is a 15-item (score 0-3) questionnaire measuring at the level of activities and is developed for use in the stroke population. It counts the frequency of housholding activities, shopping, leisure activities and visiting others. The higher the score, the more socially active the patient is.27 The reliability of the FAI in the TBI population is established.8
Community Integration Questionnaire (CIQ)The CIQ is a 15-item scale with 3 sub-scales measuring home integration (hi), social integration (si), and productivity (p) in TBI patients. A higher score indicates a better integration.28
Return to workReturn to work (RTW) is scored by using one question from the DRS regarding work.16
Quality of lifeSickness Impact Profile-68 (SIP-68)The original Sickness Impact Profile-136 (SIP-136) measures the changes in health behavior experienced by patients as a consequence of their disease.29 The SIP-136 has been used in various TBI studies.6,30-33 A shortened version of the SIP-136 has been developed in the Netherlands and comprises 68 items.34
123
Functional prognosis and quality of life in traumatic brain injury (TBI) patients
Rand-36The Rand-36 has been described previously.26
The measurement instruments for general, physical and cognitive functioning were administered at time of discharge from the hospital, and again one year post-injury. The questionnaires concerning psychosocial functioning, emotional functioning, and the instruments for measuring RTW and QoL were administered at one year post-injury only; that is, if the patient was already living at home. The pre-injury level of psychosocial functioning was assessed by administering the FAI and the CIQ with the instruction to answer the items according to the patient’s functioning before trauma.
Data analysis
First, the distribution of gender, age, and pre-injury marital status, level of education, and work status was investigated. Then the injury-related characteristics (initial severity of the TBI as measured with the GCS and total length of stay in hospital) were investigated.The scores of all measurement instruments are given and, where possible, compared with studies from the Traumatic Brain Injury Model Systems (TBIMS) national dataset.Measures for general, physical, and cognitive functioning at hospital discharge and measures for general, physical, cognitive, emotional, psychosocial functioning, as well as measures for return to work and QoL one year post-injury, were constructed using the various questionnaires. In order to present prevalence data on functional outcome and QoL, the various measurement instruments were first dichotomized. From the dichotomized measurement instruments the functional status and QoL categories were constructed.
General functioningGeneral functioning (GF) was reflected by the scores on the GOS and DRS. Those scores were dichotomized as follows: GOS score 5 = not limited and GOS < 5 = limited. DRS score 0 = not limited and DRS > 0 = limited.The dichotomized scores of the GOS and DRS were taken together and categorized into: GF not limited = not limited on GOS and DRS, GF limited = limited on one of the two, GF severely limited = limited on both measurement instruments.
Physical functioningPhysical functioning (PF) was measured with the BI and FIM. The BI was dichotomized as: BI score 19/20 = not limited and BI<19 = limited,35 and the FIM score as ≥108 = not limited and FIM< 108 = limited.36
For PF the following categories were formed: PF not limited = not limited on BI and FIM, PF moderately limited = limited on one of these measurement instruments, PF severely limited = limited on BI and FIM.
124
Chapter 8
Cognitive functioningCognitive functioning (CF) was measured with LCFS, FAM and NRS. The LCFS score was dichotomized as 8 = not limited and LCFS <8 = limited.36 A score on the FAM ≥72 = not limited and FAM <72 = limited.36 The NRS was cut-off at 28, in which a score <28 = not limited and ≥28 = limited.For CF this generated the following categories: CF not limited = not limited on FAM, LCFS, and NRS, CF mildly limited = limited on one of these measurement instruments, CF moderately limited = limited on 2 of the measurement instruments, and CF severely limited = limited on 3 measurement instruments.
Emotional functioningEmotional functioning (EF) was measured with the WSRS and the Rand MH. The WSRS was dichotomized as < 8 = not limited and WSRS ≥ 8 = limited.37 The score on the Rand-MH ≥ 58.4 = not limited and Rand-MH < 58.4 = limited.38
The following categories could be made: EF not limited = not limited on WSRS and Rand MH, EF moderately limited = limited on one of these measurement instruments, EF severely limited = limited on WSRS and Rand MH.
Psychosocial functioningPsychosocial Functioning (PSF) was measured with the FAI and the subscales home integration (HI) and social integration (SI) of the CIQ. The scores one year post-injury were compared with the scores on the pre-injury scores and thereafter dichotomized. When the score on the FAI at one year was lower than the pre-injury FAI-score the patient was categorized as limited. Also, when the score on the CIQ scores were lower than the pre-injury scores the patient was considered to be limited. For PSF this generated the following categories: PSF not limited = not limited on FAI, CIQhi, and CIQsi, PSF mildly limited = limited on one of these measurement instruments, PSF moderately limited = limited on 2 of the measurement instruments, and PSF severely limited = limited on 3 measurement instruments.
Return to workReturn to work (RTW) was scored by using one question from the DRS regarding work. The following four categories were generated: RTW not limited = work on pre-injury level, RTW mildly limited = competitive, adapted, RTW moderately limited = sheltered, not competitive, RTW severely limited = not possible.
Quality of lifeQuality of life (QoL) was measured with the SIP68 and the Rand. The SIP68 was cut-off at score 0 (score > 0 = limited) and the Rand-scores at Rand-PF < 58.6 = limited, Rand-RP < 43.9 = limited, Rand-RE < 51.8 = limited, Rand-P < 53.9 = limited, Rand-SF < 66.4 = limited, Rand-MH < 58.4 = limited, Rand-VT < 47.5 = limited.38 No Rand total score exists, but in the present study all dichotomized subscales were summed. If the summated dichotomized Rand-score
125
Functional prognosis and quality of life in traumatic brain injury (TBI) patients
was > 0 = limited. QoL = not reduced if SIP68 and Rand = not limited, moderately reduced = SIP68 or Rand = limited, and severely reduced if SIP68 and Rand = limited.Subsequently the prevalence of limitations, restrictions, and reduced QoL was estimated.Univariate linear relative risks of limitations in general, physical, cognitive, emotional, and psychosocial functioning, as well as return to work and reduced QoL at one year post-injury, were estimated for the independent variables (i.e. gender, pre-injury marital status, pre-injury work status, level of education, age, severity of TBI, and general, physical and cognitive functioning at discharge). Associations between the independent variables were also examined.Finally, multivariate relative risks of limitations in general, physical, cognitive, emotional, and psychosocial functioning, as well as RTW and reduced QoL at one year post-injury, were estimated for the significantly associated variables, using a multivariate linear regression model with backward removal criterion of F ≥ 0.05.In the regression analyses demographic variables and severity of TBI were dichotomous variables; all others were entered as ordinal variables.
Results
A total of 126 patients participated in the study. One year post-injury 16 patients had been lost to follow-up. Of the remaining 110 patients, 2 were still in a vegetative state, 1 was still in a rehabilitation center, and 4 could not be reached in time for the study. Therefore, one year post-injury measurements were carried out in 103 (94%) patients.
Demographic and injury-related characteristicsTable 1 presents the demographic and injury-related characteristics of the patients at time of injury and at one year post-injury.
Of the 126 patients (age range 16-67, mean 34.0 years), 73% was male, 81% had at least secondary education, 11% had a college/university degree, and 78% had a job at the moment of sustaining the TBI. On admission, 67% of the patients had a severe TBI (GCS score 3-8). At time of hospital discharge all patients were limited in general functioning, almost 50% were physically limited, and 76% were cognitively limited. One year post-injury, data on demographics were available from 110 patients: 75% were generally limited, 13% were physically limited, and 35% were cognitively limited.
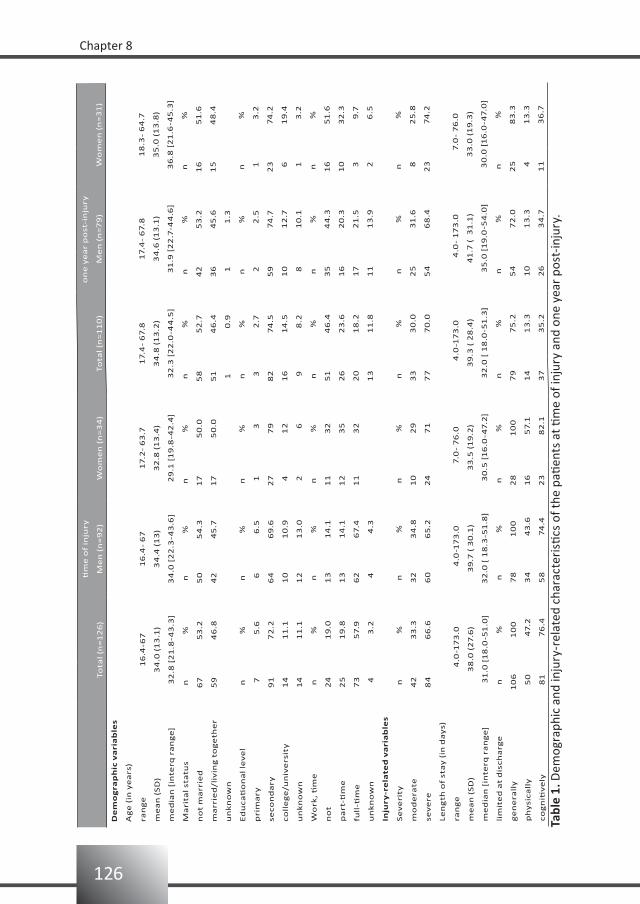
126
Chapter 8
tim
e o
f in
jury
on
e y
ea
r p
ost
-in
jury
To
tal
(n=
12
6)
Me
n (
n=
92
)W
om
en
(n
=3
4)
To
tal
(n=
11
0)
Me
n (
n=
79
)W
om
en
(n
=3
1)
De
mo
gra
ph
ic v
ari
ab
les
Ag
e (
in y
ea
rs)
ran
ge
16
.4-6
71
6.4
- 6
71
7.2
- 6
3.7
17.4
- 6
7.8
17.4
- 6
7.8
18
.3-
64
.7
me
an
(S
D)
34
.0 (
13
.1)
34
.4 (
13
)3
2.8
(1
3.4
)3
4.8
(1
3.2
)3
4.6
(1
3.1
)3
5.0
(1
3.8
)
me
dia
n [
inte
rq r
an
ge
]3
2.8
[2
1.8
-43
.3]
34
.0 [
22
.3-4
3.6
]2
9.1
[1
9.8
-42
.4]
32
.3 [
22
.0-4
4.5
]3
1.9
[2
2.7
-44
.6]
36
.8 [
21
.6-4
5.3
]
Ma
rita
l st
atu
sn
%n
%n
%n
%n
%n
%
no
t m
arr
ied
67
53
.25
05
4.3
17
50
.05
85
2.7
42
53
.21
65
1.6
ma
rrie
d/l
ivin
g t
og
eth
er
59
46
.84
24
5.7
17
50
.05
14
6.4
36
45
.61
54
8.4
un
kn
ow
n1
0
.9 1
1
.3
Ed
uc
ati
on
al
lev
el
n%
n%
n%
n%
n%
n%
pri
ma
ry 7
5
.6 6
6
.5 1
3
3
2
.7 2
2
.5 1
3
.2
seco
nd
ary
91
72
.26
46
9.6
27
79
82
74
.55
97
4.7
23
74
.2
co
lle
ge
/un
ive
rsit
y1
41
1.1
10
10
.9 4
12
16
14
.51
01
2.7
6
19
.4
un
kn
ow
n1
41
1.1
12
13
.0 2
6
9
8
.2 8
10
.1 1
3
.2
Wo
rk,
tim
en
%n
%n
%n
%n
%n
%
no
t2
41
9.0
13
14
.11
13
25
14
6.4
35
44
.31
65
1.6
pa
rt-ti
me
25
19
.81
31
4.1
12
35
26
23
.61
62
0.3
10
32
.3
full
-tim
e7
35
7.9
62
67.4
11
32
20
18
.21
72
1.5
3
9
.7
un
kn
ow
n 4
3
.2 4
4
.31
31
1.8
11
13
.9 2
6
.5
Inju
ry-r
ela
ted
va
ria
ble
s
Se
ve
rity
n%
n%
n%
n%
n%
n%
mo
de
rate
42
33
.33
23
4.8
10
29
33
30
.02
53
1.6
8
25
.8
sev
ere
84
66
.66
06
5.2
24
71
77
70
.05
46
8.4
23
74
.2
Le
ng
th o
f st
ay
(in
da
ys)
ran
ge
4
.0-1
73
.0 4
.0-1
73
.0 7.0
- 7
6.0
4
.0-1
73
.0 4
.0-
17
3.0
7.0
- 7
6.0
me
an
(S
D)
38
.0 (
27.6
)3
9.7
( 3
0.1
)3
3.5
(1
9.2
)3
9.3
( 2
8.4
)4
1.7
( 3
1.1
)3
3.0
(1
9.3
)
me
dia
n [
inte
rq r
an
ge
]3
1.0
[1
8.0
-51
.0]
32
.0 [
18
.3-5
1.8
]3
0.5
[1
6.0
-47.2
]3
2.0
[ 1
8.0
-51
.3]
35
.0 [
19
.0-5
4.0
]3
0.0
[1
6.0
-47.0
]
lim
ite
d a
t d
isch
arg
en
%n
%n
%n
%n
%n
%
ge
ne
rall
y1
06
10
07
81
00
28
10
07
97
5.2
54
72
.02
58
3.3
ph
ysi
ca
lly
5
0 4
7.2
34
4
3.6
16
5
7.1
14
13
.31
01
3.3
4
13
.3
co
gn
itiv
ely
8
1 7
6.4
58
7
4.4
23
8
2.1
37
35
.22
63
4.7
11
36
.7
Tabl
e 1.
Dem
ogra
phic
and
inju
ry-r
elat
ed c
hara
cter
istic
s of
the
patie
nts
at ti
me
of in
jury
and
one
yea
r po
st-in
jury
.
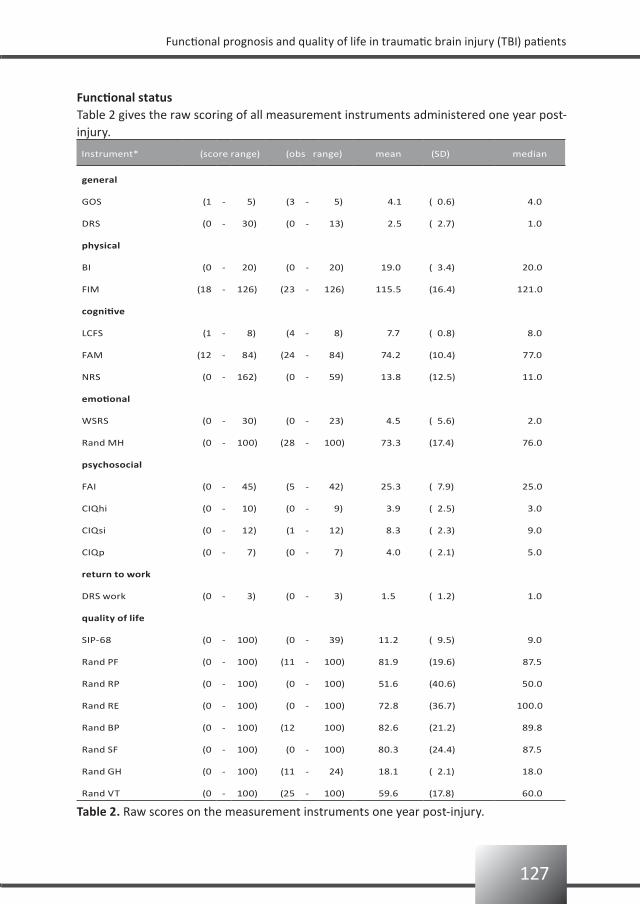
127
Functional prognosis and quality of life in traumatic brain injury (TBI) patients
Functional statusTable 2 gives the raw scoring of all measurement instruments administered one year post-injury.
Instrument* (score range) (obs range) mean (SD) median
general
GOS (1 - 5) (3 - 5) 4.1 ( 0.6) 4.0
DRS (0 - 30) (0 - 13) 2.5 ( 2.7) 1.0
physical
BI (0 - 20) (0 - 20) 19.0 ( 3.4) 20.0
FIM (18 - 126) (23 - 126) 115.5 (16.4) 121.0
cognitive
LCFS (1 - 8) (4 - 8) 7.7 ( 0.8) 8.0
FAM (12 - 84) (24 - 84) 74.2 (10.4) 77.0
NRS (0 - 162) (0 - 59) 13.8 (12.5) 11.0
emotional
WSRS (0 - 30) (0 - 23) 4.5 ( 5.6) 2.0
Rand MH (0 - 100) (28 - 100) 73.3 (17.4) 76.0
psychosocial
FAI (0 - 45) (5 - 42) 25.3 ( 7.9) 25.0
CIQhi (0 - 10) (0 - 9) 3.9 ( 2.5) 3.0
CIQsi (0 - 12) (1 - 12) 8.3 ( 2.3) 9.0
CIQp (0 - 7) (0 - 7) 4.0 ( 2.1) 5.0
return to work
DRS work (0 - 3) (0 - 3) 1.5 ( 1.2) 1.0
quality of life
SIP-68 (0 - 100) (0 - 39) 11.2 ( 9.5) 9.0
Rand PF (0 - 100) (11 - 100) 81.9 (19.6) 87.5
Rand RP (0 - 100) (0 - 100) 51.6 (40.6) 50.0
Rand RE (0 - 100) (0 - 100) 72.8 (36.7) 100.0
Rand BP (0 - 100) (12 100) 82.6 (21.2) 89.8
Rand SF (0 - 100) (0 - 100) 80.3 (24.4) 87.5
Rand GH (0 - 100) (11 - 24) 18.1 ( 2.1) 18.0
Rand VT (0 - 100) (25 - 100) 59.6 (17.8) 60.0
Table 2. Raw scores on the measurement instruments one year post-injury.
128
Chapter 8
All measurement instruments, except Rand general health (Rand GH), used the total scoring of the scale. Scoring of the Rand GH ranged from 11-24, which is only 13% of the total scale.Comparison with the TBIMS was possible for DRS (2.6), FIM (115.6), and CIQ (15.4)39; for these items no significant differences were found compared with the present study.
Table 3 gives the prevalence of limitations in general, physical, cognitive, emotional, and psychosocial functioning, as well as in work and QoL one year post-injury, by gender, age, severity of TBI, and by the limitations which were present at discharge from the hospital.One year post-injury, 75% of the patients were limited in their general functioning. Of the patients who were physically limited at discharge, almost all (92%) considered themselves as limited in general functioning one year post-injury.Only a small proportion of the patients (13%) experienced physical limitations one year post-injury, with the older patients reporting more limitations (24%) compared with the younger patients (10%). Of the patients physically limited at hospital discharge, 28% was still physically limited one year post-injury. In the total patient group, 35% was cognitively limited. The younger group experienced fewer limitations than the older group (32% and 42%, respectively). Moderately injured TBI patients experienced more limitations than severely injured TBI patients (42% and 32%, respectively).Only 25% of the total group considered themselves as emotionally limited; older patients being more often limited (38%) compared with younger ones (22%).One year post-injury, 76% of the patients rated themselves as being limited in psychosocial functioning. More women than men found themselves limited in psychosocial functioning.One year post-injury, 72% of the total group was limited in work. Women experienced more difficulties in returning to work compared with men. Compared with severe TBI patients, twice as many moderate TBI patients returned to work without limitations one year post-injury. Of the patients who were physically limited at hospital discharge, 56% did not work at all at one year post-injury.Over 90% of the total group experienced a lowered QoL; moreover, QoL was reduced in all women.
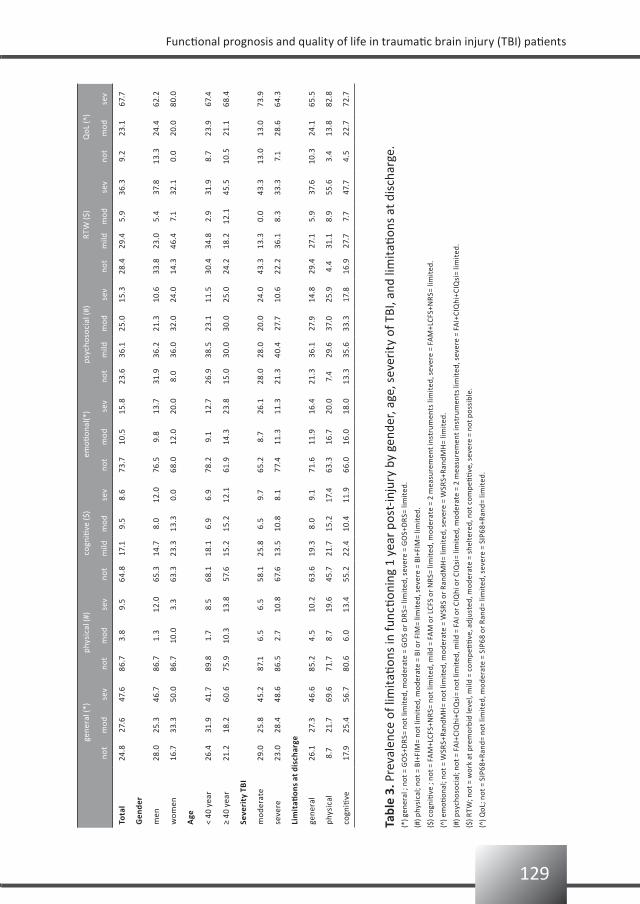
129
Functional prognosis and quality of life in traumatic brain injury (TBI) patients
gene
ral (
*)ph
ysic
al (#
)co
gniti
ve ($
)em
otion
al(*
)ps
ycho
soci
al (#
)RT
W ($
)Q
oL (^
)
not
mod
sev
not
mod
sev
not
mild
mod
sev
not
mod
sev
not
mild
mod
sev
not
mild
mod
sev
not
mod
sev
Tota
l24
.827
.647
.686
.73.
89.
564
.817
.19.
58.
673
.710
.515
.823
.636
.125
.015
.328
.429
.45.
936
.39.
223
.167
.7
Gen
der
men
28.0
25.3
46.7
86.7
1.3
12.0
65.3
14.7
8.0
12.0
76.5
9.8
13.7
31.9
36.2
21.3
10.6
33.8
23.0
5.4
37.8
13.3
24.4
62.2
wom
en16
.733
.350
.086
.710
.03.
363
.323
.313
.30.
068
.012
.020
.08.
036
.032
.024
.014
.346
.47.
132
.10.
020
.080
.0
Age
< 40
yea
r26
.431
.941
.789
.81.
78.
568
.118
.16.
96.
978
.29.
112
.726
.938
.523
.111
.530
.434
.82.
931
.98.
723
.967
.4
≥ 40
yea
r21
.218
.260
.675
.910
.313
.857
.615
.215
.212
.161
.914
.323
.815
.030
.030
.025
.024
.218
.212
.145
.510
.521
.168
.4
Seve
rity
TB
I
mod
erat
e29
.025
.845
.287
.16.
56.
558
.125
.86.
59.
765
.28.
726
.128
.028
.020
.024
.043
.313
.30.
043
.313
.013
.073
.9
seve
re23
.028
.448
.686
.52.
710
.867
.613
.510
.88.
177
.411
.311
.321
.340
.427
.710
.622
.236
.18.
333
.37.
128
.664
.3
Lim
itati
ons
at d
isch
arge
gene
ral
26.1
27.3
46.6
85.2
4.5
10.2
63.6
19.3
8.0
9.1
71.6
11.9
16.4
21.3
36.1
27.9
14.8
29.4
27.1
5.9
37.6
10.3
24.1
65.5
phys
ical
8.7
21.7
69.6
71.7
8.7
19.6
45.7
21.7
15.2
17.4
63.3
16.7
20.0
7.4
29.6
37.0
25.9
4.4
31.1
8.9
55.6
3.4
13.8
82.8
cogn
itive
17.9
25.4
56.7
80.6
6.0
13.4
55.2
22.4
10.4
11.9
66.0
16.0
18.0
13.3
35.6
33.3
17.8
16.9
27.7
7.7
47.7
4.5
22.7
72.7
Tabl
e 3.
Pre
vale
nce
of li
mit
ation
s in
func
tioni
ng 1
yea
r po
st-in
jury
by
gend
er, a
ge, s
ever
ity
of T
BI, a
nd li
mit
ation
s at
dis
char
ge.
(*) g
ener
al ;
not =
GO
S+D
RS=
not
lim
ited
, mod
erat
e =
GO
S or
DR
S= li
mit
ed, s
ever
e =
GO
S+D
RS=
lim
ited
.
(#) p
hysi
cal;
not =
BI+
FIM
= no
t lim
ited
, mod
erat
e =
BI o
r FI
M=
limit
ed, s
ever
e =
BI+F
IM=
limit
ed.
($) c
ogni
tive
; no
t = F
AM
+LCF
S+N
RS=
not
lim
ited
, mild
= F
AM
or
LCFS
or
NR
S= li
mit
ed, m
oder
ate
= 2
mea
sure
men
t ins
trum
ents
lim
ited
, sev
ere
= FA
M+L
CFS+
NR
S= li
mit
ed.
(^) e
moti
onal
; not
= W
SRS+
Rand
MH
= no
t lim
ited
, mod
erat
e =
WSR
S or
Ran
dMH
= lim
ited
, sev
ere
= W
SRS+
Rand
MH
= lim
ited
.
(#) p
sych
osoc
ial;
not =
FA
I+CI
Qhi
+CIQ
si=
not l
imit
ed, m
ild =
FA
I or
CIQ
hi o
r CI
Qsi
= lim
ited
, mod
erat
e =
2 m
easu
rem
ent i
nstr
umen
ts li
mit
ed, s
ever
e =
FAI+
CIQ
hi+C
IQsi
= lim
ited
.
($) R
TW; n
ot =
wor
k at
pre
mor
bid
leve
l, m
ild =
com
peti
tive
, adj
uste
d, m
oder
ate
= sh
elte
red,
not
com
peti
tive
, sev
ere
= no
t pos
sibl
e.
(^) Q
oL; n
ot =
SIP
68+R
and=
not
lim
ited
, mod
erat
e =
SIP6
8 or
Ran
d= li
mit
ed, s
ever
e =
SIP6
8+Ra
nd=
limit
ed.
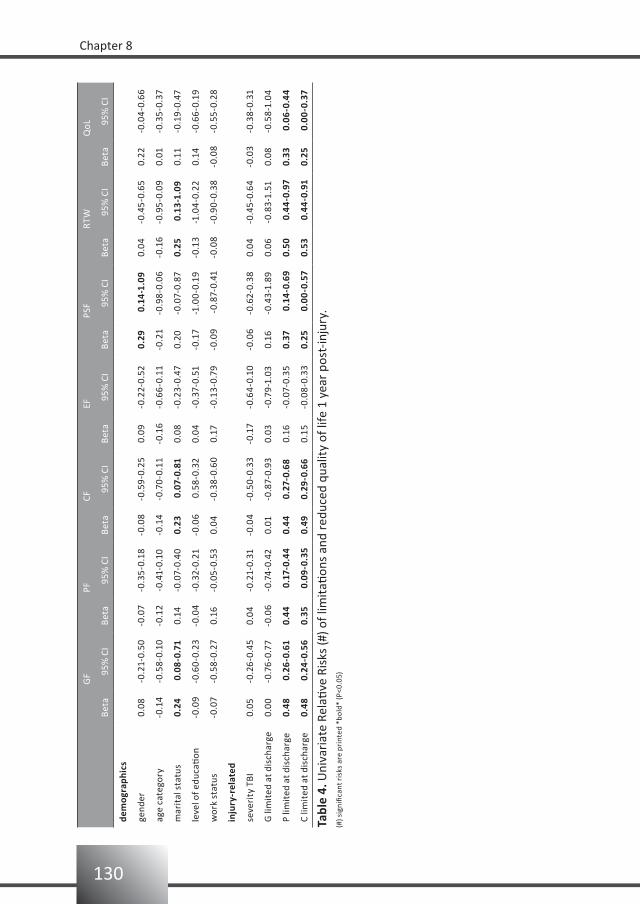
130
Chapter 8
GF
PFCF
EFPS
FRT
WQ
oL
Beta
95%
CI
Beta
95%
CI
Beta
95%
CI
Beta
95%
CI
Beta
95%
CI
Beta
95%
CI
Beta
95%
CI
dem
ogra
phic
s
gend
er0.
08-0
.21-
0.50
-0.0
7-0
.35-
0.18
-0.0
8-0
.59-
0.25
0.09
-0.2
2-0.
520.
29 0
.14-
1.09
0.04
-0.4
5-0.
650.
22-0
.04-
0.66
age
cate
gory
-0.1
4-0
.58-
0.10
-0.1
2-0
.41-
0.10
-0.1
4-0
.70-
0.11
-0.1
6-0
.66-
0.11
-0.2
1-0
.98-
0.06
-0.1
6-0
.95-
0.09
0.01
-0.3
5-0.
37
mar
ital
sta
tus
0.24
0.0
8-0.
710.
14-0
.07-
0.40
0.23
0.0
7-0.
810.
08-0
.23-
0.47
0.20
-0.0
7-0.
870.
25 0
.13-
1.09
0.11
-0.1
9-0.
47
leve
l of e
duca
tion
-0.0
9-0
.60-
0.23
-0.0
4-0
.32-
0.21
-0.0
6 0
.58-
0.32
0.04
-0.3
7-0.
51-0
.17
-1.0
0-0.
19-0
.13
-1.0
4-0.
220.
14-0
.66-
0.19
wor
k st
atus
-0.0
7-0
.58-
0.27
0.16
-0.0
5-0.
530.
04-0
.38-
0.60
0.17
-0.1
3-0.
79-0
.09
-0.
87-0
.41
-0.0
8-0
.90-
0.38
-0.0
8-0
.55-
0.28
inju
ry-r
elat
ed
seve
rity
TBI
0.05
-0.2
6-0.
450.
04-0
.21-
0.31
-0.0
4-0
.50-
0.33
-0.1
7-0
.64-
0.10
-0.0
6-0
.62-
0.38
0.04
-0.4
5-0.
64-0
.03
-0.3
8-0.
31
G li
mit
ed a
t dis
char
ge0.
00-0
.76-
0.77
-0.0
6-0
.74-
0.42
0.01
-0.8
7-0.
930.
03-0
.79-
1.03
0.16
-0.4
3-1.
890.
06-0
.83-
1.51
0.08
-0.5
8-1.
04
P lim
ited
at d
isch
arge
0.48
0.2
6-0.
610.
44 0
.17-
0.44
0.44
0.27
-0.6
80.
16-0
.07-
0.35
0.37
0.1
4-0.
690.
50 0
.44-
0.97
0.33
0.0
6-0.
44
C lim
ited
at d
isch
arge
0.48
0.2
4-0.
560.
35 0
.09-
0.35
0.49
0.29
-0.6
60.
15-0
.08-
0.33
0.25
0.0
0-0.
570.
53 0
.44-
0.91
0.25
0.0
0-0.
37
Tabl
e 4.
Uni
vari
ate
Rela
tive
Risk
s (#
) of l
imit
ation
s an
d re
duce
d qu
alit
y of
life
1 y
ear
post
-inju
ry.
(#) s
igni
fican
t ris
ks a
re p
rint
ed *
bold
* (P
<0.0
5)
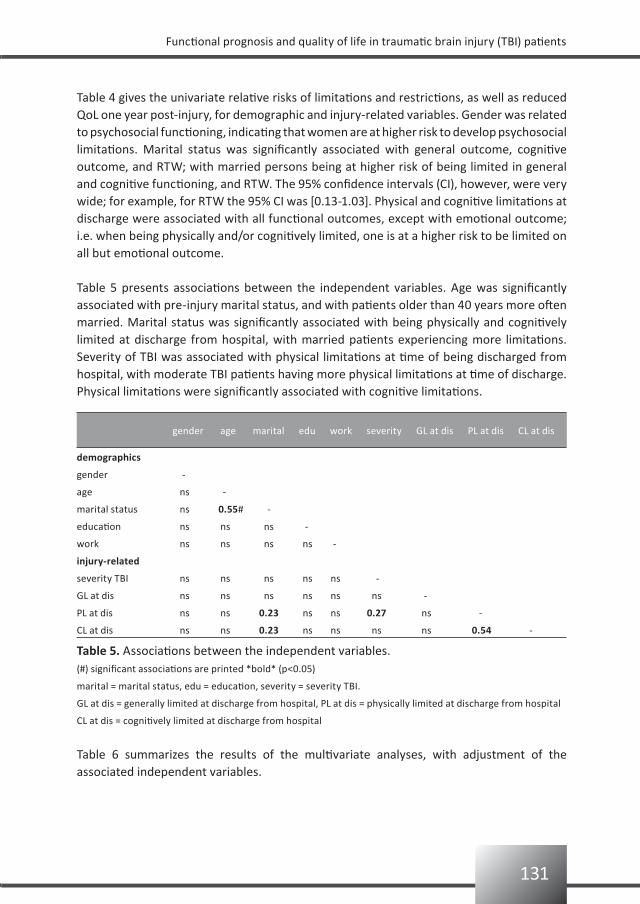
131
Functional prognosis and quality of life in traumatic brain injury (TBI) patients
Table 4 gives the univariate relative risks of limitations and restrictions, as well as reduced QoL one year post-injury, for demographic and injury-related variables. Gender was related to psychosocial functioning, indicating that women are at higher risk to develop psychosocial limitations. Marital status was significantly associated with general outcome, cognitive outcome, and RTW; with married persons being at higher risk of being limited in general and cognitive functioning, and RTW. The 95% confidence intervals (CI), however, were very wide; for example, for RTW the 95% CI was [0.13-1.03]. Physical and cognitive limitations at discharge were associated with all functional outcomes, except with emotional outcome; i.e. when being physically and/or cognitively limited, one is at a higher risk to be limited on all but emotional outcome.
Table 5 presents associations between the independent variables. Age was significantly associated with pre-injury marital status, and with patients older than 40 years more often married. Marital status was significantly associated with being physically and cognitively limited at discharge from hospital, with married patients experiencing more limitations. Severity of TBI was associated with physical limitations at time of being discharged from hospital, with moderate TBI patients having more physical limitations at time of discharge. Physical limitations were significantly associated with cognitive limitations.
(#) significant associations are printed *bold* (p<0.05)
marital = marital status, edu = education, severity = severity TBI.
GL at dis = generally limited at discharge from hospital, PL at dis = physically limited at discharge from hospital
CL at dis = cognitively limited at discharge from hospital
gender age marital edu work severity GL at dis PL at dis CL at dis
Table 5. Associations between the independent variables.
Table 6 summarizes the results of the multivariate analyses, with adjustment of the associated independent variables.
demographics
gender -
age ns -
marital status ns 0.55# -
education ns ns ns -
work ns ns ns ns -
injury-related
severity TBI ns ns ns ns ns -
GL at dis ns ns ns ns ns ns -
PL at dis ns ns 0.23 ns ns 0.27 ns -
CL at dis ns ns 0.23 ns ns ns ns 0.54 -
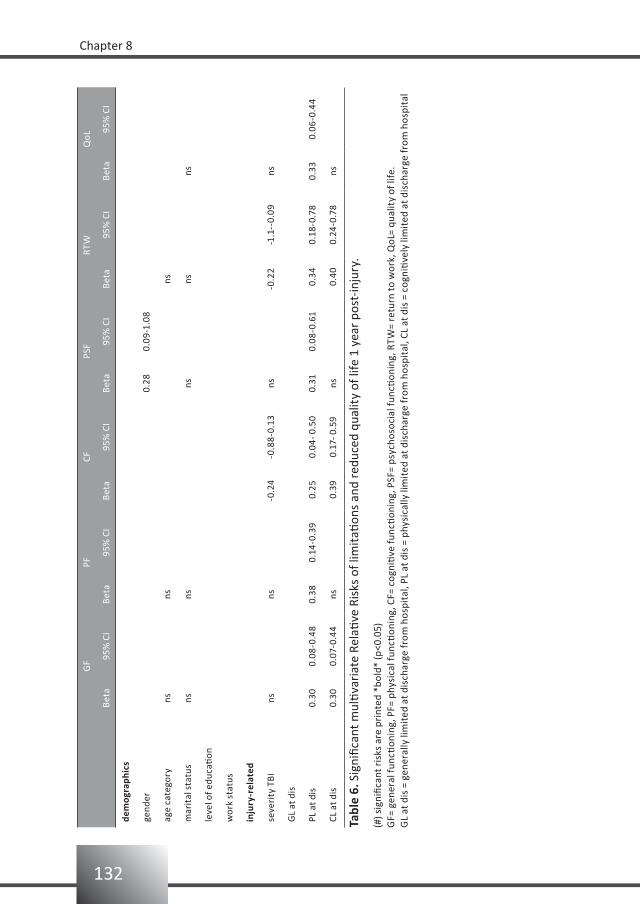
132
Chapter 8
GF
PFCF
PSF
RTW
QoL
Beta
95%
CI
Beta
95%
CI
Beta
95%
CI
Beta
95%
CI
Beta
95%
CI
Beta
95%
CI
dem
ogra
phic
s
gend
er0.
280.
09-1
.08
age
cate
gory
nsns
ns
mar
ital
sta
tus
nsns
nsns
ns
leve
l of e
duca
tion
wor
k st
atus
inju
ry-r
elat
ed
seve
rity
TBI
nsns
-0.2
4-0
.88-
0.13
ns-0
.22
-1.1
--0.
09ns
GL
at d
is
PL a
t dis
0.30
0.08
-0.4
80.
380.
14-0
.39
0.2
50.
04- 0
.50
0.31
0.08
-0.6
1 0
.34
0.18
-0.7
80.
330.
06-0
.44
CL a
t dis
0.30
0.07
-0.4
4ns
0.3
90.
17- 0
.59
ns 0
.40
0.24
-0.7
8ns
(#) s
igni
fican
t ris
ks a
re p
rint
ed *
bold
* (p
<0.0
5)G
F= g
ener
al fu
nctio
ning
, PF=
phy
sica
l fun
ction
ing,
CF=
cog
niti
ve fu
nctio
ning
, PSF
= ps
ycho
soci
al fu
nctio
ning
, RTW
= re
turn
to w
ork,
QoL
= qu
alit
y of
life
.G
L at
dis
= g
ener
ally
lim
ited
at d
isch
arge
from
hos
pita
l, PL
at d
is =
phy
sica
lly li
mit
ed a
t dis
char
ge fr
om h
ospi
tal,
CL a
t dis
= c
ogni
tive
ly li
mit
ed a
t dis
char
ge fr
om h
ospi
tal
Tabl
e 6.
Sig
nific
ant m
ultiv
aria
te R
elati
ve R
isks
of l
imit
ation
s an
d re
duce
d qu
alit
y of
life
1 y
ear
post
-inju
ry.

133
Functional prognosis and quality of life in traumatic brain injury (TBI) patients
Being physically limited at time of discharge from the hospital enhances the risk of an unfavourable outcome in all areas. Cognitive limitations at discharge increase the risk of experiencing cognitive limitations and not having returned to work one year post-injury. Patients with a moderate TBI have a worse prognosis on cognitive functioning and on RTW compared with patients with a severe TBI. Women are at higher risk for being limited in psychosocial functioning compared with men.
Discussion
In this hospital-based prospective follow-up study we evaluated the functional prognosis and QoL of patients with a moderate or severe TBI. The main research question was: which factors are predictive of the patient’s functioning and quality of life one year post-injury?Prevalence of problems in the patient’s functioning, limitations in psychosocial activities, return to work, and QoL were investigated. The strongest significant predictor variables for an unfavourable outcome were physical and cognitive functioning at discharge, severity of TBI, and gender.
PrognosisSeverity of TBI and cognitive limitations at discharge are prognostic factors for cognitive functioning and return to work (RTW) one year post-injury. The direction, however, is not as expected; a moderate TBI increases the risk of being limited in cognitive functioning and decreases RTW within the first year post-injury. However, this counter-intuitive finding is similar to an earlier study showing that people with mild TBI report more symptoms than those with more severe TBI.4 Perhaps persons with the more severe TBI lack insight into their own functioning. Another explanation may be that the less injured are more involved in society and are therefore more aware of any limitations in their functioning.Physical limitations are usually not the most disabling consequences after TBI. However, from this study we conclude that being physically limited at discharge enhances the risk of being limited in functioning and having reduced QoL one year post-injury.This study differs from other prognostic studies with regard to the inclusion criteria. In the present study 46% of the patients were discharged home; these latter patients are generally not included in prognostic studies on TBI in rehabilitation medicine. Based on the reported prevalences of unfavourable outcome in the present study, we conclude that limitations in activities, restrictions in participation, as well as a reduction in QoL, are not limited to patients discharged to a rehabilitation center.
PrevalencesThis study showed that a substantial percentage of persons hospitalized with moderate or severe TBI report unfavourable outcomes. One year post-injury 75% of the patients reported (more or less) problems in their general functioning.In accordance with the literature, the percentage of our patients reporting physical limitations was low.40,41

134
Chapter 8
Surprisingly, only 35% of the patients considered themselves as being cognitively limited. This is in contrast to the 55% reported elsewhere 40 and to the impression we have in clinical practice. A possible explanation for this may be that we asked our patients to rate their own functioning, and the patient’s lack of insight may have prevented them from giving an objectively reliable response.42 Patients often have complaints at the level of activity or participation, and may not be aware of the underlying dysfunction which causes the limitations or restrictions.
In total, 76% of the patients reported limitations in psychosocial activities, with more women than men being limited. Since the FAI is known for its gender effect,43 we compared the patient’s FAI scores one year post-injury with their own pre-injury FAI scores - and found the same gender difference.In our group of patients only 28% returned to work (i.e. 43% moderate and 22% severe) at the pre-traumatic level and time. These percentages are low compared with an earlier study (78% moderate and 47% severe);42 however, in the latter study the percentages of those employed at one year post-injury were irrespective of the pre-traumatic level.Almost all of our patients (i.e. 91%) reported a reduced QoL, which is a very high percentage; an earlier study reported that only 29% of the patients (including the mild TBIs) responded that QoL was reduced at one year post-injury.41
Study limitationsSelection bias is a risk in all studies. However, by recruiting all consecutive patients we probably avoided the risk of recruitment selection. We are reassured by the fact that the basic characteristics of the present cohort is in accordance with other published TBI populations: i.e. age range from 16 to 67 (mean 34.0) years, with an over-representation of men (73% men).Because of the small sample size (n=126) we had to leave out other potential predictors of the patient, such as co-morbidity, period of post-traumatic amnesia, and period of hypoxia.Another limitation may be found in the construction of the various outcome categories; this makes it difficult to compare our results (especially the prevalence numbers) with those of other studies. For reasons of comparison we also present the raw scoring on frequently used measurement instruments in TBI rehabilitation research.The data in Table 6 include the univariate significant variables as well as the independent variables significantly associated with each other (i.e. age, marital status, and severity of TBI). Repeating the analyses by entering all independent variables in the model did not change the outcome of the analyses. Therefore we are certain that we identified all possible risk factors; however, additional data are needed to confirm our results and to elaborate on other factors that may be relevant for prognosis.
135
Functional prognosis and quality of life in traumatic brain injury (TBI) patients
Conclusion
Limitations in activities, restrictions in participation, as well as a reduction in QoL, are not only limited to patients discharged to a rehabilitation center; prognostic studies should also include patients discharged home.Patients that experience problems in physical and cognitive functioning at discharge from hospital have the highest risk for an unfavourable outcome one year later. Women have a higher risk than men to develop restrictions in psychosocial participation. Patients with a moderate TBI have a higher risk of problems in cognitive functioning and return to work one year post-injury.
136
Chapter 8
References
Dikmen SS, Machamer MA, Powell JM, Temkin NR. Outcome 3 to 5 years after moderate to severe traumatic 1.
brain injury. Arch Phys Med Rehabil 2003;84:1449-1457.
Bushnik T, Hanks RA, Kreutzer JS, Rosenthal M. Etiology of traumatic brain injury: characterization of 2.
differential outcomes up to 1 year postinjury. Arch Phys Med Rehabil 2003;84:255-262.
Hammond, FM, Grattan KD, Sasser H, Corrigan JD, Bushnik T, Shull W. Five years after traumatic brain injury: 3.
a study of individual outcomes and predictors of change in function. NeuroRehabil 2004;19:25-35.
Whiteneck GG, Gerhart KA, Cusick CP. Identifying environmental factors that influence the outcomes of 4.
people with traumatic brain injury. J Head Trauma Rehabil 2004;19:191-204.
Zasler ND. Prognostic indicators in medical rehabilitation of traumatic brain injury: a commentary and 5.
review. Arch Phys Med Rehabil 1997;78(Suppl 4):S12-S16.
Corrigan JD, Smith-Knapp K, Granger CV. Outcomes in the first 5 years after traumatic brain injury. Arch 6.
Phys Med Rehabil 1998;79:298-305.
van Baalen B, Odding E, Maas AIR, Ribbers GM, Bergen MP, Stam HJ. Traumatic brain injury: classification 7.
of initial severity and determination of functional outcome. Disabil Rehabil 2003;25:9-18.
van Baalen B, Odding E, van Woensel MPC, van Kessel MA, Roebroeck ME, Stam HJ. Reliability and sensitivity 8.
to change of measurement instruments used in a traumatic brain injury population. Clin Rehabil 2006;20:
686-700.
van Baalen B, Odding E, Stam HJ. Cognitive status at discharge from the hospital determines discharge 9.
destination in traumatic brain injury (TBI) patients. Brain Inj 2008;22(1):25-32.
Teasdale G, Jennet B. Assessment of coma and impaired consciousness: a practical scale. Lancet 1974;2: 10.
81-84.
Marshall LF, Gautille T, Klauber MR, Eisenberg HM, Jane JA, Luerssen TG, Marmarou A, Foulkes MA. The 11.
outcome of severe closed head injury. J Neurosurg 1991;75: S28-S36.
Hall KM. Establishing a national traumatic brain injury information system based upon a unified data set. 12.
Arch Phys Med Rehabil 1997;78:S12-S16.
Gomez PA, Lobato RD, Ortega JM, De La Cruz J. Mild head injury: differences of prognosis among patients 13.
with a Glasgow Coma Scale score of 13 to 15 and analysis of factors associated with abnormal CT findings.
Brit J Neurosurg 1996;10(5):453-460.
Jennett B, Bond M. Assessment of outcome after severe brain damage a practical scale. Lancet 14.
1975;1:480-485.
Wilson JTL, Pettigrew LEL, Teasdale GM. Structured interviews for the Glasgow Outcome Scale and the 15.
Extended Glasgow Outcome Scale. J Neurotrauma 1998;15:573-585.
Rappaport M, Hall KM, Hopkins Belleza T, Cope DN. Disability Rating Scale for severe trauma: coma to 16.
community. Arch Phys Med Rehabil 1982;63:118-123.
Wade DT. Measurement in neurological rehabilitation. Oxford University Press, 1996.17.
Collin C, Wade DT, Davies S, Horne V. The Barthel ADL Index: a reliability study. Int Disabil Stud 1988;10: 18.
61-63.
Granger CV, Hamilton BB, Keith RA, Zielezny M, Sherwin FS. Advances in functional assessment for medical 19.
rehabilitation. Topics Ger Rehabil 1986;1:59-74.
137
Functional prognosis and quality of life in traumatic brain injury (TBI) patients
Hall KM, Hamilton BB, Gordon WA, Zasler ND. Characteristics and comparisons of functional assessment 20.
indices: disability rating scale, functional independence measure, and functional assessment measure.
J Head Trauma Rehabil 1993;8:60-74.
Hagen C. Language cognitive disorganization following closed head injury: a conceptualization. In: Trexler, 21.
LE, ed. Cognitive rehabilitation: conceptualization and intervention. Plenum Press, 1982, pp 131-151.
Lezak MD. Neuropsychological Assessment, (3rd edn). Oxford University Press, 1995.22.
Overall JE, Gorham DR. The brief psychiatric rating scale. Psychol Rep 1962;10: 799-812.23.
Levin HS, High WM, Goethe KE, Sisson RA, Overall JE, Rhoades HM, Eisenberg HM, Kalisky Z, Gary HE. The 24.
neurobehavioural rating scale: assessment of the behavioural sequelae of head injury by the clinician.
J Neurol Neurosurg Psychiatry 1987;50: 183-193.
Coughlan AK, Storey P. The Wimbledon Self-Report Scale: emotional and mood appraisal. Clin Rehabil 25.
1988;2:207-213.
Ware JE, Sherbourne CD. The MOS 36-Item Short-Form Health Survey (SF-36). I: Conceptual framework and 26.
item selection. Med Care 1992;30:473-483.
Holbrook M, Skilbeck CE. An activities index for use with stroke patients. Age Ageing 1983;12:166-170.27.
Willer B, Ottenbacher KJ, Coad ML. The community integration questionnaire. A comparative examination. 28.
Am J Phys Med Rehabil 1994;73:103-111.
Pollard WE, Bobbit RA, Bergner M, Martin DP, Gilson BS. The sickness impact profile: reliability of a health 29.
status measure. Med Care 1976;14:146-155.
Smith JL, Magill-Evans J, Brintnell S. Life satisfaction following traumatic brain injury. Can J Rehabil 1998; 30.
11(3):131-140.
Van Balen HGG, Mulder Th. Beyond the stereotype: an epidemiological study on the long-term sequelae of 31.
traumatic brain injury. Clin Rehabil 1996;10:259-266.
Moore AD, Stambrook M, Gill DD, Lubusko AA. Differences in long-term quality of life in married and single 32.
TBI patients. Can J Rehabil 1992;6(2):89-98.
Fleming JH, Strong J, Ashton R. Cluster analysis of self-awareness levels in adults with traumatic brain injury 33.
and relationship to outcome. J Head Trauma Rehabil 1998;13(5):39-51.
De Bruin AF, Diederik JPM, Witte de LP, Stevens FCJ, Philipsen H. The development of a short generic version 34.
of the Sickness Impact Profile. J Clin Epidemiol 1994;47:407-418.
Weimar C, Ziegler A, Konig IR, Diener HC. Predicting functional outcome and survival after acute ischemic 35.
stroke. J Neurol 2002;249:888-895.
Hall KM, Bushnik T, Lakisic-Kazazic B, Wright J, Cantanagallo A. Assessing traumatic brain injury outcome 36.
measures for long-term follow-up of community-based individuals. Arch Phys Med Rehabil 2001;82:
367-374.
Bowen A, Wenman R, Mickelborough J, Foster J, Hill E, Tallis R. Dual-task effects of talking while walking on 37.
velocity and balance following a stroke. Age Ageing 2001;30:319-323.
Gezondheid getroffenen vier jaar na de vuurwerkramp Enschede. RIVM-rapportnummer 630930005, 38.
2004.
Mammi P, Zaccaria B, Franceschini M. Early rehabilitative treatment in patients with traumatic brain 39.
injuries: outcome at one-year follow-up. Eura Medicophys 2006;42:17-22.
138
Chapter 8
van Balen HGG, Mulder Th, Keyser A. Toward a disability-oriented epidemiology of traumatic brain injury. 40.
Disabil Rehabil 1996;18:181-190.
Whiteneck G, Brooks CA, Meillick D, Harrison-Felix C, Terrill MS, Noble K. Population-based estimates of 41.
outcomes after hospitalized for traumatic brain injury in Colorado. Arch Phys Med Rehabil 2004;85(4S2):
S73-S81.
Prigatano GP. Disturbances of self-awareness of deficit after traumatic brain injury. In:Prigatano GP, 42.
Schacter DL, Eds. Awareness of deficit after brain injury: clinical and theoretical issues. Oxford University
Press,1991,pp 111-126.
Schepers VPM, Visser-Meily JMA, Ketelaar M, Lindeman E. Prediction of social activity one year post stroke. 43.
Arch Phys Med Rehabil 2005;86:1472-1476.

9
Bianca van Baalen
General discussion
140
Chapter 9
Introduction
Traumatic brain injury (TBI) is an important public health problem. TBI is the number one cause of mortality and morbidity in young adults in modern Western societies, and is often referred to as the ‘silent’ epidemic.1,2 The impact on the injured person, his or her family, friends, as well as society, and the healthcare system is well known, and so is the need for prevention, efficient acute care, rehabilitation, and follow-up. TBI is not an incident, but a lifelong disorder in which changing contextual demands may generate new needs for professional support.Because of those changes TBI rehabilitation should be a lifelong, well- coordinated process with the patient and his or her family as the main focus. This process is frustrated by capacity problems, health insurance policies and reimbursement practices, lack of cooperation between different healthcare organizations, and simple lack of long-term follow-up of individual patients. Although this problem is well known (reported as early as 1996), it still does not have priority. Progress is hindered by lack of urgency at national and local political levels, and by health insurers.2
An important issue in TBI rehabilitation is the selection of outcome measurement instruments.3 These instruments should incorporate activities of daily living, cognitive, behavioural and emotional functioning, as well as employment activities and quality of life. Rehabilitation specialists perceive that, with very few exceptions, the existing outcome monitoring systems in rehabilitation care are technically inadequate to evaluate TBI patients. Most of the neurological and neuropsychological tests used do not reflect the improvement of functional outcome that can be achieved in patients with a TBI.4,5 Moreover, most measurement tools, which reflect the consequences of TBI for daily life, have not yet been evaluated for their sensitivity to change. Administering the measurement instruments in TBI patients can be difficult, or even impossible, because of the patient’s cognitive disabilities. Therefore, a reliable use of outcome measurement tools with patients, as well as with their caregivers or ‘significant others’, is required.
The questions for this thesis were:
1) Which outcome measurement instruments are most reliable, and especially most sensitive to change, for the assessment of functional outcome and quality of life in TBI patients?
2) What are prognostic determinants of functional outcome and quality of life after TBI?
In this chapter the main results and clinical implications will be discussed, limitations of the study will be addressed, and an outline of future research will be presented.
141
General discussion
International Classification of Functioning and Health
In rehabilitation medicine, the International Classification of Functioning and Health (ICF) is a widely used conceptual model.6 The ICF, published by the World Health Organization in 2001, is a globally agreed framework and classification system. ICF describes how people live with their health condition. ICF is a classification of health and health-related domains that describe body functions and structures, activities and participation. The domains are classified from the perspective of the body, the individual and society. Since an individual's functioning and disability occurs in a context, ICF also includes a list of environmental factors.
Study results
For this study, the research population consisted of all patients aged 18 to 65 years with a moderate or severe TBI who were admitted from January 1999 until June 2004 in one of the three participating hospitals. These hospitals were the Erasmus MC, Rotterdam (January 1999 until March 2004), the Medical Center Haaglanden, location Westeinde, The Hague (September 2002 until June 2004), and the Utrecht University Medical Center (UMC) (January 2003 until June 2004). Patients were classified as having a severe TBI when the worst Glasgow Coma Scale score (GCS score) within 24 hours post injury was between 3 and 8. Moderate TBI was defined as a GCS score of 9 to13. Furthermore, patients with a GCS score of 14 or 15 ánd mass lesion on the head CT-scan were also classified as having a moderate TBI. Patients were not included in the study when they had serious (pre-traumatic) neurological, psychiatric, oncologic or internal impairments which could interfere with TBI-related disabilities. If the patient or their next of kin did not speak Dutch or English they were not invited to participate in the study.
1) Which outcome measurement instruments are most reliable, and especially most sensitive to change, for the assessment of functional outcome and quality of life in TBI patients?
From our literature review (Chapter 2) we identified measurement instruments which can be used in TBI rehabilitation research; these are the Glasgow Outcome Scale (GOS),7 the GOS-Extended (GOSE),8 the Disability Rating Scale (DRS),9 the Barthel Index (BI),10 the Rancho Los Amigos Levels of Cognitive Functioning Scale (LCFS)11, the Functional Independence Measurement (FIM),12 the Functional Assessment Measurement (FAM),13 the Neurobehavioural Rating Scale (NRS),14 the Sickness Impact Profile (SIP),15 the SIP-68,16 the Rand-SF 36,17 the Wimbledon Self-Report Scale (WSRS),18 the Dartmouth Coop Functional Health Assessment Charts/Wonca (Coop),19 the Supervision Rating Scale (SRS),20 the Community Integration Questionnaire (CIQ),21 and the Aachener Life Quality Inventory.22
142
Chapter 9
A conclusion drawn from our review is that, although apparently useful, most of those instruments still need to be validated in a TBI population.Due to our participation in the FuPro study, we added the Rehabilitation Activities Profile (RAP),23 the Frenchay Activities Index (FAI),24 the Multi-dimensional Health Locus of Control Scale (MHLCS),25 the Social Support List Interactions (SSL-I), and the Social Support List Discrepancies (SSL-D),26 and then investigated the inter-observer reliability (Chapter 3) of the following instruments.For the subacute phase we studied the BI, FIM, GOS, GOSE, DRS, FAM, LCFS, RAP, and Coop for their inter-observer reliability. Based only on the inter-observer reliability, we recommend the use of the FIM for the physical domain, the FAM for the cognitive domain, and the Coop to measure quality of life.For the inter-observer study at 12 to 18 months post injury the following measurement instruments were added: the NRS, CIQ, Employability Rating Scale (ERS),27 FAI, MHLCS, SSL-I and SSL-D, SRS, WSRS, Rand-36, and SIP-68. For later stages in recovery, based only on the inter-observer reliability, we recommend the FIM for the physical domain, the FAM and the NRS for the cognitive domain, the SRS for the psychosocial domain, and the SIP-68 for the quality of life measurement.We also determined the sensitivity to change of the above-mentioned instruments. The instruments which are most sensitive to change are: the FIM and the BI for the physical domain; the FAM, the DRS, and the NRS for the cognitive domain; the RAP and FAI for the psychosocial domain; and the Rand-physical functioning, Coop and the SIP-68 for quality of life.
In conclusion: at hospital discharge, the FIM is the most reliable measurement instrument to assess limitations in the physical domain, and is also the most sensitive to change. The FAM is the most reliable to assess limitations in the cognitive domain, and the Coop to assess quality of life. At later stages of recovery this minimum data set can best be extended with the NRS to assess limitations in the cognitive domain, the FAI to assess restrictions in the psychosocial domain, and the SIP-68 to assess quality of life.Although inter-observer reliability and sensitivity to change are important in determining which measurement instruments are to be used, other criteria (such as availability of the measurement instrument) are also important. As stated above, the FIM is the most reliable measurement instrument to assess limitations in the physical domain and is also the most sensitive to change. However, to be able to use the FIM, prior training is necessary. Furthermore, since an officially approved translation of this instrument is still lacking, this instrument is not officially available in the Netherlands. However, because we followed the Adult FIMTM Workshop prepared by the Uniform Data System for Medical Rehabilitation we are certain that we have administered the FIM correctly.
143
General discussion
TBI patients may not be able to speak for themselves, and the patient’s caregiver is often asked for information on the patient’s level of functioning or even about their experienced quality of life. Our investigations led us to conclude (Chapter 4) that in the first year post-injury the FIM, SIP-68, and Rand 36 can be reliably used to assess functional status and quality of life of the patient by administrating these questionnaires to the caregiver. However, it should be noted that this conclusion is based on a relatively small population and more studies are needed to validate these findings.
2) What are prognostic determinants of functional outcome and quality of life after TBI?
At discharge from hospitalInitial severity according to the GCS and cognitive status at the moment of discharge from the hospital is associated with being discharged home or to an institution (rehabilitation center or nursing home) (Chapter 6). However, clinicians must be alert to other non-injury-related variables which may also influence discharge destination. For example: the availability of a rehabilitation center in the area, level of organization of home care facilities, or level of assistance from family members and/or friends in the neighbourhood.Our research population was too small to distinguish between patients discharged to a rehabilitation center and those discharged to a nursing home. More research with a larger population is needed to assess the differences between these groups.An association was found between the coping style of the patient’s caregiver and the patient’s outcome (Chapter 7). The level of participation after a TBI is negatively associated with a passive coping style of the caregiver. In other words, when the patient’s caregiver has a passive way of coping with problems (i.e. isolating oneself from others, worrying about the past, and taking refuge in fantasies), the patient is at higher risk to be more restricted in participation. In clinical practice this means that we need to explore the coping preference of the caregiver and keep in mind that a passive coping preference is a signal for more restrictions in participation. A subsequent step in this line of research is to investigate whether changing the coping style of the caregiver will influence the patient’s outcome.
144
Chapter 9
One year post-injury In our study group, one year post-injury 75% of all patients with a moderate or severe TBI reported problems in their general functioning, 13% in physical functioning, 35% in cognitive functioning, and 26% in their emotional functioning. Of all patients, 76% reported limitations in psychosocial activities, 72% experienced work restrictions, and 91% of all patients reported a reduced quality of life (Chapter 8). At 1 year post-injury only 50% of the patients who were discharged home made a full return to work, whereas only 10% of the rehabilitation group returned to his or her previous work at 1 year post injury. There is a challenge here for both the rehabilitation physician as well as for the occupational physician. More interaction is needed between those two specialties. Remarkably, we found no published studies reporting the percentage of limitations in physical functioning after TBI. Apparently, it seems so obvious to clinicians that the physical limitations are not the most disabling ones that the prevalence of physical limitations was not yet studied.Gender, severity of TBI, as well as physical and cognitive status at discharge from hospital are important variables in predicting functional outcome and quality of life one year after TBI. Patients that experience problems in physical and cognitive functioning at discharge from hospital are at highest risk for an unfavourable outcome 1 year later. Women have a higher risk than men to develop restrictions in psychosocial participation, whereas patients with a moderate TBI have a higher risk of problems in cognitive functioning and return to work 1 year post-injury. For clinical practice this means that when treating a moderate TBI patient, the clinician needs to be aware of difficulties in return to work (even more than one should already be), since having sustained a moderate TBI is a risk factor for experiencing problems in return to work. The fact that the risk in the moderate group is more pronounced than in the severe group is somewhat counterintuitive, but may be explained by the lack of awareness frequently associated with the severe TBI patients. Another explanation may be that the less injured (classified as moderate TBI) are more involved in society and therefore may be more aware of any limitations in their functioning.
Study limitations
One limitation of the study is the relatively small sample sizes. For the inter-observer studies, however, having additional subjects would not have changed the mean values but would only have made the confidence interval smaller; e.g. more precise. In the prognostic studies potential predictors, such as co-morbidity, period of posttraumatic amnesia, and period of hypoxia could not be included because of the small sample size.Selection bias is a risk in all studies and, being aware of that risk, we took preventive measures. By recruiting all consecutive patients (aged between 18 and 65 years) from the hospitals we believe to have avoided selection bias of the source population based on severity of injury. We even state (Chapter 5) that other TBI studies only use a selection of the total TBI population, namely the inpatient rehabilitation population. Nevertheless, no study is completely free from selection bias. Because we wanted to provide the prevalence
145
General discussion
data of limitations in functioning caused only by the TBI, we excluded the patients with serious pre injury disabilities. Therefore, generalization to the total TBI population is not possible. Also excluded were patients who did not speak Dutch or English; however, this may not be a problem because for the Erasmus MC this is only 1% of the total TBI population. Selection bias could have occurred in the study reported in chapter 4 (the correspondence study); we randomly asked all family members of the patient, but generally only those who were present at the interview.Information bias of the direct assessment of the patients is also not likely to have occurred. All interviewers were instructed on how to use the validated questionnaires in a standardized interview setting. However, in the correspondence study (chapter 4) information bias is a matter of concern. Interviews with the patient were frequently held together with the caregiver in the same room; therefore, the caregiver may have been influenced by the interview when filling in the questionnaires at a later time. The study reported in chapter 7 (the coping study) may also be influenced by information bias. Data were missing on the FAI, which might explain the absence of a significant association between limitations in activity and the independent variables.Comparing our results with other published studies is difficult for several reasons. First, there are major differences in constructing outcome between the studies. Other studies did not give details about their scoring; we hope that having also provided our raw scorings, that we may set a trend. Meanwhile, comparison at this level is almost impossible. Second, differences in social, cultural, and health care systems are responsible for differences not related to the TBI at all. For instance, in our study, as well as in the American studies, the first assessment took place at hospital discharge. Due to differences in health care organization, mean hospital discharge in our cohort is about 20 days later than in the USA. Those data are therefore not comparable.
146
Chapter 9
Recommendations for future research
The study cohort that was followed-up in our investigation was a hospital-based population. Our studies allow to conclude that limitations in activities, restrictions in participation, as well as reductions in quality of life, are not only limited to patients discharged to a rehabilitation center. Therefore, we recommend that prognostic studies should also include patients discharged home or to a nursing home. As stated earlier, TBI rehabilitation should be a lifelong, well-coordinated process with the patient and his or her family as center of focus.
Preferably, outcome after TBI needs to be assessed in the same way throughout the world. A possible worldwide construction is given in detail in chapter 8. The first recommendation is to (at least) give the raw scoring of the measurement instruments to allow future comparison. Another recommendation is that the first assessment needs to take place after a standard time post-injury (e.g. 20 days post-injury) and not be related to hospital discharge, in order to minimize differences in social, cultural, and health care systems. Future studies should also incorporate the need, use and outcome of outpatient rehabilitation treatment in order to establish the role of outpatient rehabilitation on outcome. However, not all patients could distinguish between single physiotherapy, occupational therapy, and a multidisciplinary treatment (i.e. outpatient rehabilitation treatment). Therefore, outpatient rehabilitation treatment could not be reliably registered, and was not used in the present study. Closer cooperation with health insurance companies can probably solve this problem. This could then be a win-win situation for all parties concerned. The researchers will receive more reliable data and the health insurance companies will gain more insight into the effect of rehabilitation treatment. For assessment of the level of psychosocial functioning, patients were also asked about their pre injury level. Having a lower score post injury than pre injury was defined as having limitations in psychosocial activities. Unfortunately, the pre injury psychosocial functioning scoring was not administered at a predefined and standardized time. This may mean that, with the passage of time, a person’s subjective perception of pre injury functioning may become blurred; with patients either underestimating or overestimating themselves. When working with TBI patients it is very important to have insight into this process. It would be valuable to study whether the patient’s perception of their pre-injury functioning changes over time. If this proves to be the case, then the patient’s perception as well as the patient’s stage post injury should be taken into account when setting realistic rehabilitation goals with the patient.Environmental factors are important and need to be considered in future research. For example, for social support we need to establish whether the amount of support or the need for support changes over time, and to what extent this is relevant for clinical practice.
147
General discussion
An example of a personal factor is the locus of control regarding one’s health. An important question is whether the functional outcome of a patient with an internal locus of control is better than that of a person with an external locus. If this proves to be so, then the question will be whether a person’s locus of control can be influenced by therapeutic strategies.As already stated in our introduction, TBI is not an incident but results in a lifelong disorder in which changing contextual demands may generate new needs for professional support. TBI rehabilitation should therefore be a lifelong, well- coordinated process focusing on the patient and their family. In the Netherlands, a long-term follow-up of TBI patients is still lacking. The unique cohort of TBI patients described in this thesis may be helpful to study the long-term follow-up of TBI patients and their relatives in order to improve the coordinated process.

148
Chapter 9
References
Epidemiology of traumatic brain injury in the United States, in Centers for Disease Control and Prevention 1.
(ed): Traumatic brain (head) injury (TBI).
http//www.cdc.gov/ncipc/dacrrd/tbi.htm. National Center for Injury Prevention and Control, 1999.2.
Ribbers GM. Traumatic brain injury rehabilitation in the Netherlands: Dilemma’s and challenges. J Head 3.
Trauma Rehabil 2007;22:234-238.
van Baalen B, Odding E, Maas AIR, Ribbers GM, Bergen MP, Stam, HJ. Traumatic brain injury: classification 4.
of initial severity and determination of functional outcome. Disabil Rehabil 2003;25:9-18.
Prigatano GP, Klonoff PS. Psychotherapy and neuropsychological assessment after brain injury. J Head 5.
Trauma Rehabil 1988;3:45-56.
Vieth AZ, Johnstone B, Dawson B. Extent of intellectual, cognitive, and academic decline in adolescent 6.
traumatic brain injury. Brain Inj 1996;10:465-470.
WHO International Classification of Functioning, Disability and Health:ICF.GenevaWHO;2001.7.
Jennett B, Bond M. Assessment of outcome after severe brain damage. a practical scale. Lancet 8.
1975;1:480-484.
Wilson JT, Pettigrew LE, Teasdale GM. Structured interviews for the Glasgow Outcome Scale and the 9.
extended Glasgow Outcome Scale: guidelines for their use. J Neurotrauma 1998;15:573-585.
Rappaport, M, Hall KM, Hopkins K, Belleza T, Cope DN. Disability rating scale for severe head trauma: coma 10.
to community. Arch Phys Med Rehabil 1982;63:118-123.
Collin C, Wade DT, Davies S, Home V. The Barthel Index; a reliability study. Int Disabil Stud 1988;10:61-63.11.
Hagen C. Language cognitive disorganization following closed head injury: a conceptualization. In: Trexler 12.
LE. (ed.) Cognitive rehabilitation: conceptualization and intervention. New York: Plenum
Press,1982;131-151.
Granger CV, Hamilton BB, Keith RA, Zielezny M, Sherwin FS. Advances in functional assessment for medical 13.
rehabilitation. Topics Ger Rehabil 1986;1:59-74.
Donaghy S, Wass PJ. Interrater reliability of the functional assessment measure in a brain injury rehabilitation 14.
program. Arch Phys Med Rehabil 1998;79:1231-1236.
Levin HS, High WM, Goethe KE, Sisson RA, Overall JE, Rhoades HM, Eisenberg HM, Kalisky Z, Gary HE. The 15.
neurobehavioural rating scale: assessment of the behavioural sequelae of head injury by the clinician. J
Neurol Neurosurg Psychiatry 1987;50:183-193.
Bergner M, Bobbitt RA, Kressel S, Pollard WE, Gilson BS, Morris JR. The sickness Impact Profile: conceptual 16.
formulation and methodology for the development of a health status measure. Int J Health Serv
1976;6:393-415.
De Bruin AF, Diederik JPM, Witte de LP, Stevens FCJ, Philipsen H. The development of a short generic version 17.
of the Sickness Impact Profile. J Clin Epidemiol 1994;47:407-418.
Ware JE, Sherbourne CD. The MOS 36-Item Short-Form Health Survey (SF-36). I: Conceptual framework and 18.
item selection. Med Care 1992;30:473-483.
Coughlan AK, Storey P. The Wimbledon Self-Report Scale: emotional and mood appraisal. Clin Rehabil 19.
1988;2: 207-213.
König-Zahn C.: The COOP/WONCA Charts. In: A Hutchinson, AN Bentzen, C König-Zahn (editors) Cross 20.
Cultural Health Outcome Assessment: a user´s guide, pp 48-53, 1997.
149
General discussion
Cultural Health Outcome Assessment: a user´s guide, pp 48-53, 1997.
Boake C. Supervision Rating Scale: a measure of functional outcome from brain injury. Arch Phys Med 21.
Rehabil 1996;77:765-772.
Willer B, Ottenbacher KJ, Coad ML. The community integration questionnaire. A comparative examination. 22.
Am J Phys Med Rehabil 1994;73:103-111.
Hütter BO, Glisbach JM. Das Aachener Lebens qualitätsinventar (ALQI) für Patienten mit Hinschädigung: 23.
Erste Ergebnisse zu methodischen Gütekriterien. Zeitschrift für Neuropsychologie 1999;10:38.
Jelles F, Van Bennekom CA, Lankhorst GJ, Sibbel CJ, Bouter LM. Inter- and intra-rater agreement of the 24.
Rehabilitation Activities Profile. J Clin Epidemiol 1995;48:407-416.
Holbrook M, Skilbeck CE. An activities index for use with stroke patients. Age Ageing 1983;12:166-170.25.
Wallston KA, Wallston BS, DeVellis R. Development of the Multidimensional Health Locus of Control Scales. 26.
Health Educ Monogr 1978;6:160-166.
Van Sonderen, E. Sociale Steun Lijst - Interakties (SSL-I) en Sociale Steun Lijst – Discrepanties (SSL-D). 27.
Groningen: Noordelijk Centrum voor Gezondheidsvraagstukken Rijksuniversiteit Groningen, 1997.
Ben-Yishay Y, Silver SM, Piasetsky E, Rattok J. Relationship between employability and vocational outcome 28.
after intensive holistic cognitive rehabilitation. J Head Trauma Rehabil 1987;2:35-48.


Bianca van Baalen
Summary
152
Summary
The work presented in this thesis is based on findings of the FuPro-TBI (Functional Prognosis in Traumatic Brain Injury) study, which was part of the larger FuPro research programme which investigated the functional prognosis of four neurological disorders: multiple sclerosis (MS), stroke, amyotrophic lateral sclerosis (ALS), and traumatic brain injury (TBI). The main research questions were formulated as follows:
1) Which outcome measurement instruments are most reliable, and especially most sensitive to change, for the assessment of functional outcome and quality of life in TBI patients?
2) What are prognostic determinants of functional outcome and quality of life after TBI?
The research population consisted of all patients aged 18 to 65 years of age with a moderate or severe TBI who were admitted from January 1999 until June 2004 in one of the three participating hospitals. Those were the Erasmus MC, Rotterdam (January 1999 until March 2004), the Medical Center Haaglanden, location Westeinde, The Hague (September 2002 until June 2004) and the Utrecht University Medical Center (UMC) (January 2003 until June 2004). Patients were classified as having a severe TBI when the worst Glasgow Coma Scale score (GCS score) within 24 hours post-injury was between 3 and 8. Moderate TBI was defined as a GCS score of 9-13. Furthermore, patients with a GCS score 14 or 15 ánd mass lesion on the head CT-scan were also classified as having a moderate TBI. Patients were excluded from the study when they had serious (pre-traumatic) neurological, psychiatric, oncologic or internal impairments which could interfere with TBI-related disabilities. If the patient, or their next of kin, did not speak Dutch or English they were not invited to participate in the study.
Chapter 2 presents a review of the literature on the most applied and/or best documented measurement instruments used in TBI research to classify initial severity and final outcome. Patients with head injury may be classified according to clinical severity, mechanism of injury, or morphologic changes. In the acute phase CT examination is preferred to MRI. Presence of TBI and clinical severity is also evidenced by duration of post-traumatic amnesia (PTA), and in more severe cases by the degree and duration of a depressed level of consciousness. PTA can be reliably measured with the Galveston Orientation and Amnesia Test (GOAT) and the level of consciousness by the Glasgow Coma Scale (GCS). According to the mechanisms of injury, patients may be differentiated in closed head injury (CHI) versus penetrating head injury (PHI). Poorer outcome in PHI is primarily determined by mortality. In PHI the sequelae are primarily caused by physical disabilities versus more severe cognitive impairments in patients with CHI. The complexity of relevant outcomes, combined with the limited resources for research, has led to the use of measurement instruments not specifically developed for the TBI population. We divided the instruments into 1) general outcome scales: i.e. Glasgow Outcome Scale (GOS), Glasgow Outcome Scale Extended (GOSE), and Disability Rating Scale (DRS), 2) disability scales: i.e. Barthel Index (BI), Rancho Los Amigos Level of Cognitive Functioning Scale (LCFS), Functional Independence
153
Summary
Measurement (FIM), Functional Assessment Measurement (FAM), and Neurobehavioural Rating Scale (NRS), and 3) handicap scales: i.e. Sickness Impact Profile (SIP), Rand SF-36 (Rand), Wimbledon Self-Report Scale (WSRS), the Coop/Wonca charts (Coop), Supervision Rating Scale (SRS), Community Integration Questionnaire (CIQ), and the Aachener Life Quality Inventory. Adequate validity and reliability of these instruments has been shown, but mostly in other settings (i.e. a neurosurgical setting) and/or in other conditions such as stroke, multiple sclerosis, and chronic pain. However, validation of the above-mentioned measurement instruments is required in the TBI population. Based on those results a minimum data set of measurement instruments may be proposed.
In chapter 3, the inter-observer reliability of the measurement instruments used in our study was established. Different studies on reliability have been published, but our study is the first in which the measurement instruments were investigated in one population (i.e. a hospital population) at various time points. We also aimed to determine sensitivity to change. Because of the short concentration span often reported in TBI patients, it is important to have short interviews with a minimum data set. We identified inter-observer reliability and sensitivity to change of different measurement instruments at different time points to form such a minimum data set. At time of discharge from the hospital, 22 moderate or severe TBI patients (aged 18-50 years) were interviewed by two observers within one week from each other with the BI, FIM, GOS, GOSE, DRS, FAM, LCFS, Rehabilitation Activities Profile (RAP), and Coop. One year post injury another 14 moderate or severe TBI patients (aged 19-51 years) were interviewed, again by two observers but now within one month from each other. The same set of measurement instruments was used as was used at time of discharge, but for the one-year study the set was extended with the NRS, CIQ, Employability Rating Scale (ERS), Frenchay Activities Index (FAI), Multi Health Locus of Control Scale (MHLCS), Social Support List-Interaction (SSL-I) and SSL-Discrepancies (SSL-D), SRS, WSRS, Rand-36, and Sickness Impact Profile-68 (SIP-68). The data from the one year post injury inter-observer study were also used to calculate the sensitivity to change over time in TBI patients. Early in recovery, i.e. at time of discharge from hospital, limitations in the physical domain can reliably be assessed with the BI and the FIM, in the cognitive domain with the FAM, and the Coop is most reliable to assess quality of life. One year post injury, limitations in the physical domain can be assessed with the FIM and in the cognitive domain with the FAM and the NRS. Restrictions in the psychosocial domain can be assessed with the FAI, the CIQ, and the WSRS, whereas the Coop, all Rand subscales (except Rand mental health), and the SIP-68 are reliable measurement instruments for quality of life. The BI, the FIM, the DRS and the FAM are most sensitive to detect change. In addition, the NRS, the Coop and the SIP-68 are promising, as they are able to detect relatively small differences in a patient over time. At the moment of discharge from hospital a reliable minimum set is the FIM, the FAM, and the Coop. At follow-up the data set can be extended with the NRS, the FAI, and the SIP-68 which are most sensitive to change, thereby covering all relevant domains of functioning and participation after TBI.

154
Summary
In chapter 4 we investigated whether the patient and their proxy’s ratings about the patient’s functioning correspond. A high level of agreement was found between patient and proxy on rating of the patient’s functioning, and quality of life. Only at 3 months post injury a significant difference was found on the FIM motor score, with proxies rating the patients higher than the patients rated themselves. After 3 months no significant differences were found between ratings of the patient and proxy on the measurement instruments used in this study. Unlike results from earlier reports, in the present study no underestimation or overestimation of the patient’s limitations by the proxies was found. Most of the differences found in our study were non-significant trends. Moreover, the differences found between patients and proxies were very small and were not of clinical importance. In the first year post-injury the FIM, the SIP-68 and the Rand SF-36 can be applied either to the TBI patient or to the patient’s proxy to assess the patient’s functioning.
Few rehabilitation studies include patients from acute care hospitals; only patients referred to inpatient rehabilitation settings are usually included. In chapter 5 we questioned whether inclusion of inpatient rehabilitation TBI patients results in a selection bias. Data on demographics were collected during interviews with the TBI patient and/or their next of kin/caregiver, data on cause of injury, GCS score, and length of stay were retrieved from patient files, and data on the patient’s general, physical and cognitive functioning were assessed in interviews at the time of discharge from the hospital (i.e. the neurosurgery ward). These data were compared with data available from the Traumatic Brain Injury Model Systems (TBIMS) national database from the USA. The TBIMS inclusion criteria limit the data set to persons aged 16 years and older who receive comprehensive inpatient rehabilitation as part of a systematic continuum of care, including acute neurotrauma services in a designated TBIMS center. Patients in our hospital-based cohort were younger, more patients were married and/or working pre-injury, and in our population fewer injuries were caused by violence compared with the TBIMS data. In addition, in our hospital-based cohort the GCS score was higher, the length of stay was longer, and general, physical, and cognitive functioning was better. In our study, 46% of the patients was discharged home and would not be taken into account in the usual prognostic studies on TBI in rehabilitation medicine. The hospital-based cohort described here is different from inpatient rehabilitation cohorts with respect to age, marital and working status pre-injury, percentage of violence-related TBIs, mean GCS score, length of stay, and level of functional status. We conclude that studies which include only those patients that are recruited from an inpatient rehabilitation setting, suffer from selection bias.
In chapter 6 the association between patient characteristics (age, gender, TBI severity, functional outcome) and discharge destination was investigated in a cross- sectional study. This gave us a study population of 111 patients with a moderate or severe TBI, aged 16 to 67 years. Functional outcome was assessed with the BI, FIM, LCFS, FAM, SRS, and NRS. The patients were interviewed at the time of discharge from the neurosurgery ward. The outcome variable was discharge destination; 1) home versus institution, and 2) rehabilitation center versus nursing home. Gender, age and length of stay were not associated with
155
Summary
discharge destination. TBI severity, physical status, level of arousal and cognitive status were univariately associated with discharge destination. Multivariate analyses, however, showed that the risk of being admitted to an institution was significantly higher only for those with severe TBI [adjusted odds ratio (OR) = 14], and lowered cognitive status at the time of being discharged from hospital [adjusted OR = 12]. The physical status of the TBI patient was not associated with discharge destination. There is an indication that the group discharged to an institution can be subdivided into a rehabilitation center group and a nursing home group; with the patients discharged to a nursing home being more cognitively limited. Further research in larger studies (with more patients in the nursing home group) is needed to substantiate this finding.
In chapter 7 we examined whether the caregivers’ coping style is associated with the functional outcome of the TBI patient one year post injury. A cross-sectional study among patients with a TBI, including their primary caregivers, was performed. The study included 51 patients aged 17-64 years with a moderate or severe TBI, and 51 caregivers (23 parents and 28 partners) aged 23-67 years. The coping preferences of the caregivers were assessed at minimum 6 and maximum 12 months post injury, by filling out the Utrecht Coping List (UCL) and were related to limitations in activity (as measured with the FAI) and with restrictions in participation (as measured with the SIP-68) of TBI patients one year post injury. The patients were interviewed at their homes; the caregivers received and returned the UCL by mail. We found that the patients’ age and the caregivers’ coping style are independently associated with restrictions in participation one year post injury. Our results show that patients older than 40 years are more likely to be restricted in activities compared with younger patients, and that patients with a caregiver with a preference for a passive coping style (i.e. isolating oneself from others, worrying about the past, and taking refuge in fantasies) are more restricted in participation than patients with a caregiver with another preference for coping. In clinical terms this means that it is important to gain insight in the coping preference of the caregiver.
The study in chapter 8 investigated the prognosis of functioning and quality of life (QoL) in patients one year after having sustained a moderate or severe TBI. The study included 126 patients (aged 16-67 years) with a moderate or severe TBI. General outcome was assessed with GOS and DRS, physical outcome by BI and FIM. Cognitive outcome was assessed by FAM, LCFS, and NRS, emotional outcome by WSRS and the subscale Mental Health from the Rand SF-36. Psychosocial outcome was constructed by FAI and two subscales of the CIQ (home integration and social integration). Return to work was taken from the DRS. The SIP-68 and the Rand SF-36 were used to assess QoL. One year post injury 75% of the patients reported problems in their general functioning, 13% in physical functioning, 35% in cognitive functioning, and 26% in their emotional functioning. In addition, 76% of the patients were limited in psychosocial activities, 72% experienced work restrictions, and 91% of all patients reported a reduced QoL. General functioning was predicted by physical and cognitive limitations at discharge [risk ratio; RR 0.3]. Physical functioning was predicted by physical
156
Summary
limitations at discharge from hospital only [RR 0.4]. Cognitive functioning was predicted by severity of TBI [RR -0.2], and by physical and cognitive limitations at discharge from hospital [RR 0.3 and 0.4, respectively]. Psychosocial functioning was predicted by gender [RR 0.3] and by physical limitations at discharge from hospital [RR 0.3]. Return to work was predicted by severity of TBI [RR -0.2], and physical and cognitive limitations at discharge from hospital [RR 0.3 and 0.4, respectively]. QoL could only be predicted by physical limitations at discharge from hospital [RR 0.3]. Being a woman, having sustained a moderate TBI, and having a low physical or a low cognitive status at discharge from hospital are important predictor variables in poor functional prognosis and QoL one year after TBI.
Finally, chapter 9 discusses the conclusions of the studies, their limitations and clinical implications, and presents directions for future research.

Bianca van Baalen
Samenvatting
158
Samenvatting
.In dit proefschrift wordt verslag gedaan van het FuPro TBI onderzoek (Functionele Prognose na traumatisch hersenletsel) wat onderdeel is van het landelijk FuPro onderzoeksprogramma waarin de functionele prognose van vier neurologische aandoeningen (Multiple Sclerose (MS), cerebro vasculair accident (CVA), Amyotrofisch Lateraal Sclerose (ALS) en traumatisch hersenletsel (THL)) werd onderzocht.De belangrijkste onderzoeksvragen zijn als volgt geformuleerd:
1) Welke meetinstrumenten zijn het meest betrouwbaar en vooral het meest gevoelig om verandering van functionele uitkomst en kwaliteit van leven vast te stellen?
2) Wat zijn de determinanten van functionele prognose en kwaliteit van leven bij THL patiënten, op één jaar na trauma?
De onderzoekspopulatie bestaat uit alle patiënten in de leeftijd van 18 tot 65 jaar met matig of ernstig hersenletsel die werden opgenomen van januari 1999 tot juni 2004 in één van de drie deelnemende ziekenhuizen. De deelnemende ziekenhuizen waren het Erasmus MC te Rotterdam (januari 1999 tot maart 2004), het Medisch Centrum Haaglanden, locatie Westeinde te Den Haag (september 2002 tot juni 2004) en het Universitair Medisch Centrum te Utrecht (januari 2003 tot juni 2004). Patiënten werden geclassificeerd als ernstig THL wanneer de slechtste Glasgow Coma Scale score (GCS score) in de eerste 24 uur na letsel 3 tot 8 was. Matig THL werd gedefinieerd door een GCS score van 9-13. Daarnaast werden uit de groep patiënten met een mild THL (GCS score van 14 of 15) ook de patiënten waarbij sprake was van een traumatische laesie met massawerking (op de CT-scan) geclassificeerd als matig THL. Patiënten werden niet geïncludeerd wanneer zij ernstige (pre-traumatische) neurologische, psychiatrische, oncologische of interne stoornissen hadden die kunnen interfereren met de THL gerelateerde beperkingen. Als de patiënt of zijn familie geen Nederlands of Engels sprak, dan werden zij ook niet gevraagd voor deelname aan het onderzoek.
In hoofdstuk 2 werden de meest voorkomende en/of best gedocumenteerde in THL onder-zoek gebruikte meetinstrumenten (hier: vragenlijsten) voor het classificeren van initiële ernst en uiteindelijke uitkomst onderzocht en besproken. Patiënten met hoofdletsel kunnen geclassificeerd worden naar klinische ernst, oorzaak van het letsel of morfologische veranderingen. In de acute fase is CT-onderzoek te prefereren boven MRI-onderzoek. Aanwezigheid van THL en klinische ernst kan ook worden aangetoond door de aanwezigheid en duur van posttraumatische amnesie (PTA) en in meer ernstige gevallen door de graad en duur van een verlaagd bewustzijn. PTA kan betrouwbaar gemeten worden met de Galveston Orientation and Amnesia Test (GOAT) en niveau van bewustzijn door de Glasgow Coma Scale (GCS). Patiënten kunnen naar oorzaak van het letsel worden verdeeld in gesloten hoofdletsel (CHI) versus gepenetreerd hoofdletsel (PHI). De slechtere uitkomst bij PHI wordt voornamelijk bepaald door mortaliteit. Bij PHI worden gevolgen voornamelijk veroorzaakt door fysieke beperkingen versus meer ernstige cognitieve stoornissen bij patiënten met een CHI. De complexiteit van relevante uitkomsten in combinatie met beperkte bronnen
159
Samenvatting
van onderzoek heeft geleid tot het gebruik van meetinstrumenten die niet specifiek ontwikkeld zijn voor de THL populatie. Wij verdeelden de meetinstrumenten in algemene uitkomstschalen (Glasgow Outcome Scale (GOS), Glasgow Outcome Scale Extended (GOSE) en Disability Rating Scale (DRS)), beperkingen schalen (Barthel Index (BI), Rancho Los Amigos Level of Cognitive Functioning Scale (LCFS), Functional Independence Measurement (FIM), Functional Assessment Measurement (FAM) en Neurobehavioural Rating Scale (NRS)) en handicap schalen (Sickness Impact Profile (SIP), Rand SF 36 (Rand), Wimbledon Self Report Scale (WSRS), Coop/Wonca kaarten (Coop), Supervision Rating Scale (SRS), Community Integration Questionnaire (CIQ) en Aachener Life Quality Inventory)). De meetinstrumenten beschikken allen over een adequate validiteit en betrouwbaarheid, maar vaak vastgesteld in andere settings (bijv. neurochirurgische setting) en/of andere diagnoses zoals CVA, MS en chronisch pijn. Valideren van bovengenoemde instrumenten is nodig in de THL populatie. Gebaseerd op die resultaten kan een minimale dataset worden voorgesteld.
In hoofdstuk 3 werden de door ons gebruikte meetinstrumenten onderzocht op hun betrouwbaarheid. Verschillende betrouwbaarheidsstudies zijn gepubliceerd, maar deze studie is de eerste waarin de meetinstrumenten in één populatie (de ziekenhuis-populatie) op verschillende tijdstippen werd onderzocht. Ook werd de gevoeligheid voor verandering vastgesteld. Door de korte aandachtsspanne die vaak wordt gemeld bij THL patiënten is het belangrijk om korte interviews te houden, gebruikmakend van een minimale dataset. Op moment van ontslag uit het ziekenhuis werden 22 matig of ernstig THL-patiënten in de leeftijd van 18 tot 50 jaar geïnterviewd door twee observatoren met de BI, FIM, GOS, GOSE, DRS, FAM, LCFS, Revalidatie Activiteiten Profiel (RAP) en Coop. Eén jaar na letsel werden nog eens 14 matig of ernstig THL-patiënten in de leeftijd van 19 tot 51 jaar geïnterviewd; ook weer door twee observatoren. Dezelfde set vragenlijsten werd gebruikt als die werd afgenomen ten tijde van ontslag uit het ziekenhuis, maar voor de éénjaars interbeoordelaar-studie werd de set uitgebreid met de NRS, CIQ, Employability Rating Scale (ERS), Frenchay Activities Index (FAI), Multi Health Locus of Control Scale (MHLCS), Sociale Steun Lijst-Interactie (SSL-I) en SSL-Discrepanties (SSL-D), SRS, WSRS, Rand-36 en Sickness Impact Profile-68 (SIP-68). De data van de éénjaars interbeoordelaarstudie werden ook gebruikt om de gevoeligheid voor verandering in de tijd bij THL patiënten te berekenen. In de vroege fase van herstel (moment van ontslag uit het ziekenhuis) kunnen beperkingen in het fysieke domein betrouwbaar worden vastgesteld met de BI en de FIM, in het cognitieve domein met de FAM, en is de Coop het meest geschikt voor het vaststellen van kwaliteit van leven. Eén jaar na letsel kunnen beperkingen in het fysieke domein betrouwbaar worden vast-gesteld met de FIM, in het cognitieve domein met de FAM en de NRS. Restricties in het psychosociaal domein kunnen worden vastgesteld met de FAI, de CIQ, en de WSRS, terwijl de Coop, alle Rand subschalen (behalve subschaal geestelijke gezondheid), en de SIP-68 betrouwbare meetinstrumenten zijn voor kwaliteit van leven. De BI, de FIM, de DRS en de FAM zijn het meest gevoelig om veranderingen te kunnen opsporen. Bovendien zijn de NRS, de Coop en de SIP-68 veelbelovend, aangezien zij in staat zijn relatief kleine verschillen op te kunnen sporen. Op moment van ontslag uit het ziekenhuis bestaat een betrouwbare minimum dataset uit de FIM, de FAM en de Coop. In een later stadium van herstel kan deze
160
Samenvatting
minimum data set worden aangevuld met de NRS, de FAI en de SIP-68 die het meest gevoelig blijken voor verandering, zodat alle domeinen van functioneren worden onderzocht.
In hoofdstuk 4 onderzochten we of de beoordeling over het eigen functioneren van de patiënt overeenkwam met het idee dat de naastbetrokkene heeft over het functioneren van de patiënt. Een hoge overeenstemming werd gevonden tussen patiënt en naast-betrokkene voor het beoordelen van functioneren en kwaliteit van leven van de patiënt. Alleen op drie maanden na letsel werd een significant verschil gevonden op de FIM-motor score, met de naastbetrokkenen die patiënten hoger scoorden dan de patiënten zelf. Na drie maanden werden geen significante verschillen meer gevonden tussen de patiënt en naastbetrokkene op de meetinstrumenten die in deze studie werden gebruikt. In tegen-stelling tot eerdere studies werd in deze studie geen onder- of overschatting gevonden tussen patiënten en hun naastbetrokkene. De meeste verschillen die werden gevonden, waren niet-significante trends. Aangezien de verschillen tussen patiënten en hun naast-betrokkene erg klein waren, zijn ze niet klinisch relevant. In het eerste jaar na letsel kan de FIM, de SIP-68 en de Rand SF36 zowel door de THL-patiënt als ook door zijn naastbetrokkene worden gebruikt om zo het functioneren van de patiënt vast te stellen.
Weinig revalidatie studies includeren patiënten vanuit het ziekenhuis; alleen patiënten die worden doorverwezen voor klinische revalidatie worden gewoonlijk geïncludeerd. In hoofdstuk 5 vroegen we ons af of inclusie van alleen klinisch opgenomen THL patiënten een selectie-bias geeft. Demografische gegevens werden verzameld tijdens interviews met de patiënt en/of zijn naastbetrokkene. Data op het gebied van oorzaak van het letsel, ernst van het THL en opnameduur werden gegeven door de ziekenhuizen die deelnamen aan het onderzoek. Data op het gebied van fysiek en cognitief functioneren van de patiënt werden verzameld in een interview op het moment van ontslag uit het ziekenhuis (hier de afdeling neurochirurgie). Deze data werden vergeleken met data uit de ‘Traumatic Brain Injury Model Systems (TBIMS) national database’ uit de Verenigde Staten. De TBIMS inclusie criteria beperken hun dataset tot personen van 16 jaar en ouder die klinische revalidatie ontvangen als onderdeel van een systematisch aangeboden continuüm van zorg, waaronder ook acute neurotrauma interventies in een TBIMS centrum. Patiënten uit ons onderzoeks- cohort zijn op moment van het ongeval jonger en meer patiënten zijn getrouwd en/of aan het werk in vergelijking met de TBIMS data. Verschillen werden ook gevonden voor oorzaak van het letsel; minder letsels worden veroorzaakt door geweld. De GCS score is hoger en er wordt een verlengde opnameduur en een beter algemeen, fysiek en cognitief functioneren gevonden in ons ziekenhuiscohort. In deze studie werd 46% van de patiënten naar huis ontslagen welke in de gebruikelijke prognostische studies in THL revalidatie niet wordt meegenomen. Het ziekenhuiscohort dat hier is beschreven is verschillend van klinische revalidatie cohorten wanneer gekeken wordt naar leeftijd, huwelijkse staat en arbeidsstatus voor letsel, percentage geweldsgerelateerde THL’s, gemiddelde GCS score , opnameduur en niveau van functioneren. Geconcludeerd kan worden dat studies die alleen patiënten includeren die in aanmerking komen voor klinische revalidatie lijden aan selectie-bias.

161
Samenvatting
In hoofdstuk 6 werd de associatie tussen patiëntkenmerken (leeftijd, geslacht, THL-ernst, functionele uitkomst) en ontslagbestemming onderzocht in een cross-sectionele studie. De studiepopulatie bestond uit 111 patiënten met matig of ernstig THL in de leeftijd van 16 tot 67 jaar. Functionele uitkomst werd vastgesteld met de BI, FIM, LCFS, FAM, SRS, en NRS. De patiënten werden geïnterviewd op moment van ontslag uit het ziekenhuis (afdeling neuro-chirurgie). De uitkomst variabele was ontslagbestemming; 1) naar huis versus naar een instituut, en 2) revalidatie centrum versus verpleeghuis. Geslacht, leeftijd en opname-duur waren niet geassocieerd met ontslagbestemming. Ernst, fysieke status, niveau van bewustzijn en cognitieve status zijn univariaat geassocieerd met ontslagbestemming. Echter, multivariate analyses toonden aan dat het risico om opgenomen te worden in een instituut alleen significant hoger is voor de patiënten met een ernstig THL [adjusted odds ratio (OR) = 14] en met een verlaagd bewustzijn op moment van ontslag uit het ziekenhuis [adjusted OR= 12]. De fysieke toestand van de patiënt is niet geassocieerd met ontslag-bestemming. Er zijn aanwijzingen gevonden voor het verder kunnen onderverdelen van de groep die werd ontslagen naar een instituut in een groep revalidatiecentrum en een groep verpleeghuis; waarbij de patiënten die werden ontslagen naar het verpleeghuis meer cognitief beperkt zijn. Verder onderzoek in grotere studies (met meer patiënten in de verpleeghuisgroep) is nodig om deze aanwijzing te kunnen onderbouwen.
In hoofdstuk 7 onderzochten we of de copingstijl van de naastbetrokkene geassocieerd is met de functionele uitkomst van de THL-patiënt een jaar na letsel. Hiervoor werd een cross-sectionele studie onder THL-patiënten en hun primair naastbetrokkenen uitgevoerd. Er namen 51 patiënten met een matig of ernstig THL in de leeftijd van 17-64 jaar deel, en 51 naastbetrokkenen (23 ouders en 28 partners) in de leeftijd van 23 tot 67 jaar. De coping voorkeuren van de naastbetrokkenen werden mimimaal 6 en maximaal 12 maanden na letsel vastgelegd door de Utrecht Coping Lijst (UCL) in te vullen en werden gerelateerd aan beperkingen in activiteit, gemeten met de FAI, en met restricties in participatie, gemeten met de SIP-68 van THL-patiënten een jaar na letsel. De patiënten werden thuis geïnterviewd; de naastbetrokkenen ontvingen en retourneerden de UCL per post. We vonden dat leeftijd van patiënt en copingstijl van de naastbetrokkene onafhankelijk is geassocieerd met restricties in participatie een jaar na letsel. Onze resultaten laten zien dat patiënten ouder dan 40 jaar, meer beperkt zijn in participatie dan patiënten jonger dan 40, en dat patiënten met een naastbetrokkene met een passieve copingstijl (je volledig afzonderen van anderen, piekeren over het verleden, en niet in staat iets aan de situatie te doen) ook meer beperkt zijn in participatie dan patiënten met een naastbetrokkene met een andere coping voorkeur Voor de klinische praktijk betekent dit dat het van belang is inzicht te hebben in de coping voorkeur van de naastbetrokkene van de patiënt.
162
Samenvatting
In hoofdstuk 8 werd de prognose van functioneren en kwaliteit van leven in patiënten een jaar na het doormaken van matig of ernstig THL bestudeerd. De onderzoekspopulatie bestond uit 126 patiënten in de leeftijd van 16 tot 67 jaar met een matig of ernstig THL. De algemene uitkomst werd vastgesteld met behulp van de GOS en de DRS, de fysieke uitkomst met de BI en de FIM. Cognitieve uitkomst werd vastgesteld middels de FAM, de LCFS en de NRS, emotionele uitkomst met de WSRS en subschaal geestelijke gezondheid van de Rand SF-36. Psychosociale uitkomst werd geconstrueerd door de FAI en twee subschalen van de CIQ (thuisintegratie en sociale integratie). Terugkeer naar werk kwam uit de DRS. De SIP-68 en de Rand SF-36 werd gebruikt om kwaliteit van leven vast te stellen. Een jaar na letsel rapporteert 75% van de patiënten problemen in algemeen functioneren, 13% in fysiek functioneren, 35% in cognitief functioneren en 26% in emotioneel functioneren. Van alle patiënten geeft 76% aan beperkt te zijn in psychosociale activiteiten, 72% van de patiënten geeft beperkingen in terugkeer naar werk aan en 91% van alle patiënten rapporteert een verlaagde kwaliteit van leven. Algemeen functioneren wordt voorspeld door aanwezige fysieke en cognitieve beperkingen op moment van ontslag uit het ziekenhuis [risk ratio (RR) 0.3]. Fysiek functioneren wordt alleen voorspeld door fysieke beperkingen, aanwezig ten tijde van ontslag uit het ziekenhuis [RR 0.4]. Cognitief functioneren kan worden voorspeld door ernst van het THL [RR -0.2] en door fysieke en cognitieve beperkingen op het moment van ontslag uit het ziekenhuis [RR van 0.3 respectievelijk 0.4]. Psychosociaal functioneren wordt voorspeld door geslacht [RR 0.3]. Terugkeer naar werk wordt voorspeld door ernst van het THL [RR -0.2] en fysieke en cognitieve beperkingen op moment van ontslag uit het ziekenhuis [RR van 0.3 respectievelijk 0.4]. Kwaliteit van leven kan alleen worden voorspeld door de fysieke beperkingen op moment van ontslag uit het ziekenhuis [RR 0.3]. Het vrouw-zijn, het doorgemaakt hebben van een matig THL en het hebben van een lage fysieke of een lage cognitieve status op moment van ontslag uit het ziekenhuis zijn belangrijke predictor variabelen voor een slechte functionele prognose en kwaliteit van leven een jaar na letsel.
In hoofdstuk 9 uiteindelijk, worden de conclusies van de studies, de beperkingen en de klinische implicaties besproken en worden aanwijzingen gegeven voor verder onderzoek.
163
Samenvatting

Bianca van Baalen
Appendix
Measurement instrumentsused in this thesis
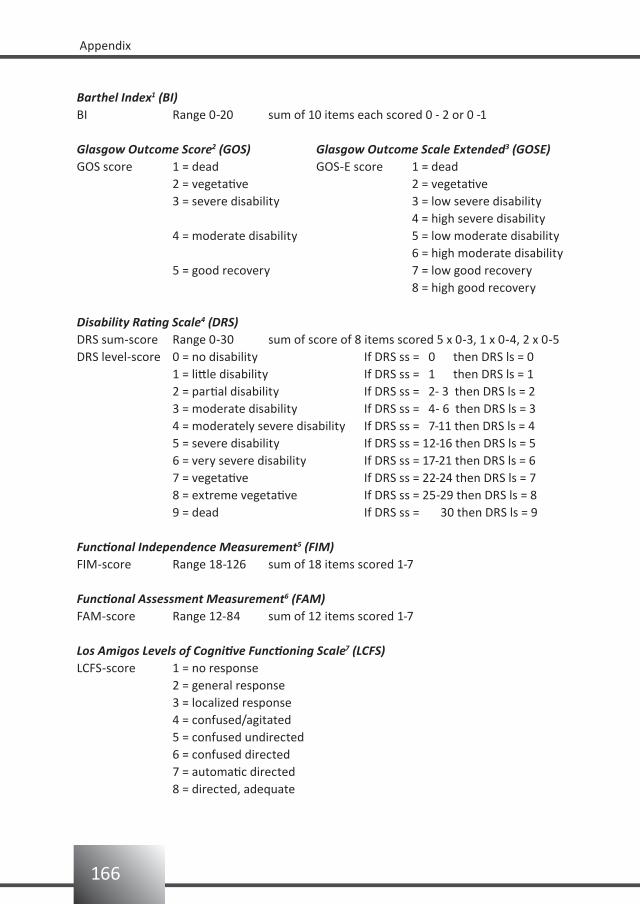
166
Appendix
Barthel Index1 (BI)BI Range 0-20 sum of 10 items each scored 0 - 2 or 0 -1
Glasgow Outcome Score2 (GOS) Glasgow Outcome Scale Extended3 (GOSE)GOS score 1 = dead GOS-E score 1 = dead 2 = vegetative 2 = vegetative 3 = severe disability 3 = low severe disability 4 = high severe disability 4 = moderate disability 5 = low moderate disability 6 = high moderate disability 5 = good recovery 7 = low good recovery 8 = high good recovery
Disability Rating Scale4 (DRS)DRS sum-score Range 0-30 sum of score of 8 items scored 5 x 0-3, 1 x 0-4, 2 x 0-5 DRS level-score 0 = no disability If DRS ss = 0 then DRS ls = 0 1 = little disability If DRS ss = 1 then DRS ls = 1 2 = partial disability If DRS ss = 2- 3 then DRS ls = 2 3 = moderate disability If DRS ss = 4- 6 then DRS ls = 3 4 = moderately severe disability If DRS ss = 7-11 then DRS ls = 4 5 = severe disability If DRS ss = 12-16 then DRS ls = 5 6 = very severe disability If DRS ss = 17-21 then DRS ls = 6 7 = vegetative If DRS ss = 22-24 then DRS ls = 7 8 = extreme vegetative If DRS ss = 25-29 then DRS ls = 8 9 = dead If DRS ss = 30 then DRS ls = 9
Functional Independence Measurement5 (FIM)FIM-score Range 18-126 sum of 18 items scored 1-7
Functional Assessment Measurement6 (FAM)FAM-score Range 12-84 sum of 12 items scored 1-7
Los Amigos Levels of Cognitive Functioning Scale7 (LCFS)LCFS-score 1 = no response 2 = general response 3 = localized response 4 = confused/agitated 5 = confused undirected 6 = confused directed 7 = automatic directed 8 = directed, adequate
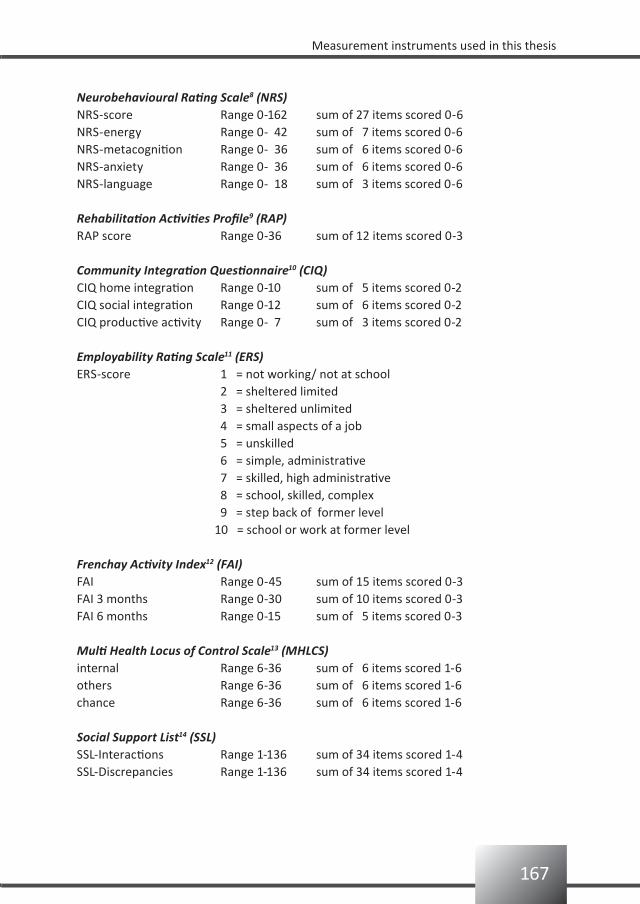
167
Measurement instruments used in this thesis
Neurobehavioural Rating Scale8 (NRS)NRS-score Range 0-162 sum of 27 items scored 0-6NRS-energy Range 0- 42 sum of 7 items scored 0-6NRS-metacognition Range 0- 36 sum of 6 items scored 0-6NRS-anxiety Range 0- 36 sum of 6 items scored 0-6NRS-language Range 0- 18 sum of 3 items scored 0-6
Rehabilitation Activities Profile9 (RAP)RAP score Range 0-36 sum of 12 items scored 0-3
Community Integration Questionnaire10 (CIQ)CIQ home integration Range 0-10 sum of 5 items scored 0-2 CIQ social integration Range 0-12 sum of 6 items scored 0-2 CIQ productive activity Range 0- 7 sum of 3 items scored 0-2 Employability Rating Scale11 (ERS)ERS-score 1 = not working/ not at school 2 = sheltered limited 3 = sheltered unlimited 4 = small aspects of a job 5 = unskilled 6 = simple, administrative 7 = skilled, high administrative 8 = school, skilled, complex 9 = step back of former level 10 = school or work at former level
Frenchay Activity Index12 (FAI)FAI Range 0-45 sum of 15 items scored 0-3FAI 3 months Range 0-30 sum of 10 items scored 0-3FAI 6 months Range 0-15 sum of 5 items scored 0-3
Multi Health Locus of Control Scale13 (MHLCS)internal Range 6-36 sum of 6 items scored 1-6 others Range 6-36 sum of 6 items scored 1-6 chance Range 6-36 sum of 6 items scored 1-6
Social Support List14 (SSL)SSL-Interactions Range 1-136 sum of 34 items scored 1-4SSL-Discrepancies Range 1-136 sum of 34 items scored 1-4
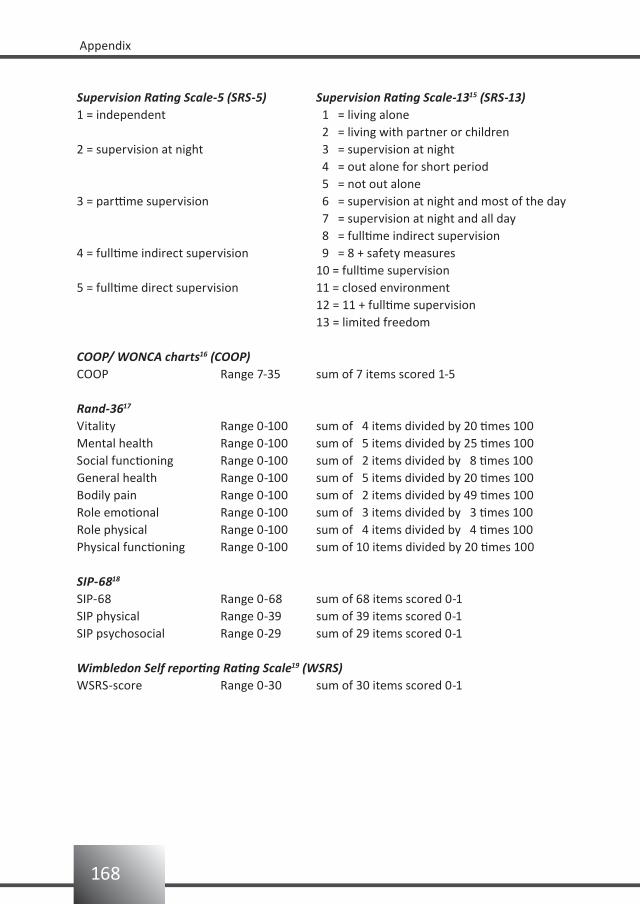
168
Appendix
Supervision Rating Scale-5 (SRS-5) Supervision Rating Scale-1315 (SRS-13)1 = independent 1 = living alone 2 = living with partner or children2 = supervision at night 3 = supervision at night 4 = out alone for short period 5 = not out alone3 = parttime supervision 6 = supervision at night and most of the day 7 = supervision at night and all day 8 = fulltime indirect supervision4 = fulltime indirect supervision 9 = 8 + safety measures 10 = fulltime supervision5 = fulltime direct supervision 11 = closed environment 12 = 11 + fulltime supervision 13 = limited freedom
COOP/ WONCA charts16 (COOP)COOP Range 7-35 sum of 7 items scored 1-5
Rand-3617
Vitality Range 0-100 sum of 4 items divided by 20 times 100Mental health Range 0-100 sum of 5 items divided by 25 times 100Social functioning Range 0-100 sum of 2 items divided by 8 times 100General health Range 0-100 sum of 5 items divided by 20 times 100Bodily pain Range 0-100 sum of 2 items divided by 49 times 100Role emotional Range 0-100 sum of 3 items divided by 3 times 100Role physical Range 0-100 sum of 4 items divided by 4 times 100Physical functioning Range 0-100 sum of 10 items divided by 20 times 100
SIP-6818
SIP-68 Range 0-68 sum of 68 items scored 0-1SIP physical Range 0-39 sum of 39 items scored 0-1SIP psychosocial Range 0-29 sum of 29 items scored 0-1
Wimbledon Self reporting Rating Scale19 (WSRS)WSRS-score Range 0-30 sum of 30 items scored 0-1
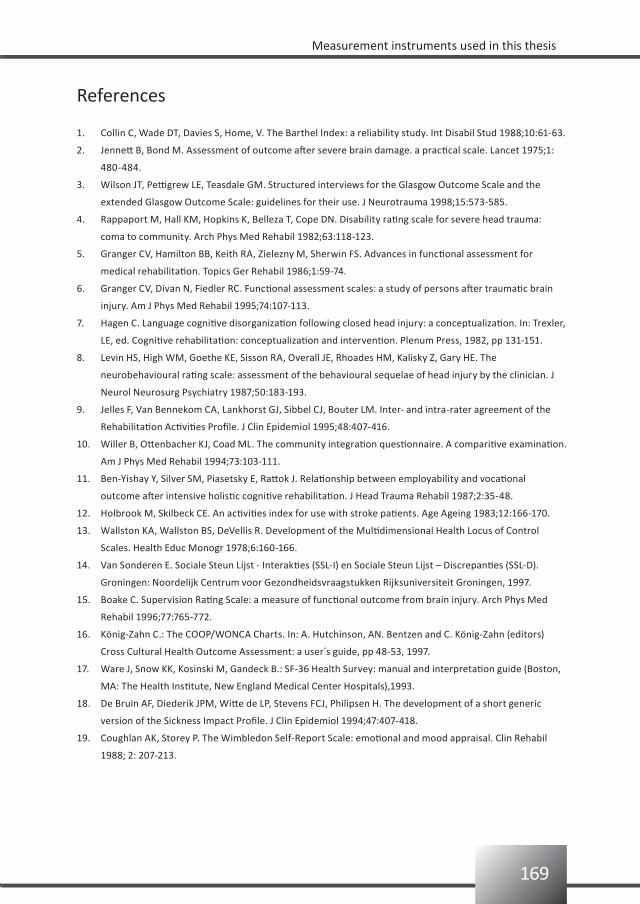
169
Measurement instruments used in this thesis
References
Collin C, Wade DT, Davies S, Home, V. The Barthel Index: a reliability study. Int Disabil Stud 1988;10:61-63.1.
Jennett B, Bond M. Assessment of outcome after severe brain damage. a practical scale. Lancet 1975;1: 2.
480-484.
Wilson JT, Pettigrew LE, Teasdale GM. Structured interviews for the Glasgow Outcome Scale and the 3.
extended Glasgow Outcome Scale: guidelines for their use. J Neurotrauma 1998;15:573-585.
Rappaport M, Hall KM, Hopkins K, Belleza T, Cope DN. Disability rating scale for severe head trauma: 4.
coma to community. Arch Phys Med Rehabil 1982;63:118-123.
Granger CV, Hamilton BB, Keith RA, Zielezny M, Sherwin FS. Advances in functional assessment for 5.
medical rehabilitation. Topics Ger Rehabil 1986;1:59-74.
Granger CV, Divan N, Fiedler RC. Functional assessment scales: a study of persons after traumatic brain 6.
injury. Am J Phys Med Rehabil 1995;74:107-113.
Hagen C. Language cognitive disorganization following closed head injury: a conceptualization. In: Trexler, 7.
LE, ed. Cognitive rehabilitation: conceptualization and intervention. Plenum Press, 1982, pp 131-151.
Levin HS, High WM, Goethe KE, Sisson RA, Overall JE, Rhoades HM, Kalisky Z, Gary HE. The 8.
neurobehavioural rating scale: assessment of the behavioural sequelae of head injury by the clinician. J
Neurol Neurosurg Psychiatry 1987;50:183-193.
Jelles F, Van Bennekom CA, Lankhorst GJ, Sibbel CJ, Bouter LM. Inter- and intra-rater agreement of the 9.
Rehabilitation Activities Profile. J Clin Epidemiol 1995;48:407-416.
Willer B, Ottenbacher KJ, Coad ML. The community integration questionnaire. A comparitive examination. 10.
Am J Phys Med Rehabil 1994;73:103-111.
Ben-Yishay Y, Silver SM, Piasetsky E, Rattok J. Relationship between employability and vocational 11.
outcome after intensive holistic cognitive rehabilitation. J Head Trauma Rehabil 1987;2:35-48.
Holbrook M, Skilbeck CE. An activities index for use with stroke patients. Age Ageing 1983;12:166-170.12.
Wallston KA, Wallston BS, DeVellis R. Development of the Multidimensional Health Locus of Control 13.
Scales. Health Educ Monogr 1978;6:160-166.
Van Sonderen E. Sociale Steun Lijst - Interakties (SSL-I) en Sociale Steun Lijst – Discrepanties (SSL-D). 14.
Groningen: Noordelijk Centrum voor Gezondheidsvraagstukken Rijksuniversiteit Groningen, 1997.
Boake C. Supervision Rating Scale: a measure of functional outcome from brain injury. Arch Phys Med 15.
Rehabil 1996;77:765-772.
König-Zahn C.: The COOP/WONCA Charts. In: A. Hutchinson, AN. Bentzen and C. König-Zahn (editors) 16.
Cross Cultural Health Outcome Assessment: a user´s guide, pp 48-53, 1997.
Ware J, Snow KK, Kosinski M, Gandeck B.: SF-36 Health Survey: manual and interpretation guide (Boston, 17.
MA: The Health Institute, New England Medical Center Hospitals),1993.
De Bruin AF, Diederik JPM, Witte de LP, Stevens FCJ, Philipsen H. The development of a short generic 18.
version of the Sickness Impact Profile. J Clin Epidemiol 1994;47:407-418.
Coughlan AK, Storey P. The Wimbledon Self-Report Scale: emotional and mood appraisal. Clin Rehabil 19.
1988; 2: 207-213.


Dankwoord
Bianca van Baalen

172
Dankwoord
Fijn dat u hier begint met lezen, uiteindelijk weten we allemaal dat het door deze mensen komt dat dit boekje voor u ligt. Ik ga natuurlijk mensen vergeten, dat is niet de bedoeling, maar dat is inherent aan zo lang over je proefschrift doen en zo veel mensen ontmoeten.
Beste deelnemers aan het onderzoek en familieleden, bedankt voor jullie ontvangsten. Ik heb erg veel van jullie geleerd en wil jullie daar hartelijk voor bedanken.Voor inclusie van deelnemers ben je afhankelijk van anderen. Daarom bedank ik hierbij de volgende afdelingen; afdeling 6Zuid IC, afdeling 7Zuid Neurochirurgie van het Erasmus MC, de IC afdeling van het Medisch Centrum Haaglanden en de afdeling Neurologie van het UMC Utrecht.Speciaal een woord van dank voor Zuster Jansen. Inmiddels al een poos niet meer als zuster werkzaam, maar op tijden dat de inclusie achterbleef ging je nog eens extra kijken op een andere afdeling en heb je er zowaar nog een paar extra voor me kunnen “binnenhalen”.
Dan volgt er natuurlijk een vermelding voor mijn promotor, professor H.J. Stam. Beste Henk, in de afrondingsfase hebben we elkaar wat beter mogen leren kennen en bleek je in staat me bij het onderwerp te houden. “Bianca, dat is leuk maar je drijft af, wat is je vraag? Blijf bij je vraagstelling!”. Dank ook om met Michael Bergen op zoek te gaan naar een potje om zo de kans te krijgen het af te maken. Michael, bij deze nogmaals dank.
Een ereplekje voor Else Odding, mijn officieuze co-promotor; ook wel vriendin van de familie genoemd. Het leven kan raar lopen, ik ben blij dat ik je heb mogen leren kennen. Vanaf nu geen praatjes meer over het onderzoek, maar over onze Casper, Thomas, Hannah, Maxim, Tonika en Lisa.
Gerard Ribbers, twee weken voordat mijn contract bij SMK Research afliep vroeg jij Theo Mulder of hij nog een psycholoog rond had lopen met interesse om een pilot op te zetten en zo is mijn carrière in Rijndam begonnen. Jouw reactie na de geboorte van Tonika en de reïntegratie zoals door jou en Joop van Leersum in gang gezet, heeft me destijds erg goed gedaan. Dank; zo kan het ook.“Beste Michiel, ‘stap voor stap’ hebben we ook nog een ander leuk boekje gemaakt. Laten we weer snel op zoek gaan naar nog zo’n klus. Hartelijke groet, Bianca.”Sandra Titulaer en Elsbeth Spakman (destijds arts-assistenten in opleiding) dankzij jullie kon de pilot plaatsvinden. Verpleging van KBA-2, in het bijzonder Ellie en Arjen die het mogelijk maakten dat er ook op de afdeling gemeten kon worden. Nog meer in het bijzonder de al eerder genoemde lieve, zorgzame, goeie vriendin Ellie Venner. Wat gewonnen koekjes van de Edah al niet teweeg kunnen brengen.
Marco en Mike, dank voor jullie metingen (hoofdstuk 3). Het leverde me een retourtje naar de Verenigde Staten van Amerika op.Marij, ICC/ SEM-deskundige en bij tijd en wijle uithuilpost voor me. Dank; het is gedaan.Dorien en Martijn, dank voor jullie inbreng voor hoofdstuk 7.
173
Dankwoord
Andrew Maas, inmiddels in Antwerpen maar jouw betrokkenheid bij het onderzoek heb ik als zeer prettig ervaren; leuk dat je zitting wilde nemen in de grote commissie.
Agnes, collega AIO, we hebben het in meerdere opzichten niet gemakkelijk gehad.Ten eerste met het onderzoek niet; heel ander soort onderzoek dan men gewend was op de afdeling. Ten tweede niet met elkaar; drie niet gemakkelijke vrouwen die met elkaar moesten samenwerken, maar waarbij de verschillende karaktertrekken moeilijk matchten. Ten derde met onszelf niet; persoonlijke zaken. Gefeliciteerd, de klus is geklaard.
Prof. Guus Lankhorst, Prof. Joost Dekker, Prof. Arie Prevo, Prof. Eline Lindeman, Annet Dallmeijer, Heleen Beckerman, Vincent de Groot, Vera Schepers, Ingrid van de Port, Anita Beelen en Imelda de Groot. Bedankt voor de samenwerking binnen de FuPro-onderzoeksgroep. Het was even zweten toen de trein besloot in de Wouwse Plantage te stoppen, maar dank zij jullie idee om een taxi te nemen naar Amersfoort kon ik toch nog op tijd mijn presentatie houden.
Dankzij Bernt Hellmann gingen de metingen in mijn zwangerschapsverlof gewoon door.
Laraine Visser-Isles, dank voor de correcties ten aanzien van het engels, niet alleen de tekst ploos je na, maar zelfs de literatuurverwijzingen werden voorzien van commentaar.
Ben en Wendy, dank voor het meedenken en voor het mogelijk maken van mijn onderzoeks-dinsdag. Beste collega’s van PBA-3, ik realiseer me dat het jullie ook extra werk en tijd heeft gekost. Ik ben blij jullie als collega te hebben. Vanaf nu zit ik weer in alle werkgroepjes, bemoei ik me weer overal mee en ben ik benieuwd hoe lang het zal duren voordat ik van één van jullie de vraag krijg of er niet één of ander project loopt in Rijndam waar ik me mee moet bemoeien. Maarten Bogert, Simone Grasteit en Eveline van Dijk bedankt voor de overname op mijn onderzoeksdagen.Adri, ik ben er nu echt klaar mee; een antwoord op de aan onszelf gestelde vraag: “En waarom hadden we ook weer bedacht dat we dit wilden doen?” heb ik nog niet, maar ik heb wel al weer een nieuwe vraag: “Ja, en nou?”
Theo en Jacqueline, ooit bij jullie (ARO/ SMK Research) gestart en eerlijk is eerlijk, het is niet geheel volgens plan, maar ik heb het toch maar afgemaakt.
Lieve Ellen, jouw: “en wanneer ben je nou eindelijk eens klaar?”-uitspaak heeft me goed gedaan en zo zie je maar weer wat een gedegen vooropleiding voor nut kan hebben.
Hans, Rita en Pancras, voor jullie was het zo vanzelfsprekend dat ik zou gaan studeren dat ik daar toen maar eens over na ben gaan denken. Ik ben jullie daar nog steeds erg dankbaar voor. Jammer dat ik Hans het boekje niet meer kan geven, want of hij dit nou van Bi had verwacht?

174
Dankwoord
Peet en Lin, het enige goede dat ik heb overgehouden aan dat vreselijke HBO-j jaar is de vriendschap met jullie. Achteraf blijkt dat ene jaar dan toch een goede investering te zijn geweest. En Peter, om aan te tonen dat ik geen workaholic ben; tot zaterdag.
Karin, 11 jaar geleden in de Ardennen (toen wij nog héél andere levens hadden), heb ik je gevraagd of je mij in de toekomst zou willen helpen bij de vormgeving van een eventueel óóit vorm te geven proefschrift. Nu, met Jeroen én veel tijd en creativiteit van Brigitte is het een ‘fraai ding’ geworden; dank jullie wel.
Liefste paranimfen, Ine (‘zwelgje’) jij bent van het begin betrokken geweest bij deze oefening en weet als geen ander onder welke omstandigheden dit boekje tot stand is gekomen; je hebt het op de voet gevolgd. Tussen “het Blok” en de verschillende opleidingen en cursussen door hebben we het, de meeste tijd, prima naar ons zin zo.Rem, jouw voorstel om in tijd van nood naar Boedapest te rijden en zo mijn geluk op te halen zal ik nooit vergeten. Ik werd zo rustig van dat voorstel dat ik vanaf dat moment wist dat ik je vandaag naast me wilde hebben, dank.
Oom Cees en tante Liza, dank jullie wel; mooi hè!
Papa en mama, jullie hebben volgens mij vaak gedacht: “Stop d’r toch mee kul”, maar het niet tegen me gezegd. Ik ben blij (en ik merk jullie ook) dat ik heb doorgezet:Pa, ma “dagge bedankt zijt dawitte”.
Lieve Tonika en lieve Lisa; jullie zijn zo verschillend van elkaar, tegelijkertijd lijken jullie zo veel op elkaar, want jullie zijn van mij en ik heb jullie lief.
Het laatste woord is natuurlijk gericht aan Goran. “polako, polako ali sigurno”. Liefs, tvoja zena.

Bianca van BaalenBianca van Baalen
About the author
176
About the author

177
About the author
About the author
Bianca van Baalen was born on the 16th of september in 1970 in Bergen op Zoom. After she graduated from secondary school in 1989 at the Mollerlyceum in Bergen op Zoom, she studied higher profession school youth welfare for one year. She started her psychology study at the catholic university of Nijmegen in 1990 and graduated in 1997 in Neuro- and Rehabilitation psychology. In 1998 she started a pilot-study in Rijndam rehabilitation center in Rotterdam in patients with a traumatic brain injury, which in 1999 became the research for this thesis at the Erasmus MC.In one of the inpatient treatment departments of Rijndam rehabilitationcenter, she was co-responsible for the development and implementation of cognitive training, which resulted in the translation of the “step by step”-course (“stap voor stap”-cursus).From 2003 the author works as a clinician in one of the outpatient departments of the Rijndam rehabilitation center and got her registration as a healthcare psychologist in 2004. As a psychologist and casemanager she was involved in the implementation of the programme ‘Vroege Interventie’ as part of the outpatient occupational department. Currently, she is one of the projectmanagers of the developing center of pain rehabilitation (Ontwikkelcentrum Pijn Revalidatie (OPR)) in Rotterdam.
Over de auteur
Bianca van Baalen werd op 16 september 1970 geboren te Bergen op Zoom. Nadat ze in 1989 haar HAVO diploma behaalde aan het Mollerlyceum te Bergen op Zoom heeft zij een jaar HBO-jeugdwelzijnszorg gestudeerd. In 1990 begon ze haar studie psychologie aan de katholieke universiteit in Nijmegen en in 1997 studeerde zij af in de richting Neuro- en Revalidatiepsychologie. In 1998 begon ze een pilot-onderzoek bij patiënten met traumatisch hersenletsel in Rijndam revalidatiecentrum te Rotterdam. In 1999 werd dat pilot-onderzoek dit promotie-onderzoek van het Erasmus MC.Binnen een klinische behandelafdeling van Rijndam revalidatiecentrum is zij medeverant-woordelijk geweest voor het ontwikkelen en implementeren van cognitieve trainingen, met als eindresultaat de vertaling van de “stap voor stap”-cursus.Sinds 2003 werkt zij naast haar promotie als behandelend psycholoog op één van de poli-klinische afdelingen van Rijndam revalidatiecentrum. In 2004 heeft zij haar registratie tot gezondheidszorgpsycholoog behaald. Bianca is als psycholoog en casemanager betrokken geweest bij de implementatie van het programma “Vroege Interventie” als onderdeel van de arbeidspoli van Rijndam revalidatiecentrum. Sinds 2007 is zij één van de projectleiders van het Ontwikkelcentrum Pijn Revalidatie (OPR) te Rotterdam.