Embed Size (px)
Citation preview
Page 1 of 12
National Business Association Operating Plan Forecast Handbook
Page 2 of 12
The National Business Association (NBA) is a not for profit association, specifically designed and actively managed to assist the self-employed and small business community in achieving their professional goals. The NBA uses its group buying power to provide our members with support programs, cost and time saving products, services and valuable small business resource materials. In 1982, the National Business Association (NBA), a non-profit organization for the Self-Employed, Small Business Owners, Entrepreneurs and professionals, was founded. The NBA continuously strives to provide its members with vital support programs, cost and time saving products and services in the areas of Business, Lifestyle, Education, and Health. In addition to the various support programs available to NBA members, the NBA also maintains close working relationships with organizations throughout the nation that assist the Self- Employed and Small Business Community. The NBA's affiliation with the SBA in Washington, D.C., as well as its regional and district offices nationwide is instrumental in the association's success. The NBA is highly supportive of the SBA's major programs, the Association of Small Business Centers (ASBDC) and the Service Corps of Retired Executives (SCORE) chapters. The association assists SCORE offices in various ways, as well as co-sponsoring forums and seminars to provide a means of education and training to the Self-Employed, Small Business Owners and Entrepreneurs everywhere.
The Story of the "Keystone" The keystone, an architectural wonder designed by the Romans, is the one critical or "key" stone in an arch that holds the two sides together. Without the support of the keystone, the arch could not remain standing. The NBA chose the arch with the keystone to represent the NBA's role as the critical or "key" element linking small businesses with support programs, resources, and benefits to ensure personal and professional success. The NBA is striving to be successful in its mission to bring together the small business community and the self-employed in the free enterprise system.
Did the NBA Operating Plan Forecast help you? If so, say so - give us a “Like” on our Facebook page located on our website at
www.nationalbusiness.org
Page 3 of 12
Table of Contents
Description Page
Operating Plan Forecast Overview 4
1St Quarter 6
2nd Quarter 7
3rd Quarter 8
4th Quarter 9
YTD Quarter 10
Notes 11
Helpful Resources 12
NBA Contact Information 12
Page 4 of 12
The NBA Operating Plan Forecast (Profit and Loss Projection) Where to Begin The work of developing the estimates can begin either with sales or with expenses. Most business people find it valuable to begin by estimating expenses first. This way, the user can project break-even points, assess their reasonableness, and determine if projected sales will yield an adequate profit margin. However, if a forecast has not been prepared previously for the firm, and unit cost information is not readily available, some will prefer to estimate the market potential first, in terms of the expected dollar amount of monthly sales. No matter which way the estimates are started, it is important to pay attention to both sales and expenses. Develop a complete estimate of expenses and project a reasonable estimate of sales that are attainable based on the prices and marketing methods to be used. Expenses can be estimated by unit costs. To do so, determine the cost of materials and direct labor required for each unit produced or sold. These costs are part of the variable expenses that include any cost that varies directly with the number of units produced/sold, such as sales commissions, packaging cost, delivery fees, etc. Depending on the number of units to be produced/sold, the resulting variable expense is added to the total fixed expenses – those that go on regardless of the volume of business done, like phones, basic utilities, insurance, interest, depreciation, etc. Based on the above, a selling price can be determined for the unit and an estimate made of the number of units that can be sold at that price. Multiplying the expected sales times the price yields dollar sales volume. Revenue (Sales) - Look at each department of the firm. Determine the number of units of products or services you realistically expected to sell each month in each department at the prices you expect to get. Use this phase of the estimating process to review your pricing practices. Do the selected prices reflect the “best” balance between what customers will pay and the volume of sales to be attained, considering the nature and type of competition? Have all potential markets been considered? What returns and markdowns can be expected? (Final sales estimates should be net of returns and markdowns) Cost of Sales - Estimate the cost of sales for each of the sales categories listed under Revenue (Sales). Where materials (inventory) is involved, do not overlook transportation-in cost. Include any direct labor. Careful development of the cost of materials for each department can be used not only for this Forecast, but also for calculating the firm’s Monthly Cash Flow Projection. The figures also are useful as tools for controlling operations. Evaluating the Estimates - After the estimates have been made and entries totaled, the owner-manager can compare the projected results with the profit goals for the firm. If the Forecast shows that expenses will not be covered, (or even though covered, not enough profit will be left) there is time to plan for the changes. For example, are services or merchandise priced too low? If costs and expenses are not out of line with projected sales volume (compared with industry averages), attention can be given to increasing sales through new promotional efforts or improving merchandising techniques. If interest expense, for example, is out of line, is there any excess equipment, inventory, or other business property that could be disposed of so that indebtedness and interest payments could be reduced with the proceeds? Where the results of the Forecast indicate changes to be made, new estimates are calculated. A Forecast is not rigid. It can be revised as often as necessary to reflect what realistically can be expected in the future. Using the Forecast for Controlling Targets - Once operating expenses have been developed and entered on the Forecast, they can serve as definite targets for controlling business operation. As the actual operating results become known each month they are entered on the Forecast for comparison with the targets.
Page 5 of 12 Evaluating Actual Results - Actual sales, cost of sales, and expense performance can be evaluated against several standards: to the targets for the month; to the operating average for the industry; to last year’s performance. Where actual sales are below target, or actual costs, or expenses, are above target, the owner-manager is able to pinpoint the cause(s). For example, if payroll has been identified as overly large in relation to total sales-- Is time on each job being accurately recorded? Is travel time being properly accounted for? When employee overtime is paid, has the customer been charged? If work was done on a guaranteed-charge basis, does actual time on the job exceed the estimate? Are “fringe” benefits costs being omitted in the estimate? Can labor time be reduced by combining jobs or other changes? This is only one illustration of the value which this management tool can be for controlling the firm’s operation. Further Analysis - Comparative analysis using units of business activity can be of further help in gauging performance trends for better operations, control of sales, cost of sales, and expenses. Perhaps the more profitable departments of the operation suggest expansion possibilities, just as the less productive invite close review. Value of this Forecast An OPF can yield multiple benefits to the small business owner. First, the OPF is a valuable planning tool. Second, when the planning phase has been completed, the OPF becomes a key management tool in controlling the business operations to achieve the results planned for. As a Planning Tool – The OPF enables the owner to develop a “preview” of the amount of profit or loss, which can be expected to be generated each month, for each quarter, and for the business year – based on reasonable predictions of monthly levels of sales, costs, and expenses. By having a “preview” of future operations the owner can compare, ahead of time, the year’s expected profit or loss against profit goals and needs established for the business. If the results as forecasted are not satisfactory, there is time to identify what must be done in order to achieve satisfactory results for the year. As a Control Tool- A completed Forecast enables the owner-manager to compare the figures for the actual results, as they become known, with the estimated or “targets” projected for that month. Where the results are out of line, steps can be taken to correct undesired deviations. By being able to see quickly where the trouble is, less time and money will be lost in getting back on track towards overall profit goals. Limitation Regarding Cash Flow - Valuable as the Forecast is both as a business planning tool and as a management tool for controlling the business, the Forecast does not provide information about cash. Profits and cash are not the same thing. In order to project the firm’s future cash requirements— as well as project the amount of cash it will have available to meet those requirements—it will be necessary to complete a separate schedule specifically designed for that purpose. (See SBA Form 1100, titled “Monthly Cash Flow Projection.”) However, monthly estimates of sales, cost of sales, and expenses, needed for a cash flow projection can be easily obtained from this Forecast once it is completed. Industry “Averages” - In starting the estimating process it may be desirable to enter into the “Industry Percentage” column of the Forecast, the average operating percentages for your industry. These percentages may be obtained from various sources such as Trade Associations, accountants, or banks. Also, the reference librarian in your nearest public library can refer you to appropriate documents containing the percentage figures. Industry “averages” can serve as a useful benchmark against which to compare cost and expense estimates being developed for your firm. Later, they will be useful for comparing the firm’s actual operations. Developing the Estimates - To get the most out of an Operating Plan Forecast, estimates should be developed for each operating element (sales, cost of sales, and expenses) for each month of the firm’s operating year. When a firm’s business cycle covers more than twelve months, or where special factors influencing the firm’s activities will not properly be reflected during that period—example, long term construction projects—the Forecast should be extended for the appropriate additional period.
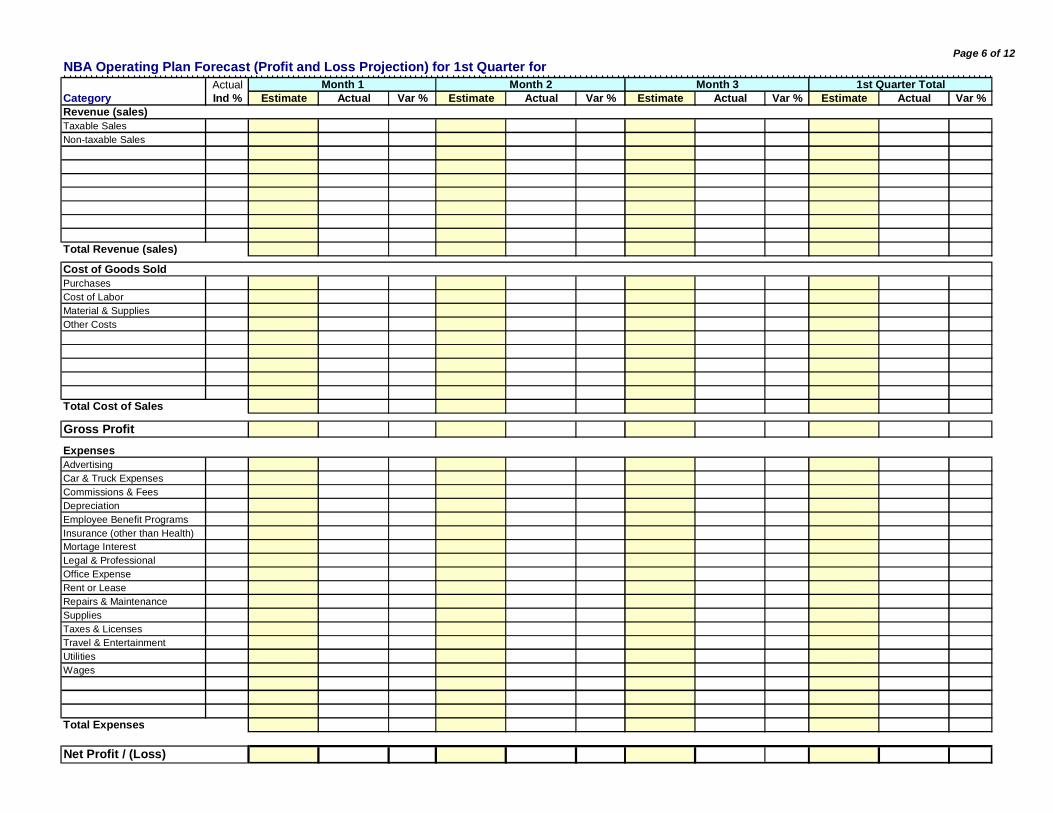
Page 6 of 12 NBA Operating Plan Forecast (Profit and Loss Projection) for 1st Quarter for
ActualCategory Ind % Estimate Actual Var % Estimate Actual Var % Estimate Actual Var % Estimate Actual Var %Revenue (sales)Taxable Sales 0.0% 0.0% 0.0% - - Non-taxable Sales 0.0% 0.0% 0.0% - -
Total Revenue (sales)
Cost of Goods SoldPurchases 0.0% 0.0% - - Cost of Labor 0.0% 0.0% - - Material & Supplies 0.0% 0.0% - - Other Costs 0.0% 0.0% - -
Total Cost of Sales
Gross ProfitExpensesAdvertising 0.0% 0.0% - - Car & Truck Expenses 0.0% 0.0% - - Commissions & Fees 0.0% 0.0% - - Depreciation 0.0% 0.0% - - Employee Benefit Programs 0.0% 0.0% - - Insurance (other than Health) 0.0% 0.0% - - Mortage Interest 0.0% 0.0% - - Legal & Professional 0.0% 0.0% - - Office Expense 0.0% 0.0% - - Rent or Lease 0.0% 0.0% - - Repairs & Maintenance 0.0% 0.0% - - Supplies 0.0% 0.0% - - Taxes & Licenses 0.0% 0.0% - - Travel & Entertainment 0.0% 0.0% - - Utilities 0.0% 0.0% - - Wages 0.0% 0.0% - -
Total Expenses 0.0% 0.0% 0.0%
Net Profit / (Loss)
Month 1 Month 2 Month 3 1st Quarter Total
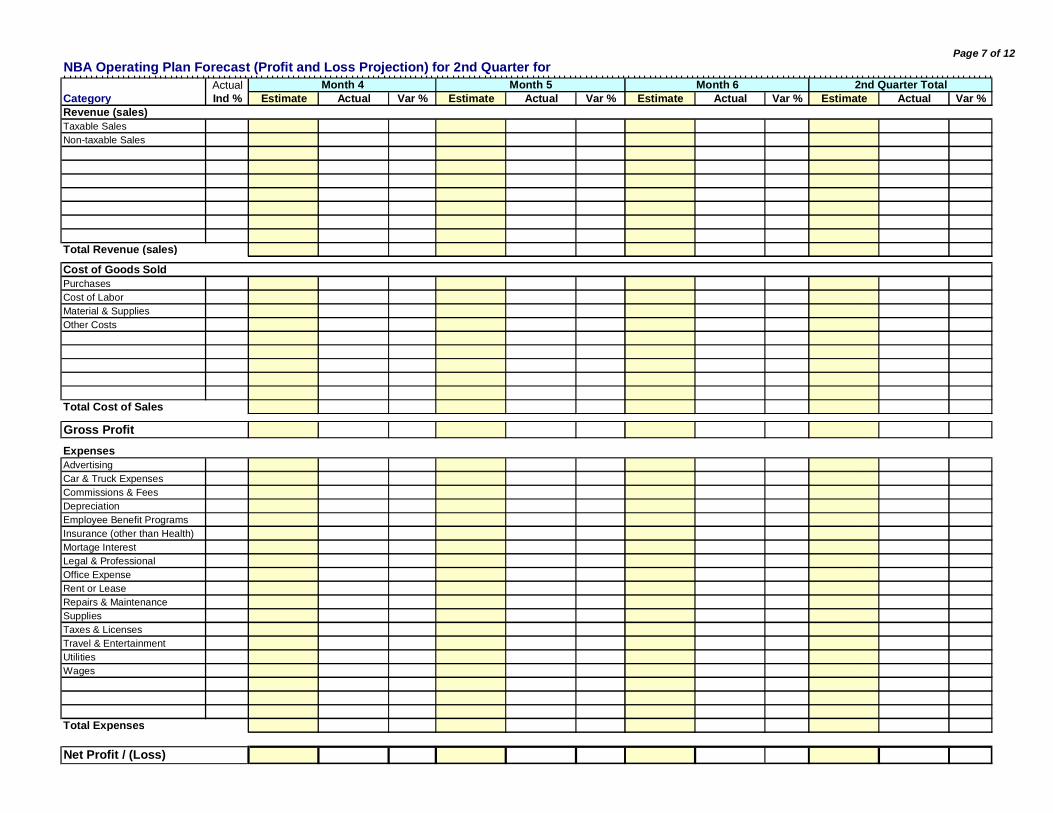
Page 7 of 12 NBA Operating Plan Forecast (Profit and Loss Projection) for 2nd Quarter for
ActualCategory Ind % Estimate Actual Var % Estimate Actual Var % Estimate Actual Var % Estimate Actual Var %Revenue (sales)Taxable Sales 0.0% 0.0% 0.0% - - Non-taxable Sales 0.0% 0.0% 0.0% - -
Total Revenue (sales)
Cost of Goods SoldPurchases 0.0% 0.0% - - Cost of Labor 0.0% 0.0% - - Material & Supplies 0.0% 0.0% - - Other Costs 0.0% 0.0% - -
Total Cost of Sales
Gross ProfitExpensesAdvertising 0.0% 0.0% - - Car & Truck Expenses 0.0% 0.0% - - Commissions & Fees 0.0% 0.0% - - Depreciation 0.0% 0.0% - - Employee Benefit Programs 0.0% 0.0% - - Insurance (other than Health) 0.0% 0.0% - - Mortage Interest 0.0% 0.0% - - Legal & Professional 0.0% 0.0% - - Office Expense 0.0% 0.0% - - Rent or Lease 0.0% 0.0% - - Repairs & Maintenance 0.0% 0.0% - - Supplies 0.0% 0.0% - - Taxes & Licenses 0.0% 0.0% - - Travel & Entertainment 0.0% 0.0% - - Utilities 0.0% 0.0% - - Wages 0.0% 0.0% - -
Total Expenses 0.0% 0.0% 0.0%
Net Profit / (Loss)
Month 4 Month 5 Month 6 2nd Quarter Total
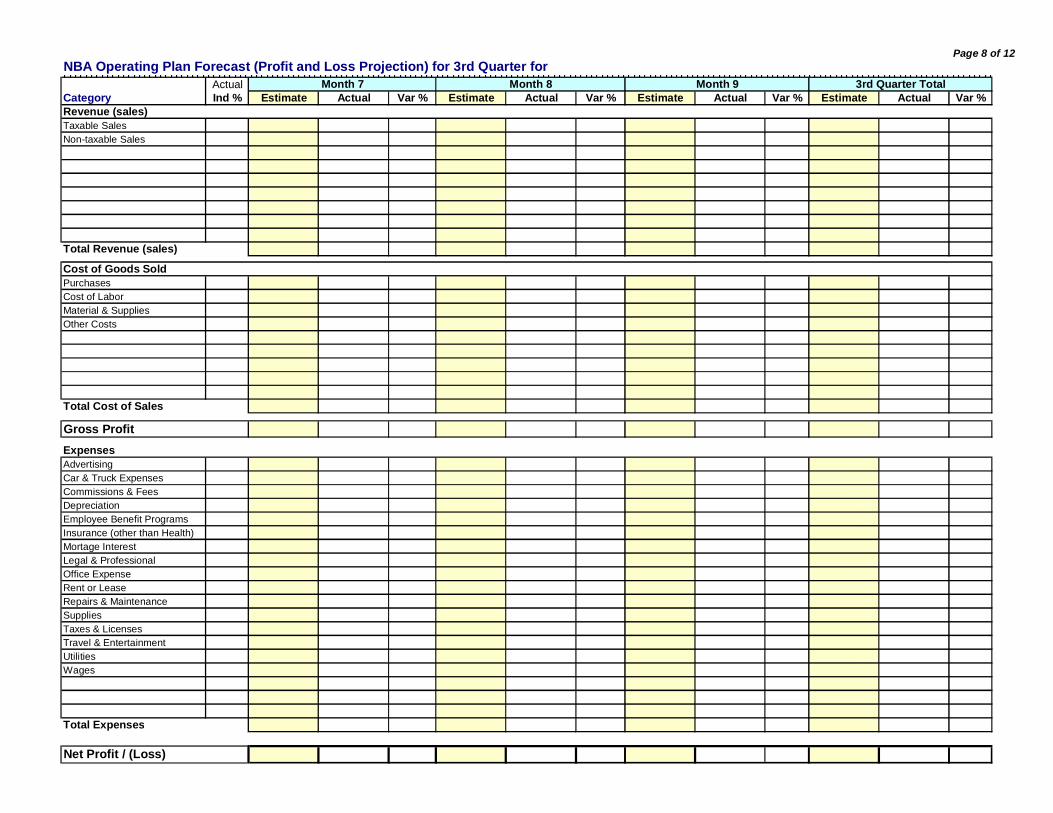
Page 8 of 12 NBA Operating Plan Forecast (Profit and Loss Projection) for 3rd Quarter for
ActualCategory Ind % Estimate Actual Var % Estimate Actual Var % Estimate Actual Var % Estimate Actual Var %Revenue (sales)Taxable Sales 0.0% 0.0% 0.0% - - Non-taxable Sales 0.0% 0.0% 0.0% - -
Total Revenue (sales)
Cost of Goods SoldPurchases 0.0% 0.0% - - Cost of Labor 0.0% 0.0% - - Material & Supplies 0.0% 0.0% - - Other Costs 0.0% 0.0% - -
Total Cost of Sales
Gross ProfitExpensesAdvertising 0.0% 0.0% - - Car & Truck Expenses 0.0% 0.0% - - Commissions & Fees 0.0% 0.0% - - Depreciation 0.0% 0.0% - - Employee Benefit Programs 0.0% 0.0% - - Insurance (other than Health) 0.0% 0.0% - - Mortage Interest 0.0% 0.0% - - Legal & Professional 0.0% 0.0% - - Office Expense 0.0% 0.0% - - Rent or Lease 0.0% 0.0% - - Repairs & Maintenance 0.0% 0.0% - - Supplies 0.0% 0.0% - - Taxes & Licenses 0.0% 0.0% - - Travel & Entertainment 0.0% 0.0% - - Utilities 0.0% 0.0% - - Wages 0.0% 0.0% - -
Total Expenses 0.0% 0.0% 0.0%
Net Profit / (Loss)
Month 7 Month 8 Month 9 3rd Quarter Total

Page 9 of 12
NBA Operating Plan Forecast (Profit and Loss Projection) for 4th Quarter for Actual
Category Ind % Estimate Actual Var % Estimate Actual Var % Estimate Actual Var % Estimate Actual Var %Revenue (sales)Taxable Sales 0.0% 0.0% 0.0% - - Non-taxable Sales 0.0% 0.0% 0.0% - -
Total Revenue (sales)
Cost of Goods SoldPurchases 0.0% 0.0% - - Cost of Labor 0.0% 0.0% - - Material & Supplies 0.0% 0.0% - - Other Costs 0.0% 0.0% - -
Total Cost of Sales
Gross ProfitExpensesAdvertising 0.0% 0.0% - - Car & Truck Expenses 0.0% 0.0% - - Commissions & Fees 0.0% 0.0% - - Depreciation 0.0% 0.0% - - Employee Benefit Programs 0.0% 0.0% - - Insurance (other than Health) 0.0% 0.0% - - Mortage Interest 0.0% 0.0% - - Legal & Professional 0.0% 0.0% - - Office Expense 0.0% 0.0% - - Rent or Lease 0.0% 0.0% - - Repairs & Maintenance 0.0% 0.0% - - Supplies 0.0% 0.0% - - Taxes & Licenses 0.0% 0.0% - - Travel & Entertainment 0.0% 0.0% - - Utilities 0.0% 0.0% - - Wages 0.0% 0.0% - -
Total Expenses 0.0% 0.0% 0.0%
Net Profit / (Loss)
Month 10 Month 11 Month 12 4th Quarter Total

Page 10 of 12
NBA Operating Plan Forecast (Profit and Loss Projection) YTD By Quarter for Actual
Category Ind % Estimate Actual Var % Estimate Actual Var % Estimate Actual Var % Estimate Actual Var %Revenue (sales)Taxable Sales 0.0% - - 0.0% - - 0.0% - - 0.0% - - 0.0%Non-taxable Sales 0.0% - - 0.0% - - 0.0% - - 0.0% - - 0.0%
Total Revenue (sales)
Cost of Goods SoldPurchases 0.0% - - 0.0% - - 0.0% - - 0.0% - - 0.0%Cost of Labor 0.0% - - 0.0% - - 0.0% - - 0.0% - - 0.0%Material & Supplies 0.0% - - 0.0% - - 0.0% - - 0.0% - - 0.0%Other Costs 0.0% - - 0.0% - - 0.0% - - 0.0% - - 0.0%
Total Cost of Sales
Gross ProfitExpensesAdvertising 0.0% - - 0.0% - - 0.0% - - 0.0% - - 0.0%Car & Truck Expenses 0.0% - - 0.0% - - 0.0% - - 0.0% - - 0.0%Commissions & Fees 0.0% - - 0.0% - - 0.0% - - 0.0% - - 0.0%Depreciation 0.0% - - 0.0% - - 0.0% - - 0.0% - - 0.0%Employee Benefit Programs 0.0% - - 0.0% - - 0.0% - - 0.0% - - 0.0%Insurance (other than Health) 0.0% - - 0.0% - - 0.0% - - 0.0% - - 0.0%Mortage Interest 0.0% - - 0.0% - - 0.0% - - 0.0% - - 0.0%Legal & Professional 0.0% - - 0.0% - - 0.0% - - 0.0% - - 0.0%Office Expense 0.0% - - 0.0% - - 0.0% - - 0.0% - - 0.0%Rent or Lease 0.0% - - 0.0% - - 0.0% - - 0.0% - - 0.0%Repairs & Maintenance 0.0% - - 0.0% - - 0.0% - - 0.0% - - 0.0%Supplies 0.0% - - 0.0% - - 0.0% - - 0.0% - - 0.0%Taxes & Licenses 0.0% - - 0.0% - - 0.0% - - 0.0% - - 0.0%Travel & Entertainment 0.0% - - 0.0% - - 0.0% - - 0.0% - - 0.0%Utilities 0.0% - - 0.0% - - 0.0% - - 0.0% - - 0.0%Wages 0.0% - - 0.0% - - 0.0% - - 0.0% - - 0.0%
Total Expenses 0.0% 0.0% 0.0% 0.0%
Net Profit / (Loss)
1st Quarter YTD 2nd Quarter YTD 3rd Quarter YTD 4th Quarter YTD

Page 11 of 12
Notes
______________________________________________________________________
______________________________________________________________________
______________________________________________________________________
______________________________________________________________________
______________________________________________________________________
______________________________________________________________________
______________________________________________________________________
______________________________________________________________________
______________________________________________________________________
______________________________________________________________________
______________________________________________________________________
______________________________________________________________________
______________________________________________________________________
______________________________________________________________________
______________________________________________________________________
______________________________________________________________________
______________________________________________________________________
______________________________________________________________________
______________________________________________________________________
Page 12 of 12
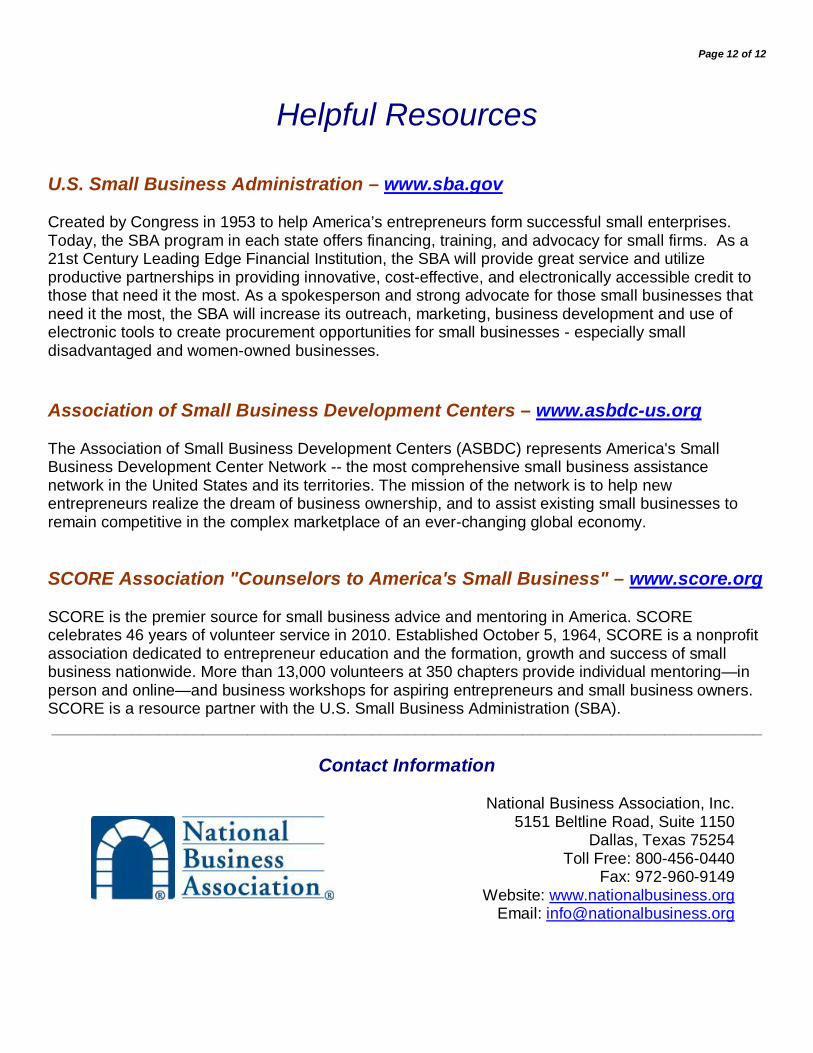
Helpful Resources
U.S. Small Business Administration – www.sba.gov Created by Congress in 1953 to help America’s entrepreneurs form successful small enterprises. Today, the SBA program in each state offers financing, training, and advocacy for small firms. As a 21st Century Leading Edge Financial Institution, the SBA will provide great service and utilize productive partnerships in providing innovative, cost-effective, and electronically accessible credit to those that need it the most. As a spokesperson and strong advocate for those small businesses that need it the most, the SBA will increase its outreach, marketing, business development and use of electronic tools to create procurement opportunities for small businesses - especially small disadvantaged and women-owned businesses. Association of Small Business Development Centers – www.asbdc-us.org The Association of Small Business Development Centers (ASBDC) represents America's Small Business Development Center Network -- the most comprehensive small business assistance network in the United States and its territories. The mission of the network is to help new entrepreneurs realize the dream of business ownership, and to assist existing small businesses to remain competitive in the complex marketplace of an ever-changing global economy. SCORE Association "Counselors to America's Small Business" – www.score.org SCORE is the premier source for small business advice and mentoring in America. SCORE celebrates 46 years of volunteer service in 2010. Established October 5, 1964, SCORE is a nonprofit association dedicated to entrepreneur education and the formation, growth and success of small business nationwide. More than 13,000 volunteers at 350 chapters provide individual mentoring—in person and online—and business workshops for aspiring entrepreneurs and small business owners. SCORE is a resource partner with the U.S. Small Business Administration (SBA). ________________________________________________________________________________
Contact Information
National Business Association, Inc.
5151 Beltline Road, Suite 1150 Dallas, Texas 75254
Toll Free: 800-456-0440 Fax: 972-960-9149
Website: www.nationalbusiness.org Email: [email protected]
![Download or print gazette [PDF, 978KB]](https://img.pdfslide.net/doc/110x75/586a213b1a28ab917d8bd251/download-or-print-gazette-pdf-978kb.jpg)


![Download or print gazette [PDF, 2.2MB]](https://img.pdfslide.net/doc/110x75/589c5d1f1a28abe0498b8911/download-or-print-gazette-pdf-22mb.jpg)

![Download or print gazette [PDF, 1.5MB]](https://img.pdfslide.net/doc/110x75/58676d241a28ab63408ba67f/download-or-print-gazette-pdf-15mb.jpg)


![Download or print gazette [PDF, 3.3MB]](https://img.pdfslide.net/doc/110x75/5866e3011a28abb9408b8cbf/download-or-print-gazette-pdf-33mb.jpg)

![Download or print gazette [PDF, 3.2MB]](https://img.pdfslide.net/doc/110x75/5868cc681a28ab5e1c8b664f/download-or-print-gazette-pdf-32mb.jpg)
![Download or print gazette [PDF, 858KB]](https://img.pdfslide.net/doc/110x75/589ec6c31a28ab724a8bdc17/download-or-print-gazette-pdf-858kb.jpg)

![Download or print gazette [PDF, 2.1MB]](https://img.pdfslide.net/doc/110x75/588c7f5e1a28ab78218ba193/download-or-print-gazette-pdf-21mb.jpg)

![Download or print gazette [PDF, 2.0MB]](https://img.pdfslide.net/doc/110x75/622f9f5747b17a4f0545e963/download-or-print-gazette-pdf-20mb.jpg)

![Download or print gazette [PDF, 1.7MB]](https://img.pdfslide.net/doc/110x75/5868e7281a28ab27408c30a5/download-or-print-gazette-pdf-17mb.jpg)