Embed Size (px)
Citation preview
DOWNTOWN REVITALIZATION & ECONOMIC ASSISTANCE FOR MISSOURI
Sikeston, Missouri
OCTOBER 2009
VISITOR SURVEY REPORT FINAL SURVEY FINDINGS
AND RESULTS

DOWNTOWN REVITALIZATION & ECONOMIC ASSISTANCE FOR MISSOURI
Sikeston, Missouri
OCTOBER 2009
ACKNOWLEDGMENTS
DOWNTOWN REVITALIZATION AND ECONOMIC ASSISTANCE FOR MISSOURI (DREAM)
PROGRAM SPONSORS:
PLANNING CONSULTANT
This Page Intentionally Left Blank
Downtown Revitalization and Economic Assistance for Missouri Visitor Survey Report Final Survey Findings and Results
October 2009 UNICOM-ARC 82131-03 - i -
Sikeston, Missouri
TABLE OF CONTENTS
SECTION PAGE
I. EXECUTIVE SUMMARY .................................................................................................. 1 A. Visiting Downtown Sikeston ....................................................................................... 1
B. Activities On This Visit To Downtown ......................................................................... 1 C. Using Downtown Sikeston ......................................................................................... 2
D. Additions And Improvements To Downtown Sikeston ................................................. 2 E. Respondent Profile ................................................................................................... 3 II. OVERVIEW OF DATA .................................................................................................... 5 III. RESPONSES TO OPEN-ENDED QUESTIONS ............................................................... 17 IV. VISITOR BAR CHARTS .................................................................................................. 19 V. QUESTIONNAIRE........................................................................................................ 37
VI. CROSS TABULATION .................................................................................................. 41
Downtown Revitalization and Economic Assistance for Missouri Visitor Survey Report Final Survey Findings and Results
October 2009 UNICOM-ARC 82131-03 - ii -
Sikeston, Missouri
This Page Intentionally Left Blank
Downtown Revitalization and Economic Assistance for Missouri Visitor Survey Report Final Survey Findings and Results
October 2009 UNICOM-ARC 82131-03 - 1 -
Sikeston, Missouri
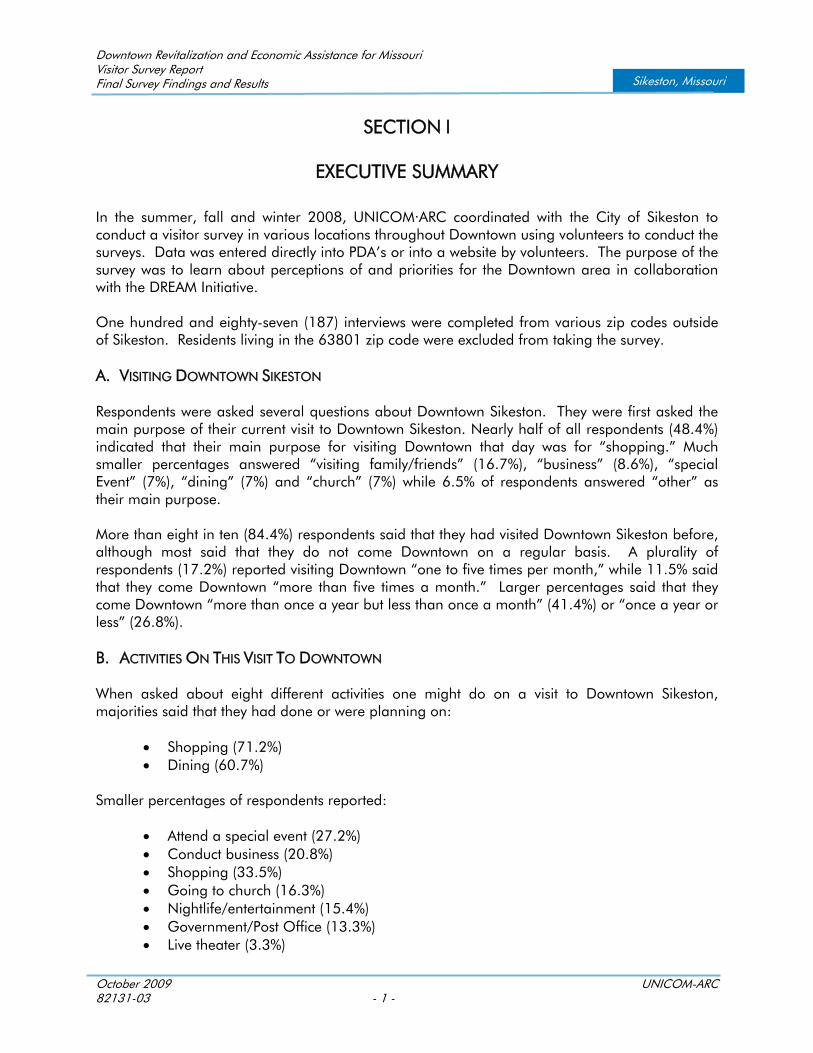
SECTION I
EXECUTIVE SUMMARY
In the summer, fall and winter 2008, UNICOM·ARC coordinated with the City of Sikeston to conduct a visitor survey in various locations throughout Downtown using volunteers to conduct the surveys. Data was entered directly into PDA’s or into a website by volunteers. The purpose of the survey was to learn about perceptions of and priorities for the Downtown area in collaboration with the DREAM Initiative. One hundred and eighty-seven (187) interviews were completed from various zip codes outside of Sikeston. Residents living in the 63801 zip code were excluded from taking the survey. A. VISITING DOWNTOWN SIKESTON
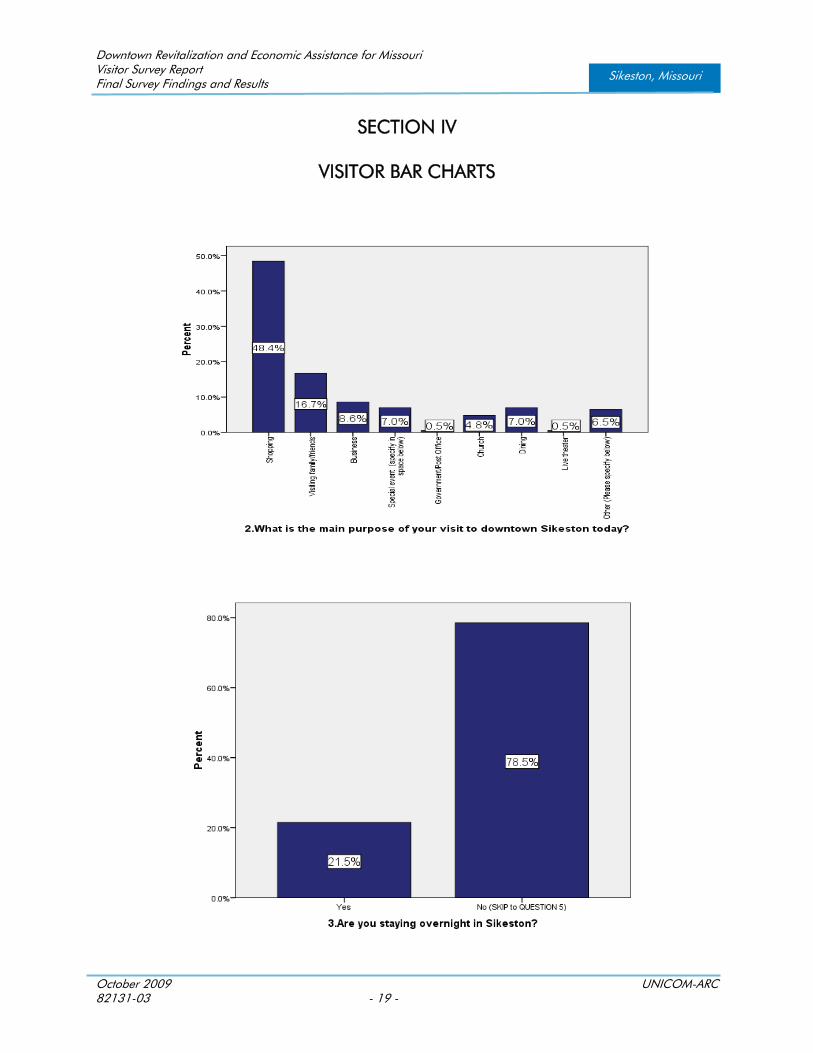
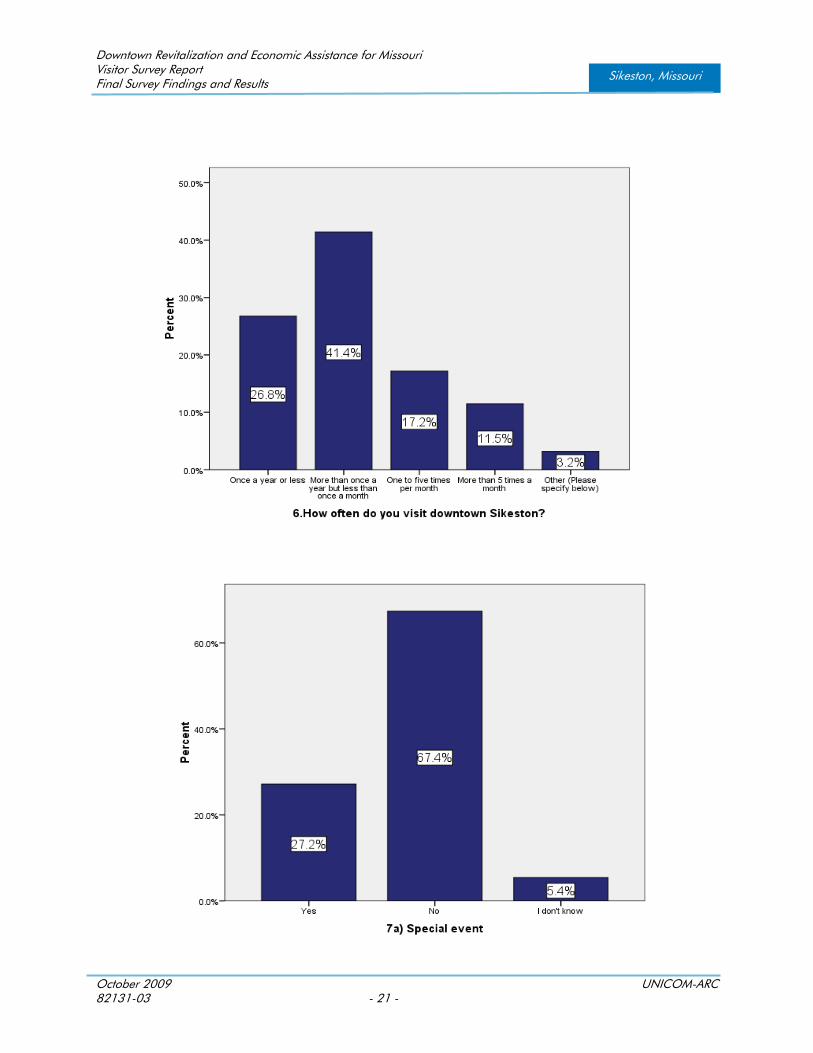
Respondents were asked several questions about Downtown Sikeston. They were first asked the main purpose of their current visit to Downtown Sikeston. Nearly half of all respondents (48.4%) indicated that their main purpose for visiting Downtown that day was for “shopping.” Much smaller percentages answered “visiting family/friends” (16.7%), “business” (8.6%), “special Event” (7%), “dining” (7%) and “church” (7%) while 6.5% of respondents answered “other” as their main purpose. More than eight in ten (84.4%) respondents said that they had visited Downtown Sikeston before, although most said that they do not come Downtown on a regular basis. A plurality of respondents (17.2%) reported visiting Downtown “one to five times per month,” while 11.5% said that they come Downtown “more than five times a month.” Larger percentages said that they come Downtown “more than once a year but less than once a month” (41.4%) or “once a year or less” (26.8%). B. ACTIVITIES ON THIS VISIT TO DOWNTOWN
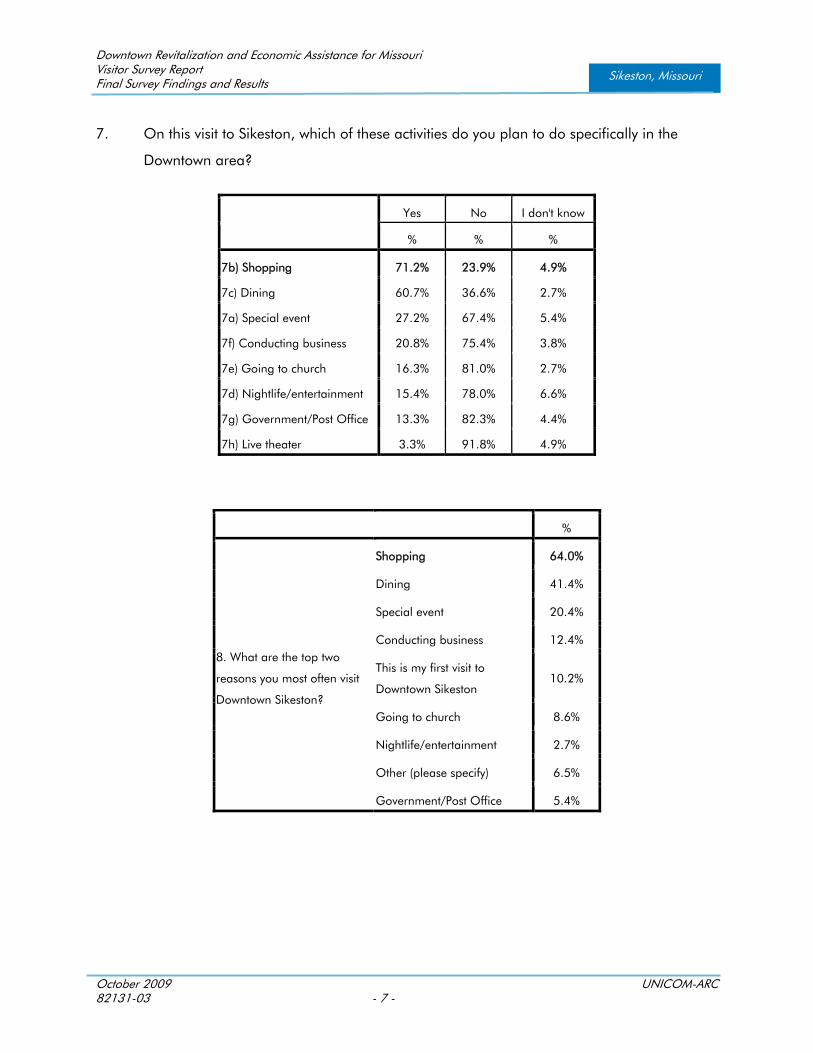
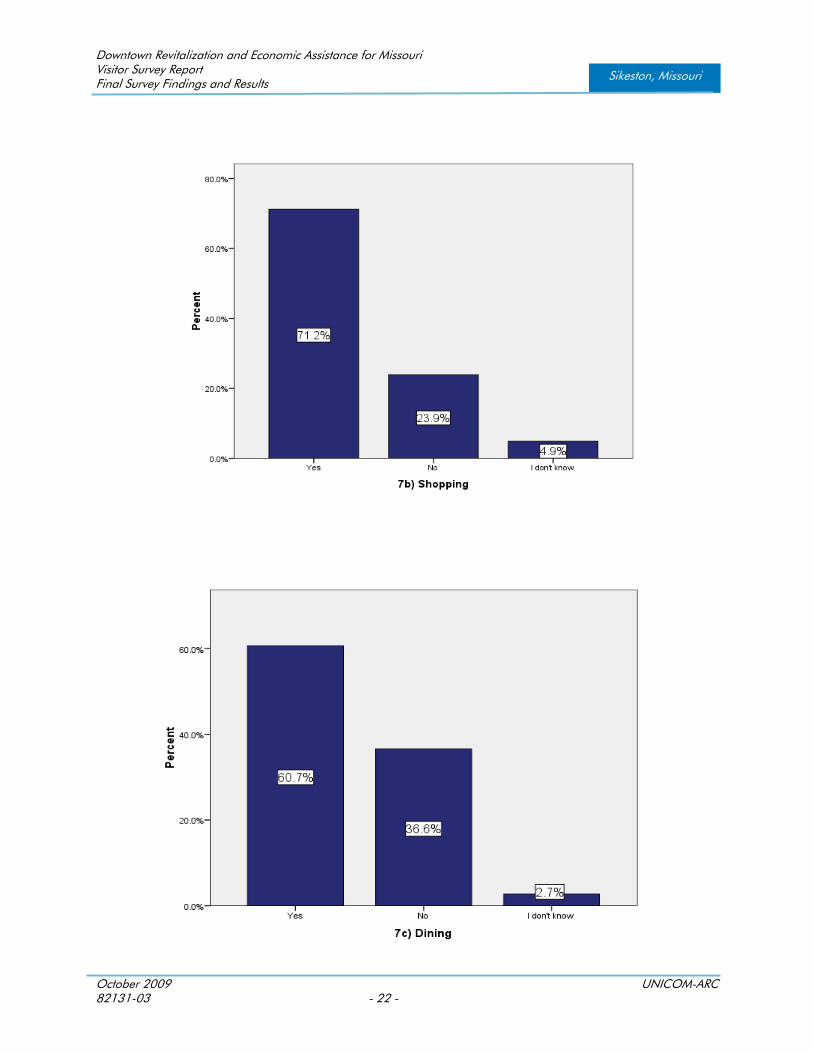
When asked about eight different activities one might do on a visit to Downtown Sikeston, majorities said that they had done or were planning on:
Shopping (71.2%) Dining (60.7%)
Smaller percentages of respondents reported:
Attend a special event (27.2%) Conduct business (20.8%) Shopping (33.5%) Going to church (16.3%) Nightlife/entertainment (15.4%) Government/Post Office (13.3%) Live theater (3.3%)
Downtown Revitalization and Economic Assistance for Missouri Visitor Survey Report Final Survey Findings and Results
October 2009 UNICOM-ARC 82131-03 - 2 -
Sikeston, Missouri
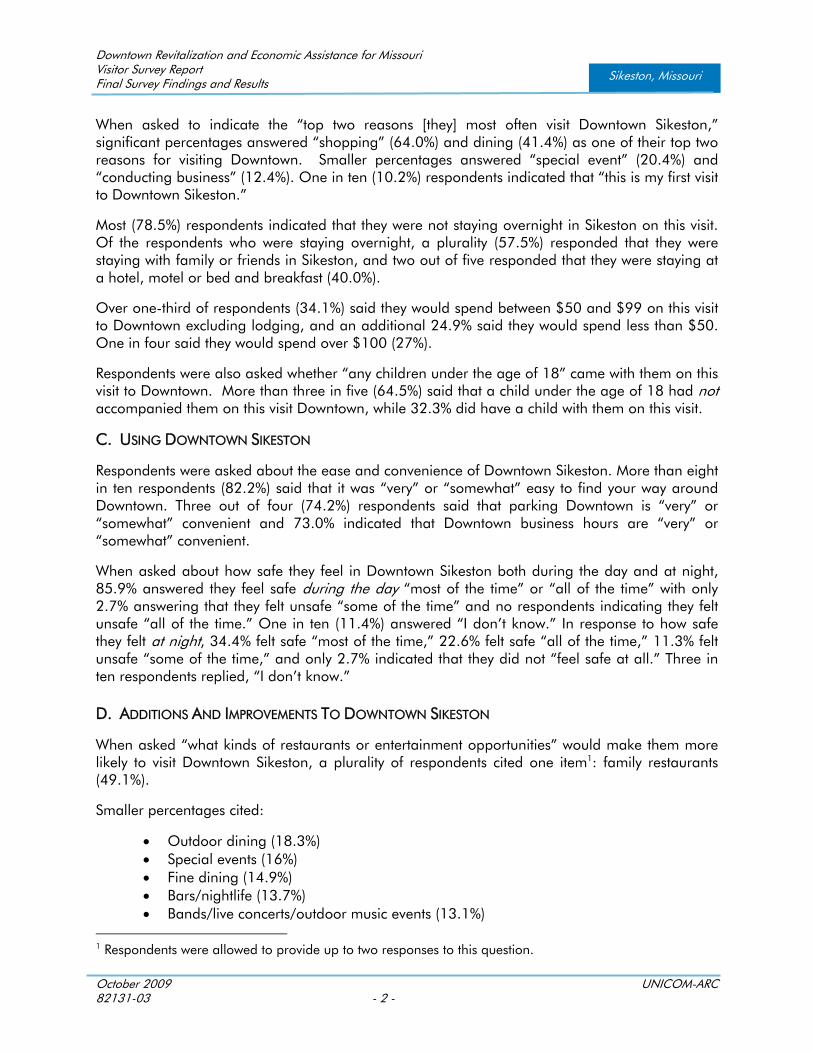
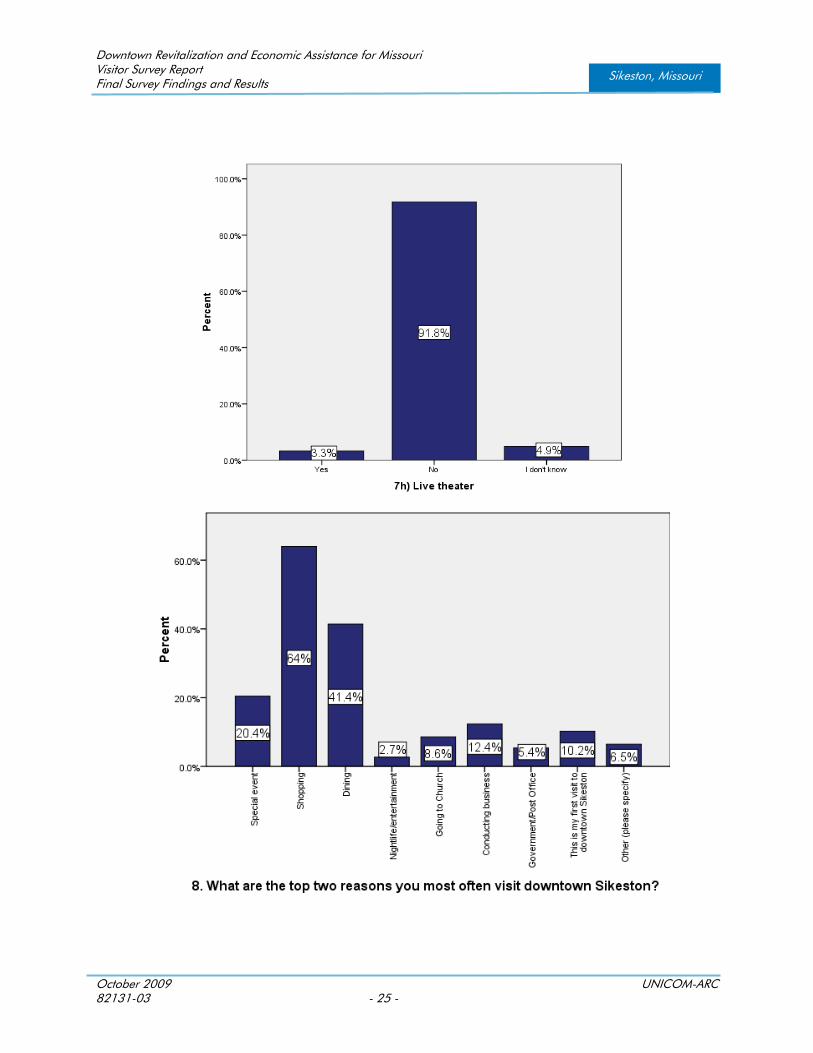
When asked to indicate the “top two reasons [they] most often visit Downtown Sikeston,” significant percentages answered “shopping” (64.0%) and dining (41.4%) as one of their top two reasons for visiting Downtown. Smaller percentages answered “special event” (20.4%) and “conducting business” (12.4%). One in ten (10.2%) respondents indicated that “this is my first visit to Downtown Sikeston.”
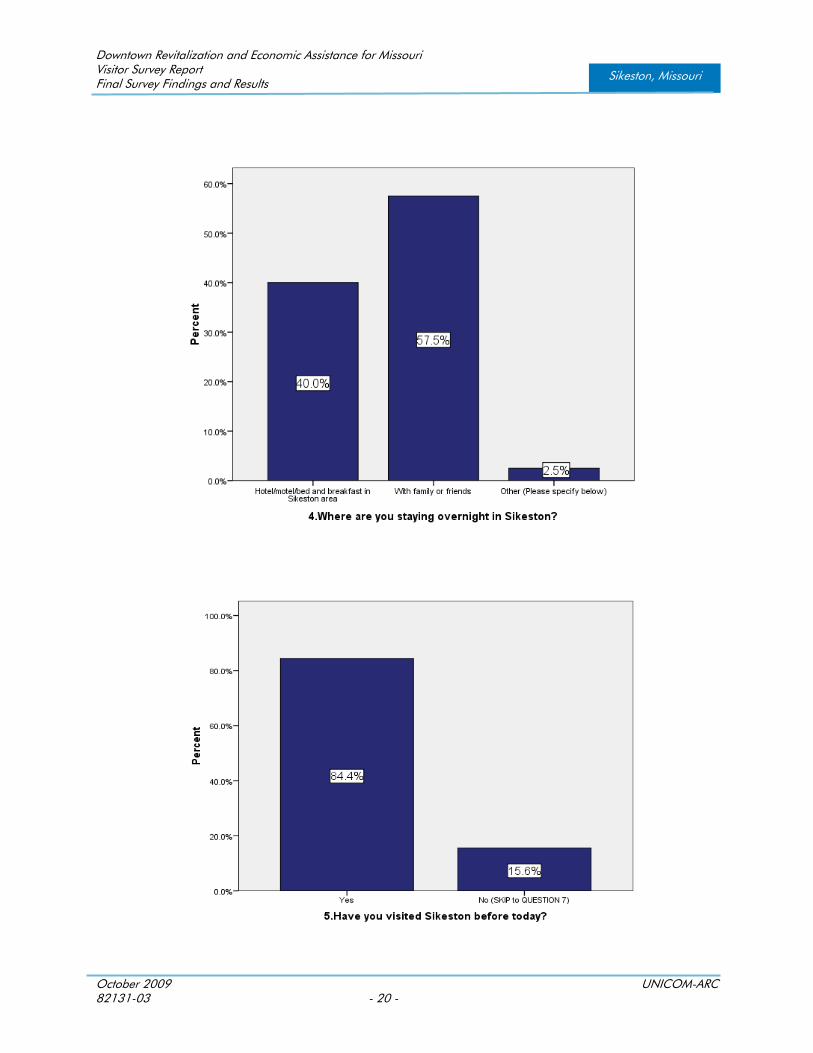
Most (78.5%) respondents indicated that they were not staying overnight in Sikeston on this visit. Of the respondents who were staying overnight, a plurality (57.5%) responded that they were staying with family or friends in Sikeston, and two out of five responded that they were staying at a hotel, motel or bed and breakfast (40.0%).
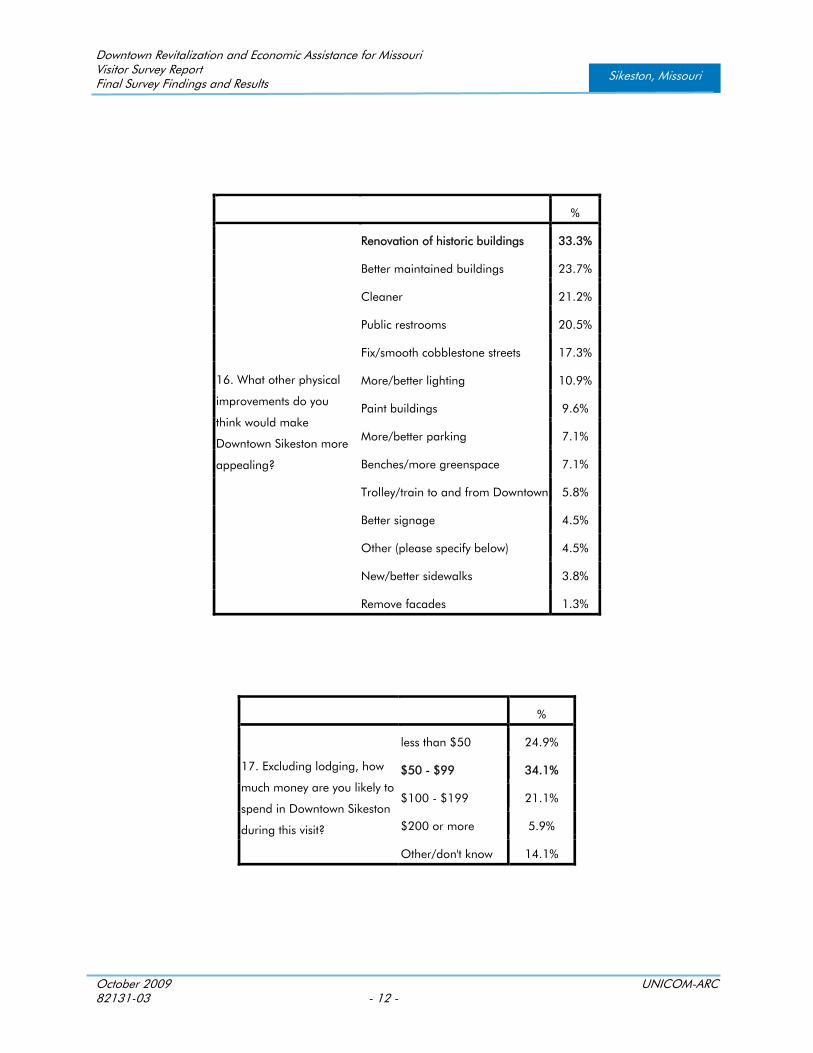
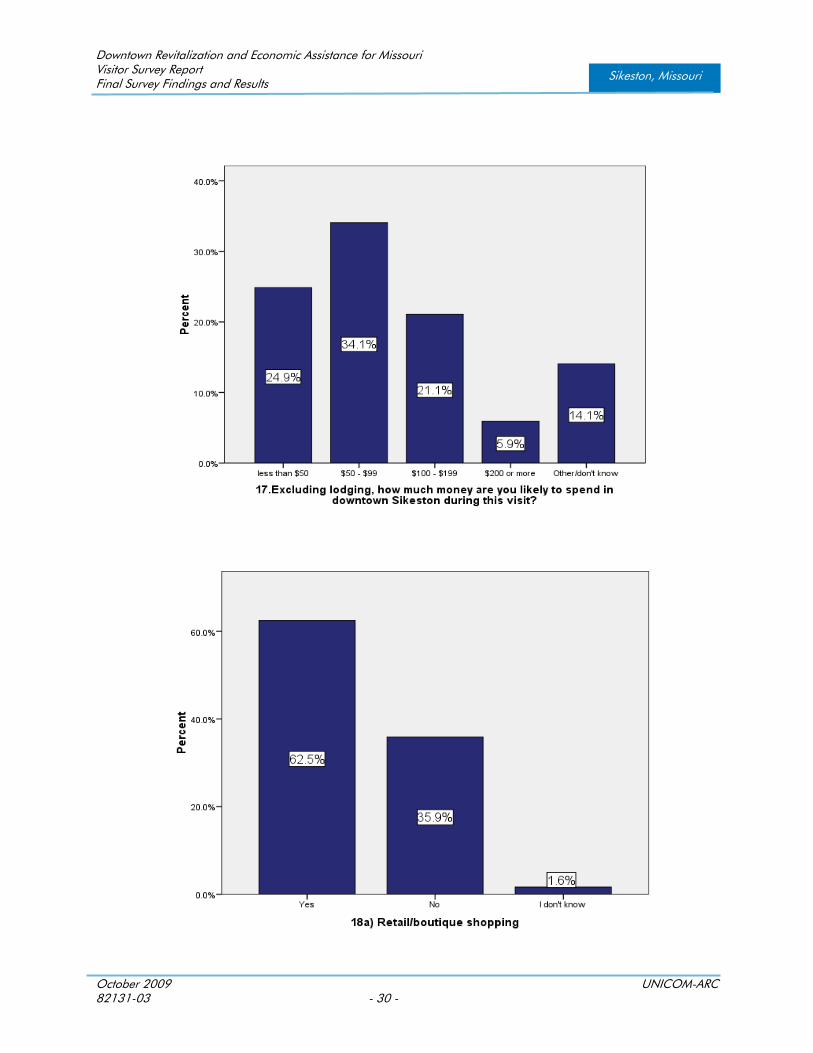
Over one-third of respondents (34.1%) said they would spend between $50 and $99 on this visit to Downtown excluding lodging, and an additional 24.9% said they would spend less than $50. One in four said they would spend over $100 (27%).
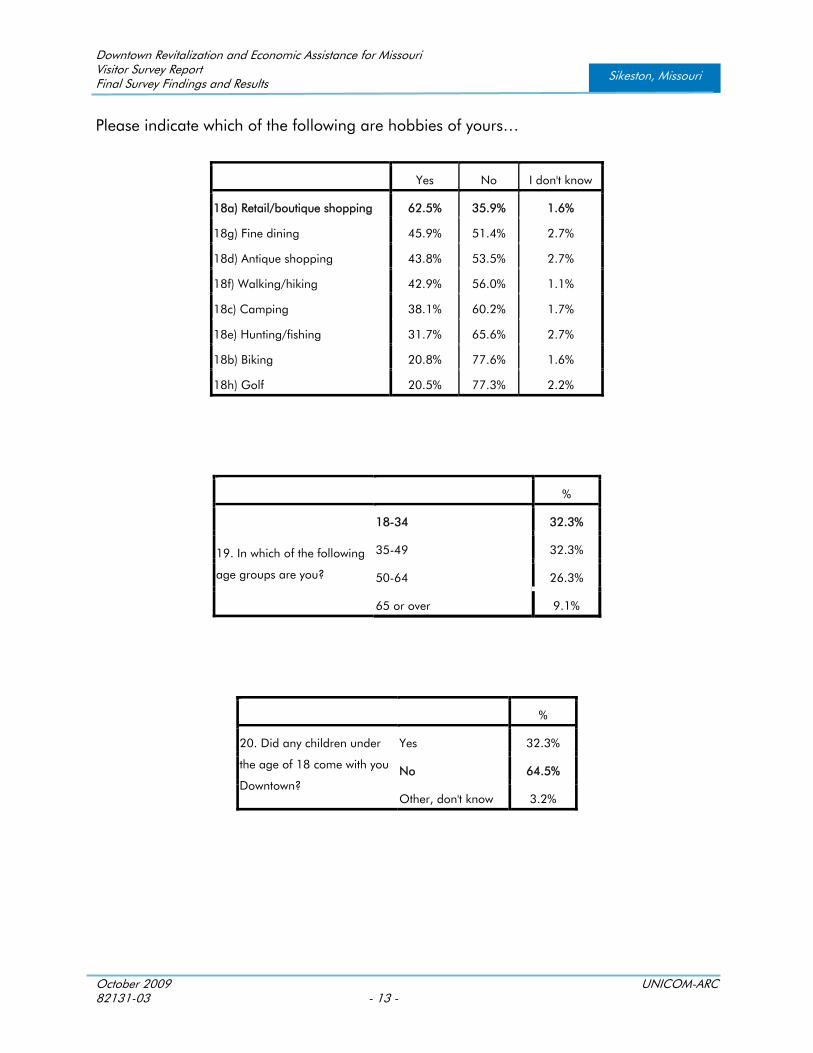
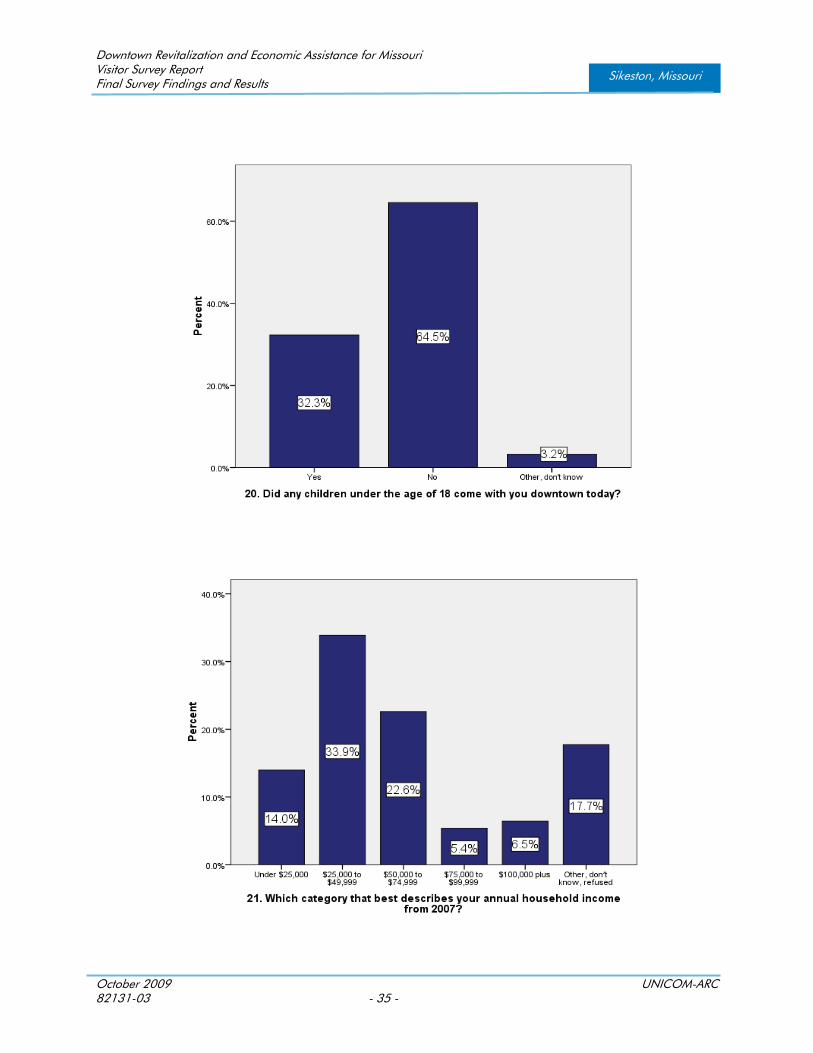
Respondents were also asked whether “any children under the age of 18” came with them on this visit to Downtown. More than three in five (64.5%) said that a child under the age of 18 had not accompanied them on this visit Downtown, while 32.3% did have a child with them on this visit.
C. USING DOWNTOWN SIKESTON
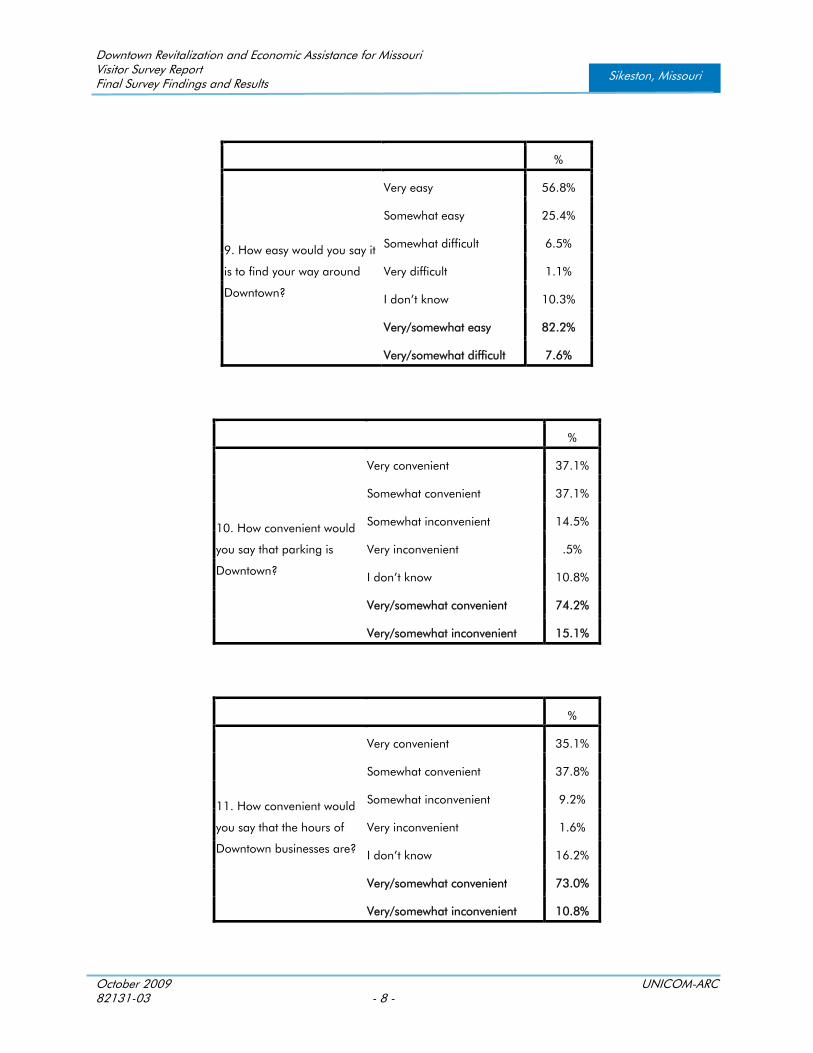
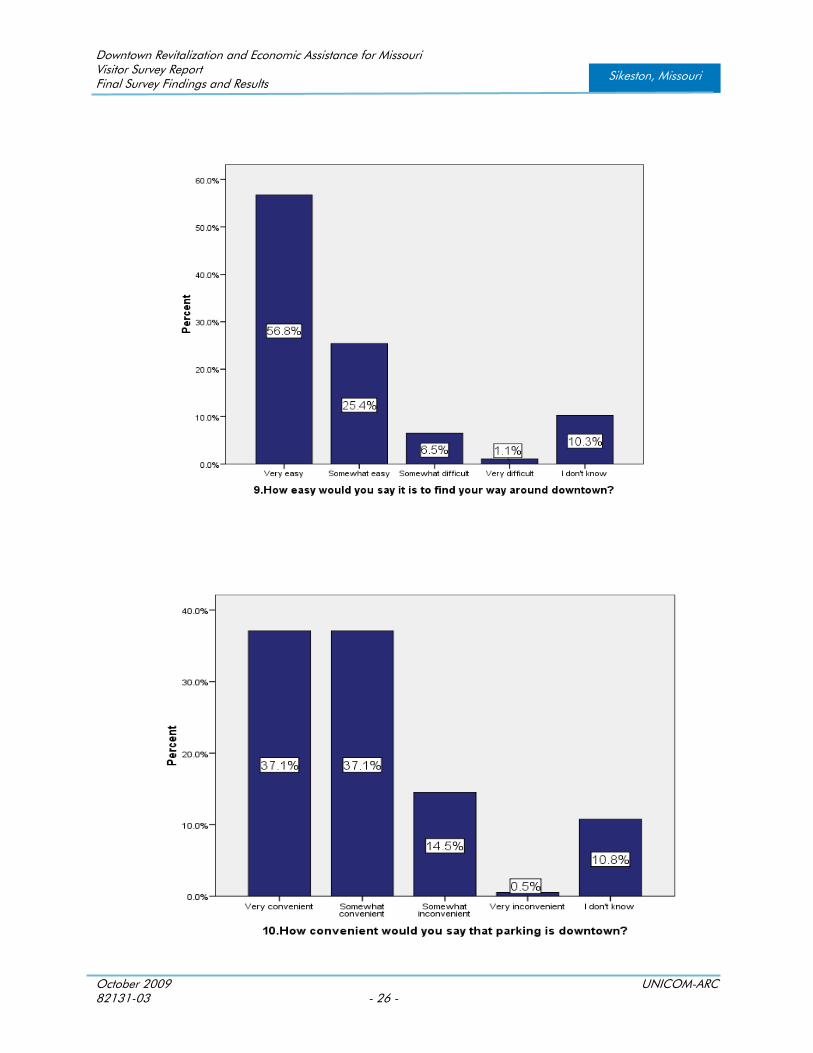
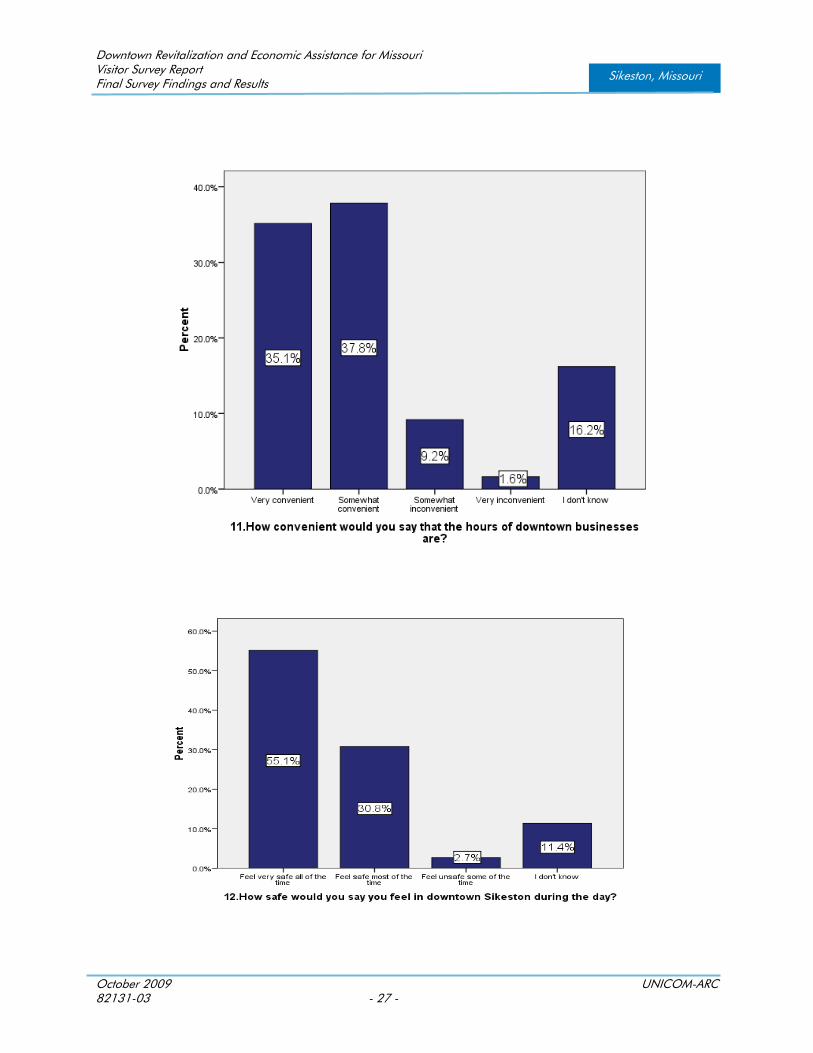
Respondents were asked about the ease and convenience of Downtown Sikeston. More than eight in ten respondents (82.2%) said that it was “very” or “somewhat” easy to find your way around Downtown. Three out of four (74.2%) respondents said that parking Downtown is “very” or “somewhat” convenient and 73.0% indicated that Downtown business hours are “very” or “somewhat” convenient.
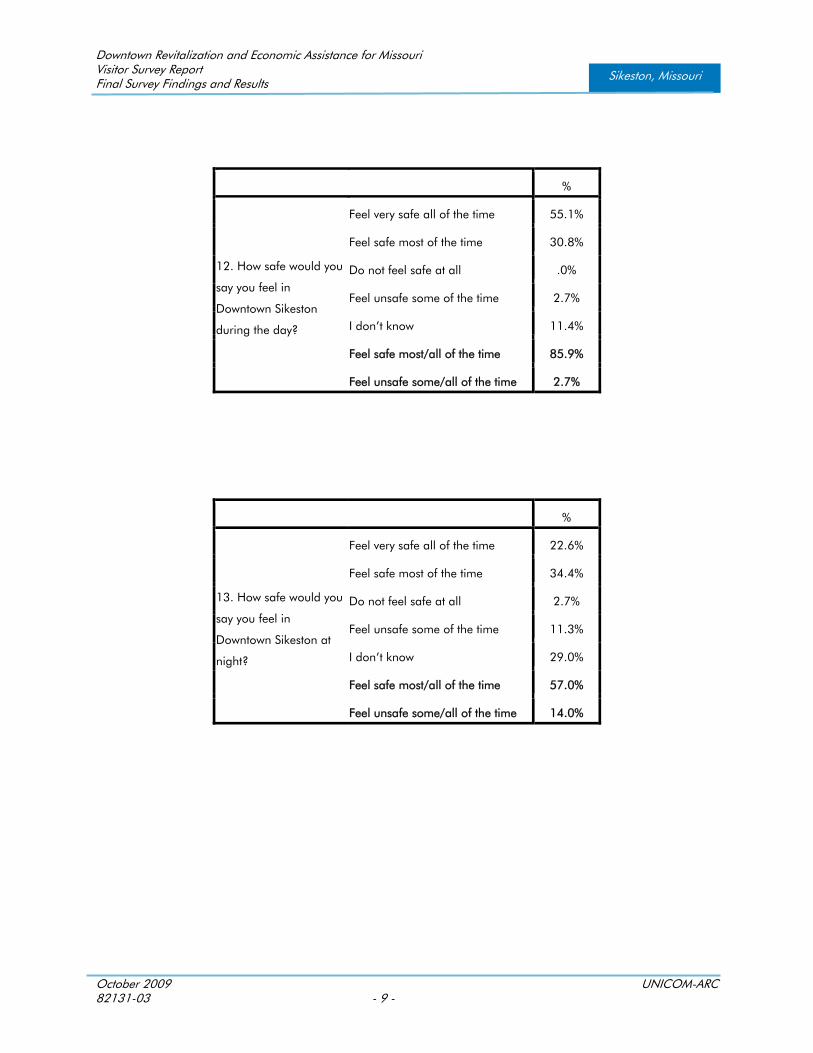
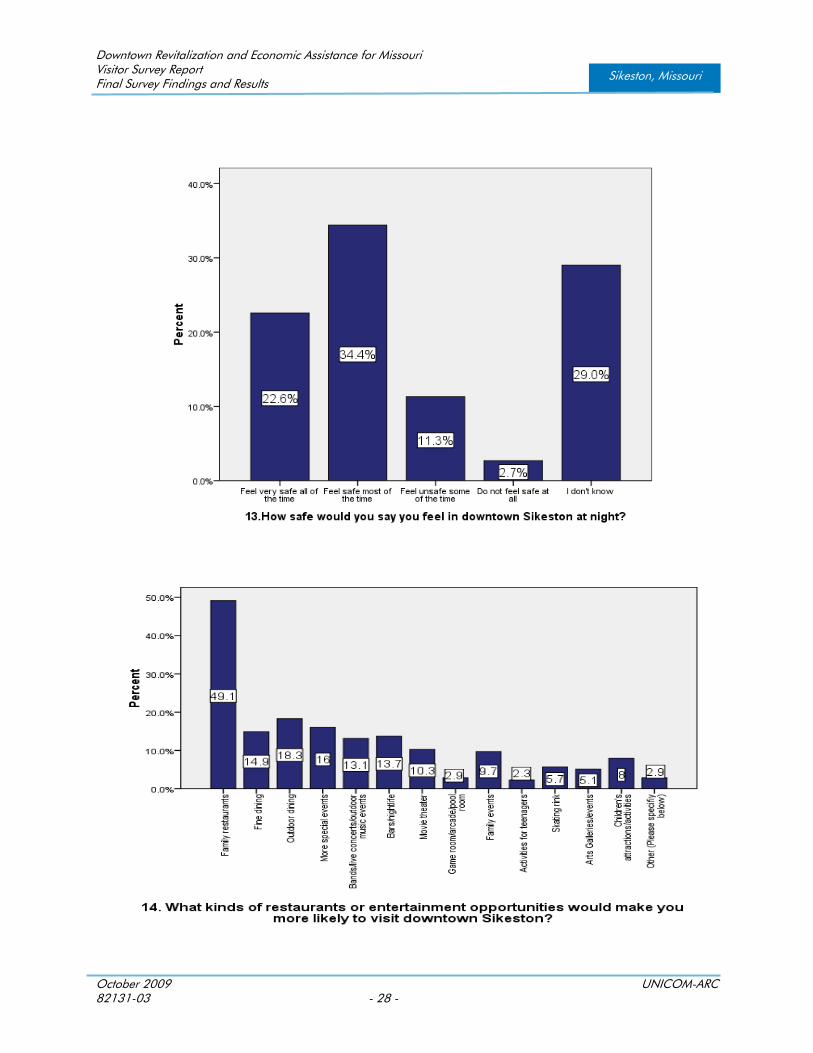
When asked about how safe they feel in Downtown Sikeston both during the day and at night, 85.9% answered they feel safe during the day “most of the time” or “all of the time” with only 2.7% answering that they felt unsafe “some of the time” and no respondents indicating they felt unsafe “all of the time.” One in ten (11.4%) answered “I don’t know.” In response to how safe they felt at night, 34.4% felt safe “most of the time,” 22.6% felt safe “all of the time,” 11.3% felt unsafe “some of the time,” and only 2.7% indicated that they did not “feel safe at all.” Three in ten respondents replied, “I don’t know.” D. ADDITIONS AND IMPROVEMENTS TO DOWNTOWN SIKESTON
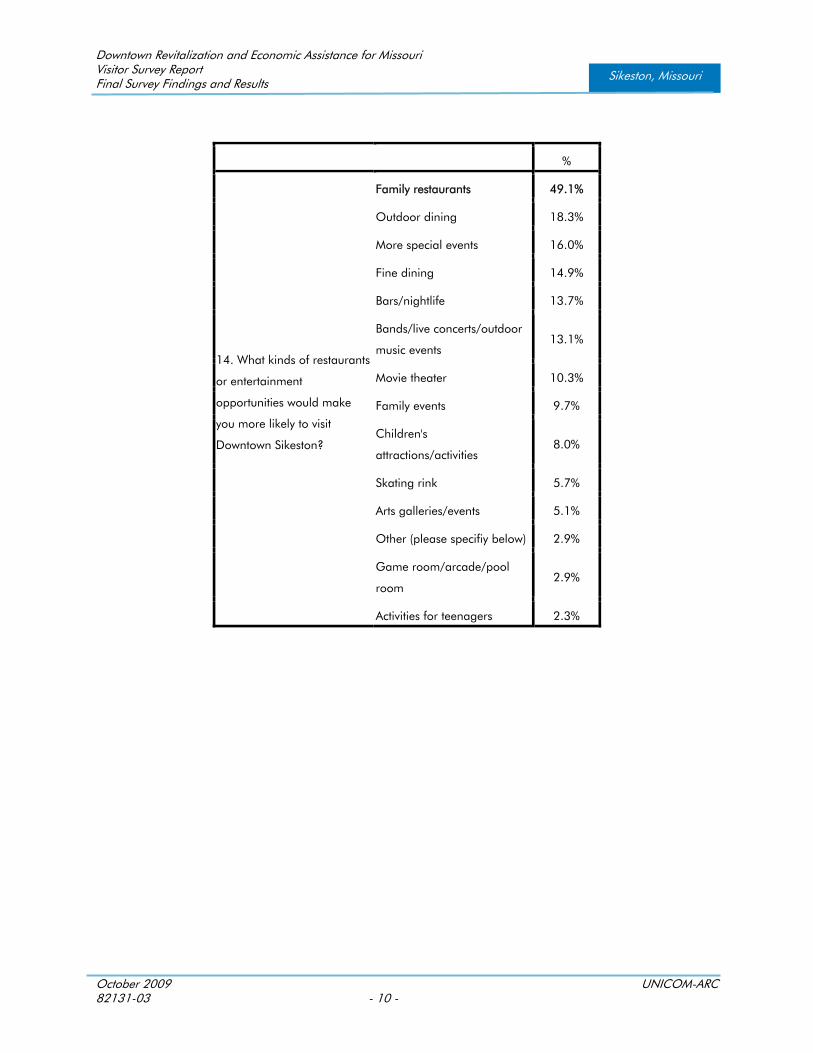
When asked “what kinds of restaurants or entertainment opportunities” would make them more likely to visit Downtown Sikeston, a plurality of respondents cited one item1: family restaurants (49.1%).
Smaller percentages cited:
Outdoor dining (18.3%) Special events (16%) Fine dining (14.9%) Bars/nightlife (13.7%) Bands/live concerts/outdoor music events (13.1%)
1 Respondents were allowed to provide up to two responses to this question.
Downtown Revitalization and Economic Assistance for Missouri Visitor Survey Report Final Survey Findings and Results
October 2009 UNICOM-ARC 82131-03 - 3 -
Sikeston, Missouri
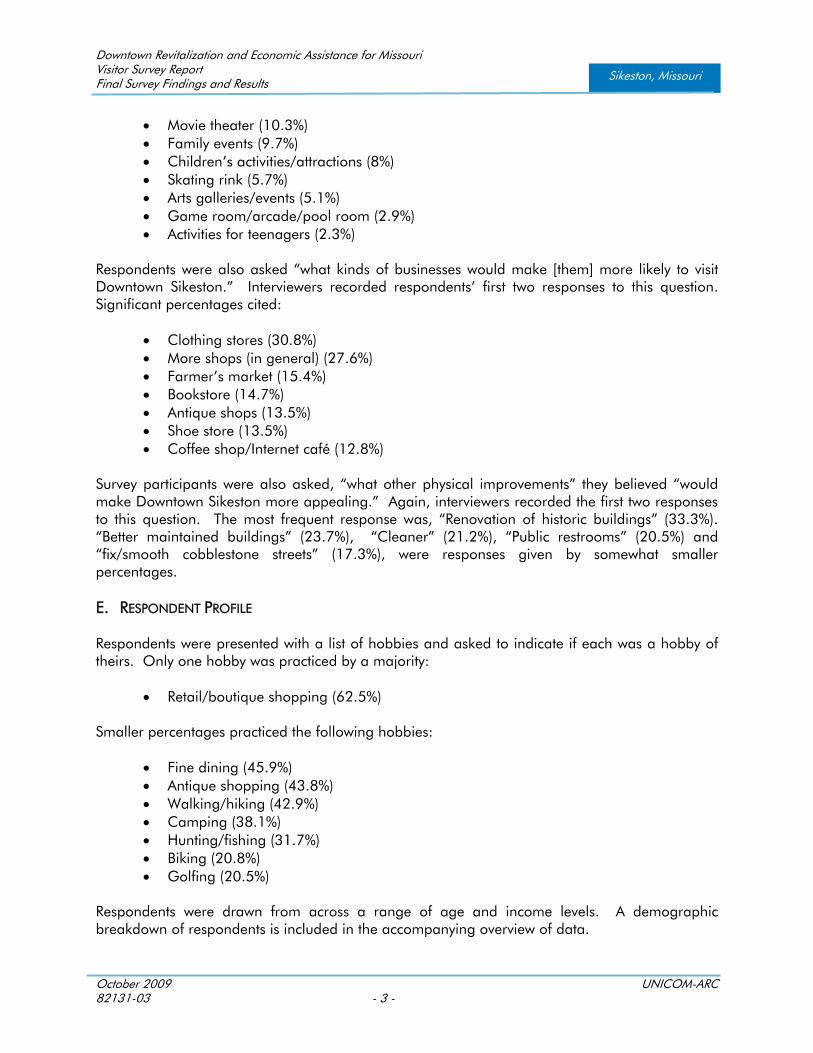
Movie theater (10.3%) Family events (9.7%) Children’s activities/attractions (8%) Skating rink (5.7%) Arts galleries/events (5.1%) Game room/arcade/pool room (2.9%) Activities for teenagers (2.3%)
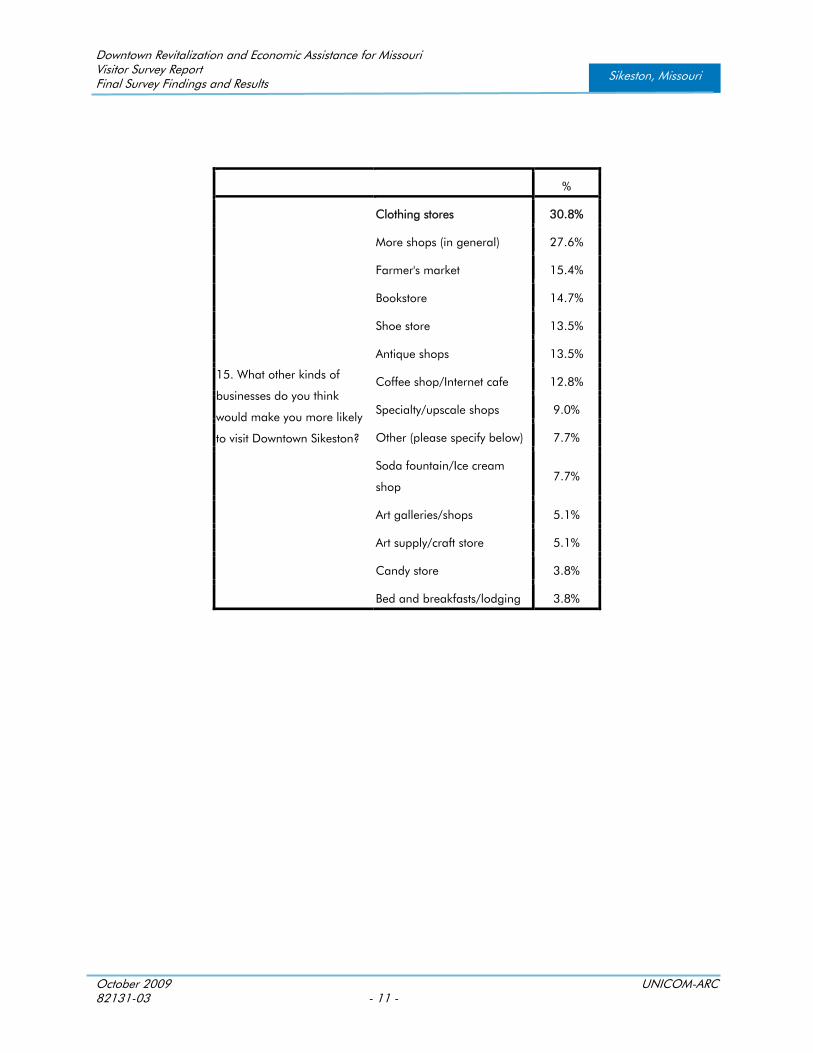
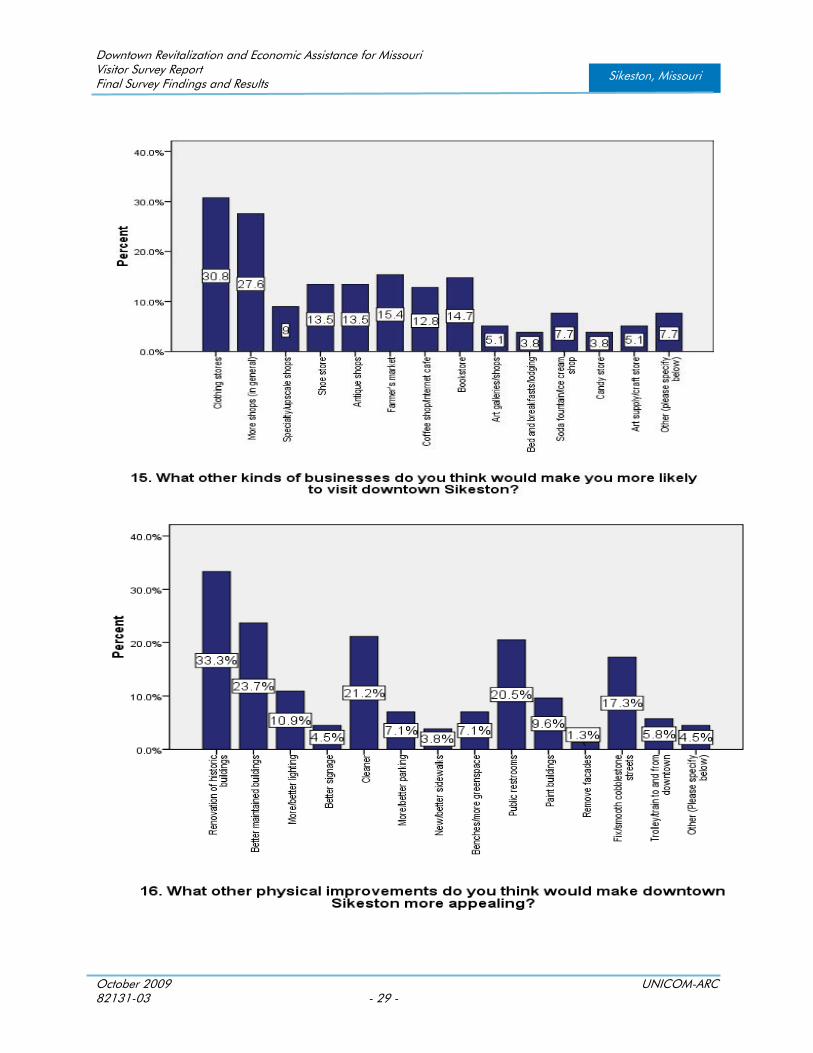
Respondents were also asked “what kinds of businesses would make [them] more likely to visit Downtown Sikeston.” Interviewers recorded respondents’ first two responses to this question. Significant percentages cited:
Clothing stores (30.8%) More shops (in general) (27.6%) Farmer’s market (15.4%) Bookstore (14.7%) Antique shops (13.5%) Shoe store (13.5%) Coffee shop/Internet café (12.8%)
Survey participants were also asked, “what other physical improvements” they believed “would make Downtown Sikeston more appealing.” Again, interviewers recorded the first two responses to this question. The most frequent response was, “Renovation of historic buildings” (33.3%). “Better maintained buildings” (23.7%), “Cleaner” (21.2%), “Public restrooms” (20.5%) and “fix/smooth cobblestone streets” (17.3%), were responses given by somewhat smaller percentages. E. RESPONDENT PROFILE
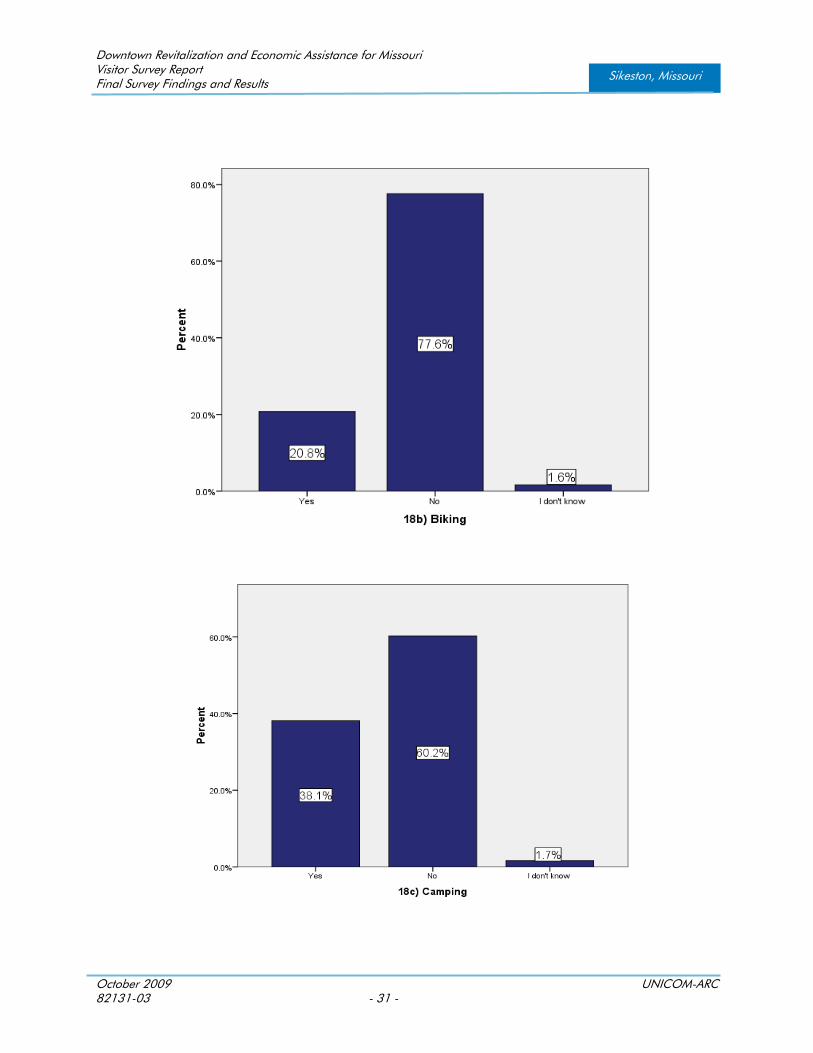
Respondents were presented with a list of hobbies and asked to indicate if each was a hobby of theirs. Only one hobby was practiced by a majority:
Retail/boutique shopping (62.5%) Smaller percentages practiced the following hobbies:
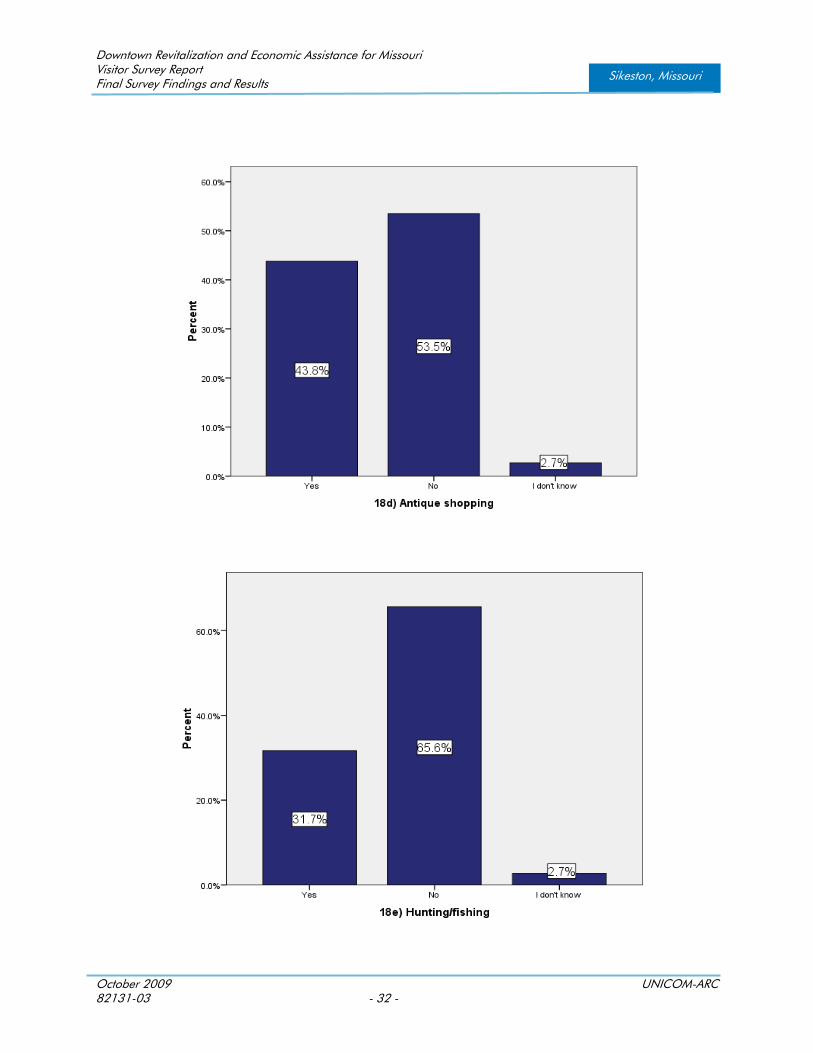
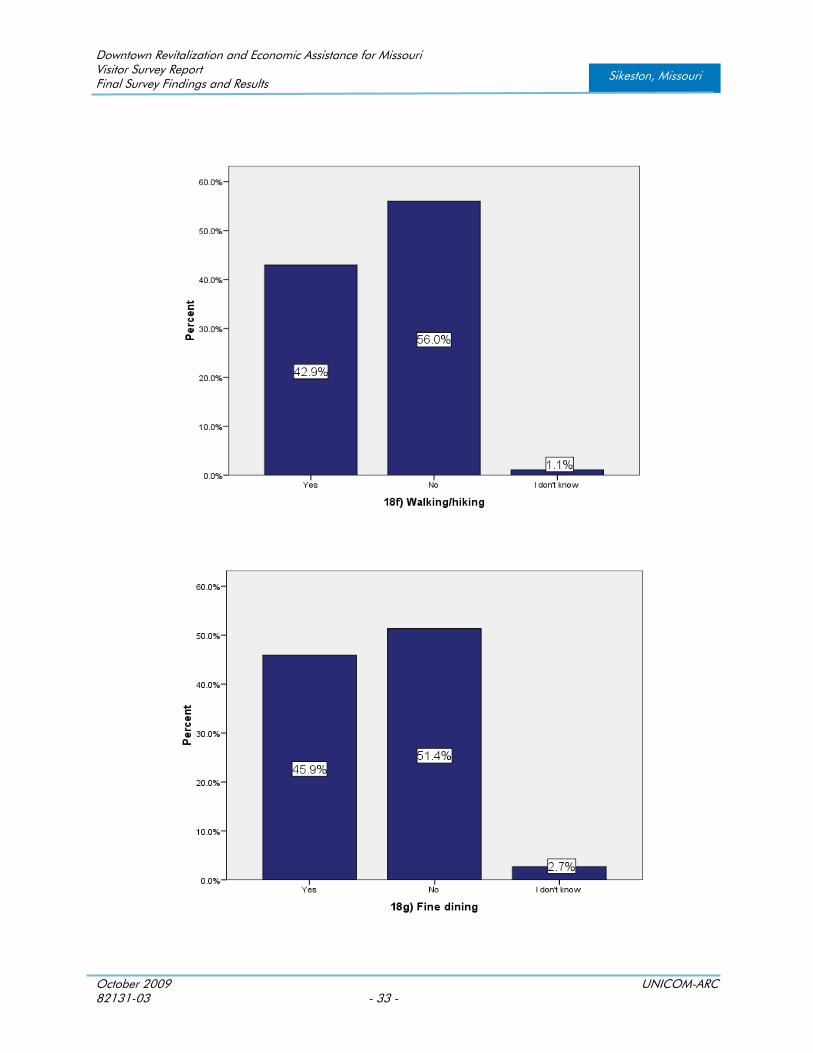
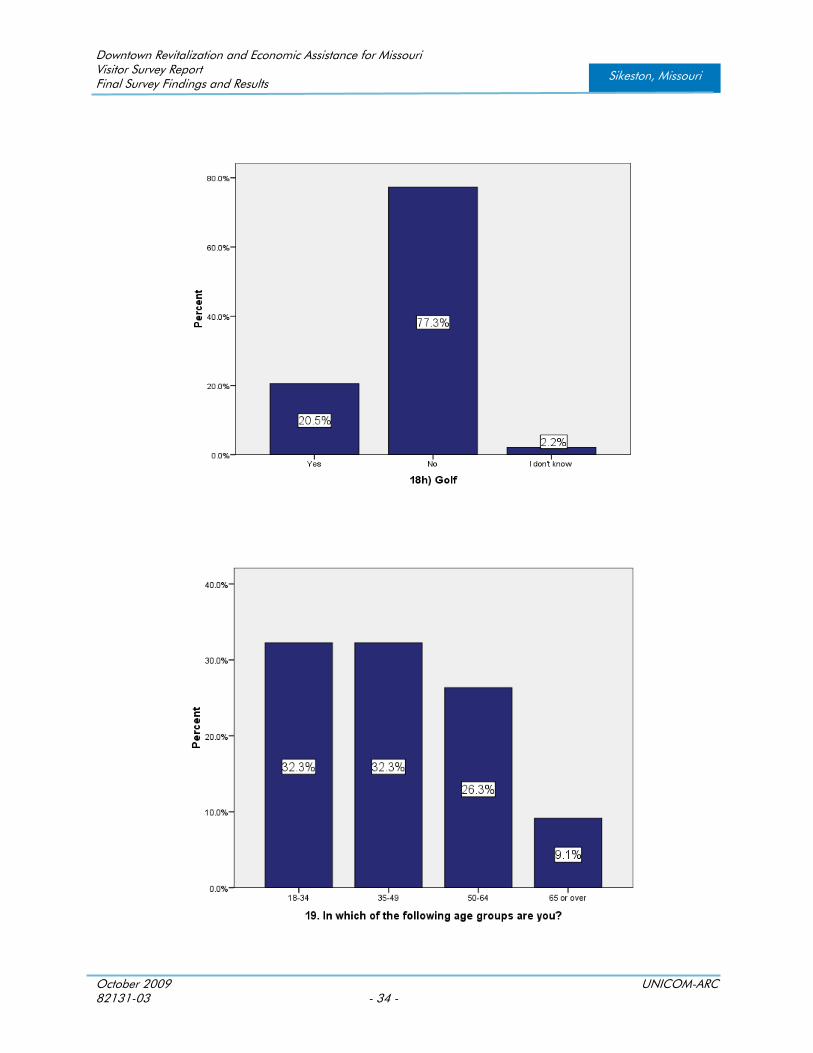
Fine dining (45.9%) Antique shopping (43.8%) Walking/hiking (42.9%) Camping (38.1%) Hunting/fishing (31.7%) Biking (20.8%) Golfing (20.5%)
Respondents were drawn from across a range of age and income levels. A demographic breakdown of respondents is included in the accompanying overview of data.

Downtown Revitalization and Economic Assistance for Missouri Visitor Survey Report Final Survey Findings and Results
October 2009 UNICOM-ARC 82131-03 - 4 -
Sikeston, Missouri
This Page Intentionally Left Blank
Downtown Revitalization and Economic Assistance for Missouri Visitor Survey Report Final Survey Findings and Results
October 2009 UNICOM-ARC 82131-03 - 5 -
Sikeston, Missouri
SECTION II
OVERVIEW OF DATA
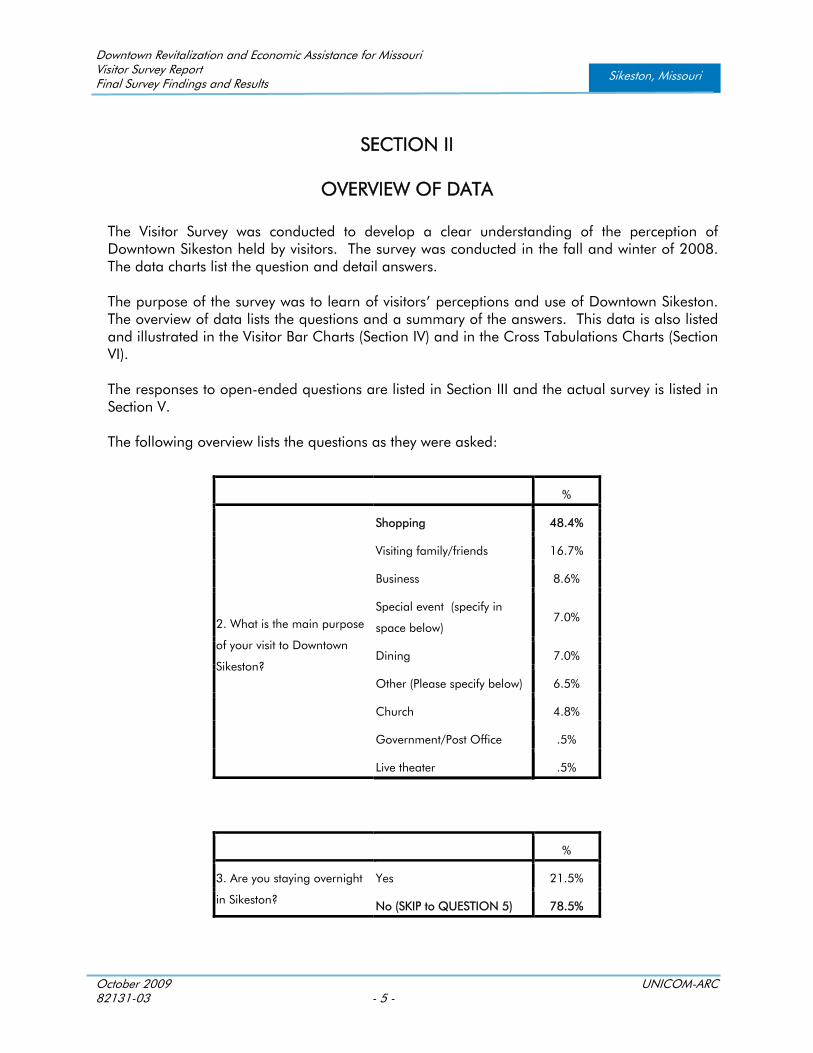
The Visitor Survey was conducted to develop a clear understanding of the perception of Downtown Sikeston held by visitors. The survey was conducted in the fall and winter of 2008. The data charts list the question and detail answers. The purpose of the survey was to learn of visitors’ perceptions and use of Downtown Sikeston. The overview of data lists the questions and a summary of the answers. This data is also listed and illustrated in the Visitor Bar Charts (Section IV) and in the Cross Tabulations Charts (Section VI). The responses to open-ended questions are listed in Section III and the actual survey is listed in Section V. The following overview lists the questions as they were asked:
%
2. What is the main purpose
of your visit to Downtown
Sikeston?
Shopping 48.4%
Visiting family/friends 16.7%
Business 8.6%
Special event (specify in
space below) 7.0%
Dining 7.0%
Other (Please specify below) 6.5%
Church 4.8%
Government/Post Office .5%
Live theater .5%
%
3. Are you staying overnight
in Sikeston?
Yes 21.5%
No (SKIP to QUESTION 5) 78.5%
Downtown Revitalization and Economic Assistance for Missouri Visitor Survey Report Final Survey Findings and Results
October 2009 UNICOM-ARC 82131-03 - 6 -
Sikeston, Missouri
%
4. Where are you staying
overnight in Sikeston?
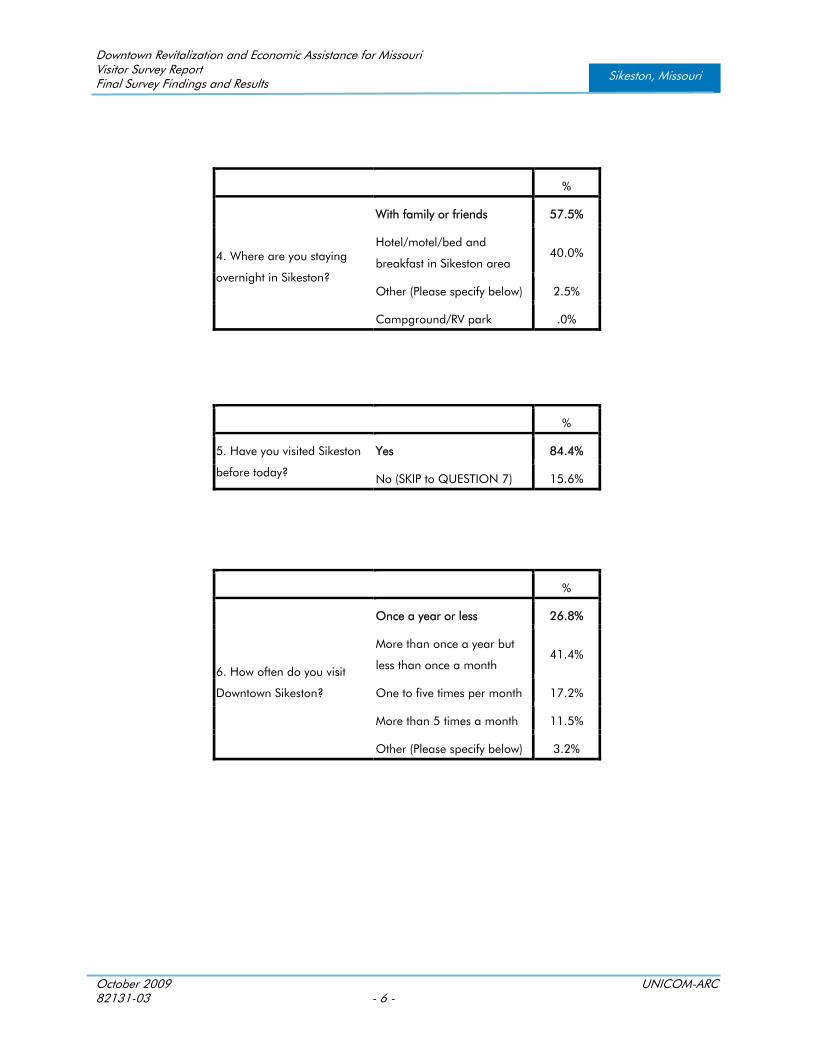
With family or friends 57.5%
Hotel/motel/bed and
breakfast in Sikeston area 40.0%
Other (Please specify below) 2.5%
Campground/RV park .0%
%
5. Have you visited Sikeston
before today?
Yes 84.4%
No (SKIP to QUESTION 7) 15.6%
%
6. How often do you visit
Downtown Sikeston?
Once a year or less 26.8%
More than once a year but
less than once a month 41.4%
One to five times per month 17.2%
More than 5 times a month 11.5%
Other (Please specify below) 3.2%
Downtown Revitalization and Economic Assistance for Missouri Visitor Survey Report Final Survey Findings and Results
October 2009 UNICOM-ARC 82131-03 - 7 -
Sikeston, Missouri
7. On this visit to Sikeston, which of these activities do you plan to do specifically in the
Downtown area?
Yes No I don't know
% % %
7b) Shopping 71.2% 23.9% 4.9%
7c) Dining 60.7% 36.6% 2.7%
7a) Special event 27.2% 67.4% 5.4%
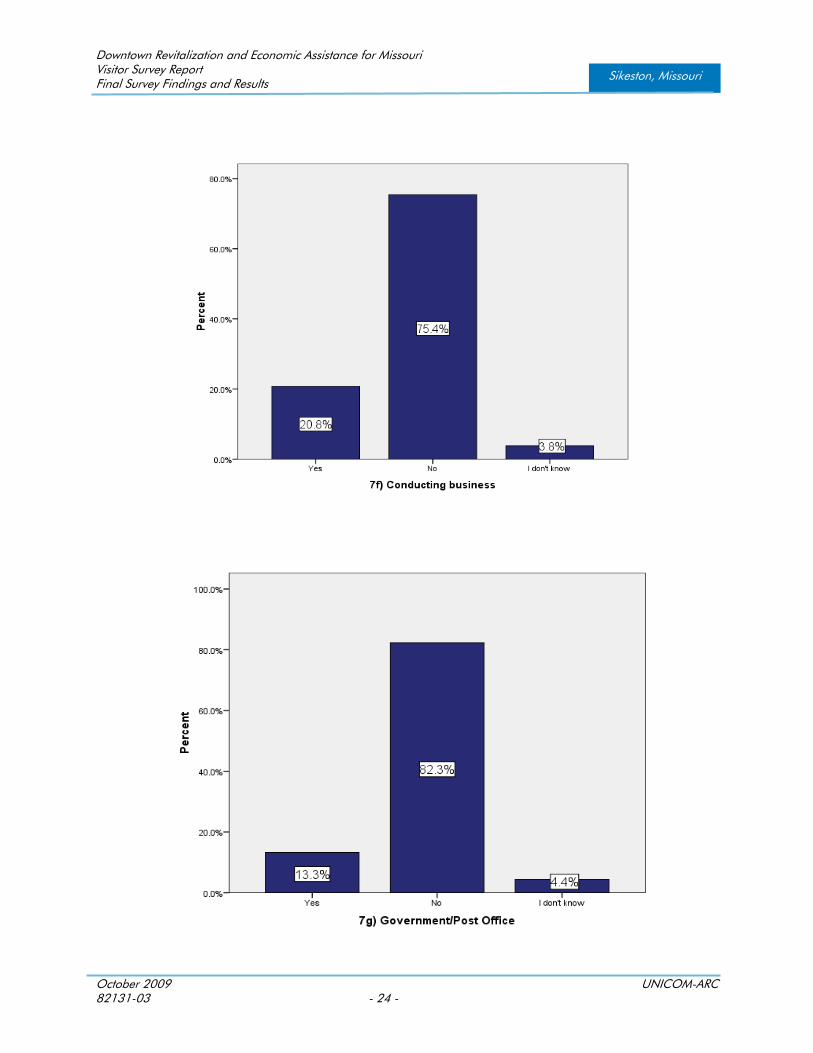
7f) Conducting business 20.8% 75.4% 3.8%
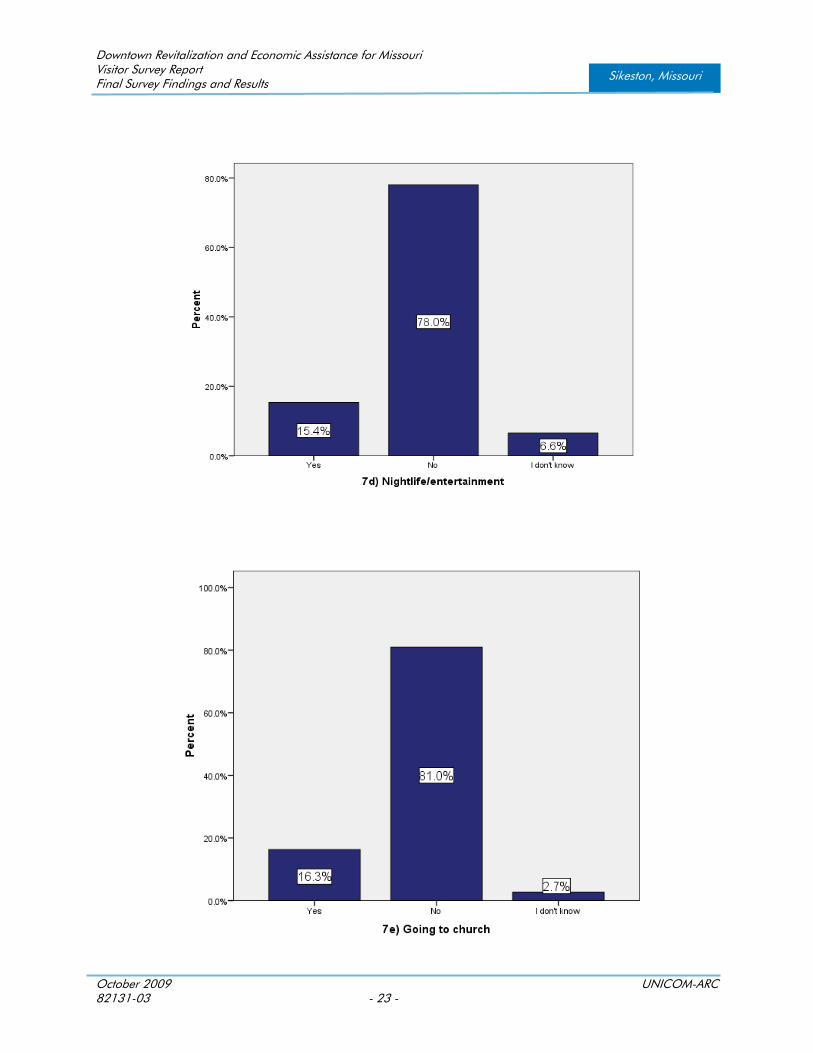
7e) Going to church 16.3% 81.0% 2.7%
7d) Nightlife/entertainment 15.4% 78.0% 6.6%
7g) Government/Post Office 13.3% 82.3% 4.4%
7h) Live theater 3.3% 91.8% 4.9%
%
8. What are the top two
reasons you most often visit
Downtown Sikeston?
Shopping 64.0%
Dining 41.4%
Special event 20.4%
Conducting business 12.4%
This is my first visit to
Downtown Sikeston 10.2%
Going to church 8.6%
Nightlife/entertainment 2.7%
Other (please specify) 6.5%
Government/Post Office 5.4%
Downtown Revitalization and Economic Assistance for Missouri Visitor Survey Report Final Survey Findings and Results
October 2009 UNICOM-ARC 82131-03 - 8 -
Sikeston, Missouri
%
9. How easy would you say it
is to find your way around
Downtown?
Very easy 56.8%
Somewhat easy 25.4%
Somewhat difficult 6.5%
Very difficult 1.1%
I don’t know 10.3%
Very/somewhat easy 82.2%
Very/somewhat difficult 7.6%
%
10. How convenient would
you say that parking is
Downtown?
Very convenient 37.1%
Somewhat convenient 37.1%
Somewhat inconvenient 14.5%
Very inconvenient .5%
I don’t know 10.8%
Very/somewhat convenient 74.2%
Very/somewhat inconvenient 15.1%
%
11. How convenient would
you say that the hours of
Downtown businesses are?
Very convenient 35.1%
Somewhat convenient 37.8%
Somewhat inconvenient 9.2%
Very inconvenient 1.6%
I don’t know 16.2%
Very/somewhat convenient 73.0%
Very/somewhat inconvenient 10.8%
Downtown Revitalization and Economic Assistance for Missouri Visitor Survey Report Final Survey Findings and Results
October 2009 UNICOM-ARC 82131-03 - 9 -
Sikeston, Missouri
%
12. How safe would you
say you feel in
Downtown Sikeston
during the day?
Feel very safe all of the time 55.1%
Feel safe most of the time 30.8%
Do not feel safe at all .0%
Feel unsafe some of the time 2.7%
I don’t know 11.4%
Feel safe most/all of the time 85.9%
Feel unsafe some/all of the time 2.7%
%
13. How safe would you
say you feel in
Downtown Sikeston at
night?
Feel very safe all of the time 22.6%
Feel safe most of the time 34.4%
Do not feel safe at all 2.7%
Feel unsafe some of the time 11.3%
I don’t know 29.0%
Feel safe most/all of the time 57.0%
Feel unsafe some/all of the time 14.0%
Downtown Revitalization and Economic Assistance for Missouri Visitor Survey Report Final Survey Findings and Results
October 2009 UNICOM-ARC 82131-03 - 10 -
Sikeston, Missouri
%
14. What kinds of restaurants
or entertainment
opportunities would make
you more likely to visit
Downtown Sikeston?
Family restaurants 49.1%
Outdoor dining 18.3%
More special events 16.0%
Fine dining 14.9%
Bars/nightlife 13.7%
Bands/live concerts/outdoor
music events 13.1%
Movie theater 10.3%
Family events 9.7%
Children's
attractions/activities 8.0%
Skating rink 5.7%
Arts galleries/events 5.1%
Other (please specifiy below) 2.9%
Game room/arcade/pool
room 2.9%
Activities for teenagers 2.3%
Downtown Revitalization and Economic Assistance for Missouri Visitor Survey Report Final Survey Findings and Results
October 2009 UNICOM-ARC 82131-03 - 11 -
Sikeston, Missouri
%
15. What other kinds of
businesses do you think
would make you more likely
to visit Downtown Sikeston?
Clothing stores 30.8%
More shops (in general) 27.6%
Farmer's market 15.4%
Bookstore 14.7%
Shoe store 13.5%
Antique shops 13.5%
Coffee shop/Internet cafe 12.8%
Specialty/upscale shops 9.0%
Other (please specify below) 7.7%
Soda fountain/Ice cream
shop 7.7%
Art galleries/shops 5.1%
Art supply/craft store 5.1%
Candy store 3.8%
Bed and breakfasts/lodging 3.8%
Downtown Revitalization and Economic Assistance for Missouri Visitor Survey Report Final Survey Findings and Results
October 2009 UNICOM-ARC 82131-03 - 12 -
Sikeston, Missouri
%
16. What other physical
improvements do you
think would make
Downtown Sikeston more
appealing?
Renovation of historic buildings 33.3%
Better maintained buildings 23.7%
Cleaner 21.2%
Public restrooms 20.5%
Fix/smooth cobblestone streets 17.3%
More/better lighting 10.9%
Paint buildings 9.6%
More/better parking 7.1%
Benches/more greenspace 7.1%
Trolley/train to and from Downtown 5.8%
Better signage 4.5%
Other (please specify below) 4.5%
New/better sidewalks 3.8%
Remove facades 1.3%
%
17. Excluding lodging, how
much money are you likely to
spend in Downtown Sikeston
during this visit?
less than $50 24.9%
$50 - $99 34.1%
$100 - $199 21.1%
$200 or more 5.9%
Other/don't know 14.1%
Downtown Revitalization and Economic Assistance for Missouri Visitor Survey Report Final Survey Findings and Results
October 2009 UNICOM-ARC 82131-03 - 13 -
Sikeston, Missouri
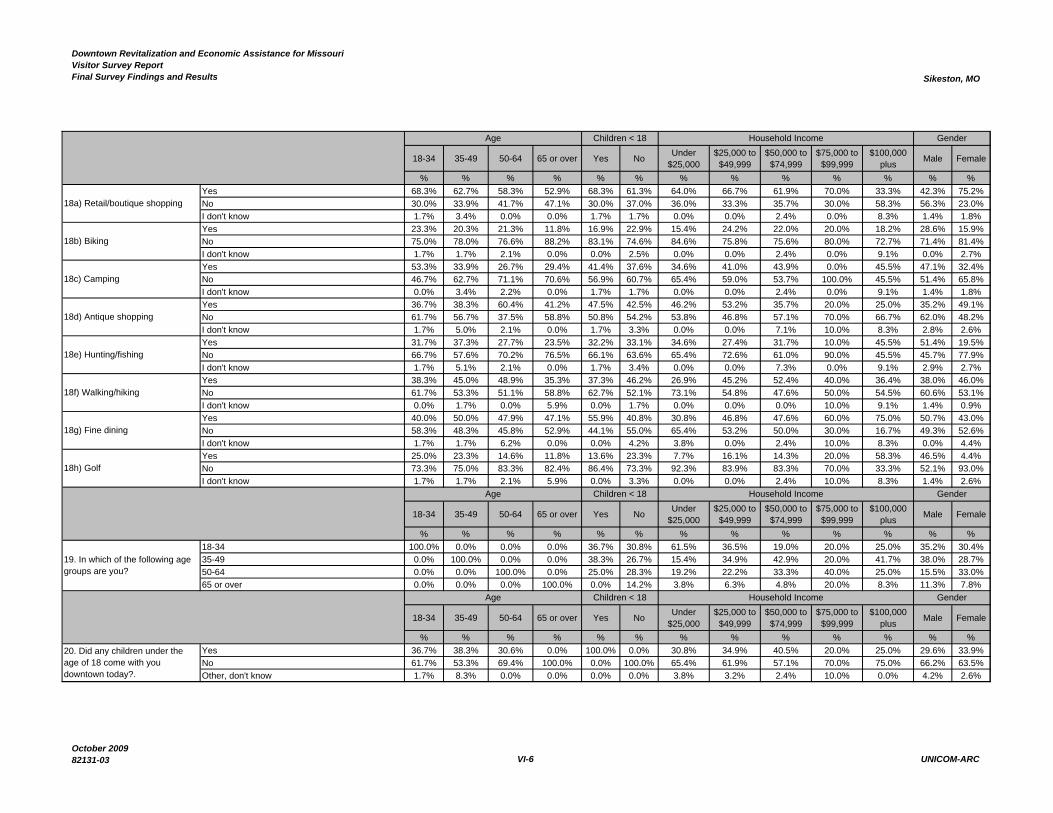
Please indicate which of the following are hobbies of yours…
Yes No I don't know
18a) Retail/boutique shopping 62.5% 35.9% 1.6%
18g) Fine dining 45.9% 51.4% 2.7%
18d) Antique shopping 43.8% 53.5% 2.7%
18f) Walking/hiking 42.9% 56.0% 1.1%
18c) Camping 38.1% 60.2% 1.7%
18e) Hunting/fishing 31.7% 65.6% 2.7%
18b) Biking 20.8% 77.6% 1.6%
18h) Golf 20.5% 77.3% 2.2%
%
19. In which of the following
age groups are you?
18-34 32.3%
35-49 32.3%
50-64 26.3%
65 or over 9.1%
%
20. Did any children under
the age of 18 come with you
Downtown?
Yes 32.3%
No 64.5%
Other, don't know 3.2%
Downtown Revitalization and Economic Assistance for Missouri Visitor Survey Report Final Survey Findings and Results
October 2009 UNICOM-ARC 82131-03 - 14 -
Sikeston, Missouri
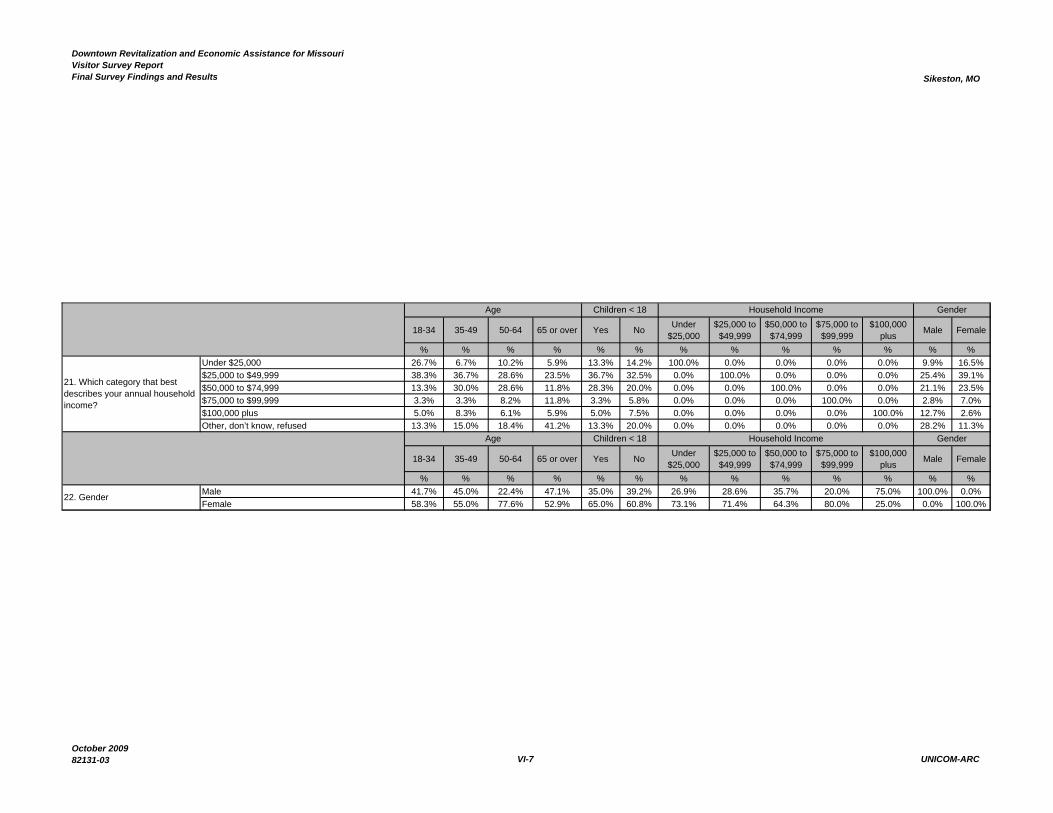
%
21. Which category that best
describes your annual
household income?
Under $25,000 14.0%
$25,000 to $49,999 33.9%
$50,000 to $74,999 22.6%
$75,000 to $99,999 5.4%
$100,000 or more 6.5%
Other, don’t know, refused 17.7%
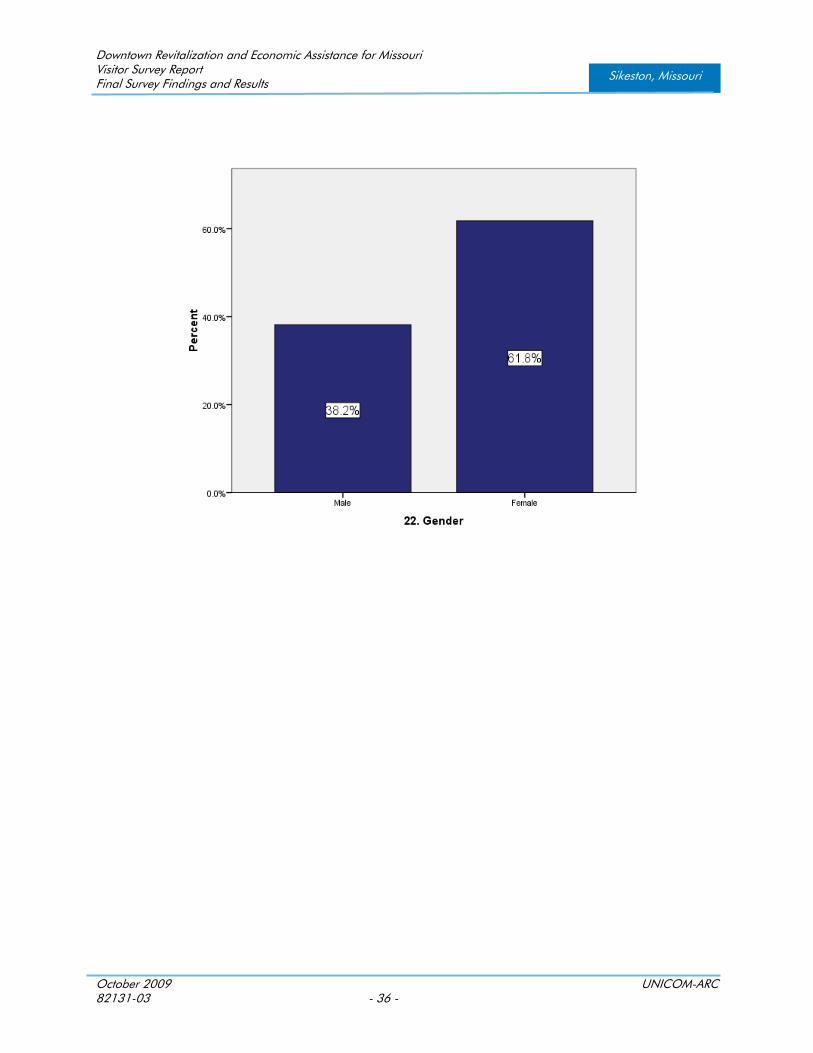
%
22.Gender Male 38.2%
Female 61.8%
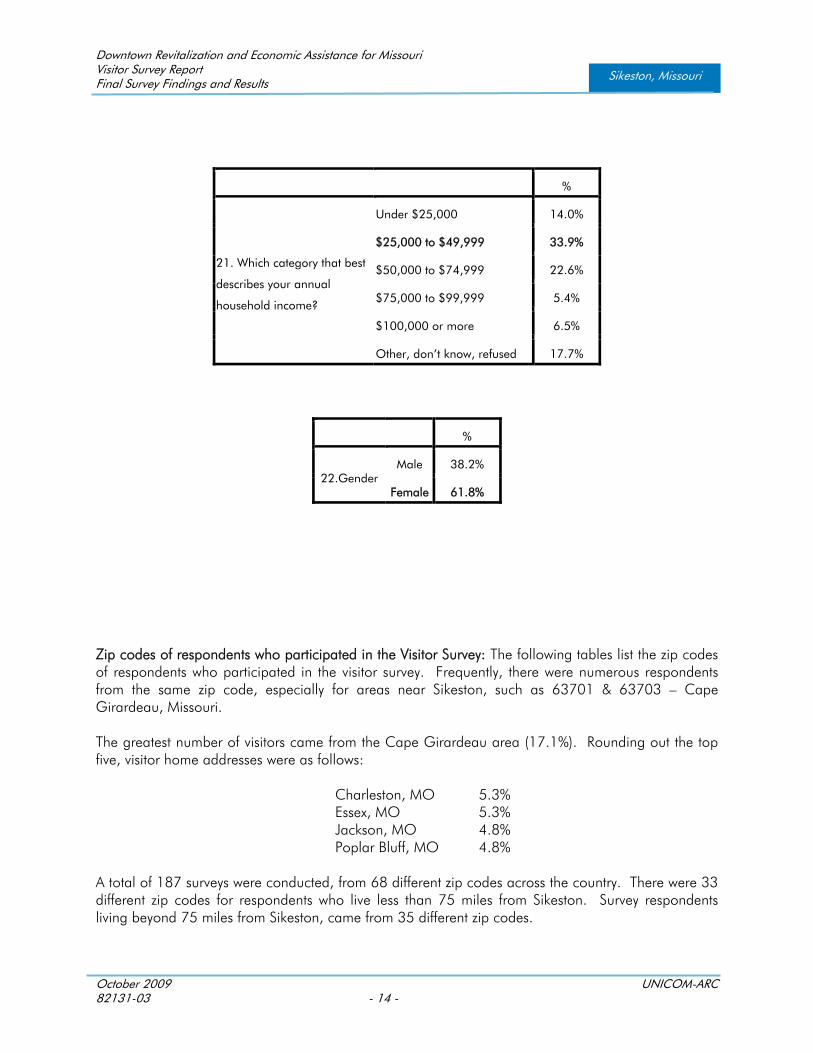
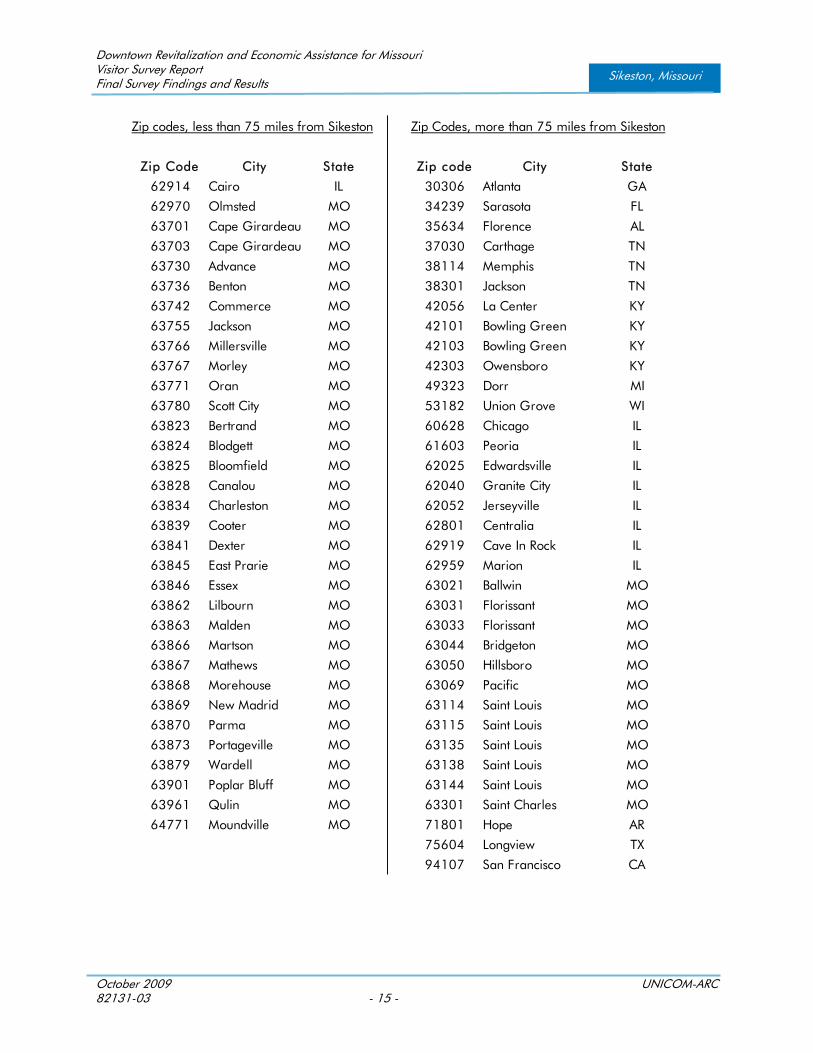
Zip codes of respondents who participated in the Visitor Survey: The following tables list the zip codes of respondents who participated in the visitor survey. Frequently, there were numerous respondents from the same zip code, especially for areas near Sikeston, such as 63701 & 63703 – Cape Girardeau, Missouri. The greatest number of visitors came from the Cape Girardeau area (17.1%). Rounding out the top five, visitor home addresses were as follows:
Charleston, MO 5.3% Essex, MO 5.3% Jackson, MO 4.8% Poplar Bluff, MO 4.8%
A total of 187 surveys were conducted, from 68 different zip codes across the country. There were 33 different zip codes for respondents who live less than 75 miles from Sikeston. Survey respondents living beyond 75 miles from Sikeston, came from 35 different zip codes.
Downtown Revitalization and Economic Assistance for Missouri Visitor Survey Report Final Survey Findings and Results
October 2009 UNICOM-ARC 82131-03 - 15 -
Sikeston, Missouri
Zip codes, less than 75 miles from Sikeston Zip Codes, more than 75 miles from Sikeston
Zip Code City State Zip code City State
62914 Cairo IL 30306 Atlanta GA
62970 Olmsted MO 34239 Sarasota FL
63701 Cape Girardeau MO 35634 Florence AL
63703 Cape Girardeau MO 37030 Carthage TN
63730 Advance MO 38114 Memphis TN
63736 Benton MO 38301 Jackson TN
63742 Commerce MO 42056 La Center KY
63755 Jackson MO 42101 Bowling Green KY
63766 Millersville MO 42103 Bowling Green KY
63767 Morley MO 42303 Owensboro KY
63771 Oran MO 49323 Dorr MI
63780 Scott City MO 53182 Union Grove WI
63823 Bertrand MO 60628 Chicago IL
63824 Blodgett MO 61603 Peoria IL
63825 Bloomfield MO 62025 Edwardsville IL
63828 Canalou MO 62040 Granite City IL
63834 Charleston MO 62052 Jerseyville IL
63839 Cooter MO 62801 Centralia IL
63841 Dexter MO 62919 Cave In Rock IL
63845 East Prarie MO 62959 Marion IL
63846 Essex MO 63021 Ballwin MO
63862 Lilbourn MO 63031 Florissant MO
63863 Malden MO 63033 Florissant MO
63866 Martson MO 63044 Bridgeton MO
63867 Mathews MO 63050 Hillsboro MO
63868 Morehouse MO 63069 Pacific MO
63869 New Madrid MO 63114 Saint Louis MO
63870 Parma MO 63115 Saint Louis MO
63873 Portageville MO 63135 Saint Louis MO
63879 Wardell MO 63138 Saint Louis MO
63901 Poplar Bluff MO 63144 Saint Louis MO
63961 Qulin MO 63301 Saint Charles MO
64771 Moundville MO 71801 Hope AR
75604 Longview TX
94107 San Francisco CA
Downtown Revitalization and Economic Assistance for Missouri Visitor Survey Report Final Survey Findings and Results
October 2009 UNICOM-ARC 82131-03 - 16 -
Sikeston, Missouri
This Page Intentionally Left Blank
Downtown Revitalization and Economic Assistance for Missouri Visitor Survey Report Final Survey Findings and Results
October 2009 UNICOM-ARC 82131-03 - 17 -
Sikeston, Missouri
SECTION III
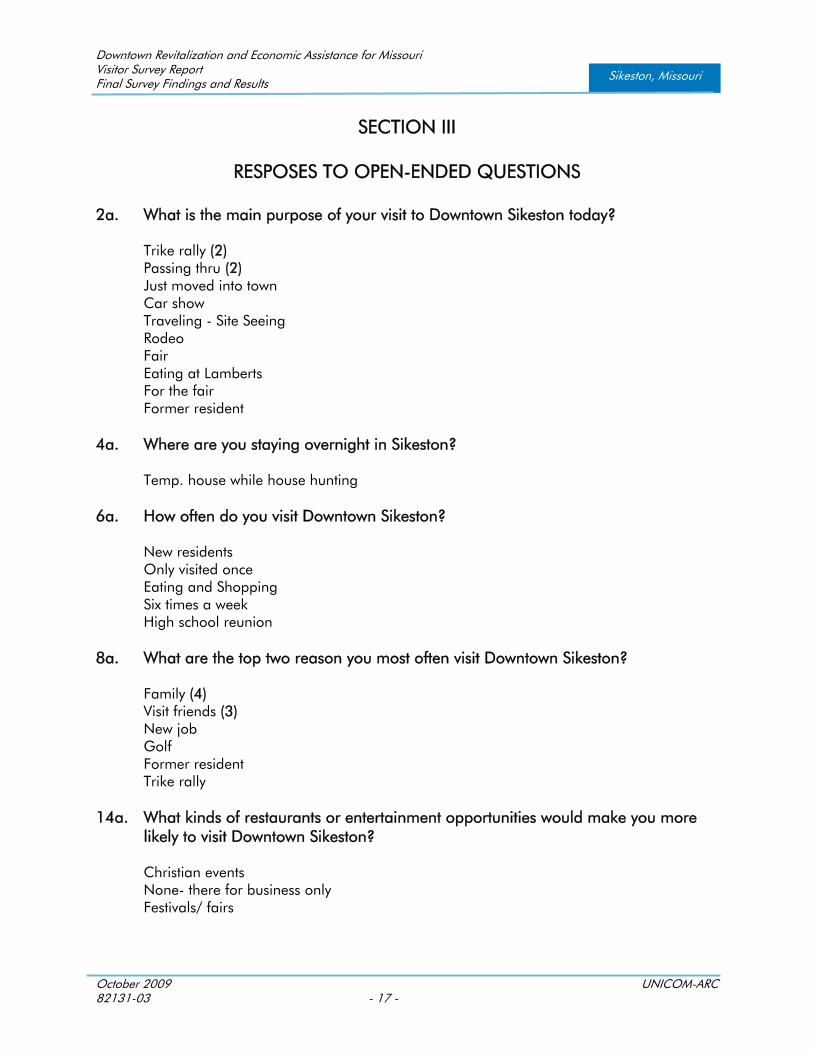
RESPOSES TO OPEN-ENDED QUESTIONS
2a. What is the main purpose of your visit to Downtown Sikeston today?
Trike rally (2) Passing thru (2) Just moved into town Car show Traveling - Site Seeing Rodeo Fair Eating at Lamberts For the fair Former resident
4a. Where are you staying overnight in Sikeston?
Temp. house while house hunting 6a. How often do you visit Downtown Sikeston?
New residents Only visited once Eating and Shopping Six times a week High school reunion
8a. What are the top two reason you most often visit Downtown Sikeston?
Family (4) Visit friends (3) New job Golf Former resident Trike rally
14a. What kinds of restaurants or entertainment opportunities would make you more
likely to visit Downtown Sikeston?
Christian events None- there for business only Festivals/ fairs
Downtown Revitalization and Economic Assistance for Missouri Visitor Survey Report Final Survey Findings and Results
October 2009 UNICOM-ARC 82131-03 - 18 -
Sikeston, Missouri
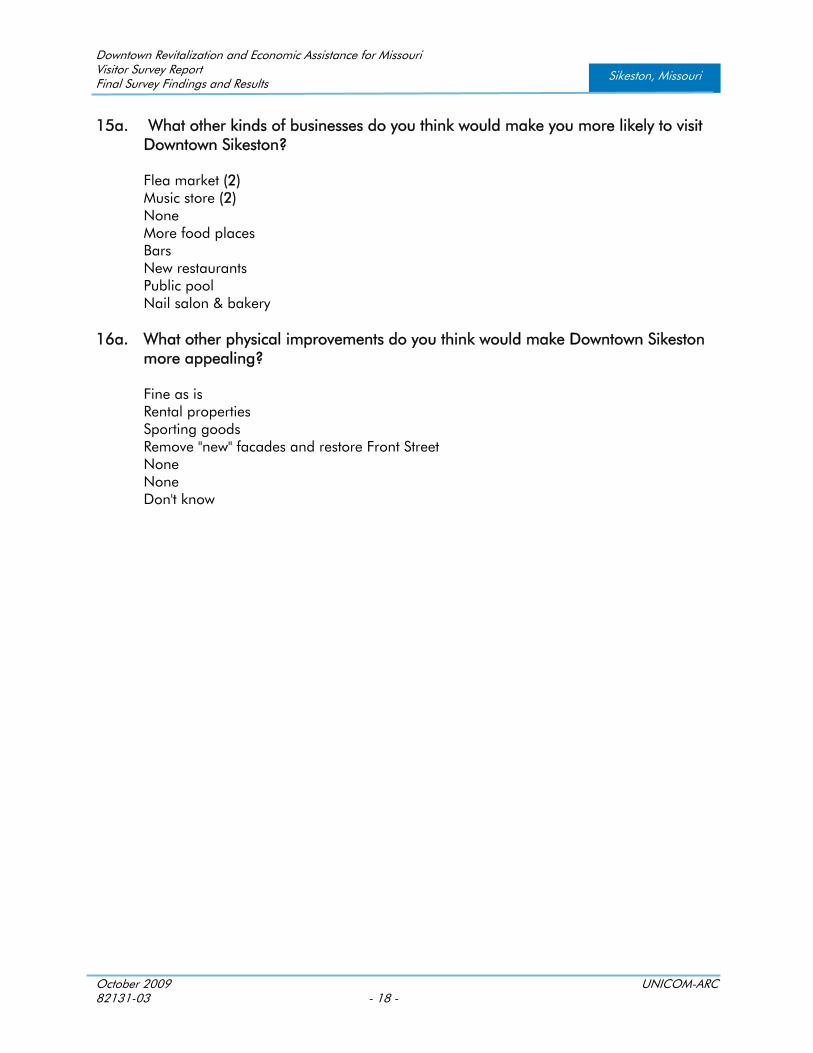
15a. What other kinds of businesses do you think would make you more likely to visit Downtown Sikeston?
Flea market (2) Music store (2) None More food places Bars New restaurants Public pool Nail salon & bakery
16a. What other physical improvements do you think would make Downtown Sikeston
more appealing?
Fine as is Rental properties Sporting goods Remove "new" facades and restore Front Street None None Don't know
Downtown Revitalization and Economic Assistance for Missouri Visitor Survey Report Final Survey Findings and Results
October 2009 UNICOM-ARC 82131-03 - 19 -
Sikeston, Missouri
SECTION IV
VISITOR BAR CHARTS
Downtown Revitalization and Economic Assistance for Missouri Visitor Survey Report Final Survey Findings and Results
October 2009 UNICOM-ARC 82131-03 - 20 -
Sikeston, Missouri
Downtown Revitalization and Economic Assistance for Missouri Visitor Survey Report Final Survey Findings and Results
October 2009 UNICOM-ARC 82131-03 - 21 -
Sikeston, Missouri
Downtown Revitalization and Economic Assistance for Missouri Visitor Survey Report Final Survey Findings and Results
October 2009 UNICOM-ARC 82131-03 - 22 -
Sikeston, Missouri
Downtown Revitalization and Economic Assistance for Missouri Visitor Survey Report Final Survey Findings and Results
October 2009 UNICOM-ARC 82131-03 - 23 -
Sikeston, Missouri
Downtown Revitalization and Economic Assistance for Missouri Visitor Survey Report Final Survey Findings and Results
October 2009 UNICOM-ARC 82131-03 - 24 -
Sikeston, Missouri
Downtown Revitalization and Economic Assistance for Missouri Visitor Survey Report Final Survey Findings and Results
October 2009 UNICOM-ARC 82131-03 - 25 -
Sikeston, Missouri
Downtown Revitalization and Economic Assistance for Missouri Visitor Survey Report Final Survey Findings and Results
October 2009 UNICOM-ARC 82131-03 - 26 -
Sikeston, Missouri
Downtown Revitalization and Economic Assistance for Missouri Visitor Survey Report Final Survey Findings and Results
October 2009 UNICOM-ARC 82131-03 - 27 -
Sikeston, Missouri
Downtown Revitalization and Economic Assistance for Missouri Visitor Survey Report Final Survey Findings and Results
October 2009 UNICOM-ARC 82131-03 - 28 -
Sikeston, Missouri
Downtown Revitalization and Economic Assistance for Missouri Visitor Survey Report Final Survey Findings and Results
October 2009 UNICOM-ARC 82131-03 - 29 -
Sikeston, Missouri
Downtown Revitalization and Economic Assistance for Missouri Visitor Survey Report Final Survey Findings and Results
October 2009 UNICOM-ARC 82131-03 - 30 -
Sikeston, Missouri
Downtown Revitalization and Economic Assistance for Missouri Visitor Survey Report Final Survey Findings and Results
October 2009 UNICOM-ARC 82131-03 - 31 -
Sikeston, Missouri
Downtown Revitalization and Economic Assistance for Missouri Visitor Survey Report Final Survey Findings and Results
October 2009 UNICOM-ARC 82131-03 - 32 -
Sikeston, Missouri
Downtown Revitalization and Economic Assistance for Missouri Visitor Survey Report Final Survey Findings and Results
October 2009 UNICOM-ARC 82131-03 - 33 -
Sikeston, Missouri
Downtown Revitalization and Economic Assistance for Missouri Visitor Survey Report Final Survey Findings and Results
October 2009 UNICOM-ARC 82131-03 - 34 -
Sikeston, Missouri
Downtown Revitalization and Economic Assistance for Missouri Visitor Survey Report Final Survey Findings and Results
October 2009 UNICOM-ARC 82131-03 - 35 -
Sikeston, Missouri
Downtown Revitalization and Economic Assistance for Missouri Visitor Survey Report Final Survey Findings and Results
October 2009 UNICOM-ARC 82131-03 - 36 -
Sikeston, Missouri
Downtown Revitalization and Economic Assistance for Missouri Visitor Survey Report Final Survey Findings and Results
October 2009 UNICOM-ARC 82131-03 - 37 -
Sikeston, Missouri
SECTION V
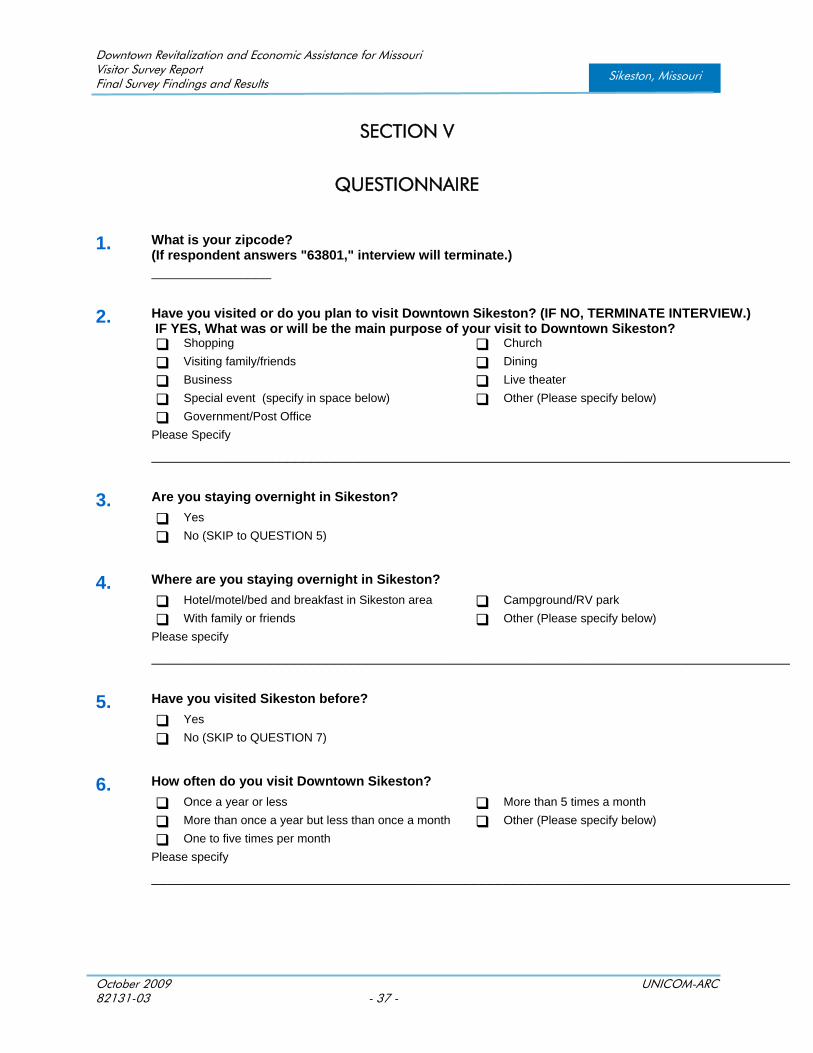
QUESTIONNAIRE 1. What is your zipcode?
(If respondent answers "63801," interview will terminate.) _______________
2. Have you visited or do you plan to visit Downtown Sikeston? (IF NO, TERMINATE INTERVIEW.) IF YES, What was or will be the main purpose of your visit to Downtown Sikeston?
Shopping Church
Visiting family/friends Dining
Business Live theater
Special event (specify in space below) Other (Please specify below)
Government/Post Office Please Specify ________________________________________________________________________________
3. Are you staying overnight in Sikeston?
Yes No (SKIP to QUESTION 5)
4. Where are you staying overnight in Sikeston?
Hotel/motel/bed and breakfast in Sikeston area Campground/RV park With family or friends Other (Please specify below)
Please specify ________________________________________________________________________________
5. Have you visited Sikeston before?
Yes No (SKIP to QUESTION 7)
6. How often do you visit Downtown Sikeston?
Once a year or less More than 5 times a month More than once a year but less than once a month Other (Please specify below)
One to five times per month Please specify ________________________________________________________________________________
Downtown Revitalization and Economic Assistance for Missouri Visitor Survey Report Final Survey Findings and Results
October 2009 UNICOM-ARC 82131-03 - 38 -
Sikeston, Missouri
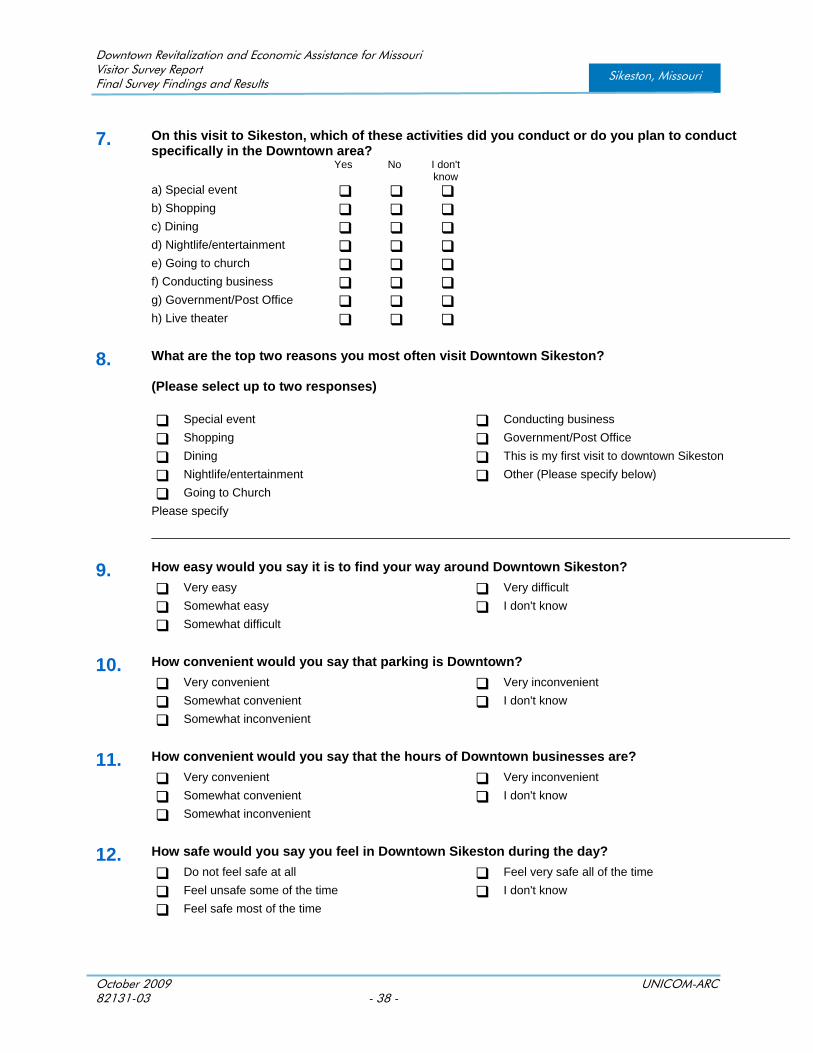
7. On this visit to Sikeston, which of these activities did you conduct or do you plan to conduct specifically in the Downtown area?
Yes No I don't know
a) Special event b) Shopping c) Dining d) Nightlife/entertainment e) Going to church f) Conducting business g) Government/Post Office h) Live theater 8. What are the top two reasons you most often visit Downtown Sikeston?
(Please select up to two responses)
Special event Conducting business Shopping Government/Post Office Dining This is my first visit to downtown Sikeston
Nightlife/entertainment Other (Please specify below)
Going to Church Please specify ________________________________________________________________________________ 9. How easy would you say it is to find your way around Downtown Sikeston? Very easy Very difficult
Somewhat easy I don't know
Somewhat difficult 10. How convenient would you say that parking is Downtown?
Very convenient Very inconvenient Somewhat convenient I don't know
Somewhat inconvenient 11. How convenient would you say that the hours of Downtown businesses are? Very convenient Very inconvenient Somewhat convenient I don't know
Somewhat inconvenient 12. How safe would you say you feel in Downtown Sikeston during the day? Do not feel safe at all Feel very safe all of the time Feel unsafe some of the time I don't know
Feel safe most of the time
Downtown Revitalization and Economic Assistance for Missouri Visitor Survey Report Final Survey Findings and Results
October 2009 UNICOM-ARC 82131-03 - 39 -
Sikeston, Missouri
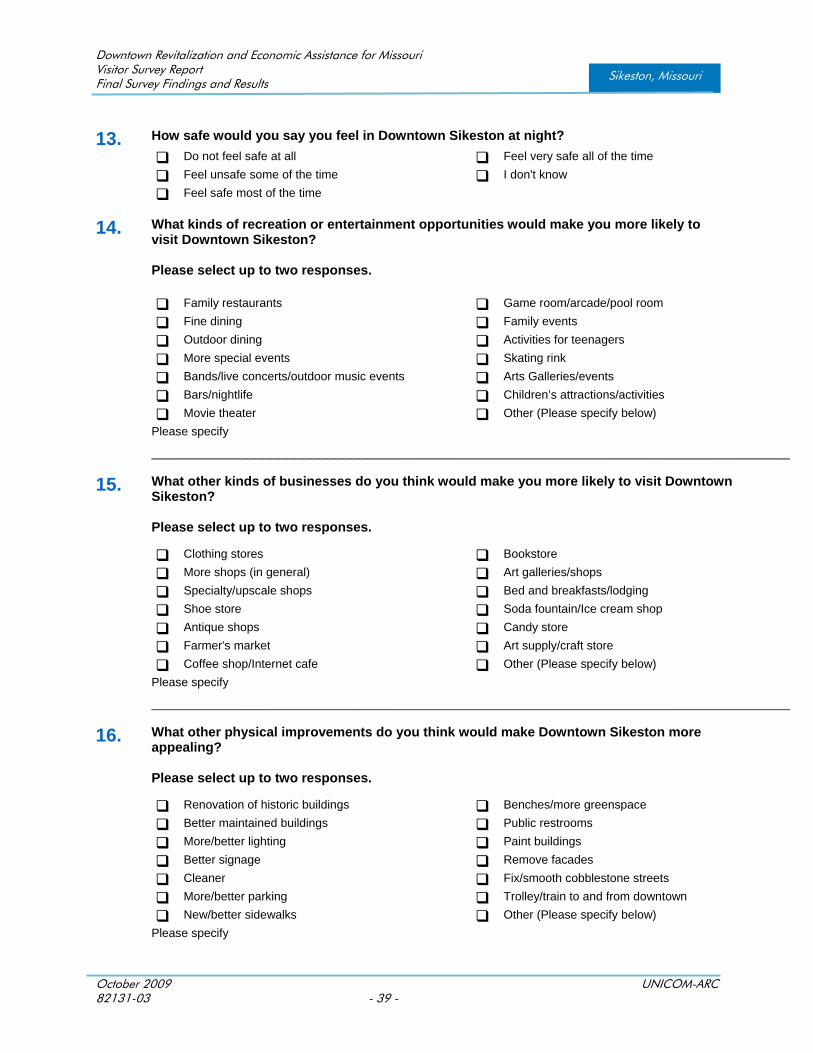
13. How safe would you say you feel in Downtown Sikeston at night? Do not feel safe at all Feel very safe all of the time Feel unsafe some of the time I don't know
Feel safe most of the time
14. What kinds of recreation or entertainment opportunities would make you more likely to visit Downtown Sikeston? Please select up to two responses.
Family restaurants Game room/arcade/pool room
Fine dining Family events Outdoor dining Activities for teenagers More special events Skating rink
Bands/live concerts/outdoor music events Arts Galleries/events Bars/nightlife Children’s attractions/activities
Movie theater Other (Please specify below)
Please specify ________________________________________________________________________________
15. What other kinds of businesses do you think would make you more likely to visit Downtown Sikeston? Please select up to two responses.
Clothing stores Bookstore
More shops (in general) Art galleries/shops Specialty/upscale shops Bed and breakfasts/lodging Shoe store Soda fountain/Ice cream shop
Antique shops Candy store
Farmer's market Art supply/craft store Coffee shop/Internet cafe Other (Please specify below)
Please specify ________________________________________________________________________________
16. What other physical improvements do you think would make Downtown Sikeston more appealing? Please select up to two responses.
Renovation of historic buildings Benches/more greenspace Better maintained buildings Public restrooms More/better lighting Paint buildings Better signage Remove facades Cleaner Fix/smooth cobblestone streets
More/better parking Trolley/train to and from downtown
New/better sidewalks Other (Please specify below)
Please specify
Downtown Revitalization and Economic Assistance for Missouri Visitor Survey Report Final Survey Findings and Results
October 2009 UNICOM-ARC 82131-03 - 40 -
Sikeston, Missouri
________________________________________________________________________________
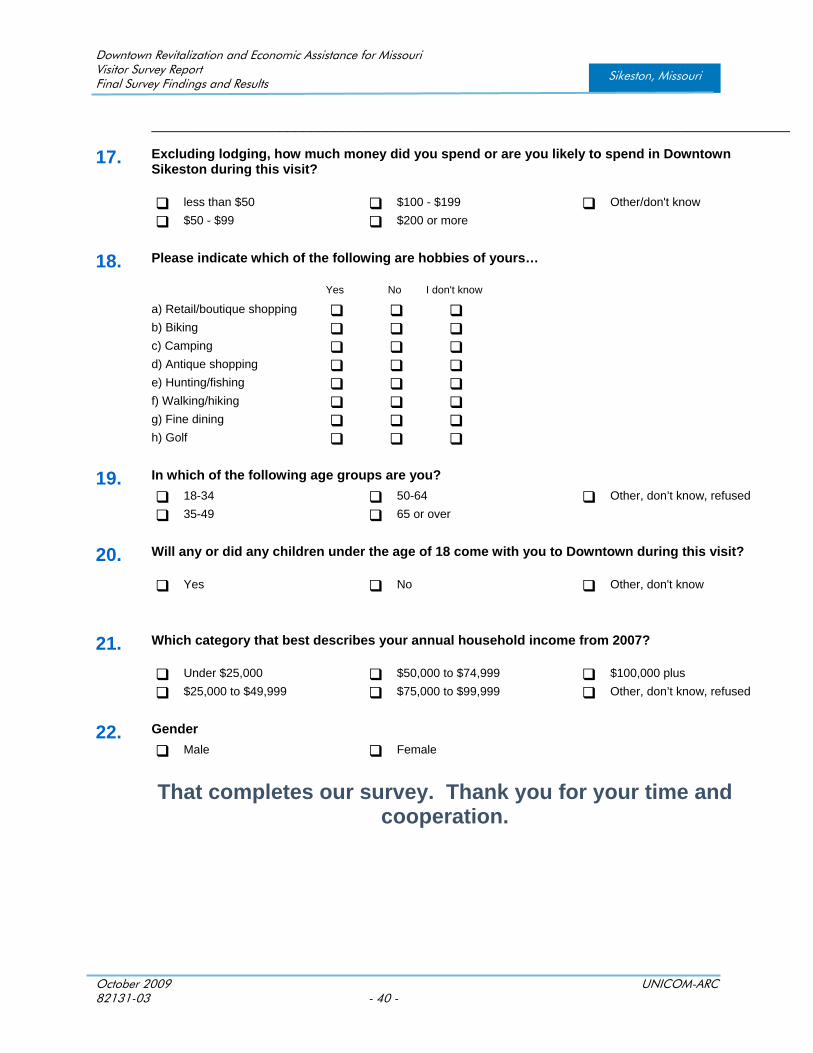
17. Excluding lodging, how much money did you spend or are you likely to spend in Downtown Sikeston during this visit?
less than $50 $100 - $199 Other/don't know
$50 - $99 $200 or more 18. Please indicate which of the following are hobbies of yours…
Yes No I don't know a) Retail/boutique shopping b) Biking c) Camping d) Antique shopping e) Hunting/fishing f) Walking/hiking g) Fine dining h) Golf 19. In which of the following age groups are you?
18-34 50-64 Other, don’t know, refused
35-49 65 or over 20. Will any or did any children under the age of 18 come with you to Downtown during this visit?
Yes No Other, don't know
21. Which category that best describes your annual household income from 2007?
Under $25,000 $50,000 to $74,999 $100,000 plus
$25,000 to $49,999 $75,000 to $99,999 Other, don’t know, refused
22. Gender Male Female That completes our survey. Thank you for your time and
cooperation.
Downtown Revitalization and Economic Assistance for Missouri Visitor Survey Report Final Survey Findings and Results
October 2009 UNICOM-ARC 82131-03 - 41 -
Sikeston, Missouri
SECTION VI
CROSS TABULATION

Downtown Revitalization and Economic Assistance for Missouri Visitor Survey Report Final Survey Findings and Results
October 2009 UNICOM-ARC 82131-03 - 42 -
Sikeston, Missouri
This Page Intentionally Left Blank
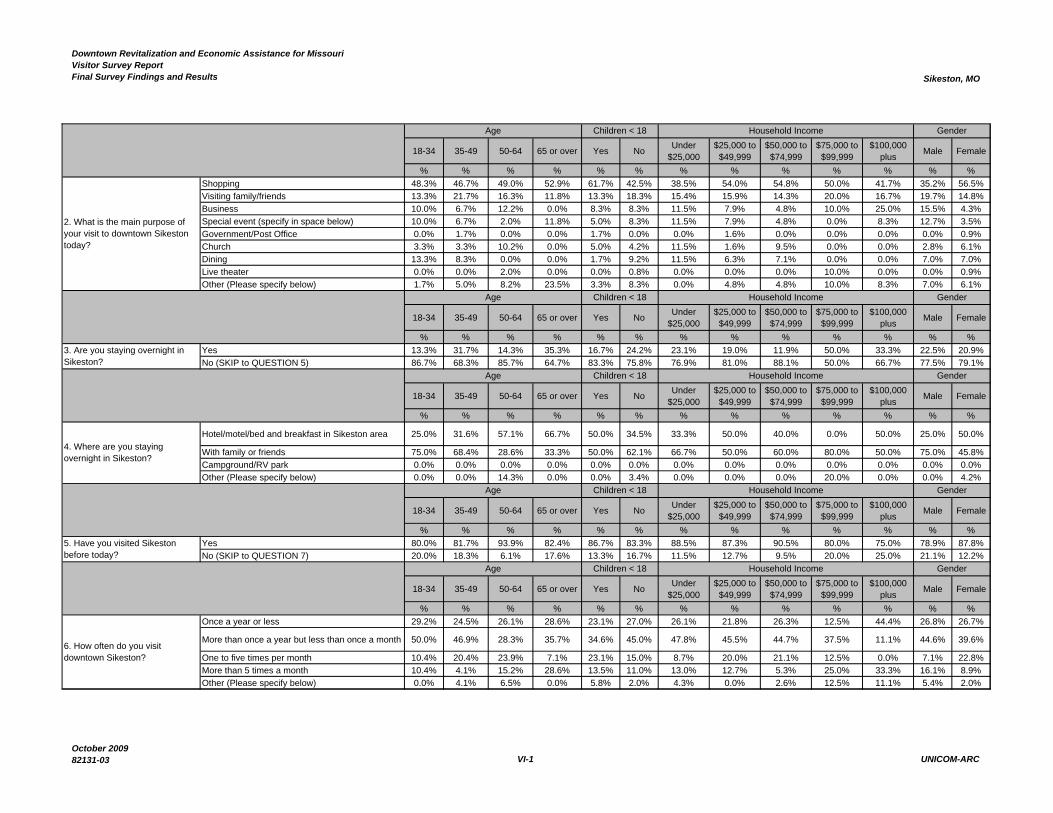
Downtown Revitalization and Economic Assistance for MissouriVisitor Survey ReportFinal Survey Findings and Results Sikeston, MO
18-34 35-49 50-64 65 or over Yes No Under $25,000
$25,000 to $49,999
$50,000 to $74,999
$75,000 to $99,999
$100,000 plus Male Female
% % % % % % % % % % % % %Shopping 48.3% 46.7% 49.0% 52.9% 61.7% 42.5% 38.5% 54.0% 54.8% 50.0% 41.7% 35.2% 56.5%Visiting family/friends 13.3% 21.7% 16.3% 11.8% 13.3% 18.3% 15.4% 15.9% 14.3% 20.0% 16.7% 19.7% 14.8%Business 10.0% 6.7% 12.2% 0.0% 8.3% 8.3% 11.5% 7.9% 4.8% 10.0% 25.0% 15.5% 4.3%Special event (specify in space below) 10.0% 6.7% 2.0% 11.8% 5.0% 8.3% 11.5% 7.9% 4.8% 0.0% 8.3% 12.7% 3.5%Government/Post Office 0.0% 1.7% 0.0% 0.0% 1.7% 0.0% 0.0% 1.6% 0.0% 0.0% 0.0% 0.0% 0.9%Church 3.3% 3.3% 10.2% 0.0% 5.0% 4.2% 11.5% 1.6% 9.5% 0.0% 0.0% 2.8% 6.1%Dining 13.3% 8.3% 0.0% 0.0% 1.7% 9.2% 11.5% 6.3% 7.1% 0.0% 0.0% 7.0% 7.0%Live theater 0.0% 0.0% 2.0% 0.0% 0.0% 0.8% 0.0% 0.0% 0.0% 10.0% 0.0% 0.0% 0.9%Other (Please specify below) 1.7% 5.0% 8.2% 23.5% 3.3% 8.3% 0.0% 4.8% 4.8% 10.0% 8.3% 7.0% 6.1%
18-34 35-49 50-64 65 or over Yes No Under $25,000
$25,000 to $49,999
$50,000 to $74,999
$75,000 to $99,999
$100,000 plus Male Female
% % % % % % % % % % % % %Yes 13.3% 31.7% 14.3% 35.3% 16.7% 24.2% 23.1% 19.0% 11.9% 50.0% 33.3% 22.5% 20.9%No (SKIP to QUESTION 5) 86.7% 68.3% 85.7% 64.7% 83.3% 75.8% 76.9% 81.0% 88.1% 50.0% 66.7% 77.5% 79.1%
18-34 35-49 50-64 65 or over Yes No Under $25,000
$25,000 to $49,999
$50,000 to $74,999
$75,000 to $99,999
$100,000 plus Male Female
% % % % % % % % % % % % %
Hotel/motel/bed and breakfast in Sikeston area 25.0% 31.6% 57.1% 66.7% 50.0% 34.5% 33.3% 50.0% 40.0% 0.0% 50.0% 25.0% 50.0%
With family or friends 75.0% 68.4% 28.6% 33.3% 50.0% 62.1% 66.7% 50.0% 60.0% 80.0% 50.0% 75.0% 45.8%Campground/RV park 0.0% 0.0% 0.0% 0.0% 0.0% 0.0% 0.0% 0.0% 0.0% 0.0% 0.0% 0.0% 0.0%Other (Please specify below) 0.0% 0.0% 14.3% 0.0% 0.0% 3.4% 0.0% 0.0% 0.0% 20.0% 0.0% 0.0% 4.2%
18-34 35-49 50-64 65 or over Yes No Under $25,000
$25,000 to $49,999
$50,000 to $74,999
$75,000 to $99,999
$100,000 plus Male Female
% % % % % % % % % % % % %Yes 80.0% 81.7% 93.9% 82.4% 86.7% 83.3% 88.5% 87.3% 90.5% 80.0% 75.0% 78.9% 87.8%No (SKIP to QUESTION 7) 20.0% 18.3% 6.1% 17.6% 13.3% 16.7% 11.5% 12.7% 9.5% 20.0% 25.0% 21.1% 12.2%
18-34 35-49 50-64 65 or over Yes No Under $25,000
$25,000 to $49,999
$50,000 to $74,999
$75,000 to $99,999
$100,000 plus Male Female
% % % % % % % % % % % % %Once a year or less 29.2% 24.5% 26.1% 28.6% 23.1% 27.0% 26.1% 21.8% 26.3% 12.5% 44.4% 26.8% 26.7%
More than once a year but less than once a month 50.0% 46.9% 28.3% 35.7% 34.6% 45.0% 47.8% 45.5% 44.7% 37.5% 11.1% 44.6% 39.6%
One to five times per month 10.4% 20.4% 23.9% 7.1% 23.1% 15.0% 8.7% 20.0% 21.1% 12.5% 0.0% 7.1% 22.8%More than 5 times a month 10.4% 4.1% 15.2% 28.6% 13.5% 11.0% 13.0% 12.7% 5.3% 25.0% 33.3% 16.1% 8.9%Other (Please specify below) 0.0% 4.1% 6.5% 0.0% 5.8% 2.0% 4.3% 0.0% 2.6% 12.5% 11.1% 5.4% 2.0%
5. Have you visited Sikeston before today?
Age Children < 18 Household Income Gender
6. How often do you visit downtown Sikeston?
Children < 18
Children < 18
Household Income
Household Income
Gender
3. Are you staying overnight in Sikeston?
Age Children < 18 Household Income Gender
4. Where are you staying overnight in Sikeston?
Age
Gender
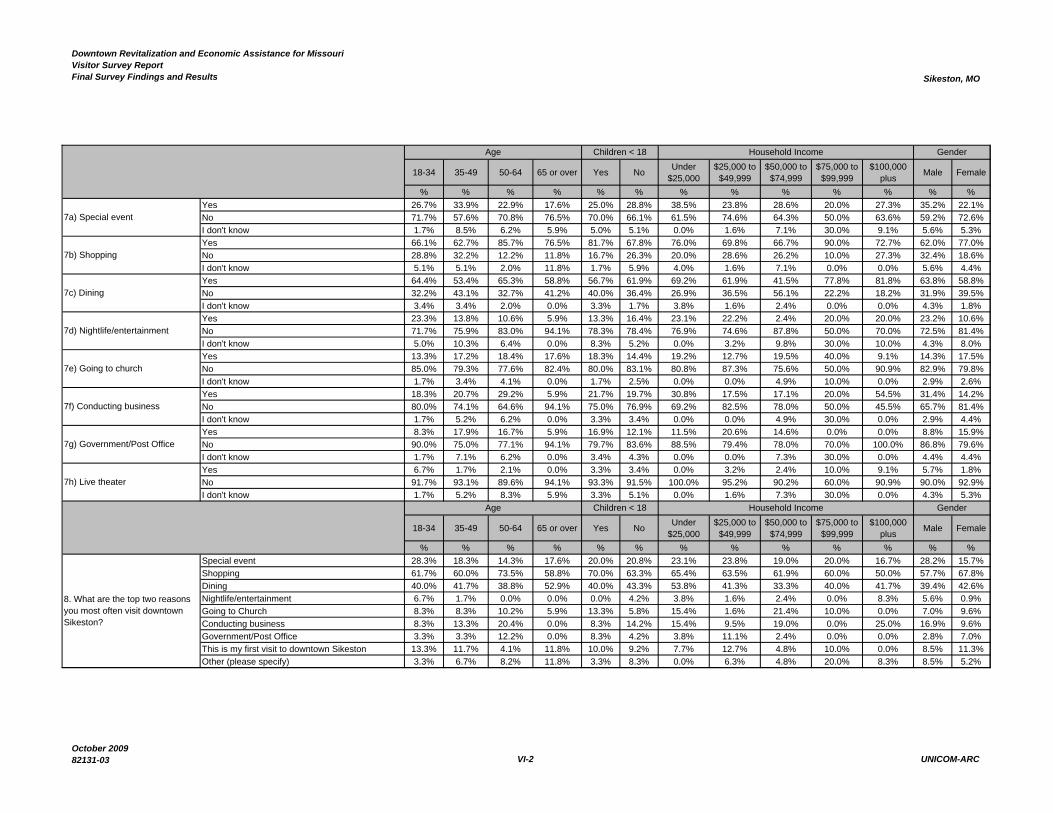
Age Children < 18 Household Income Gender
2. What is the main purpose of your visit to downtown Sikeston today?
Age
October 200982131-03 VI-1 UNICOM-ARC
Downtown Revitalization and Economic Assistance for MissouriVisitor Survey ReportFinal Survey Findings and Results Sikeston, MO
18-34 35-49 50-64 65 or over Yes No Under $25,000
$25,000 to $49,999
$50,000 to $74,999
$75,000 to $99,999
$100,000 plus Male Female
% % % % % % % % % % % % %Yes 26.7% 33.9% 22.9% 17.6% 25.0% 28.8% 38.5% 23.8% 28.6% 20.0% 27.3% 35.2% 22.1%No 71.7% 57.6% 70.8% 76.5% 70.0% 66.1% 61.5% 74.6% 64.3% 50.0% 63.6% 59.2% 72.6%I don't know 1.7% 8.5% 6.2% 5.9% 5.0% 5.1% 0.0% 1.6% 7.1% 30.0% 9.1% 5.6% 5.3%Yes 66.1% 62.7% 85.7% 76.5% 81.7% 67.8% 76.0% 69.8% 66.7% 90.0% 72.7% 62.0% 77.0%No 28.8% 32.2% 12.2% 11.8% 16.7% 26.3% 20.0% 28.6% 26.2% 10.0% 27.3% 32.4% 18.6%I don't know 5.1% 5.1% 2.0% 11.8% 1.7% 5.9% 4.0% 1.6% 7.1% 0.0% 0.0% 5.6% 4.4%Yes 64.4% 53.4% 65.3% 58.8% 56.7% 61.9% 69.2% 61.9% 41.5% 77.8% 81.8% 63.8% 58.8%No 32.2% 43.1% 32.7% 41.2% 40.0% 36.4% 26.9% 36.5% 56.1% 22.2% 18.2% 31.9% 39.5%I don't know 3.4% 3.4% 2.0% 0.0% 3.3% 1.7% 3.8% 1.6% 2.4% 0.0% 0.0% 4.3% 1.8%Yes 23.3% 13.8% 10.6% 5.9% 13.3% 16.4% 23.1% 22.2% 2.4% 20.0% 20.0% 23.2% 10.6%No 71.7% 75.9% 83.0% 94.1% 78.3% 78.4% 76.9% 74.6% 87.8% 50.0% 70.0% 72.5% 81.4%I don't know 5.0% 10.3% 6.4% 0.0% 8.3% 5.2% 0.0% 3.2% 9.8% 30.0% 10.0% 4.3% 8.0%Yes 13.3% 17.2% 18.4% 17.6% 18.3% 14.4% 19.2% 12.7% 19.5% 40.0% 9.1% 14.3% 17.5%No 85.0% 79.3% 77.6% 82.4% 80.0% 83.1% 80.8% 87.3% 75.6% 50.0% 90.9% 82.9% 79.8%I don't know 1.7% 3.4% 4.1% 0.0% 1.7% 2.5% 0.0% 0.0% 4.9% 10.0% 0.0% 2.9% 2.6%Yes 18.3% 20.7% 29.2% 5.9% 21.7% 19.7% 30.8% 17.5% 17.1% 20.0% 54.5% 31.4% 14.2%No 80.0% 74.1% 64.6% 94.1% 75.0% 76.9% 69.2% 82.5% 78.0% 50.0% 45.5% 65.7% 81.4%I don't know 1.7% 5.2% 6.2% 0.0% 3.3% 3.4% 0.0% 0.0% 4.9% 30.0% 0.0% 2.9% 4.4%Yes 8.3% 17.9% 16.7% 5.9% 16.9% 12.1% 11.5% 20.6% 14.6% 0.0% 0.0% 8.8% 15.9%No 90.0% 75.0% 77.1% 94.1% 79.7% 83.6% 88.5% 79.4% 78.0% 70.0% 100.0% 86.8% 79.6%I don't know 1.7% 7.1% 6.2% 0.0% 3.4% 4.3% 0.0% 0.0% 7.3% 30.0% 0.0% 4.4% 4.4%Yes 6.7% 1.7% 2.1% 0.0% 3.3% 3.4% 0.0% 3.2% 2.4% 10.0% 9.1% 5.7% 1.8%No 91.7% 93.1% 89.6% 94.1% 93.3% 91.5% 100.0% 95.2% 90.2% 60.0% 90.9% 90.0% 92.9%I don't know 1.7% 5.2% 8.3% 5.9% 3.3% 5.1% 0.0% 1.6% 7.3% 30.0% 0.0% 4.3% 5.3%
18-34 35-49 50-64 65 or over Yes No Under $25,000
$25,000 to $49,999
$50,000 to $74,999
$75,000 to $99,999
$100,000 plus Male Female
% % % % % % % % % % % % %Special event 28.3% 18.3% 14.3% 17.6% 20.0% 20.8% 23.1% 23.8% 19.0% 20.0% 16.7% 28.2% 15.7%Shopping 61.7% 60.0% 73.5% 58.8% 70.0% 63.3% 65.4% 63.5% 61.9% 60.0% 50.0% 57.7% 67.8%Dining 40.0% 41.7% 38.8% 52.9% 40.0% 43.3% 53.8% 41.3% 33.3% 40.0% 41.7% 39.4% 42.6%Nightlife/entertainment 6.7% 1.7% 0.0% 0.0% 0.0% 4.2% 3.8% 1.6% 2.4% 0.0% 8.3% 5.6% 0.9%Going to Church 8.3% 8.3% 10.2% 5.9% 13.3% 5.8% 15.4% 1.6% 21.4% 10.0% 0.0% 7.0% 9.6%Conducting business 8.3% 13.3% 20.4% 0.0% 8.3% 14.2% 15.4% 9.5% 19.0% 0.0% 25.0% 16.9% 9.6%Government/Post Office 3.3% 3.3% 12.2% 0.0% 8.3% 4.2% 3.8% 11.1% 2.4% 0.0% 0.0% 2.8% 7.0%This is my first visit to downtown Sikeston 13.3% 11.7% 4.1% 11.8% 10.0% 9.2% 7.7% 12.7% 4.8% 10.0% 0.0% 8.5% 11.3%Other (please specify) 3.3% 6.7% 8.2% 11.8% 3.3% 8.3% 0.0% 6.3% 4.8% 20.0% 8.3% 8.5% 5.2%
GenderAge Children < 18 Household Income
8. What are the top two reasons you most often visit downtown Sikeston?
7e) Going to church
7f) Conducting business
7g) Government/Post Office
7h) Live theater
7a) Special event
7b) Shopping
7c) Dining
7d) Nightlife/entertainment
GenderAge Household IncomeChildren < 18
October 200982131-03 VI-2 UNICOM-ARC
Downtown Revitalization and Economic Assistance for MissouriVisitor Survey ReportFinal Survey Findings and Results Sikeston, MO
18-34 35-49 50-64 65 or over Yes No Under $25,000
$25,000 to $49,999
$50,000 to $74,999
$75,000 to $99,999
$100,000 plus Male Female
% % % % % % % % % % % % %Very easy 55.0% 54.2% 61.2% 58.8% 49.2% 60.0% 61.5% 59.7% 52.4% 60.0% 58.3% 54.9% 57.9%Somewhat easy 23.3% 25.4% 30.6% 17.6% 33.9% 22.5% 23.1% 25.8% 31.0% 20.0% 25.0% 33.8% 20.2%Somewhat difficult 6.7% 10.2% 4.1% 0.0% 10.2% 3.3% 7.7% 4.8% 9.5% 10.0% 0.0% 2.8% 8.8%Very difficult 3.3% 0.0% 0.0% 0.0% 0.0% 1.7% 0.0% 1.6% 2.4% 0.0% 0.0% 0.0% 1.8%I don't know 11.7% 10.2% 4.1% 23.5% 6.8% 12.5% 7.7% 8.1% 4.8% 10.0% 16.7% 8.5% 11.4%Very/Somewhat easy 78.3% 79.7% 91.8% 76.5% 83.1% 82.5% 84.6% 85.5% 83.3% 80.0% 83.3% 88.7% 78.1%Very/Somewhat difficult 10.0% 10.2% 4.1% 0.0% 10.2% 5.0% 7.7% 6.5% 11.9% 10.0% 0.0% 2.8% 10.5%
18-34 35-49 50-64 65 or over Yes No Under $25,000
$25,000 to $49,999
$50,000 to $74,999
$75,000 to $99,999
$100,000 plus Male Female
% % % % % % % % % % % % %Very convenient 28.3% 33.3% 49.0% 47.1% 33.3% 40.0% 26.9% 38.1% 35.7% 50.0% 25.0% 42.3% 33.9%Somewhat convenient 43.3% 36.7% 34.7% 23.5% 45.0% 34.2% 53.8% 44.4% 38.1% 20.0% 25.0% 33.8% 39.1%Somewhat inconvenient 15.0% 21.7% 10.2% 0.0% 13.3% 12.5% 11.5% 9.5% 19.0% 20.0% 33.3% 15.5% 13.9%Very inconvenient 1.7% 0.0% 0.0% 0.0% 1.7% 0.0% 0.0% 1.6% 0.0% 0.0% 0.0% 0.0% 0.9%I don't know 11.7% 8.3% 6.1% 29.4% 6.7% 13.3% 7.7% 6.3% 7.1% 10.0% 16.7% 8.5% 12.2%Very/Somewhat convenient 71.7% 70.0% 83.7% 70.6% 78.3% 74.2% 80.8% 82.5% 73.8% 70.0% 50.0% 76.1% 73.0%Very/Somewhat inconvenient 16.7% 21.7% 10.2% 0.0% 15.0% 12.5% 11.5% 11.1% 19.0% 20.0% 33.3% 15.5% 14.8%
18-34 35-49 50-64 65 or over Yes No Under $25,000
$25,000 to $49,999
$50,000 to $74,999
$75,000 to $99,999
$100,000 plus Male Female
% % % % % % % % % % % % %Very convenient 30.5% 28.3% 40.8% 58.8% 31.7% 37.0% 30.8% 33.3% 33.3% 60.0% 9.1% 35.7% 34.8%Somewhat convenient 37.3% 40.0% 40.8% 23.5% 41.7% 37.0% 46.2% 36.5% 35.7% 20.0% 72.7% 35.7% 39.1%Somewhat inconvenient 11.9% 10.0% 8.2% 0.0% 8.3% 9.2% 7.7% 12.7% 11.9% 10.0% 0.0% 10.0% 8.7%Very inconvenient 0.0% 5.0% 0.0% 0.0% 1.7% 1.7% 3.8% 1.6% 2.4% 0.0% 0.0% 4.3% 0.0%I don't know 20.3% 16.7% 10.2% 17.6% 16.7% 15.1% 11.5% 15.9% 16.7% 10.0% 18.2% 14.3% 17.4%Very/Somewhat convenient 67.8% 68.3% 81.6% 82.4% 73.3% 73.9% 76.9% 69.8% 69.0% 80.0% 81.8% 71.4% 73.9%Very/Somewhat inconvenient 11.9% 15.0% 8.2% 0.0% 10.0% 10.9% 11.5% 14.3% 14.3% 10.0% 0.0% 14.3% 8.7%
18-34 35-49 50-64 65 or over Yes No Under $25,000
$25,000 to $49,999
$50,000 to $74,999
$75,000 to $99,999
$100,000 plus Male Female
% % % % % % % % % % % % %Feel very safe all of the time 45.0% 55.9% 63.3% 64.7% 51.7% 58.8% 46.2% 54.0% 59.5% 70.0% 63.6% 63.4% 50.0%Feel safe most of the time 38.3% 30.5% 26.5% 17.6% 38.3% 26.1% 42.3% 33.3% 31.0% 0.0% 27.3% 25.4% 34.2%Do not feel safe at all 0.0% 0.0% 0.0% 0.0% 0.0% 0.0% 0.0% 0.0% 0.0% 0.0% 0.0% 0.0% 0.0%Feel unsafe some of the time 0.0% 5.1% 4.1% 0.0% 0.0% 4.2% 0.0% 3.2% 0.0% 10.0% 0.0% 1.4% 3.5%I don't know 16.7% 8.5% 6.1% 17.6% 10.0% 10.9% 11.5% 9.5% 9.5% 20.0% 9.1% 9.9% 12.3%Feel safe most/all of the time 83.3% 86.4% 89.8% 82.4% 90.0% 84.9% 88.5% 87.3% 90.5% 70.0% 90.9% 88.7% 84.2%Do not feel safe some/all of the time 0.0% 5.1% 4.1% 0.0% 0.0% 4.2% 0.0% 3.2% 0.0% 10.0% 0.0% 1.4% 3.5%
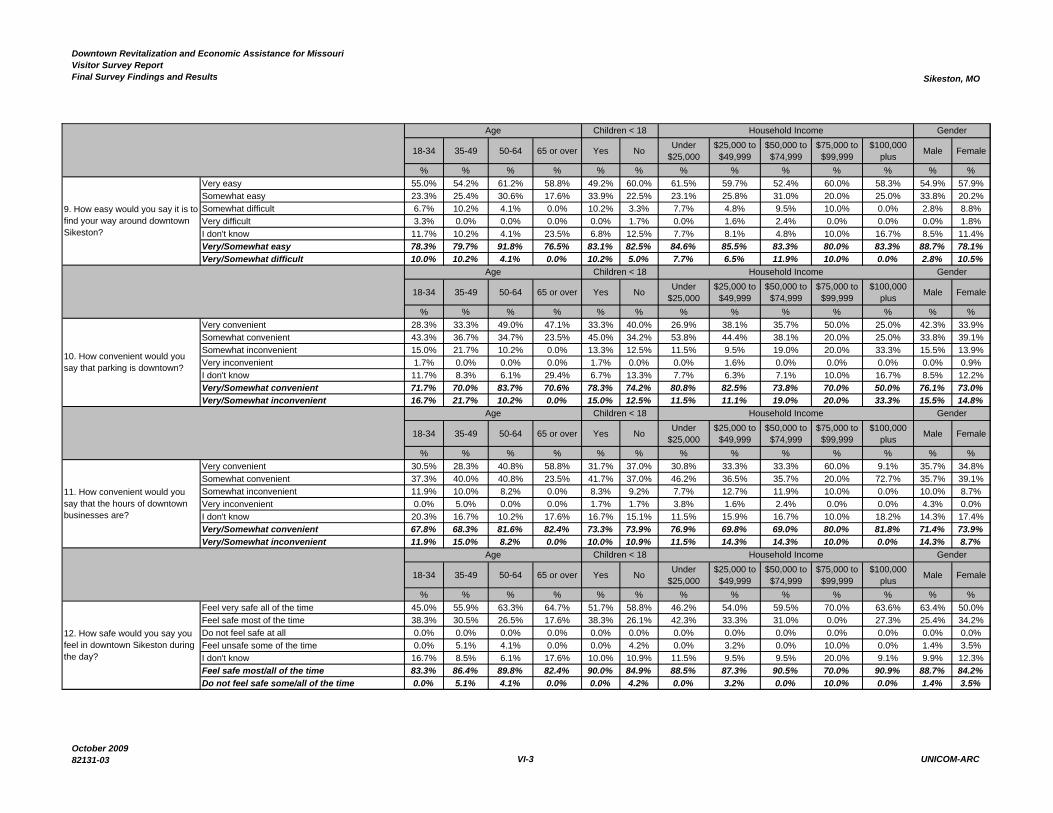
12. How safe would you say you feel in downtown Sikeston during the day?
11. How convenient would you say that the hours of downtown businesses are?
Age Children < 18 Household Income Gender
9. How easy would you say it is to find your way around downtown Sikeston?
Age Children < 18 Household Income Gender
10. How convenient would you say that parking is downtown?
Age Children < 18 Household Income Gender
Household Income GenderAge Children < 18
October 200982131-03 VI-3 UNICOM-ARC
Downtown Revitalization and Economic Assistance for MissouriVisitor Survey ReportFinal Survey Findings and Results Sikeston, MO
18-34 35-49 50-64 65 or over Yes No Under $25,000
$25,000 to $49,999
$50,000 to $74,999
$75,000 to $99,999
$100,000 plus Male Female
% % % % % % % % % % % % %Feel very safe all of the time 15.0% 25.0% 28.6% 23.5% 18.3% 25.8% 15.4% 22.2% 19.0% 30.0% 33.3% 32.4% 16.5%Feel safe most of the time 36.7% 35.0% 34.7% 23.5% 33.3% 34.2% 42.3% 36.5% 38.1% 20.0% 33.3% 32.4% 35.7%Do not feel safe at all 1.7% 1.7% 6.1% 0.0% 1.7% 2.5% 0.0% 3.2% 2.4% 10.0% 0.0% 2.8% 2.6%Feel unsafe some of the time 16.7% 8.3% 6.1% 17.6% 18.3% 8.3% 11.5% 14.3% 11.9% 10.0% 8.3% 11.3% 11.3%I don't know 30.0% 30.0% 24.5% 35.3% 28.3% 29.2% 30.8% 23.8% 28.6% 30.0% 25.0% 21.1% 33.9%Feel safe some/all of the time 51.7% 60.0% 63.3% 47.1% 51.7% 60.0% 57.7% 58.7% 57.1% 50.0% 66.7% 64.8% 52.2%Do not feel safe some/all of the time 18.3% 10.0% 12.2% 17.6% 20.0% 10.8% 11.5% 17.5% 14.3% 20.0% 8.3% 14.1% 13.9%
18-34 35-49 50-64 65 or over Yes No Under $25,000
$25,000 to $49,999
$50,000 to $74,999
$75,000 to $99,999
$100,000 plus Male Female
% % % % % % % % % % % % %Family restaurants 25.6% 34.9% 25.6% 14.0% 36.0% 58.1% 8.1% 39.5% 23.3% 2.3% 7.0% 32.6% 67.4%Fine dining 23.1% 26.9% 38.5% 11.5% 19.2% 76.9% 7.7% 23.1% 26.9% 15.4% 7.7% 53.8% 46.2%Outdoor dining 28.1% 37.5% 31.2% 3.1% 28.1% 71.9% 12.5% 28.1% 34.4% 6.2% 3.1% 43.8% 56.2%More special events 32.1% 32.1% 32.1% 3.6% 28.6% 67.9% 17.9% 25.0% 28.6% 17.9% 0.0% 17.9% 82.1%Bands/live concerts/outdoor music events 39.1% 43.5% 13.0% 4.3% 17.4% 82.6% 26.1% 39.1% 17.4% 4.3% 4.3% 47.8% 52.2%Bars/nightlife 66.7% 29.2% 4.2% 0.0% 20.8% 79.2% 16.7% 45.8% 12.5% 4.2% 4.2% 66.7% 33.3%Movie theater 33.3% 27.8% 33.3% 5.6% 27.8% 66.7% 22.2% 16.7% 16.7% 11.1% 5.6% 33.3% 66.7%Game room/arcade/pool room 80.0% 20.0% 0.0% 0.0% 60.0% 40.0% 0.0% 80.0% 0.0% 0.0% 0.0% 60.0% 40.0%Family events 23.5% 29.4% 41.2% 5.9% 52.9% 41.2% 11.8% 41.2% 29.4% 0.0% 5.9% 35.3% 64.7%Activities for teenagers 25.0% 25.0% 50.0% 0.0% 75.0% 25.0% 50.0% 25.0% 25.0% 0.0% 0.0% 25.0% 75.0%Skating rink 40.0% 40.0% 20.0% 0.0% 40.0% 60.0% 20.0% 40.0% 30.0% 0.0% 10.0% 50.0% 50.0%Arts Galleries/events 22.2% 0.0% 77.8% 0.0% 22.2% 77.8% 0.0% 22.2% 44.4% 0.0% 11.1% 22.2% 77.8%Children's attractions/activities 28.6% 57.1% 14.3% 0.0% 78.6% 21.4% 7.1% 42.9% 28.6% 7.1% 7.1% 14.3% 85.7%Other (Please specify below) 40.0% 20.0% 40.0% 0.0% 0.0% 100.0% 40.0% 20.0% 0.0% 0.0% 20.0% 20.0% 80.0%
18-34 35-49 50-64 65 or over Yes No Under $25,000
$25,000 to $49,999
$50,000 to $74,999
$75,000 to $99,999
$100,000 plus Male Female
% % % % % % % % % % % % %Clothing stores 39.6% 33.3% 20.8% 6.2% 43.8% 52.1% 18.8% 43.8% 20.8% 2.1% 4.2% 29.2% 70.8%More shops (in general) 32.6% 39.5% 20.9% 7.0% 30.2% 69.8% 9.3% 23.3% 27.9% 4.7% 2.3% 34.9% 65.1%Specialty/upscale shops 42.9% 28.6% 14.3% 14.3% 21.4% 78.6% 14.3% 21.4% 14.3% 14.3% 21.4% 42.9% 57.1%Shoe store 52.4% 28.6% 14.3% 4.8% 47.6% 47.6% 23.8% 42.9% 23.8% 4.8% 0.0% 19.0% 81.0%Antique shops 19.0% 38.1% 38.1% 4.8% 19.0% 81.0% 9.5% 42.9% 14.3% 9.5% 4.8% 28.6% 71.4%Farmer's market 25.0% 25.0% 41.7% 8.3% 20.8% 79.2% 12.5% 33.3% 33.3% 8.3% 4.2% 41.7% 58.3%Coffee shop/Internet cafe 50.0% 20.0% 30.0% 0.0% 35.0% 65.0% 25.0% 10.0% 35.0% 10.0% 10.0% 50.0% 50.0%Bookstore 30.4% 30.4% 30.4% 8.7% 34.8% 60.9% 4.3% 39.1% 30.4% 8.7% 13.0% 43.5% 56.5%Art galleries/shops 50.0% 37.5% 12.5% 0.0% 37.5% 62.5% 12.5% 37.5% 25.0% 0.0% 0.0% 50.0% 50.0%Bed and breakfasts/lodging 33.3% 33.3% 33.3% 0.0% 50.0% 50.0% 33.3% 33.3% 16.7% 16.7% 0.0% 16.7% 83.3%Soda fountain/Ice cream shop 16.7% 50.0% 33.3% 0.0% 66.7% 33.3% 0.0% 33.3% 50.0% 0.0% 8.3% 58.3% 41.7%Candy store 16.7% 66.7% 16.7% 0.0% 16.7% 66.7% 33.3% 50.0% 16.7% 0.0% 0.0% 33.3% 66.7%Art supply/craft store 12.5% 37.5% 37.5% 12.5% 25.0% 62.5% 0.0% 50.0% 0.0% 25.0% 12.5% 12.5% 87.5%Other (please specify below) 41.7% 16.7% 25.0% 16.7% 16.7% 75.0% 16.7% 33.3% 0.0% 8.3% 8.3% 41.7% 58.3%
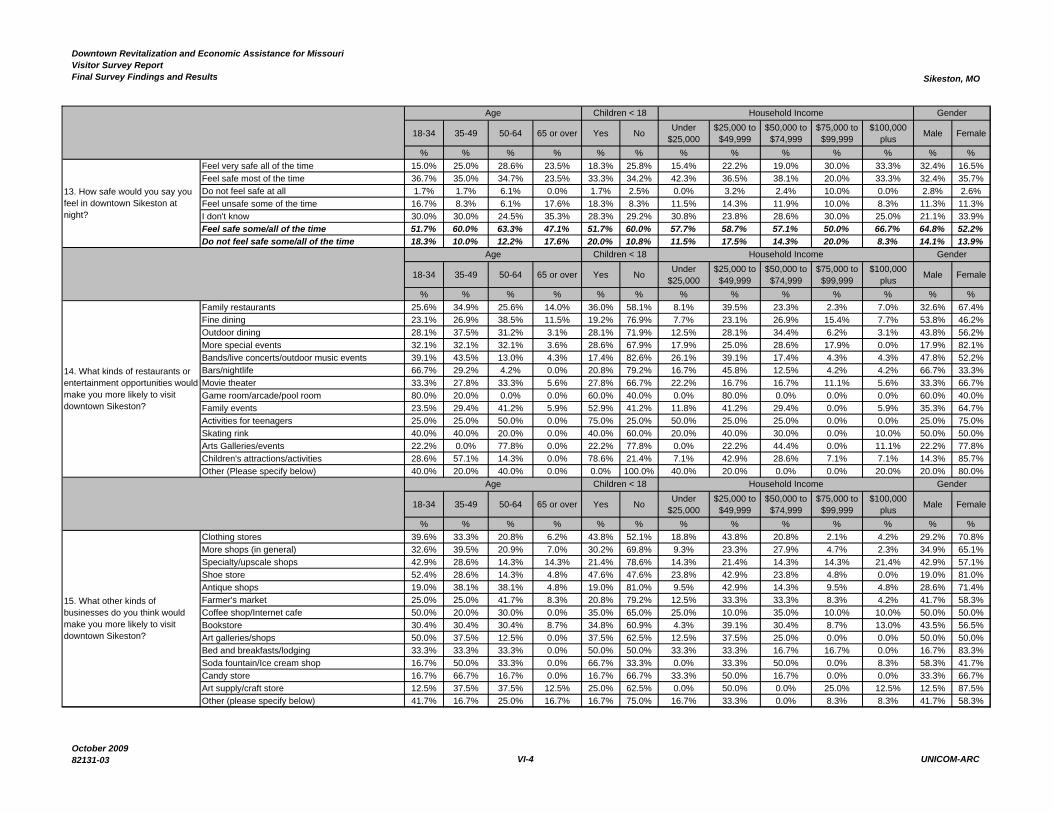
15. What other kinds of businesses do you think would make you more likely to visit downtown Sikeston?
13. How safe would you say you feel in downtown Sikeston at night?
Age Children < 18 Household Income Gender
14. What kinds of restaurants or entertainment opportunities would make you more likely to visit downtown Sikeston?
Age Children < 18 Household Income Gender
Age Children < 18 Household Income Gender
October 200982131-03 VI-4 UNICOM-ARC
Downtown Revitalization and Economic Assistance for MissouriVisitor Survey ReportFinal Survey Findings and Results Sikeston, MO
18-34 35-49 50-64 65 or over Yes No Under $25,000
$25,000 to $49,999
$50,000 to $74,999
$75,000 to $99,999
$100,000 plus Male Female
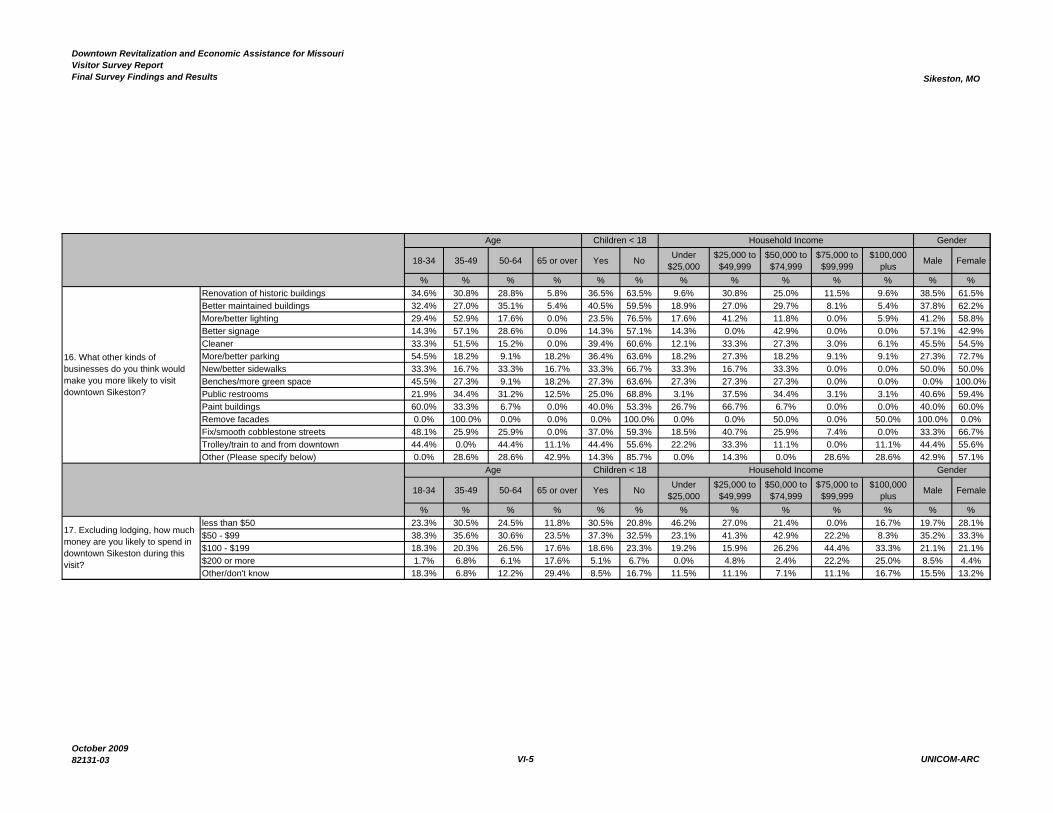
% % % % % % % % % % % % %Renovation of historic buildings 34.6% 30.8% 28.8% 5.8% 36.5% 63.5% 9.6% 30.8% 25.0% 11.5% 9.6% 38.5% 61.5%Better maintained buildings 32.4% 27.0% 35.1% 5.4% 40.5% 59.5% 18.9% 27.0% 29.7% 8.1% 5.4% 37.8% 62.2%More/better lighting 29.4% 52.9% 17.6% 0.0% 23.5% 76.5% 17.6% 41.2% 11.8% 0.0% 5.9% 41.2% 58.8%Better signage 14.3% 57.1% 28.6% 0.0% 14.3% 57.1% 14.3% 0.0% 42.9% 0.0% 0.0% 57.1% 42.9%Cleaner 33.3% 51.5% 15.2% 0.0% 39.4% 60.6% 12.1% 33.3% 27.3% 3.0% 6.1% 45.5% 54.5%More/better parking 54.5% 18.2% 9.1% 18.2% 36.4% 63.6% 18.2% 27.3% 18.2% 9.1% 9.1% 27.3% 72.7%New/better sidewalks 33.3% 16.7% 33.3% 16.7% 33.3% 66.7% 33.3% 16.7% 33.3% 0.0% 0.0% 50.0% 50.0%Benches/more green space 45.5% 27.3% 9.1% 18.2% 27.3% 63.6% 27.3% 27.3% 27.3% 0.0% 0.0% 0.0% 100.0%Public restrooms 21.9% 34.4% 31.2% 12.5% 25.0% 68.8% 3.1% 37.5% 34.4% 3.1% 3.1% 40.6% 59.4%Paint buildings 60.0% 33.3% 6.7% 0.0% 40.0% 53.3% 26.7% 66.7% 6.7% 0.0% 0.0% 40.0% 60.0%Remove facades 0.0% 100.0% 0.0% 0.0% 0.0% 100.0% 0.0% 0.0% 50.0% 0.0% 50.0% 100.0% 0.0%Fix/smooth cobblestone streets 48.1% 25.9% 25.9% 0.0% 37.0% 59.3% 18.5% 40.7% 25.9% 7.4% 0.0% 33.3% 66.7%Trolley/train to and from downtown 44.4% 0.0% 44.4% 11.1% 44.4% 55.6% 22.2% 33.3% 11.1% 0.0% 11.1% 44.4% 55.6%Other (Please specify below) 0.0% 28.6% 28.6% 42.9% 14.3% 85.7% 0.0% 14.3% 0.0% 28.6% 28.6% 42.9% 57.1%
18-34 35-49 50-64 65 or over Yes No Under $25,000
$25,000 to $49,999
$50,000 to $74,999
$75,000 to $99,999
$100,000 plus Male Female
% % % % % % % % % % % % %less than $50 23.3% 30.5% 24.5% 11.8% 30.5% 20.8% 46.2% 27.0% 21.4% 0.0% 16.7% 19.7% 28.1%$50 - $99 38.3% 35.6% 30.6% 23.5% 37.3% 32.5% 23.1% 41.3% 42.9% 22.2% 8.3% 35.2% 33.3%$100 - $199 18.3% 20.3% 26.5% 17.6% 18.6% 23.3% 19.2% 15.9% 26.2% 44.4% 33.3% 21.1% 21.1%$200 or more 1.7% 6.8% 6.1% 17.6% 5.1% 6.7% 0.0% 4.8% 2.4% 22.2% 25.0% 8.5% 4.4%Other/don't know 18.3% 6.8% 12.2% 29.4% 8.5% 16.7% 11.5% 11.1% 7.1% 11.1% 16.7% 15.5% 13.2%
17. Excluding lodging, how much money are you likely to spend in downtown Sikeston during this visit?
16. What other kinds of businesses do you think would make you more likely to visit downtown Sikeston?
Age Children < 18
Age Children < 18
Household Income Gender
Household Income Gender
October 200982131-03 VI-5 UNICOM-ARC
Downtown Revitalization and Economic Assistance for MissouriVisitor Survey ReportFinal Survey Findings and Results Sikeston, MO
18-34 35-49 50-64 65 or over Yes No Under $25,000
$25,000 to $49,999
$50,000 to $74,999
$75,000 to $99,999
$100,000 plus Male Female
% % % % % % % % % % % % %Yes 68.3% 62.7% 58.3% 52.9% 68.3% 61.3% 64.0% 66.7% 61.9% 70.0% 33.3% 42.3% 75.2%No 30.0% 33.9% 41.7% 47.1% 30.0% 37.0% 36.0% 33.3% 35.7% 30.0% 58.3% 56.3% 23.0%I don't know 1.7% 3.4% 0.0% 0.0% 1.7% 1.7% 0.0% 0.0% 2.4% 0.0% 8.3% 1.4% 1.8%Yes 23.3% 20.3% 21.3% 11.8% 16.9% 22.9% 15.4% 24.2% 22.0% 20.0% 18.2% 28.6% 15.9%No 75.0% 78.0% 76.6% 88.2% 83.1% 74.6% 84.6% 75.8% 75.6% 80.0% 72.7% 71.4% 81.4%I don't know 1.7% 1.7% 2.1% 0.0% 0.0% 2.5% 0.0% 0.0% 2.4% 0.0% 9.1% 0.0% 2.7%Yes 53.3% 33.9% 26.7% 29.4% 41.4% 37.6% 34.6% 41.0% 43.9% 0.0% 45.5% 47.1% 32.4%No 46.7% 62.7% 71.1% 70.6% 56.9% 60.7% 65.4% 59.0% 53.7% 100.0% 45.5% 51.4% 65.8%I don't know 0.0% 3.4% 2.2% 0.0% 1.7% 1.7% 0.0% 0.0% 2.4% 0.0% 9.1% 1.4% 1.8%Yes 36.7% 38.3% 60.4% 41.2% 47.5% 42.5% 46.2% 53.2% 35.7% 20.0% 25.0% 35.2% 49.1%No 61.7% 56.7% 37.5% 58.8% 50.8% 54.2% 53.8% 46.8% 57.1% 70.0% 66.7% 62.0% 48.2%I don't know 1.7% 5.0% 2.1% 0.0% 1.7% 3.3% 0.0% 0.0% 7.1% 10.0% 8.3% 2.8% 2.6%Yes 31.7% 37.3% 27.7% 23.5% 32.2% 33.1% 34.6% 27.4% 31.7% 10.0% 45.5% 51.4% 19.5%No 66.7% 57.6% 70.2% 76.5% 66.1% 63.6% 65.4% 72.6% 61.0% 90.0% 45.5% 45.7% 77.9%I don't know 1.7% 5.1% 2.1% 0.0% 1.7% 3.4% 0.0% 0.0% 7.3% 0.0% 9.1% 2.9% 2.7%Yes 38.3% 45.0% 48.9% 35.3% 37.3% 46.2% 26.9% 45.2% 52.4% 40.0% 36.4% 38.0% 46.0%No 61.7% 53.3% 51.1% 58.8% 62.7% 52.1% 73.1% 54.8% 47.6% 50.0% 54.5% 60.6% 53.1%I don't know 0.0% 1.7% 0.0% 5.9% 0.0% 1.7% 0.0% 0.0% 0.0% 10.0% 9.1% 1.4% 0.9%Yes 40.0% 50.0% 47.9% 47.1% 55.9% 40.8% 30.8% 46.8% 47.6% 60.0% 75.0% 50.7% 43.0%No 58.3% 48.3% 45.8% 52.9% 44.1% 55.0% 65.4% 53.2% 50.0% 30.0% 16.7% 49.3% 52.6%I don't know 1.7% 1.7% 6.2% 0.0% 0.0% 4.2% 3.8% 0.0% 2.4% 10.0% 8.3% 0.0% 4.4%Yes 25.0% 23.3% 14.6% 11.8% 13.6% 23.3% 7.7% 16.1% 14.3% 20.0% 58.3% 46.5% 4.4%No 73.3% 75.0% 83.3% 82.4% 86.4% 73.3% 92.3% 83.9% 83.3% 70.0% 33.3% 52.1% 93.0%I don't know 1.7% 1.7% 2.1% 5.9% 0.0% 3.3% 0.0% 0.0% 2.4% 10.0% 8.3% 1.4% 2.6%
18-34 35-49 50-64 65 or over Yes No Under $25,000
$25,000 to $49,999
$50,000 to $74,999
$75,000 to $99,999
$100,000 plus Male Female
% % % % % % % % % % % % %18-34 100.0% 0.0% 0.0% 0.0% 36.7% 30.8% 61.5% 36.5% 19.0% 20.0% 25.0% 35.2% 30.4%35-49 0.0% 100.0% 0.0% 0.0% 38.3% 26.7% 15.4% 34.9% 42.9% 20.0% 41.7% 38.0% 28.7%50-64 0.0% 0.0% 100.0% 0.0% 25.0% 28.3% 19.2% 22.2% 33.3% 40.0% 25.0% 15.5% 33.0%65 or over 0.0% 0.0% 0.0% 100.0% 0.0% 14.2% 3.8% 6.3% 4.8% 20.0% 8.3% 11.3% 7.8%
18-34 35-49 50-64 65 or over Yes No Under $25,000
$25,000 to $49,999
$50,000 to $74,999
$75,000 to $99,999
$100,000 plus Male Female
% % % % % % % % % % % % %Yes 36.7% 38.3% 30.6% 0.0% 100.0% 0.0% 30.8% 34.9% 40.5% 20.0% 25.0% 29.6% 33.9%No 61.7% 53.3% 69.4% 100.0% 0.0% 100.0% 65.4% 61.9% 57.1% 70.0% 75.0% 66.2% 63.5%Other, don't know 1.7% 8.3% 0.0% 0.0% 0.0% 0.0% 3.8% 3.2% 2.4% 10.0% 0.0% 4.2% 2.6%
20. Did any children under the age of 18 come with you downtown today?.
Gender
19. In which of the following age groups are you?
Age Children < 18 Household Income Gender
Age Children < 18 Household Income
18e) Hunting/fishing
18f) Walking/hiking
18g) Fine dining
Age Children < 18 Household Income Gender
18h) Golf
18a) Retail/boutique shopping
18b) Biking
18c) Camping
18d) Antique shopping
October 200982131-03 VI-6 UNICOM-ARC
Downtown Revitalization and Economic Assistance for MissouriVisitor Survey ReportFinal Survey Findings and Results Sikeston, MO
18-34 35-49 50-64 65 or over Yes No Under $25,000
$25,000 to $49,999
$50,000 to $74,999
$75,000 to $99,999
$100,000 plus Male Female
% % % % % % % % % % % % %Under $25,000 26.7% 6.7% 10.2% 5.9% 13.3% 14.2% 100.0% 0.0% 0.0% 0.0% 0.0% 9.9% 16.5%$25,000 to $49,999 38.3% 36.7% 28.6% 23.5% 36.7% 32.5% 0.0% 100.0% 0.0% 0.0% 0.0% 25.4% 39.1%$50,000 to $74,999 13.3% 30.0% 28.6% 11.8% 28.3% 20.0% 0.0% 0.0% 100.0% 0.0% 0.0% 21.1% 23.5%$75,000 to $99,999 3.3% 3.3% 8.2% 11.8% 3.3% 5.8% 0.0% 0.0% 0.0% 100.0% 0.0% 2.8% 7.0%$100,000 plus 5.0% 8.3% 6.1% 5.9% 5.0% 7.5% 0.0% 0.0% 0.0% 0.0% 100.0% 12.7% 2.6%Other, don’t know, refused 13.3% 15.0% 18.4% 41.2% 13.3% 20.0% 0.0% 0.0% 0.0% 0.0% 0.0% 28.2% 11.3%
18-34 35-49 50-64 65 or over Yes No Under $25,000
$25,000 to $49,999
$50,000 to $74,999
$75,000 to $99,999
$100,000 plus Male Female
% % % % % % % % % % % % %Male 41.7% 45.0% 22.4% 47.1% 35.0% 39.2% 26.9% 28.6% 35.7% 20.0% 75.0% 100.0% 0.0%Female 58.3% 55.0% 77.6% 52.9% 65.0% 60.8% 73.1% 71.4% 64.3% 80.0% 25.0% 0.0% 100.0%
22. Gender
Household Income Gender
21. Which category that best describes your annual household income?
Age Children < 18 Household Income Gender
Age Children < 18
October 200982131-03 VI-7 UNICOM-ARC