Embed Size (px)
Citation preview

Doyle J. GirouardCEO and Senior Managing Partner
The Cypress GroupMay, 2013
“An Industry Snapshot, and
Look into the Future”
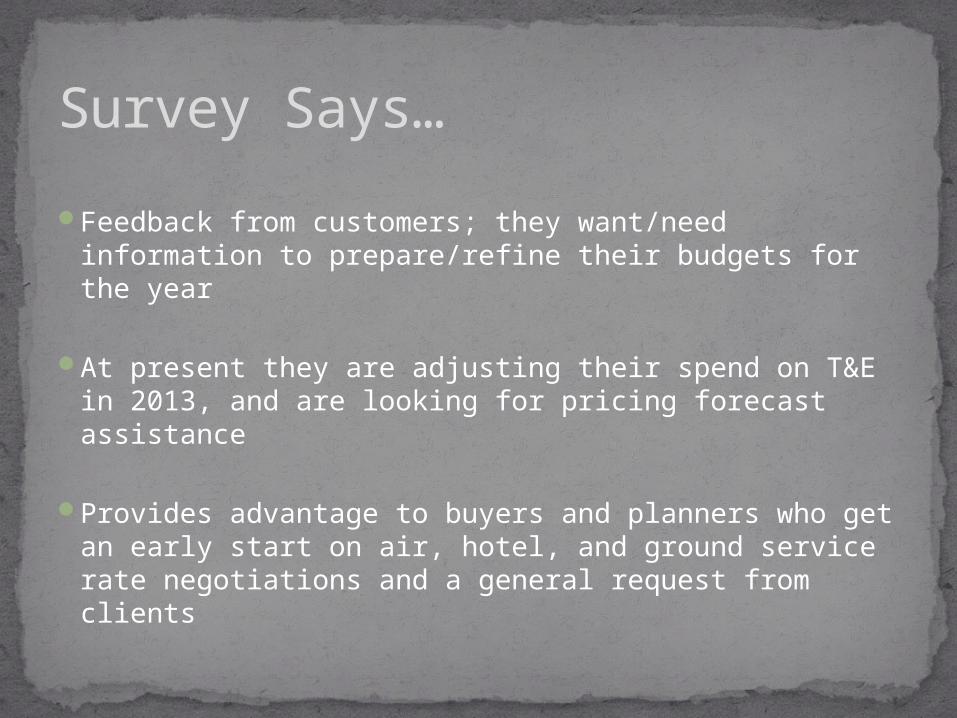
Feedback from customers; they want/need information to prepare/refine their budgets for the year
At present they are adjusting their spend on T&E in 2013, and are looking for pricing forecast assistance
Provides advantage to buyers and planners who get
an early start on air, hotel, and ground service rate negotiations and a general request from clients
Survey Says…
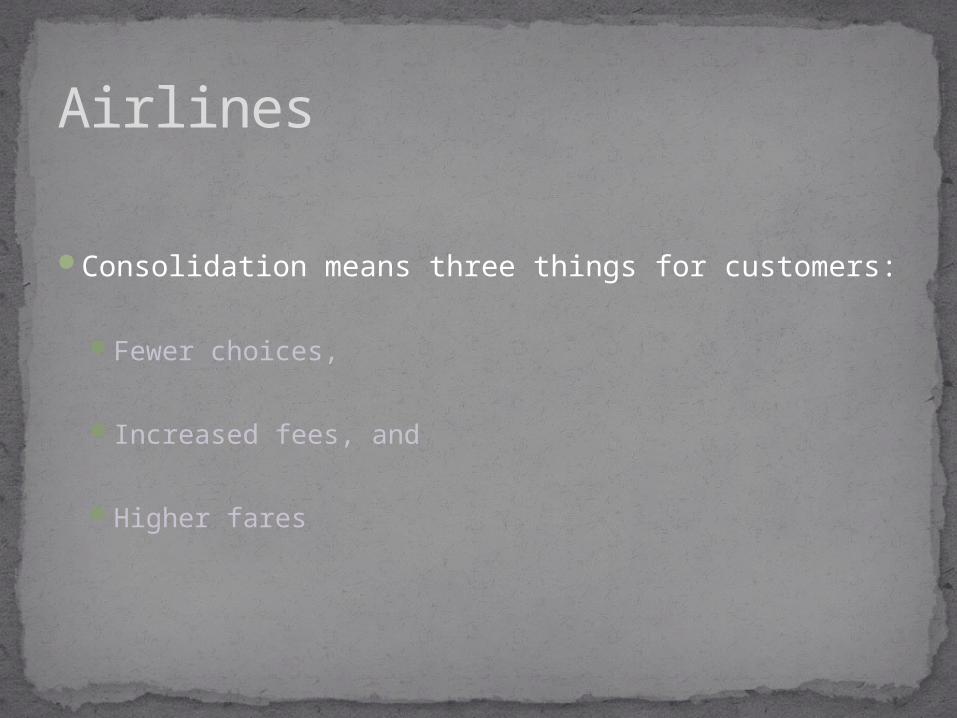
Consolidation means three things for customers:
Fewer choices,
Increased fees, and
Higher fares
Airlines
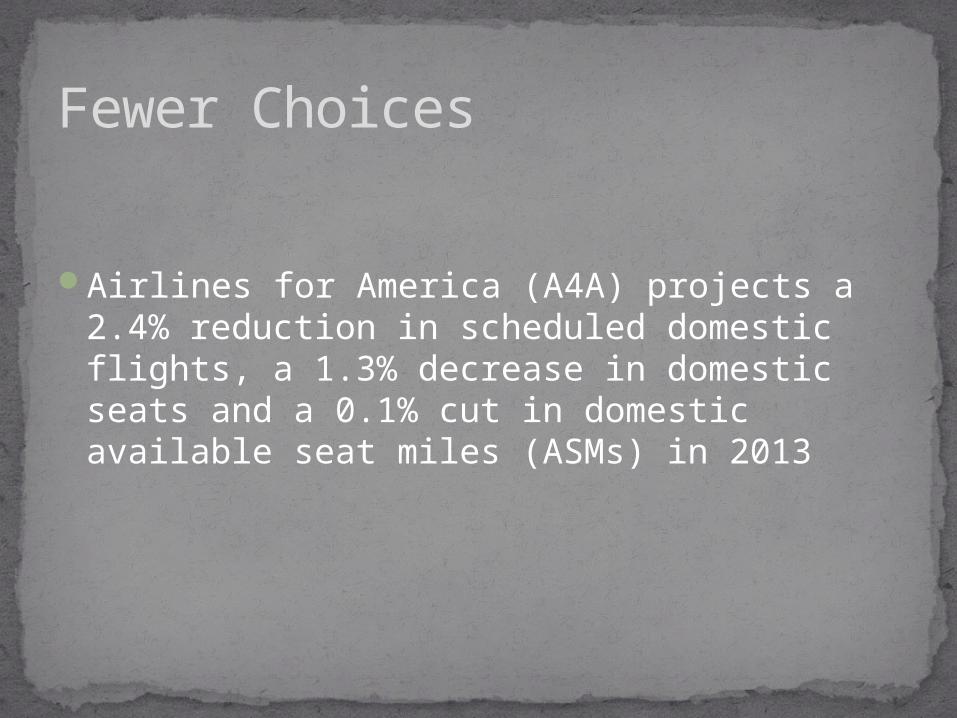
Airlines for America (A4A) projects a 2.4% reduction in scheduled domestic flights, a 1.3% decrease in domestic seats and a 0.1% cut in domestic available seat miles (ASMs) in 2013
Fewer Choices
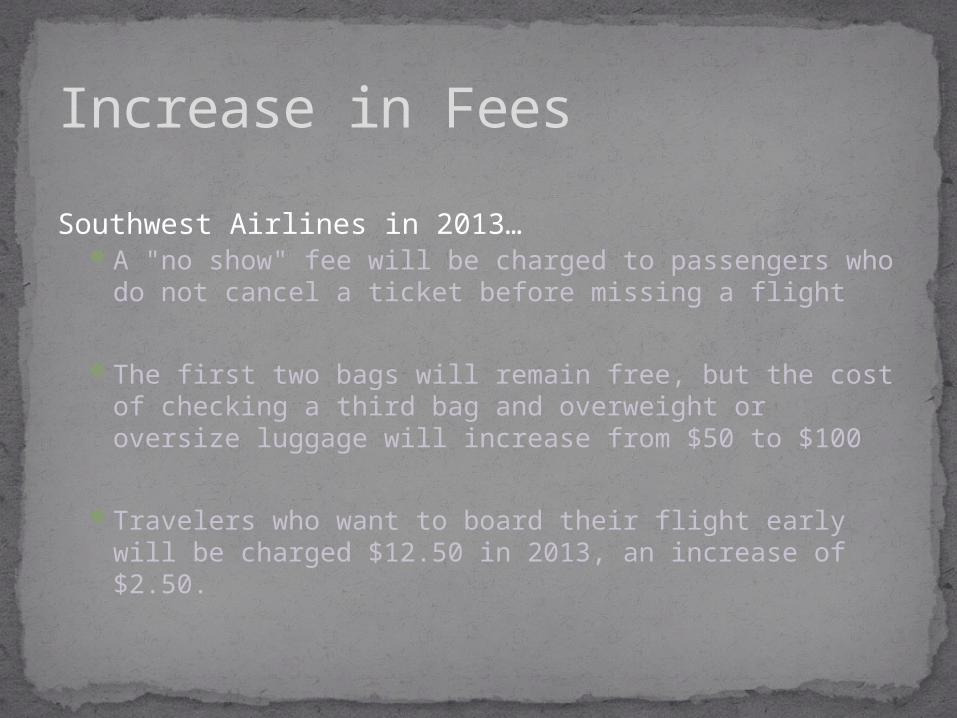
Southwest Airlines in 2013…A "no show" fee will be charged to passengers
who do not cancel a ticket before missing a flight
The first two bags will remain free, but the cost of checking a third bag and overweight or oversize luggage will increase from $50 to $100
Travelers who want to board their flight early will be charged $12.50 in 2013, an increase of $2.50.
Increase in Fees
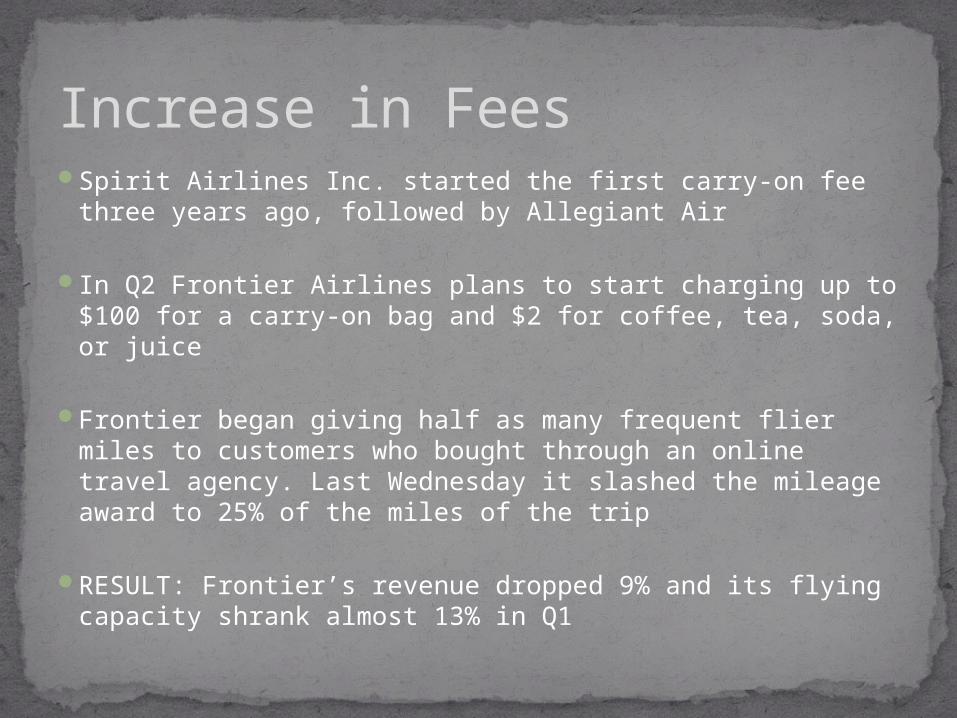
Spirit Airlines Inc. started the first carry-on fee three years ago, followed by Allegiant Air
In Q2 Frontier Airlines plans to start charging up to $100 for a carry-on bag and $2 for coffee, tea, soda, or juice
Frontier began giving half as many frequent flier miles to customers who bought through an online travel agency. Last Wednesday it slashed the mileage award to 25% of the miles of the trip
RESULT: Frontier’s revenue dropped 9% and its flying capacity shrank almost 13% in Q1
Increase in Fees
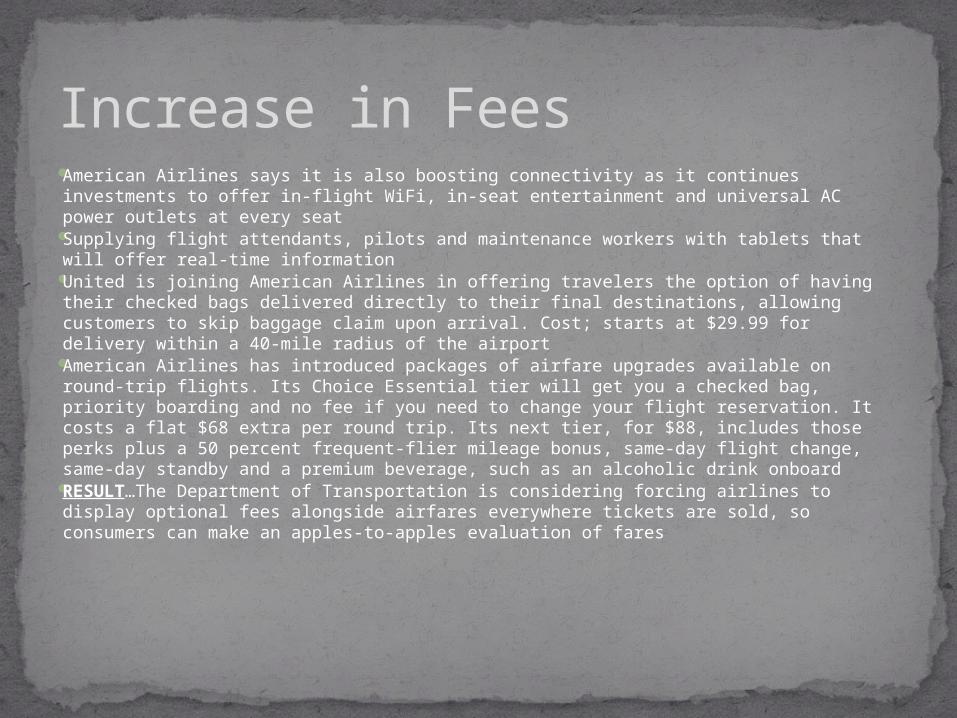
American Airlines says it is also boosting connectivity as it continues investments to offer in-flight WiFi, in-seat entertainment and universal AC power outlets at every seat
Supplying flight attendants, pilots and maintenance workers with tablets that will offer real-time information
United is joining American Airlines in offering travelers the option of having their checked bags delivered directly to their final destinations, allowing customers to skip baggage claim upon arrival. Cost; starts at $29.99 for delivery within a 40-mile radius of the airport
American Airlines has introduced packages of airfare upgrades available on round-trip flights. Its Choice Essential tier will get you a checked bag, priority boarding and no fee if you need to change your flight reservation. It costs a flat $68 extra per round trip. Its next tier, for $88, includes those perks plus a 50 percent frequent-flier mileage bonus, same-day flight change, same-day standby and a premium beverage, such as an alcoholic drink onboard
RESULT…The Department of Transportation is considering forcing airlines to display optional fees alongside airfares everywhere tickets are sold, so consumers can make an apples-to-apples evaluation of fares
Increase in Fees
Airline expenses have increased by 6.2% year over year
Offsetting a 5.6% increase in operating revenues
Higher Fares
Fares are typically driven by four main factors: competition, supply, demand, and oil prices
Domestic airline fares are estimated to increase by 3-6% in 2013
“Unbundling”…The top five U.S. carriers generated more than $12 billion in fees in 2012, with even more expected through 2013
Airline Fares/Fees
The year-to-date price of jet fuel averaged $3.08 per gallon, exceeding the record 2011 level of $3.00.
During 2012, fuel accounted for 34% of total airline operating expense
Airline Expenses
Strategic Competitive Advantage; Delta Airlines purchased the Phillips 66 “Trainer” refinery outside of Philadelphia, PA in 2012 for $150mm
Will spend $100mm to upgrade to jet fuel production
Refinery will produce more than 52,000 barrels of jet fuel per day, or 80% of Delta’s jet fuel needs in the Northeast
"Acquiring the Trainer refinery is an innovative approach to managing our largest expense," Delta CEO Richard Anderson said. "This modest investment, the equivalent of the list price of a new wide-body aircraft, will allow Delta to reduce its fuel expense by $300 million annually and ensure jet fuel availability in the Northeast."
Delta Airlines
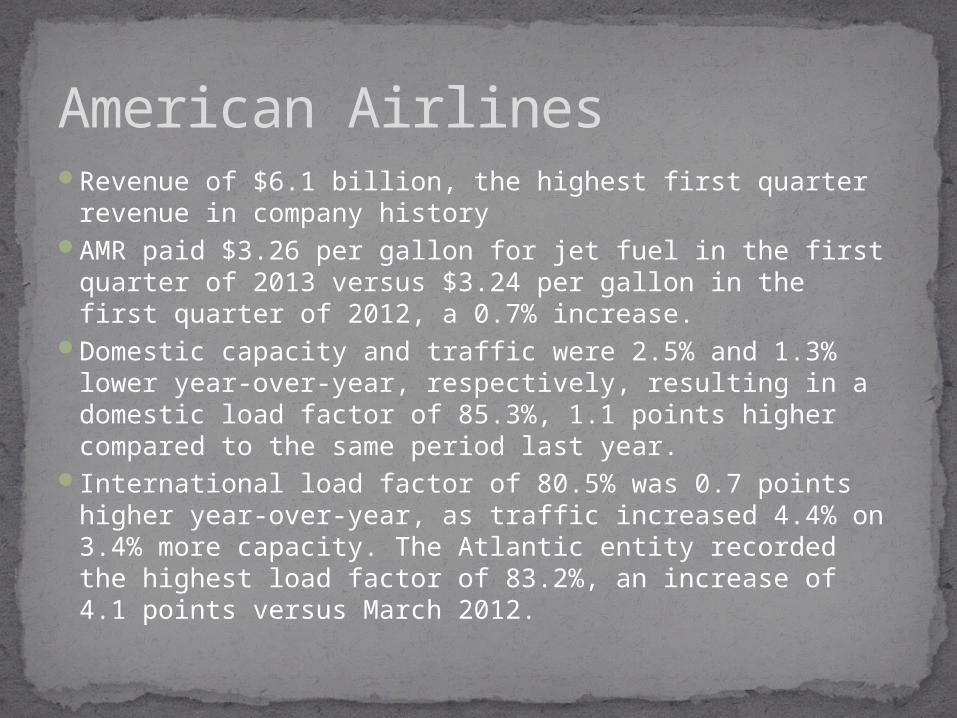
Revenue of $6.1 billion, the highest first quarter revenue in company history
AMR paid $3.26 per gallon for jet fuel in the first quarter of 2013 versus $3.24 per gallon in the first quarter of 2012, a 0.7% increase.
Domestic capacity and traffic were 2.5% and 1.3% lower year-over-year, respectively, resulting in a domestic load factor of 85.3%, 1.1 points higher compared to the same period last year.
International load factor of 80.5% was 0.7 points higher year-over-year, as traffic increased 4.4% on 3.4% more capacity. The Atlantic entity recorded the highest load factor of 83.2%, an increase of 4.1 points versus March 2012.
American Airlines
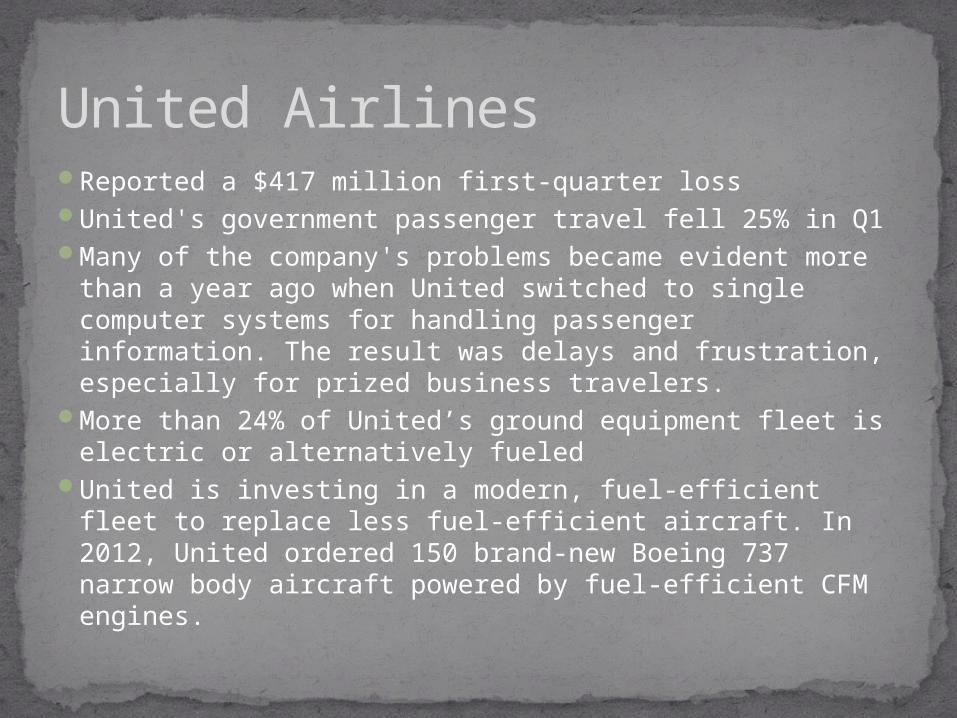
Reported a $417 million first-quarter lossUnited's government passenger travel fell 25% in Q1Many of the company's problems became evident more
than a year ago when United switched to single computer systems for handling passenger information. The result was delays and frustration, especially for prized business travelers.
More than 24% of United’s ground equipment fleet is electric or alternatively fueled
United is investing in a modern, fuel-efficient fleet to replace less fuel-efficient aircraft. In 2012, United ordered 150 brand-new Boeing 737 narrow body aircraft powered by fuel-efficient CFM engines.
United Airlines
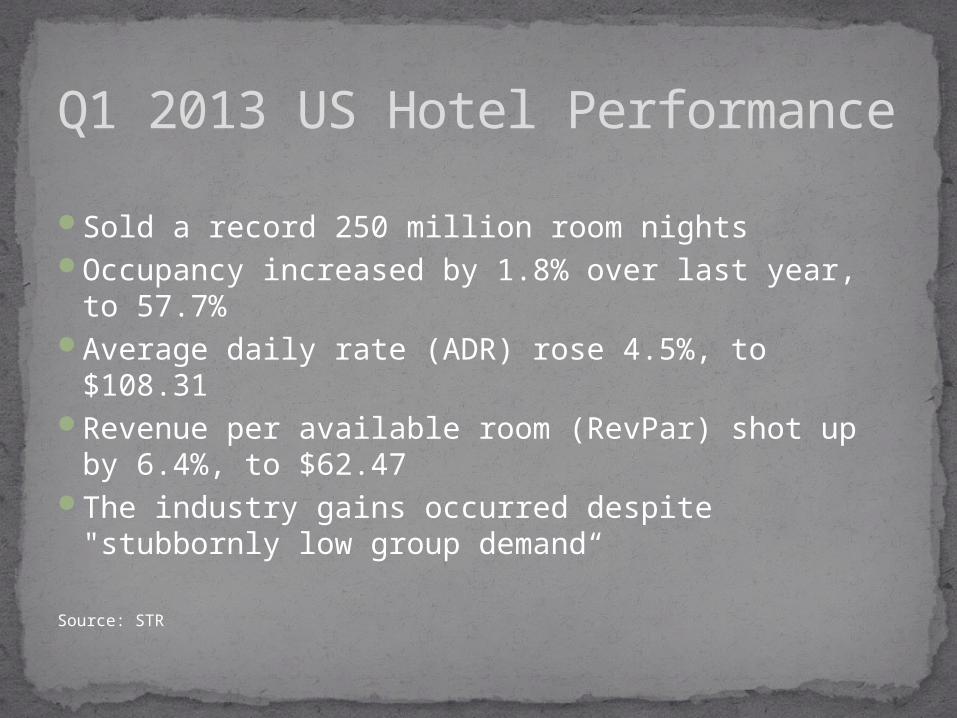
Sold a record 250 million room nightsOccupancy increased by 1.8% over last year, to
57.7%Average daily rate (ADR) rose 4.5%, to $108.31Revenue per available room (RevPar) shot up by
6.4%, to $62.47The industry gains occurred despite "stubbornly
low group demand“
Source: STR
Q1 2013 US Hotel Performance
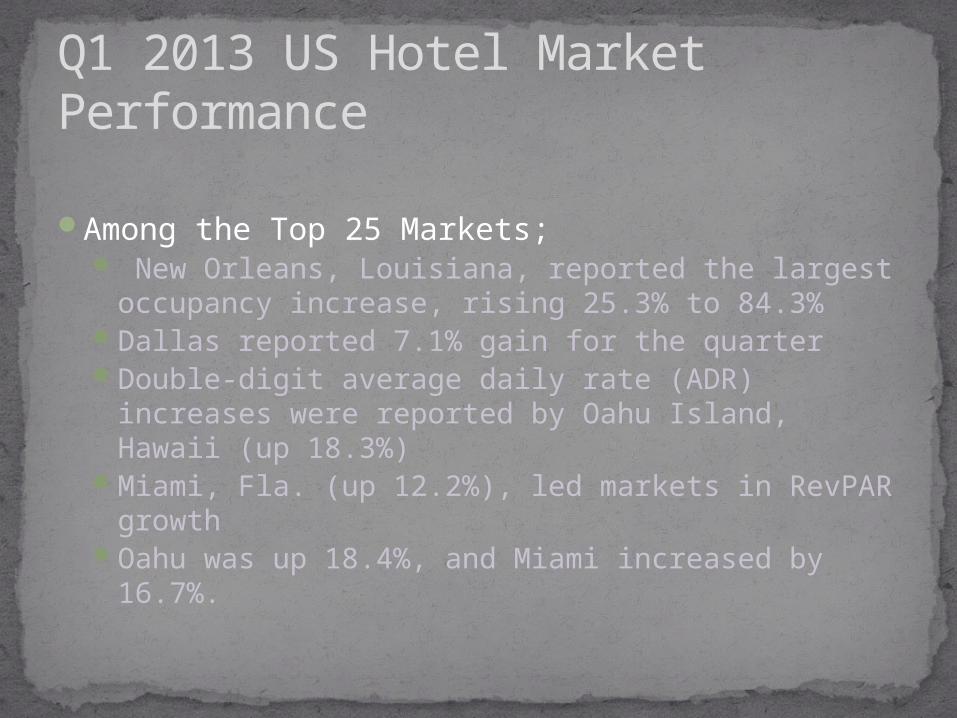
Among the Top 25 Markets; New Orleans, Louisiana, reported the largest
occupancy increase, rising 25.3% to 84.3%Dallas reported 7.1% gain for the quarterDouble-digit average daily rate (ADR) increases
were reported by Oahu Island, Hawaii (up 18.3%)
Miami, Fla. (up 12.2%), led markets in RevPAR growth
Oahu was up 18.4%, and Miami increased by 16.7%.
Q1 2013 US Hotel Market Performance
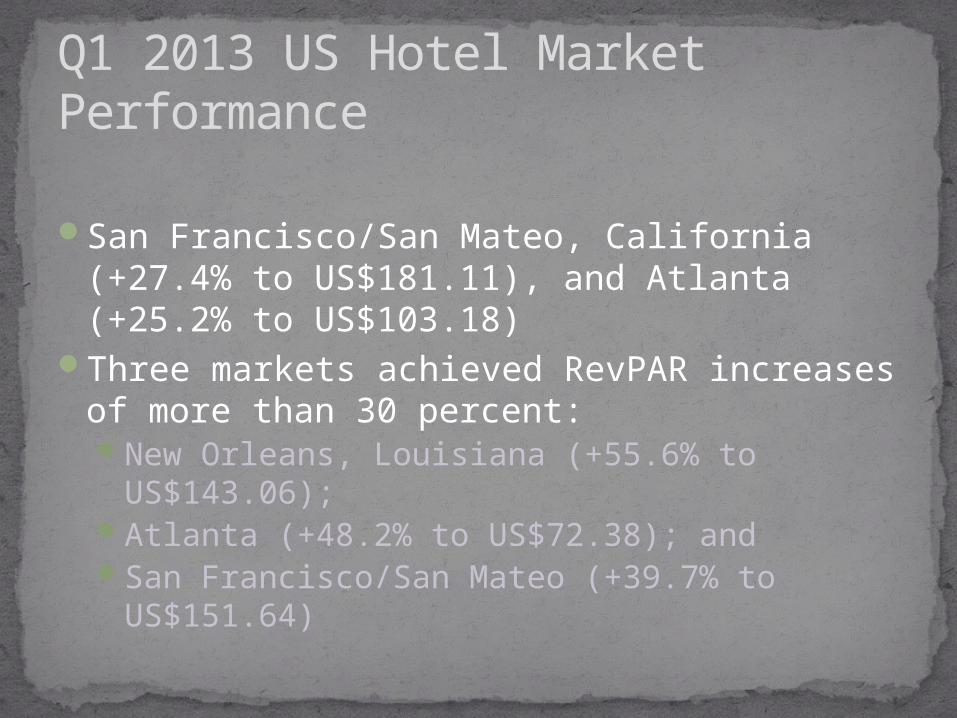
San Francisco/San Mateo, California (+27.4% to US$181.11), and Atlanta (+25.2% to US$103.18)
Three markets achieved RevPAR increases of more than 30 percent: New Orleans, Louisiana (+55.6% to
US$143.06); Atlanta (+48.2% to US$72.38); and San Francisco/San Mateo (+39.7% to
US$151.64)
Q1 2013 US Hotel Market Performance
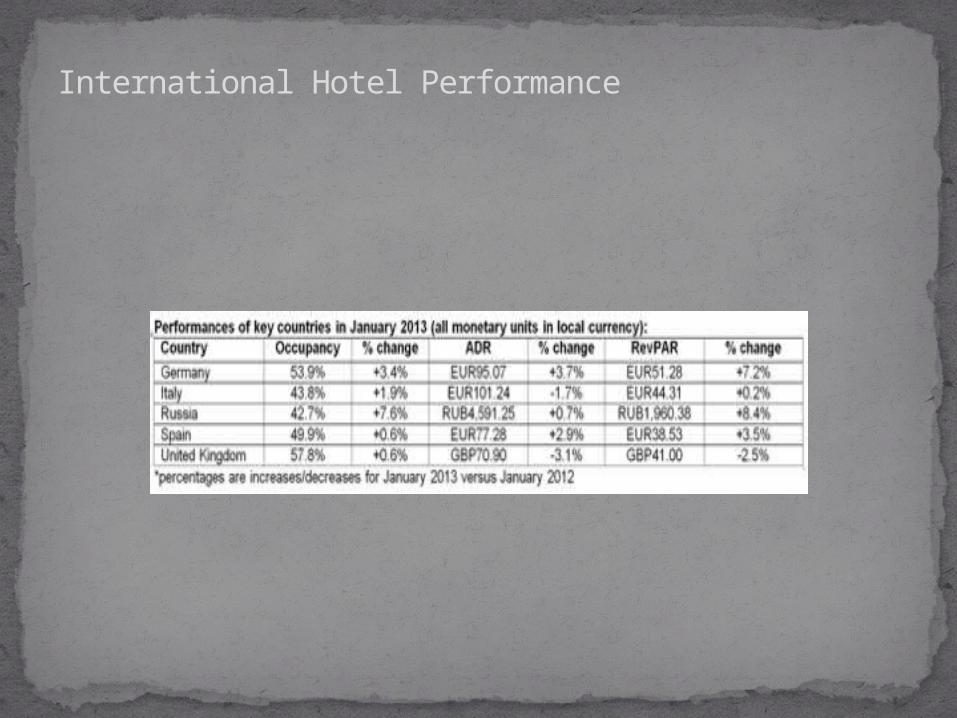
International Hotel Performance
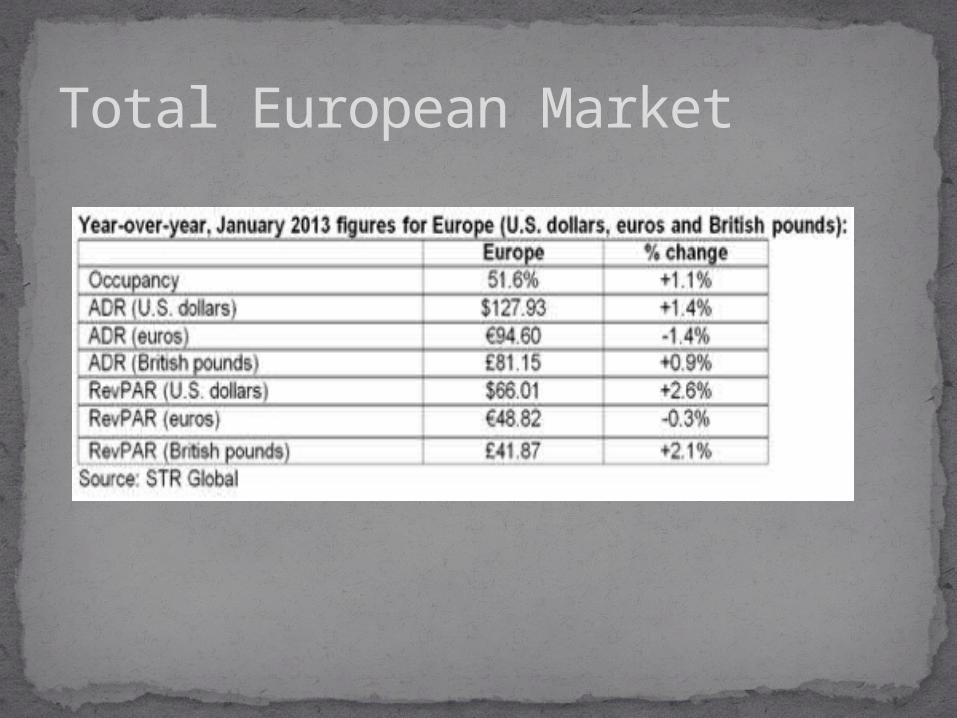
Total European Market
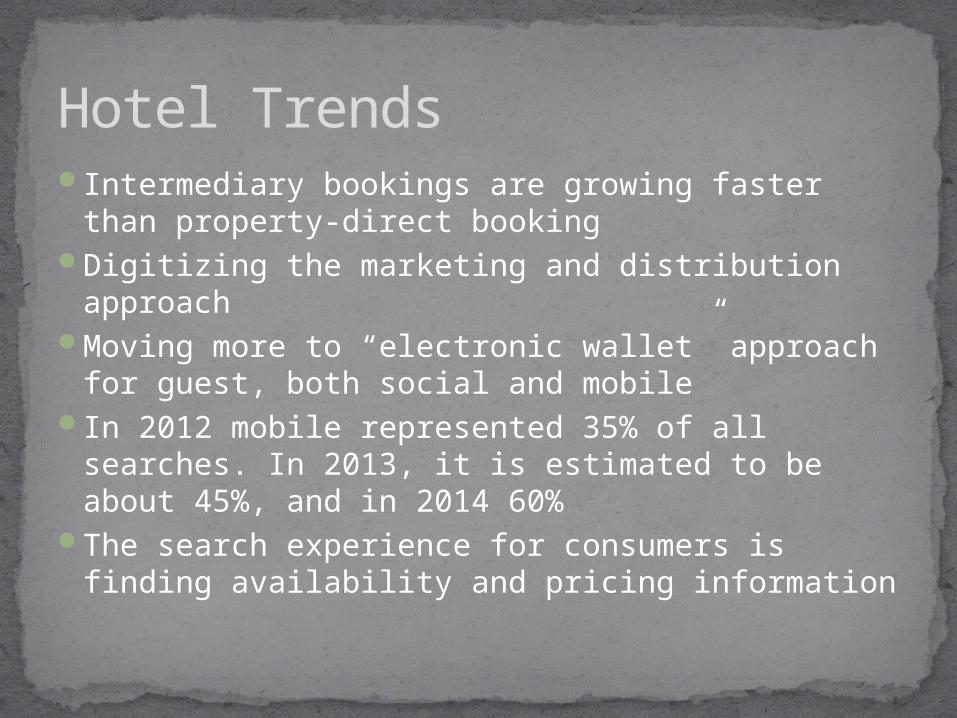
Intermediary bookings are growing faster than property-direct booking
Digitizing the marketing and distribution approach
Moving more to “electronic wallet” approach for guest, both social and mobile
In 2012 mobile represented 35% of all searches. In 2013, it is estimated to be about 45%, and in 2014 60%
The search experience for consumers is finding availability and pricing information
Hotel Trends
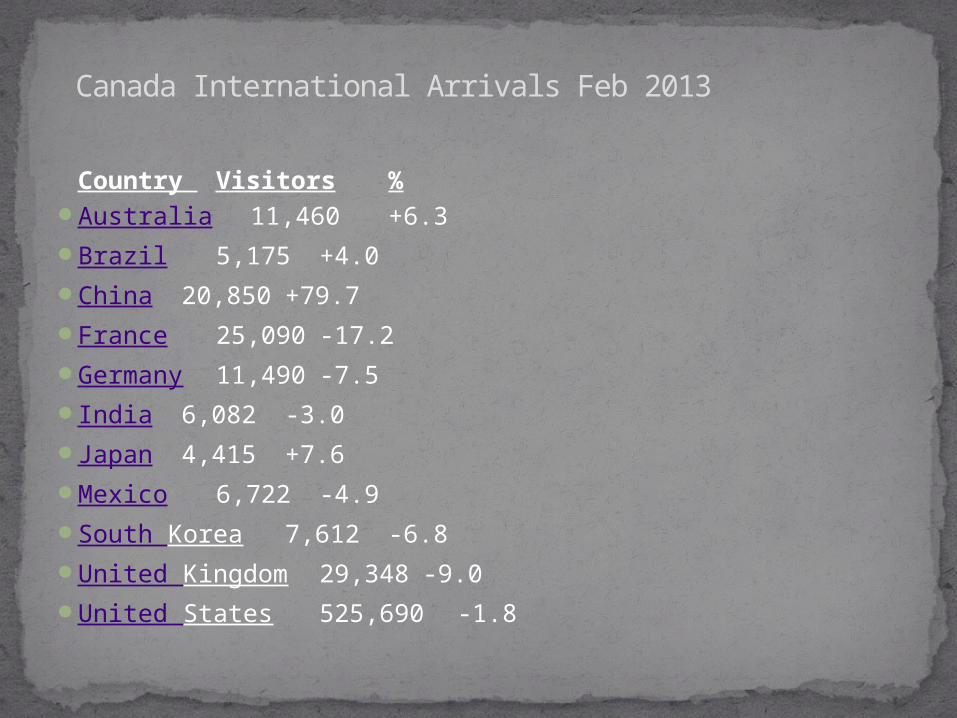
Country Visitors %Australia 11,460 +6.3Brazil 5,175 +4.0China 20,850 +79.7France 25,090 -17.2Germany 11,490 -7.5India 6,082 -3.0Japan 4,415 +7.6Mexico 6,722 -4.9South Korea 7,612 -6.8United Kingdom 29,348 -9.0United States 525,690 -1.8
Canada International Arrivals Feb 2013
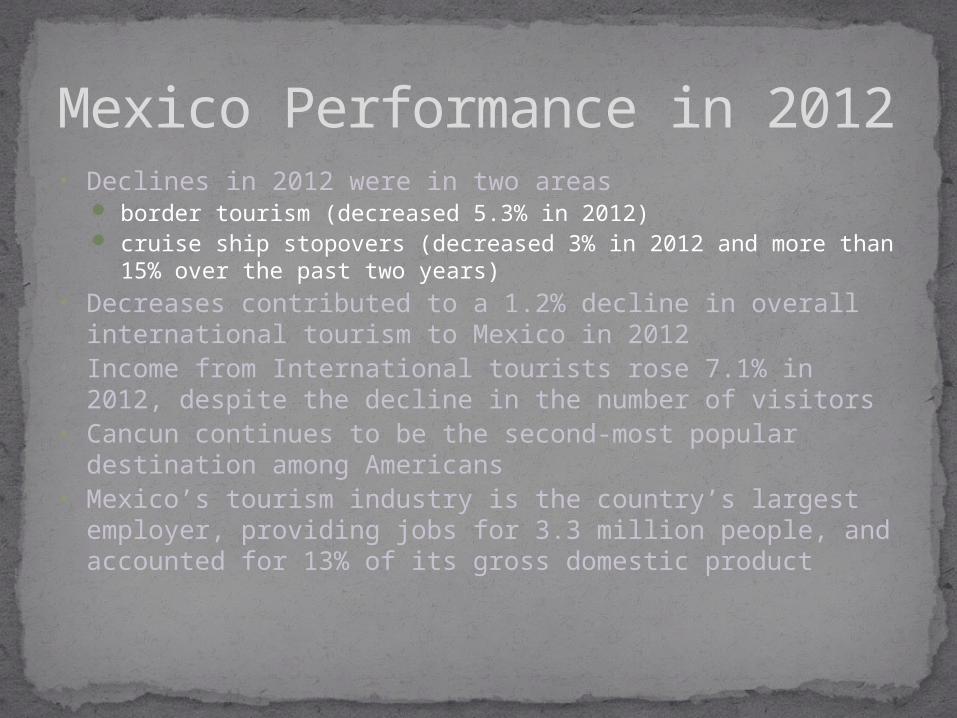
• Declines in 2012 were in two areas border tourism (decreased 5.3% in 2012) cruise ship stopovers (decreased 3% in 2012 and more
than 15% over the past two years)• Decreases contributed to a 1.2% decline in overall
international tourism to Mexico in 2012 • Income from International tourists rose 7.1% in 2012,
despite the decline in the number of visitors• Cancun continues to be the second-most popular
destination among Americans• Mexico’s tourism industry is the country’s largest
employer, providing jobs for 3.3 million people, and accounted for 13% of its gross domestic product
Mexico Performance in 2012
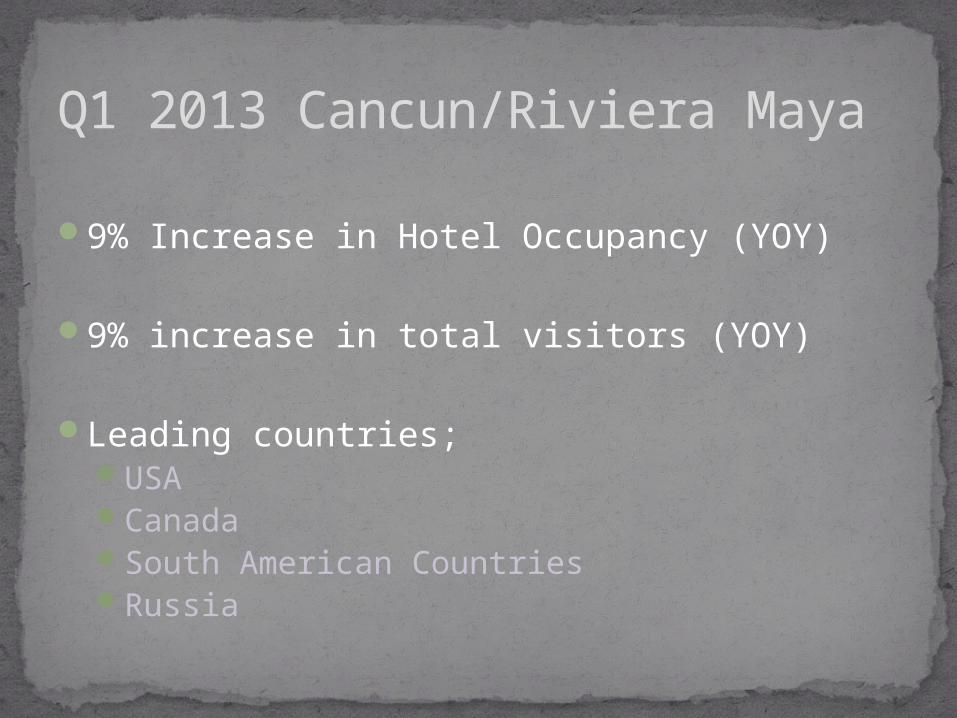
9% Increase in Hotel Occupancy (YOY)
9% increase in total visitors (YOY)
Leading countries;USACanadaSouth American CountriesRussia
Q1 2013 Cancun/Riviera Maya
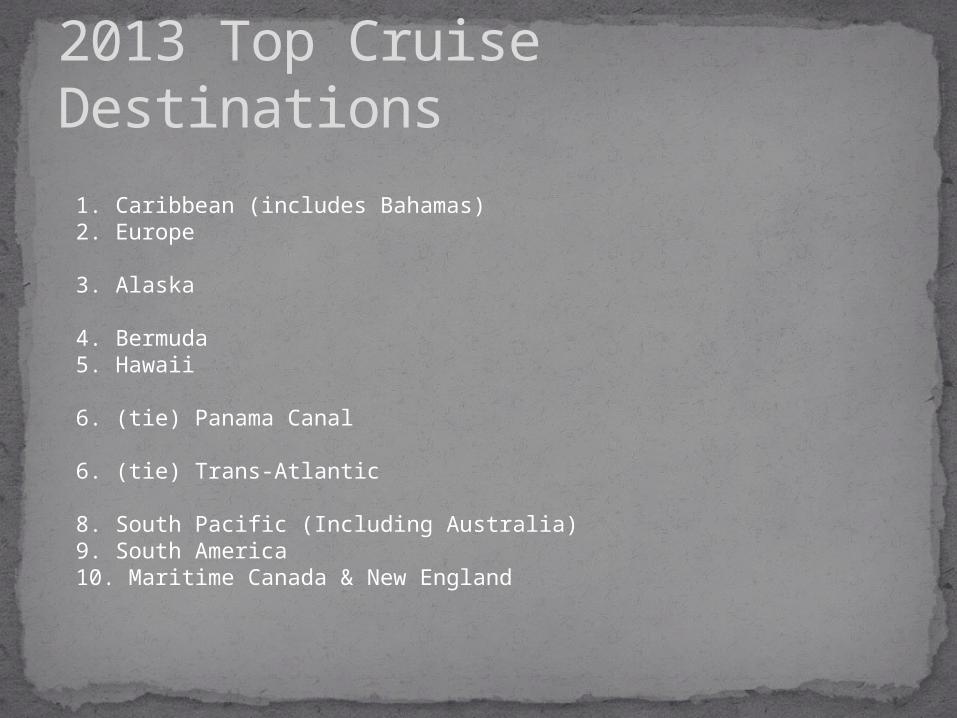
1. Caribbean (includes Bahamas) 2. Europe 3. Alaska 4. Bermuda 5. Hawaii 6. (tie) Panama Canal
6. (tie) Trans-Atlantic 8. South Pacific (Including Australia) 9. South America 10. Maritime Canada & New England
2013 Top Cruise Destinations
The top five cruise destinations remain unchanged from 2012 to 2013
However, the Caribbean’s fell slightly, from nearly 60% in 2012 to under 55% of total bookings for 2013 so far
The difference is made up by Europe taking a
larger piece of the pie, climbing from 11% to 13% of the total, and Alaska climbing from 6.7% to 8.5%.
Cruise Performance

262 days out or just under nine months
The Magic Number…

2013 meeting demand is improving at an encouraging pace Across the country, booking pace is getting more encouraging for
2013 and for 2014. Things are looking positive and headed in the right direction - onward and upward
Education (particularly engineering & technology), medical, bio tech, high tech, new media, association, not-for-profits, financial services and the incentive segment are all showing strong signs of recovery in 2013
With increased demand, group rates are advancing commensurately, depending on the location and the market. Meeting planning professionals are still in the driver's seat
CMP = Expectations are heightened for the creative and unique delivery of the industry's Complete Meeting Package
Healthy protein-nourished meeting attendees are attentive conferees. Meeting attendees are demanding healthy, gluten free, sustainable cuisine and refreshment break selections
MEI Trends
In general, per-attendee meeting costs worldwide to rise more noticeably than prices in other travel categories. In North America, a 4.8% increase would coincide with an expected 6% jump in group size.
Booking windows have increased 5% as organizations feel more confident about the future.
Given this, advance bookings for 2013 are already strong."
MEI
The United States and Canada will see the largest hike in average airfares (2.8%), Latin America would lead in hotel rate and per-attendee meeting cost increases (6.5% and 11%, respectively)
MEI

Index of Optimism, which was conducted in March 2013, asked just over 400 North American respondents (70% buyers and 30% suppliers) to share how they felt about the meetings industry’s business prospects over the coming months
IMEX Survey…
Asked to compare their current levels of optimism to Q1 2012;
67% of respondents declared themselves “more optimistic” than this time last year
58% of respondents expect to see the number of
meetings and events they organize increase slightly throughout 2013 and into the first quarter of 2014
Additionally 8.5% anticipate significant increases.
Optimism…
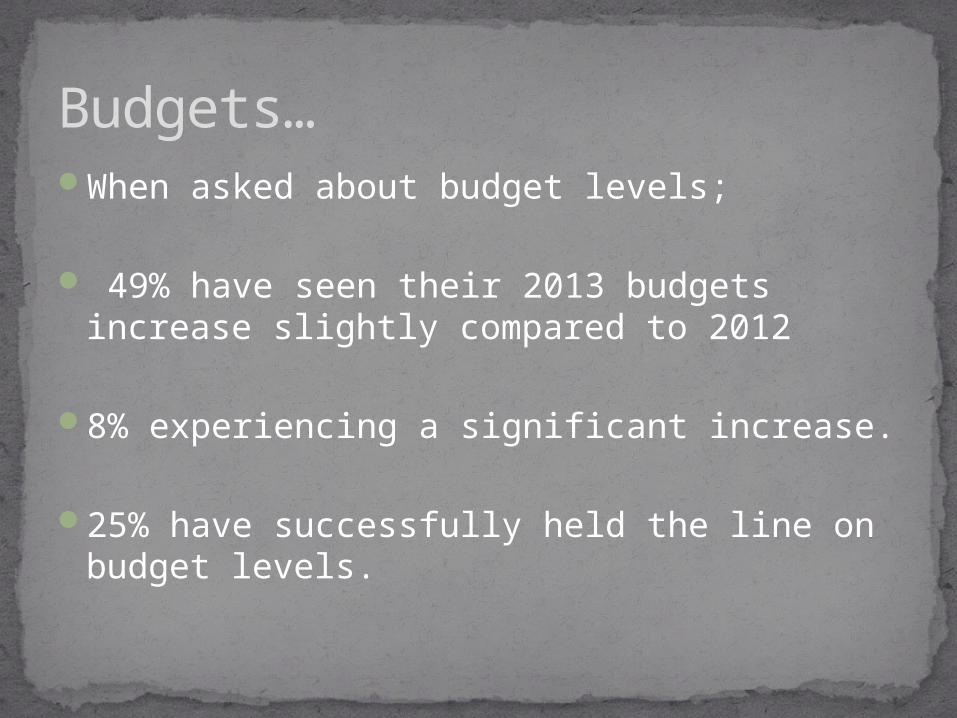
When asked about budget levels;
49% have seen their 2013 budgets increase slightly compared to 2012
8% experiencing a significant increase.
25% have successfully held the line on budget levels.
Budgets…

354 responding; “pressures, needs and requests to reduce
costs” continue to dominate and are the single most important factor in daily decision-making.
“Complying with new company meeting and expenses policies” ranks second while
“continued uncertainty about the global economic outlook”
“a need to plan green meetings” “incorporating social media into meetings and
events”
Buying Decisions Influencers…Survey Says…
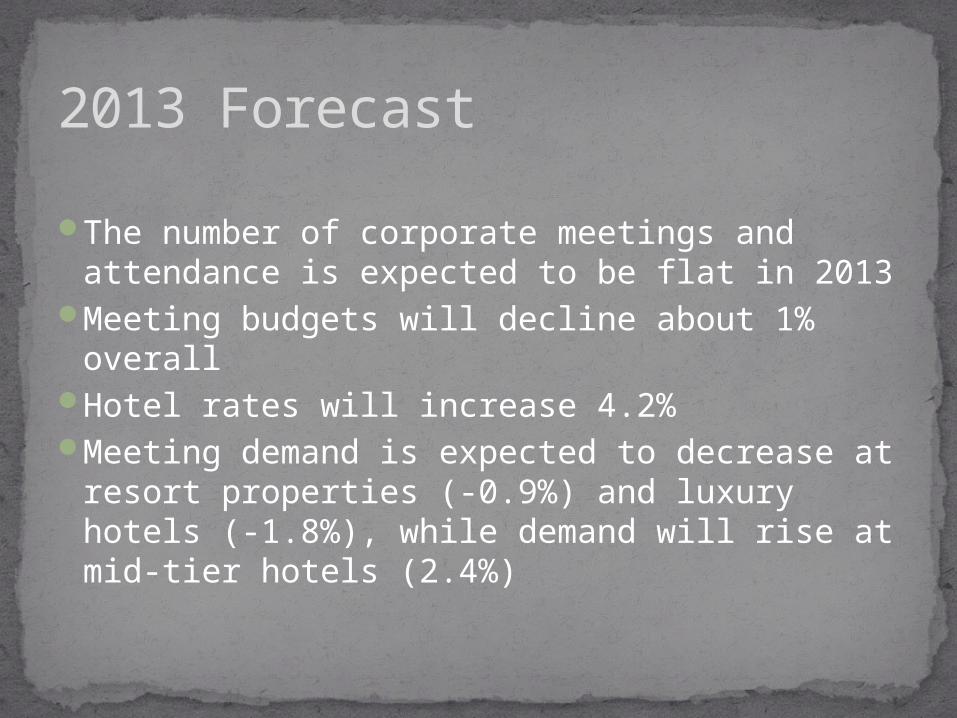
The number of corporate meetings and attendance is expected to be flat in 2013
Meeting budgets will decline about 1% overall
Hotel rates will increase 4.2%Meeting demand is expected to decrease
at resort properties (-0.9%) and luxury hotels (-1.8%), while demand will rise at mid-tier hotels (2.4%)
2013 Forecast
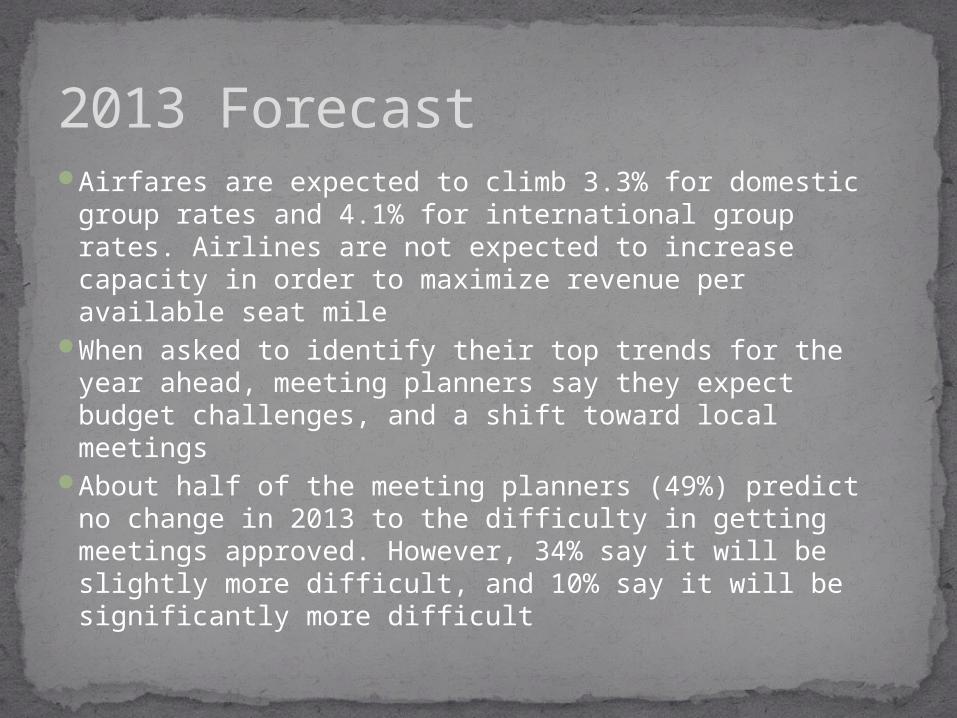
Airfares are expected to climb 3.3% for domestic group rates and 4.1% for international group rates. Airlines are not expected to increase capacity in order to maximize revenue per available seat mile
When asked to identify their top trends for the year ahead, meeting planners say they expect budget challenges, and a shift toward local meetings
About half of the meeting planners (49%) predict no change in 2013 to the difficulty in getting meetings approved. However, 34% say it will be slightly more difficult, and 10% say it will be significantly more difficult
2013 Forecast

About 52% of meeting planners say that the most compelling reason to offer virtual/hybrid meetings is the potential cost savings. The biggest obstacles, said 28%, are to effectively engage the audience and monitor participation
40% of planners say they issue less than five requests for proposal per meeting, 26% send between five and 10, and 15% send between 10 and 15
According to data from the Cvent Supplier Network, the 10 cities with the most meetings activity for the one-year period that ended July 31, 2012, were (in order, beginning with the most meetings held) Orlando, Washington, D.C., Las Vegas, Miami, Chicago, San Diego, Phoenix, Atlanta, Dallas, and New Orleans
2013 Projections

The Cypress GroupDoyle J. Girouard
CEO and Senior Managing Partner
Suite 1101, 150 Creekway Bend
Southlake, TX 76092
817-421-4774 Office
817-307-7577 Cellular
Email: [email protected]
Website: www.thecypressgroup.com
Blog: www.TravelKeyNote.com
Twitter: www.twitter.com/doylejgirouard
LinkedIn: www.linkedin.com/in/doylejgirouard
Facebook: www.facebook.com/doylejgirouard

This presentation and its contents are the property of The Cypress Group, and reserves all rights to ownership, use, reproduction, distribution, and publication of this document and the intellectual property therein. Some parts of the document are reprinted from other sources.
NOTICE – PROPRIETARY INFORMATION ALL RIGHTS RESERVED