Embed Size (px)
Citation preview
DP 2007– 01
Education and Gender Wage Differentials in Portugal: What Can We Learn From an Age Cohort Analysis?
Pilar González
Maria Clementina Santos
Luis Delfim Santos
January 2007
CETE − Centro de Estudos de Economia Industrial, do Trabalho e da Empresa
Research Center on Industrial, Labour and Managerial Economics
Research Center supported by Fundação para a Ciência e a Tecnologia, Programa de Financiamento
Plurianual through the Programa Operacional Ciência, Tecnologia e Inovação (POCTI)/Programa
Operacional Ciência e Inovação 2010 (POCI) of the III Quadro Comunitário de Apoio, which is financed
by FEDER and Portuguese funds.
Faculdade de Economia, Universidade do Porto
http://www.fep.up.pt /investigacao/cete/papers/dp0701.pdf
1
Education and Gender Wage Differentials in Portugal: What Can We Learn From
an Age Cohort Analysis?
Pilar González*
Maria Clementina Santos*
Luis Delfim Santos**
* Faculty of Economics, University of Porto and CETE +
** Faculty of Economics, University of Porto and CEMPRE +
Rua Dr. Roberto Frias
4200 – 464 Porto – Portugal
Corresponding author:
Maria Clementina Santos (e-mail: [email protected]: fax: +351 225505050)
+ CETE – Centro de Estudos de Economia Industrial, do Trabalho e da Empresa and CEMPRE - Centro
de Estudos Macroeconómicos e Previsão - are supported by the Fundação para a Ciência e a Tecnologia.
2
Abstract
Deep changes characterize the evolution of the Portuguese labor market concerning the
average schooling of workers, particularly since the 1980s.
The purpose of this paper is to investigate the consequences of those changes in the
gender wage gap. In particular, we analyze and compare the way that this process has
evolved in the groups of young workers and older workers.
Our findings suggest that the major part of the pay gap refers to employer
discrimination practices for both age group cohorts: in the case of the younger workers,
discrimination plays an increasing role in explaining the wage gap whereas for the older
workers discrimination remains stable overtime. Furthermore, the attributes related to
the characteristics of jobs are the major sources of the explained pay gap. In particular,
the different way men and women are distributed among the sectors of industry is the
main reason of the gap for both cohorts.
Key words: Labor market; discrimination; salary wage differentials.
JEL classification: J71; C50
3
1. Introduction
The Portuguese labor market may be considered an interesting case in the European
Union context, namely, for two reasons: the low average schooling of workers and the
high female participation rate. Regarding the former, average schooling is one of the
lowest when compared with other European countries. In 2003, the working age
population with nine years of education or less was 76.3% for Portugal whereas for the
European Union (hereafter EU25) this percentage only stood at 34.8.1 However, very
significant efforts have been taken since the early 1970s towards an increase of the
educational attainment of workers. The educational system has gone through profound
changes, including an expansion of compulsory schooling (from six years, for
individuals who entered the school system in 1969, to nine years, for those who entered
in 1986), the reform of the secondary school curricula, and the extension of the
university system. Also, non-formal education has had a more visible role in labor
market policies namely through increasing investments in training, particularly after
Portugal’s entrance to the European Community in 1986.
These educational policies, although improving the average education of both men and
women, have favored the latter, increasing the already existent gender educational gap.
In 2003, among the population aged 15 to 64, 10.6% of females held a college degree
whereas only 6.9% of males held such degree (in the EU25, for the same year, these
percentages were 18.1 and 18.9, respectively).2
As to the second reason, Portugal is a country where the female participation rate is
high as compared to the other EU member-states, and particularly, with the other
1 European Commission (2004).
2 idem.
4
southern European countries. In 2004, the female participation rate was 67.0%, five
percentage points above the EU25, while the average value for Spain, Italy and Greece
stood at 53.8%.3
Notwithstanding the notable investment in education made by females and their high
engagement in the labor market, our research on gender wage differentials for Portugal
reveals strong evidence of a persistent wage gap between male and female workers.
(Kiker & Santos, 1991; González, Santos & Santos, 2005).
The role of discrimination as a source of male-female wage differentials is in line with
an extensive body of literature on the issue. Following the seminal work of Oaxaca
(1973), the most important feature of the numerous empirical studies on this matter has
been the evidence of a certain extent of discrimination against female workers. This
finding has been pervasive in most of the studies using different estimation
methodologies and datasets, although the proportion attributed to discrimination differs
and the sources of the gender gap vary (see for example Cotton, 1988; Neumark, 1988;
Oaxaca & Ransom 1994; Plasman, Cortese, Krzeslo, Plasman, Rusinek, Rycx, &
Vanheerswynghels, 2001; Rubery, Grimshaw, & Figueiredo, 2002).
Despite the robustness of our findings on the effective importance of wage
discrimination practices, further investigation is needed on the effects of changes in the
supply of educated workers to explain the gender wage gap. The investment in
education made by females is perceived as inducing a wage gap reduction, especially
felt among the younger generation as compared with the older one. It is expected that
the profiles of younger males and females regarding their level of education will
converge contributing to such reduction.
3 European Commission (2005).

5
According to the above we can expect that the educational reforms affect diversely
different cohorts of workers. Therefore, a deeper understanding of the reasons involved
in the explanation of the gender wage gap requires a separate analysis of the extent of
discrimination for the younger and older cohorts of workers. The use of global data, as
is the usual procedure in this type of study, is somewhat limited since it can hide
significant differences between the two referred to groups of workers, either regarding
the part of the gap that can be explained by the diversity of characteristics of workers
and jobs (endowment effect) or regarding the unexplained part of that gap
(discrimination effect).
In this study we apply wage decomposition techniques to analyze the gender wage gap
in Portugal, following the Oaxaca methodology and employing the Neumark
decomposition method. To distinguish the impact of the policy reforms across cohorts
of workers, we analyze, separately, young workers (defined as those aged from 15 to 34
years) and older ones (workers aged 35 and above) using a large dataset of Portuguese
workers for the period 1991-2000. The focus of the paper on this period allows us to
investigate more deeply the effects of educational reforms on the evolution of the
gender wage gap in the Portuguese labor market.
In section 2, we briefly present the data and point out some major changes regarding
educational attainment that characterized the Portuguese labor market during the 90s. In
section 3, we present the model used. In section 4, we present and discuss the results of
the decomposition of the gender pay gap for the two age group cohorts using the
Neumark methodology. In section 5, we present our concluding remarks.
2. The data

6
In the present work we use data from the Personnel Records database (Quadros de
Pessoal), an administrative dataset collected annually by the Portuguese Ministry of
Employment. Response to the questionnaire is mandatory for all private-sector firms
with at least one employee. This dataset provides information on workers’ attributes
such as gender, age, education, occupation, qualification level, years with the firm,
hours worked and earnings, and job related attributes such as type of industry,
geographic location and plant size. Information about employees in public
administration, the self-employed and military personnel is not included in the dataset.
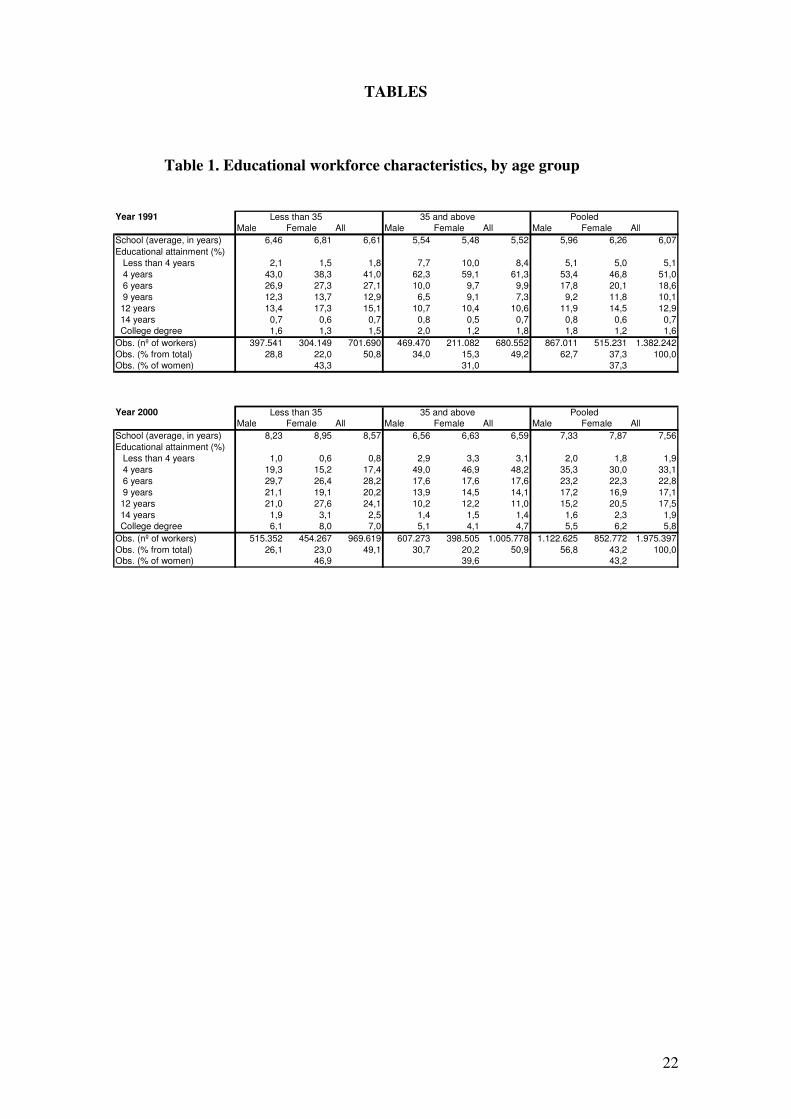
Table 1 summarizes the educational workforce characteristics for the whole population
and for the two age groups considered. According to the data, there is a high incidence
of young workers amongst the Portuguese employees since almost half (49.1%) of the
workers were aged less than 35 years in 2000 and 50.8% in 1991.4 As expected, the
share of women is higher in the younger cohort than in the older one (46.9% against
39.6% in 2000 and 43.3% against 31.0% in 1991). Also, the relative weight of women
increased in the two age groups between 1991 and 2000, being more pronounced in the
group of older workers.
[Insert Table 1 here]
There are visible educational changes in the Portuguese workforce over the decade as
the average years of education of the employees increased by 25% from 1991 to 2000.
4 This appears to be a particular characteristic of the Portuguese labor market as compared with other EU
countries. According to the EUROSTAT data (Labour Force Statistics) and despite the different
information source and the different scope of the considered age group, in 2000 the percentages of
employees aged 15 to 39 was 54.6 in the EU25, 55.1 in the EU15 and 60.0 in Portugal.
7
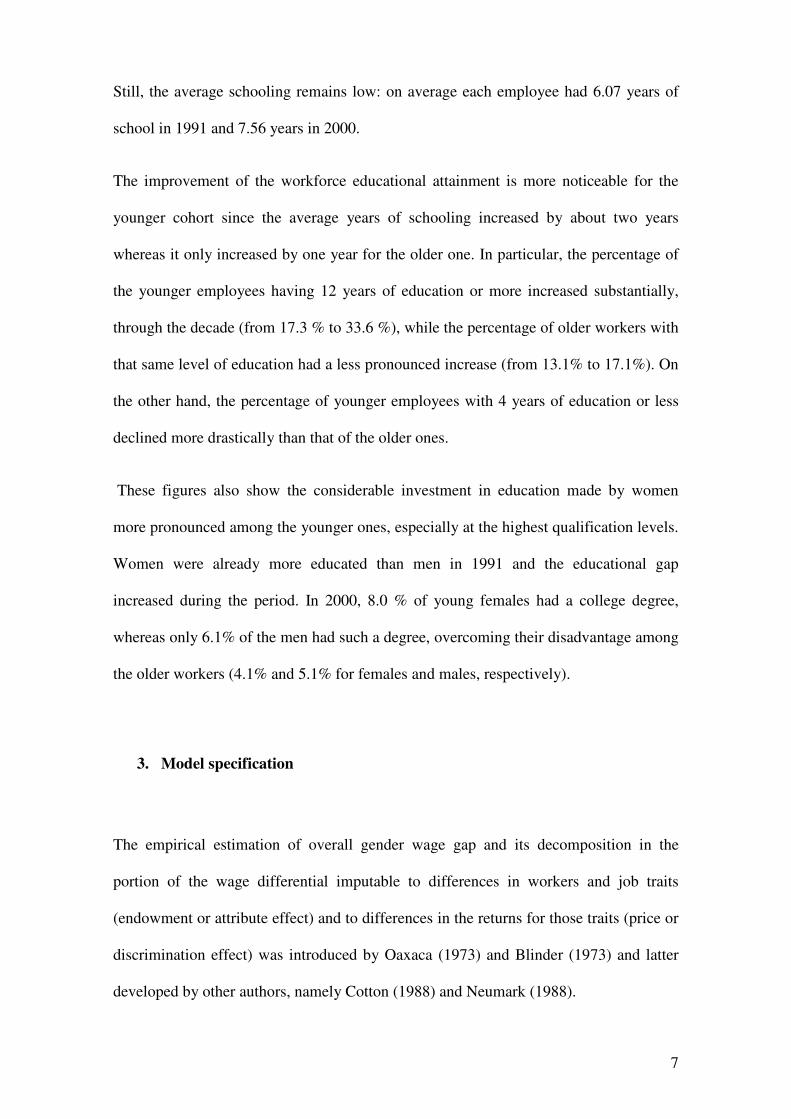
Still, the average schooling remains low: on average each employee had 6.07 years of
school in 1991 and 7.56 years in 2000.
The improvement of the workforce educational attainment is more noticeable for the
younger cohort since the average years of schooling increased by about two years
whereas it only increased by one year for the older one. In particular, the percentage of
the younger employees having 12 years of education or more increased substantially,
through the decade (from 17.3 % to 33.6 %), while the percentage of older workers with
that same level of education had a less pronounced increase (from 13.1% to 17.1%). On
the other hand, the percentage of younger employees with 4 years of education or less
declined more drastically than that of the older ones.
These figures also show the considerable investment in education made by women
more pronounced among the younger ones, especially at the highest qualification levels.
Women were already more educated than men in 1991 and the educational gap
increased during the period. In 2000, 8.0 % of young females had a college degree,
whereas only 6.1% of the men had such a degree, overcoming their disadvantage among
the older workers (4.1% and 5.1% for females and males, respectively).
3. Model specification
The empirical estimation of overall gender wage gap and its decomposition in the
portion of the wage differential imputable to differences in workers and job traits
(endowment or attribute effect) and to differences in the returns for those traits (price or
discrimination effect) was introduced by Oaxaca (1973) and Blinder (1973) and latter
developed by other authors, namely Cotton (1988) and Neumark (1988).
8
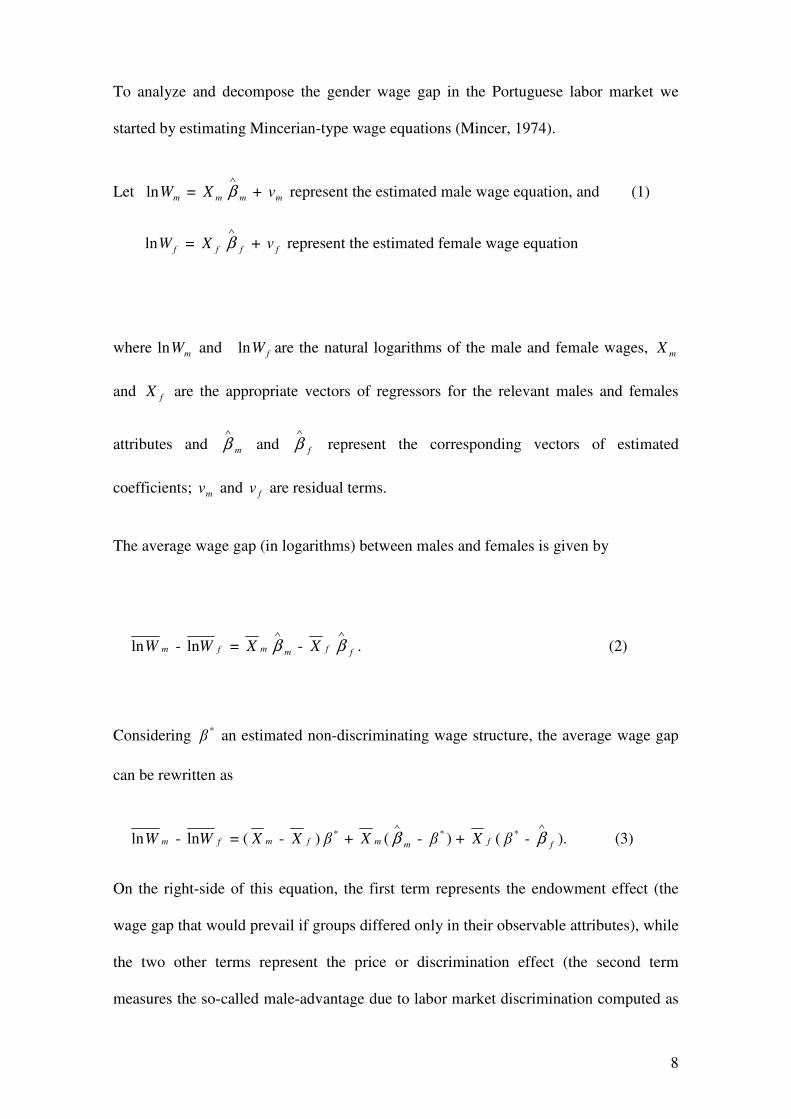
To analyze and decompose the gender wage gap in the Portuguese labor market we
started by estimating Mincerian-type wage equations (Mincer, 1974).
Let ln mW = mX m
∧
β + mv represent the estimated male wage equation, and (1)
ln fW = fX f
∧
β + fv represent the estimated female wage equation
where ln mW and ln fW are the natural logarithms of the male and female wages, mX
and fX are the appropriate vectors of regressors for the relevant males and females
attributes and m
∧
β and f
∧
β represent the corresponding vectors of estimated
coefficients; mv and fv are residual terms.
The average wage gap (in logarithms) between males and females is given by
mWln - fWln = mX m
∧
β - fX f
∧
β . (2)
Considering *β an estimated non-discriminating wage structure, the average wage gap
can be rewritten as
mWln - fWln = ( mX - fX ) *β + mX ( m
∧
β - *β ) + fX ( *β - f
∧
β ). (3)
On the right-side of this equation, the first term represents the endowment effect (the
wage gap that would prevail if groups differed only in their observable attributes), while
the two other terms represent the price or discrimination effect (the second term
measures the so-called male-advantage due to labor market discrimination computed as
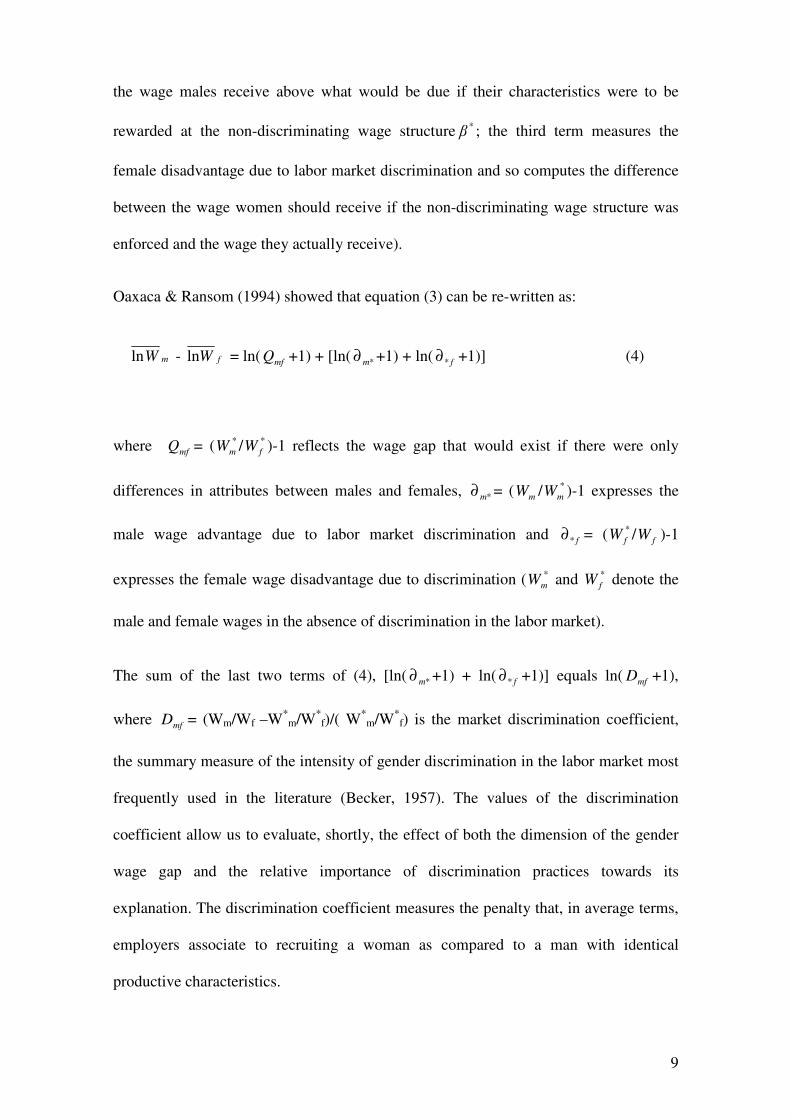
9
the wage males receive above what would be due if their characteristics were to be
rewarded at the non-discriminating wage structure *β ; the third term measures the
female disadvantage due to labor market discrimination and so computes the difference
between the wage women should receive if the non-discriminating wage structure was
enforced and the wage they actually receive).
Oaxaca & Ransom (1994) showed that equation (3) can be re-written as:
mWln - fWln = ln( mfQ +1) + [ln( *m∂ +1) + ln( f*∂ +1)] (4)
where mfQ = ( *
mW / *
fW )-1 reflects the wage gap that would exist if there were only
differences in attributes between males and females, *m∂ = ( mW / *
mW )-1 expresses the
male wage advantage due to labor market discrimination and f*∂ = ( *
fW / fW )-1
expresses the female wage disadvantage due to discrimination ( *
mW and *
fW denote the
male and female wages in the absence of discrimination in the labor market).
The sum of the last two terms of (4), [ln( *m∂ +1) + ln( f*∂ +1)] equals ln( mfD +1),
where mfD = (Wm/Wf –W*m/W
*f)/( W
*m/W
*f) is the market discrimination coefficient,
the summary measure of the intensity of gender discrimination in the labor market most
frequently used in the literature (Becker, 1957). The values of the discrimination
coefficient allow us to evaluate, shortly, the effect of both the dimension of the gender
wage gap and the relative importance of discrimination practices towards its
explanation. The discrimination coefficient measures the penalty that, in average terms,
employers associate to recruiting a woman as compared to a man with identical
productive characteristics.
10
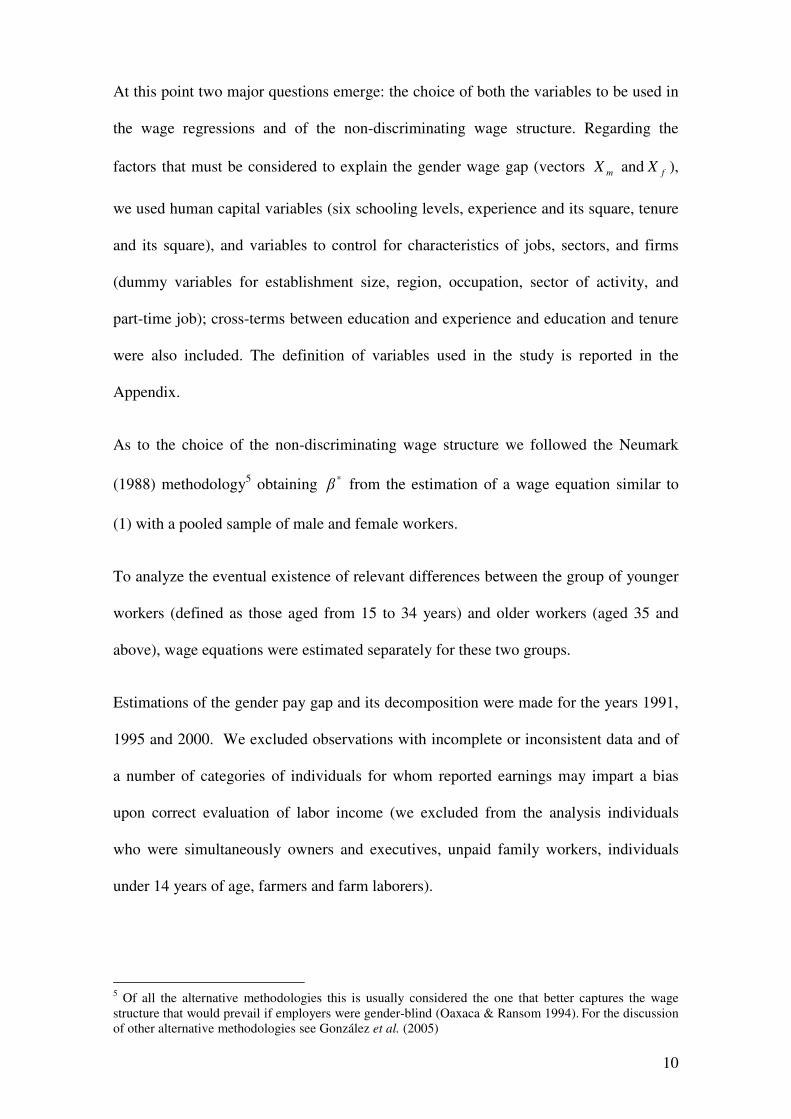
At this point two major questions emerge: the choice of both the variables to be used in
the wage regressions and of the non-discriminating wage structure. Regarding the
factors that must be considered to explain the gender wage gap (vectors mX and fX ),
we used human capital variables (six schooling levels, experience and its square, tenure
and its square), and variables to control for characteristics of jobs, sectors, and firms
(dummy variables for establishment size, region, occupation, sector of activity, and
part-time job); cross-terms between education and experience and education and tenure
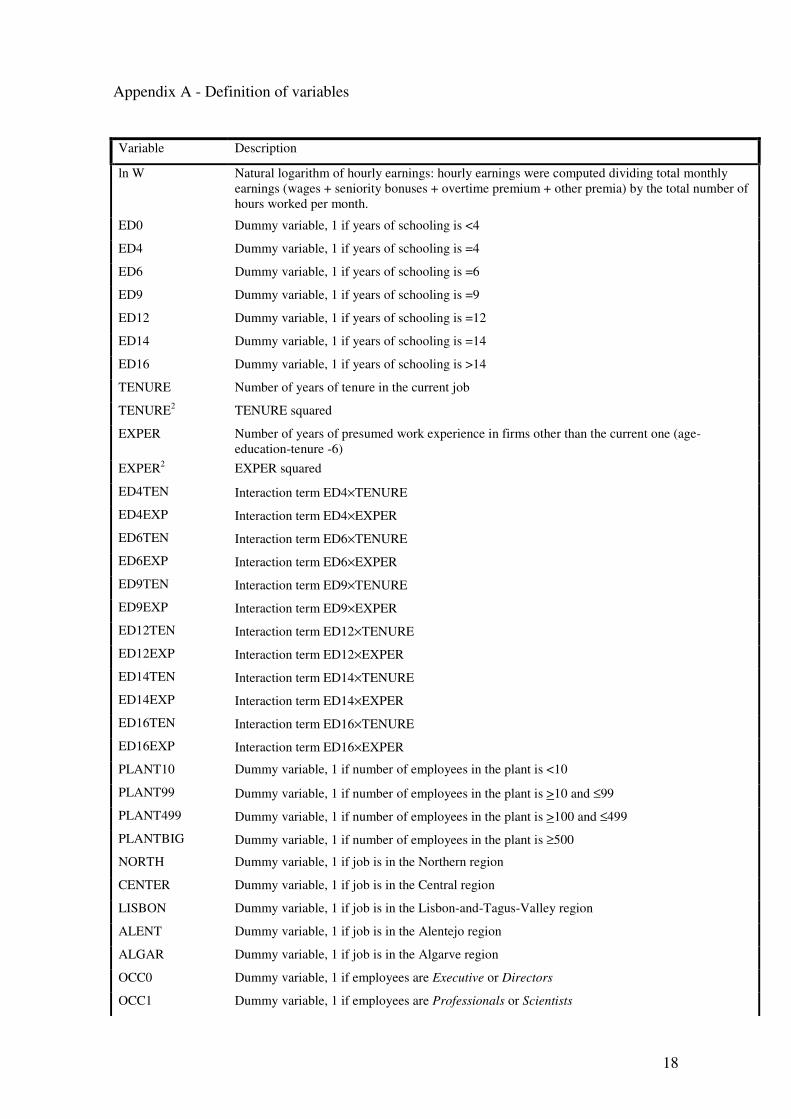
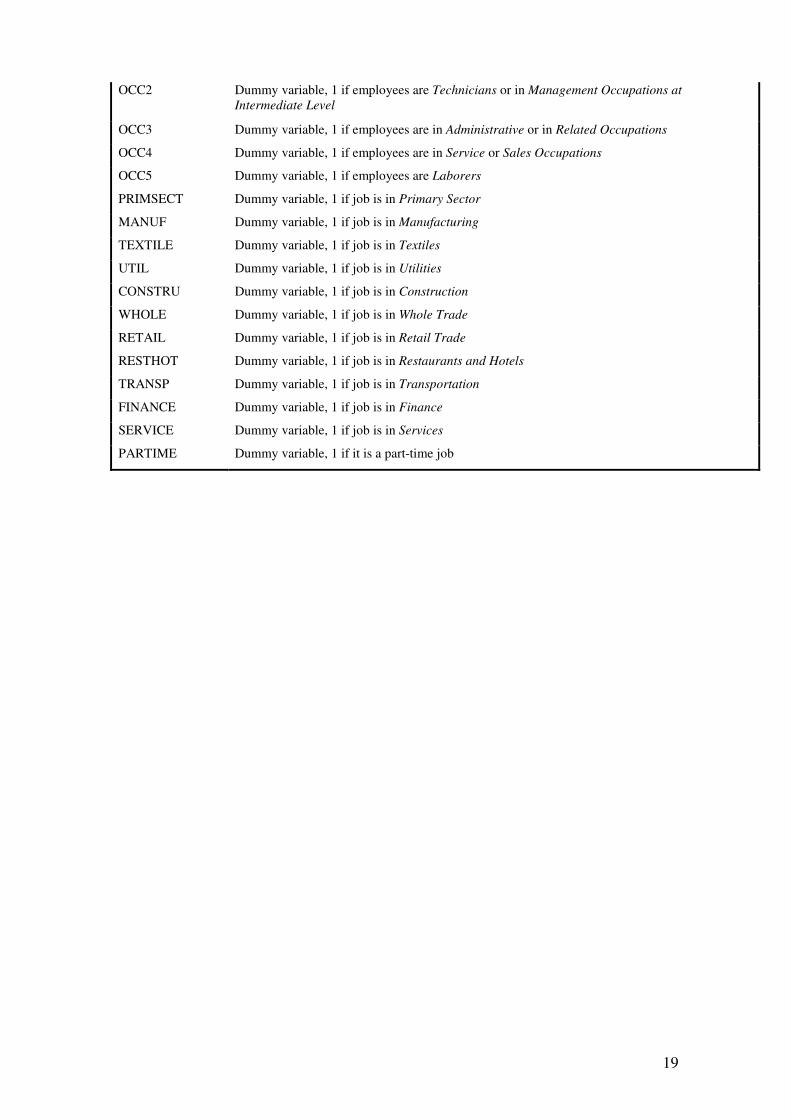
were also included. The definition of variables used in the study is reported in the
Appendix.
As to the choice of the non-discriminating wage structure we followed the Neumark
(1988) methodology5 obtaining *β from the estimation of a wage equation similar to
(1) with a pooled sample of male and female workers.
To analyze the eventual existence of relevant differences between the group of younger
workers (defined as those aged from 15 to 34 years) and older workers (aged 35 and
above), wage equations were estimated separately for these two groups.
Estimations of the gender pay gap and its decomposition were made for the years 1991,
1995 and 2000. We excluded observations with incomplete or inconsistent data and of
a number of categories of individuals for whom reported earnings may impart a bias
upon correct evaluation of labor income (we excluded from the analysis individuals
who were simultaneously owners and executives, unpaid family workers, individuals
under 14 years of age, farmers and farm laborers).
5 Of all the alternative methodologies this is usually considered the one that better captures the wage
structure that would prevail if employers were gender-blind (Oaxaca & Ransom 1994). For the discussion
of other alternative methodologies see González et al. (2005)
11
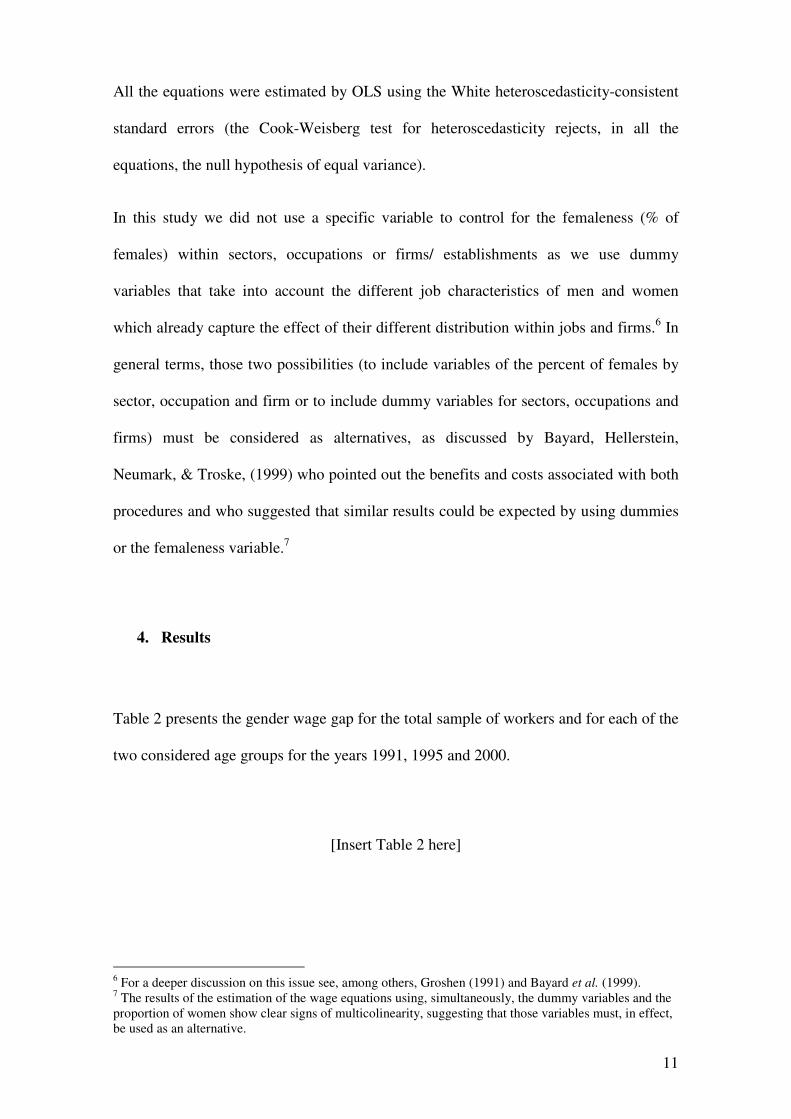
All the equations were estimated by OLS using the White heteroscedasticity-consistent
standard errors (the Cook-Weisberg test for heteroscedasticity rejects, in all the
equations, the null hypothesis of equal variance).
In this study we did not use a specific variable to control for the femaleness (% of
females) within sectors, occupations or firms/ establishments as we use dummy
variables that take into account the different job characteristics of men and women
which already capture the effect of their different distribution within jobs and firms.6 In
general terms, those two possibilities (to include variables of the percent of females by
sector, occupation and firm or to include dummy variables for sectors, occupations and
firms) must be considered as alternatives, as discussed by Bayard, Hellerstein,
Neumark, & Troske, (1999) who pointed out the benefits and costs associated with both
procedures and who suggested that similar results could be expected by using dummies
or the femaleness variable.7
4. Results
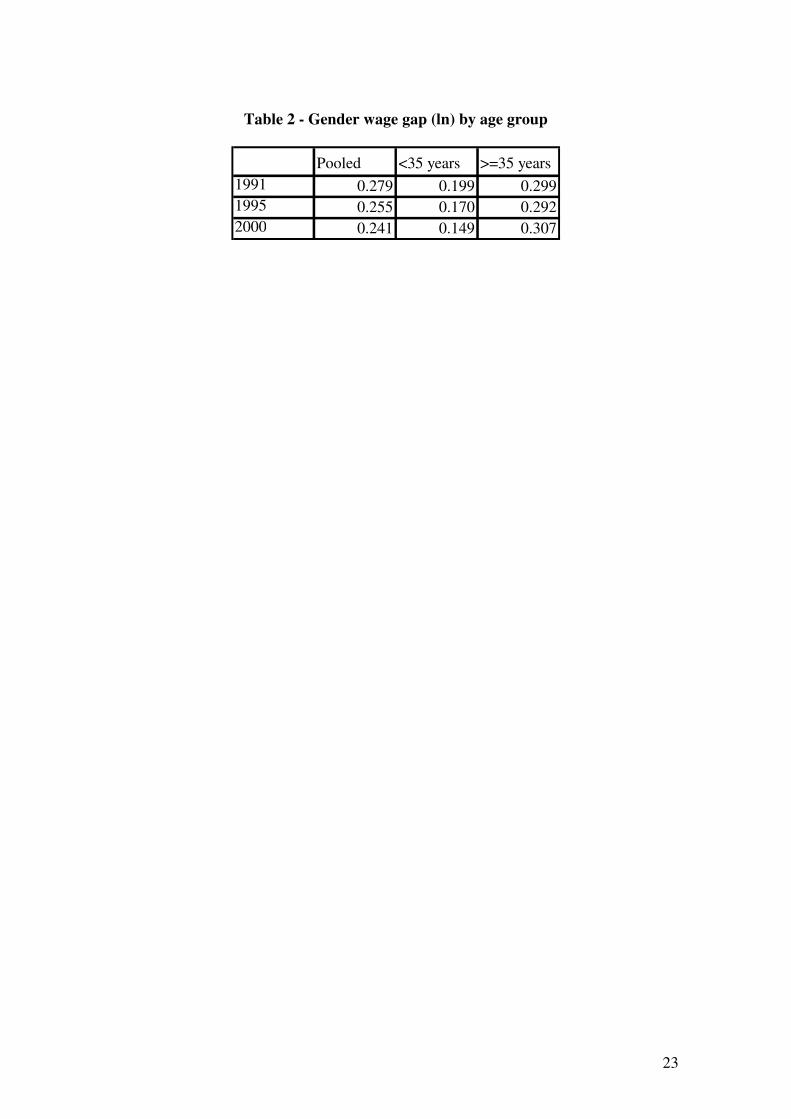
Table 2 presents the gender wage gap for the total sample of workers and for each of the
two considered age groups for the years 1991, 1995 and 2000.
[Insert Table 2 here]
6 For a deeper discussion on this issue see, among others, Groshen (1991) and Bayard et al. (1999).
7 The results of the estimation of the wage equations using, simultaneously, the dummy variables and the
proportion of women show clear signs of multicolinearity, suggesting that those variables must, in effect,
be used as an alternative.
12
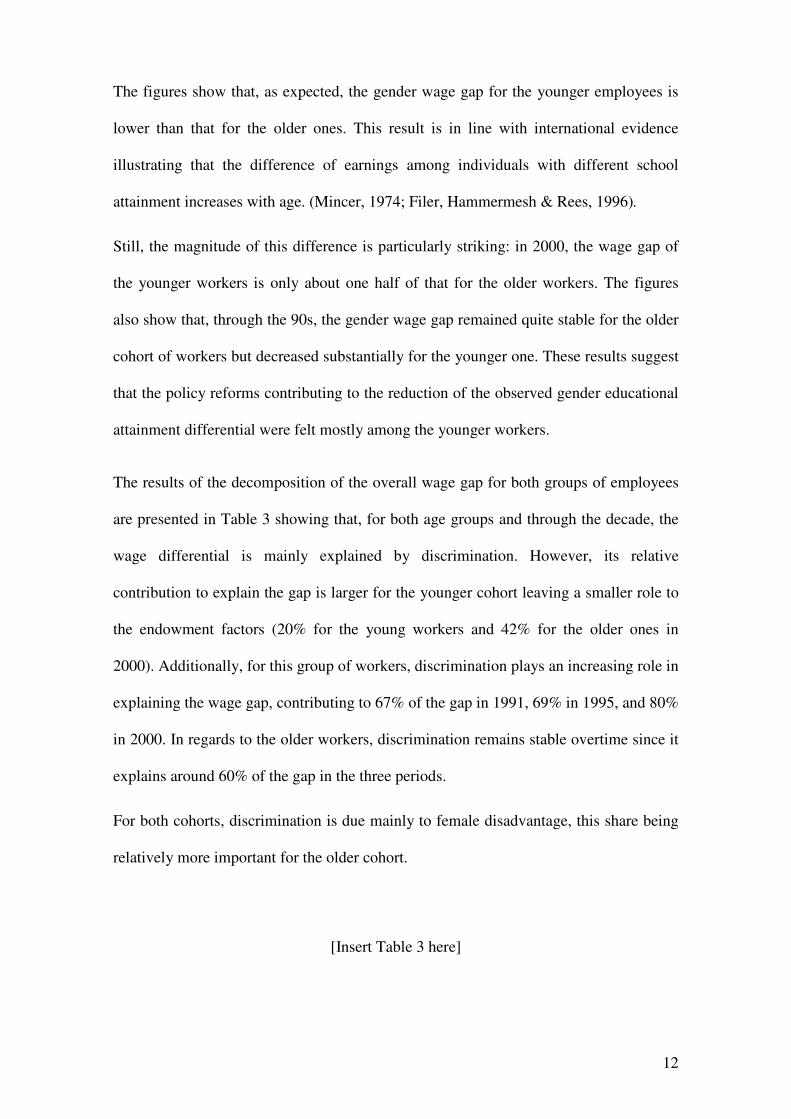
The figures show that, as expected, the gender wage gap for the younger employees is
lower than that for the older ones. This result is in line with international evidence
illustrating that the difference of earnings among individuals with different school
attainment increases with age. (Mincer, 1974; Filer, Hammermesh & Rees, 1996).
Still, the magnitude of this difference is particularly striking: in 2000, the wage gap of
the younger workers is only about one half of that for the older workers. The figures
also show that, through the 90s, the gender wage gap remained quite stable for the older
cohort of workers but decreased substantially for the younger one. These results suggest
that the policy reforms contributing to the reduction of the observed gender educational
attainment differential were felt mostly among the younger workers.
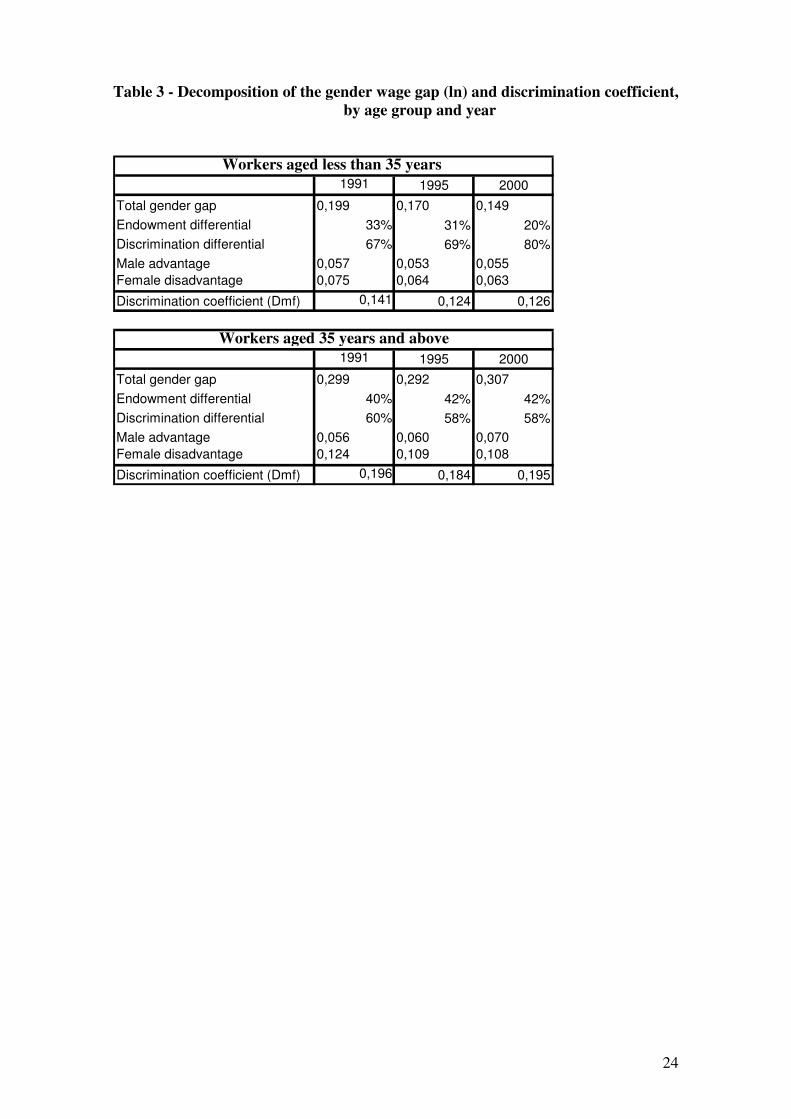
The results of the decomposition of the overall wage gap for both groups of employees
are presented in Table 3 showing that, for both age groups and through the decade, the
wage differential is mainly explained by discrimination. However, its relative
contribution to explain the gap is larger for the younger cohort leaving a smaller role to
the endowment factors (20% for the young workers and 42% for the older ones in
2000). Additionally, for this group of workers, discrimination plays an increasing role in
explaining the wage gap, contributing to 67% of the gap in 1991, 69% in 1995, and 80%
in 2000. In regards to the older workers, discrimination remains stable overtime since it
explains around 60% of the gap in the three periods.
For both cohorts, discrimination is due mainly to female disadvantage, this share being
relatively more important for the older cohort.
[Insert Table 3 here]
13
Figures on table 3 show that the difference in the discrimination coefficient between the
younger and the older workers is lower than the difference in the overall wage gap of
the two groups. The penalty associated by employers to recruiting a female, measured
by the discrimination coefficient and according to the obtained results, being smaller for
the younger cohort than for the older. Still it is important to stress that, in 2000, the gap
in the discrimination coefficient for the two cohorts was lower than the wage gap
observable for the same groups.8
Through the 90s this coefficient (as it occurred with the gender wage gap) remained
quite stable for the older cohort of workers but decreased, rather slightly, for the
younger one contrasting with the substantial decrease that characterizes the evolution of
the gender wage gap in this age cohort.
So we can conclude that the referred to changes in the Portuguese education system
contributed to the reduction of the discrimination coefficient in the younger group of
workers, but that this effect has been rather slight. This fact indicates that education is
only one of the sources of the gender discrimination existing in the Portuguese labor
market and that the other sources have retained an important influence on its
maintenance.
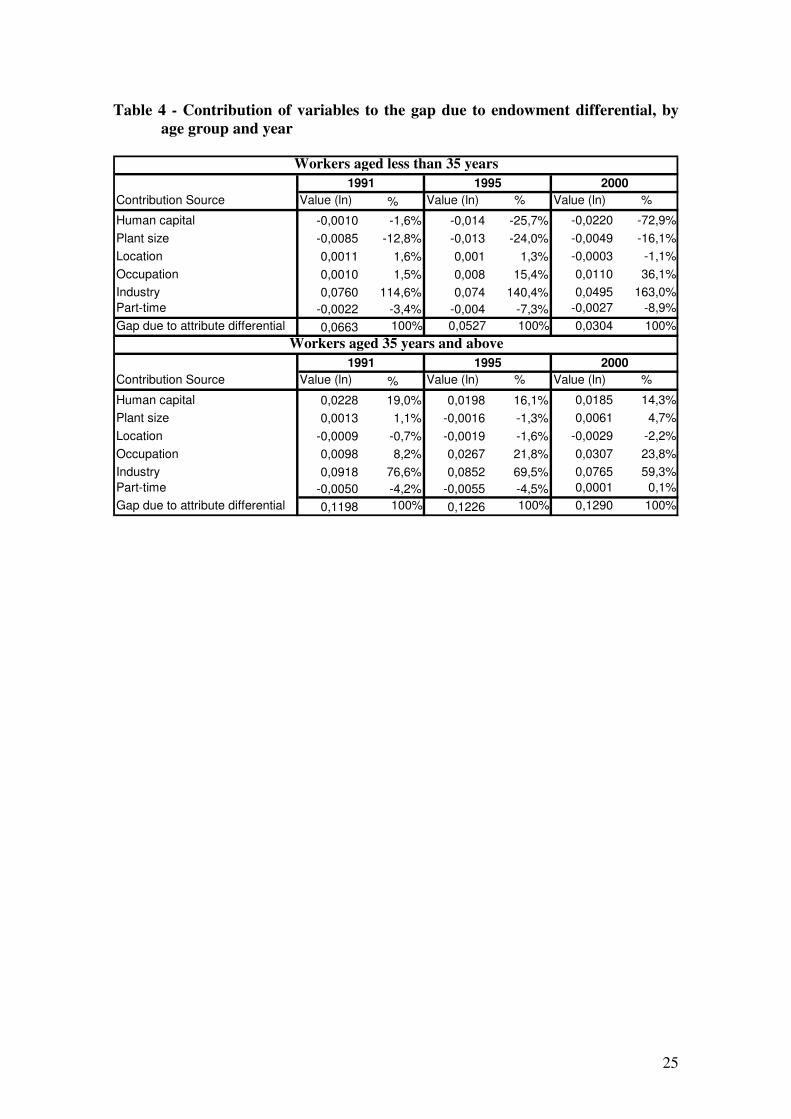
The analysis of the contribution of the different attributes, related to either worker or job
characteristics, to the explained part of the wage gap allows us to deepen our knowledge
of these sources. Results on this issue are presented in Table 4 and show that the role of
human capital variables varies sensibly between cohorts. For younger workers these
variables contributed, increasingly during the decade, to the reduction of the gender pay
gap. While for older workers, human capital variables contributed to increasing that
8 The discrimination coefficient of the group of the youngest represented 65% of the one that applied to
the group of the eldest quite above the ratio of the wage differentials of the same two groups, 49%.
14
gap, despite the reduction of its relative weight during the decade. As expected, the
significant investments in education and training had a key effect on the evolution of the
explained part of the gender pay gap.
It is also worth noting that education, experience, and tenure play a different role in
explaining the wage gap for the two groups of workers.9 Among younger workers,
education, mainly the highest levels of education, emerges as the most important factor
contributing to the decreasing of the wage gap during the 90s. These results suggest that
women invested in education, as a means of increasing their productive characteristics
recognizable by employers.
Tenure also acted towards the reduction of the gap through the period but with a lower
and rather constant effect as compared to education. In contrast, differences in
experience of male and female workers acted towards increasing the wage gap in this
age group. As for the older workers, education, tenure and experience contributed to the
increase of the gap.
[Insert Table 4 here]
For the two cohorts of workers, Industry is the variable that has the highest importance
in explaining the pay gap during the decade; however, its relative importance increased
for the younger workers and decreased for the older ones. Also, the contribution of the
different sectors to explain the wage gap does not vary significantly in the two groups of
workers. Textiles (with the highest percentage of female workers) and Transportation
(with the highest share of male workers) contributed to widening the gap, whereas
Finance (the sector with the lowest level of gender segregation) was the only sector that
9 Detailed results are available upon request.
15
acted towards its reduction. These results are not unexpected since the structure of male
and female jobs by industry does not show relevant changes amongst the older and the
younger workers.10
In 2000 textiles kept the leading role in terms of female
employment, especially among the younger cohort.
Occupation, accounting for a small portion of the wage gap for both cohorts in 1991,
had an increasing influence to its explanation during the decade.
The other considered factors (part-time, location, and plant size) play a minor role in the
explanation of the wage gap for both groups of workers, exception made for the fact that
having employment in a large firm (more than 100 employees) acts towards decreasing
of the wage gap among the younger group.
In sum, investments in human capital, in particular in education, favoring the younger
Portuguese female workers acted to decrease the gender wage gap for the younger
cohort through the decade; however the different distribution across sectors of activity
and occupations of younger females as compared with younger males and, especially,
discrimination practices, have surmounted these effects.
5. Concluding remarks
This analysis of the gender wage gap in the Portuguese labor market has followed the
Neumark methodology of decomposing the gap into workers and jobs effects and
discrimination effects. We assess the relative importance of investment of workers in
human capital characteristics and the role of workplace factors such as industry and
occupation in the explained part of the gap. Further, we study the extent of the gap
10
Detailed results are available upon request.
16
separately for the younger and older cohorts of workers to better evaluate the impact of
educational reforms and changes in the workplace structure that have taken place in the
Portuguese labor market since the early 1970s.
Our results suggest that most of the pay gap, for both cohorts, refers to discrimination
practices by the employers. In the case of the younger workers, discrimination plays an
increasing role in explaining the wage gap, contributing to 67% of the gap in 1991, 69%
in 1995, and 80% in 2000. In regards to the older workers, discrimination remains stable
over time since it explains around 60% of the gap in the three periods. The
discrimination coefficient, that is the penalty associated by employers to female wages,
is higher amongst older workers than amongst younger ones. During the 90s its
evolution did not show any strong tendency towards decreasing: it remained rather
stable amongst the older and reduced, but only slightly, amongst the younger.
As expected, the gender wage gap for the younger employees is lower than that of the
older ones, although somewhat surprisingly such a gap is, in 2000, only about one half
of that of the older workers. Through the 90s the gender wage gap remained quite stable
for the older cohort of workers but decreased substantially for the younger workers.
These results suggest that the effects of the educational reforms were felt mainly among
the younger group of workers and reflect the larger investment on education made by
younger women, especially at the highest qualification levels. It is likely that the gender
wage gap among the younger workers will further decrease in the future as the full
effects of the reforms are felt and the gap among the older ones will tend also to
decrease as the new workers will be substitute for the older ones in the labor market.
Although the improvement of the productive characteristics of workers has been
important to the reduction of the explained part of the gender pay gap, the attributes
related to the characteristics of jobs appear as its major sources. In particular, the

17
different way men and women are distributed among the sectors of industry emerges as
the main reason of the persistence of the wage gap for both cohorts. The observed
persistence of the wage differential over time, in spite of the investment in human
capital especially amongst women, suggests that a different allocation of men and
women by jobs and sectors of activity is required in order to change the prevailing
rigidity of worker placement. Any further attempt to analyze the gender wage gap
should more deeply address this issue.
18
Appendix A - Definition of variables
Variable Description
ln W Natural logarithm of hourly earnings: hourly earnings were computed dividing total monthly
earnings (wages + seniority bonuses + overtime premium + other premia) by the total number of
hours worked per month.
ED0 Dummy variable, 1 if years of schooling is <4
ED4 Dummy variable, 1 if years of schooling is =4
ED6 Dummy variable, 1 if years of schooling is =6
ED9 Dummy variable, 1 if years of schooling is =9
ED12 Dummy variable, 1 if years of schooling is =12
ED14 Dummy variable, 1 if years of schooling is =14
ED16 Dummy variable, 1 if years of schooling is >14
TENURE Number of years of tenure in the current job
TENURE2
TENURE squared
EXPER Number of years of presumed work experience in firms other than the current one (age-
education-tenure -6)
EXPER2
EXPER squared
ED4TEN Interaction term ED4×TENURE
ED4EXP Interaction term ED4×EXPER
ED6TEN Interaction term ED6×TENURE
ED6EXP Interaction term ED6×EXPER
ED9TEN Interaction term ED9×TENURE
ED9EXP Interaction term ED9×EXPER
ED12TEN Interaction term ED12×TENURE
ED12EXP Interaction term ED12×EXPER
ED14TEN Interaction term ED14×TENURE
ED14EXP Interaction term ED14×EXPER
ED16TEN Interaction term ED16×TENURE
ED16EXP Interaction term ED16×EXPER
PLANT10 Dummy variable, 1 if number of employees in the plant is <10
PLANT99 Dummy variable, 1 if number of employees in the plant is >10 and ≤99
PLANT499 Dummy variable, 1 if number of employees in the plant is >100 and ≤499
PLANTBIG Dummy variable, 1 if number of employees in the plant is ≥500
NORTH Dummy variable, 1 if job is in the Northern region
CENTER Dummy variable, 1 if job is in the Central region
LISBON Dummy variable, 1 if job is in the Lisbon-and-Tagus-Valley region
ALENT Dummy variable, 1 if job is in the Alentejo region
ALGAR Dummy variable, 1 if job is in the Algarve region
OCC0 Dummy variable, 1 if employees are Executive or Directors
OCC1 Dummy variable, 1 if employees are Professionals or Scientists
19
OCC2 Dummy variable, 1 if employees are Technicians or in Management Occupations at
Intermediate Level
OCC3 Dummy variable, 1 if employees are in Administrative or in Related Occupations
OCC4 Dummy variable, 1 if employees are in Service or Sales Occupations
OCC5 Dummy variable, 1 if employees are Laborers
PRIMSECT Dummy variable, 1 if job is in Primary Sector
MANUF Dummy variable, 1 if job is in Manufacturing
TEXTILE Dummy variable, 1 if job is in Textiles
UTIL Dummy variable, 1 if job is in Utilities
CONSTRU Dummy variable, 1 if job is in Construction
WHOLE Dummy variable, 1 if job is in Whole Trade
RETAIL Dummy variable, 1 if job is in Retail Trade
RESTHOT Dummy variable, 1 if job is in Restaurants and Hotels
TRANSP Dummy variable, 1 if job is in Transportation
FINANCE Dummy variable, 1 if job is in Finance
SERVICE Dummy variable, 1 if job is in Services
PARTIME Dummy variable, 1 if it is a part-time job
20
BIBLIOGRAPHY
Bayard, K., Hellerstein J., Neumark D., & Troske, K. (1999). New evidence on sex
segregation and sex differences in wages from matched employee-employer data. NBER
Working Papers Series, WP 7003, March.
Becker, G.S. (1957). The economics of discrimination. Chicago: The University of
Chicago Press, 2nd
ed., 1971.
Blinder, A.S. (1973). Wage discrimination: reduced form and structural estimates.
Journal of Human Resources 8, 436-455.
Cotton, J. (1988). On the decomposition of wage differentials. Review of Economics
and Statistics 70, 236-243.
European Commission (2004). Employment in Europe 2004. Luxembourg: Office for
Official Publications of the European Communities.
European Commission (2005). Employment in Europe 2005. Luxembourg: Office for
Official Publications of the European Communities.
Filer, R.K., Hammermesh, D.S., & Rees, A.E. (1996). The Economics of Work and Pay,
New York: HarperCollins College Publishers, sixth edition.
González, P., Santos, M. C., & Santos, L. D. (2005). The gender wage gap in Portugal:
recent evolution and decomposition. CETE Discussion Paper DP0505, Faculty of
Economics, University of Porto.
Groshen, E.L. (1991). The structure of the female/male wage differential. Is it who you
are, what you do or where you work. The Journal of Human Resources XXVI(3), 457-
472.
Kiker, B.F. & Santos, M.C. (1991). Human capital and earnings in Portugal. Economics
of Education Review10(3), 187-203.
Mincer, J. (1974). Schooling, Experience and Earnings. New York: Columbia
University Press for National Bureau of Economic Research.
Neumark, D. (1988). Employers´ discrimination behaviour and the estimation of wage
discrimination. Journal of Human Resources 23, 279-295.
Oaxaca, R. (1973). Male-female wage differentials in urban labor markets. International
Economic Review 14, 693-709.
Oaxaca, R., & Ransom, M.R. (1994). On discrimination and the decomposition of wage
differentials. Journal of Econometrics 61, 5-21.

21
Plasman, R., Cortese, V., Krzeslo, E., Plasman, A., Rusinek, M., Rycx, F., &
Vanheerswynghels, A. (2001). Indicators on gender pay equality: the Belgian
Presidency’s report. Brussels: European Council.
Rubery, J., Grimshaw, D., Figueiredo, H. (2002). The gender pay gap and gender
mainstreaming pay policy: synthesis report of gender pay equality in EU member states.
EWERC (Manchester School of Management, UMIST). Brussels: report prepared by
the Group of Experts on Gender and Employment commissioned by the Employment
and Social Affairs DG.
22
TABLES
Table 1. Educational workforce characteristics, by age group
Year 1991 Less than 35 35 and above Pooled
Male Female All Male Female All Male Female All
School (average, in years) 6,46 6,81 6,61 5,54 5,48 5,52 5,96 6,26 6,07
Educational attainment (%)
Less than 4 years 2,1 1,5 1,8 7,7 10,0 8,4 5,1 5,0 5,1
4 years 43,0 38,3 41,0 62,3 59,1 61,3 53,4 46,8 51,0
6 years 26,9 27,3 27,1 10,0 9,7 9,9 17,8 20,1 18,6
9 years 12,3 13,7 12,9 6,5 9,1 7,3 9,2 11,8 10,1
12 years 13,4 17,3 15,1 10,7 10,4 10,6 11,9 14,5 12,9
14 years 0,7 0,6 0,7 0,8 0,5 0,7 0,8 0,6 0,7
College degree 1,6 1,3 1,5 2,0 1,2 1,8 1,8 1,2 1,6
Obs. (nº of workers) 397.541 304.149 701.690 469.470 211.082 680.552 867.011 515.231 1.382.242
Obs. (% from total) 28,8 22,0 50,8 34,0 15,3 49,2 62,7 37,3 100,0
Obs. (% of women) 43,3 31,0 37,3
Year 2000 Less than 35 35 and above Pooled
Male Female All Male Female All Male Female All
School (average, in years) 8,23 8,95 8,57 6,56 6,63 6,59 7,33 7,87 7,56
Educational attainment (%)
Less than 4 years 1,0 0,6 0,8 2,9 3,3 3,1 2,0 1,8 1,9
4 years 19,3 15,2 17,4 49,0 46,9 48,2 35,3 30,0 33,1
6 years 29,7 26,4 28,2 17,6 17,6 17,6 23,2 22,3 22,8
9 years 21,1 19,1 20,2 13,9 14,5 14,1 17,2 16,9 17,1
12 years 21,0 27,6 24,1 10,2 12,2 11,0 15,2 20,5 17,5
14 years 1,9 3,1 2,5 1,4 1,5 1,4 1,6 2,3 1,9
College degree 6,1 8,0 7,0 5,1 4,1 4,7 5,5 6,2 5,8
Obs. (nº of workers) 515.352 454.267 969.619 607.273 398.505 1.005.778 1.122.625 852.772 1.975.397
Obs. (% from total) 26,1 23,0 49,1 30,7 20,2 50,9 56,8 43,2 100,0
Obs. (% of women) 46,9 39,6 43,2
23
Table 2 - Gender wage gap (ln) by age group
Pooled <35 years >=35 years
1991 0.279 0.199 0.299
1995 0.255 0.170 0.292
2000 0.241 0.149 0.307
24
Table 3 - Decomposition of the gender wage gap (ln) and discrimination coefficient,
by age group and year
1991 1995 2000
Total gender gap 0,199 0,170 0,149
Endowment differential 33% 31% 20%
Discrimination differential 67% 69% 80%
Male advantage 0,057 0,053 0,055
Female disadvantage 0,075 0,064 0,063
Discrimination coefficient (Dmf) 0,141 0,124 0,126
1991 1995 2000
Total gender gap 0,299 0,292 0,307
Endowment differential 40% 42% 42%
Discrimination differential 60% 58% 58%
Male advantage 0,056 0,060 0,070
Female disadvantage 0,124 0,109 0,108
Discrimination coefficient (Dmf) 0,196 0,184 0,195
Workers aged less than 35 years
Workers aged 35 years and above
25
Table 4 - Contribution of variables to the gap due to endowment differential, by
age group and year
Contribution Source Value (ln) % Value (ln) % Value (ln) %
Human capital -0,0010 -1,6% -0,014 -25,7% -0,0220 -72,9%
Plant size -0,0085 -12,8% -0,013 -24,0% -0,0049 -16,1%
Location 0,0011 1,6% 0,001 1,3% -0,0003 -1,1%
Occupation 0,0010 1,5% 0,008 15,4% 0,0110 36,1%
Industry 0,0760 114,6% 0,074 140,4% 0,0495 163,0%
Part-time -0,0022 -3,4% -0,004 -7,3% -0,0027 -8,9%
Gap due to attribute differential 0,0663 100% 0,0527 100% 0,0304 100%
Contribution Source Value (ln) % Value (ln) % Value (ln) %
Human capital 0,0228 19,0% 0,0198 16,1% 0,0185 14,3%
Plant size 0,0013 1,1% -0,0016 -1,3% 0,0061 4,7%
Location -0,0009 -0,7% -0,0019 -1,6% -0,0029 -2,2%
Occupation 0,0098 8,2% 0,0267 21,8% 0,0307 23,8%
Industry 0,0918 76,6% 0,0852 69,5% 0,0765 59,3%
Part-time -0,0050 -4,2% -0,0055 -4,5% 0,0001 0,1%
Gap due to attribute differential 0,1198 100% 0,1226 100% 0,1290 100%
Workers aged less than 35 years
1991 1995 2000
Workers aged 35 years and above
1991 1995 2000