Embed Size (px)
Citation preview
DP--48-53
ANALYSIS OF TEE ANOMALOUS SCALE-DEPENDENT BEHAVIOR OF DISPBBSIVITY USIIOG STRAIGETFORUARD MALYTICAL BQUATIOAS: FLOW VARLIWCE VS. DISPERSION
Brian B. Looney Q q dal,
E. I. du Pont de Nemours and Company Savannah River Laboratory Aiken, SC 29808
and
M. Todd S c o t t
Environmental Systems Engineering Clemson Univers i ty Clemson, SC
DISCLAIMER
This report was prepared as an account of work sponsored by an agency of the United States Government. Neither the United States Government nor any agency thereof, nor any of their empluyees, makes any warranty, express or implied, or assumes any legal liability or responsi- bility for the accuracj, completeness, or usefulness of any information, apparatus, product, or process disclosed, or represents that its use would not infringe privately owned rights. Refer- ence herein to any specific commercial product, process, or service by trade name, trademark, manufacturer, or otherwise does not necessarily constitute or imply its endorsement, rccom- mendation, or favoring by the United States Government or any agency thereof. The views and opinions of authors expressed herein do not necessarily state or reflect those of the United States Government or any agency thereof.
MASTER
This paper was prepared i n connection with work done under Contract No. DE-AC09-76SR00001 with the U. S . Department of Energy. By acceptance of t h i s paper, t he publ i sher and/or r ec ip i en t acknowledges the U.S. Government 's r i g h t t o r e t a i n a nonexclusive, roya l ty - f r ee l i c e n s e i n and t o any copyright covering t h i s paper, along with the r i g h t t o reproduce and t o author ize o thers t o reproduce a l l o r p a r t of t he copyrighted paper.
IS

DISCLAIMER
ncy of the United States thereof, nor any of
the accuracy, completeness, or usefulness of any information, apparatus, product, orprocess disclosed, or represents that its use would not infiinge privately owned rights. Referenceberein to any specific commercial product, process, or service by trade name, t r a d e d manufacturer, or otherwise necessarily constitute or imply its endorsement, recommendation, or favoring by the tates Government or any agency thereof. The views and opinions of authors expressed herein do not necessarily state or reflect those of the United States Government or any agency thereof.
anty, express or , or assumes any legal liability
the best available copy.
the o&ce of Scientific and Technical Infomation, ailable from (615) 576-8401.
Tedhnical Information Service, U.S. Department of
Available to DOE
1
I
,
~

DISCLAIMER
Portions of this document may be illegible in electronic image products. Images are produced from the best available original document.

ANALYSIS OF THE ANOMALOUS SCALE DEPENDENT BEHAVIOR OF DISPERSIVITY USING STRAIGHTFORWARD ANALYTICAL EQUATIONS: FLOW VARIANCE VS. DISPERSION*
Brian B. Looney
E. I. du Pont de Nemours and Company Savannah River Laboratory Aiken, SC 29808
and
M . Todd Scott
Environmental Systems Engineering Clemson University Clemson, SC
ABSTRACT
Recent field and laboratory data have confirmed that apparent dispers-
ivity is a function of the flow distance of the measurement. This scale
effect is not consistent wi.th classical advection dispersion modeling often
used to describe the transport of solutes in saturated porous media. Many
investigators attribute this anomalous behavior to the fact that the
spreading of solute is actually the result of the heterogeneity of subsurface
materials and the wide distribution of flow paths and velocities available in
such systems. An analysis using straightforward analytical equations confirms
this hypothesis.
matches available field data when a variance descriptor ( 0 ) of approximately
0.4 is employed. Also, current field data provide a basis for statistical
selection of the variance parameter based on the level of concern related to
the resulting calculated concentration. While the advection dispersion
approach often yielded reasonable predictions, continued development of
statistical and stochastic techniques will provide more defendable and
mechanistically descriptive models.
An analytical equation based on a flow variance approach

INTRODUCTION AND SUMMARY
Development of mathematical models that accurately describe the transport
of solutes in saturated and unsaturated porous media is an integral part in
the assessment of the location and management of new and existing waste
disposal facilities, as well as an important element in our fundamental
understanding of geochemistry and diagenesis in the subsurface. A large
number of computational algorithms are available to describe the behavior of
solutes in subsurface flow systems. These range from direct solutions of
governing equations based on assumed initial and boundary conditions to
numerical finite element and finite difference methods. Despite the apparent
diversity of methods, the various algorithms almost exclusively rely on ‘the
same governing equation--the advection and dispersion equation. Critical
evaluation of this equation is important, affecting most of the available
models. From a practical standpoint, any deficiencies identified should be
put into perspective (i.e., how significant are differences between the model
predictions and field measurements). Also, alternate methods, or the general
path toward these methods, should be identified.
Recent data on laboratory- and field-scale dispersivity measurements
[Silliman and Simpson, 1987; Gelhar et al., 1985; Moltz et al., 19861
document a phenomenon that is not consistent with the advection and dispersion
approach; measured dispersivity values are a function of the measurement scale
rather than a constant value. A variety of explanations have been developed
for this phenomenon [Gelhar e t al., 1985; Molz et al., 1986; Dagan, 1987;
Greenkorn and Cala, 1986; Russo and Bresler, 1982; Konikow and Mercer, 1988;
and Domenico and Robbins, 19841. A consensus among the various investigators
is emerging, however. Many geohydrologists and modelers attribute the effect
to the heterogeneity found in the subsurface flow systems and the stochastic

. nature of flow between various locations. As a result, a few alternate
modeling approaches have been developed. These include several complex -
stochastic transport models [Gelhar, 1986; Mantoglou and Gelhar, 1987; Yeh
et al., 1985; Duffy and Gelhar, 1986; Gutjahr and Gelhar, 1981; Simmons,
19821, and straightforward descriptions of statistically stratified flow
fields [Matheron and de Marsily, 1980; Dagan, 1984; Jury, 1982; Jury e t al.,
1986.1 To date, however, the relationship between the alternate methods and
the classical advection dispersion approach has not been addressed in a
definitive manner. The development of a straightforward alternate modeling
approach, along with a comparison of the approach to classical methods, is
presented below.
BACKGROUND
To meet the general objective described above, two analytical solutions
describing solute transport were developed for the same boundary and initial
conditions. One of these is based on the advection and dispersion equation,
while the other is based on a heterogeneous media providing a distribution of
flow paths between two locations--a flow variance approach. Note that the
flow variance approach assumes that all of the spreading of a solute is due
to the heterogeneity in available flow paths, and the solution is based on
the transfer function similar to Jury and co-workers [Jury, 1982; Jury et a l . ,
19863; no diffusion or dispersion is assumed. The calculated concentrations
at any time a t various locations show that the two approaches are almost
identical at a reference location; however, they diverge significantly at
other locations.
Based on the two equations, a mathematical relationship between the
assumed variance of the flow velocity distribution and dispersivity was
derived. Variances were then calculated from the well documented data set

presented in Gelhar et al. I19851.
centered around a constant value of 0.4, and there was no effect of scale.
This suggests that the flow variance approach may be a more mechanistically
consistent description of subsurface transport. The probability distribution
of the calculated variances provides modelers with a tool to calculate con-
centrations that have an explicit degree of conservatism built in. Although
the analysis suggests that the classical advect ion dispersion approach may
be sufficiently accurate for some transport calculations (e.g., calculating
concentrations at a single receptor location or calculating relative concen-
trations to compare engineered options), additional development of alternate
approaches is recommended. Specifically, stochastic and flow variance
approaches appear to be attractive candidates for incorporation into both
numerical and analytical models. The initial results with the flow variance
approach provide a more satisfactory description of the field data than the
advection dispersion approach.
The resulting variance descriptors' values
Classical Advection Dispersion Approach
The transport of solutes through a porous medium is typically represented
in terms of advection modified by dispersion processes; both of these may be
adjusted for retardation caused by interaction of the solute with alternate
solution phases or the solid matrix. Dispersion is a mathematical construct
that is used t o represent the spreading of solute caused by molecular diffu-
sion, velocity gradients across the pores, mixing of pore channels, and the
effects of spatial heterogeneity in natural systems (e.g., layering or
channeling). The one-dimensional form of the advection-dispersion equation
for nonreactive solutes under uniform flow is:

where: x = the coordinate along the flow line (length)
v’ = is the average linear flow velocity (length/time)
D = the longitudinal dispersion coefficient ( length2/time)
C = the solute concentration (mass/length3)
The longitudinal dispersion coefficient is typically expressed as :
D = a 0 + D* ( 2 )
where: a = the dispersivity (length)
D* the molecular diffusion coefficient in the medium
( length2/ t ime) . Molecular diffusion is generally considered insignificant in practical field
applications (based on peclet number and other considerations).
These simplified constructs form the basis of most analytical and
numerical models currently used. to describe solute transport. However, a
growing body of data suggests that this approach is not entirely adequate to
represent the complex flow and geochemical processes occurring in real sub-
surface systems. In particular, the dispersivity, a, that is theoretically a
function of the porous medium has been shown to be dependent on the scale of
measurement in both Laboratory and field studies [Silliman and Simpson, 1987;
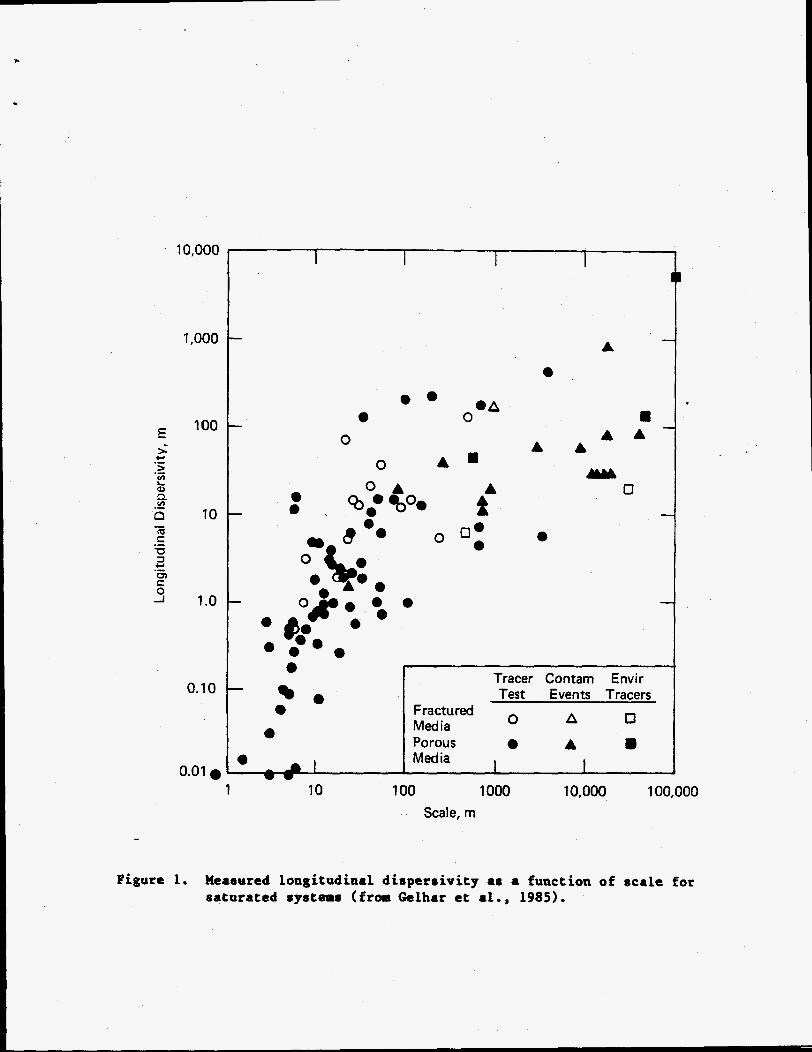
Gelhar et al., 1985; Moltz et al., 19861. Figure 1, adapted from Gelhar et
al. [1985], demonstrates this relationship. In fact, many investigators have
recommended approximating ca using a direct relationship [Looney et al., 1987,
Fjeld et al., 19871:
a = B L ( 3 )
where: L = the reference receptor location (length)
t3 = the dispersivity distance multiplier.
A B value of 0.1 is commonly recommended following inspection of figures
similar to Figure 1 [Anderson, 1984; Looney et al., 1987; Fjeld et al., 19871.

To evaluate the relationship between the classical advect ion-dispersion
approach and an alternate approach based on mathematical description of flow
rate heterogeneity, analytical solutions for each will be developed. For a
step function input, the following equation describes the concentration at a
receptor location as a function of time [Freeze and Cherry, 19791:
t c o Boundary Conditions
where C(x,t) is the concentration at location x at time t based on advection
and dispersion, etfc represents the complementary error function and x is any
receptor location (x > 0). In this case, D is assumed to be defined by ( 2 )
and ( 3 ) for a reference receptor location.
Derivation of a Flow Variance-Based Equation
A straightforward method of calculating solute concentration in sub-
surface f low systems based on a transfer function has been proposed by
Jury [19821 and Jury et al. [1986]. To date, this approach has been applied
to partially saturated soil transport systems. However, the concept may be
generalized to describe solute transport from a source zone to a receptor
zone in a fully saturated subsurface flow system.
The transfer function approach assumes that a flow system, in this
case an aquifer, may be entirely described in terms of a mathematical

transformation of the solute input function into an output function. The
mathematical transformation used is se'lected to be consistent with the assumed
governing physical and chemical processes. Thus, while the ultimate model is
mechanistically consistent, it is not fully descriptive (e.g., specific
variations in permeability caused by channels or barriers are not explicitly
described). The transfer function model estimates the average and extreme
behavior of solutes based on the field-measurable (or inferred) distribution
of travel times in a porous medium. The transport of solutes in the sub-
surface is assumed to be entirely defined by the mean flow velocity and a
probabilistic description of the variability in flow velocity. The model
assumes no dispersion, other than that which is implicit in the travel time
variation.
Subject to these assumptions, the probability that a solute entering a
flow system at a location (x = 0) will reach a reference receptor location
(x = L) after a specified time at a mean flow velocity ( 7 ) is:
Gt PL(t) = fL(;t'> d(vt ' 1
where fL(vt) is the probability density function (i.e., the probability
that a solute will arrive between 7t and 'vt+d(Tt)is fL(vt) d(5t)) [Jury
et a l . , 1982; Raats, 19781. By representing the transfer as a probability
density, all of the mechanisms that contribute to solute spreading are assumed
to be functions of Ct. The system may be viewed as a bundle of tubes of
different length within which fluid flows by piston flow.
By superposition, the concentration at the reference receptor location
( x L) for arbitrary variations in source concentrations is
m

e
A
C(x,t)
where C(x,t
A where C(L,~) = concentration at reference location (L) at time t
h c ( ~ , ~ ) = concentration at x = 0 at time t
The concentration at any receptor location is determined by assuming that the
governing processes between x = 0 and x L are the same between all other
receptor locations:
eo
d(vt '1 ( 7 1 (O,(St - k')) x L (it'L/x) c L - f = I c
0
is the concentration at location x based on flow variance in
the subsurface. Thus, a reference calibration function fL allows statistical
description of transport to all receptor locations.
Several measurements of flow velocity or hydraulic conductivity varia-
tions have been reported in the literature [Jury and Stolzy, 1982; White
et al., 1986; Molz et al., 1986; Nielson et al., 1973; Van de Pol et al.,
1977; Bigger and Neilson, 1976; Sharma et al., 1980; Smith et al., 1985;
White et al., 19841. These studies suggest that the calibration function,
fL is a lognormal distribution. Thus the travel time density function may
be written as: c
where P is the mean of the distribution of ln(?t) and a2 is the corresponding
variance. The standard deviation, 0, is a descriptor of the variance that is
used in the model solutions. In a fully saturated flow system, IJ will be
approximately equal to ln(L).
available for various assumed input functions [Jury et al., 19821. These
include :
Several analytical solutions of (7) and (8) are

for a step function input - x ) 0
t > 0 } Boundary Conditions
t c o
Based on the previous studies, CJ values should be in’the range of 0.5 [Jury
et al., 1986; Jury et al., 1982; Moltz et al., 19861. A comparison of this.
approach, Equation (91, to the traditional advection dispersion approach,
Equation (41, along with a straightforward transformation of the data set
documented in Gelhar et al. 119851, provides an intuitive explanation of the
observed dispersivity scale effect and provides a semiquantitative estimate
of field values for 0.
Comparison of Alternate Weir
Equation (9) defines the concentration at a receptor based on solute
transport in a one-dimensional flow system in which the spreading of solute
between the source and receptor is described by media/flow rate heterogeneity.
Equation ( 4 ) defines the receptor concentration for this same system in which
the spreading of solute is described by conventional advection and dispersion
assumptions. By equating the underlying equations, the relationship between
the descriptors (dispersion and variance) can be evaluated:
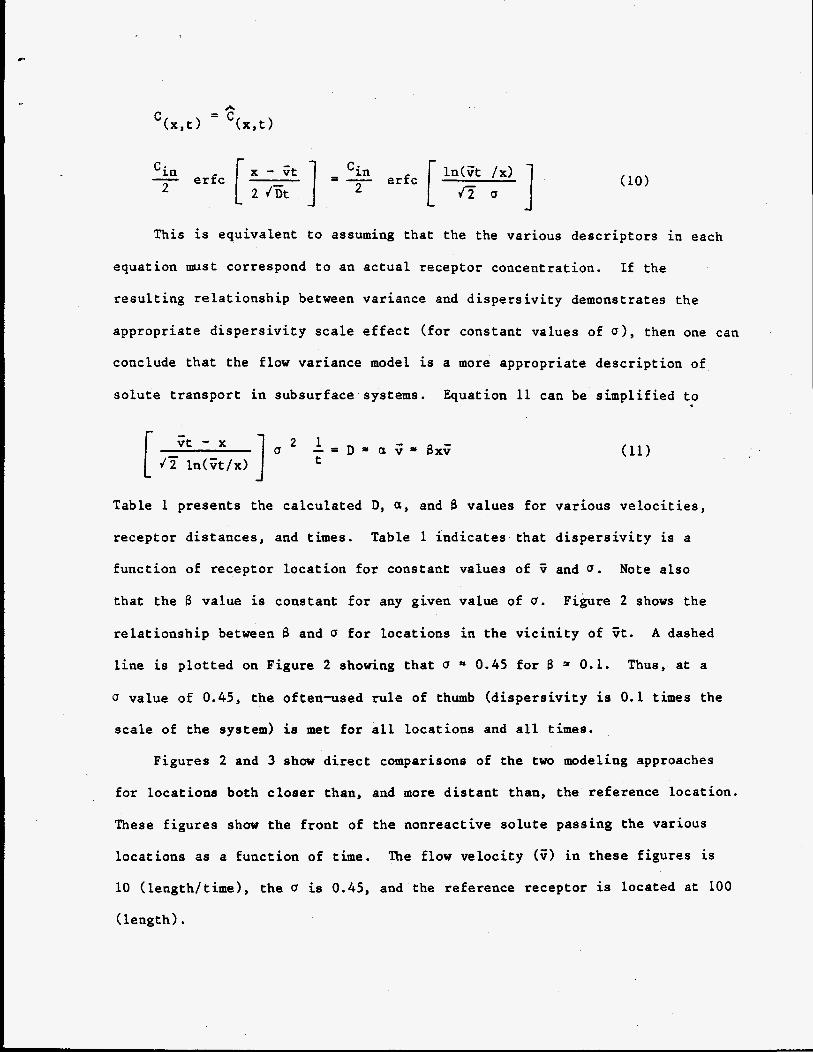
This is equiva len t t o assuming t h a t the the var ious desc r ip to r s i n each
equat ion must correspond t o an a c t u a l receptor concentrat ion. Xf t he
r e s u l t i n g r e l a t i o n s h i p between var iance and d i s p e r s i v i t y demonstrates t he
appropr i a t e d i s p e r s i v i t y s c a l e e f f e c t ( f o r constant values of 01, then one can
conclude t h a t the flow var iance model i s a more appropr ia te desc r ip t ion of
s o l u t e t r anspor t i n subsurface systems. Equation 11 can be s impl i f i ed t o
Table 1 presents the ca l cu la t ed D, a , and 8 va lues f o r var ious v e l o c i t i e s ,
r ecep to r d i s t ances , and t i m e s . Table 1 i n d i c a t e s t h a t d i s p e r s i v i t y is a
func t ion of receptor l o c a t i o n f o r constant values of 5 and 0. Note a l s o
t h a t t he B value i s constant f o r any given value of U. Figure 2 shows the
r e l a t i o n s h i p between B and U f o r l oca t ions i n the v i c i n i t y of 3t. A dashed
l i n e is p l o t t e d on Figure 2 showing t h a t 0.45 f o r B 0.1. Thus, a t a
U value of 0.45, t he of ten-used r u l e of thumb ( d i s p e r s i v i t y is 0.1 t i m e s the
sca l e of t he system) is m e t f o r a l l l oca t ions and a l l t i m e s .
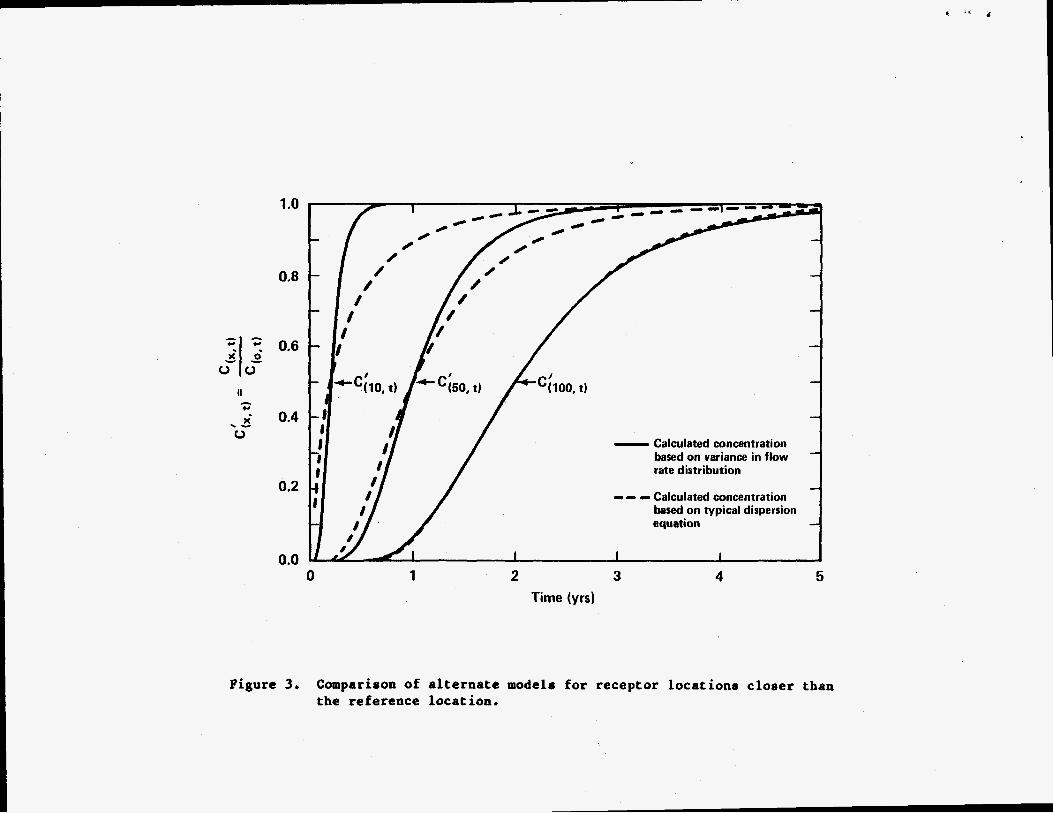
F igures 2 and 3 show d i r e c t comparisons of t he two modeling approaches
fo r l oca t ions both c l o s e r than, and more d i s t a n t than, the re ference loca t ion .
These f i g u r e s show t h e f r o n t of t he nonreact ive s o l u t e pass ing the var ious
loca t ions a s a func t ion of t i m e . The flow ve loc i ty (SI i n t h e s e f igu res is
10 ( length / t ime) , t he U is 0.45, and the re ference receptor is located a t 100
( l eng th ) .
Since a constant dispersivity (or dispersion coefficient) is almost
always used when modeling subsurface transport, Figures 3 and 4 indicate the
type and magnitude of possible error when receptors are at a range of
locations.
both models predict a relative concentration (C/Co) of 0.5. Also, at x = L
(i.e., the receptor is at the reference location) the concentrations at all
times are essentially identical. However, when x f L, the "tails" of the
passing calculated plumes diverge significantly. If x < L, the advection dispersion approach predicts greater spreading of solute, while at x > L the advection dispersion approach predicts less spreading of solute.
When x = Gt (i.e., the receptor is at the mean flow position),
Using Equation 11, U values based on the well documented data set in
Gelhar et al. I19851 can be approximated.
that dispersivity is a function of receptor scale (Figures 1 and 5a), a plot
of the approximate u values. (Figure 5b) has no scale dependence.
While the data demonstrate clearly
Also, these
(5 values appear to be reasonably well described by a lognormal distribution
(Figure 6 ) .
(0 = 0 . 4 1 , along with the 10% (a 4.07) and 90% (0 ~1.05) values, are plotted
as lines on Figure 5a.
The approximated dispersivity scale effects based on the median
Finally, the data shown in Figure 6 may be used in a practical modeling
approach to screen solute transport in simple systems (e.g., a small waste
site).
modeling methods are warranted. Analytical solutions to the mathematical
equations of contaminant transport have received considerable attention as
tools for screening the hazard associated with active and inactive waste
sites, or for assessing the suitability of a waste for disposal in a facility
designed for nonhazardous materials. Most notably, the U.S. Environmental
Protective Agency (EPA) has recommended a three-dimensional analytical model
The resulting semiquantitative calculation may indicate if more robust
for these purposes, the vertical and ho i tal read (VHS) model [EPA 1985a,
EPA 1985bI. In general, analytical models are attractive screening tools
because they are simple to apply (making the analysis of many constituents at
many sites tractable) and they require a relatively small number of input
parameters.
Often, investigators assert that assuming minimal solute spreading
(typically by using a low D) will yield a conservative (somewhat high)
calculated estimate of concentration/risk. While this is sometimes the case,
the opposite assumption (one of maximum solute spreading) will often yield a
higher calculated risk due to significant levels reaching more distant
receptors (this is especially true when considering radionuclides or degrading
organics). Table 2 lists several cases in which assumption of relatively more .
(or less) solute spreading will yield results that tend to be conservative in
terms of risk.
With these precepts in mind, one can select a a value, or a bounding
range of 0 values, to screen the risk associated with a particular location.
For cases where analysis of minimum spreading is desired, one might choose a
0 of 0.07. This is equivalent to selecting a variance descriptor that will
yield concentrations that are higher than 90% of the values reported in the
literature. Similarly, if maximum spreading is desired, a u of 1.05 might be
used (yielding a spreading of solute that is greater than that predicted by
90% of the variance values i n the literature). A more detailed listing of the
range of reasonable Q values, derived from Figure 6 , is provided in Table 3.
DISCUSSION
Field and laboratory measurements of dispersion in a wide variety of
media suggest that dispersivity is not a function of the aquifer material, but
instead it depends on the scale of the system. Several explanations of this

phenomenon have been developed. For example, Domenico and Robbins [1984]
demonstrate t h a t using an (n-l)-dimensional model t o model an n-dimensional
physical system w i l l in t roduce a d i s p e r s i v i t y scale e f f e c t . Davis [1986]
demonstrates t h a t t h e scale e f f e c t is a mathematical r e s u l t of r ep resen t ing
a q u i f e r p r o p e r t i e s as mean values.
of aqu i f e r p r o p e r t i e s f u r t h e r ; f o r example Smith and Schwartz [19801 conclude
t h a t macroscopic d i s p e r s i o n r e s u l t s from large-scale s p a t i a l v a r i a t i o n s i n
hydrau l i c conduc t iv i ty and t h a t t he u s e of l a rge d i s p e r s i v i t y values and
uniform flow f i e l d s i s an inappropr i a t e d e s c r i p t i o n of t r anspor t of s o l u t e s
i n subsurface geo log ica l systems.
The emerging consensus c a r r i e s t he concept
As discussed i n Konikow and Mercer 119881, numerous i n v e s t i g a t o r s have
provided i n s i g h t s t o place on f i rmer ground the l a r g e l y i n t u i t i v e concept of
s p a t i a l he t e rogene i ty impacting apparent d i s p e r s i v i t y .
have developed robust numerical methods t h a t desc r ibe d i s p e r s i o n i n a randomly
,
Gelhar and o the r s
varying porous medium using t h e Fourier transform [Gelhar e t al . , 1979;
Matheron and de Marsily, 1980; Gelhar and Axeness, 1983; Dieul in et a l . ,
19811. S t a t i s t i c a l and Green's funct ions [Dagan, 1984; Jury, 1982; J u r y
et a l . , 19861 , Monte Carlo methods [Schwartz, 1977; Smith and Schwartz, 19801,
and random walk methods [Dagan, 19821 have a l s o been appl ied t o porous media.
Resul ts from desc r ib ing f r a c t u r e d rock flow systems as networks suggest t h a t
f r a c t u r e d media do not behave as an equivalent continuum [Long e t a l . , 1982;
Robinson, 1983; Schwartz et a l . , 1983; Endo et a l . , 1984; Long and
Witherspoon, 1985; Rasmussen e t a l . , 1985; Andersson and Dverstorp, 19871.
Some i n v e s t i g a t o r s have viewed subsurface media as a system of separate
channels, tubes, o r s t r a t a i n which flow proceeds independently.at d i f f e r e n t
speeds [Nere t r i cks , 1984; Molz, 19861. A l a r g e number of t he techniques
descr ibed above, along with t h e model descr ibed he re in , are predicated

on a statistical description of aquifers and the resulting effects on solute
spreading.
Two promising techniques that have been documented in recent publications
and presentations are the application of fractal geometry mathematics to dis-
persion and the incorporation of geological models of depositional environment
into transport models. Fractals [Mandelbrot, 19831 have unique mathematical
properties that correspond to a scale-dependent description of heterogeneity
or fractures [Ross, 1986; Wheatcraft and Tyler, 19881. Understanding the
depositional environment of a subsurface flow system is a key element in
describing the site-specific statistical nature of the heterogeneities and
potential for isolated flow paths in critical areas [Anderson, 1987; Fogg,
19861. Significant developments in these emerging fields are expected.
The various investigations related to subsurface flow and transport
systems have improved our understanding of these systems. None of the studies
to date, however, has produced a definitive direct explanation of the scale
dependence of apparent dispersivity. The direct comparison of an analytical
solution based on classical advection dispersion assumptions to one based on a
statistical flow variance assumption, combined with the active and preceding
research, supports the concept that large-scale heterogeneities play a
controlling role in solute spreading during subsurface transport. Further
development of the various fractal geometry, geological, and statistical
methods will ultimately provide usable numerical and analytical models that
are descriptive and defendable.
CONCLUSION
A straightforward description of solute transport based on the hetero-
geneity of subsurface systems appears to eliminate the anomalous scale
dependence seen in applications of the classical advection dispersion

approach. An alternate analytical solution, based on description of solute
transport as nondispersive flow in a lognormal flow distribution field,
yielded consistent results with variance descriptor values, (5, centering near
0.4 . The concentrations calculated using the two models were identical at a
reference receptor location, but diverged significantly at other receptor
locations. The literature provides sufficient data to derive u values to
screen sites where detailed-measured transport parameter data are limited.
The resulting screening may be sufficient to reduce the need for more robust
field work and numerical models at every site. Based on the results,
additional development of stochastic and flow variance approaches, to be
incorporated into numerical and analytical models is recommended. Such *
development will improve the ability of modelers to adequately simulate the
observable natural heterogeneity of subsurface geological materials, the
framework of hydrologic transport systems.
ACKNOWLEDGMENT
The information contained in this article was developed during the
course of work under Contract No. DE-AC09-76SR00001 with the U . S . Department
of Energy.

REFERENCES
Anderson, M. P., Geological facies models: What can they tell us about
heterogeneity, EOS-Trans. A.G.U., 68, 300, 1987.
Anderson, M. P., Movement of contaminants in groundwater: groundwater
transport--advection and dispersion, Groundwater Contamination, National
Academy Press, Washington, DC, 1984.
Andersson, 3., and E. Dverstorp, Conditional simulations of fluid flow in
three-dimensional networks of discrete fractures, Water Resources Res., 23,
1876-1886, 1987.
Biggar, J. W., and D. R. Nielson, Spatial variability of the leaching
characteristics of a field soil, Water Resources Res., 12, 78-84, 1976:
Dagan, G., Theory of solute transport by groundwater, Ann. Rev. Fluid Mech., , I
19, 183-215, 1987.
Dagan, G., Solute transport in heterogeneous porous formations, Jour. Fluid
Mechanics, 145, 151-177, 1984.
Dagan, G., Stochastic modeling of groundwater flow by conditional and
unconditional probabilities, 2: the solute transport, Water Resources Res.,
18, 835-848, 1982.
Davis, A. D. , Deterministic modeling of dispersion in heterogeneous permeable media, Ground Water, 24, 609-619, 1986.
Dieulin, A., G. Matheron, and G. de Marsily, Growth of the dispersion
coefficient with mean traveled distance in porous media, Science of the
Total Environment, 21, 319-321, 1981.
Domenico, I?. A., and G. A. Robbins, A dispersion scale effect in model
calibrations and field tracer experiments, Jour. Hydrology, 70, 123-132,
1984.

Duffy, C. J., and L. W. Gelhar, A frequency domain analysis of groundwater
quality fluctuations: interpretation of field data, Water Resources Res,,
2 2 , 1115-1128, 1986.
Endo, H. K . , J. C. S. Long, C. R. Wilson, and P. A. Witherspoon, A model for
investigating mechanical transport in fracture networks, Water Resources
Res., 20, 1390-1400, 1984. - EPA, Hazardous waste management system: identification and listing of hazard-
ous waste, 50 FR 7822, U.S. Environmental Protection Agency, Washington, DC,
1985a.
EPA, General clarification of the VAS model and its application, 50 FR 48897,
U.S. Environmental Protection Agency, Washington, DC, 1985b.
Fjeld, R. A., A. W. Elzerman, T. J. Overcamp, N. Giannopoulos, S. Crider, and
B. L. Sill, Verification and sensitivity of the calculational methods used
in the PATHRAE code to predict subsurface contaminant transport for risk
assessment of SRP waste sites, Report COOR-86-0385, by Clemson University
for E. I. du Pont de Nemours and Company, Savannah River Laboratory, Aiken,
SC, 1986.
Fogg, G. E., Groundwater flow and sand body interconnectedness in a thick
multiple aquifer system, Water Resources Res., 22, 679-694, 1986.
Freeze, R. A . , and J. A. Cherry, Groundwater, pp 389-401, Prentice Hall, Znc.,
Englewood Cliffs, NJ, 1979.
Gelhar, L. W., Stochastic subsurface hydrology from theory to applications,
Water Resources Res., 22, 135S-145S, 1986.
Gelhar, L. W., and C. L. Axness, Three-dimensional stochastic analysis of
macrodispersion in aquifers, Water Resources Res., 19, 161-170, 1983.

Gelhar, L. W., A. Montoglou, C. Welty, and K. R. Rehfeldt, A review of field-
scale physical solute transport processes in saturated and unsaturated
porous media, Report EA-4190, Electric Power Research Institute, Palo Alto,
CA, 1985.
Gelhar, L. W., A. L. Gutjahr, and R. L. Naff, Stochastic analysis of
15, macrodispersion in a stratified aquifer, Water Resources Res.,
1387-1 39 7 , 1979. Greenkorn, R. A., and M. A. Cala, Scaling dispersion in heterogeneous porous
media, Ind. Eng. Chem. Fundam., 25, 506-510, 1986.
Gutjahr, A. L., and L. W. Gelhar, Stochastic models of subsurface flow:
infinite versus finite domains and stationarity, Water Resources Res., 17,
337-350, 1981.
Jury, W. A., Simulation of solute transport using a transfer function model,
Water Resources Res., 18, 363-368, 1982.
Jury, W. A., L. H. Stolzy , and P. Shouse, A field test of the transfer
function model for predicting solute transport, Water Resources Res., 18,
369-375, 1982.
Jury, W. A., G. Sposito, and R. E. White, A transfer function model of solute
transport through soil, 1. fundamental concepts, Water Resources Res., 22,
243-247, 1987.
Konikow, L. F., and J. W. Mercer, Groundwater flow and transport modeling,
Jour. Hydrology (in press).
Long, J. C. S., and P. A. Witherspoon, The relationship of the degree of
interconnection to permeability, Jour. of Geophys. Res., 90, 3087-3094,
1985.

Long, J. C. S., J. S. Remer, C. R. Wilson, and P. A. Witherspoon, Porous
media equivalents for networks of discontinuous fractures, Water Resources
Res., 18, 645-658, 1982. - Looney, B. B., M . W. Grant, and C. M. King, Estimation of geochemical
parameters for assessing subsurface transport at the Savannah River Plant,
Report DPST-85-904, E. I. du Pont de Nemours and Company, Savannah River
Laboratory, Aiken, SC, 1987.
Mandelbrot, B. B., The Fractal Geometry of Nature, W. H. Freeman and Co.,
New York, 1983.
Nantoglou, A., and L. W. Gelhar, Stochastic modeling of large-scale transient
unsaturated flow systems, Water Resources Res., 23, 37-46, 1987.
Matheron, G., and G. de Marsily, Is transport in porous media always
diffusive? A counter example, Water Resources Res., 16, 901-917, 1980.
Molz, F. J., 0. GGven, J. G. Malville, R. D. Crocker, and K. T. Matteson,
Performance, analysis, and simulation of a two-well tracer test at the
Mobile Site, Water Resources Res., 22, 1031-1037, 1986.
Nielson, D. R., J. W. Bigger, and K. T. Erh, Spatial variability of field
measured soil water properties, Hilgardia, 42, 215-260, 1973.
Neretnieks, I., A note on fracture flow dispersion mechanisms in the ground,
Water Resources Res., 19, 364-370, 1984.
Raats, P. A. C., Convective transport of solutes by steady flows, 1. general
theory, Agric. Water Manag., 1, 201-218, 1978.
Rasmussen, T. C., C. Huang, and D. E. Evans, Numerical experiments on
artificially generated, three-dimensional fracture networks: an examination
of scale and aggregation effects, Mem. International Assoc. of Hydro-
geologists, 17, 676-682, 1985.

Robinson, P. C., Connectivity of fracture systems--a percolation theory
approach, Jour. Phys. A: Math. Gen., 16, 605-614, 1983.
ROSS, B., Dispersion in fractal fracture networks, Water Resources Res., 22,
823-827, 1986.
RUSSO, D., and E. Bresler, A univariate versus a multivariate parameter
distribution in a stochastic-conceptual analysis of unsaturated flow, Water
Resources Res., 18, 483-488, 1982.
Schwartz, F. W., Macroscopic dispersion in porous media: the controlling
factors, Water Resources Res., 13, 743-752, 1977.
Schwartz, F. W., L. Smith, and A. S. Crowe, A stochastic analysis of
macroscopic dispersion in fractured media, Water Resources Res., 19,
1253-1265, 1983.
Sharma, M. L., G. A. Gander, and C. G. Hunt, Spatial variability of
infiltration in a watershed, Jour. Hydrol., 45, 101-122, 1980.
Silliman, S. E., and E. S. Simpson, Laboratory evidence of the scale effect
in dispersion of solutes in porous media, Water Resources Res., 23,
1667-1673, 1987.
Simmons, C. S.; A stochastic-convective ensemble method for representing
dispersive transport in groundwater, Report No., CS-2558, Electric Power
Research Institute, Palo Alto, CA, 1982.
Smith, L., and F. W. Schwartz, Mass transport, 1: A stochastic analysis of
macroscopic dispersion, Water Resources Res., 16, 303-313, 1980.
Smith, M. S., G. W. Thomas, R. E. White, and D. Ritonga, Transport of
Escherichia coli through intact and disturbed columns of soil, Jour.
Environ. Qual., 14, 87-91, 1985.
Van de Pol, R. M., P. J. Wierenga, and D. R. Nielsen, Solute movement in a
field soil, Soil Sci. SOC. Am. J., 41, 10-13, 1977.

Wheatcraft, S. W. and S. W. Tyler, An explanation of scale-dependent
dispersivity in heterogeneous aquifers using concepts of fractal geometry,
Water Resources Res. (in press).
White, R. E., G. W. Thomas, and M. S. Smith, Modeling water flow through
undisturbed cores using a transfer function model derived from 3HOH and Cl
transport, Jour. Soil Science, 35, 159-168, 1984.
White, R. E., J. S. Dyson, R. A. Haigh, W. A. Jury, and G . Sposito, A transfer
function model of solute transport through soil, 2: illustrative applica-
tions, Water Resources Res., 22, 248-254, 1986.
Yeh, T. C. J., L. W. GeLhar, and A. L, Gutjahr, Stochastic analysis soils, 1.
statistically isotropic media, Water Resources Res., 21, 447-457, 1985.

a
B
C(X,t>
C(x,t)
D
D*
L
t
- V
X
NOTAT ION
the longitudinal dispersivity, length
the dispersivity distance multiplier
the concentration at Location x at time t based on advection dispersion assumptions, mass/length3
the concentration at location x at time t based on flow variance assumptions, mass/length3
the Longitudinal dispersion coefficient, length2/time
the molecular diffusion coefficient in the medium, length2/time
reference receptor location, length
time
average flow velocity, lengthltime
flow distance, length

TABLE 1
Dispersivity ad a Function of V, x and t
Input Data
V X t D U B D a B D A B
Res u 1 ts Q = 0.1 . Q = 0 .25 Q = 0.45
------------ 50
50
50
50
5
10
50
100
10
100
1000
10000
100
100
100
100
0.19
1.9
19
190
19
9
1.9
0.9
2 . 5 0.05 0.005 15.6 0.3 0.03 50.7
25 0.5 0.005 156 3.0 0.03 507
250 5.0 0.005 1560 30.0 0.03 5070
2500 50 0.005 15600 300 0.03 50700
50.7
101
507
1013
1.01 0.101
10.1 0.101
101 0.101
1010 0.101
10.1 0.101
10.1 0.101
10.1 0.101
10.1 0.101

TABLE 2
Considerations Related to Selection of B or u in Risk Screening Applications*
Conditions that tend to result in higher calculated risk for low assumed spreading (low CY or low a)
o Initial concentration < health based standard
0 Receptor location < flow time x flow velocity adjusted for retardation
0 Nondecaying chemical (or chemical that is growing in from parent or from react ion)
Short "tail'' of plume following source reduction is acceptable
Conditions that tend to result in higher calculated risk for high assume3 spreading (high d or a)
0 Initial concentration > or >> health based standard 0 Receptor location > flow time multiplied by the flow velocity adjusted
for retardation
0 Decaying constituent (radioactive, biological or chemical)
0 Long "tail" of plume following source reduction may be important
* One or more conditions from a category m y determine if a high or low assumption of solute spreading is conservative. Most real problems will have a combination of characteristics that should be used to select bounding coefficients.

Range of u Valuer Calculated from Bx,rting Field-Measured Dirpcrsivity
Percentile
2
5
10
15
20
25
30
40
50
60
70
75
80
85
90
95
98
CI (Max. Spread)
0.03
0.04
0.07
0.10
0.15
0.17
0.20
0.30
0.40
0.50
0.55
0.64
0.70
0.85
1.05
1.60
2.40
Q (Min. Spread)
2.40
1.60
1.05
0.85
0.70
0.64
0.55
0.50
0.40
0.30
0.20
0.17
0.15
0.10
0.07
0.04
0.03
10,000
1,000
100 E
0.10
0.01
A
. e a
0
@A 0
0 YY
A A
. I Tracer Contam Envir I - * . a
e e Media 1 I 1 1
rl
Test Events Tracers A D Fractured
Media Porous 0 A
1 10 100 1000 Scale, rn
10,000 100,000
Figure 1. Me88urcd longitudiaal d ispcrr iv i ty as 8 fuuctiou of scale for saturated system (from Gclhar et al., 1985).

0.20
0.18
- 0.16
f 0.14
.$ - P
r‘ p: 0.12 t g 0.10
0.02
0.00
1 1 1 1
0.1 0.2 0.3 0.4 0.5 0.6 u (Variance in Flow Rate Distribution)
Figure 2. Calculated dirpersivitp distance multiplier values (6) as a function of assumed variance descriptor (u).
1 .o
0.8
0.6
0.4
0.2
0.0
I 3 I / - Calculated concentration
based on variance in flow rate distribution - - - Calculated concentration based on typical dispersion equation
1 I I
0 1 2 3 4 5 Time (yrs)
Figure 3. Comparison of alternate models for receptor locations c loser than the reference location.

8
Qo N
0
al & 0 8
e e Lc 1 00 .d a

0.0
0.00
10,000
10
1
1~~~~ 0.1
10,000
1,000
100
10
0.1
10
- -
-
-
1 -
-
-
1 1 1 I I i
0
1
0.01
-1 0.1 1 10 100 1,000 10,000
1
0.1
Scale, m
m I
a +. m r I I I I I
0.1 1 10 1 00 1,000 10,000 Scale, m
Figure 5 . Graphs of: a) longitudinal di8per8iVity (u) and b. variance descriptor (a) as a function of scale. d irpcrs iv i ty graph are the calculated diapersivity sca le e f f e c t baaed on a range of a valuer.
The lines on the

10
1
0.1
0.01
I I I I I I I I 1 I I I I I I 1
I I I I I I I I I I I I 1 I I I I 0.2 1 5 10 15 20 30 40 50 60 70 ' 80 85 90 95 99 99.8
Percent of Values Less Than
Figure 6. Probability plot showing the log-normal distribution of variance descriptor valuer (a) calculated from the literature.