Embed Size (px)
Citation preview

7/28/2019 DP96-7
http://slidepdf.com/reader/full/dp96-7 1/21
TRAVEL AND PARKING BEHAVIOR IN THE UNITED STATES
GERARD C.S. MILDNER, JAMES G. STRATHMAN,
and MARTHA J. BIANCO
ABSTRACT
This paper looks at the connection between the regulation of parking by cities, transit service
levels, and travel and parking behavior in the United States. Travel behavior information comes
from the 1990 Nationwide Personal Transportation Survey (NPTS) and the Federal Urban Mass
Transportation Administration’s 1990 Section 15 Report. Data on the current state of parking
programs in place in central business districts of the U.S. is identifed through telephone interviews
of local officials responsible for parking policies from the twenty cities identified in the NPTS.
The travel behavior analyses and the data from the parking officials interviews were combined with
data from the Federal Highway Administration’s Journey-to-Work data to group cities according to
their parking policies, transit service, and ridership levels on a continuum of “Transit-
Accommodating Cities” and “Auto-Accomodating Cities”. A key finding is that cities with
interventionist parking policies, high parking prices and limited supply, frequent transit service,
and a high probability that travelers will pay to park are the most likely to have high transit
ridership figures.
ANALYSIS OF COMMUTING BEHAVIOR AND PARKING
IntroductionTransportation economists have long noted the connection between high levels of
automobile usage and the failure to charge auto users the appropriate cost for driving. A particular
concern has been the subsidy received by drivers whose cost of parking is paid by their employer
or by local retailers (1). This paper look at new local policies implemented to restrict the

7/28/2019 DP96-7
http://slidepdf.com/reader/full/dp96-7 2/21
availability of parking and to boost the use of transit facilities. These policies are assessed in terms
of their effect on reducing transit ridership.
Two studies were conducted to assess the current state of worktrip travel behavior, transit
service, parking policies, and other factors across the U.S. The first of these used data from the
1990 Nationwide Personal Transportation Survey (2) augmented by the Federal Urban Mass
Transportation Administration’s (UMTA) Section 15 data (3) and congestion estimates calculated
by the Texas Transportation Institute (4) The second study surveyed officials across the U.S.
regarding the parking policies currently in place. Results from these two studies were combined,
along with data from the Federal Highway Administration’s Journey-to-Work trends in order to
group cities and compare their parking policies, based on transit ridership and transit service (5).
The Nationwide Personal Transportation Survey (NPTS)
Twenty metropolitan areas were examined using data from the 1990 Nationwide Personal
Transportation Survey (NPTS). The NPTS is the only source of information on travel for all
purposes in the U.S. The 1990 survey recovered information on personal trip-making over a 24-
hour period for a sample of approximately 22,000 households and 50,000 individuals. The NPTS
data on individual behavior was supplemented with areawide transit service data from the UMTA’s
Section 15 Report.
Some of the salient characteristics of this data are shown in Table 1, which lists worktrip
characteristics for the twenty metropolitan areas. The first data column in the table reports the
number of observations for each Consolidated Metropolitan Statistical Area (CMSA). More than
half of the CMSAs have fewer than 100 observations, indicating that the NPTS data does not likely
portray conditions in any given metropolitan area very precisely. Overall, however, the NPTSshould be representative of U.S. metropolitan commuting activity.
The mode chosen for 75 percent of commutes in the NPTS sample is single occupant
vehicle (SOV), while carpools and transit account for 13 and 8 percent, respectively, and other
modes (mainly walking) make up the remainder. Over 40 percent of the sample respondents
7/28/2019 DP96-7
http://slidepdf.com/reader/full/dp96-7 3/21
reported that they lived within 1/4 mile of transit service. Only 5 percent of auto commuters
reported that they paid for parking at work.
There is an average of 1.7 hours of revenue-producing transit service per year for each
resident. Service in older, more densely developed eastern metropolitan areas (the “rustbelt”) is
higher, while service in the more recently developing southern and western metropolitan areas (the
“sunbelt”) is generally lower. But there are exceptions to this pattern. For example, San Francisco
and Portland offer high levels of transit service in relation to other western metropolises, while
Detroit and Providence provide comparatively less than their regional counterparts. Even ignoring
the polar cases of New York and Providence, the range of transit service provided in these CMSAs
is noteworthy. San Francisco’s 2.13 revenue hours per capita is more than three times the .67
hours provided in Detroit.
SURVEY OF PARKING POLICIES
The primary cities of the twenty metropolitan were also surveyed about their parking
policies. Telephone interviews were conducted of city, county, regional, and state officials, in the
planning, transportation, and public facilities departments. The typical respondent was a city
planner or a manager of a municipal parking authority.
The survey focused on the Central Business District (CBD) of these central cities. The
geographic definition of each city’s CBD was largely adopted as suggested by the local officials.
Interviews were adapted to the circumstance, but the interview focused on four key areas: one,
parking regulation, especially zoning requirements and parking taxation; two, publicly owned CBD
parking facilities; three, parking meters; and four, neighborhood parking permit programs.
Parking Regulations
Zoning. Some cities use zoning to regulate parking by mandating a minimum number of
parking spaces for a given floor area for each possible use of the property. These requirements are
usually expressed as the number of parking spaces required per 1,000 feet of floor area. The most

7/28/2019 DP96-7
http://slidepdf.com/reader/full/dp96-7 4/21
striking finding is that minimum parking requirements for office development, which are so
prevalent in suburban areas of the U.S., are uncommon in large U.S. downtowns. Instead, the
amount of parking being developed appears to be determined primarily by the need of tenants and
their clients and not by minimum parking regulations. And in several examples, the city is
rationing the amount of space that can be allocated for parking by using maximum ratios or caps on
the total amount of downtown parking (e.g., Portland).
Stand-Alone Parking. The survey also examined whether cities are restricting private-
sector parking garages in the downtown area. Eleven of the twenty cities have some sort of
restriction on the development of surface parking lots or stand-alone parking garages, whether in
the form of locational restrictions, design restrictions, or review processes.
Taxes. A third way cities regulate parking is through taxation. Taxes are imposed on
parking revenue in ten of the twenty surveyed cities. For about half of those ten, the parking tax is
merely an application of the ordinary county or state sales tax that is applied to consumer goods.
None of these taxes is levied on drivers in instances where the parking is provided free by the
landowner, and no city attempts to tax the portion of office lease payments that secures parking
spaces for tenants. As long as the office lease and the parking lease are bundled, as they often are,
the parking tax does not apply.
Publicly Owned CBD Parking Facilities
Information on the amount of municipally held spaces was usually obtained from the
department managing those facilities. The category of publicly owned parking does not include
spaces held by state or federal agencies, many of which rent privately owned office space that
contains accessory parking.Most cities own a minimal share of the downtown off-street parking supply. Provision of
parking is seen by most city officials, especially in large cities, as a role of the private real estate
sector. The cities in the ten larger metropolitan areas had smaller percentages of publicly owned
parking supplies than the cities in smaller metro areas (10.4 percent versus 17.9 percent). Cities

7/28/2019 DP96-7
http://slidepdf.com/reader/full/dp96-7 5/21
with large public parking supplies often have established a public parking authority that has some
independence of city hall to manage their supplies (Pittsburgh, Buffalo, Cincinnati, Miami). Often
these authorities also manage on-street parking and earn surpluses for the city’s general fund.
Officials in five of the seven cities where a large portion of downtown parking is publicly
held identified downtown commuters as the primary market served by the parking facilities. All
cities were found to own at least one parking facility, usually located adjacent to their city hall,
municipal building, or convention center, and invariably used by city employees and/or for event
parking. The rates charged for city employees are often highly discounted, while the management
of those facilities is often done on a contract basis by a private firm.
Parking Meters
All cities have parking meters in their CBD, although in two cases (Portland, Houston) the
CBD was the only place they had any metered spaces. Very few of the cities have any free parking
in their downtown areas, and some are aggressively expanding the areas where metering reigns.
In most cities hourly meter rates vary by location. Only two cities—Boston and Buffalo—
have a uniform hourly rate. In general, cities in large metropolitan areas have higher meter rates.
In the ten largest metro areas, meter rates have an average range of $0.45 to $1.40, while cities in
the ten smallest metro areas have meter rates in the $0.38-to-$0.97 range.
Neighborhood Parking Permit Programs
The problem of spillover parking in residential neighborhoods is often created when
parking prices in the CBD rise. Thirteen of the twenty cities surveyed had at least one
neighborhood parking permit program to address spillover parking. Of the remaining seven, twocities had been interested in neighborhood permit programs but faced a state constitutional
prohibition (New York, Buffalo), and two were in the smallest metro areas in the survey
(Providence, Hartford) and perhaps faced only minor spillover parking problems.

7/28/2019 DP96-7
http://slidepdf.com/reader/full/dp96-7 6/21
Cities typically apply parking permit programs in five types of areas: residential
neighborhoods on the fringe of the CBD, streets surrounding transit stations, neighborhoods
surrounding stadiums and arenas, neighborhoods near hospitals and universities, and historic or
tourist-destination neighborhoods. No city reported applying this technique in the CBD itself,
where pricing via meters and time limits governs supply, and downtown residents who own a car
are assumed to have their own off-street space.
Most cities with parking permit programs consider a new parking management zone only
following a neighborhood request, often with explicit rules about the percentage of residents who
must sign a petition. A parking survey is usually done by the city’s traffic engineer. The
neighborhood is determined to be adversely impacted if the available on-street parking supply has a
low average vacancy rate (typically daytime use) and if a high percentage of the automobiles parked
in the neighborhood are licensed to owners who lived outside the neighborhood.
Most of the permit districts are large and allow the permit holder to park anywhere within
the district; permit prices do not exceed $35 per year. City officials often expressed a desire to
keep the districts sufficiently large so that excess resident demand for parking on certain streets can
spill over into other parts of the same district. Two exceptions to this pattern are Denver and
Chicago.
None of the districts faces the condition in which the number of permit holders exceeds the
number of available spaces. Therefore, permits are not rationed among residents but are available
for any registered automobile owner. Indeed, officials in cities that have areas with insufficient
parking supply for all potential car owners have decided to avoid instituting permit zones for this
very reason. Most of the permit zones allow visitors to park in these districts, either on a short-
term basis for shoppers or on an extended basis for out-of-town guests.

7/28/2019 DP96-7
http://slidepdf.com/reader/full/dp96-7 7/21
METROPOLITAN CLASSIFICATION
BASED ON TRAVEL DATA AND PARKING POLICIES
Introduction
Information from the NPTS and the telephone survey was supplemented with data from the
Federal Highway Administration’s Journey-to-Work Trends publication. The twenty metropolitan
areas were then categorized according to the three transit-related variables: transit share (Journey-
to-Work data), percentage of the respondents living within 1/4 mile of transit service (NPTS data),
and annual per capita transit revenue hours, as a proxy for transit frequency (UMTA Section 15
data). The cities were ranked based on these variables and grouped into three main categories:
transit-accommodating, transitional, and auto-accommodating (6).
Data for the categories is displayed in Tables 2 and 3. Note that while Table 2 presents
metropolitan area data, Table 3 consists primarily of central city data. Table 4 summarizes whether
the metropolitan areas, grouped according to transit service, implement the following five parking
programs:
. parking maximums are imposed in the CBD
. a parking tax of 10 percent or more is levied
. the maximum meter rate is equal to or greater than the overall mean of $1.18
. stand-along garages are not unconditionally allowed in the CBD
. residential permit programs are in place
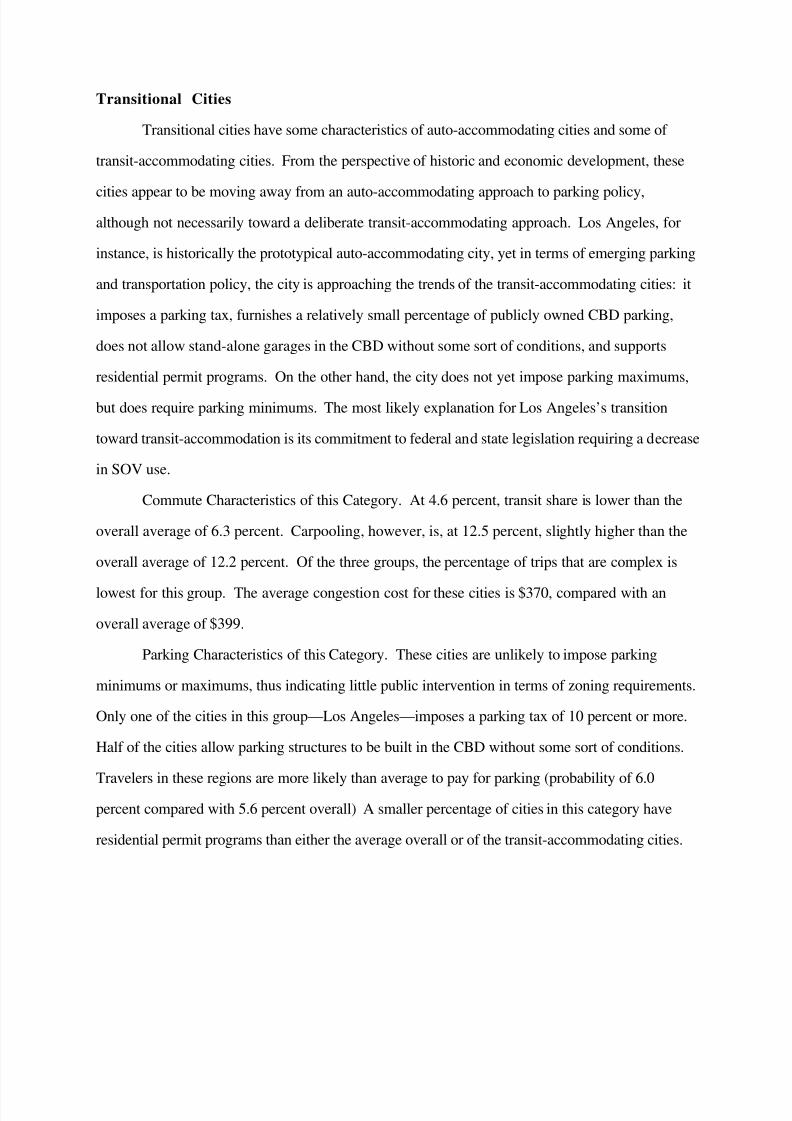
A discussion follows, with an emphasis on the parking policies that prevail in each
category. A relationship between extent of public intervention in parking, transit service, and
transit ridership does appear to exist. For example, cities with interventionist parking policies,
high parking prices and limited supply, frequent transit service, and a high probability that travelerswill pay to park are the most likely to have high transit ridership figures.

7/28/2019 DP96-7
http://slidepdf.com/reader/full/dp96-7 8/21
Transit-Accommodating Cities
Transit-accommodating central cities tend to have large and growing populations. All but
two of the eight cities in this category—Portland and Seattle—are rustbelt cities (7). With the
exception of Seattle, which has a dedicated bus tunnel, all of these cities also have established rail
transit systems.
Commute Characteristics of this Category. The percentage of SOV ridership—68.4
percent—is less for this group than for the entire sample (74 percent), with the percentage of transit
ridership (10.3) being greater than that of the rest of the twenty-city sample (6.3 percent). The
percentage of carpooling is slightly less than for the entire sample. A larger percentage of
respondents in this group are within 1/4 mile of transit access, and similarly, transit per capita
revenue hours are higher than the average for the sample. The average annual congestion costs for
travelers in these cities are higher than any other group and higher than for the sample on average.
This relatively high congestion cost may explain the higher-than-average transit-ridership figures.
Parking Characteristics of this Category. Only 25 percent of the central cities in this
category impose parking minimums, less than in the other two categories. Half, however, impose
maximums, whereas none of the cities in the other two categories do. Five of the eight cities
impose a parking tax of 15 percent or more. None of the cities in this category allow parking
structures to be built in the CBD without some sort of conditions.
Travelers in these cities are about as likely to pay to park as is the case with the sample
overall or with the other two groups. The maximum hourly meter rate is, at $1.49, relatively high
when compared with the overall average of $1.18. Finally, a lower share of the CBD off-street
parking is publicly owned than average—11 percent compared with the overall average of 14
percent. The comparative stringency of CBD parking is accompanied not only by relatively hightransit service and usage, but residential permit programs to control spillover.
7/28/2019 DP96-7
http://slidepdf.com/reader/full/dp96-7 9/21
Transitional Cities
Transitional cities have some characteristics of auto-accommodating cities and some of
transit-accommodating cities. From the perspective of historic and economic development, these
cities appear to be moving away from an auto-accommodating approach to parking policy,
although not necessarily toward a deliberate transit-accommodating approach. Los Angeles, for
instance, is historically the prototypical auto-accommodating city, yet in terms of emerging parking
and transportation policy, the city is approaching the trends of the transit-accommodating cities: it
imposes a parking tax, furnishes a relatively small percentage of publicly owned CBD parking,
does not allow stand-alone garages in the CBD without some sort of conditions, and supports
residential permit programs. On the other hand, the city does not yet impose parking maximums,
but does require parking minimums. The most likely explanation for Los Angeles’s transition
toward transit-accommodation is its commitment to federal and state legislation requiring a decrease
in SOV use.
Commute Characteristics of this Category. At 4.6 percent, transit share is lower than the
overall average of 6.3 percent. Carpooling, however, is, at 12.5 percent, slightly higher than the
overall average of 12.2 percent. Of the three groups, the percentage of trips that are complex is
lowest for this group. The average congestion cost for these cities is $370, compared with an
overall average of $399.
Parking Characteristics of this Category. These cities are unlikely to impose parking
minimums or maximums, thus indicating little public intervention in terms of zoning requirements.
Only one of the cities in this group—Los Angeles—imposes a parking tax of 10 percent or more.
Half of the cities allow parking structures to be built in the CBD without some sort of conditions.
Travelers in these regions are more likely than average to pay for parking (probability of 6.0percent compared with 5.6 percent overall) A smaller percentage of cities in this category have
residential permit programs than either the average overall or of the transit-accommodating cities.

7/28/2019 DP96-7
http://slidepdf.com/reader/full/dp96-7 10/21
Auto-Accommodating Cities
Two of these cities, Cincinnati and Detroit, have experienced population decline, while the
remaining four have remained fairly stable or have experienced significant growth due to
annexation.
Commute Characteristics of this Category. Transit share is very low in these cities—at an
average of 2.7 percent, while SOV and carpooling is more frequent than for the other two groups.
Although higher than the transitional cities, these cities have a smaller-than-average number of trips
that are classified as complex. This fact seems to contradict the low levels of transit ridership until
the very low levels of transit service are taken into consideration: only 27.6 percent of the
respondents are within 1/4 mile of transit access, and there are only .90 per capita revenue hours.
Parking Characteristics of this Category. Half of the cities in this group impose parking
minimums, but none impose maximums. Only two of the six cities have residential permit
programs. None of the cities has a parking tax greater than 10 percent. All of these cities allow the
construction of parking structures in the CBD without any sort of condition or review process.
Travelers in these cities are the least likely to pay to park, and the maximum hourly rate for meters
is very low—$0.83 compared with the overall average of $1.18.
Conclusions
Cities with both a relatively high degree of public intervention in parking policy and high
transit service levels—particularly in terms of frequency—are more likely to have high transit
ridership levels than cities with less public involvement in parking policy and a lower degree of
transit service.
Parking policies in transit-accommodating cities appear to be part of a larger transportation
policy that supports public transit. Such policies are more likely to be characterized by highermaximum parking rates, parking taxes of at least 15 percent, conditions imposed on the erection of
parking structures in the CBD, zoning requirements, and residential permit programs. These cities
are either larger, rustbelt cities or growing sunbelt cities on the Pacific coast. Rail or express bus
service is a feature of all of these cities.

7/28/2019 DP96-7
http://slidepdf.com/reader/full/dp96-7 11/21
Transitional cities have some of the characteristics of auto-accommodating cities, but appear
to be moving away from a transportation policy aimed primarily at accommodating the auto and
more toward transit-supportive policies or policies that are the least burdensome to the city budget.
Some of these cities impose conditions on the erection of parking structures in the CBD, zoning
requirements, and residential permit programs. Travelers in these cities are the most likely to pay
to park. These cities range from a small, declining rustbelt city such as Buffalo to a large,
expanding sunbelt city such as Los Angeles.
Parking policies in auto-accommodating cities are the most likely to be characterized by low
parking rates and little public involvement except, in half of the cases, to require parking
minimums. Travelers in these cities are the least likely to pay to park. These cities are either
expanding southern sunbelt cities or declining rustbelt cities or.
These findings indicate that transit ridership depends less on transit access than on transit
frequency and that the probability that travelers pay to park is positively correlated with transit
ridership, suggesting that public policies that support pricing of parking and improved transit
service, particularly in terms of frequency, are likely to be correlated with high levels of transit
ridership. In addition, the survey analysis reveals that such policies may work best in
combination. However, the fact that these policies are most successfully imposed in cities with
other important characteristics—population size, growth, age, etc.—should not be overlooked.

7/28/2019 DP96-7
http://slidepdf.com/reader/full/dp96-7 12/21
Table 1A:Selected Worktrip Commute Characteristicsin the 1990 NPTS-Section 15-TTI Sample
Travel Mode (%)
CMSA N SOV Carpool Mass Transit OtherBoston 97 72.2 11.3 6.2 10.3Buffalo 24 75.0 25.0 0.0 0.0Chicago 255 74.9 13.7 8.2 3.1Cincinnati 81 86.4 11.1 0.0 2.5Cleveland 91 81.3 12.1 3.3 3.3Dallas 138 84.8 14.5 0.7 0.0Denver 78 85.9 7.7 5.1 1.3Detroit 151 89.4 9.3 0.7 0.7Hartford 269 84.0 9.7 2.2 4.1Houston 132 89.4 7.6 1.5 1.5Los Angeles 447 77.9 16.3 2.7 3.1Miami 74 71.6 25.7 2.7 0.0Milwaukee 61 77.0 13.1 3.3 6.6
New York 1152 64.2 12.1 15.9 7.8Philadelphia 194 72.7 13.4 7.7 6.2Pittsburgh 79 67.1 22.8 5.1 5.1Portland 44 81.8 15.9 2.3 0.0Providence 27 74.1 11.1 7.4 7.4San Francisco 153 80.4 9.2 5.9 4.6Seattle 98 78.6 15.3 2.0 4.1
Overall 3 6 45 7 4 . 7 1 2 . 9 7 . 6 4 . 8
Source: Mode share estimated from the 1990 National Personal Transportation Survey

7/28/2019 DP96-7
http://slidepdf.com/reader/full/dp96-7 13/21
Table 1B:Selected Worktrip Commute Characteristicsin the 1990 NPTS-Section 15-TTI Sample
Transit Service
CMSA N % Pay toPark % Within1/4 Mile Annual RevenueHours Per Capita
Boston 97 6.6 46.4 1.45Buffalo 24 4.5 58.3 .99Chicago 255 4.1 47.1 1.81Cincinnati 81 5.2 32.1 .82Cleveland 91 7.2 30.8 1.10Dallas 138 6.1 30.4 .73Denver 78 5.8 53.8 1.07Detroit 151 4.9 21.2 .67Hartford 269 2.5 28.3 1.19Houston 132 6.6 25.8 .84Los Angeles 447 3.4 49.9 .92Miami 74 1.4 43.2 1.31
Milwaukee 61 13.7 26.2 1.51New York 1152 5.5 46.0 2.74Philadelphia 194 4.4 39.7 1.40Pittsburgh 79 7.6 36.7 1.96Portland 44 7.7 50.0 1.35Providence 27 4.8 37.0 .56San Francisco 153 4.6 60.1 2.13Seattle 98 5.7 53.1 1.31
Overall 3 6 45 5 . 0 4 2 . 3 1 . 7 1
Source: Parking data and transit access data estimated from 1990 National Personal Transportation Survey; transit
operation data from US Dept. of Transportation, 1990 UMTA Section 15 Report

7/28/2019 DP96-7
http://slidepdf.com/reader/full/dp96-7 14/21
TABLE 2A :Travel Characteristics for Metro Areas Grouped by Mean Transit Rank
Metropolitan AreaMean
TransitRank
TransitShare (%)
SOVShare (%)
CarpoolShare (%)
% Within1/4 MileTransit
Annual TransitRevenue Hours
Per Capita
Transit-Accommodating
San Francisco 2.33 9.3 68.8 13.0 60.1 2.13New York 3.67 27.8 52.3 10.3 46.0 2.74Boston 5.33 10.6 70.2 10.3 46.4 1.45Seattle 6.67 6.3 73.8 11.9 53.1 1.31Portland 6.67 5.4 74.1 12.3 50.0 1.35Chicago 6.67 4.8 67.5 12.0 47.1 1.81Philadelphia 7.00 10.2 69.2 12.2 39.7 1.40Pittsburgh 7.00 8.0 71.5 12.8 36.7 1.96Mean 5 . 6 7 1 0 . 3 6 8 . 4 1 1 . 8 4 7 . 4 1 . 7 7Transitional
Buffalo 8.67 4.7 77.1 11.2 58.3 0.99
Denver 10.00 4.3 75.2 12.4 53.8 1.07Milwaukee 10.33 4.9 77.3 10.9 26.2 1.51Miami 10.67 4.4 75.5 14.5 43.2 1.31Los Angeles 10.67 4.6 72.9 15.5 49.9 0.92Cleveland 13.00 4.6 79.6 10.3 30.8 1.10Mean 1 0 . 5 6 4 . 6 7 6 . 3 1 2 . 5 4 3 . 7 1 . 1 5Auto-Accommodating
Cincinnati 15.67 3.7 79.3 11.4 32.1 0.82Hartford 16.00 1.6 78.5 13.3 28.3 1.19Providence 16.33 2.6 78.6 12.3 37.0 0.56Houston 16.67 3.8 76.3 14.6 25.8 0.84Dallas 17.67 2.4 78.9 13.8 30.4 0.73Detroit 19.00 2.4 82.7 10.1 21.2 0.67
Mean 1 6 . 8 9 2 . 7 7 9 . 0 1 2 . 6 2 7 . 6 0 . 9 0Overall Mean 6 . 3 7 4 . 0 1 2 . 2 4 0 . 8 1 . 2 9
Sources: Mean transit rank is calculated from metropolitan area rankings for Transit Share, Percent within 1/4 Mile
Transit Access, and Annual Transit Revenue Hours Per Capita; mode share data from U.S. Department of Transportation, Federal Highway Administration, Journey-to-Work Trends in the United States and Its Major
Metropolitan Areas, 1960-1990; transit access estimated from Nationwide Personal Transportation Survey, 1990; and
transit operation data from U.S. Dept. of Transportation, Urban Mass Transportation Admin., Transit Profiles:
Agencies in Urbanized Areas Exceeding 200,000 Population. 1990 Section 15 Report (1990).

7/28/2019 DP96-7
http://slidepdf.com/reader/full/dp96-7 15/21
TABLE 2B:Travel Characteristics for Metro Areas Grouped by Mean Transit Rank
Metropolitan Area %ComplexTrips
Annual CongestionCost Per Traveler
1994 CentralCity Pop.
% Change inCentral CityPop. 1980-90
Rustbeltversus
Sunbelt
Transit-Accommodating
San Francisco 41.8 $760 734,676 6.6 rustbeltNew York 64.2 $390 7,333,253 3.5 rustbeltBoston 42.3 $495 547,725 2.0 rustbeltSeattle 39.8 $660 520,947 4.5 sunbeltPortland 31.8 $330 450,777 18.8 sunbeltChicago 38.4 $300 2,731,743 -7.4 rustbeltPhiladelphia 36.6 $270 1,524,249 -6.1 rustbeltPittsburgh 35.4 $270 358,883 -12.8 rustbeltMean 4 1 . 3 $434 1 , 775 , 28 2 1 . 1 3 75%
rustbeltTransitional
Buffalo 41.7 $380 312,965 -8.3 rustbeltDenver 33.3 $370 493,559 -5.1 sunbeltMilwaukee 27.9 $160 6,174,044 -1.3 rustbeltMiami 36.5 $520 373,024 3.4 sunbeltLos Angeles 39.6 $670 3,448,613 17.4 sunbeltCleveland 30.8 $120 492,901 -11.9 rustbeltMean 3 4 . 9 $37 0 956 , 351 - 0 .9 6 50%
rustbeltAuto-Accommodating
Cincinnati 24.0 $160 358,170 -5.5 rustbeltHartford 100.1 $220 124,196 2.5 rustbeltProvidence 10.0 $380 150,639 2.5 rustbeltHouston 51.0 $570 1,702,086 2.2 sunbelt
Dallas 66.0 $570 1,022,830 11.3 sunbeltDetroit 56.0 $380 992,038 -14.6 rustbeltMean 3 8 . 5 $36 8 724 , 993 - . 2 7 67%
rustbeltOverall Mean 4 2 . 3 $399 1 , 214 , 51 6 1 . 7 65%
rustbelt
Sources: The percent complex trip is estimated from the Nationwide Personal Transportation Survey, 1990;congestion cost data from Schrank, D.L., et al., Estimates of Urban Roadway Congestion - 1990. Research Report1131-5, Texas Transportation Institute, Texas A&M University (1993), 61 pp; population data from US Bureau of Census; rustbelt/sunbelt categorization is based on date of founding, incorporation, extent of preautomobiledevelopment (pre-1920), and early 19th century economic base.

7/28/2019 DP96-7
http://slidepdf.com/reader/full/dp96-7 16/21
TABLE 3A:Parking Characteristics for Cities Grouped by Mean Transit Rank
Central City Pay-to-Park Probability
Parking MinimumsImposed in CBD
Parking MaximumsImposed in CBD
Parking Taxexceeds 10%
Transit-Accommodating Cities
San Francisco 4.6 no yes yesNew York 5.5 no yes yesBoston 6.6 no no noSeattle 5.7 yes yes noPortland 7.7 no yes noChicago 4.1 yes no **yesPhiladelphia 4.4 no no yesPittsburgh 7.6 no no yesMean 5 . 7 25% yes 50% yes 63% yesTransitional Cities
Buffalo 4.5 no no noDenver 5.8 no no no
Milwaukee 13.7 no no noMiami 1.4 yes no noLos Angeles 3.4 yes no yesCleveland 7.2 no no noMean 6 . 0 33% yes 0% yes 17% yes
Auto-Accommodating Cities
Cincinnati 5.2 yes no noHartford 2.5 yes no noProvidence 4.8 no no noHouston 6.6 no no noDallas 6.1 yes no noDetroit 4.9 no no noMean 5 . 0 50% yes 0% yes 0% yes
Overall Mean 5 . 6 35% yes 20% yes 30% yes
Sources: Pay-to-park probability is etimated for each metropolitan areas from the Nationwide PersonalTransportation Survey, 1990; all other data from the twenty-city telephone survey.** Chicago imposes a flat $25-per-space monthly parking tax

7/28/2019 DP96-7
http://slidepdf.com/reader/full/dp96-7 17/21
TABLE 3BParking Characteristics for Cities Grouped by Mean Transit Rank
Central City %of CBDParking Public
Owned
% of Meters Locatedin CBD
MaximumMeter Rate
Stand-AloneParking GaragesUnconditionallyAllowed in CBD
ResidentialPermit
Programs
Transit-Accommodating Cities
San Francisco 15 34 $1.50 no yesNew York 1 26 $1.50 no noBoston 7 85 $1.00 no yesSeattle 3 74 $1.00 no yesPortland 10 100 $0.90 no yesChicago 1 26 $3.00 no yesPhiladelphia 9 40 $1.00 no yesPittsburgh 41 8 $2.00 no yesMean 1 1 4 9 $ 1 . 4 9 100% no 88% yesTransitional Cities
Buffalo 52 48 $1.00 no noDenver 10 67 $1.00 no yesMilwaukee 12 45 $1.00 no yesMiami 28 12 $1.00 yes noLos Angeles 6 16 $2.00 yes yesCleveland 7 95 $0.75 yes yesMean 1 9 4 7 $ 1 . 1 3 50% no 67% yesAuto-Accommodating Cities
Cincinnati 24 33 $0.50Hartford 19 24 $0.75Providence 1 97 $0.75Houston 8 100 $1.00Dallas 8 58 $1.00
Detroit 21 35 $1.00Mean 1 4 5 8 $ 0 . 8 3Overall Mean 1 4 5 1 $ 1 . 1 8
Source: Twenty-city telephone survey.

7/28/2019 DP96-7
http://slidepdf.com/reader/full/dp96-7 18/21
TABLE 4Transit Service Rank and Parking Policies
Metropolitan AreaMean Transit Rank Transit Share (%)
Transit-Accommodating
San Francisco 2.33 5New York 3.67 4Boston 5.33 2Seattle 6.67 3Portland 6.67 3Chicago 6.67 4Philadelphia 7.00 3Pittsburgh 7.00 3Mean 5 . 6 7 3 . 3 8Transitional
Buffalo 8.67 1Denver 10.00 2
Milwaukee 10.33 2Miami 10.67 0Los Angeles 10.67 3Cleveland 13.00 1Mean 1 0 . 5 6 1 . 5 0
Auto-Accommodating
Cincinnati 15.67 0Hartford 16.00 0Providence 16.33 0Houston 16.67 0Dallas 17.67 1Detroit 19.00 1Mean 1 6 . 8 9 0 . 3 3
Source: See Table 2A and explanation in the text.

7/28/2019 DP96-7
http://slidepdf.com/reader/full/dp96-7 19/21
C i t i e s P
l o t t e d b y P a r k i n g P o l i c y a n d T r
a n s i t S e r v i c e R a n k
1 3 5 7 9 1 1
1 3
1 5
1 7
1 9
0
1
2
3
4
5
N
u m b e r o f P a r k i n g M a n a g e m e n t P r o
g r a m s
T r a n s i t S e r v i c e R a n k
S a n F r a n c i s c o
N e w
Y o r k
C h i c a g o
S e a t t l e ,
P o r t l a n d
P h i l a d e l p h i a ,
P i t t s b u r g h
L o s A n g e l e s
B o s t o n
D e n v e r
M i l w a u k e e
B u f f a l o
M i a m i
C l e v e l a n d
D a l l a s
D e t r o i t
C i n c i n n a t i
H a r t f o r d
P r o v i d e n c e
H o u s t o n

7/28/2019 DP96-7
http://slidepdf.com/reader/full/dp96-7 20/21
ENDNOTES
1. For example, see MacKenzie, J.J., et al., The Going Rate: What it Really Costs to Drive.
World Resources Institute (1992), Willson, R.W., “Suburban Parking: Economics and
Policy,” DOT-T-93-05, US Department of Transportation (1993), or Zupan, J.M.,
“Transportation Demand Management: A Cautious Look: Transportation Research Record, No.
1346 (1992).
2. Vincent, M.J., Keyes, M.A., and Reed, M., NPTS Urban Travel Patterns: 1990 Nationwide
Personal Transportation Survey. U.S. Department of Transportation, Federal Highway
Administration, Office of Highway Information Management (1994) pages vary.
3. U.S. Department of Transportation, Urban Mass Transportation Administration, Transit
Profiles: Agencies in Urbanized Areas Exceeding 200,000 Population. 1990 Section 15 Report
(1990) pages vary.
4. Schrank, D.L., Turner, S.M., and Lomax, T.J., Estimates of Urban Roadway Congestion -
1990. Research Report 1131-5, Texas Transportation Institute, Texas A&M University
(1993), 61 pp.
5. U.S. Department of Transportation, Federal Highway Administration, Office of Highway
Information Management, Journey-to-Work Trends in the United States and its Major
Metropolitan Areas, 1960-1990 (1993) pages vary.
6. These categories are consistent with the three categories in Weant, R. A., and H. S. Levinson,
Parking, Eno Foundation for Transportation (1990). pp. 8-9.
7. Although geographically a sunbelt city, San Francisco is identified here as rustbelt due to its
early date of founding (1776), compact development, significant growth during thepreautomobile period prior to 1920, and early economic base (mining, rail, commerce, and
banking).

7/28/2019 DP96-7
http://slidepdf.com/reader/full/dp96-7 21/21
Biographical Sketch
GERARD C.S. MILDNER is Assistant Professor of Urban Studies and Planning at Portland State
University. Dr. Mildner received his Ph.D. in Economics from New York University.
JAMES G. STRATHMAN is Professor of Urban Studies and Planning and Associate Director of
the Center for Urban Studies at Portland State University. Dr. Strathman received his Ph.D. in
Geography from University of Iowa.
MARTHA J. BIANCO is Assistant Director of the Center for Urban Studies at Portland State
University. Dr. Bianco received her Ph.D. in Urban Studies from Portland State University.


![December 21, 2015 - Wisconsin Supreme Court · RB-1 (2015) [?\^]`_ acbedgfhbeij[ ahik[ l 1. mon#p qsrHt`rvuxwnzye{E|}ux~)r 'p n#w )rv|}ux~x 7 7 7 7 7 7 7 7 7 7 7 7 7 7 7 7 7 7 7 7](https://img.pdfslide.net/doc/110x75/5fb3422fccf05f68ab3a22e4/december-21-2015-wisconsin-supreme-court-rb-1-2015-acbedgfhbeij-ahik.jpg)