Embed Size (px)
Citation preview
GT-SUITE North American User's Conference, Dearborn, MI
November 15, 2005
DPF Modeling Using GT-POWER / Schernus, Wiartalla, Tomazic 1
1GT-SUITE North American User’s Conference The Dearborn Inn, Dearborn, MI, November 15, 2005
© by FEV / GUC-2005-USA_FEV_DPF-Modeling.ppt / Schernus, Tomazic
DPF Modeling Using GT-Power
GT-Suite User’s ConferenceDearborn, November 15, 2005
Christof Schernus and Andreas WiartallaFEV Motorentechnik GmbH, Aachen, Germany
andDean Tomazic
FEV Engine Technology, Inc., Auburn Hills, Michigan
GT-SUITE North American User's Conference, Dearborn, MI
November 15, 2005
DPF Modeling Using GT-POWER / Schernus, Wiartalla, Tomazic 2
2GT-SUITE North American User’s Conference The Dearborn Inn, Dearborn, MI, November 15, 2005
© by FEV / GUC-2005-USA_FEV_DPF-Modeling.ppt / Schernus, Tomazic
Agenda1. Introduction2. DPF Structures3. DPF Function4. GT-Power Model for DPF Flow Resistance5. Summary and Conclusions6. References
GT-SUITE North American User's Conference, Dearborn, MI
November 15, 2005
DPF Modeling Using GT-POWER / Schernus, Wiartalla, Tomazic 3
3GT-SUITE North American User’s Conference The Dearborn Inn, Dearborn, MI, November 15, 2005
© by FEV / GUC-2005-USA_FEV_DPF-Modeling.ppt / Schernus, Tomazic
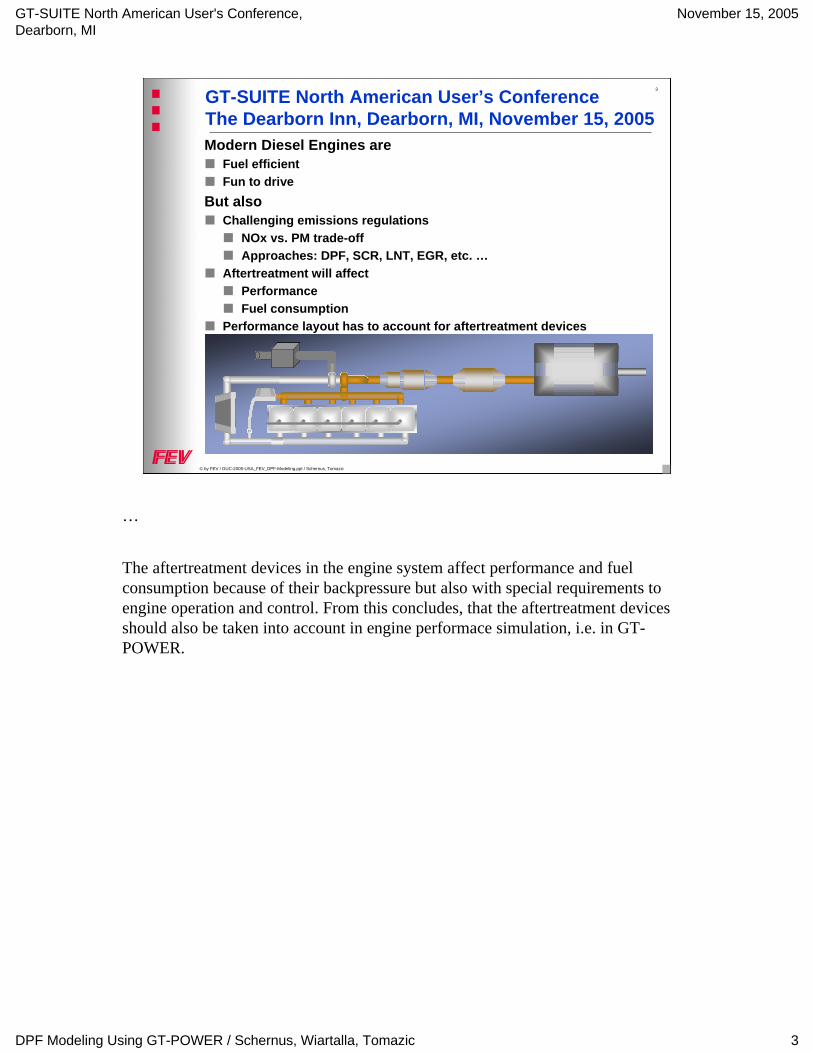
Modern Diesel Engines areFuel efficientFun to drive
But alsoChallenging emissions regulations
NOx vs. PM trade-offApproaches: DPF, SCR, LNT, EGR, etc. …
Aftertreatment will affectPerformanceFuel consumption
Performance layout has to account for aftertreatment devices
…
The aftertreatment devices in the engine system affect performance and fuel consumption because of their backpressure but also with special requirements to engine operation and control. From this concludes, that the aftertreatment devices should also be taken into account in engine performace simulation, i.e. in GT-POWER.
GT-SUITE North American User's Conference, Dearborn, MI
November 15, 2005
DPF Modeling Using GT-POWER / Schernus, Wiartalla, Tomazic 4
4GT-SUITE North American User’s Conference The Dearborn Inn, Dearborn, MI, November 15, 2005
© by FEV / GUC-2005-USA_FEV_DPF-Modeling.ppt / Schernus, Tomazic
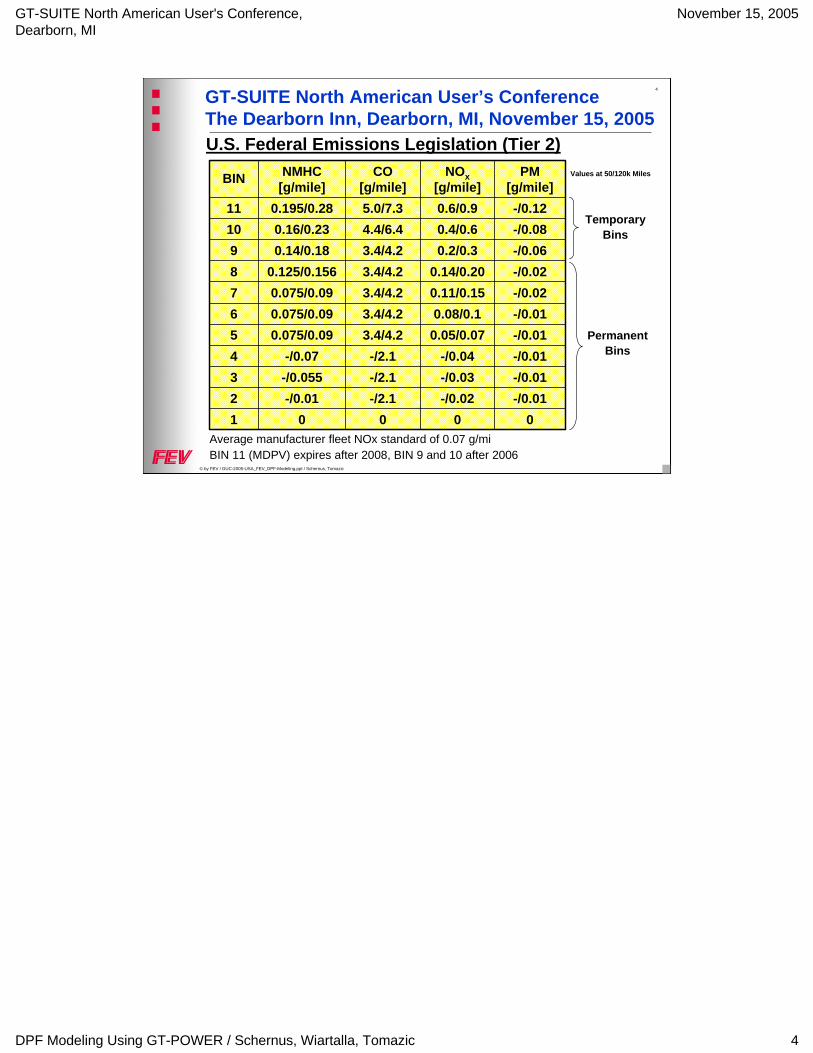
00001-/0.01-/0.02-/2.1-/0.012-/0.01-/0.03-/2.1-/0.0553-/0.01-/0.04-/2.1-/0.074-/0.010.05/0.073.4/4.20.075/0.095-/0.010.08/0.13.4/4.20.075/0.096-/0.020.11/0.153.4/4.20.075/0.097-/0.020.14/0.203.4/4.20.125/0.1568-/0.060.2/0.33.4/4.20.14/0.189-/0.080.4/0.64.4/6.40.16/0.2310-/0.120.6/0.95.0/7.30.195/0.2811
PM [g/mile]
NOx[g/mile]
CO [g/mile]
NMHC [g/mile]BIN Values at 50/120k Miles
U.S. Federal Emissions Legislation (Tier 2)
Average manufacturer fleet NOx standard of 0.07 g/miBIN 11 (MDPV) expires after 2008, BIN 9 and 10 after 2006
TemporaryBins
PermanentBins
GT-SUITE North American User's Conference, Dearborn, MI
November 15, 2005
DPF Modeling Using GT-POWER / Schernus, Wiartalla, Tomazic 5
5GT-SUITE North American User’s Conference The Dearborn Inn, Dearborn, MI, November 15, 2005
© by FEV / GUC-2005-USA_FEV_DPF-Modeling.ppt / Schernus, Tomazic
PM poses significant challenges for Diesel engine certificationLight-DutyHeavy-DutyOn-/Off-Highway
Application of DPF is a prerequisite for EU5 and US07European conurbations faced several violations of the new air PMconcentration limits during winter/spring 2005. Cities consider to temporarily ban diesel vehicles w/o DPF from urban areas, when similar weather and air pollution situations arise in future.Although Diesel cars w/o a DPF may comply to EU4 emission limits, they may suddenly not be useable in urban areas. This has created great customer request for new cars with DPF and also for aftermarket solutions for retrofitting.
Introduction
From the previous table we can see, particulate matter poses significant challenges for Diesel car certification, no matter if light-duty, heavy duty, On- or Off-Highway application.A DPF is a prerequisite for complying with future emission regulations such as Euro 5 and US07.Europe currently has a special situation: In winter/spring 2005, several European conurbations exceeded the air PM concentration limits for more than the legal 35 days, followed by lawsuits. As a countermeasure, cities consider to ban Diesel vehicles w/o a DPF from urban areas in future, when similar weather and pollution situations arise.The nightmare for a diesel vehicle owner is to find himself surprisingly prohibited from driving downtown, although his car complies with the ambitious Euro 4 limits. This scenario has created great customer request for new cars with DPF and also for retrofitting aftermarket solutions.Actually, new Diesel cars without soot filter are hard to sell in Germany. And the DPF seems to be the key element to gain market acceptance for diesel cars in the USA.
GT-SUITE North American User's Conference, Dearborn, MI
November 15, 2005
DPF Modeling Using GT-POWER / Schernus, Wiartalla, Tomazic 6
6GT-SUITE North American User’s Conference The Dearborn Inn, Dearborn, MI, November 15, 2005
© by FEV / GUC-2005-USA_FEV_DPF-Modeling.ppt / Schernus, Tomazic
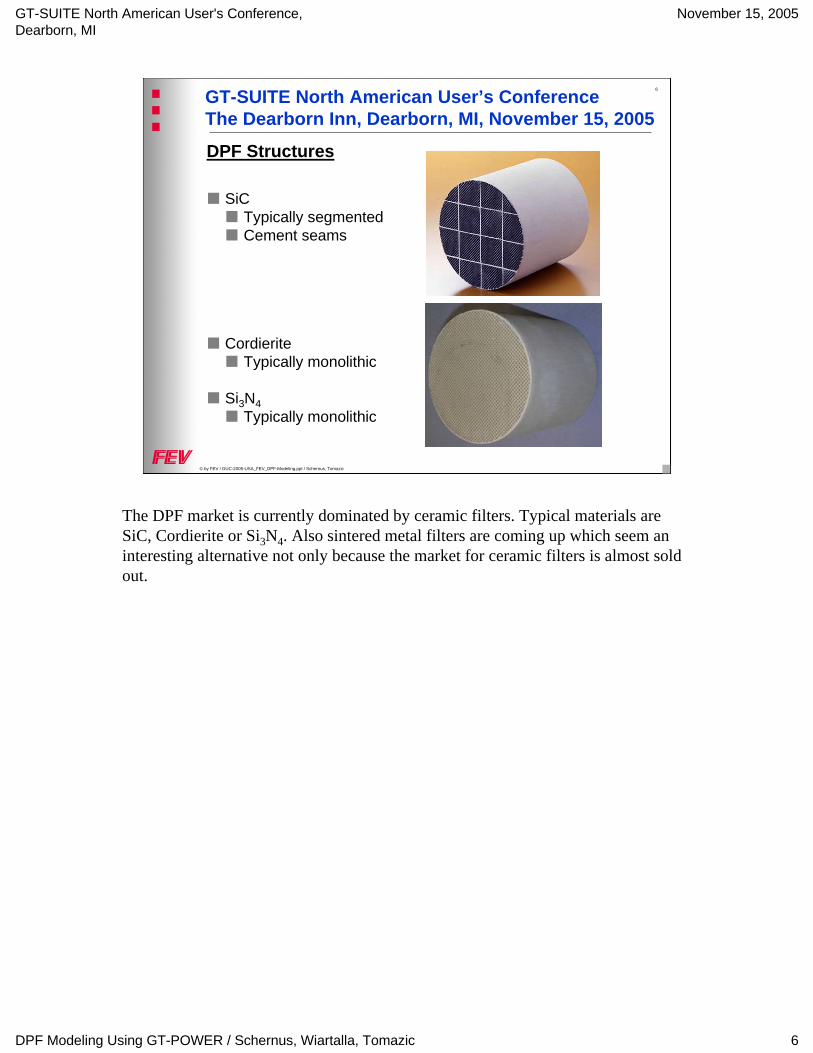
DPF Structures
SiCTypically segmentedCement seams
CordieriteTypically monolithic
Si3N4Typically monolithic
The DPF market is currently dominated by ceramic filters. Typical materials are SiC, Cordierite or Si3N4. Also sintered metal filters are coming up which seem an interesting alternative not only because the market for ceramic filters is almost sold out.
GT-SUITE North American User's Conference, Dearborn, MI
November 15, 2005
DPF Modeling Using GT-POWER / Schernus, Wiartalla, Tomazic 7
7GT-SUITE North American User’s Conference The Dearborn Inn, Dearborn, MI, November 15, 2005
© by FEV / GUC-2005-USA_FEV_DPF-Modeling.ppt / Schernus, Tomazic
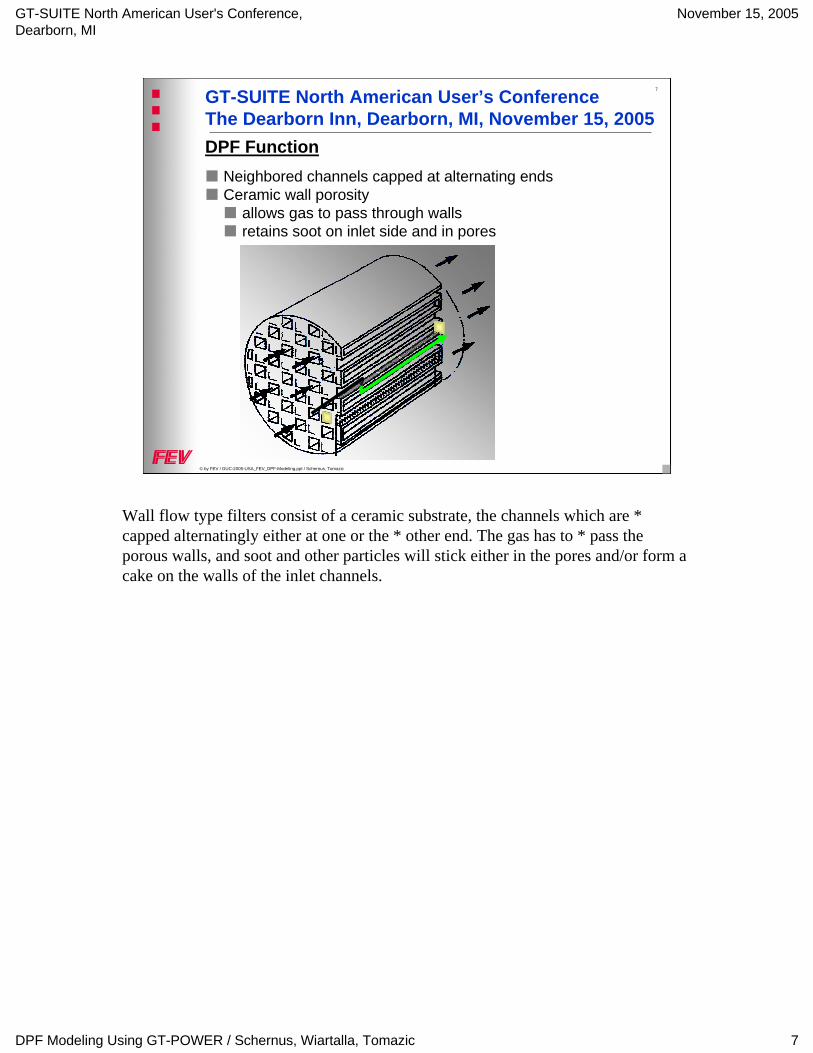
DPF FunctionNeighbored channels capped at alternating endsCeramic wall porosity
allows gas to pass through wallsretains soot on inlet side and in pores
Wall flow type filters consist of a ceramic substrate, the channels which are * capped alternatingly either at one or the * other end. The gas has to * pass the porous walls, and soot and other particles will stick either in the pores and/or form a cake on the walls of the inlet channels.
GT-SUITE North American User's Conference, Dearborn, MI
November 15, 2005
DPF Modeling Using GT-POWER / Schernus, Wiartalla, Tomazic 8
8GT-SUITE North American User’s Conference The Dearborn Inn, Dearborn, MI, November 15, 2005
© by FEV / GUC-2005-USA_FEV_DPF-Modeling.ppt / Schernus, Tomazic
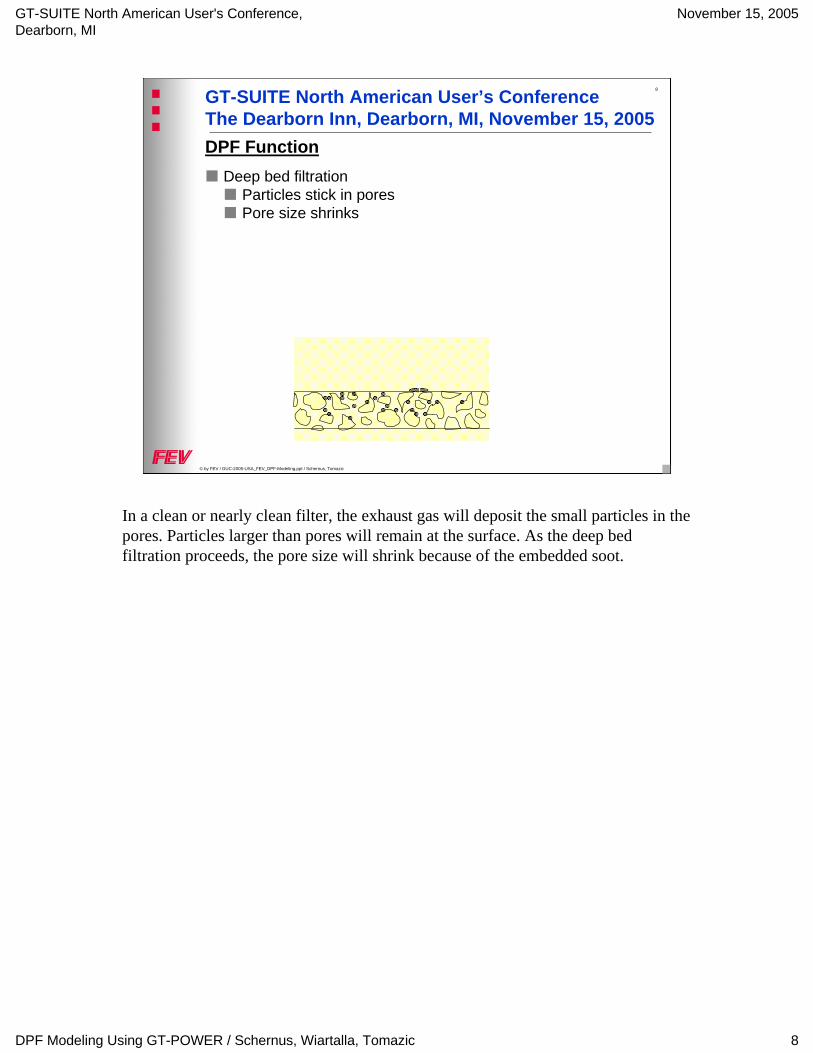
DPF FunctionDeep bed filtration
Particles stick in poresPore size shrinks
In a clean or nearly clean filter, the exhaust gas will deposit the small particles in the pores. Particles larger than pores will remain at the surface. As the deep bed filtration proceeds, the pore size will shrink because of the embedded soot.
GT-SUITE North American User's Conference, Dearborn, MI
November 15, 2005
DPF Modeling Using GT-POWER / Schernus, Wiartalla, Tomazic 9
9GT-SUITE North American User’s Conference The Dearborn Inn, Dearborn, MI, November 15, 2005
© by FEV / GUC-2005-USA_FEV_DPF-Modeling.ppt / Schernus, Tomazic
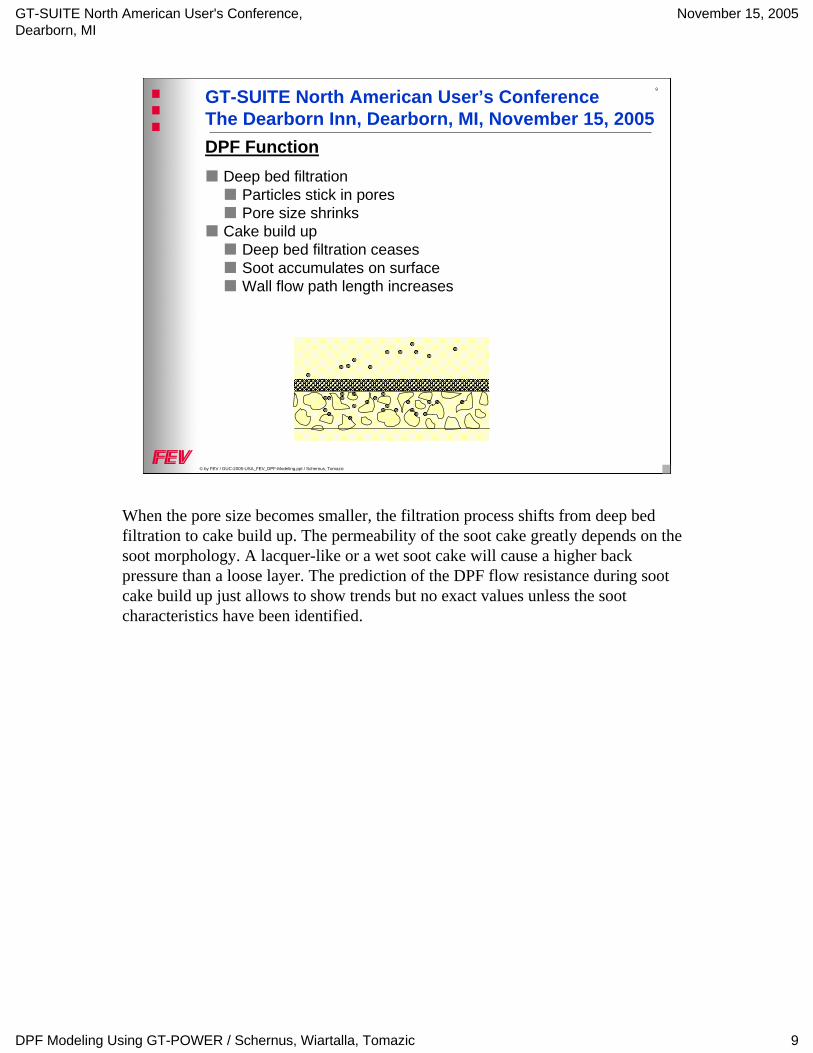
DPF FunctionDeep bed filtration
Particles stick in poresPore size shrinks
Cake build upDeep bed filtration ceasesSoot accumulates on surfaceWall flow path length increases
When the pore size becomes smaller, the filtration process shifts from deep bed filtration to cake build up. The permeability of the soot cake greatly depends on the soot morphology. A lacquer-like or a wet soot cake will cause a higher back pressure than a loose layer. The prediction of the DPF flow resistance during soot cake build up just allows to show trends but no exact values unless the soot characteristics have been identified.
GT-SUITE North American User's Conference, Dearborn, MI
November 15, 2005
DPF Modeling Using GT-POWER / Schernus, Wiartalla, Tomazic 10
10GT-SUITE North American User’s Conference The Dearborn Inn, Dearborn, MI, November 15, 2005
© by FEV / GUC-2005-USA_FEV_DPF-Modeling.ppt / Schernus, Tomazic
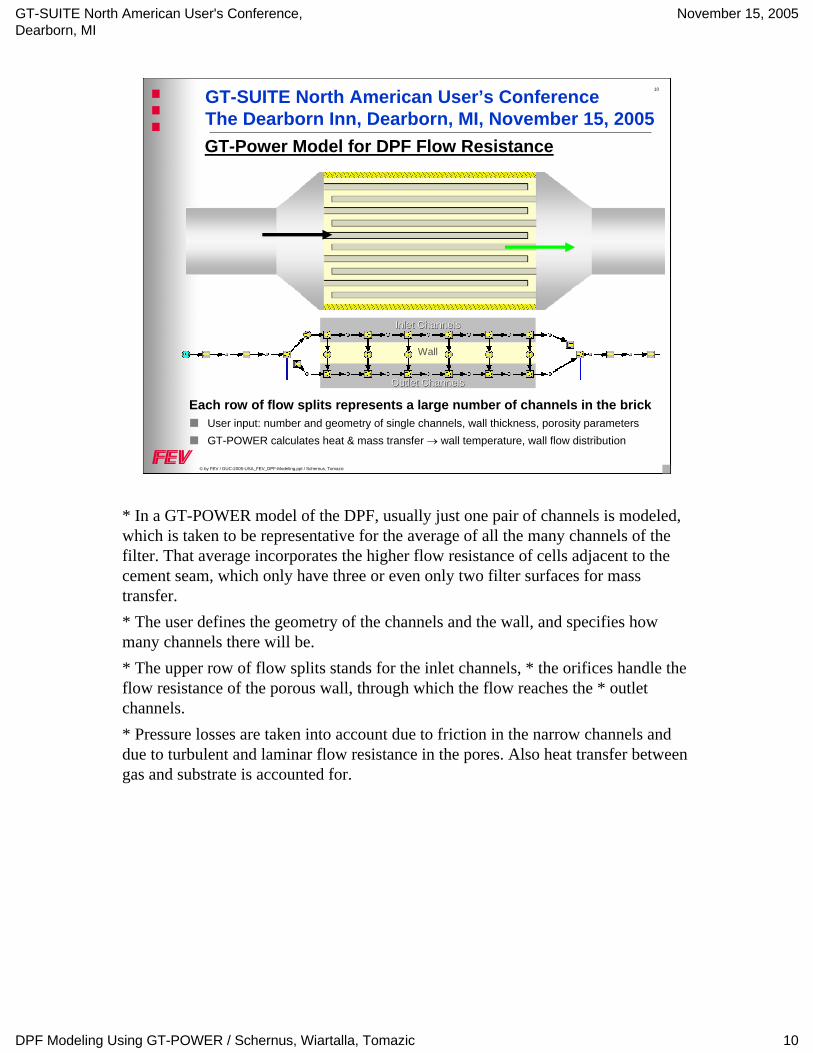
GT-Power Model for DPF Flow Resistance
Inlet ChannelsInlet Channels
Each row of flow splits represents a large number of channels in the brickUser input: number and geometry of single channels, wall thickness, porosity parametersGT-POWER calculates heat & mass transfer → wall temperature, wall flow distribution
Outlet ChannelsOutlet Channels
Wall
* In a GT-POWER model of the DPF, usually just one pair of channels is modeled, which is taken to be representative for the average of all the many channels of the filter. That average incorporates the higher flow resistance of cells adjacent to the cement seam, which only have three or even only two filter surfaces for mass transfer.* The user defines the geometry of the channels and the wall, and specifies how many channels there will be.* The upper row of flow splits stands for the inlet channels, * the orifices handle the flow resistance of the porous wall, through which the flow reaches the * outlet channels. * Pressure losses are taken into account due to friction in the narrow channels and due to turbulent and laminar flow resistance in the pores. Also heat transfer between gas and substrate is accounted for.
GT-SUITE North American User's Conference, Dearborn, MI
November 15, 2005
DPF Modeling Using GT-POWER / Schernus, Wiartalla, Tomazic 11
11GT-SUITE North American User’s Conference The Dearborn Inn, Dearborn, MI, November 15, 2005
© by FEV / GUC-2005-USA_FEV_DPF-Modeling.ppt / Schernus, Tomazic
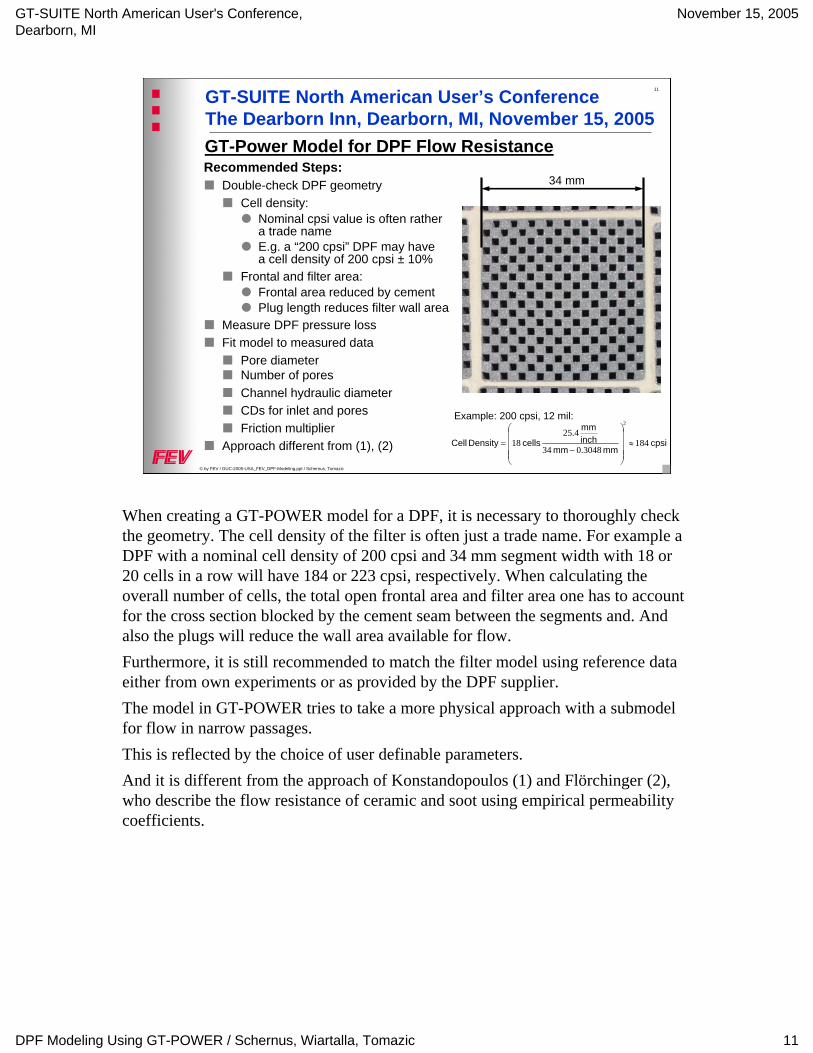
Recommended Steps:Double-check DPF geometry
Cell density:Nominal cpsi value is often rather a trade nameE.g. a “200 cpsi” DPF may have a cell density of 200 cpsi ± 10%
Frontal and filter area:Frontal area reduced by cementPlug length reduces filter wall area
Measure DPF pressure lossFit model to measured data
Pore diameterNumber of poresChannel hydraulic diameterCDs for inlet and poresFriction multiplier
Approach different from (1), (2)
34 mm
cpsi mm mm
inchmm
cells Density Cell 1843048.034
4.2518
2
≈⎟⎟⎟⎟
⎠
⎞
⎜⎜⎜⎜
⎝
⎛
−=
Example: 200 cpsi, 12 mil:
GT-Power Model for DPF Flow Resistance
When creating a GT-POWER model for a DPF, it is necessary to thoroughly check the geometry. The cell density of the filter is often just a trade name. For example a DPF with a nominal cell density of 200 cpsi and 34 mm segment width with 18 or 20 cells in a row will have 184 or 223 cpsi, respectively. When calculating the overall number of cells, the total open frontal area and filter area one has to account for the cross section blocked by the cement seam between the segments and. And also the plugs will reduce the wall area available for flow.Furthermore, it is still recommended to match the filter model using reference data either from own experiments or as provided by the DPF supplier.The model in GT-POWER tries to take a more physical approach with a submodelfor flow in narrow passages. This is reflected by the choice of user definable parameters. And it is different from the approach of Konstandopoulos (1) and Flörchinger (2), who describe the flow resistance of ceramic and soot using empirical permeability coefficients.
GT-SUITE North American User's Conference, Dearborn, MI
November 15, 2005
DPF Modeling Using GT-POWER / Schernus, Wiartalla, Tomazic 12
12GT-SUITE North American User’s Conference The Dearborn Inn, Dearborn, MI, November 15, 2005
© by FEV / GUC-2005-USA_FEV_DPF-Modeling.ppt / Schernus, Tomazic
GT-Power Model for DPF Flow Resistance
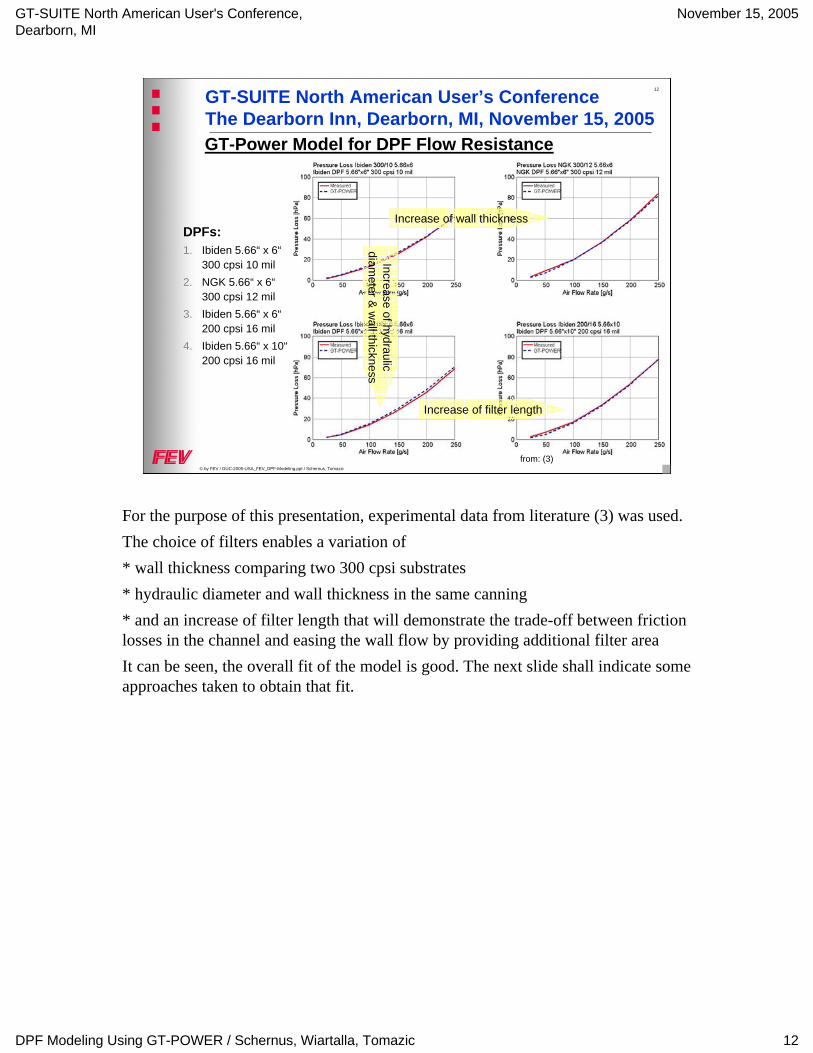
DPFs:1. Ibiden 5.66“ x 6“
300 cpsi 10 mil2. NGK 5.66“ x 6“
300 cpsi 12 mil3. Ibiden 5.66“ x 6“
200 cpsi 16 mil4. Ibiden 5.66“ x 10“
200 cpsi 16 mil
Increase of wall thickness
Increase of filter lengthIncrease of hydraulic
diameter &
wall thickness
from: (3)
For the purpose of this presentation, experimental data from literature (3) was used.The choice of filters enables a variation of* wall thickness comparing two 300 cpsi substrates* hydraulic diameter and wall thickness in the same canning* and an increase of filter length that will demonstrate the trade-off between friction losses in the channel and easing the wall flow by providing additional filter areaIt can be seen, the overall fit of the model is good. The next slide shall indicate some approaches taken to obtain that fit.
GT-SUITE North American User's Conference, Dearborn, MI
November 15, 2005
DPF Modeling Using GT-POWER / Schernus, Wiartalla, Tomazic 13
13GT-SUITE North American User’s Conference The Dearborn Inn, Dearborn, MI, November 15, 2005
© by FEV / GUC-2005-USA_FEV_DPF-Modeling.ppt / Schernus, Tomazic
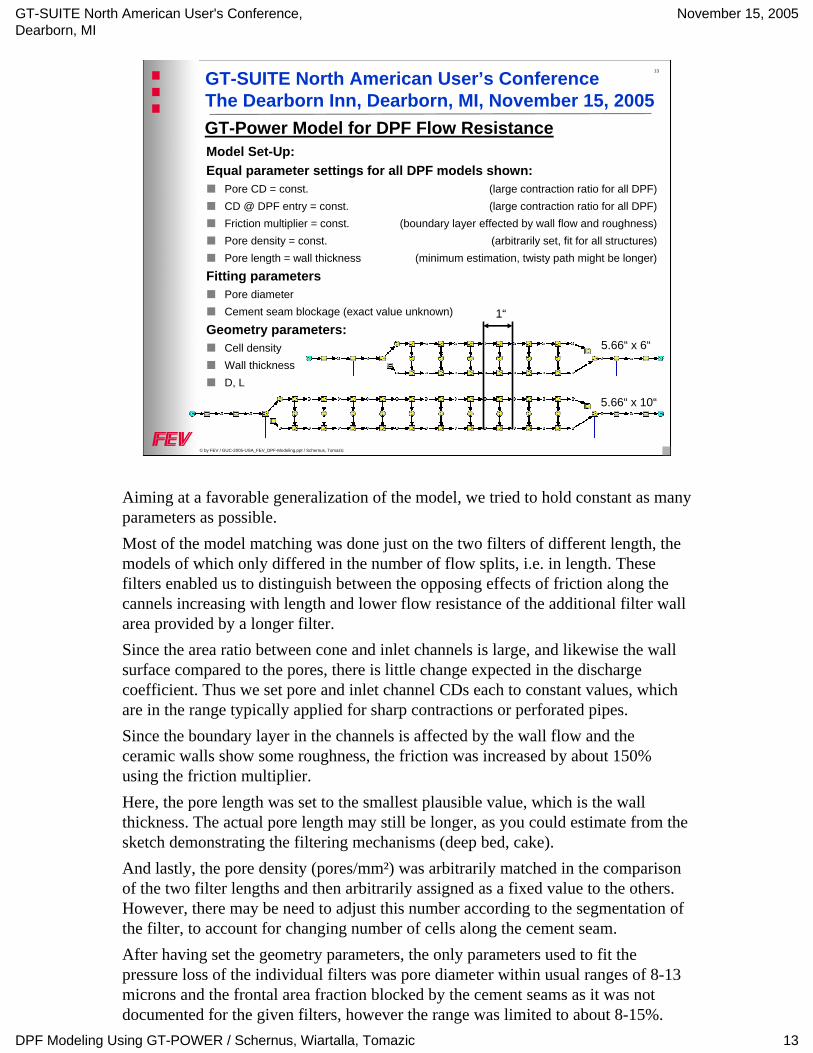
GT-Power Model for DPF Flow ResistanceModel Set-Up:Equal parameter settings for all DPF models shown:
Pore CD = const. (large contraction ratio for all DPF)CD @ DPF entry = const. (large contraction ratio for all DPF)Friction multiplier = const. (boundary layer effected by wall flow and roughness)Pore density = const. (arbitrarily set, fit for all structures)Pore length = wall thickness (minimum estimation, twisty path might be longer)
Fitting parametersPore diameterCement seam blockage (exact value unknown)
Geometry parameters:Cell densityWall thicknessD, L
5.66“ x 10“
1“
5.66“ x 6“
Aiming at a favorable generalization of the model, we tried to hold constant as manyparameters as possible.Most of the model matching was done just on the two filters of different length, the models of which only differed in the number of flow splits, i.e. in length. These filters enabled us to distinguish between the opposing effects of friction along the cannels increasing with length and lower flow resistance of the additional filter wall area provided by a longer filter.Since the area ratio between cone and inlet channels is large, and likewise the wall surface compared to the pores, there is little change expected in the discharge coefficient. Thus we set pore and inlet channel CDs each to constant values, which are in the range typically applied for sharp contractions or perforated pipes.Since the boundary layer in the channels is affected by the wall flow and the ceramic walls show some roughness, the friction was increased by about 150% using the friction multiplier.Here, the pore length was set to the smallest plausible value, which is the wall thickness. The actual pore length may still be longer, as you could estimate from the sketch demonstrating the filtering mechanisms (deep bed, cake).And lastly, the pore density (pores/mm²) was arbitrarily matched in the comparison of the two filter lengths and then arbitrarily assigned as a fixed value to the others. However, there may be need to adjust this number according to the segmentation of the filter, to account for changing number of cells along the cement seam.After having set the geometry parameters, the only parameters used to fit the pressure loss of the individual filters was pore diameter within usual ranges of 8-13 microns and the frontal area fraction blocked by the cement seams as it was not documented for the given filters, however the range was limited to about 8-15%.
GT-SUITE North American User's Conference, Dearborn, MI
November 15, 2005
DPF Modeling Using GT-POWER / Schernus, Wiartalla, Tomazic 14
14GT-SUITE North American User’s Conference The Dearborn Inn, Dearborn, MI, November 15, 2005
© by FEV / GUC-2005-USA_FEV_DPF-Modeling.ppt / Schernus, Tomazic
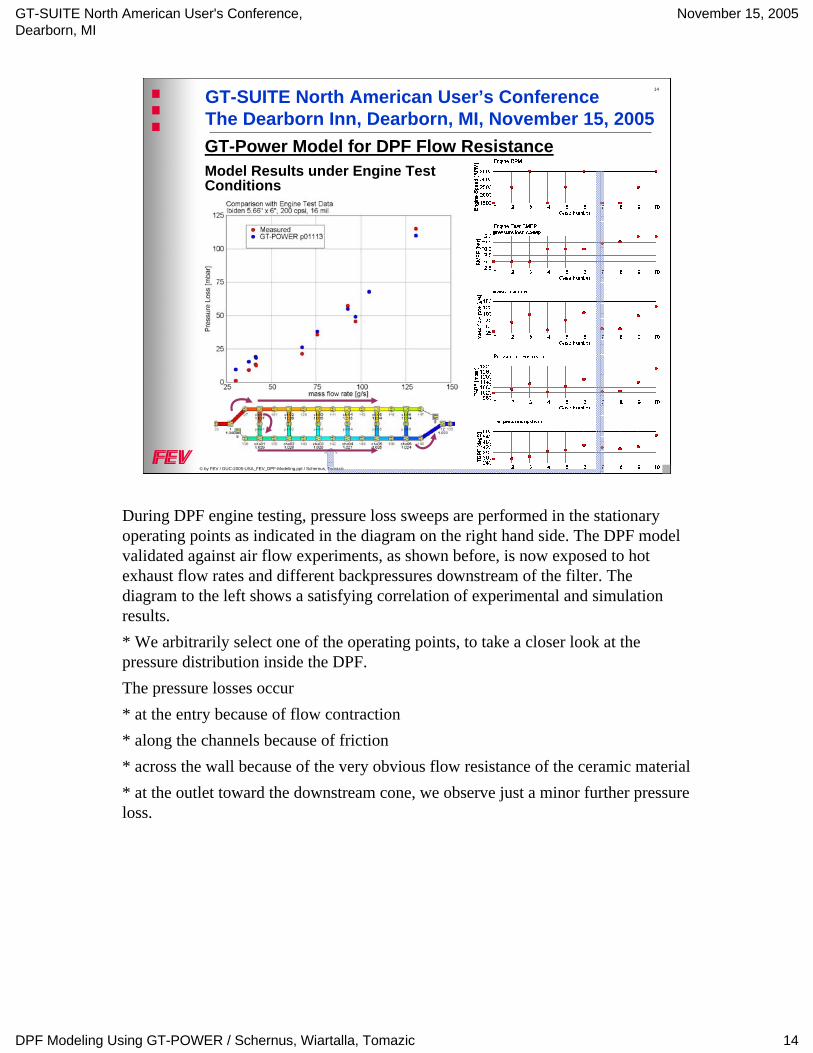
GT-Power Model for DPF Flow ResistanceModel Results under Engine Test Conditions
During DPF engine testing, pressure loss sweeps are performed in the stationary operating points as indicated in the diagram on the right hand side. The DPF model validated against air flow experiments, as shown before, is now exposed to hot exhaust flow rates and different backpressures downstream of the filter. The diagram to the left shows a satisfying correlation of experimental and simulation results.* We arbitrarily select one of the operating points, to take a closer look at the pressure distribution inside the DPF.The pressure losses occur* at the entry because of flow contraction* along the channels because of friction * across the wall because of the very obvious flow resistance of the ceramic material* at the outlet toward the downstream cone, we observe just a minor further pressure loss.
GT-SUITE North American User's Conference, Dearborn, MI
November 15, 2005
DPF Modeling Using GT-POWER / Schernus, Wiartalla, Tomazic 15
15GT-SUITE North American User’s Conference The Dearborn Inn, Dearborn, MI, November 15, 2005
© by FEV / GUC-2005-USA_FEV_DPF-Modeling.ppt / Schernus, Tomazic
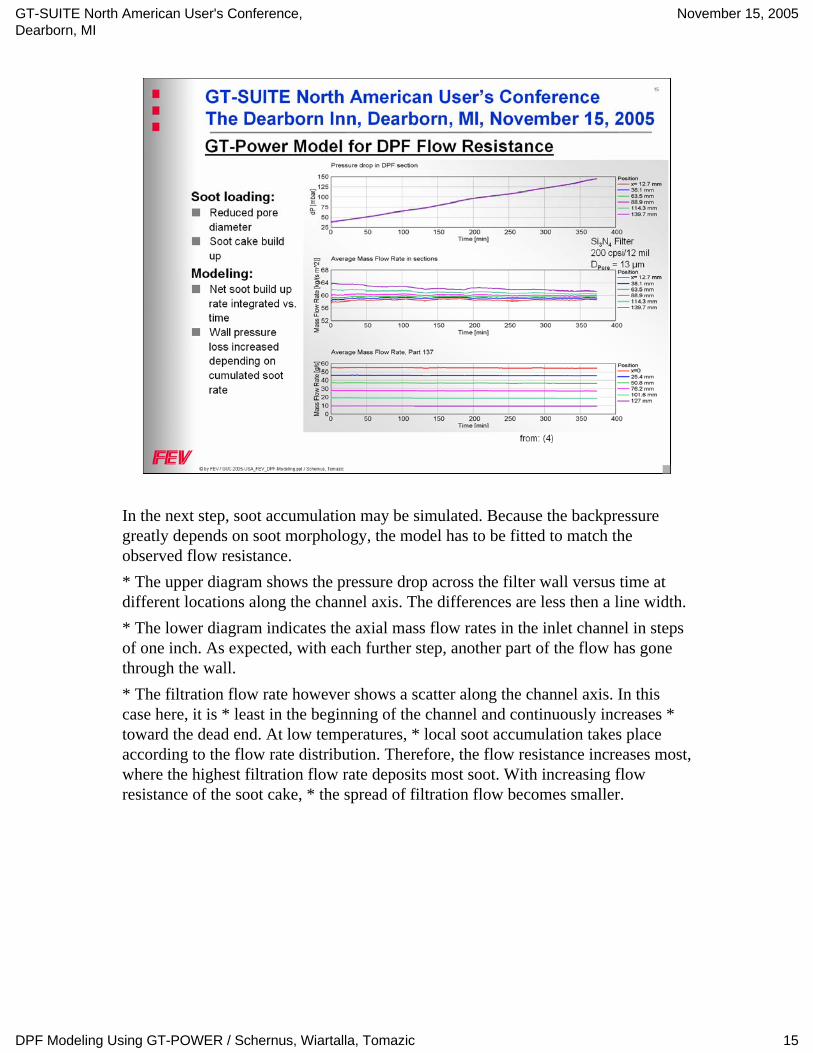
In the next step, soot accumulation may be simulated. Because the backpressure greatly depends on soot morphology, the model has to be fitted to match the observed flow resistance. * The upper diagram shows the pressure drop across the filter wall versus time at different locations along the channel axis. The differences are less then a line width.* The lower diagram indicates the axial mass flow rates in the inlet channel in steps of one inch. As expected, with each further step, another part of the flow has gone through the wall.* The filtration flow rate however shows a scatter along the channel axis. In this case here, it is * least in the beginning of the channel and continuously increases * toward the dead end. At low temperatures, * local soot accumulation takes place according to the flow rate distribution. Therefore, the flow resistance increases most, where the highest filtration flow rate deposits most soot. With increasing flow resistance of the soot cake, * the spread of filtration flow becomes smaller.
GT-SUITE North American User's Conference, Dearborn, MI
November 15, 2005
DPF Modeling Using GT-POWER / Schernus, Wiartalla, Tomazic 16
16GT-SUITE North American User’s Conference The Dearborn Inn, Dearborn, MI, November 15, 2005
© by FEV / GUC-2005-USA_FEV_DPF-Modeling.ppt / Schernus, Tomazic
V6.1 => multiple flow splits and new pore model enable modeling of wall flow DPFPressure loss well matched for different filter configurationsEngine test data represented with acceptable accuracyEnables prediction of filter wall flow distribution, pressure loss and acoustic attenuationWall effects such as soot accumulation currently handled using user coded functions (control icons)V6.2 will enable homogeneous gas reactions with built-in features and enable the use of CHEMKIN for surface reactions
Summary and Conclusions
With the new Version 6.1 feature of multiple flow splits and porous walls, GT-POWER can now be used to model the flow resistance of wall flow particulate filters.Experimental data from cold air flow and hot exhaust flow in engine tests are represented with satisfactory accuracy.Integrated in engine model assemblies, the DPF subassemblies are useful to predict wall flow distribution under various operating conditions, backpressure and even acoustic attenuation.The local accumulation of soot and its influence on backpressure are currently handled by user functions coded using control icons.The next steps to take will be modeling of regeneration and other chemical processes.I want to close my talk by pointing out to a few references.
GT-SUITE North American User's Conference, Dearborn, MI
November 15, 2005
DPF Modeling Using GT-POWER / Schernus, Wiartalla, Tomazic 17
17GT-SUITE North American User’s Conference The Dearborn Inn, Dearborn, MI, November 15, 2005
© by FEV / GUC-2005-USA_FEV_DPF-Modeling.ppt / Schernus, Tomazic
1. A. G. Konstandopoulos: “Flow Resistance Descriptors for Diesel Particulate Filters: Definitions, Measurements and Testing”; SAE Paper 2003-01-0846
2. S. Ebener, P. Flörchinger: “Druckverlustmodell für keramischeDieselpartikelfilter”; MTZ Motortechnische Zeitschrift 61 (2000) 6, pp. 414-422.
3. M. Mansoudi: “Pressure Drop of Segmented Diesel Particulate Filters”; SAE Paper 2005-01-0971
4. T. Morel, C. Schernus: “Progress in Integrated Simulation of Fuel Injection, Combustion and Aftertreatment”; VPD Workshop, Abbaye de Stavelot, May 9 & 10, 2005
References
Thank you for your attention.


![1.4.22 DOUGLAS [FRANZONI RODRIGUES] – SERVIÇO PÚBLICO FEDERAL DEPARTAMENTO DE POLÍCIA FEDERAL SUPERINTENDÊNCIA REGIONAL NO ESTADO DO PARANÁ GT OPERAÇÃO LAVAJATO/DRCOR/SR/DPF/PR](https://img.pdfslide.net/doc/110x75/5c00fc1109d3f26f1e8bf780/1422-douglas-franzoni-rodrigues-servico-publico-federal-departamento-de.jpg)