Embed Size (px)
Citation preview


• To extend the ANOVA model to include two independent variables and to explain how variability can be partitioned in a two-way independent groups Analysis of Variance design.
• To enable students to interpret the results of a two-way independent groups ANOVA.
• To demonstrate, using example data, the equations and calculations for a two-way independent groups ANOVA.

• Demonstrate an understanding of..• The terminology associated with Factorial
designs• the rationale of two-way Factorial Analysis of
Variance.• sums of squares and degrees of freedom for
a two-way independent groups Factorial ANOVA.
At the end of this lecture you will be able to :
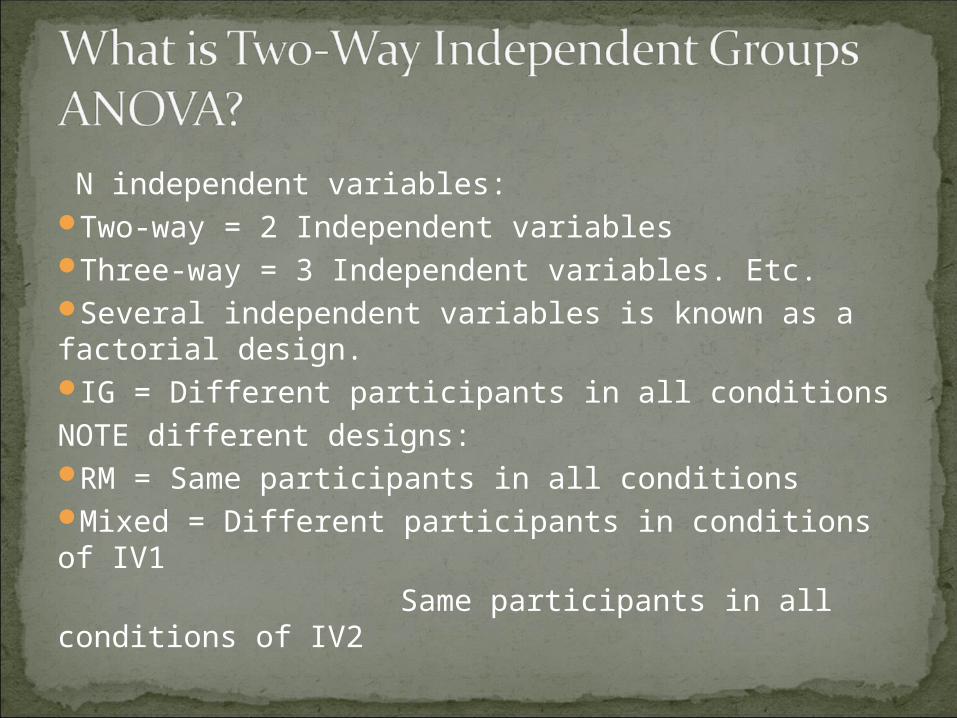
N independent variables:Two-way = 2 Independent variablesThree-way = 3 Independent variables. Etc.Several independent variables is known as a factorial design.IG = Different participants in all conditionsNOTE different designs:RM = Same participants in all conditionsMixed = Different participants in conditions of IV1 Same participants in all conditions of IV2

We can look at how variables interact.Show how the effects of one IV might depend
on the effects of anotherAre often more interesting than main effects
or One-way designs we have looked at so far
Factors: independent variables each with a number of levels
Factorial Design: an experimental design which uses all combinations of levels of factors. These are called crossed factors.
Treatment: A particular combination of levels of the factors. Also known as a cell (in an independent groups design also a group).

Main Effect: The effects of one independent variable (factor) summed (averaged) over all levels of the other independent variable
Interaction: When the effect of one factor is not constant across all levels of the other factors.

A B C
24
57
24
11
31
33
4
2
2 4 3
Depression
Schizophrenia
Factor 1: Drug
Factor 2: Diagnosis
Treatment Cells
Factor 1 Means
Factor 2 Means
Cell Means
Grand Mean

Partitioning of Sums of Squares for One-way ANOVA
SStotal
SSbetweenSSwithin

SStotal
SSbetweenSSwithin
SSF1 SSF2 SSF1xF2
Partitioning of Sums of Squares for Two-way Factorial ANOVA

a)

b) Sum of squares for drug

c) sum of squares for diagnosis

d) sum of squares for drug x diagnosis

e) error sum of squares
or

f)
g)
h)

i) There are two ways of calculating the interaction degrees of freedom
or

There are two ways of calculating the error degrees of freedom
j)
or

k) mean square for drug
l) mean square for diagnosis

m) mean square for interaction drug x diagnosis
n) mean square for error

o) drug
p) diagnosis
q) interaction drug x diagnosis

ANOVA Summary Table

ANOVA summary table, SPSS output, edited

A main effect means that we should be able to make a statement such as; For Factor 1 condition A was better (or worse) than condition B regardless of level of Factor 2
From the table on the previous slide it appears that we have a significant Main Effect for Diagnosis, F(1,6)=9,p=.024, ηρ
2 = .60
What does this mean – how would we interpret it?

The significant main effect for Diagnosis indicates that no matter which drug was being taken, participants with one diagnosis scored significantly better / worse than participants with the other diagnosis
We would report the result thus: There was a significant Main Effect for Diagnosis, F(1,6)=9,p=.024, ηρ
2 = .60. inspection of the means indicates that participants with Schizophrenia reported greater reduction of symptom scores regardless of which Drug they were taking.
It is not actually true in this case but we will come back to that!!

An Interaction Effect is when the effect of one factor is not constant across all levels of the other factors or in other words, when the effect of one factor varies with the levels on the other factor
Thus, we CANNOT make a statement such as: Participants given Drug A reported a greater reduction in symptoms than participants taking Drugs B or C regardless of diagnosis, as this would be indicative of a Main Effect for Drug

Examples of interpreting an Interaction Effect would be:1.Participants with Schizophrenia reported greater
symptom reduction with Drug B and participants with Depression reported greater symptom reduction with Drug C. Participants with Depression reported less symptom reduction for Drug A
Or..2.Participants given Drug C did not differ in reported
symptom reduction regardless of diagnosis but Participants with Schizophrenia reported a greater reduction that those with Depression when given Drugs A & B
We can see from the examples above that reported symptom reduction scores are not dependent only on Diagnosis or only on type of Drug but a combination of Drug and Diagnosis

The graph clearly shows an interaction but our ANOVA only tells us there is a significant Main Effect for Diagnosis, this peculiar result is because we have so few participants (2 per cell) and non normal data, illustrating that statistical test can be unreliable when the assumptions are violated!!