Embed Size (px)
Citation preview
1 Dr. Lakshmi Mohan
Advances in BI
1. Why Data Mining?
2. Expert Systems: A Tool for Sifting Through Mountains of Data- Case Example: Ocean Spray Cranberries
3. Data Mining Models:- Association, Sequential Patterns, Classification, Clustering and Predictive Models
4. Data Mining Techniques:- Decision Trees, Rules Induction, Regression & Neural Networks
5. Text Mining for Unstructured Data
6. Business Activity Monitoring: A Priority Today
2 Dr. Lakshmi Mohan
Why Data Mining ?
Data volumes are TOO BIG for traditional DSS Query/ Reporting and OLAP tools.
Organizations have to get value from the huge investments of time and money made in building data warehouses.
“Now that we have gathered so much data, what do we do with it?”
“The datasets are of little direct value themselves. What is of value is the knowledge that can be inferred from the data and put to use.”
3 Dr. Lakshmi Mohan
“Discover the Diamonds in Your Data Warehouse”
“Maximize your ROI on data warehousing & data marts by enabling your decision makers to exploit your customer data for competitive advantage”
“This web-enabled, point-and-click approach lets you employ OLAP, neutral networks, churn analysis, and many other visualizations and analytical techniques to improve – Customer retention Target key prospect Profile market segments Detect fraud Analyze customer response, and much more”
Source: Ads of BI vendors
Without BI, your DW is…….. ….. Well, a warehouse full of data
4 Dr. Lakshmi Mohan
The Economics of Attention
“A wealth of information creates a poverty of attention.” - Nobel prize- winning economist, Herbert Simon
Problem: NOT Information Access BUT Information Overload
Challenge: Locating , Filtering & Communicating What is useful to the user
5 Dr. Lakshmi Mohan
Why is Data Mining a “Hot” Topic Today?
1. Implementation of ERP, CRM & SCM systems have resulted in vast stores of operational data.
2. Emergence of global competition has put the pressure on companies to be “data- driven” – i.e., make informed decisions based on facts and not hunches.
3. The speed of change in the marketplace demands that the pearls of actionable information have to be found faster in the ocean of data, for companies to be one step ahead of competition.
4. The hardware needed to store and process a “ton of data” was prohibitively expensive until recently – “You would have had to have NASA at your disposal”. Today, the technology makes it feasible to apply complex models to ferret out patterns previously left to rot in “data jails”.
6 Dr. Lakshmi Mohan
The Payoff from Data Mining- Two Examples
1. Farmer’s Insurance Based on traditional data analysis, drivers of sports cars were determined
to be at higher risk for collisions than drivers of “safe” cars such as Volvos Hence charged them more for car insurance Data mining discovered a pattern that changed the pricing policy…. ….. As long as the sports car was not the only car in the household, the
driver fit the profile of the “safe” family car driver, not the risky sports car driver.
2. Walgreen (A large Retailer) In the past, success of promotional offers such as 2-for-1 sales was
measured primarily by product sales….. ….. With data mining, Walgreen can see what other items are selling with its
promotional offers ….. Tuned its programs to put things on sale that people tend to buy in
tandem with high-margin items.
7 Dr. Lakshmi Mohan
What are Expert Systems?
A technology that enables expertise to be distributed throughout a firm without the presence of the human expert
Rule-Based System― If “This”, Then “That”― Rules are determined from expert knowledge and programmed in the
software
An HR Application Screening a large number of resumes for relatively low-level positions
with well-defined and precise skill requirements - e.g., Call Center Agents
Expert System can weed out applicants who do not meet the requirements
8 Dr. Lakshmi Mohan
Applying Expert Systems – To Extract “News” from Scanner Data
The Promise: Better Data for Tracking Market Shares– Compared to Retail Store Audits– Frequency: Weekly vs. Bimonthly– Level of Detail: UPCs vs. Brands– Scope: Top 50 Markets vs. Regions
The Problem: Too Much Data– At least 100 times more data
The Result: Impossible to Use the Quality Data
9 Dr. Lakshmi Mohan
"CoverStory"- An Expert System: Replaced the Human Analyst
Before . . .Companies circulated top-line reports, including tables
and charts from the retail store audit data. An analyst prepared the cover memo highlighting important news in the data.
Now. . . Not feasible to have an army of analysts to sift through the
mountain of scanner data. Instead, "CoverStory" automatically writes this memo!– a model-imbedded expert system extracts the news– includes a built-in thesaurus to eliminate repetitious
wording
10 Dr. Lakshmi Mohan
Case Example:Ocean Spray Cranberries
– A $1 billion grower-owned agricultural cooperative
– Lean IS staff
– Only one marketing professional for analyzing the tracking data
– Scanner data for juices is imposing
-- 400 M numbers covering up to 100 data measures, 10,000 products, 125 weeks and 50 geographic markets
-- Grows by 10 million new numbers every four weeks
11 Dr. Lakshmi Mohan
Impact of CoverStory
– Enables a department of one to alert all Ocean Spray marketing and sales managers to key problems and opportunities and provide problem-solving information
– Being done across 4 business units handling scores of company products in dozens of markets representing hundreds of millions of dollars of sales
– System is totally integrated into business operations because it delivers information of competitive value in running the business
12 Dr. Lakshmi Mohan
Tools to Get Value from Data Warehouses
Business Intelligence ToolsTo enable users without programming skills to analyze
the raw data in the data warehouse.Ad Hoc Query / ReportingOLAP Tools to “slice” and “dice” data.
Data Mining ToolsAutomate the detection of patterns in the data
warehouseBuild models to predict behavior through statistical and
machine-learning techniques.
13 Dr. Lakshmi Mohan
Data Mining Not Limited to Discovery…
… i.e., finding an existing nugget of “gold” in the “mountain” of data,
Data Mining used for Prediction alsoTelling you not just where the gold is “today”, but
where the gold might be “tomorrow”Predict what is going to happen next based on what
we have found. “From the moment I signed up for my Total Rewards card in the
casino lobby and filled in my name, address, date of birth and driver’s license number, Harrah’s had a pretty good hunch that my long term potential was already low… I was a 32- year old man from the distant state of Montana… did not fit the profile of a high- value customer!”
Age, gender and distance from the casino were identified through data mining as critical predictors of frequency of visiting casinos.
14 Dr. Lakshmi Mohan
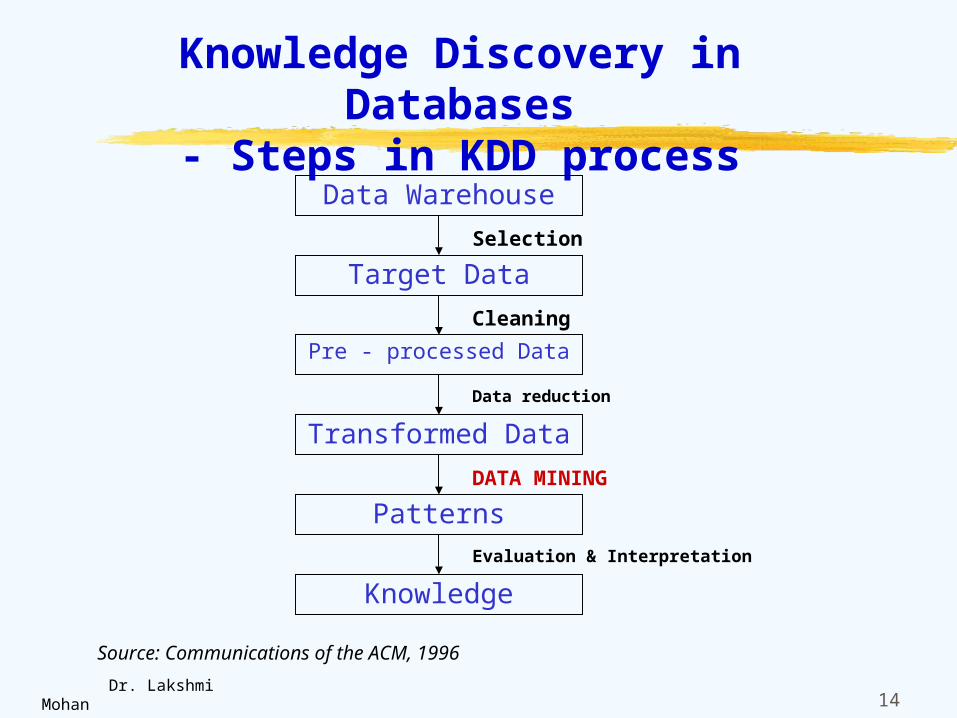
Knowledge Discovery in Databases
- Steps in KDD processData Warehouse
Target Data
Pre - processed Data
Transformed Data
Patterns
Knowledge
Selection
Cleaning
Data reduction
DATA MINING
Evaluation & Interpretation
Source: Communications of the ACM, 1996
15 Dr. Lakshmi Mohan
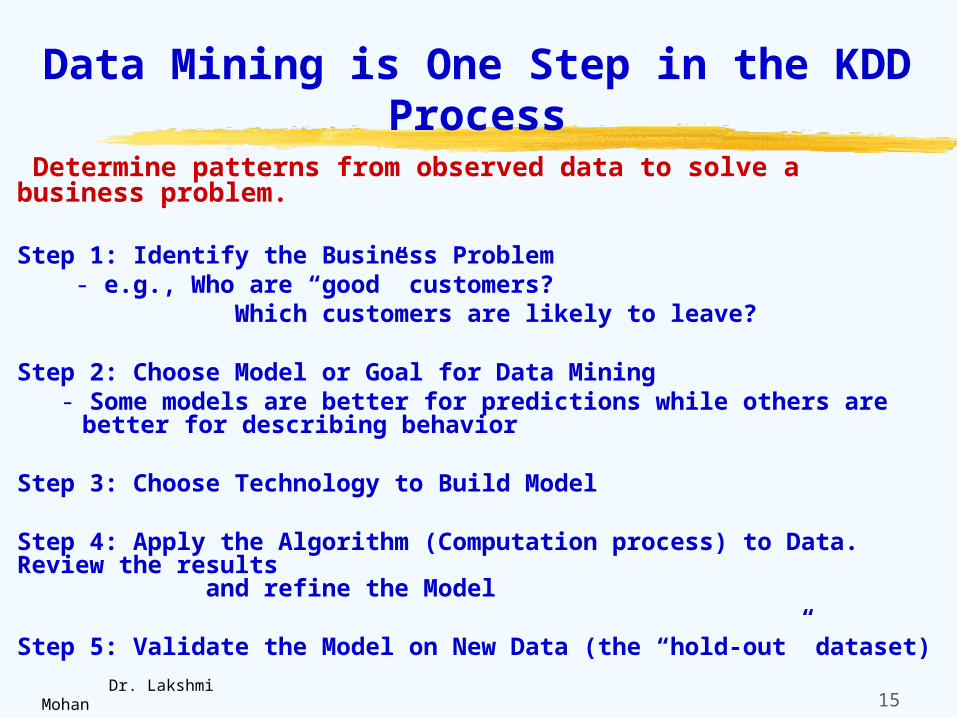
Data Mining is One Step in the KDD Process
Determine patterns from observed data to solve a business problem.
Step 1: Identify the Business Problem - e.g., Who are “good” customers? Which customers are likely to leave?
Step 2: Choose Model or Goal for Data Mining- Some models are better for predictions while others are better for
describing behavior
Step 3: Choose Technology to Build Model
Step 4: Apply the Algorithm (Computation process) to Data. Review the results and refine the Model
Step 5: Validate the Model on New Data (the “hold-out” dataset)
16 Dr. Lakshmi Mohan
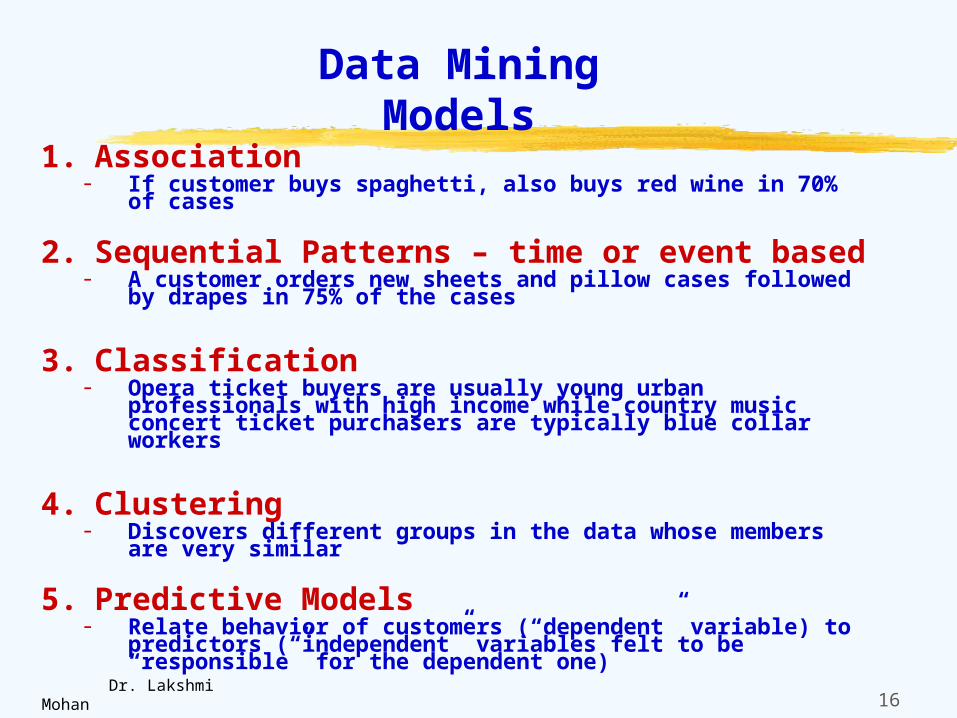
Data Mining Models
1. Association- If customer buys spaghetti, also buys red wine in 70% of cases
2. Sequential Patterns – time or event based- A customer orders new sheets and pillow cases followed by
drapes in 75% of the cases
3. Classification- Opera ticket buyers are usually young urban professionals with
high income while country music concert ticket purchasers are typically blue collar workers
4. Clustering- Discovers different groups in the data whose members are very
similar
5. Predictive Models- Relate behavior of customers (“dependent” variable) to
predictors (“independent” variables felt to be “responsible” for the dependent one)
17 Dr. Lakshmi Mohan
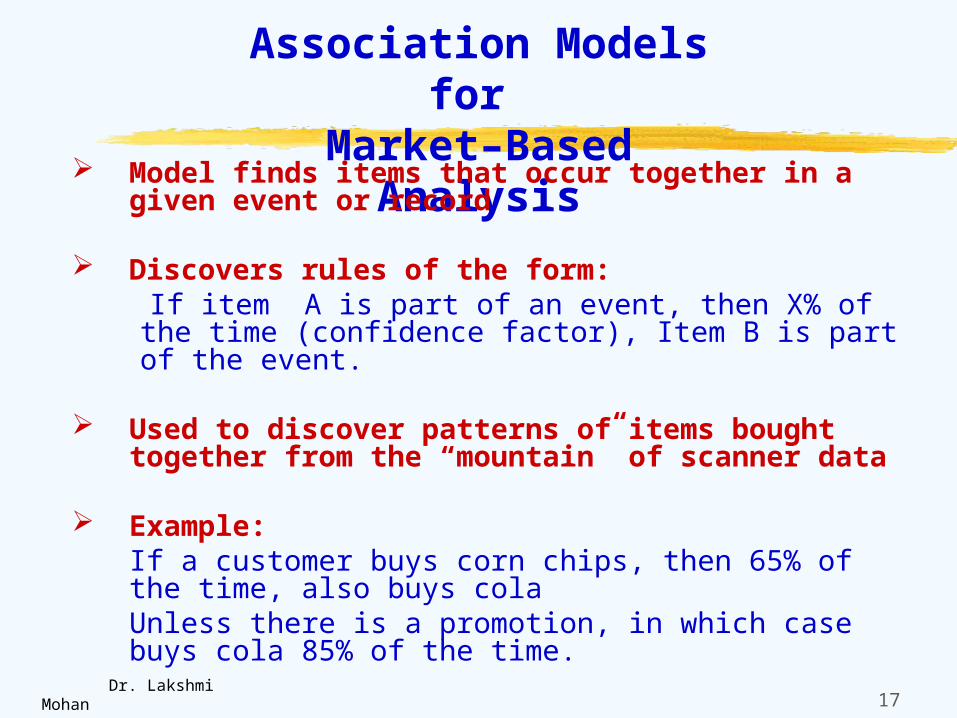
Association Models for
Market–Based Analysis Model finds items that occur together in a given event or record
Discovers rules of the form: If item A is part of an event, then X% of the time
(confidence factor), Item B is part of the event.
Used to discover patterns of items bought together from the “mountain” of scanner data
Example:If a customer buys corn chips, then 65% of the time, also buys colaUnless there is a promotion, in which case buys cola 85% of the time.
18 Dr. Lakshmi Mohan
Sequential Patterns
Similar to Association Models, except that the relationships among items are spread over time.
Sequences are associations in which events are linked by time
Require data on the identity of the transactors in addition to details of each transaction.
Example:
If surgical procedure X is performed, then 45% of the time infection Y occurs within 5 days
But after 5 days, the likelihood of infection Y drops to 4%
19 Dr. Lakshmi Mohan
Classification Models - Most Common Data Mining
Model Describe the group that a member belongs to by
examining existing cases that already have been classified, and inferring a set of rules
These IF-THEN rules are often depicted in a tree like structure
Examples:
- What are the characteristics of customers who are likely to switch to a rival telecom service provider?
- Which kinds of promotions have been effective in keeping which types of customers so that you can target the right promotion to the right customer?
20 Dr. Lakshmi Mohan
Clustering Models
Segment a database into different groups whose members are very similar
- Similar to Classification except that no groups have yet been defined
The Clustering model discovers groupings within the data- You do not know what the clusters will be when you start, or on what attributes the data
will be clustered.- Hence, a user who is knowledgeable in the business needs to interpret the clusters.
Example:- Xerox has developed predictive models using clusters for analyzing usage profile history,
maintenance data, and representations of knowledge from field engineers to predict photocopy component failure.
- An email is sent to the repair staff to schedule maintenance PRIOR to the breakdown- “Root Cause Analysis” enables a “prescription” for what to do about a problem
21 Dr. Lakshmi Mohan
Predictive Models
Combine predictors (or “independent” variables) in a model relating them to the variable to be predicted (“dependent” or “predictive” variable) using historical data on the predictors and the predictive variable – “training” data set
- Resulting model is used to predict the value for new data that does not include the predictive variable.
Example 1: Predefined Predictors - If the customer is rural and her monthly usage is high, then the customer will
probably renew.
- If the customer is urban and new feature exploration is high, then the customer will probably not renew.
Example 2: Customer Profiling - “We can tell the profile of someone who is about to have a baby by what
purchases they make…
We can then compare that profile with those of others “who are moving into baby space” to predict needs. For instance, such a customer may be a good target for a life insurance sales pitch.”
22 Dr. Lakshmi Mohan
Data Mining Techniques
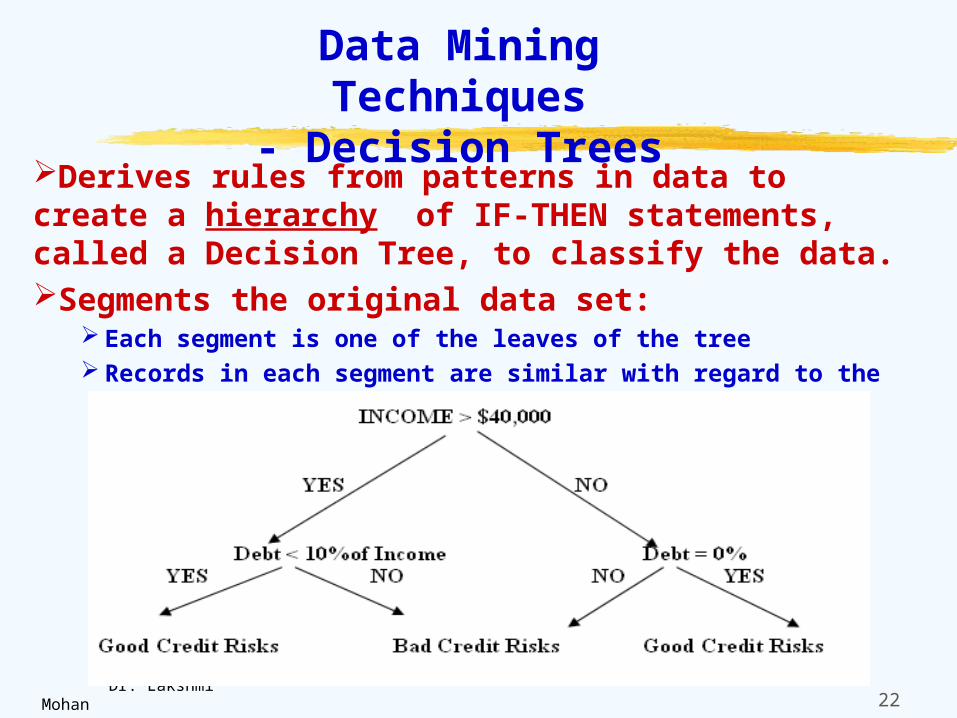
- Decision TreesDerives rules from patterns in data to create a hierarchy of IF-THEN statements, called a Decision Tree, to classify the data.Segments the original data set:
Each segment is one of the leaves of the tree Records in each segment are similar with regard to the variable of interest
Example: Classification of Credit Risks
23 Dr. Lakshmi Mohan
Pros & Cons of Decision Trees
1. How to handle continuous sets of data, like age or sales? Ranges have to be created such as 25-34 years, 35-44 years, etc. This grouping of ages could inadvertently hide patterns…
e.g., a significant break at 30 could be concealed
2. Crux of the “Tree- Growing” Process: What is the best possible question to ask at each branch point of the tree? e.g., The question “are you over 35?” may not distinguish between churners and
those who are not if the spilt of people over 35 is 40% for churners & 60% for others. The goal is to get a 90%-10% (10%- 90%) spilt in the segment of people over 35 years.
3. The algorithms look at all possible distinguishing questions and the sequence of asking them that could break up the “training data set” into segments that are nearly homogeneous with respect to the variable to be predicted. They stop growing the tree when the improvement is not substantial to warrant asking the question.
24 Dr. Lakshmi Mohan
CART: Classification and Regression Trees
- A Popular Statistical Package for Decision Trees CART begins by trying all the questions for grouping the population and
picks the best one that splits the data into two or more “organized” segments that decrease the “disorder” of the original population as much as possible.
Then, CART repeats the process on each of these new segments individually.
The algorithm not only discovers the optimally generated tree but also has the validation of the model on new test data (holdout sample) built in.
The most complex tree rarely fares the best on the holdout sample because it has been over-fitted to the training data set. The tree is pruned back based on the performance of the various pruned versions on the test data.
25 Dr. Lakshmi Mohan
CHAID: Another Statistical Tool for Decision Trees
Chi-Square Automatic Interaction Detector
Relies on the “Chi-Square” test used in “contingency” tables obtained by cross-tabulating the data on say, churners and non-churners by predictors, which have to be “categorical” such as age groups:
Less than 20, 20-29, 30-39, etc.
It determines which categorical predictor is “furthest from independence” with the prediction values of churners and non-churners.
Problem: Continuous variables such as age have to be coerced into a categorical form – how many categories? where should the splits be?
26 Dr. Lakshmi Mohan
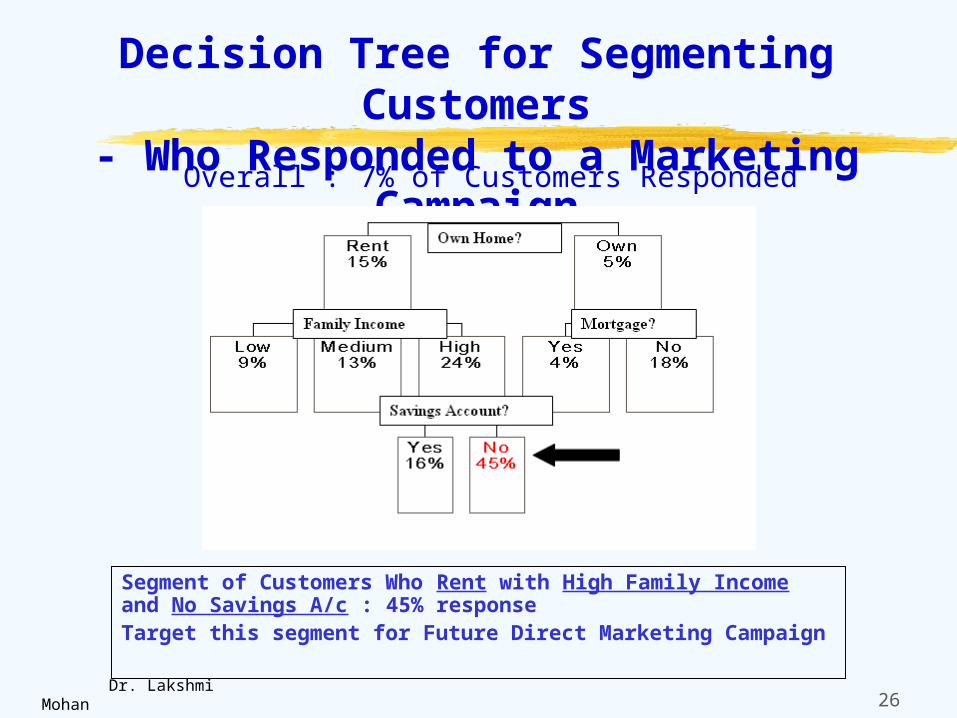
Decision Tree for Segmenting Customers- Who Responded to a Marketing
CampaignOverall : 7% of Customers Responded
Segment of Customers Who Rent with High Family Income and No Savings A/c : 45% responseTarget this segment for Future Direct Marketing Campaign
27 Dr. Lakshmi Mohan
Data Mining Techniques- Rule Induction
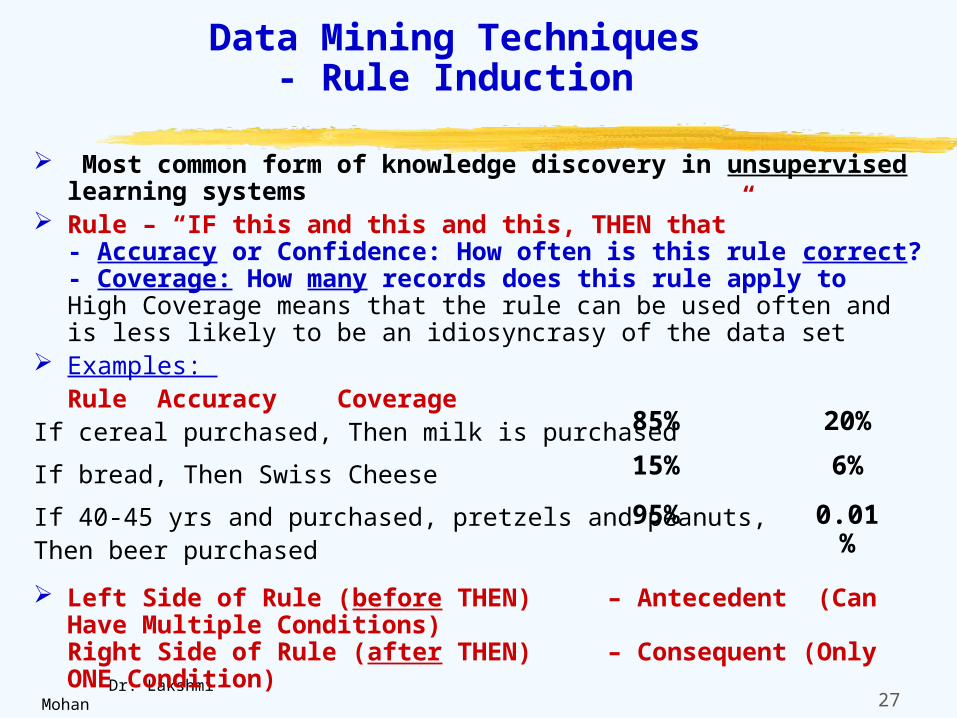
Most common form of knowledge discovery in unsupervised learning systems Rule – “IF this and this and this, THEN that”
- Accuracy or Confidence: How often is this rule correct?- Coverage: How many records does this rule apply toHigh Coverage means that the rule can be used often and is less likely to be an idiosyncrasy of the data set
Examples: Rule Accuracy
CoverageIf cereal purchased, Then milk is purchased
If bread, Then Swiss Cheese
If 40-45 yrs and purchased, pretzels and peanuts,Then beer purchased
Left Side of Rule (before THEN) – Antecedent (Can Have Multiple Conditions)Right Side of Rule (after THEN) – Consequent (Only ONE Condition)
85% 20%
15% 6%
95% 0.01%
28 Dr. Lakshmi Mohan
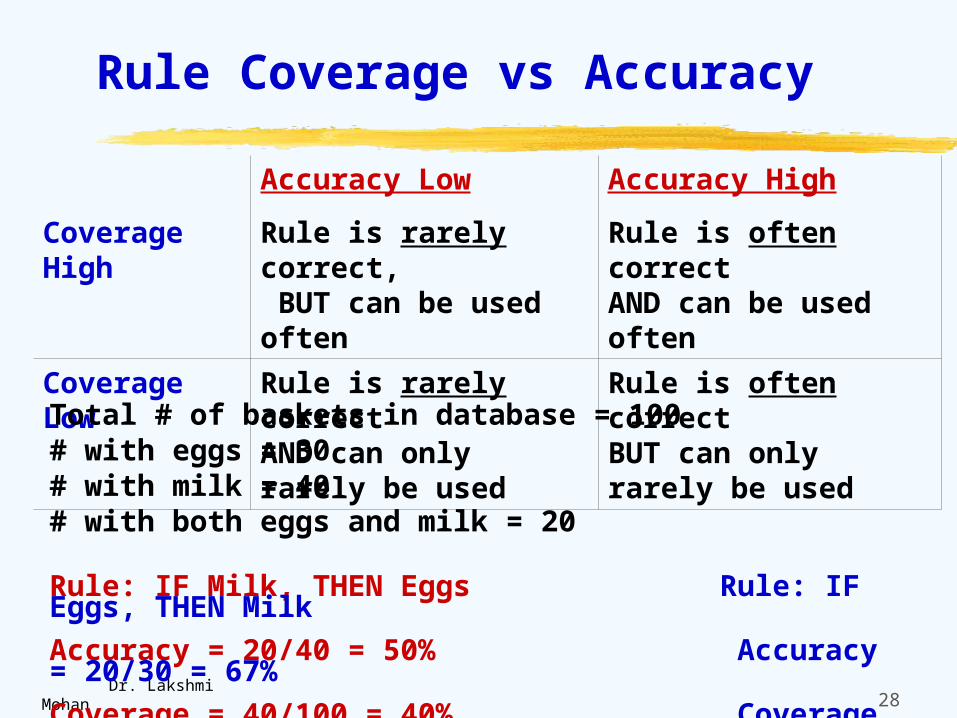
Rule Coverage vs Accuracy
Coverage High
Accuracy Low
Rule is rarely correct, BUT can be used often
Accuracy High
Rule is often correct AND can be used often
Coverage Low Rule is rarely correctAND can only rarely be used
Rule is often correctBUT can only rarely be used
Total # of baskets in database = 100# with eggs = 30# with milk = 40# with both eggs and milk = 20
Rule: IF Milk, THEN Eggs Rule: IF Eggs, THEN Milk
Accuracy = 20/40 = 50% Accuracy = 20/30 = 67%
Coverage = 40/100 = 40% Coverage = 30/100 = 30%

29 Dr. Lakshmi Mohan
What To Do With A Rule?
1. Target the Antecedent:- All rules with a certain value for the antecedent, e.g., “nails, bolts and screws”, are presented to a retailer- Would discontinuing the sale of these low-margin items have any effect on sales of higher margin products, e.g., expensive hammers?- Example:A British supermarket was about to discontinue a line of expensive French Cheeses which were not selling well.But data mining showed that the few people who were buying the cheeses were among the supermarket’s most profitable customers – so it was worth keeping the cheese to retain them.
2. Target the Consequent:- Understand what affects the consequent, say, purchase of coffee- Put those items near the coffee on the store shelves to increase sales of coffee and those items- Example:Sales of diapers and beer were found to be highly correlated in shopping transactions between 5pm and 7pm… young fathers dropped in at the stores to pick up diapers, and decided to stock up the latter at the same time… hence put the beer display near the diapers
30 Dr. Lakshmi Mohan
Rule Induction vs. Decision Trees
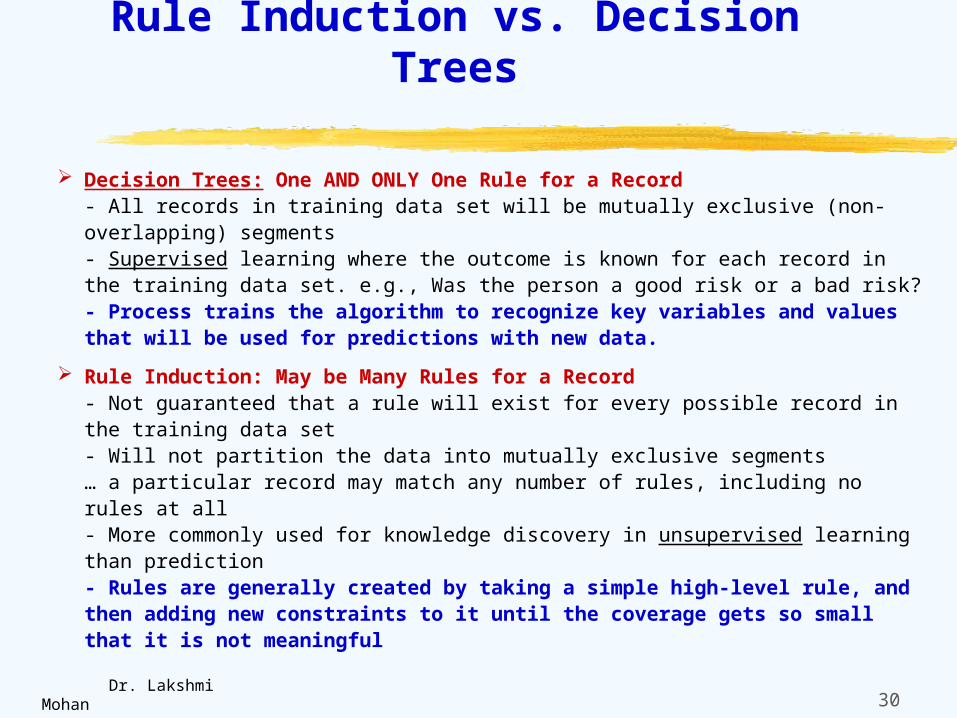
Decision Trees: One AND ONLY One Rule for a Record- All records in training data set will be mutually exclusive (non-overlapping) segments- Supervised learning where the outcome is known for each record in the training data set. e.g., Was the person a good risk or a bad risk?- Process trains the algorithm to recognize key variables and values that will be used for predictions with new data.
Rule Induction: May be Many Rules for a Record- Not guaranteed that a rule will exist for every possible record in the training data set- Will not partition the data into mutually exclusive segments… a particular record may match any number of rules, including no rules at all- More commonly used for knowledge discovery in unsupervised learning than prediction- Rules are generally created by taking a simple high-level rule, and then adding new constraints to it until the coverage gets so small that it is not meaningful
31 Dr. Lakshmi Mohan
When to Use What?
Decision Trees:- Create the smallest possible set of rules for a predictive model - work from a prediction target downward in what is known as “greedy” search – look for the best possible split on the next step, greedily picking the best one without looking any further than the next step- If there is overlap between two predictors, the better of the two would be picked. e.g., height might be used instead of shoe-size as a predictor whereas both could be used as antecedents in a rule induction system- Traditionally used for exploration to determine the useful predictors to be fed on the second pass of data mining into prediction models using statistical techniques or neural networks
Rule Induction:- Yields a variety of rules with different predictors even if some are redundant.- Even though height and shoe size are highly correlated, both could be preset as antecedents in two different rules – in contrast, the decision tree would pick the better of the two predictors- Mainly used to discover interesting patterns in the data
32 Dr. Lakshmi Mohan
Data Mining Techniques- Regression Models
Statistical models which link predictors or “independent” variables to the variable to be predicted or “dependent” variable
User has to select the predictors and define the structure of the linkage
e.g., a linear model linking the predictor, Customer’s Annual Income (Y) to the variable to be predicted, Average Customer Bank Balance, (X)Y = a + b*XThe constants, ‘a’ and ‘b’ in the above model, are called “parameters” that specify the shape of the line relating X and Y.
The parameters are calculated so as to minimize the sum of squares of the forecast errors when the model is applied to the training or model-fitting data set of X values and corresponding actual Y values… The “least squares method” uses calculus to derive the formulas for the parameters a and b.
33 Dr. Lakshmi Mohan
Validation and Refinement of Regression Models
“R-Squared” value is calculated to show the goodness of fit of the predicted Y values from the model to the actual Y values in the data set.e.g., a value of 0.87 means than 87% of the variation in y was explained by the model
Acid test of the model is to apply the fitted model to new data not used to calculate the parameters (‘a’ and ‘b’) of the model – the “hold-out” or “validation” data set
Refine the model, if necessary, to make better predictions:… Add multiple predictors (“multiple regression models)… Transform predictors by squaring, taking logarithms etc (“non-linear models”)… Combine predictors by multiplying or taking rations(e.g., ratio of annual household income to family size)
If dependent variable is a response variable with just Yes/No or 0/1 values, a different model called “logisitic regression” model is used.
34 Dr. Lakshmi Mohan
Data Mining Techniques- Neural Networks
Based on the concept of the human brain in that it learns- originally developed for military applications to tell whether a speck on a screen is a bomber or a bird, and discriminate between decoys and genuine mistakes- now, the same technology can separate good customers from bad ones
Network composed of a large number of “neurons” (or processing elements) tied together with weighted connections (synapses)- A collection of connected notes, each having an input and an output, and arranged in layers.- Between the visible Input Layer and final Output Layer, there could be a number of hidden processing layers
35 Dr. Lakshmi Mohan
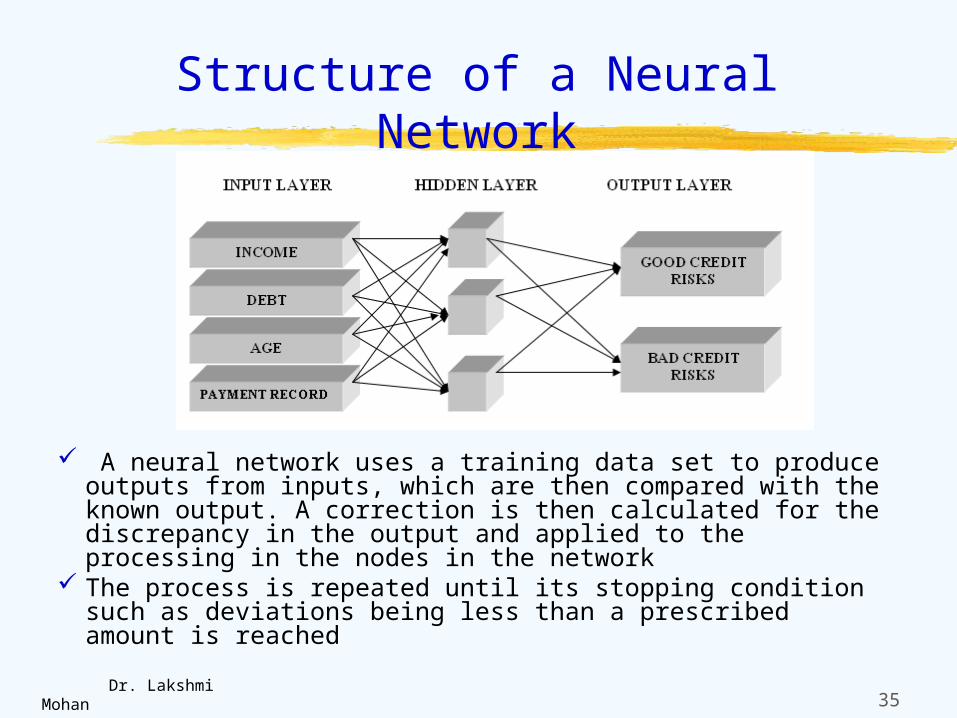
Structure of a Neural Network
A neural network uses a training data set to produce outputs from inputs, which are then compared with the known output. A correction is then calculated for the discrepancy in the output and applied to the processing in the nodes in the network
The process is repeated until its stopping condition such as deviations being less than a prescribed amount is reached
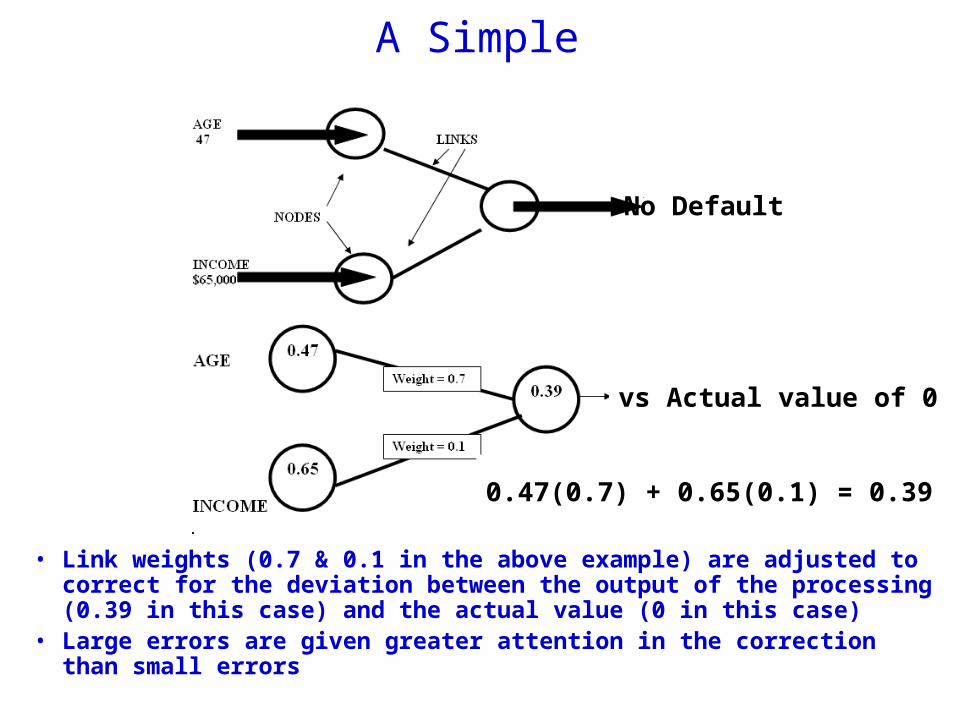
A Simple Example
vs Actual value of 0
No Default
0.47(0.7) + 0.65(0.1) = 0.39
• Link weights (0.7 & 0.1 in the above example) are adjusted to correct for the deviation between the output of the processing (0.39 in this case) and the actual value (0 in this case)
• Large errors are given greater attention in the correction than small errors
37 Dr. Lakshmi Mohan
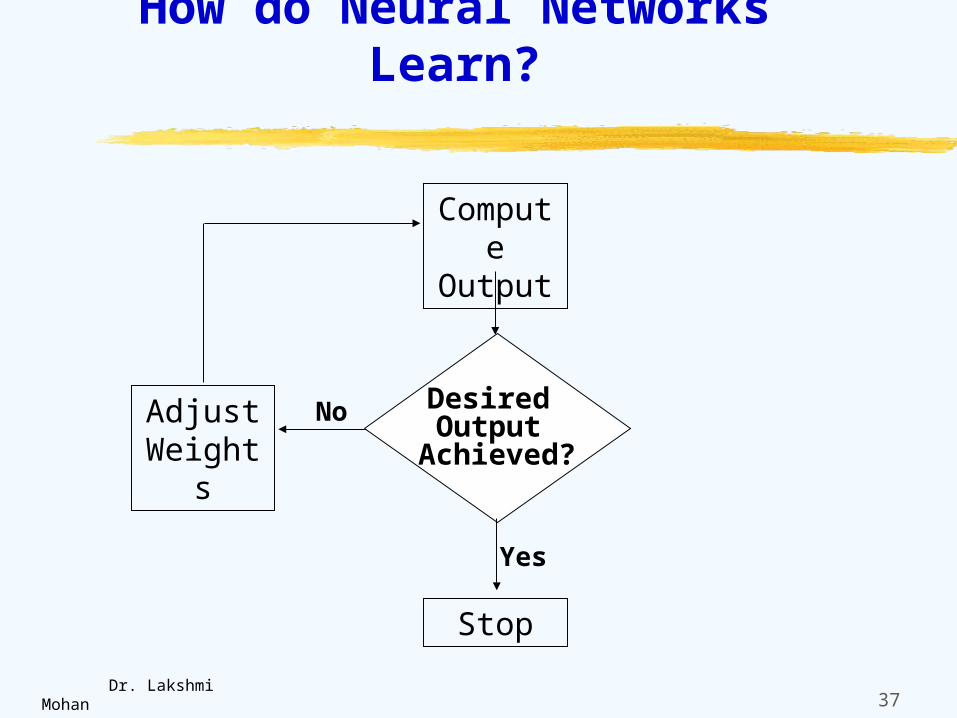
How do Neural Networks Learn?
Compute Output
Desired Output
Achieved?
Adjust Weights
No
Stop
Yes
38 Dr. Lakshmi Mohan
Pros and Cons of Neural Nets
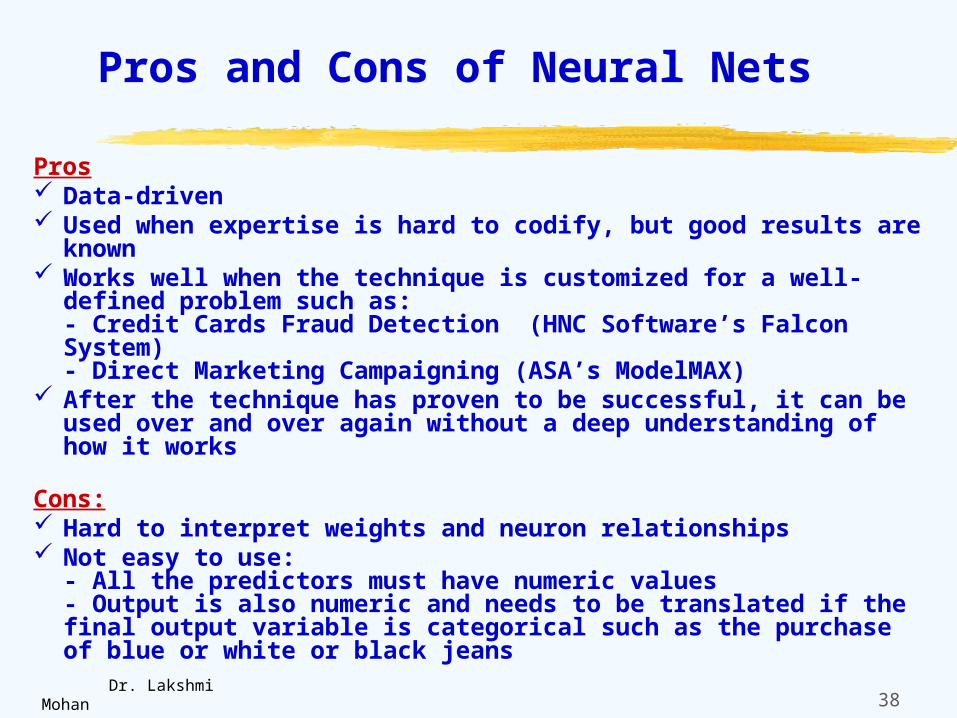
Pros Data-driven Used when expertise is hard to codify, but good results are known Works well when the technique is customized for a well-defined problem
such as:- Credit Cards Fraud Detection (HNC Software’s Falcon System)- Direct Marketing Campaigning (ASA’s ModelMAX)
After the technique has proven to be successful, it can be used over and over again without a deep understanding of how it works
Cons: Hard to interpret weights and neuron relationships Not easy to use:
- All the predictors must have numeric values- Output is also numeric and needs to be translated if the final output variable is categorical such as the purchase of blue or white or black jeans
39 Dr. Lakshmi Mohan
How to Evaluate a Data Mining Product
1. What kind of business problem does it address?
2. What technique does it use to model the data?
3. How does it handle categorical data and continuous data?
4. How sensitive is it to “noise” data?
5. How does it avoid the problem of “overfitting” the model?
6. Does it have a built-in process for validating the model on the “holdout” data?
7. Is the user interface easy to understand and use?
8. How long does it take to get useful answers from the data?
9. How clear are the results to interpret?
10. ABOVE ALL, TEST DRIVE THE PRODUCT ON YOUR DATA!
40 Dr. Lakshmi Mohan
Text Mining: An Imperative Today
Unstructured data, most of it in the form of text files, typically accounts for 85% of an organization's knowledge stores, but it’s not always easy to find, access, analyze or use.
“We are drowning in information, but are starving for knowledge”
41 Dr. Lakshmi Mohan
New Generation of Text Mining Tools…
…to extract key elements from large unstructured data sets, discover relationships and summarize the information
Categorization: Presents the search results in categories, rather than an undifferentiated mass.
Clustering: Grouping similar documents based on their content.
Extraction:Extracting relevant information from a documente.g., pulling out all the company names from a data set.
42 Dr. Lakshmi Mohan
New Generation of Text Mining Tools
Keyword Search:
Searching documents for the occurrence of a particular word or set of words.
Natural-Language processing:
Determining the meaning of written words taking into account their context, grammar, etc.
Visualization:
Graphically presenting the mined data as relationships are easier to spot and understand.
43 Dr. Lakshmi Mohan
Case Example of Text Mining- Dow Chemical’s BI Center
Using ClearResearch software to extract data from a century’s worth of chemical patent abstracts, published research papers and the company’s own files.
“By eliminating the irrelevant, we’ve been able to reduce the time it takes for researchers to find what they need to read.”
ClearResearch uses a proprietary pattern-matching technology to search for information, categorize it and show its relationship to other data.
“The software can see, discover and extract concepts, not just words. It gives us a pictorial representation of the text in the document in an easy-to-understand chart”
44 Dr. Lakshmi Mohan
Case Example of Text Mining- Air Products & Chemical’s Knowledge Management
System
Company has over 18,000 employees in 300 countries, and more than 600 intranet and extranet sites.
Its file servers contain 9TB of unstructured data, excluding email or anything stored on local drives.
Using SmartDiscovery to generate a catalog and index of the data repository so that it can be more easily accessed by MS SharePoint Portal Document Management System.
Also using the software for Sarbanes-Oxley compliance and e-learning since by correctly categorizing the data, business rules can be applied to a category of documents rather than to individual documents: e.g., if a document relates to operations covered by SOX, then the appropriate data-retention policies are applied to it.
“I call it the central nervous system for what we are doing with knowledge management.”
45 Dr. Lakshmi Mohan
Text Mining Tools
Come either as stand-alone products or embedded as part of a larger software system:
Database vendors: Oracle, IBM,…- Incorporating pattern-matching algorithms into their database products
Data Mining vendors: SAS, SPSS,…- Added text mining to their portfolios.
Enterprise Search Engine Vendors: Autonomy, Verily,…
Specialized Text Mining Firms: Inxight Software, Stratify…
“Installing SAS Text Miner is a simple process- just needed to load 6 CDs on my workstation” Hard part:: Get meaningful results - Depends on the skill and knowledge of user to properly interrogate text repositories“We are getting an increasing understanding of what things are possible with text mining. But there is a huge skills problem in this area, which is why it hasn’t gotten much traction so far”- Gartner
46 Dr. Lakshmi Mohan
Dec 2003 Report of Gartner
Text Mining has not been well coupled with clearly recognized “pain points” in the organisation. Customer service has been mainly handled in call centers, with an emphasis on transaction processing and short interaction times. As a result, most firms have been missing valuable input from customers on how to improve their business processes. This has led to low levels of customer satisfaction, little long-term loyalty and an expensive, albeit necessary, way of resolving customer complaints…
Blended service delivery models using text mining, telephone and web services will enable companies to identify not only what the customer said, but also what was meant… will be able to spot and resolve problems earlier… improve their ability to prevent problems recurring…improved measurement of customer satisfaction over today’s flawed survey methodology.”
Text Mining Will revolutionize CRM Strategies by 2008…Companies will retire older technologies such as IVR, and redesign
customer-facing processes.
47 Dr. Lakshmi Mohan
Business Activity Monitoring (BAM)
Automated monitoring of business-related activity affecting an enterpriseReport on activity in the current operational cycle, e.g., the current hour, day or week.Designed to spot problems early enough to head them off.
BAM is not a new conceptCredit Card companies have had real-time fraud monitors for years.Manufacturers have real-time error-detection software built into their assembly lines.
Proactive or Reactive?“The conventional wisdom has been to just take transactional data and move it to the data
warehouse and then to the BI System. But these systems aren’t responsive”
Monitoring business activity after the fact is too late to head off a problem such as a missed
deadline or the loss of a major customer. BAM systems pluck the data in real time from the applications where it originates -
order entry, accounts receivable, call centers, etc. Output in variety of forms –
dashboards, e-mails, pager alerts,…
48 Dr. Lakshmi Mohan
GE’s Real-Time Dashboard
GE’s aim is to monitor everything in real time, GE’s CIO explains, calling up a special web page on his PC: a “digital dashboard”. From a distance it looks like a Mondrian canvas in green, yellow and red. A closer look reveals that the colors signal the status of software applications critical to GE’s business. If one of the programs stays red or even yellow for too long, he gets the system to e-mail the people in charge. He can also see when he had to intervene the last time, or how individual applications such as programs to manage book-keeping or orders have performed.
As CIO, Mr. Reiner was the first in the firm to get a dashboard, in early 2001. Now most of GE’s senior managers have such a constantly updated view of their enterprise. Their screens differ according to their particular business, but the principle is the same: the dashboard compares how certain measurements, such as response times or sales or margins, perform against goals, and alerts managers if the deviation becomes large enough for them to have to take action.
49 Dr. Lakshmi Mohan
BAM Case Example- Davis Controls Ltd. (Canada)
Every afternoon, at 4:30 pm, a screen pops up on the CEO’s PC with important “news”: How many orders the company booked Names of customers who have gone past 90 days without paying Orders that have missed delivery promises
PLUS 15 Daily E-mail Alerts, e.g., Which salespeople have not logged in that day to download the latest data
from a corporate database about the customers in their territories “Sometimes those remote sales guys will just sit out there in never-never land, and as long as they think no one is watching, they will march to their own drummer.”
When a promised order-delivery is missed, one e-mail alert is generated for the responsible salesperson, one goes to a customer with an apology, and one goes to an expediter… Different e-mails go to new customers, depending on the size of their initial orders.
50 Dr. Lakshmi Mohan
BAM Case Example- Davis Controls Ltd. (Canada)
Use Macola Enterprise Suite, an ERP package from Exact Software, a subsidiary of a Dutch Company Includes the Exact Event Manager, a BAM product that triggers
alerts and reports on activity and non-activity, both inside and outside the ERP system.
“BAM enables me to manage the Company more proactively. Before, I’d have to wait until a customer called with a complaint or the month-end financial reports to really get a feel for how the business was doing.”
51 Dr. Lakshmi Mohan
BAM Case Example- A Fortune 100 Financial Services
Firm
Uses SeeRun Platform, a suite of products from SeeRun Corp. in San Francisco To monitor some 50,000 cases per year where the firm has signed contracts
with it’s clients guaranteeing performance against operational metrics relating to dozens of milestones in the contracts.
“If a task is supposed to be completed within 24 hours but isn’t, an alert is generated for the appropriate manager.”
“Even more helpful is receiving live activity-tracking along the way – at 6 hours, 12 hours, 18 hours and so on.”
Benefits: Improved Performance & Reduced Expenses Serves also as a marketing tool to show prospective clients
Biggest Challenge: What To Do With All the Data “You can actually over engineer something like this. If you get too many
stakeholders involved, everyone wants their own particular metric. We have been able to keep it focused and simple.”
52 Dr. Lakshmi Mohan
BAM Case Example- The Albuquerque City
Government Uses NoticeCast from Cognos
To proactively push e-mail notices of important events, in near real time, to city employees, residents & vendors
NoticeCast sits outside the city’s firewall on an extranet and monitors events by periodically querying Oracle tables populated by municipal systems.
Vendors Sends an e-mail to each vendor that was issued an electronic payment during the
night. Directs the vendor to a Website on the extranet where it can get a remittance report
Residents Sends an e-mail to each residents for whom a water-bill was produced with all the
pertinent billing info Directs the resident to a Website where he may pay his bill online
City Employees Once-a-day e-mails to certain employees letting them know of all online payments
made to the city during the past 24 hours –> whenever a candidate files a contribution report, NoticeCast sends an e-mail to city employees responsible for tracking campaign law compliance
53 Dr. Lakshmi Mohan
What’s Next for BAM?
Will become tightly coupled to Business Process Management (BPM) systems Send Alerts in a publish/subscribe model to lots of BPM
systems throughout the enterprise. Events go in and alerts come out, but those alerts just become
events in other applications Example:
A BAM system could generate an alert that the estimated date of a package delivery had slipped.
A CRM system and a BPM system might each subscribe to such “package due-date change” alerts, extending the usefulness of the alerts.
54 Dr. Lakshmi Mohan
What’s Next for BAM?
More sophisticated rules of logic will be included in BAM capable of finding hidden patterns in current business activity by doing on-the-fly analyses of historical data. “If a process is beginning to go South, the early birds of that are
hard to see. Eventually, we’ll see BI & BAM married at the level of using historically recorded data to identify problems much earlier.”
Even further out lies the Holy Grail of BAM: When a system not only sees a problem coming but also goes beyond alerts to actually fixing the problem.
e.g., automatically reordering a part when it sees that a shipment has been lost – an example of autonomic response, a self-learning system.
55 Dr. Lakshmi Mohan
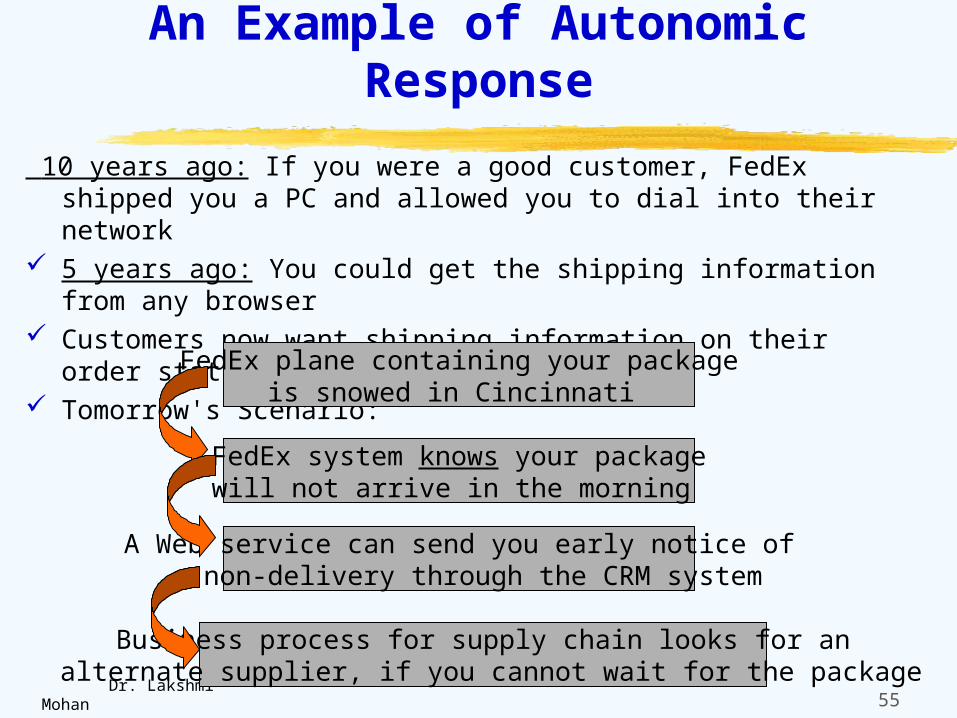
An Example of Autonomic Response
10 years ago: If you were a good customer, FedEx shipped you a PC and allowed you to dial into their network
5 years ago: You could get the shipping information from any browser Customers now want shipping information on their order status screen Tomorrow's Scenario:
FedEx plane containing your packageis snowed in Cincinnati
FedEx system knows your packagewill not arrive in the morning
A Web service can send you early notice of a non-delivery through the CRM system
Business process for supply chain looks for an alternate supplier, if you cannot wait for the package