Embed Size (px)
Citation preview
Dr. Lindsey Malcom-Piqueux AIR Symposium on Using Research to Inform Policies and Practices in STEM Education September 26, 2013

THE GOOD NEWS. Let’s start with…
0
5,000
10,000
15,000
20,000
25,000
1990 1993 1996 1999 2002 2005 2008 2011
Num
ber o
f STE
M B
ache
lor’s
Deg
rees
Black Latino American Indian/Alaskan Native
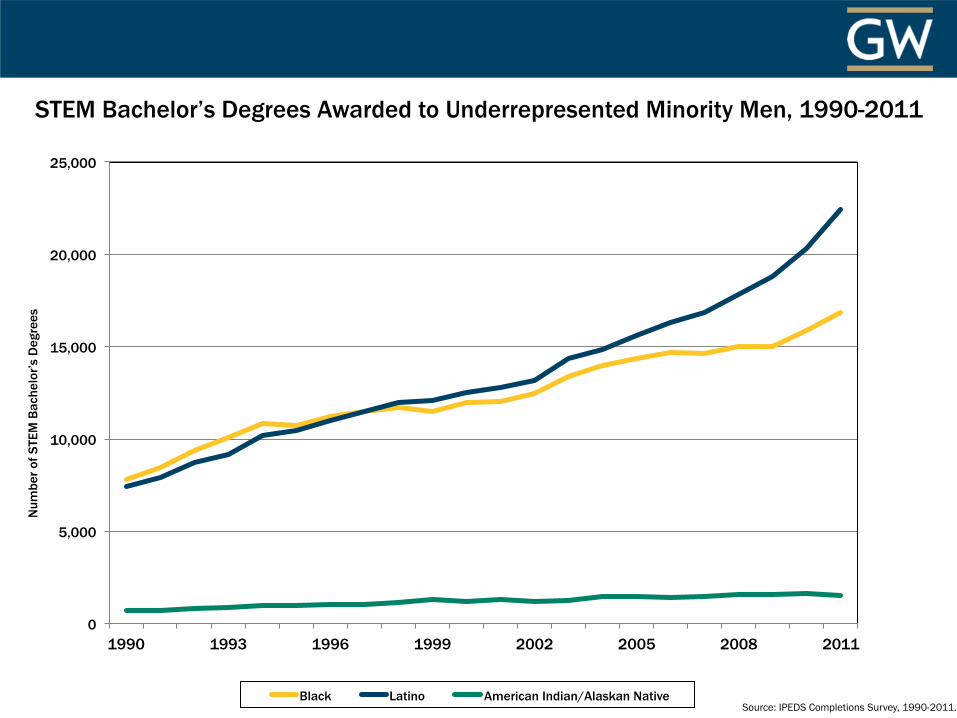
STEM Bachelor’s Degrees Awarded to Underrepresented Minority Men, 1990-2011
Source: IPEDS Completions Survey, 1990-2011.
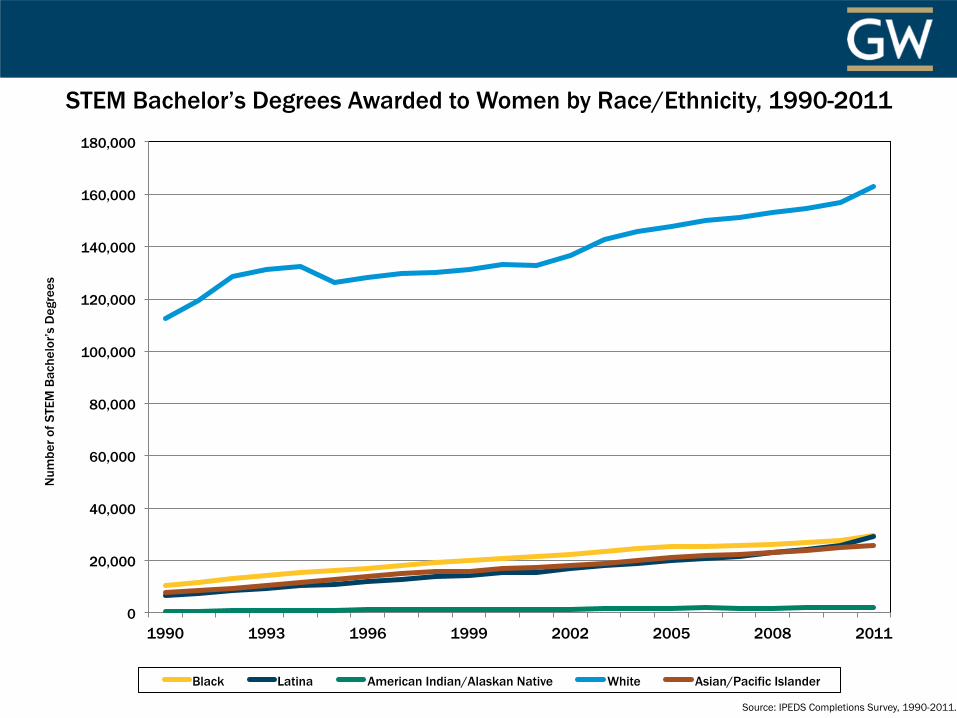
STEM Bachelor’s Degrees Awarded to Women by Race/Ethnicity, 1990-2011
0
20,000
40,000
60,000
80,000
100,000
120,000
140,000
160,000
180,000
1990 1993 1996 1999 2002 2005 2008 2011
Num
ber o
f STE
M B
ache
lor’s
Deg
rees
Black Latina American Indian/Alaskan Native White Asian/Pacific Islander
Source: IPEDS Completions Survey, 1990-2011.
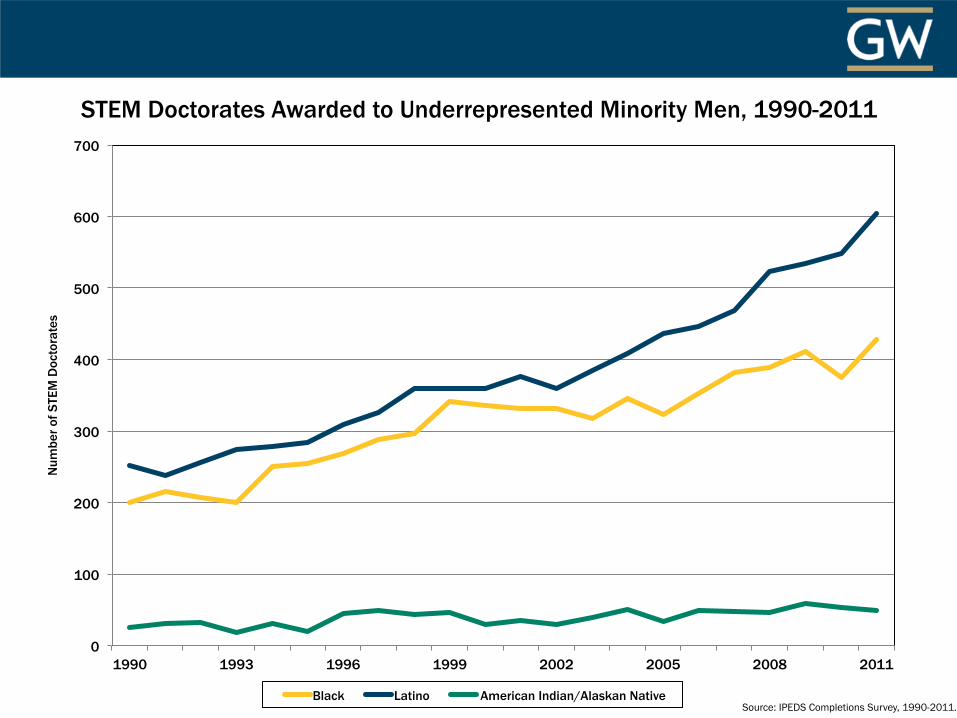
STEM Doctorates Awarded to Underrepresented Minority Men, 1990-2011
0
100
200
300
400
500
600
700
1990 1993 1996 1999 2002 2005 2008 2011
Num
ber o
f STE
M D
octo
rate
s
Black Latino American Indian/Alaskan Native Source: IPEDS Completions Survey, 1990-2011.
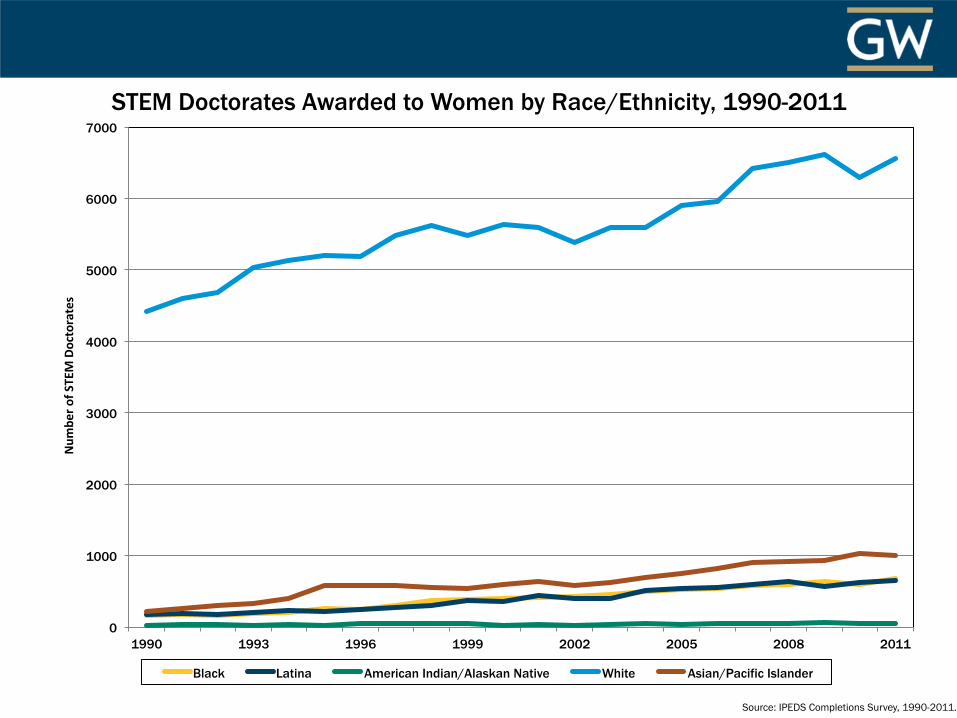
STEM Doctorates Awarded to Women by Race/Ethnicity, 1990-2011
0
1000
2000
3000
4000
5000
6000
7000
1990 1993 1996 1999 2002 2005 2008 2011
Num
ber o
f STEM Doctorates
Black Latina American Indian/Alaskan Native White Asian/Pacific Islander
Source: IPEDS Completions Survey, 1990-2011.
UNDEREPRESENTATION REMAINS A PROBLEM.
However…
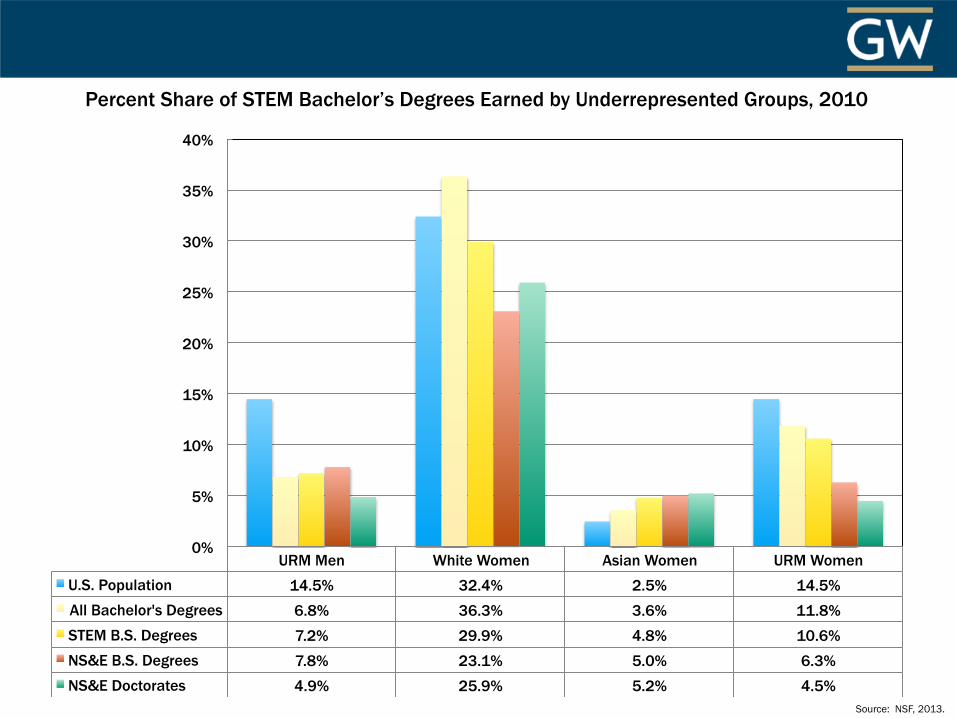
URM Men White Women Asian Women URM Women U.S. Population 14.5% 32.4% 2.5% 14.5% All Bachelor's Degrees 6.8% 36.3% 3.6% 11.8% STEM B.S. Degrees 7.2% 29.9% 4.8% 10.6% NS&E B.S. Degrees 7.8% 23.1% 5.0% 6.3% NS&E Doctorates 4.9% 25.9% 5.2% 4.5%
0%
5%
10%
15%
20%
25%
30%
35%
40%
Percent Share of STEM Bachelor’s Degrees Earned by Underrepresented Groups, 2010
Source: NSF, 2013.
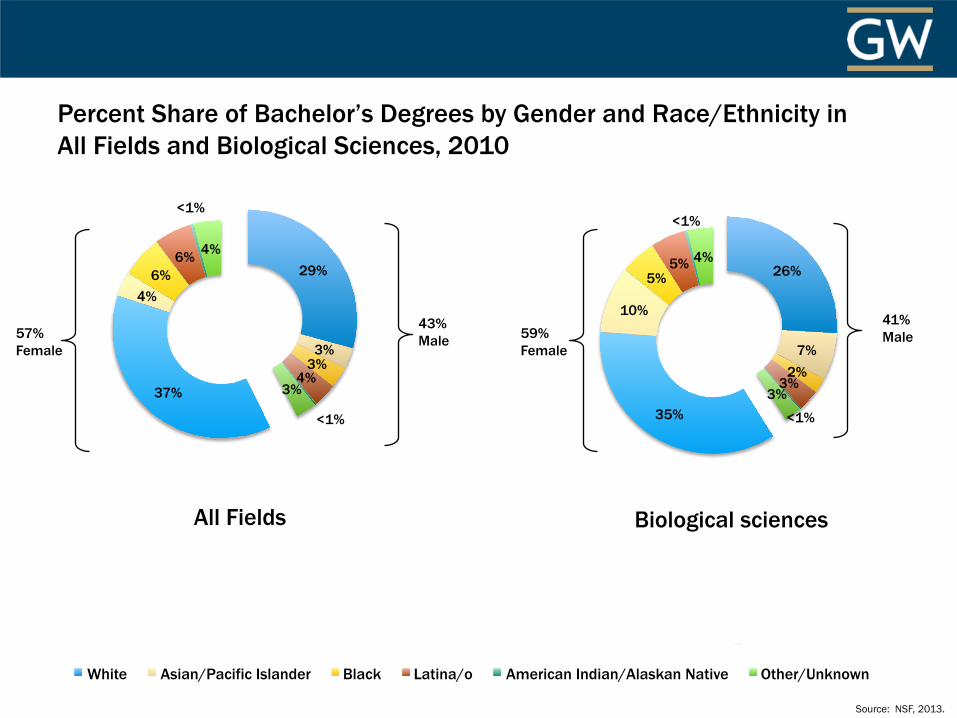
Percent Share of Bachelor’s Degrees by Gender and Race/Ethnicity in All Fields and Biological Sciences, 2010
37%
4% 6%
6%
<1%
4%
57% Female
29%
3% 3%
4%
<1%
3%
41% Male
26%
7% 2%
3%
<1%
3% 35%
10%
5% 5%
<1%
4%
59% Female
43% Male
All Fields Biological sciences
Source: NSF, 2013.
White Asian/Pacific Islander Black Latina/o American Indian/Alaskan Native Other/Unknown
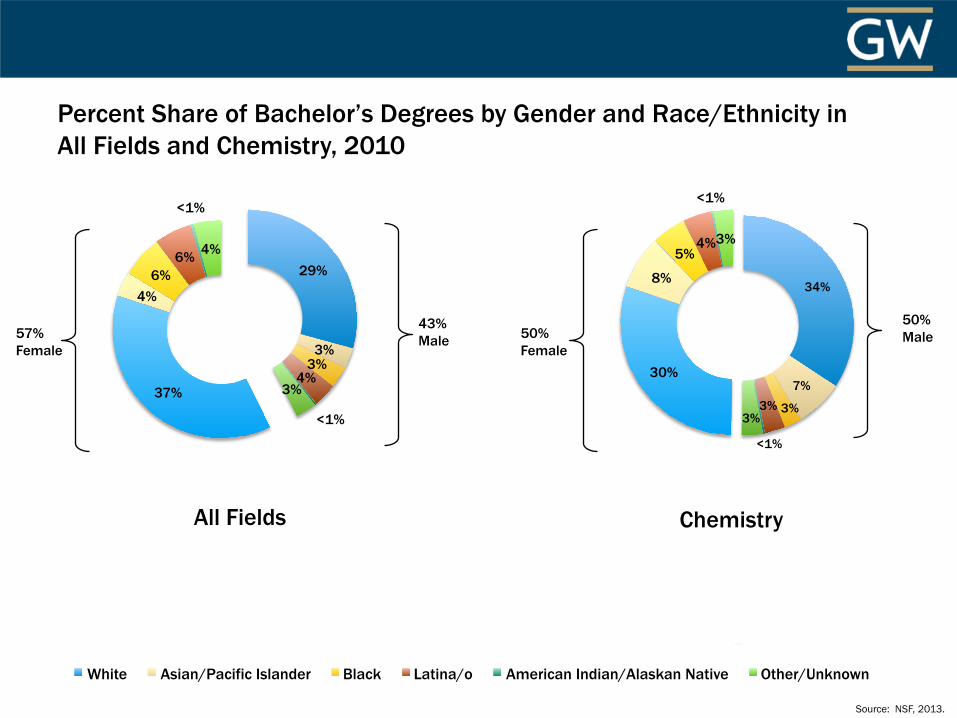
Percent Share of Bachelor’s Degrees by Gender and Race/Ethnicity in All Fields and Chemistry, 2010
37%
4% 6%
6%
<1%
4%
57% Female
29%
3% 3%
4%
<1%
3%
50% Male 50%
Female
43% Male
All Fields Chemistry
34%
7%
3% 3%
<1%
3%
30%
8%
5% 4%
<1%
3%
Source: NSF, 2013.
White Asian/Pacific Islander Black Latina/o American Indian/Alaskan Native Other/Unknown
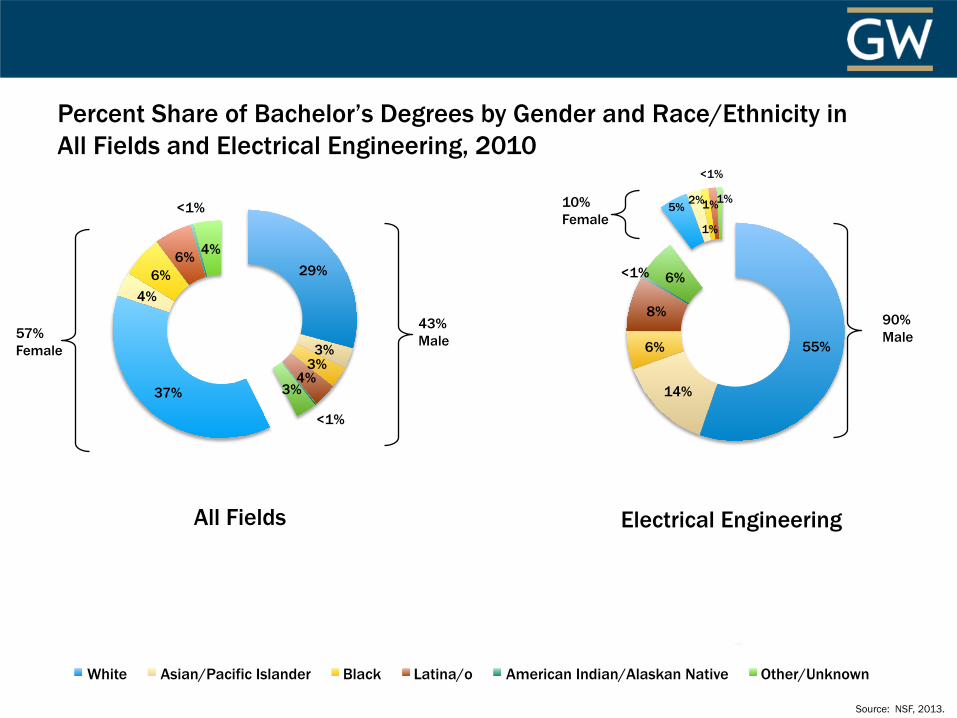
Percent Share of Bachelor’s Degrees by Gender and Race/Ethnicity in All Fields and Electrical Engineering, 2010
37%
4% 6%
6%
<1%
4%
57% Female
29%
3% 3%
4%
<1%
3%
90% Male
10% Female
43% Male
All Fields Electrical Engineering
5% 2%
1%
1%
<1%
1%
55%
14%
6%
8%
<1% 6%
Source: NSF, 2013.
White Asian/Pacific Islander Black Latina/o American Indian/Alaskan Native Other/Unknown
0%
1%
2%
3%
4%
5%
6%
7%
8%
9%
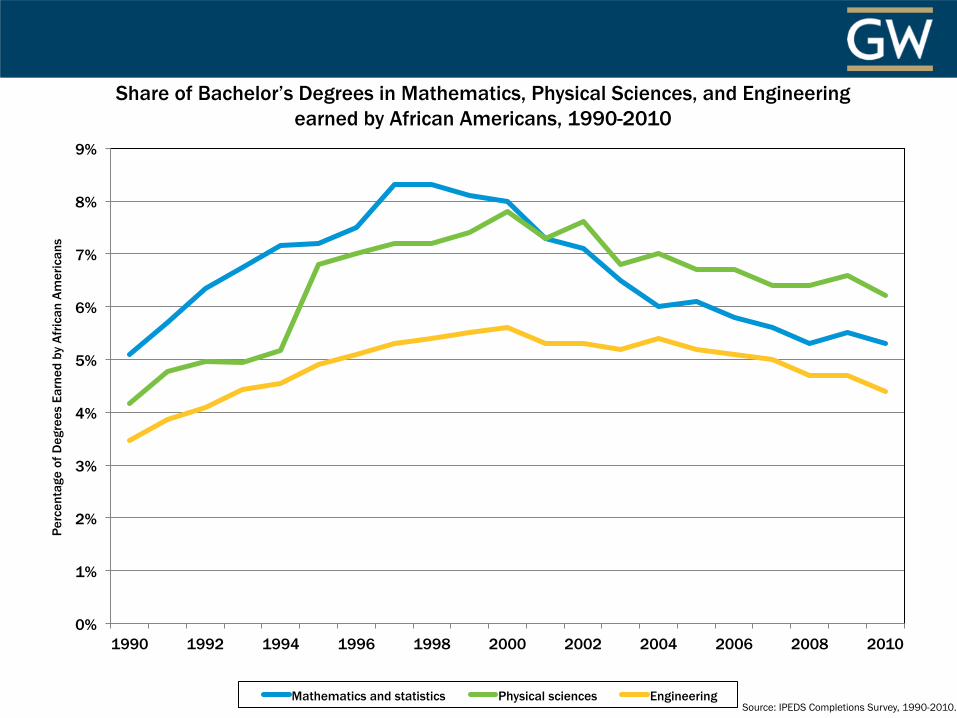
1990 1992 1994 1996 1998 2000 2002 2004 2006 2008 2010
Perc
enta
ge o
f Deg
rees
Ear
ned
by A
fric
an A
mer
ican
s
Mathematics and statistics Physical sciences Engineering
Share of Bachelor’s Degrees in Mathematics, Physical Sciences, and Engineering earned by African Americans, 1990-2010
Source: IPEDS Completions Survey, 1990-2010.
Broadening Participation in STEM
• Decades of efforts to broaden participation in STEM have yielded slow, but measurable change.
• Progress has been uneven across STEM disciplines and institutions, and for various populations.
• Do we need to alter our approach? If so, how?
THE APPROACH TO BROADENING PARTICIPATION IN STEM HAS EVOLVED OVER TIME.
Well, what have we tried?
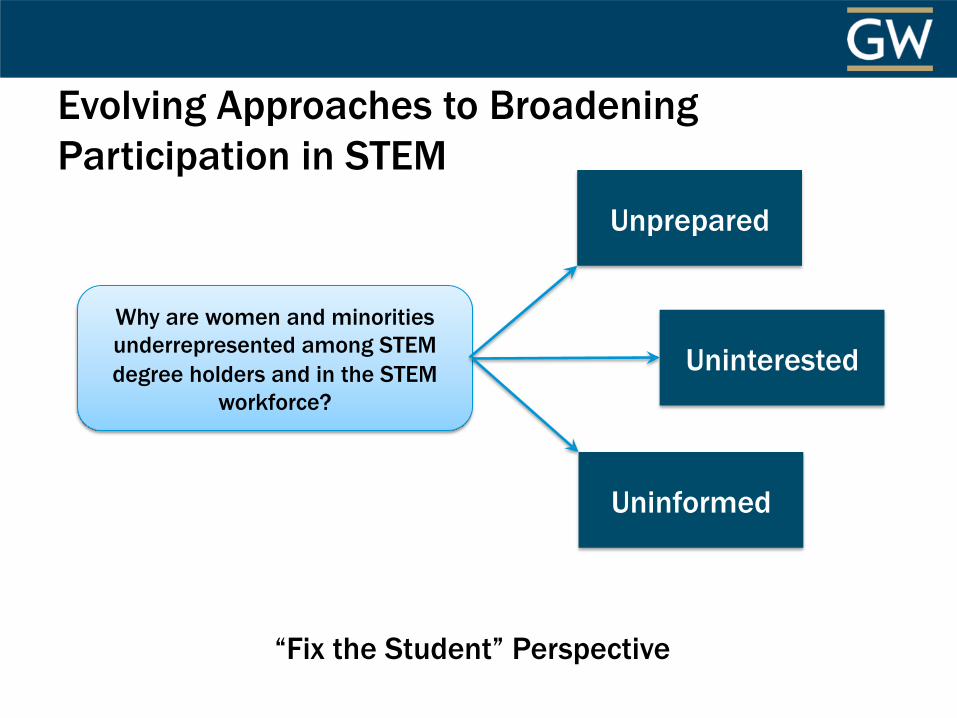
Evolving Approaches to Broadening Participation in STEM
Why are women and minorities underrepresented among STEM degree holders and in the STEM
workforce?
Unprepared
Uninterested
Uninformed
“Fix the Student” Perspective
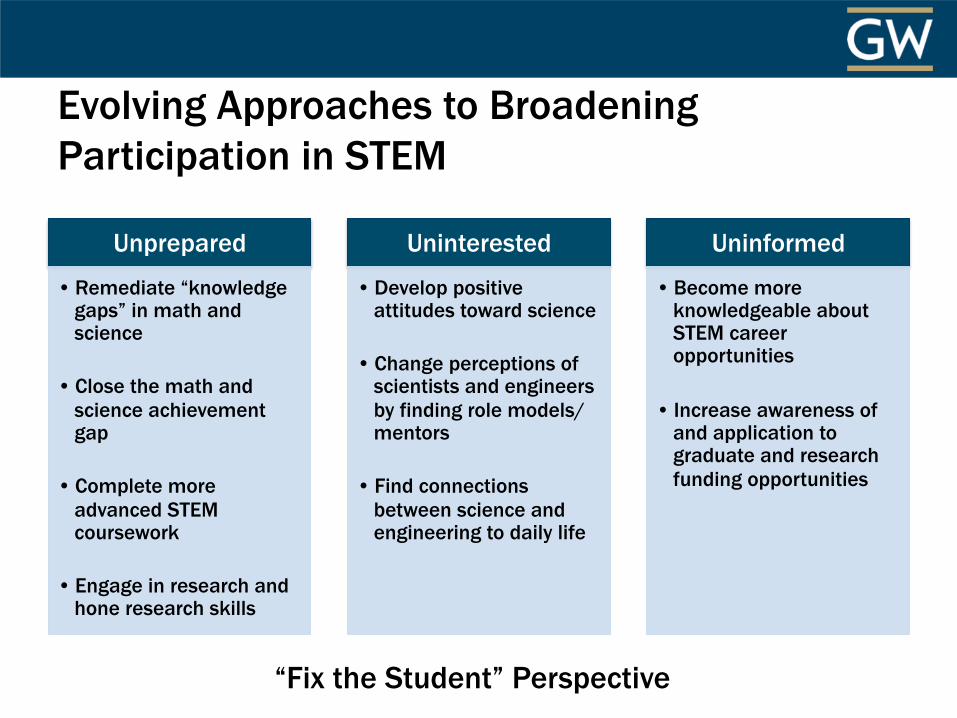
Evolving Approaches to Broadening Participation in STEM
Unprepared
• Remediate “knowledge gaps” in math and science
• Close the math and science achievement gap
• Complete more advanced STEM coursework
• Engage in research and hone research skills
Uninterested
• Develop positive attitudes toward science
• Change perceptions of scientists and engineers by finding role models/mentors
• Find connections between science and engineering to daily life
Uninformed
• Become more knowledgeable about STEM career opportunities
• Increase awareness of and application to graduate and research funding opportunities
“Fix the Student” Perspective
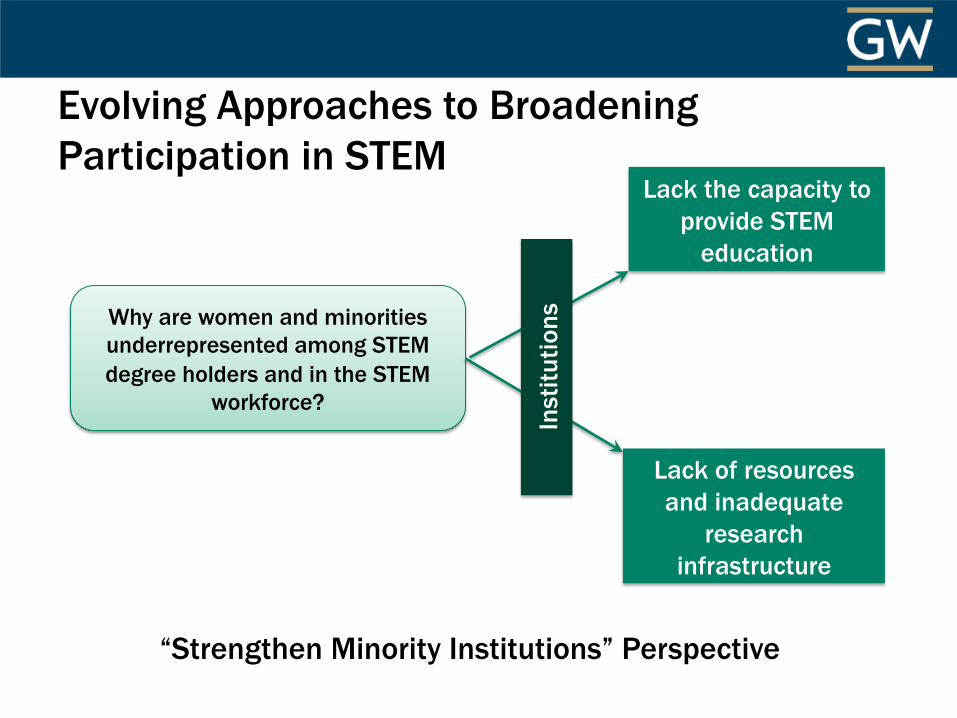
Evolving Approaches to Broadening Participation in STEM
Why are women and minorities underrepresented among STEM degree holders and in the STEM
workforce?
“Strengthen Minority Institutions” Perspective
Lack the capacity to provide STEM
education
Lack of resources and inadequate
research infrastructure
Inst
itutio
ns
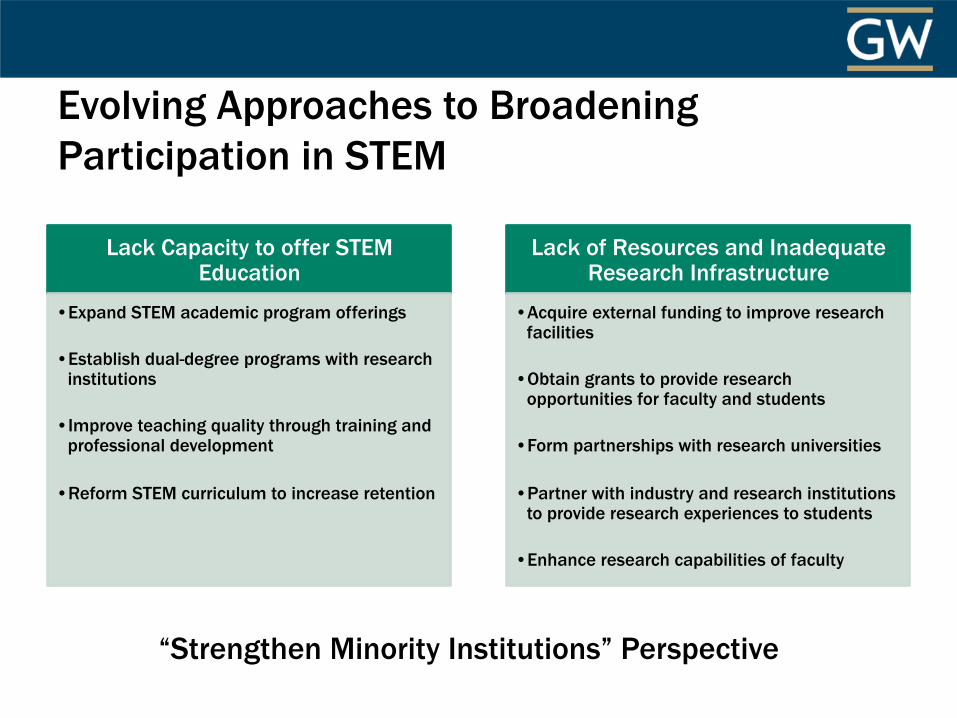
Evolving Approaches to Broadening Participation in STEM
Lack Capacity to offer STEM Education
• Expand STEM academic program offerings
• Establish dual-degree programs with research institutions
• Improve teaching quality through training and professional development
• Reform STEM curriculum to increase retention
Lack of Resources and Inadequate Research Infrastructure
• Acquire external funding to improve research facilities
• Obtain grants to provide research opportunities for faculty and students
• Form partnerships with research universities
• Partner with industry and research institutions to provide research experiences to students
• Enhance research capabilities of faculty
“Strengthen Minority Institutions” Perspective
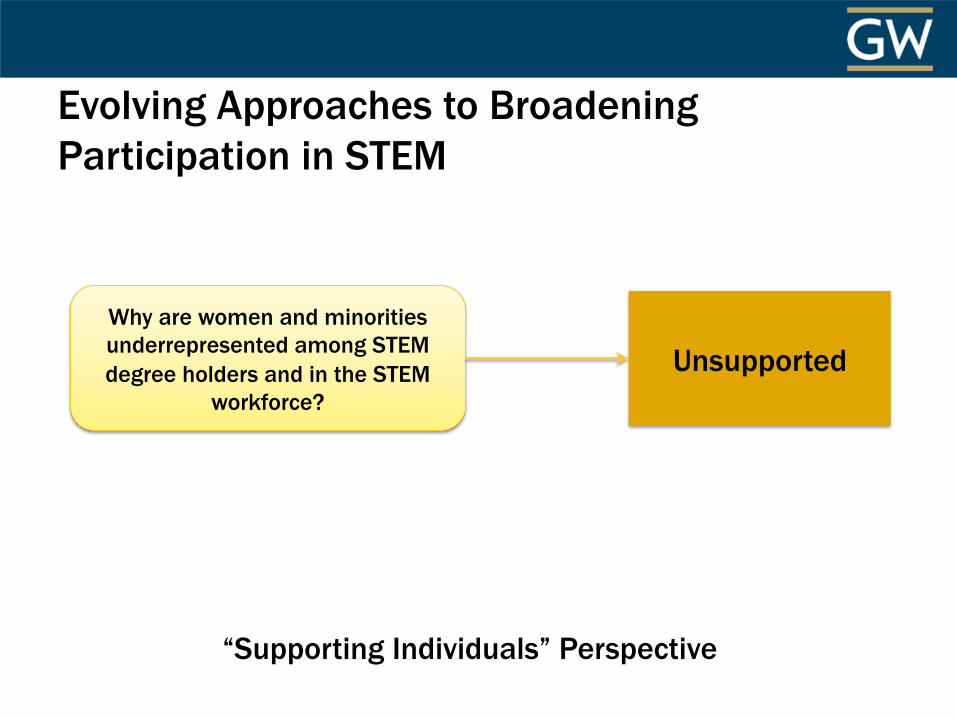
Evolving Approaches to Broadening Participation in STEM
Why are women and minorities underrepresented among STEM degree holders and in the STEM
workforce?
“Supporting Individuals” Perspective
Unsupported
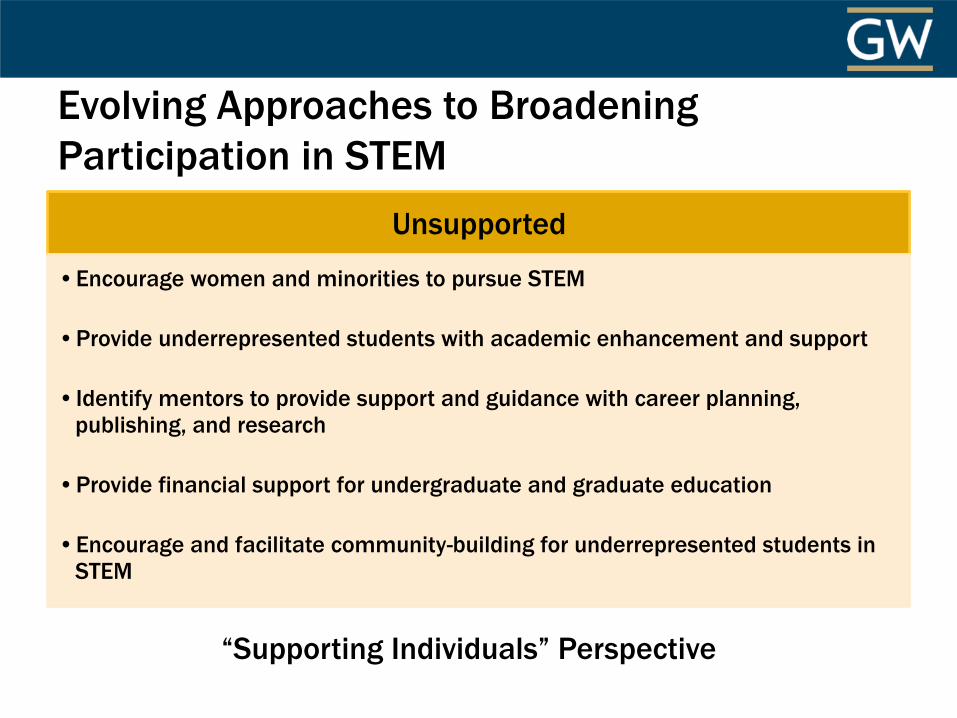
Evolving Approaches to Broadening Participation in STEM
Unsupported
• Encourage women and minorities to pursue STEM
• Provide underrepresented students with academic enhancement and support
• Identify mentors to provide support and guidance with career planning, publishing, and research
• Provide financial support for undergraduate and graduate education
• Encourage and facilitate community-building for underrepresented students in STEM
“Supporting Individuals” Perspective
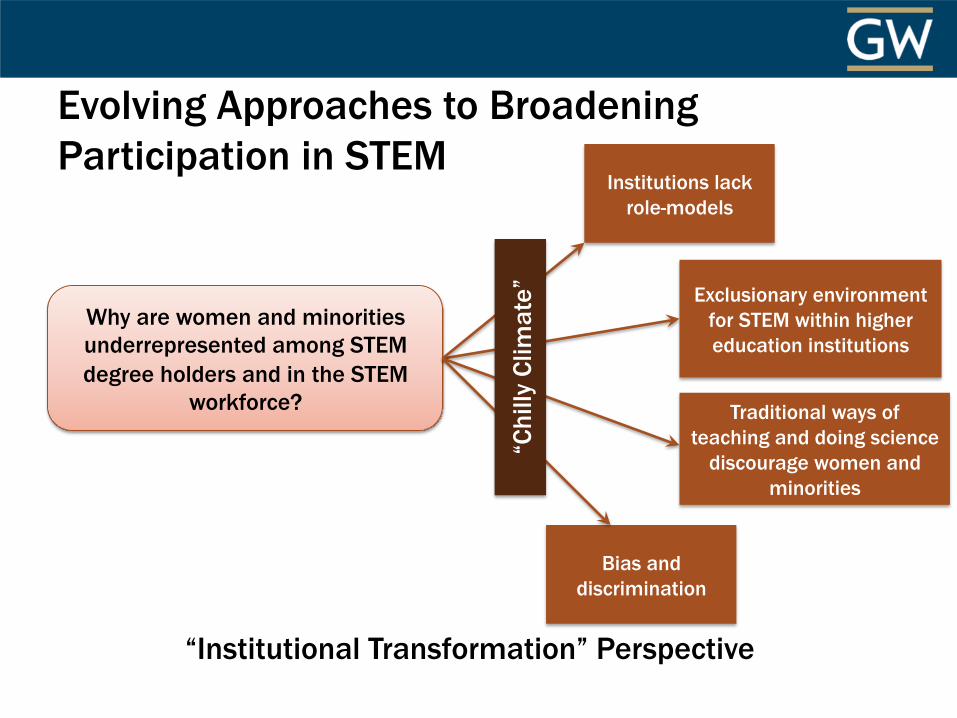
Evolving Approaches to Broadening Participation in STEM
Why are women and minorities underrepresented among STEM degree holders and in the STEM
workforce?
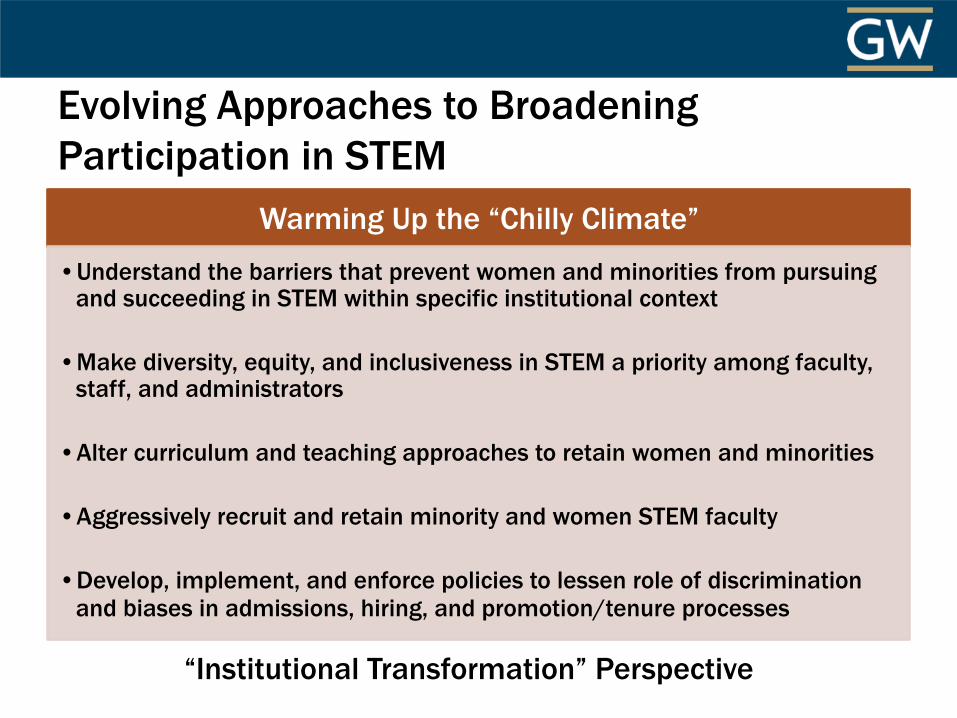
“Institutional Transformation” Perspective
Exclusionary environment for STEM within higher education institutions
Traditional ways of teaching and doing science
discourage women and minorities
Institutions lack role-models
Bias and discrimination
“Chi
lly C
limat
e”
Evolving Approaches to Broadening Participation in STEM
Warming Up the “Chilly Climate”
• Understand the barriers that prevent women and minorities from pursuing and succeeding in STEM within specific institutional context
• Make diversity, equity, and inclusiveness in STEM a priority among faculty, staff, and administrators
• Alter curriculum and teaching approaches to retain women and minorities
• Aggressively recruit and retain minority and women STEM faculty
• Develop, implement, and enforce policies to lessen role of discrimination and biases in admissions, hiring, and promotion/tenure processes
“Institutional Transformation” Perspective

TOWARD A MORE COMPREHENSIVE APPROACH.
So, what ought to change?
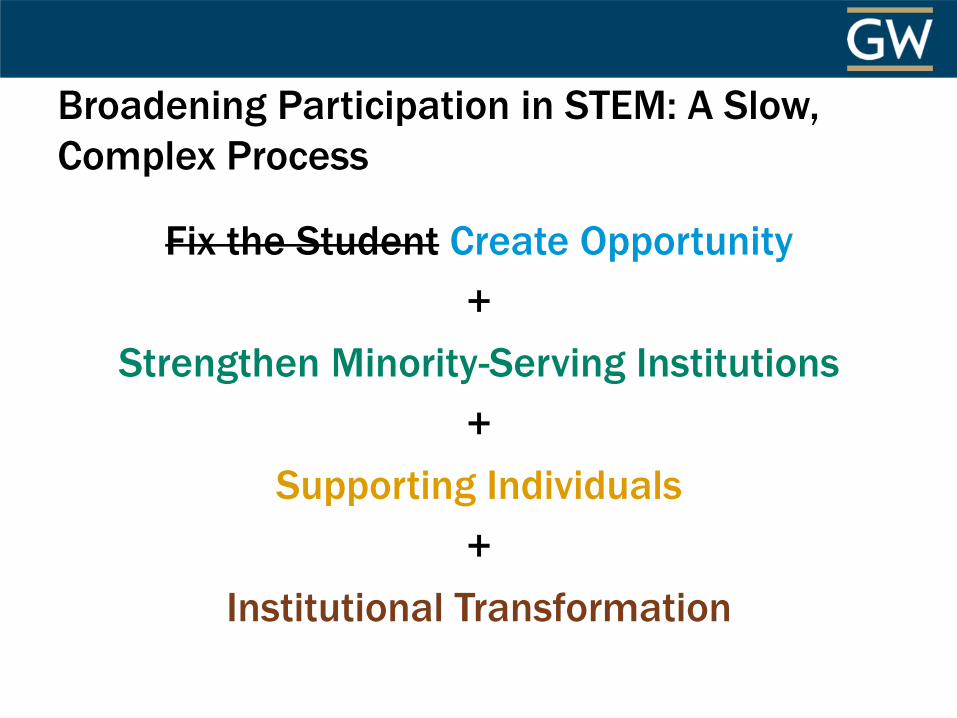
Broadening Participation in STEM: A Slow, Complex Process
Fix the Student Create Opportunity +
Strengthen Minority-Serving Institutions +
Supporting Individuals +
Institutional Transformation
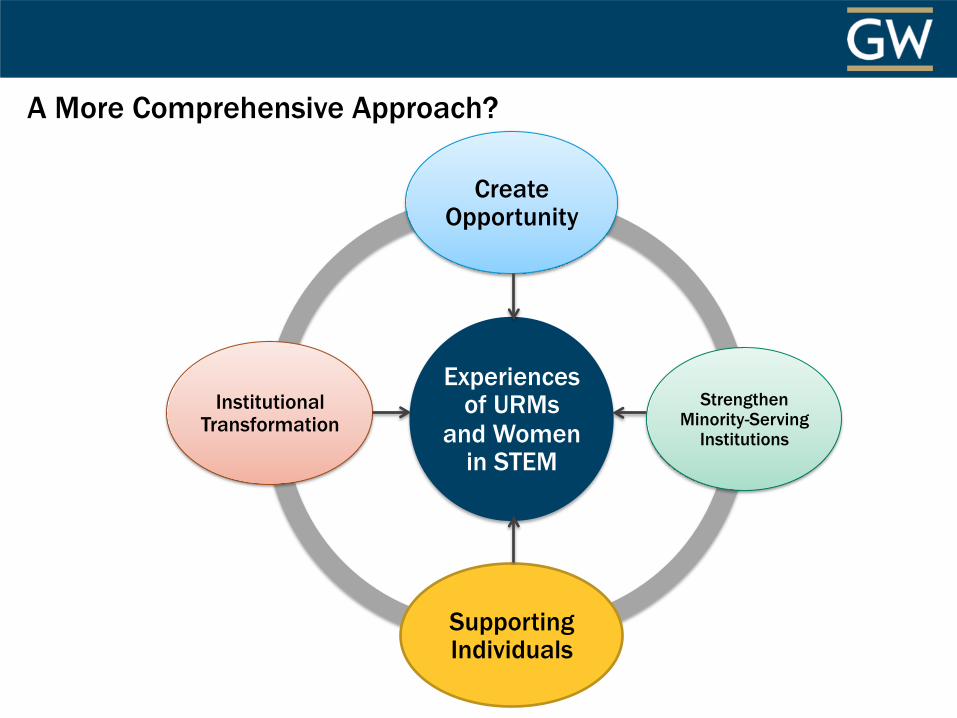
A More Comprehensive Approach?
Experiences of URMs
and Women in STEM
Create Opportunity
Strengthen Minority-Serving
Institutions
Supporting Individuals
Institutional Transformation
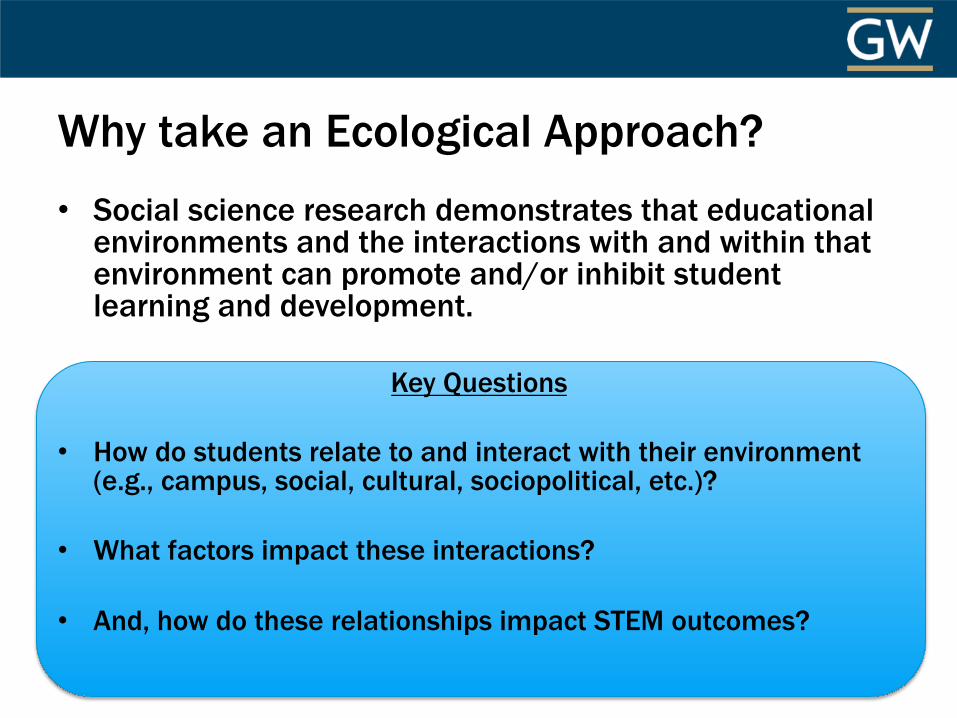
Why take an Ecological Approach? • Social science research demonstrates that educational
environments and the interactions with and within that environment can promote and/or inhibit student learning and development.
Key Questions
• How do students relate to and interact with their environment (e.g., campus, social, cultural, sociopolitical, etc.)?
• What factors impact these interactions?
• And, how do these relationships impact STEM outcomes?
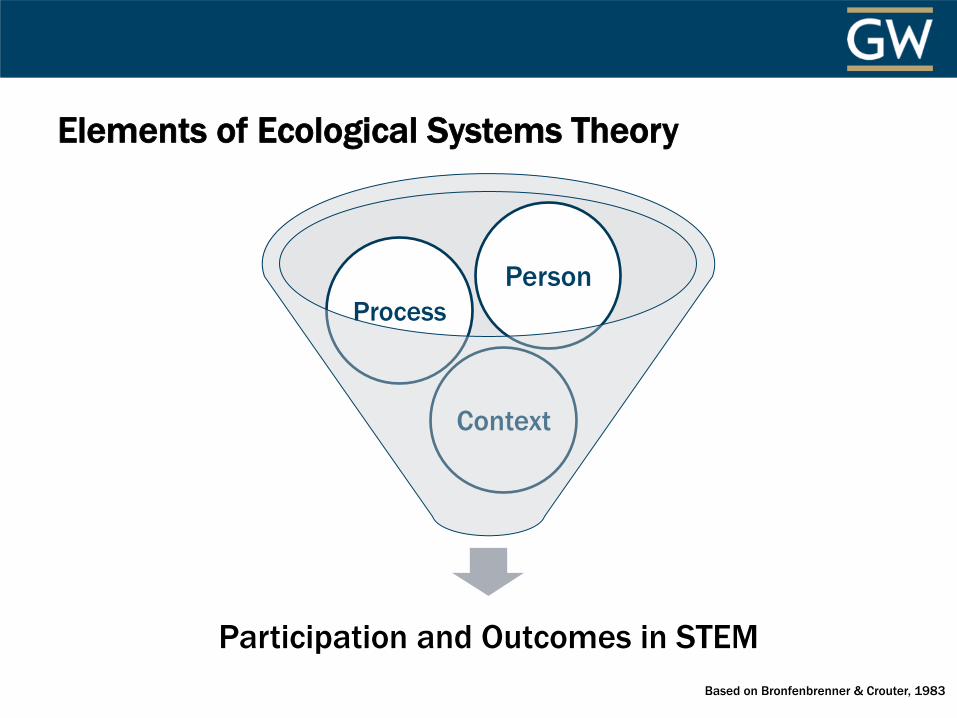
Elements of Ecological Systems Theory
Participation and Outcomes in STEM
Context
Process Person
Based on Bronfenbrenner & Crouter, 1983
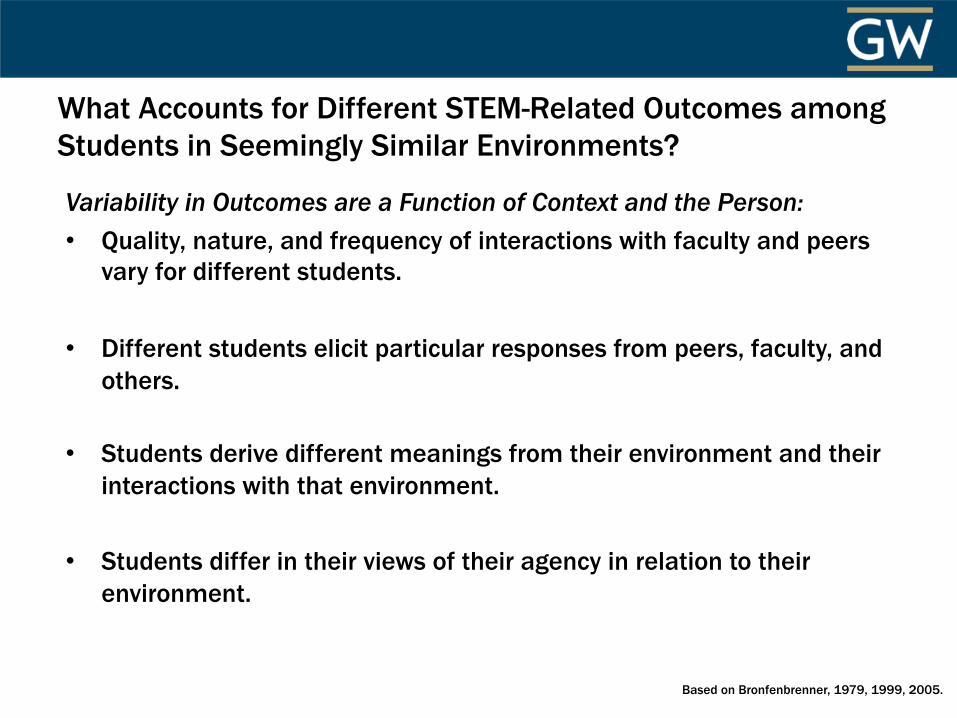
What Accounts for Different STEM-Related Outcomes among Students in Seemingly Similar Environments?
Variability in Outcomes are a Function of Context and the Person: • Quality, nature, and frequency of interactions with faculty and peers
vary for different students.
• Different students elicit particular responses from peers, faculty, and others.
• Students derive different meanings from their environment and their interactions with that environment.
• Students differ in their views of their agency in relation to their environment.
Based on Bronfenbrenner, 1979, 1999, 2005.
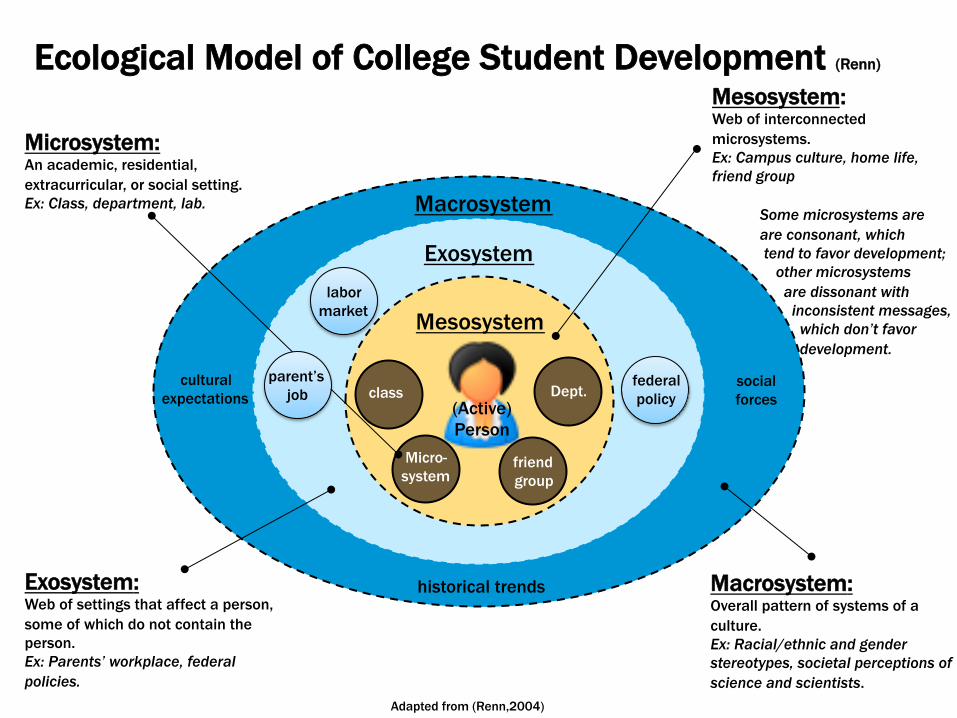
Ecological Model of College Student Development (Renn)
Dept.
Mesosystem
Micro- system
friend group
Exosystem
Macrosystem
federal policy
cultural expectations
social forces
historical trends
Microsystem: An academic, residential, extracurricular, or social setting. Ex: Class, department, lab.
Mesosystem: Web of interconnected microsystems. Ex: Campus culture, home life, friend group Some microsystems are
are consonant, which tend to favor development; other microsystems are dissonant with inconsistent messages, which don’t favor development.
Exosystem: Web of settings that affect a person, some of which do not contain the person. Ex: Parents’ workplace, federal policies.
Macrosystem: Overall pattern of systems of a culture. Ex: Racial/ethnic and gender stereotypes, societal perceptions of science and scientists.
class parent’s
job
Adapted from (Renn,2004)
(Active) Person
labor market
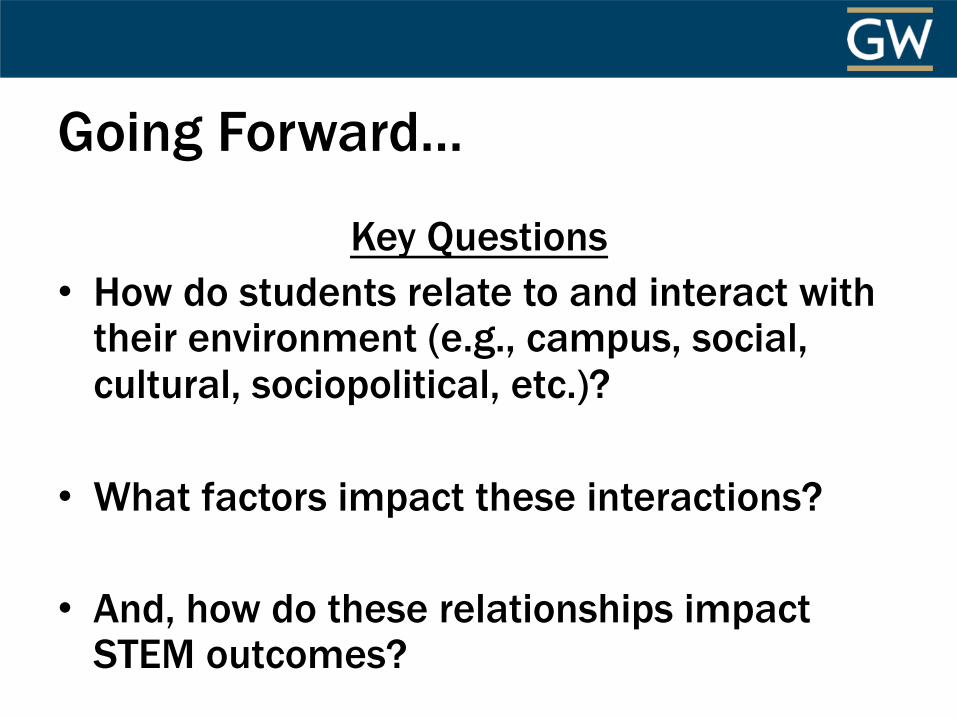
Going Forward…
Key Questions • How do students relate to and interact with
their environment (e.g., campus, social, cultural, sociopolitical, etc.)?
• What factors impact these interactions?
• And, how do these relationships impact STEM outcomes?