Embed Size (px)
Citation preview

8/2/2019 DR Mainland Southwest Employment Projection 2010 2015
http://slidepdf.com/reader/full/dr-mainland-southwest-employment-projection-2010-2015 1/43
British ColumbiaRegional Employment ProjectionsMainland/Southwest Development Region
2010 to 2015

8/2/2019 DR Mainland Southwest Employment Projection 2010 2015
http://slidepdf.com/reader/full/dr-mainland-southwest-employment-projection-2010-2015 2/43
8/2/2019 DR Mainland Southwest Employment Projection 2010 2015
http://slidepdf.com/reader/full/dr-mainland-southwest-employment-projection-2010-2015 3/43
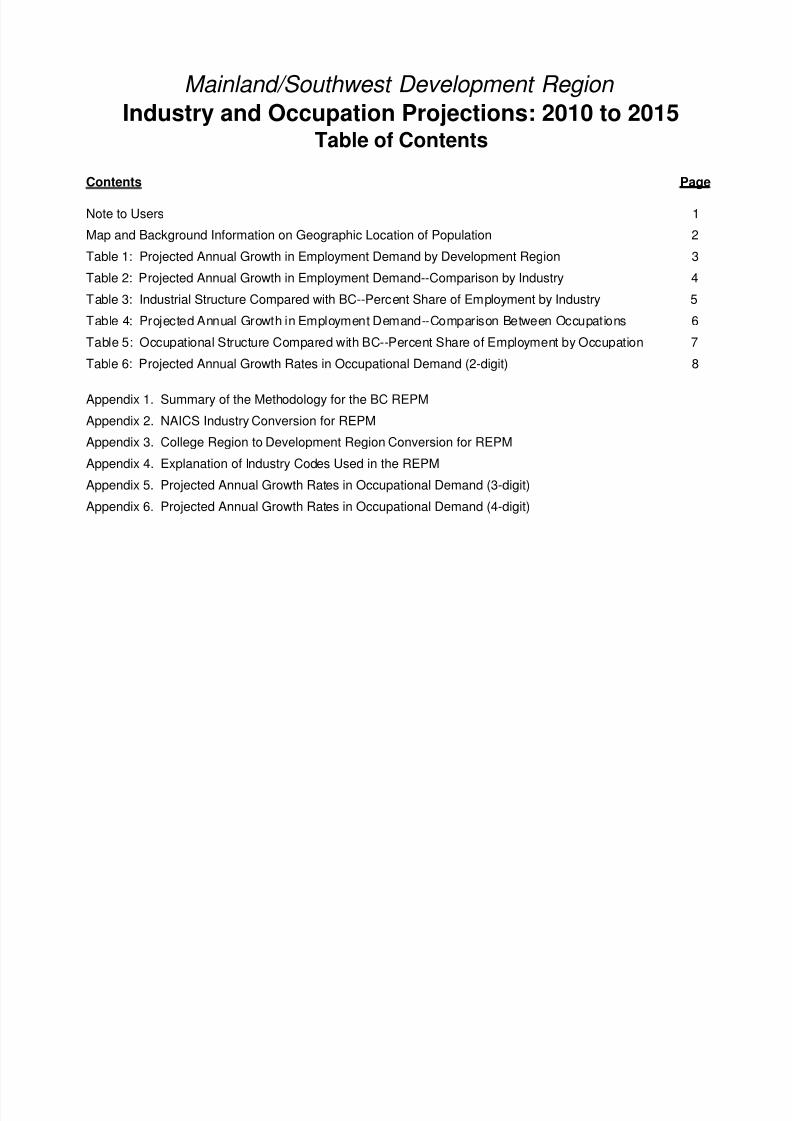
Contents
Note to Users 1
Map and Background Information on Geographic Location of Population 2
Table 1: Projected Annual Growth in Employment Demand by Development Region 3
Table 2: Projected Annual Growth in Employment Demand--Comparison by Industry 4
Table 3: Industrial Structure Compared with BC--Percent Share of Employment by Industry 5
Table 4: Projected Annual Growth in Employment Demand--Comparison Between Occupations 6
Table 5: Occupational Structure Compared with BC--Percent Share of Employment by Occupation 7
Table 6: Projected Annual Growth Rates in Occupational Demand (2-digit) 8
Appendix 1. Summary of the Methodology for the BC REPM
Appendix 2. NAICS Industry Conversion for REPM
Appendix 3. College Region to Development Region Conversion for REPM
Appendix 4. Explanation of Industry Codes Used in the REPM
Appendix 5. Projected Annual Growth Rates in Occupational Demand (3-digit)
Appendix 6. Projected Annual Growth Rates in Occupational Demand (4-digit)
Mainland/Southwest Development Region
Industry and Occupation Projections: 2010 to 2015Table of Contents
Page

8/2/2019 DR Mainland Southwest Employment Projection 2010 2015
http://slidepdf.com/reader/full/dr-mainland-southwest-employment-projection-2010-2015 4/43
Prepared by: BC Stats Page 1
Note to Users
All assumptions relating to employment are based on past conditions, modified whereverpossible to take into consideration future changes. The resulting employment projections are notnecessarily what will be, but rather what could be, given the realization of these conditions. It iscertainly possible that unforeseen changes in factors such as economic development,
government policy, or land use and zoning will affect future employment. Consequently, theprojections should only be regarded as one possible scenario on the future size and distributionof the workforce.
It is important for users to understand that the same set of industries and occupations arereported for each of the 7 Development Regions, regardless of the importance of theseindustries to any particular regional economy. Some of these industries, while significant to theprovince overall, may have a very small presence in a particular region. For example, theBeverage Manufacturing industry could show up as the highest growth rate for each region ofthe province because the wine industry is expected to grow, but this would mean theThompson-Okanagan Development Region would gain hundreds of jobs while the Northeastwould gain 5 to 10 jobs at the most. For this reason, growth rates should be viewed in the
context of the size of the occupational or industry grouping to clarify the number of jobs beingcreated or lost and the potential impact the change would have on the local economy.
For information on the Regional Districts contained in the Development Regions, seeAppendix 3: REGIONAL DISTRICT TO DEVELOPMENT REGION CONVERSION
The March 2011 version of the Major Projects Inventory was used in the development of theemployment projections for the 2010-2015 version of the REPM. A full listing of all the MajorProjects under construction or at the proposal stage can be found athttp://www.bcstats.gov.bc.ca/pubs/pr_mproj.asp The British Columbia level employment projections are based on the B.C. Labour Market
Scenario Model (BCLMSM). The BCLMSM project was undertaken by the Ministry of Jobs,Tourism and Innovation (JTI), in partnership with BC Stats and the Ministry of Finance.
Funding for this project was made possible
through the Labour Market Information initiative
under the Canada-British Columbia Labour Market Agreement (LMA), which is administered
for B.C. by the Ministry of Jobs, Tourism and Innovation.
8/2/2019 DR Mainland Southwest Employment Projection 2010 2015
http://slidepdf.com/reader/full/dr-mainland-southwest-employment-projection-2010-2015 5/43
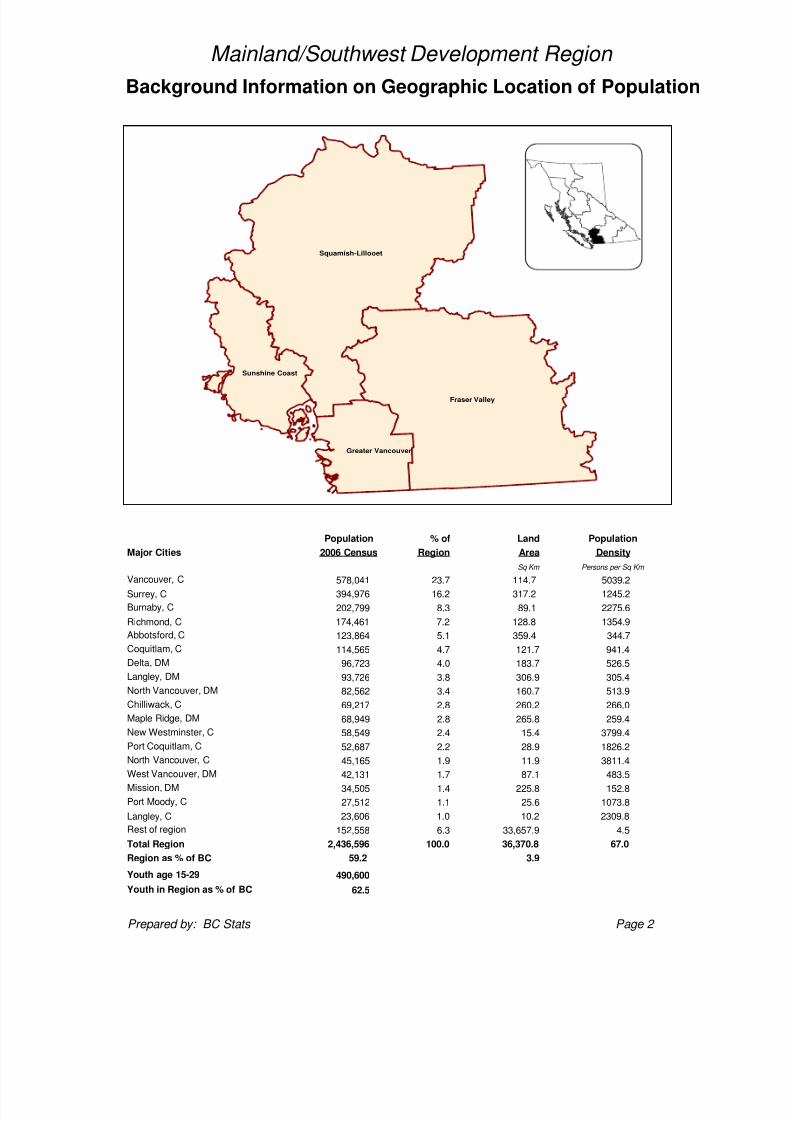
% of Land
Major Cities Region Area
Sq Km
Vancouver, C 578,041 23.7 114.7 5039.2
Surrey, C 394,976 16.2 317.2 1245.2
Burnaby, C 202,799 8.3 89.1 2275.6
Richmond, C 174,461 7.2 128.8 1354.9
Abbotsford, C 123,864 5.1 359.4 344.7
Coquitlam, C 114,565 4.7 121.7 941.4
Delta, DM 96,723 4.0 183.7 526.5
Langley, DM 93,726 3.8 306.9 305.4
North Vancouver, DM 82,562 3.4 160.7 513.9
Chilliwack, C 69,217 2.8 260.2 266.0
Maple Ridge, DM 68,949 2.8 265.8 259.4
New Westminster, C 58,549 2.4 15.4 3799.4
Port Coquitlam, C 52,687 2.2 28.9 1826.2
North Vancouver, C 45,165 1.9 11.9 3811.4
West Vancouver, DM 42,131 1.7 87.1 483.5
Mission, DM 34,505 1.4 225.8 152.8
Port Moody, C 27,512 1.1 25.6 1073.8
Langley, C 23,606 1.0 10.2 2309.8
Rest of region 152,558 6.3 33,657.9 4.5
Total Region 2,436,596 100.0 36,370.8 67.0
Region as % of BC 59.2 3.9
Youth age 15-29 490,600
Youth in Region as % of BC 62.5
Prepared by: BC Stats Page 2
Background Information on Geographic Location of Population
Mainland/Southwest Development Region
Persons per Sq Km
Population Population
Density2006 Census
Squamish-Lillooet
Sunshine Coast
Greater Vancouver
Fraser Valley

8/2/2019 DR Mainland Southwest Employment Projection 2010 2015
http://slidepdf.com/reader/full/dr-mainland-southwest-employment-projection-2010-2015 6/43
Avg Annual % Chng
Over 5 Years
Development Region* 2010 2015 2010 to 2015
Vancouver Island/Coast 383,780 414,360 1.6
Mainland/Southwest 1,388,400 1,520,570 1.9
Thompson-Okanagan 257,050 272,550 1.2
Kootenay 69,770 76,730 2.0
Cariboo 79,550 84,110 1.1
North Coast & Nechako 41,000 49,030 3.9
Northeast 36,860 41,880 2.7
British Columbia 2,256,400 2,459,230 1.8
* See Appendix 3 for details on the Regional Districts included in the Development Regions.
Prepared by: BC Stats Page 3
Estimated Employment
Projected Annual Growth in Employment Demand
by Development Region*
Mainland/Southwest Development Region
3.9
2.7
2.01.9
1.6
1.21.1
0.0
0.5
1.0
1.5
2.0
2.5
3.0
3.5
4.0
4.5
N . C s t / N e c h
N o r t h e a s t
K o o t e n a y
M n l n d / S W
V I / C o a s t
T h o m p / O k a n
C a r i b o o
Percent
8/2/2019 DR Mainland Southwest Employment Projection 2010 2015
http://slidepdf.com/reader/full/dr-mainland-southwest-employment-projection-2010-2015 7/43
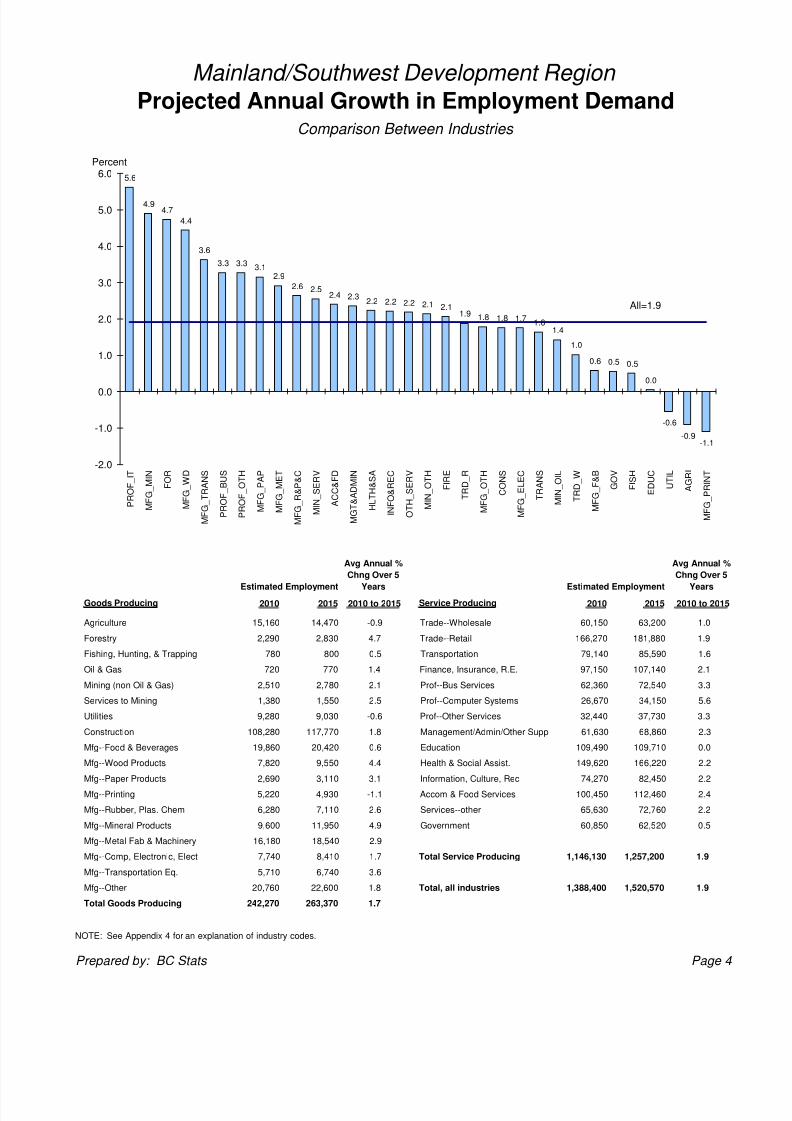
2010 2015 2010 to 2015 2010 2015 2010 to 2015
Agriculture 15,160 14,470 -0.9 Trade--Wholesale 60,150 63,200 1.0
Forestry 2,290 2,830 4.7 Trade--Retail 166,270 181,880 1.9
Fishing, Hunting, & Trapping 780 800 0.5 Transportation 79,140 85,590 1.6
Oil & Gas 720 770 1.4 Finance, Insurance, R.E. 97,150 107,140 2.1
Mining (non Oil & Gas) 2,510 2,780 2.1 Prof--Bus Services 62,360 72,540 3.3
Services to Mining 1,380 1,550 2.5 Prof--Computer Systems 26,670 34,150 5.6
Utilities 9,280 9,030 -0.6 Prof--Other Services 32,440 37,730 3.3
Construction 108,280 117,770 1.8 Management/Admin/Other Supp 61,630 68,860 2.3
Mfg--Food & Beverages 19,860 20,420 0.6 Education 109,490 109,710 0.0
Mfg--Wood Products 7,820 9,550 4.4 Health & Social Assist. 149,620 166,220 2.2
Mfg--Paper Products 2,690 3,110 3.1 Information, Culture, Rec 74,270 82,450 2.2
Mfg--Printing 5,220 4,930 -1.1 Accom & Food Services 100,450 112,460 2.4
Mfg--Rubber, Plas. Chem 6,280 7,110 2.6 Services--other 65,630 72,760 2.2
Mfg--Mineral Products 9,600 11,950 4.9 Government 60,850 62,520 0.5
Mfg--Metal Fab & Machinery 16,180 18,540 2.9
Mfg--Comp, Electronic, Elect 7,740 8,410 1.7 1,146,130 1,257,200 1.9
Mfg--Transportation Eq. 5,710 6,740 3.6
Mfg--Other 20,760 22,600 1.8 1,388,400 1,520,570 1.9
242,270 263,370 1.7
NOTE: See Appendix 4 for an explanation of industry codes.
Prepared by: BC Stats Page 4
Total Service Producing
Total Goods Producing
Service Producing
Total, all industries
Mainland/Southwest Development Region
Projected Annual Growth in Employment DemandComparison Between Industries
Goods Producing
Avg Annual %
Chng Over 5
Years
Avg Annual %
Chng Over 5
YearsEstimated Employment Estimated Employment
5.6
4.94.7
4.4
3.6
3.3 3.33.1
2.9
2.6 2.52.4 2.3
2.2 2.2 2.2 2.1 2.11.9 1.8 1.8 1.7
1.61.4
1.0
0.6 0.5 0.5
0.0
-0.6
-0.9-1.1
All=1.9
-2.0
-1.0
0.0
1.0
2.0
3.0
4.0
5.0
6.0
P R O F_
I T
M F G_
M I N
F O R
M F G_
W D
M F G_
T R A N S
P R O F_
B U S
P R O F_
O T H
M F G_
P A P
M F G_
M E T
M F G_
R & P & C
M I N_
S E R V
A C C & F D
M G T & A D M I N
H L T H & S A
I N F O & R E C
O T H_
S E R V
M I N_
O T H
F I R E
T R D_
R
M F G_
O T H
C O N S
M F G_
E L E C
T R A N S
M I N_
O I L
T R D_
W
M F G_
F & B
G O V
F I S H
E D U C
U T I L
A G R I
M F G_
P R I N T
Percent
8/2/2019 DR Mainland Southwest Employment Projection 2010 2015
http://slidepdf.com/reader/full/dr-mainland-southwest-employment-projection-2010-2015 8/43
NOTE: See Appendix 4 for an explanation of industry codes.
Prepared by: BC Stats Page 5
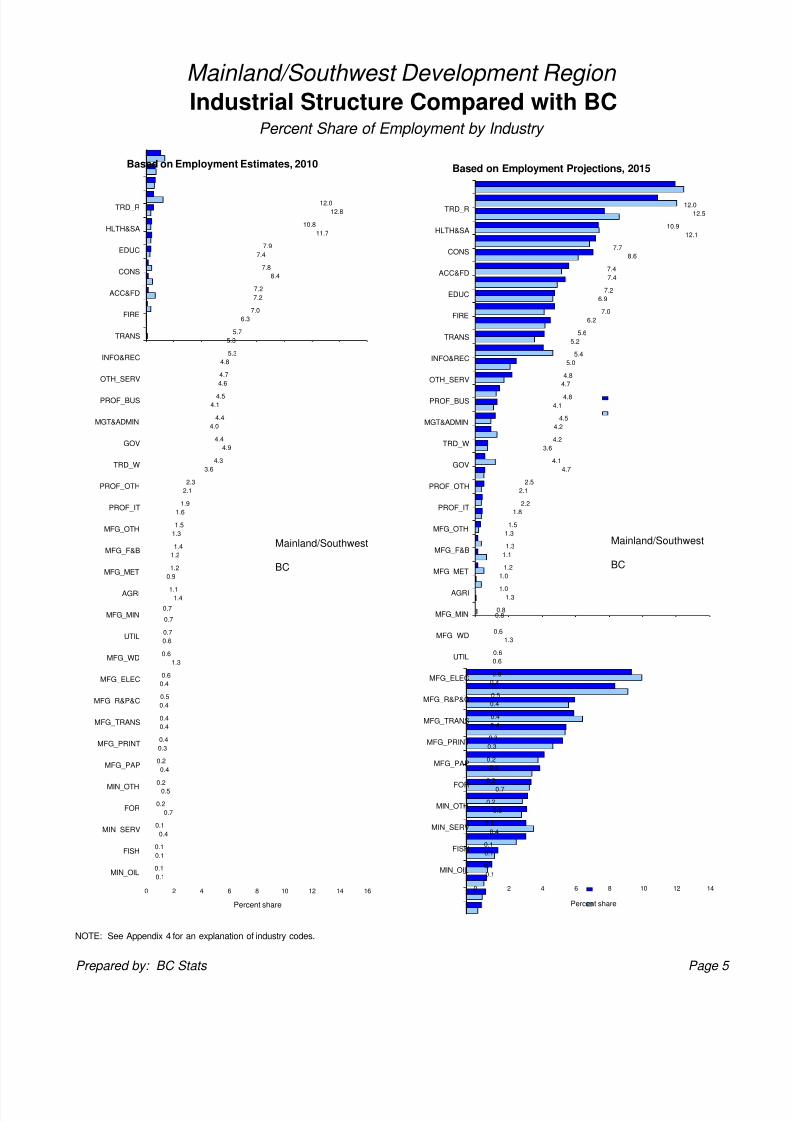
Mainland/Southwest Development Region
Industrial Structure Compared with BCPercent Share of Employment by Industry
0.1
0.1
0.4
0.7
0.5
0.4
0.3
0.4
0.4
0.4
1.3
0.6
0.7
1.4
0.9
1.2
1.3
1.6
2.1
3.6
4.9
4.0
4.1
4.6
4.8
5.3
6.3
7.2
8.4
7.4
11.7
12.8
0.1
0.1
0.1
0.2
0.2
0.2
0.4
0.4
0.5
0.6
0.6
0.7
0.7
1.1
1.2
1.4
1.5
1.9
2.3
4.3
4.4
4.4
4.5
4.7
5.3
5.7
7.0
7.2
7.8
7.9
10.8
12.0
0 2 4 6 8 10 12 14 16
MIN_OIL
FISH
MIN_SERV
FOR
MIN_OTH
MFG_PAP
MFG_PRINT
MFG_TRANS
MFG_R&P&C
MFG_ELEC
MFG_WD
UTIL
MFG_MIN
AGRI
MFG_MET
MFG_F&B
MFG_OTH
PROF_IT
PROF_OTH
TRD_W
GOV
MGT&ADMIN
PROF_BUS
OTH_SERV
INFO&REC
TRANS
FIRE
ACC&FD
CONS
EDUC
HLTH&SA
TRD_R
Percent share
Based on Employment Estimates, 2010
Mainland/Southwest
BC
0.1
0.1
0.4
0.6
0.7
0.4
0.3
0.4
0.4
0.4
0.6
1.3
0.8
1.3
1.0
1.1
1.3
1.8
2.1
4.7
3.6
4.2
4.1
4.7
5.0
5.2
6.2
6.9
7.4
8.6
12.1
12.5
0.1
0.1
0.1
0.2
0.2
0.2
0.3
0.4
0.5
0.6
0.6
0.6
0.8
1.0
1.2
1.3
1.5
2.2
2.5
4.1
4.2
4.5
4.8
4.8
5.4
5.6
7.0
7.2
7.4
7.7
10.9
12.0
0 2 4 6 8 10 12 14
MIN_OIL
FISH
MIN_SERV
MIN_OTH
FOR
MFG_PAP
MFG_PRINT
MFG_TRANS
MFG_R&P&C
MFG_ELEC
UTIL
MFG_WD
MFG_MIN
AGRI
MFG_MET
MFG_F&B
MFG_OTH
PROF_IT
PROF_OTH
GOV
TRD_W
MGT&ADMIN
PROF_BUS
OTH_SERV
INFO&REC
TRANS
FIRE
EDUC
ACC&FD
CONS
HLTH&SA
TRD_R
Percent share
Based on Employment Projections, 2015
Mainland/Southwest
BC
8/2/2019 DR Mainland Southwest Employment Projection 2010 2015
http://slidepdf.com/reader/full/dr-mainland-southwest-employment-projection-2010-2015 9/43
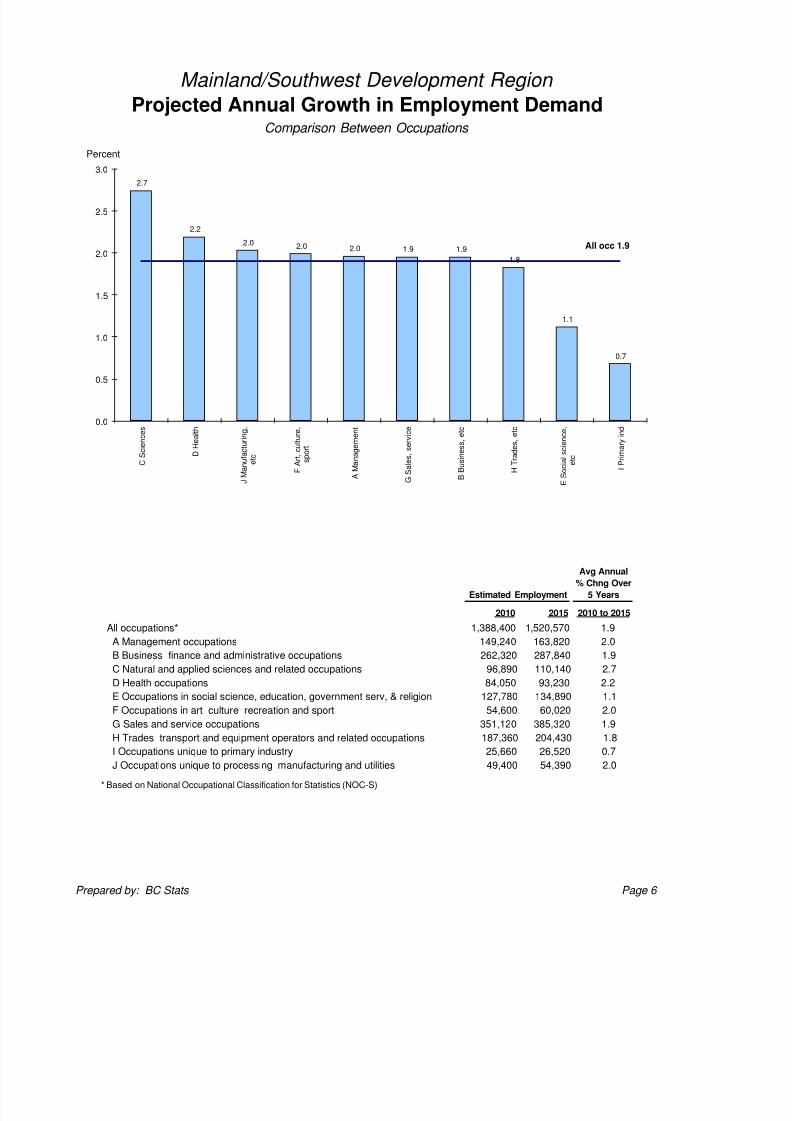
2010 2015
All occupations* 1,388,400 1,520,570 1.9
A Management occupations 149,240 163,820 2.0
B Business finance and administrative occupations 262,320 287,840 1.9
C Natural and applied sciences and related occupations 96,890 110,140 2.7
D Health occupations 84,050 93,230 2.2
E Occupations in social science, education, government serv, & religion 127,780 134,890 1.1
F Occupations in art culture recreation and sport 54,600 60,020 2.0
G Sales and service occupations 351,120 385,320 1.9
H Trades transport and equipment operators and related occupations 187,360 204,430 1.8
I Occupations unique to primary industry 25,660 26,520 0.7
J Occupations unique to processing manufacturing and utilities 49,400 54,390 2.0
* Based on National Occupational Classification for Statistics (NOC-S)
Prepared by: BC Stats Page 6
2010 to 2015
Avg Annual
% Chng Over
5 YearsEstimated Employment
Mainland/Southwest Development Region
Projected Annual Growth in Employment DemandComparison Between Occupations
2.7
2.2
2.0 2.0 2.0 1.9 1.9
1.8
1.1
0.7
All occ 1.9
0.0
0.5
1.0
1.5
2.0
2.5
3.0
C S c i e n c e s
D H e a l t h
J M a n u f a c t u r i n g ,
e t c
F A r t , c u l t u r e ,
s p o r t
A M a n a g e m e n t
G S a l e s , s e r v i c e
B B u s i n e s s , e t c
H T r a d e s , e t c
E S o c i a l s c i e n c e ,
e t c
I P r i m a r y i n d
Percent

8/2/2019 DR Mainland Southwest Employment Projection 2010 2015
http://slidepdf.com/reader/full/dr-mainland-southwest-employment-projection-2010-2015 10/43
Prepared by: BC Stats Page 7
Percent Share of Employment by Occupation
Mainland/Southwest Development Region
Occupational Structure Compared with BC
3.1
3.7
3.5
6.4
6.2
8.8
10.1
15.5
17.5
25.5
1.8
3.6
3.9
6.1
7.0
9.2
10.7
13.5
18.9
25.3
0 10 20 30
I Occupations unique to primary industry
J Occupations unique to processing,
manufacturing and utilities
F Occupations in art, culture, recreationand sport
D Health occupations
C Natural and applied sciences andrelated occupations
E Occupations in social science,education, government service and
religion
A Management occupations
H Trades, transport and equipmentoperators and related occupations
B Business, finance and administrativeoccupations
G Sales and service occupations
Percent share
Based on Employment Estimates, 2010
Mainland/SouthBC
3.0
3.6
3.5
6.5
6.3
8.5
10.1
15.6
17.4
25.4
1.7
3.6
3.9
6.1
7.2
8.9
10.8
13.4
18.9
25.3
0 10 20 30
I Occupations unique to primary industry
J Occupations unique to processing,
manufacturing and utilities
F Occupations in art, culture, recreationand sport
D Health occupations
C Natural and applied sciences andrelated occupations
E Occupations in social science,education, government service and
religion
A Management occupations
H Trades, transport and equipmentoperators and related occupations
B Business, finance and administrativeoccupations
G Sales and service occupations
Percent share
Based on Employment Projections, 2015
Mainland/SouthBC
8/2/2019 DR Mainland Southwest Employment Projection 2010 2015
http://slidepdf.com/reader/full/dr-mainland-southwest-employment-projection-2010-2015 11/43
2010 2015
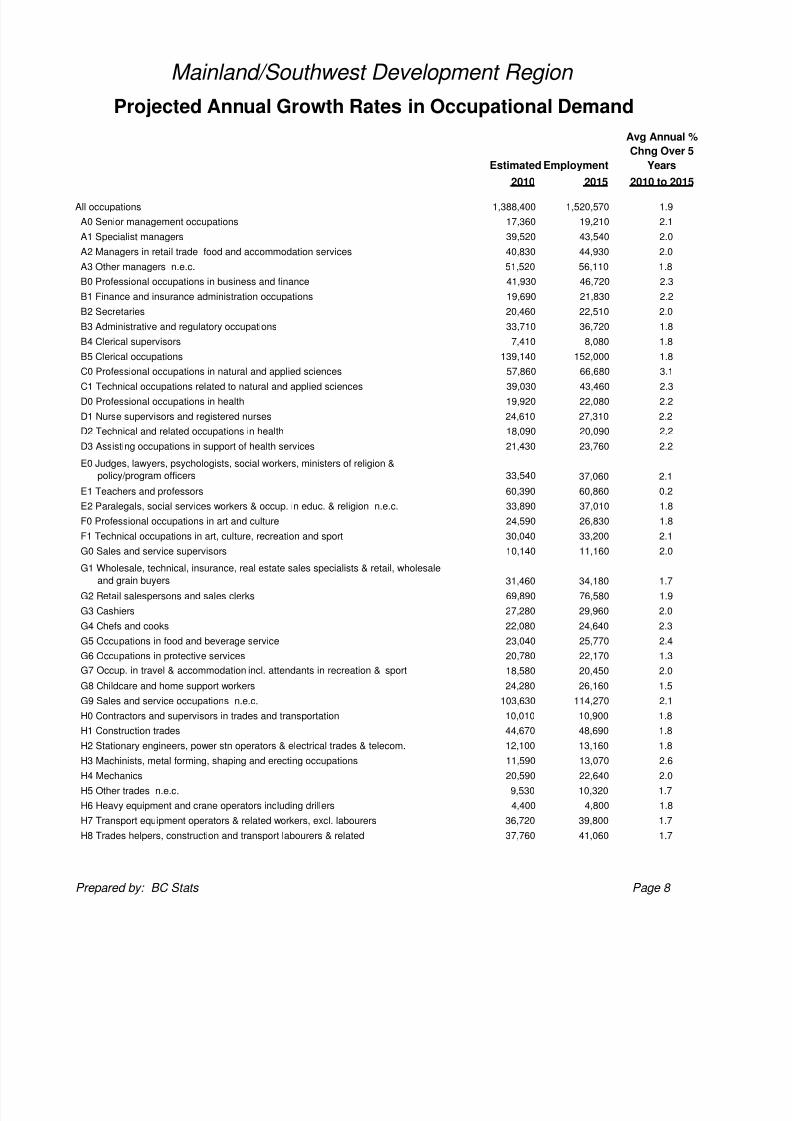
All occupations 1,388,400 1,520,570 1.9
A0 Senior management occupations 17,360 19,210 2.1
A1 Specialist managers 39,520 43,540 2.0
A2 Managers in retail trade food and accommodation services 40,830 44,930 2.0
A3 Other managers n.e.c. 51,520 56,110 1.8
B0 Professional occupations in business and finance 41,930 46,720 2.3
B1 Finance and insurance administration occupations 19,690 21,830 2.2
B2 Secretaries 20,460 22,510 2.0
B3 Administrative and regulatory occupations 33,710 36,720 1.8
B4 Clerical supervisors 7,410 8,080 1.8
B5 Clerical occupations 139,140 152,000 1.8
C0 Professional occupations in natural and applied sciences 57,860 66,680 3.1
C1 Technical occupations related to natural and applied sciences 39,030 43,460 2.3
D0 Professional occupations in health 19,920 22,080 2.2
D1 Nurse supervisors and registered nurses 24,610 27,310 2.2
D2 Technical and related occupations in health 18,090 20,090 2.2
D3 Assisting occupations in support of health services 21,430 23,760 2.2
E0 Judges, lawyers, psychologists, social workers, ministers of religion &
policy/program officers 33,540 37,060 2.1
E1 Teachers and professors 60,390 60,860 0.2
E2 Paralegals, social services workers & occup. in educ. & religion n.e.c. 33,890 37,010 1.8
F0 Professional occupations in art and culture 24,590 26,830 1.8
F1 Technical occupations in art, culture, recreation and sport 30,040 33,200 2.1
G0 Sales and service supervisors 10,140 11,160 2.0
G1 Wholesale, technical, insurance, real estate sales specialists & retail, wholesale
and grain buyers 31,460 34,180 1.7
G2 Retail salespersons and sales clerks 69,890 76,580 1.9
G3 Cashiers 27,280 29,960 2.0
G4 Chefs and cooks 22,080 24,640 2.3
G5 Occupations in food and beverage service 23,040 25,770 2.4
G6 Occupations in protective services 20,780 22,170 1.3
G7 Occup. in travel & accommodation incl. attendants in recreation & sport 18,580 20,450 2.0
G8 Childcare and home support workers 24,280 26,160 1.5
G9 Sales and service occupations n.e.c. 103,630 114,270 2.1
H0 Contractors and supervisors in trades and transportation 10,010 10,900 1.8
H1 Construction trades 44,670 48,690 1.8
H2 Stationary engineers, power stn operators & electrical trades & telecom. 12,100 13,160 1.8
H3 Machinists, metal forming, shaping and erecting occupations 11,590 13,070 2.6
H4 Mechanics 20,590 22,640 2.0
H5 Other trades n.e.c. 9,530 10,320 1.7
H6 Heavy equipment and crane operators including drillers 4,400 4,800 1.8
H7 Transport equipment operators & related workers, excl. labourers 36,720 39,800 1.7
H8 Trades helpers, construction and transport labourers & related 37,760 41,060 1.7
Prepared by: BC Stats Page 8
Projected Annual Growth Rates in Occupational Demand
Mainland/Southwest Development Region
Estimated Employment
Avg Annual %
Chng Over 5
Years
2010 to 2015
8/2/2019 DR Mainland Southwest Employment Projection 2010 2015
http://slidepdf.com/reader/full/dr-mainland-southwest-employment-projection-2010-2015 12/43
2010 2015
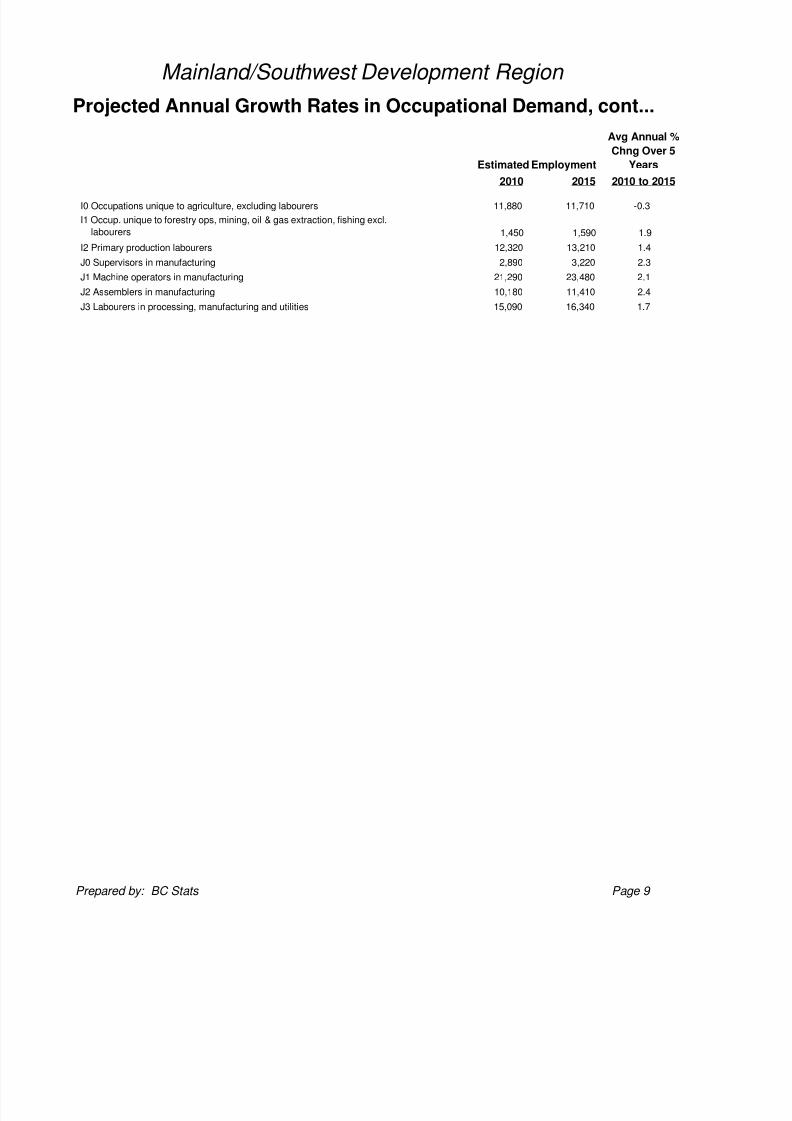
I0 Occupations unique to agriculture, excluding labourers 11,880 11,710 -0.3
I1 Occup. unique to forestry ops, mining, oil & gas extraction, fishing excl.
labourers 1,450 1,590 1.9
I2 Primary production labourers 12,320 13,210 1.4
J0 Supervisors in manufacturing 2,890 3,220 2.3
J1 Machine operators in manufacturing 21,290 23,480 2.1
J2 Assemblers in manufacturing 10,180 11,410 2.4
J3 Labourers in processing, manufacturing and utilities 15,090 16,340 1.7
Prepared by: BC Stats Page 9
Projected Annual Growth Rates in Occupational Demand, cont...
Mainland/Southwest Development Region
Estimated Employment
Avg Annual %
Chng Over 5
Years
2010 to 2015

8/2/2019 DR Mainland Southwest Employment Projection 2010 2015
http://slidepdf.com/reader/full/dr-mainland-southwest-employment-projection-2010-2015 13/43
Appendix 1
Summary of Methodology for theBritish Columbia Regional Employment
Projection Model (REPM)
8/2/2019 DR Mainland Southwest Employment Projection 2010 2015
http://slidepdf.com/reader/full/dr-mainland-southwest-employment-projection-2010-2015 14/43
Prepared by: BC Stats Page A1-1
Summary of Methodology for the REPM
Overview
The methodology used in the model is based on previous work on community
dependencies carried out by BC Stats. The fundamental premise is that the economy ofa region can be represented by income flows that can be classified as either “basic” (ordriver) or “non-basic” (or induced), depending on the source of the income. Basic incomeis the result of employment income generated from “basic jobs” plus income frominvestments and government transfers.
Included among basic jobs are those that are financed from resources emanating fromoutside the region. These jobs are labelled as “direct jobs” and are found in industriesthat export their product internationally, nationally or to other regions within the province.Typically, when speaking of exports, goods-producing industries, such as those in theprimary and manufacturing sectors, are those most often given consideration. However,service sector industries can also be exporters, particularly given the trend toward
globalization. Examples of trade in services include financial and insurance servicesprovided to foreign companies, software support services, call centres, or engineeringconsulting services. In addition, the metropolitan regions provide retail and wholesaletrade services to the outlying regions of British Columbia and many local economiesprovide tourism services such as accommodation, food and recreation to residents fromother regions (both inside and outside the province).
Other less obvious direct jobs are those in the public sector. Education, health andgovernment jobs are generated through tax revenues from the federal or provincialgovernments so those industries rely on general tax revenues coming from outside theregion.1
The other element of basic jobs is classified as “indirect jobs”. The model calculatesindirect employment effects from employment changes in direct jobs. For example, whendirect jobs are created in a local sawmill, indirect jobs will be created in the “upstream”industries that supply goods and services that go into the production of lumber such asthe logging industry, the equipment manufacturing industry, etc., and in the“downstream” industries that get the lumber to market such as the transportationindustry, the wholesale trade industry, and so forth. The model calculates these indirect
jobs using multipliers based on inter-industry linkages from the British Columbia Input-Output Model. The sum of the direct jobs and the indirect jobs are labelled basic jobs.The wages and salaries earned from these basic jobs are the major component of basicincome.
The other component of basic income is principally investment income and transferpayments, which are assumed to come from outside the local community. The growth inpopulation of a region is used as an indicator of changes to this non-employmentincome.
1For the purpose of the model, tax payments are treated as an income flow-out of the regional
economy and are deducted from total income so are not connected with any particular industry.
8/2/2019 DR Mainland Southwest Employment Projection 2010 2015
http://slidepdf.com/reader/full/dr-mainland-southwest-employment-projection-2010-2015 15/43
Prepared by: BC Stats Page A1-2
Up to this point, the model has calculated the number of basic jobs by industry and thetotal basic income of the local region. The next step is to calculate the number of jobscreated as a result of the expenditure of this basic income by the local population onhousehold goods and services such as retail goods, restaurants, transportation,residential construction, etc. These induced jobs are called “non-basic jobs” and arecalculated using a multiplier based on an income to non-basic jobs ratio derived from the
British Columbia Input-Output Model. The final result is a count of the number of non-basic jobs by industry which is then added to the basic jobs to derive total jobs byindustry by region.
The final component of the model is to convert the industry employment levels intooccupation employment levels. To this end, fixed occupation-to-industry ratios, based onthe 2006 Census of Canada data, are applied.2
Three different ratio structures are used:one for the Vancouver Census Metropolitan Area, one for the Victoria CensusMetropolitan Area, and one for the “Rest of Province”.
Data Sources
The current version of the model is benchmarked to the 2006 Census employment byCollege Region (CR), and estimates are produced for 2010 using the most up-to-dateannual employment data from the Labour Force Survey (LFS). The growth rates for thedirect industries from the LFS at the provincial level and, where available, at theDevelopment Region level, are used to project growth down to the CR level and then thesub-provincial growth rates are refined using standard variables that indicate differentialgrowth between the regions. For example, the industries that have components in thetourism sector are differentiated according to the sub-provincial growth rates in taxrevenues derived from room rentals. Another important determining factor of sub-regiondirect employment growth in the private sector is the major projects underway in thetimeframe, such as mines that have opened or closed during that period. Note that not
all industries experienced employment growth since the Census and the “growth” ratesare sometimes negative, indicating job loss. This is particularly apparent in the forestsector, where there have been significant reductions in employment.
The output from the model is benchmarked to the LFS industry employment numbers atthe B.C. level, as well as to the LFS regional employment numbers for the DevelopmentRegions.3
Once the model is updated to the most current employment levels, then theforecast is produced for five years out. The industrial employment projections from theBC Labour Market Scenario Model (BCLMSM) are used as the source data for theindustrial growth.
The BCLMSM figures are used in determining both the growth rates in the direct
employment and as a benchmark to reconcile the industrial employment generated by
2A concordance between the NOC-S (Statistics Canada’s occupation coding scheme: National
Occupational Classification for Statistics) and NOC (Human Resources and Skills DevelopmentCanada’s occupation codes: National Occupational Classification) can be found on StatisticsCanada’s website: http://www.statcan.gc.ca/subjects-sujets/standard-norme/concordances/ noc2006-cnp2006-concordance-eng.htm
3Note that while employment numbers will sum exactly to the B.C. industry totals from the LFS,
there may be some small differences at the Development Region level.
8/2/2019 DR Mainland Southwest Employment Projection 2010 2015
http://slidepdf.com/reader/full/dr-mainland-southwest-employment-projection-2010-2015 16/43
Prepared by: BC Stats Page A1-3
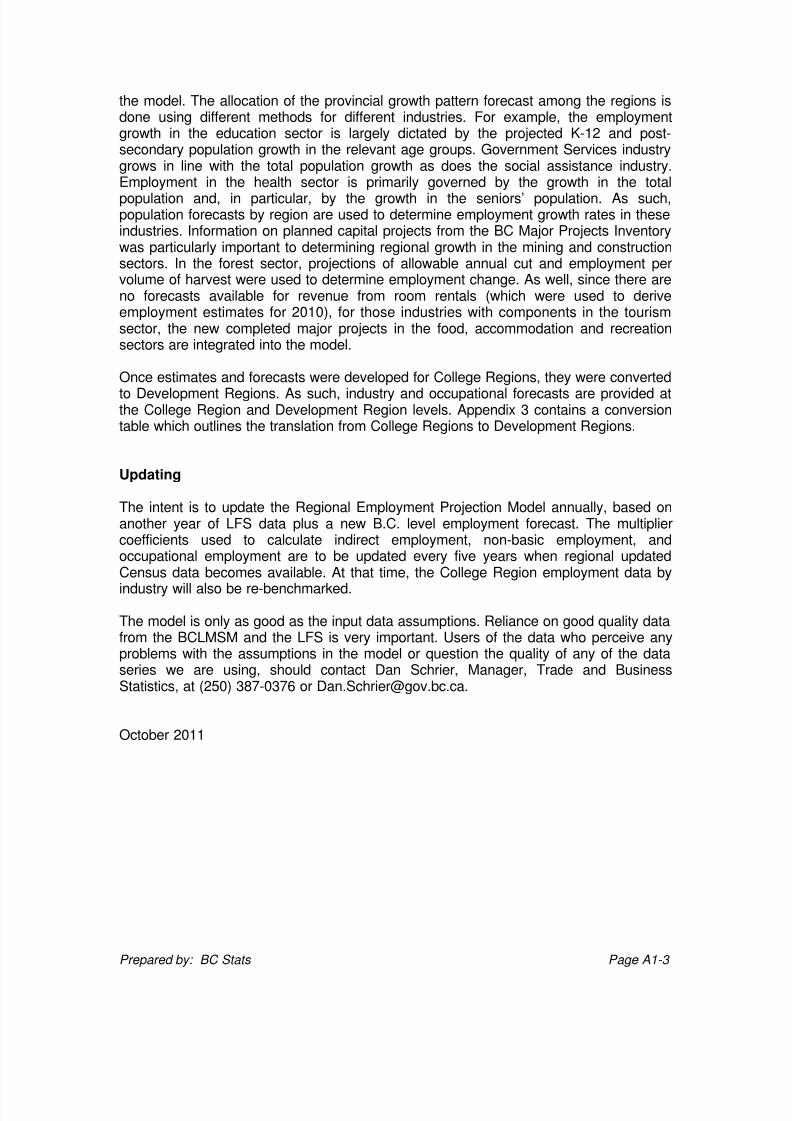
the model. The allocation of the provincial growth pattern forecast among the regions isdone using different methods for different industries. For example, the employmentgrowth in the education sector is largely dictated by the projected K-12 and post-secondary population growth in the relevant age groups. Government Services industrygrows in line with the total population growth as does the social assistance industry.Employment in the health sector is primarily governed by the growth in the total
population and, in particular, by the growth in the seniors’ population. As such,population forecasts by region are used to determine employment growth rates in theseindustries. Information on planned capital projects from the BC Major Projects Inventorywas particularly important to determining regional growth in the mining and constructionsectors. In the forest sector, projections of allowable annual cut and employment pervolume of harvest were used to determine employment change. As well, since there areno forecasts available for revenue from room rentals (which were used to deriveemployment estimates for 2010), for those industries with components in the tourismsector, the new completed major projects in the food, accommodation and recreationsectors are integrated into the model.
Once estimates and forecasts were developed for College Regions, they were converted
to Development Regions. As such, industry and occupational forecasts are provided atthe College Region and Development Region levels. Appendix 3 contains a conversiontable which outlines the translation from College Regions to Development Regions.
Updating
The intent is to update the Regional Employment Projection Model annually, based onanother year of LFS data plus a new B.C. level employment forecast. The multipliercoefficients used to calculate indirect employment, non-basic employment, andoccupational employment are to be updated every five years when regional updatedCensus data becomes available. At that time, the College Region employment data by
industry will also be re-benchmarked.
The model is only as good as the input data assumptions. Reliance on good quality datafrom the BCLMSM and the LFS is very important. Users of the data who perceive anyproblems with the assumptions in the model or question the quality of any of the dataseries we are using, should contact Dan Schrier, Manager, Trade and BusinessStatistics, at (250) 387-0376 or [email protected].
October 2011

8/2/2019 DR Mainland Southwest Employment Projection 2010 2015
http://slidepdf.com/reader/full/dr-mainland-southwest-employment-projection-2010-2015 17/43
(REPM)
Appendix 2
NAICS Industry Conversion
for the British Columbia
Regional Employment Projection Model
8/2/2019 DR Mainland Southwest Employment Projection 2010 2015
http://slidepdf.com/reader/full/dr-mainland-southwest-employment-projection-2010-2015 18/43
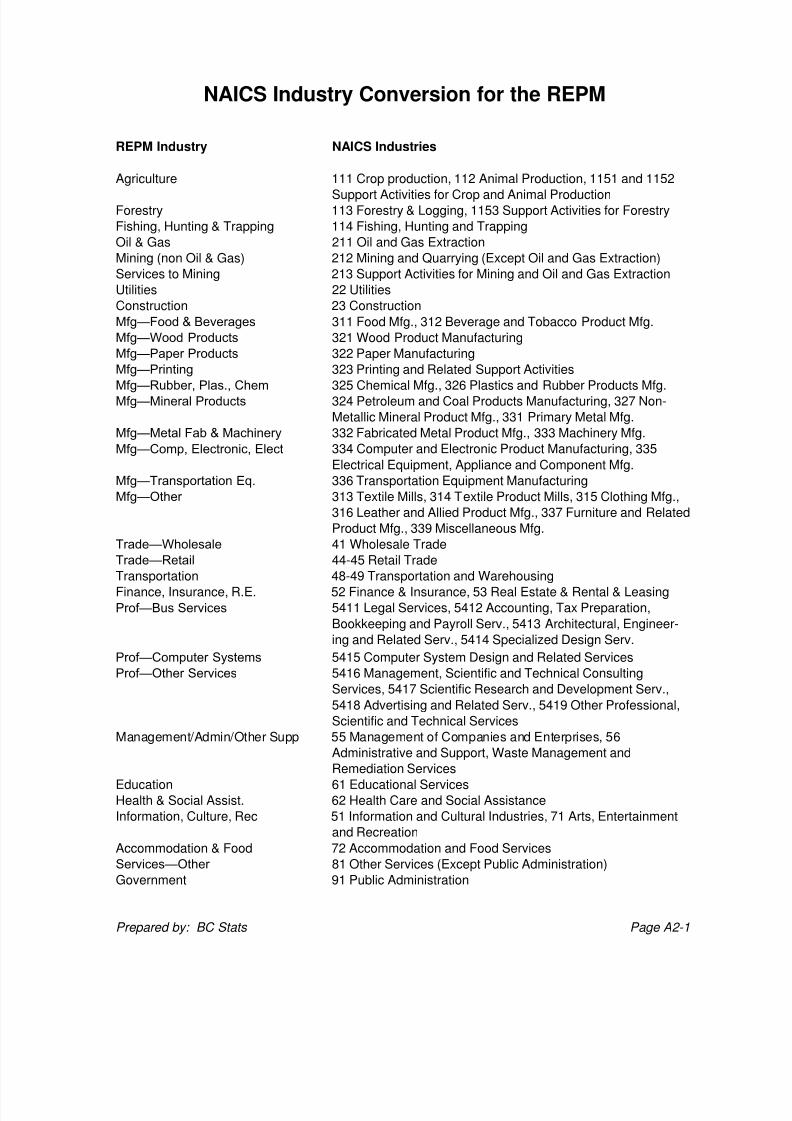
REPM Industry NAICS Industries
Agriculture 111 Crop production, 112 Animal Production, 1151 and 1152
Support Activities for Crop and Animal ProductionForestry 113 Forestry & Logging, 1153 Support Activities for Forestry
Fishing, Hunting & Trapping 114 Fishing, Hunting and Trapping
Oil & Gas 211 Oil and Gas Extraction
Mining (non Oil & Gas) 212 Mining and Quarrying (Except Oil and Gas Extraction)
Services to Mining 213 Support Activities for Mining and Oil and Gas Extraction
Utilities 22 Utilities
Construction 23 Construction
Mfg—Food & Beverages 311 Food Mfg., 312 Beverage and Tobacco Product Mfg.
Mfg—Wood Products 321 Wood Product Manufacturing
Mfg—Paper Products 322 Paper Manufacturing
Mfg—Printing 323 Printing and Related Support Activities
Mfg—Rubber, Plas., Chem 325 Chemical Mfg., 326 Plastics and Rubber Products Mfg.
Mfg—Mineral Products 324 Petroleum and Coal Products Manufacturing, 327 Non-
Metallic Mineral Product Mfg., 331 Primary Metal Mfg.
Mfg—Metal Fab & Machinery 332 Fabricated Metal Product Mfg., 333 Machinery Mfg.
Mfg—Comp, Electronic, Elect 334 Computer and Electronic Product Manufacturing, 335
Electrical Equipment, Appliance and Component Mfg.
Mfg—Transportation Eq. 336 Transportation Equipment Manufacturing
Mfg—Other 313 Textile Mills, 314 Textile Product Mills, 315 Clothing Mfg.,
316 Leather and Allied Product Mfg., 337 Furniture and Related
Product Mfg., 339 Miscellaneous Mfg.
Trade—Wholesale 41 Wholesale Trade
Trade—Retail 44-45 Retail Trade
Transportation 48-49 Transportation and Warehousing
Finance, Insurance, R.E. 52 Finance & Insurance, 53 Real Estate & Rental & LeasingProf—Bus Services 5411 Legal Services, 5412 Accounting, Tax Preparation,
Bookkeeping and Payroll Serv., 5413 Architectural, Engineer-
ing and Related Serv., 5414 Specialized Design Serv.
Prof—Computer Systems 5415 Computer System Design and Related Services
Prof—Other Services 5416 Management, Scientific and Technical Consulting
Services, 5417 Scientific Research and Development Serv.,
5418 Advertising and Related Serv., 5419 Other Professional,
Scientific and Technical Services
Management/Admin/Other Supp 55 Management of Companies and Enterprises, 56
Administrative and Support, Waste Management and
Remediation Services
Education 61 Educational ServicesHealth & Social Assist. 62 Health Care and Social Assistance
Information, Culture, Rec 51 Information and Cultural Industries, 71 Arts, Entertainment
and Recreation
Accommodation & Food 72 Accommodation and Food Services
Services—Other 81 Other Services (Except Public Administration)
Government 91 Public Administration
Prepared by: BC Stats Page A2-1
NAICS Industry Conversion for the REPM

8/2/2019 DR Mainland Southwest Employment Projection 2010 2015
http://slidepdf.com/reader/full/dr-mainland-southwest-employment-projection-2010-2015 19/43
Appendix 3
Development Region to Regional District
Conversion for the British Columbia
Regional Employment Projection Model
(REPM)

8/2/2019 DR Mainland Southwest Employment Projection 2010 2015
http://slidepdf.com/reader/full/dr-mainland-southwest-employment-projection-2010-2015 20/43
Regional
Development Region District Name
Vancouver Island/Coast 1 Capital 17Vancouver Island/Coast 1 Cowichan Valley 19
Vancouver Island/Coast 1 Nanaimo 21
Vancouver Island/Coast 1 Alberni-Clayoquot 23
Vancouver Island/Coast 1 Comox-Strathcona 25
Vancouver Island/Coast 1 Powell River 27
Vancouver Island/Coast 1 Mount Waddington 43
Vancouver Island/Coast 1 Central Coast 45
Mainland/Southwest 2 Fraser Valley 9
Mainland/Southwest 2 Greater Vancouver 15
Mainland/Southwest 2 Sunshine Coast 29
Mainland/Southwest 2 Squamish-Lillooet 31
Thompson-Okanagan 3 Okanagan-Similkameen 7
Thompson-Okanagan 3 Thompson-Nicola 33
Thompson-Okanagan 3 Central Okanagan 35
Thompson-Okanagan 3 North Okanagan 37
Thompson-Okanagan 3 Columbia-Shuswap 39
Kootenay 4 East Kootenay 1
Kootenay 4 Central Kootenay 3
Kootenay 4 Kootenay-Boundary 5
Cariboo 5 Cariboo 41
Cariboo 5 Fraser-Fort George 53
North Coast 6 Skeena- Queen Charlotte 47
North Coast 6 Kitimat-Stikine 49
Nechako 7 Bulkley-Nechako 51
Nechako 7 Stikine 57
Northeast 8 Peace River 55
Northeast 8 Northern Rockies 57
Prepared by: BC Stats Page A3-1
Development Region to Regional District
Conversion for REPM
Development Regional
Region # District #

8/2/2019 DR Mainland Southwest Employment Projection 2010 2015
http://slidepdf.com/reader/full/dr-mainland-southwest-employment-projection-2010-2015 21/43
Reports
Regional Employment Projection Model
Appendix 4
Explanation of Industry Codes Used
In the British Columbia
8/2/2019 DR Mainland Southwest Employment Projection 2010 2015
http://slidepdf.com/reader/full/dr-mainland-southwest-employment-projection-2010-2015 22/43
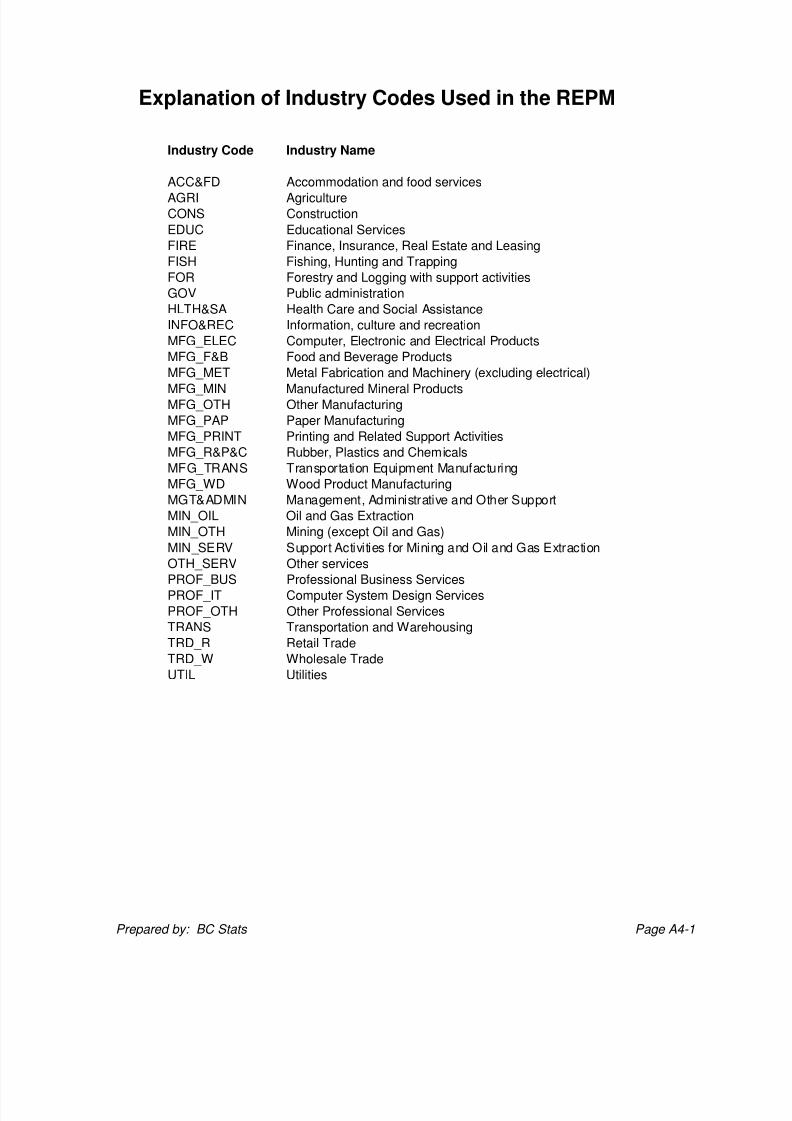
Industry Code Industry Name
ACC&FD Accommodation and food services
AGRI AgricultureCONS Construction
EDUC Educational Services
FIRE Finance, Insurance, Real Estate and Leasing
FISH Fishing, Hunting and Trapping
FOR Forestry and Logging with support activities
GOV Public administration
HLTH&SA Health Care and Social Assistance
INFO&REC Information, culture and recreation
MFG_ELEC Computer, Electronic and Electrical Products
MFG_F&B Food and Beverage Products
MFG_MET Metal Fabrication and Machinery (excluding electrical)
MFG_MIN Manufactured Mineral ProductsMFG_OTH Other Manufacturing
MFG_PAP Paper Manufacturing
MFG_PRINT Printing and Related Support Activities
MFG_R&P&C Rubber, Plastics and Chemicals
MFG_TRANS Transportation Equipment Manufacturing
MFG_WD Wood Product Manufacturing
MGT&ADMIN Management, Administrative and Other Support
MIN_OIL Oil and Gas Extraction
MIN_OTH Mining (except Oil and Gas)
MIN_SERV Support Activities for Mining and Oil and Gas Extraction
OTH_SERV Other services
PROF_BUS Professional Business Services
PROF_IT Computer System Design Services
PROF_OTH Other Professional Services
TRANS Transportation and Warehousing
TRD_R Retail Trade
TRD_W Wholesale Trade
UTIL Utilities
Prepared by: BC Stats Page A4-1
Explanation of Industry Codes Used in the REPM

8/2/2019 DR Mainland Southwest Employment Projection 2010 2015
http://slidepdf.com/reader/full/dr-mainland-southwest-employment-projection-2010-2015 23/43
Projected Annual Growth Rate
In Occupational Demand (3-digit)
Appendix 5

8/2/2019 DR Mainland Southwest Employment Projection 2010 2015
http://slidepdf.com/reader/full/dr-mainland-southwest-employment-projection-2010-2015 24/43
2010 2015
All occupations 1,388,400 1,520,570 1.9
A01 Legislators and senior management 17,390 19,250 2.1
A11 Administrative services managers 13,420 14,740 2.0
A12 Managers in engineering, architecture, science and information systems 6,340 7,240 2.8
A13 Sales, marketing and advertising managers 16,200 17,730 1.9
A14 Facility operation and maintenance managers 3,530 3,830 1.6
A21 Managers in retail trade 29,740 32,540 1.9
A22 Managers in food service and accommodation 11,100 12,410 2.3
A30 Managers in financial and business services 15,580 17,190 2.1
A31 Managers in communication (except broadcasting) 1,250 1,380 2.0
A32 Managers in health, education, social and community services 7,240 7,610 1.0
A33 Managers in public administration 1,000 1,050 1.0
A34 Managers in art, culture, recreation and sport 1,840 2,010 1.9
A35 Managers in protective service 610 620 0.6A36 Managers in other services 3,150 3,470 2.1
A37 Managers in construction and transportation 13,800 15,030 1.8
A38 Managers in primary production (except agriculture) 600 680 2.6
A39 Managers in manufacturing and utilities 6,510 7,130 1.9
B01 Auditors, accountants and investment professionals 32,280 35,920 2.3
B02 Human resources and business service professionals 9,680 10,830 2.4
B11 Finance and insurance administrative occupations 19,690 21,830 2.2
B21 Secretaries, recorders and transcriptionists 20,470 22,520 2.0
B31 Administrative and regulatory occupations 33,690 36,700 1.8
B41 Clerical supervisors 7,420 8,090 1.8
B51 Clerical occupations, general office skills 45,720 50,040 1.9
B52 Office equipment operators 5,480 6,000 1.9B53 Finance and insurance clerks 29,690 32,630 2.0
B54 Administrative support clerks 11,620 12,600 1.7
B55 Library, correspondence and related information clerks 17,300 18,890 1.8
B56 Mail and message distribution occupations 9,270 10,060 1.7
B57 Recording, scheduling and distributing occupations 20,030 21,750 1.7
C01 Physical science professionals 3,050 3,410 2.4
C02 Life science professionals 2,190 2,440 2.2
C03 Civil, mechanical, electrical and chemical engineers 12,190 13,650 2.4
C04 Other engineers 5,290 6,060 2.9
C05 Architects, urban planners and land surveyors 4,030 4,570 2.7
C06 Mathematicians, statisticians and actuaries 420 470 2.4
C07 Computer and information systems professionals 30,710 36,100 3.5
C11 Technical occupations in physical sciences 2,610 2,910 2.3
C12 Technical occupations in life sciences 2,440 2,640 1.6
C13 Technical occupations in civil, mechanical and industrial engineering 3,880 4,310 2.2
C14 Technical occupations in electronics and electrical engineering 7,960 8,780 2.1
C15 Technical occupations in architecture, drafting, surveying and mapping 5,920 6,720 2.7
C16 Other technical inspectors and regulatory officers 3,030 3,290 1.8
C17 Transportation officers and controllers 3,330 3,610 1.7
C18 Technical occupations in computer and information systems 9,880 11,210 2.7
D01 Physicians, dentists and veterinarians 11,270 12,530 2.2
D02 Optometrists, chiropractors and other health diagnosing and treating professionals 880 970 2.2
D03 Pharmacists, dietitians and nutritionists 3,490 3,840 2.0
Mainland/Southwest Development Region
Projected Growth Rates: 3-digit
Estimated Employment
Avg Annual %
Chng Over 5
Years
2010 to 2015
Prepared by: BC Stats Page A5-1
8/2/2019 DR Mainland Southwest Employment Projection 2010 2015
http://slidepdf.com/reader/full/dr-mainland-southwest-employment-projection-2010-2015 25/43
2010 2015
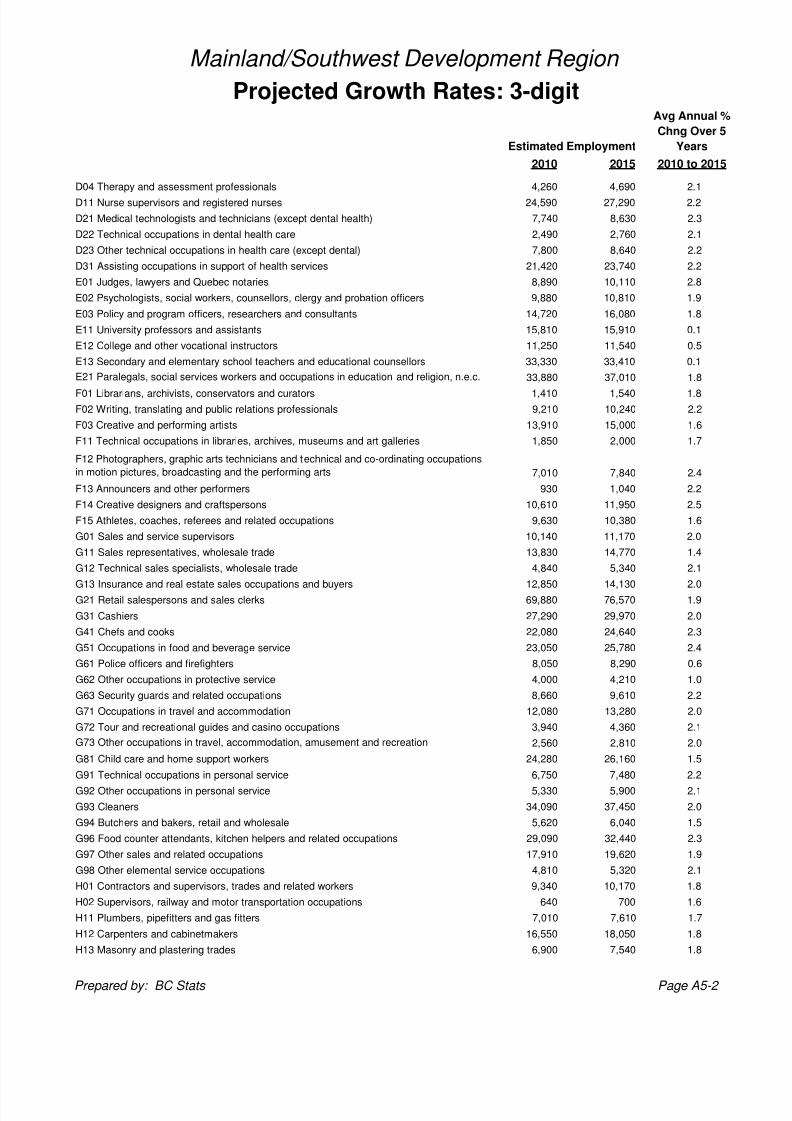
Mainland/Southwest Development Region
Projected Growth Rates: 3-digit
Estimated Employment
Avg Annual %
Chng Over 5
Years
2010 to 2015
D04 Therapy and assessment professionals 4,260 4,690 2.1
D11 Nurse supervisors and registered nurses 24,590 27,290 2.2
D21 Medical technologists and technicians (except dental health) 7,740 8,630 2.3
D22 Technical occupations in dental health care 2,490 2,760 2.1
D23 Other technical occupations in health care (except dental) 7,800 8,640 2.2
D31 Assisting occupations in support of health services 21,420 23,740 2.2
E01 Judges, lawyers and Quebec notaries 8,890 10,110 2.8
E02 Psychologists, social workers, counsellors, clergy and probation officers 9,880 10,810 1.9
E03 Policy and program officers, researchers and consultants 14,720 16,080 1.8
E11 University professors and assistants 15,810 15,910 0.1
E12 College and other vocational instructors 11,250 11,540 0.5
E13 Secondary and elementary school teachers and educational counsellors 33,330 33,410 0.1
E21 Paralegals, social services workers and occupations in education and religion, n.e.c. 33,880 37,010 1.8
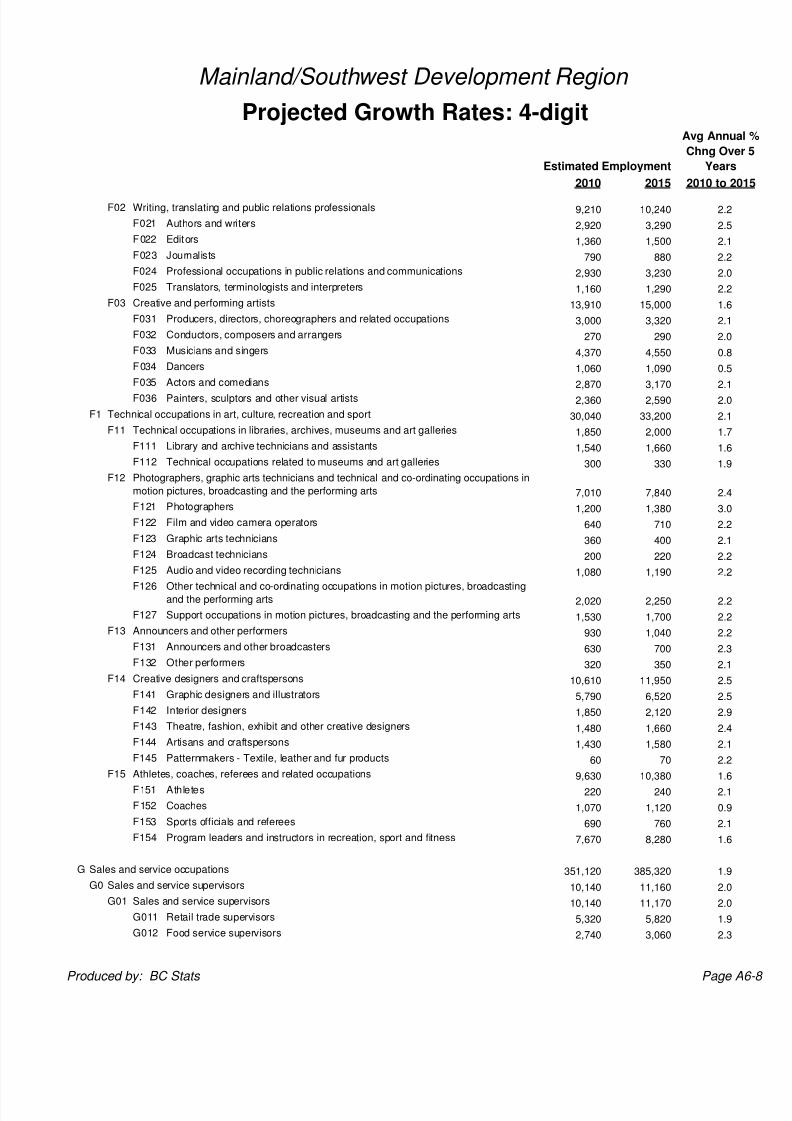
F01 Librarians, archivists, conservators and curators 1,410 1,540 1.8F02 Writing, translating and public relations professionals 9,210 10,240 2.2
F03 Creative and performing artists 13,910 15,000 1.6
F11 Technical occupations in libraries, archives, museums and art galleries 1,850 2,000 1.7
F12 Photographers, graphic arts technicians and technical and co-ordinating occupations
in motion pictures, broadcasting and the performing arts 7,010 7,840 2.4
F13 Announcers and other performers 930 1,040 2.2
F14 Creative designers and craftspersons 10,610 11,950 2.5
F15 Athletes, coaches, referees and related occupations 9,630 10,380 1.6
G01 Sales and service supervisors 10,140 11,170 2.0
G11 Sales representatives, wholesale trade 13,830 14,770 1.4
G12 Technical sales specialists, wholesale trade 4,840 5,340 2.1
G13 Insurance and real estate sales occupations and buyers 12,850 14,130 2.0G21 Retail salespersons and sales clerks 69,880 76,570 1.9
G31 Cashiers 27,290 29,970 2.0
G41 Chefs and cooks 22,080 24,640 2.3
G51 Occupations in food and beverage service 23,050 25,780 2.4
G61 Police officers and firefighters 8,050 8,290 0.6
G62 Other occupations in protective service 4,000 4,210 1.0
G63 Security guards and related occupations 8,660 9,610 2.2
G71 Occupations in travel and accommodation 12,080 13,280 2.0
G72 Tour and recreational guides and casino occupations 3,940 4,360 2.1
G73 Other occupations in travel, accommodation, amusement and recreation 2,560 2,810 2.0
G81 Child care and home support workers 24,280 26,160 1.5
G91 Technical occupations in personal service 6,750 7,480 2.2
G92 Other occupations in personal service 5,330 5,900 2.1
G93 Cleaners 34,090 37,450 2.0
G94 Butchers and bakers, retail and wholesale 5,620 6,040 1.5
G96 Food counter attendants, kitchen helpers and related occupations 29,090 32,440 2.3
G97 Other sales and related occupations 17,910 19,620 1.9
G98 Other elemental service occupations 4,810 5,320 2.1
H01 Contractors and supervisors, trades and related workers 9,340 10,170 1.8
H02 Supervisors, railway and motor transportation occupations 640 700 1.6
H11 Plumbers, pipefitters and gas fitters 7,010 7,610 1.7
H12 Carpenters and cabinetmakers 16,550 18,050 1.8
H13 Masonry and plastering trades 6,900 7,540 1.8
Prepared by: BC Stats Page A5-2
8/2/2019 DR Mainland Southwest Employment Projection 2010 2015
http://slidepdf.com/reader/full/dr-mainland-southwest-employment-projection-2010-2015 26/43
2010 2015
Mainland/Southwest Development Region
Projected Growth Rates: 3-digit
Estimated Employment
Avg Annual %
Chng Over 5
Years
2010 to 2015
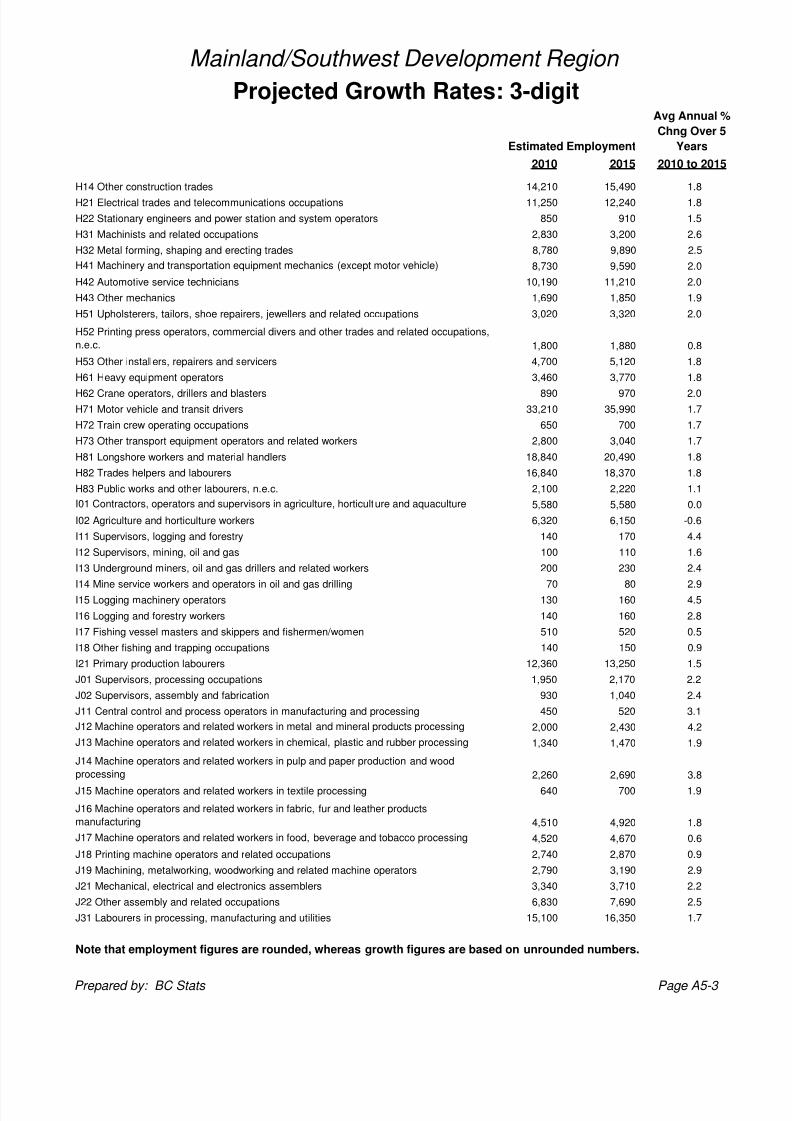
H14 Other construction trades 14,210 15,490 1.8
H21 Electrical trades and telecommunications occupations 11,250 12,240 1.8
H22 Stationary engineers and power station and system operators 850 910 1.5
H31 Machinists and related occupations 2,830 3,200 2.6
H32 Metal forming, shaping and erecting trades 8,780 9,890 2.5
H41 Machinery and transportation equipment mechanics (except motor vehicle) 8,730 9,590 2.0
H42 Automotive service technicians 10,190 11,210 2.0
H43 Other mechanics 1,690 1,850 1.9
H51 Upholsterers, tailors, shoe repairers, jewellers and related occupations 3,020 3,320 2.0
H52 Printing press operators, commercial divers and other trades and related occupations,
n.e.c. 1,800 1,880 0.8
H53 Other installers, repairers and servicers 4,700 5,120 1.8
H61 Heavy equipment operators 3,460 3,770 1.8
H62 Crane operators, drillers and blasters 890 970 2.0H71 Motor vehicle and transit drivers 33,210 35,990 1.7
H72 Train crew operating occupations 650 700 1.7
H73 Other transport equipment operators and related workers 2,800 3,040 1.7
H81 Longshore workers and material handlers 18,840 20,490 1.8
H82 Trades helpers and labourers 16,840 18,370 1.8
H83 Public works and other labourers, n.e.c. 2,100 2,220 1.1
I01 Contractors, operators and supervisors in agriculture, horticulture and aquaculture 5,580 5,580 0.0
I02 Agriculture and horticulture workers 6,320 6,150 -0.6
I11 Supervisors, logging and forestry 140 170 4.4
I12 Supervisors, mining, oil and gas 100 110 1.6
I13 Underground miners, oil and gas drillers and related workers 200 230 2.4
I14 Mine service workers and operators in oil and gas drilling 70 80 2.9I15 Logging machinery operators 130 160 4.5
I16 Logging and forestry workers 140 160 2.8
I17 Fishing vessel masters and skippers and fishermen/women 510 520 0.5
I18 Other fishing and trapping occupations 140 150 0.9
I21 Primary production labourers 12,360 13,250 1.5
J01 Supervisors, processing occupations 1,950 2,170 2.2
J02 Supervisors, assembly and fabrication 930 1,040 2.4
J11 Central control and process operators in manufacturing and processing 450 520 3.1
J12 Machine operators and related workers in metal and mineral products processing 2,000 2,430 4.2
J13 Machine operators and related workers in chemical, plastic and rubber processing 1,340 1,470 1.9
J14 Machine operators and related workers in pulp and paper production and wood
processing 2,260 2,690 3.8
J15 Machine operators and related workers in textile processing 640 700 1.9
J16 Machine operators and related workers in fabric, fur and leather products
manufacturing 4,510 4,920 1.8
J17 Machine operators and related workers in food, beverage and tobacco processing 4,520 4,670 0.6
J18 Printing machine operators and related occupations 2,740 2,870 0.9
J19 Machining, metalworking, woodworking and related machine operators 2,790 3,190 2.9
J21 Mechanical, electrical and electronics assemblers 3,340 3,710 2.2
J22 Other assembly and related occupations 6,830 7,690 2.5
J31 Labourers in processing, manufacturing and utilities 15,100 16,350 1.7
Note that employment figures are rounded, whereas growth figures are based on unrounded numbers.
Prepared by: BC Stats Page A5-3

8/2/2019 DR Mainland Southwest Employment Projection 2010 2015
http://slidepdf.com/reader/full/dr-mainland-southwest-employment-projection-2010-2015 27/43
Appendix 6
Projected Annual Growth Rate
In Occupational Demand (4-digit)

8/2/2019 DR Mainland Southwest Employment Projection 2010 2015
http://slidepdf.com/reader/full/dr-mainland-southwest-employment-projection-2010-2015 28/43
2010 2015
All occupations 1,388,400 1,520,570 1.9
A Management occupations 149,240 163,820 2.0
A0 Senior management occupations 17,360 19,210 2.1
A01 Legislators and senior management 17,390 19,250 2.1
A011 Legislators 340 350 0.4
A012 Senior government managers and officials 910 940 0.7
A013 Senior managers - Financial, communications and other business services 5,880 6,780 3.1
A014 Senior managers - Health, education, social and community services and
membership organizations 1,720 1,860 1.6
A015 Senior managers - Trade, broadcasting and other services, n.e.c. 4,190 4,540 1.7
A016 Senior managers - Goods production, utilities, transportation and construction 4,310 4,740 2.0
A1 Specialist managers 39,520 43,540 2.0
A11 Administrative services managers 13,420 14,740 2.0
A111 Financial managers 5,470 6,030 2.0
A112 Human resources managers 3,180 3,490 1.9
A113 Purchasing managers 930 1,020 1.9
A114 Other administrative services managers 3,870 4,240 1.9
A12 Managers in engineering, architecture, science and information systems 6,340 7,240 2.8
A121 Engineering managers 1,530 1,720 2.5
A122 Computer and information systems managers 4,210 4,850 3.0
A123 Architecture and science managers 620 690 2.1
A13 Sales, marketing and advertising managers 16,200 17,730 1.9
A131 Sales, marketing and advertising managers 16,230 17,760 1.9
A14 Facility operation and maintenance managers 3,530 3,830 1.6A141 Facility operation and maintenance managers 3,530 3,810 1.6
A2 Managers in retail trade, food and accommodation services 40,830 44,930 2.0
A21 Managers in retail trade 29,740 32,540 1.9
A211 Retail trade managers 29,740 32,550 1.9
A22 Managers in food service and accommodation 11,100 12,410 2.3
A221 Restaurant and food service managers 9,260 10,350 2.4
A222 Accommodation service managers 1,840 2,060 2.3
A3 Other managers, n.e.c. 51,520 56,110 1.8
A30 Managers in financial and business services 15,580 17,190 2.1
A301 Insurance, real estate and financial brokerage managers 8,380 9,240 2.0
A302 Banking, credit and other investment managers 6,470 7,130 2.0
A303 Other business services managers 710 800 2.5
A31 Managers in communication (except broadcasting) 1,250 1,380 2.0
A311 Telecommunication carriers managers 910 1,000 2.2
A312 Postal and courier services managers 370 400 1.6
A32 Managers in health, education, social and community services 7,240 7,610 1.0
A321 Managers in health care 1,720 1,900 2.1
A322 Administrators - Post-secondary education and vocational training 1,640 1,660 0.2
A323 School principals and administrators of elementary and secondary education 2,250 2,270 0.1
A324 Managers in social, community and correctional services 1,630 1,800 2.0
A33 Managers in public administration 1,000 1,050 1.0
A331 Government managers - Health and social policy development and program 230 240 1.1
Mainland/Southwest Development Region
Projected Growth Rates: 4-digit
Estimated Employment
Avg Annua
Chng Ove
Years
2010 to 20
Produced by: BC Stats Page A

8/2/2019 DR Mainland Southwest Employment Projection 2010 2015
http://slidepdf.com/reader/full/dr-mainland-southwest-employment-projection-2010-2015 29/43
2010 2015
Mainland/Southwest Development Region
Projected Growth Rates: 4-digit
Estimated Employment
Avg Annua
Chng Ove
Years
2010 to 20
A332 Government managers - Economic analysis, policy development and program
administration 530 560 1.2
A333 Government managers - Education policy development and program
administration 20 20 0.3
A334 Other managers in public administration 210 210 0.8
A34 Managers in art, culture, recreation and sport 1,840 2,010 1.9
A341 Library, archive, museum and art gallery managers 280 310 2.0
A342 Managers - Publishing, motion pictures, broadcasting and performing arts 820 910 2.1
A343 Recreation, sports and fitness program and service directors 750 810 1.6
A35 Managers in protective service 610 620 0.6
A351 Commissioned police officers 110 110 0.5
A352 Fire chiefs and senior firefighting officers 180 190 0.7
A353 Commissioned officers, armed forces 320 330 0.5A36 Managers in other services 3,150 3,470 2.1
A361 Other services managers 3,140 3,470 2.1
A37 Managers in construction and transportation 13,800 15,030 1.8
A371 Construction managers 7,670 8,370 1.8
A372 Residential home builders and renovators 3,440 3,740 1.8
A373 Transportation managers 2,710 2,930 1.7
A38 Managers in primary production (except agriculture) 600 680 2.6
A381 Primary production managers (except agriculture) 610 680 2.5
A39 Managers in manufacturing and utilities 6,510 7,130 1.9
A391 Manufacturing managers 5,450 6,050 2.2
A392 Utilities managers 1,060 1,060 0.2
B Business, finance and administrative occupations 262,320 287,840 1.9
B0 Professional occupations in business and finance 41,930 46,720 2.3
B01 Auditors, accountants and investment professionals 32,280 35,920 2.3
B011 Financial auditors and accountants 19,460 21,790 2.4
B012 Financial and investment analysts 2,820 3,110 2.1
B013 Securities agents, investment dealers and brokers 3,150 3,470 2.1
B014 Other financial officers 6,800 7,500 2.1
B02 Human resources and business service professionals 9,680 10,830 2.4
B021 Specialists in human resources 3,640 3,970 1.8
B022 Professional occupations in business services to management 6,070 6,890 2.7
B1 Finance and insurance administration occupations 19,690 21,830 2.2
B11 Finance and insurance administrative occupations 19,690 21,830 2.2
B111 Bookkeepers 10,430 11,660 2.4
B112 Loan officers 3,570 3,940 2.1
B113 Insurance adjusters and claims examiners 2,950 3,250 2.0
B114 Insurance underwriters 1,170 1,290 2.0
B115 Assessors, valuators and appraisers 910 990 1.7
B116 Customs, ship and other brokers 580 630 1.6
B2 Secretaries 20,460 22,510 2.0
B21 Secretaries, recorders and transcriptionists 20,470 22,520 2.0
B211 Secretaries (except legal and medical) 15,160 16,520 1.8
B212 Legal secretaries 3,480 3,960 2.8
Produced by: BC Stats Page A
8/2/2019 DR Mainland Southwest Employment Projection 2010 2015
http://slidepdf.com/reader/full/dr-mainland-southwest-employment-projection-2010-2015 30/43
2010 2015
Mainland/Southwest Development Region
Projected Growth Rates: 4-digit
Estimated Employment
Avg Annua
Chng Ove
Years
2010 to 20
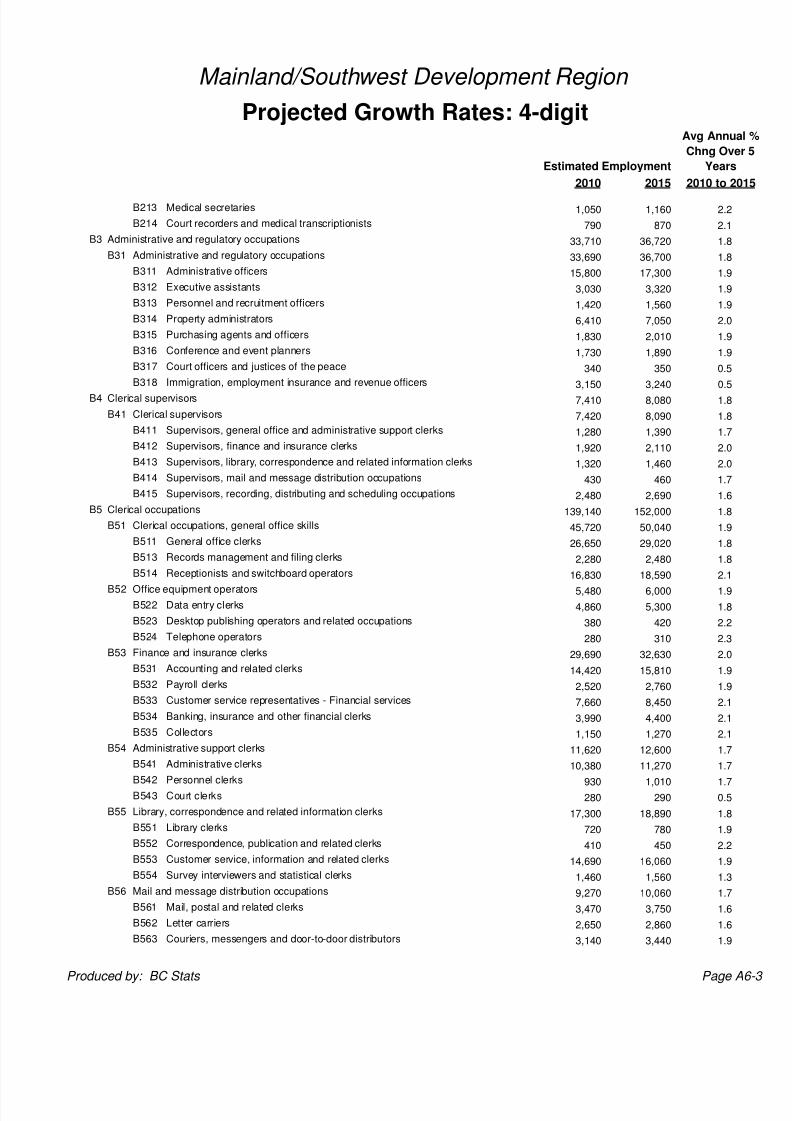
B213 Medical secretaries 1,050 1,160 2.2
B214 Court recorders and medical transcriptionists 790 870 2.1
B3 Administrative and regulatory occupations 33,710 36,720 1.8
B31 Administrative and regulatory occupations 33,690 36,700 1.8
B311 Administrative officers 15,800 17,300 1.9
B312 Executive assistants 3,030 3,320 1.9
B313 Personnel and recruitment officers 1,420 1,560 1.9
B314 Property administrators 6,410 7,050 2.0
B315 Purchasing agents and officers 1,830 2,010 1.9
B316 Conference and event planners 1,730 1,890 1.9
B317 Court officers and justices of the peace 340 350 0.5
B318 Immigration, employment insurance and revenue officers 3,150 3,240 0.5
B4 Clerical supervisors 7,410 8,080 1.8
B41 Clerical supervisors 7,420 8,090 1.8
B411 Supervisors, general office and administrative support clerks 1,280 1,390 1.7
B412 Supervisors, finance and insurance clerks 1,920 2,110 2.0
B413 Supervisors, library, correspondence and related information clerks 1,320 1,460 2.0
B414 Supervisors, mail and message distribution occupations 430 460 1.7
B415 Supervisors, recording, distributing and scheduling occupations 2,480 2,690 1.6
B5 Clerical occupations 139,140 152,000 1.8
B51 Clerical occupations, general office skills 45,720 50,040 1.9
B511 General office clerks 26,650 29,020 1.8
B513 Records management and filing clerks 2,280 2,480 1.8
B514 Receptionists and switchboard operators 16,830 18,590 2.1
B52 Office equipment operators 5,480 6,000 1.9B522 Data entry clerks 4,860 5,300 1.8
B523 Desktop publishing operators and related occupations 380 420 2.2
B524 Telephone operators 280 310 2.3
B53 Finance and insurance clerks 29,690 32,630 2.0
B531 Accounting and related clerks 14,420 15,810 1.9
B532 Payroll clerks 2,520 2,760 1.9
B533 Customer service representatives - Financial services 7,660 8,450 2.1
B534 Banking, insurance and other financial clerks 3,990 4,400 2.1
B535 Collectors 1,150 1,270 2.1
B54 Administrative support clerks 11,620 12,600 1.7
B541 Administrative clerks 10,380 11,270 1.7
B542 Personnel clerks930 1,010 1.7
B543 Court clerks 280 290 0.5
B55 Library, correspondence and related information clerks 17,300 18,890 1.8
B551 Library clerks 720 780 1.9
B552 Correspondence, publication and related clerks 410 450 2.2
B553 Customer service, information and related clerks 14,690 16,060 1.9
B554 Survey interviewers and statistical clerks 1,460 1,560 1.3
B56 Mail and message distribution occupations 9,270 10,060 1.7
B561 Mail, postal and related clerks 3,470 3,750 1.6
B562 Letter carriers 2,650 2,860 1.6
B563 Couriers, messengers and door-to-door distributors 3,140 3,440 1.9
Produced by: BC Stats Page A
8/2/2019 DR Mainland Southwest Employment Projection 2010 2015
http://slidepdf.com/reader/full/dr-mainland-southwest-employment-projection-2010-2015 31/43
2010 2015
Mainland/Southwest Development Region
Projected Growth Rates: 4-digit
Estimated Employment
Avg Annua
Chng Ove
Years
2010 to 20
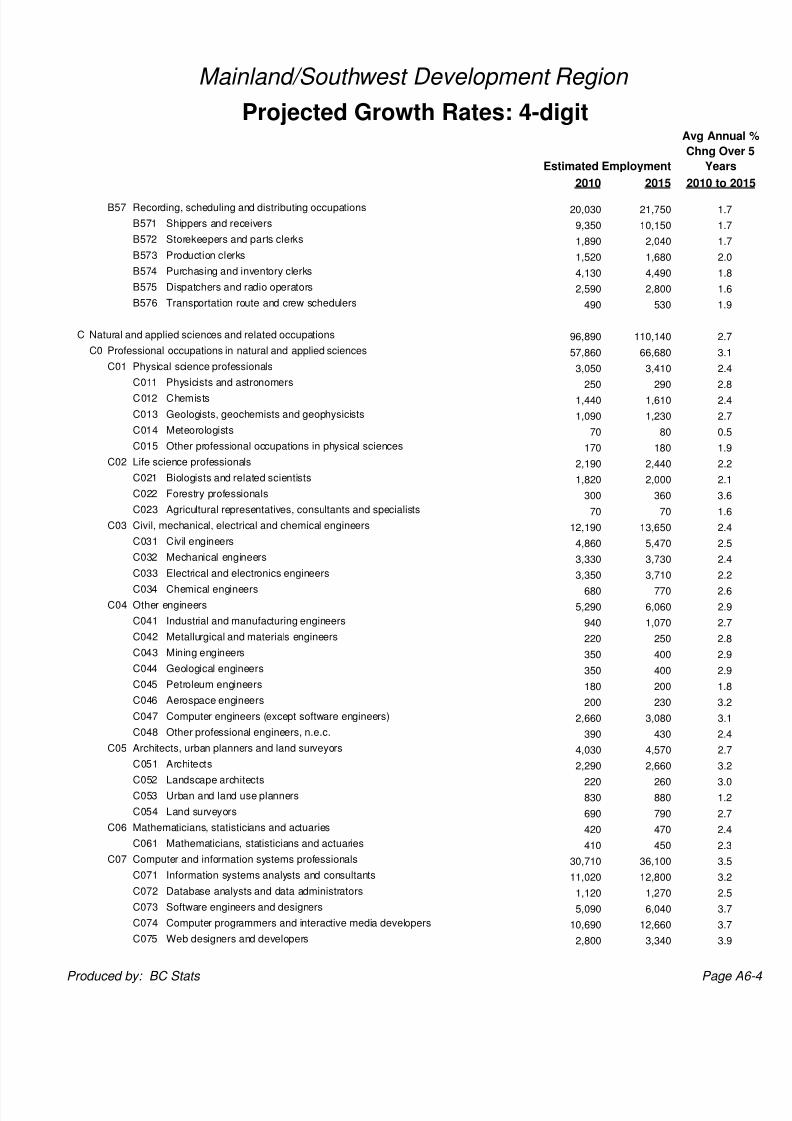
B57 Recording, scheduling and distributing occupations 20,030 21,750 1.7
B571 Shippers and receivers 9,350 10,150 1.7
B572 Storekeepers and parts clerks 1,890 2,040 1.7
B573 Production clerks 1,520 1,680 2.0
B574 Purchasing and inventory clerks 4,130 4,490 1.8
B575 Dispatchers and radio operators 2,590 2,800 1.6
B576 Transportation route and crew schedulers 490 530 1.9
C Natural and applied sciences and related occupations 96,890 110,140 2.7
C0 Professional occupations in natural and applied sciences 57,860 66,680 3.1
C01 Physical science professionals 3,050 3,410 2.4
C011 Physicists and astronomers 250 290 2.8
C012 Chemists 1,440 1,610 2.4
C013 Geologists, geochemists and geophysicists 1,090 1,230 2.7
C014 Meteorologists 70 80 0.5
C015 Other professional occupations in physical sciences 170 180 1.9
C02 Life science professionals 2,190 2,440 2.2
C021 Biologists and related scientists 1,820 2,000 2.1
C022 Forestry professionals 300 360 3.6
C023 Agricultural representatives, consultants and specialists 70 70 1.6
C03 Civil, mechanical, electrical and chemical engineers 12,190 13,650 2.4
C031 Civil engineers 4,860 5,470 2.5
C032 Mechanical engineers 3,330 3,730 2.4
C033 Electrical and electronics engineers 3,350 3,710 2.2
C034 Chemical engineers 680 770 2.6C04 Other engineers 5,290 6,060 2.9
C041 Industrial and manufacturing engineers 940 1,070 2.7
C042 Metallurgical and materials engineers 220 250 2.8
C043 Mining engineers 350 400 2.9
C044 Geological engineers 350 400 2.9
C045 Petroleum engineers 180 200 1.8
C046 Aerospace engineers 200 230 3.2
C047 Computer engineers (except software engineers) 2,660 3,080 3.1
C048 Other professional engineers, n.e.c. 390 430 2.4
C05 Architects, urban planners and land surveyors 4,030 4,570 2.7
C051 Architects 2,290 2,660 3.2
C052 Landscape architects220 260 3.0
C053 Urban and land use planners 830 880 1.2
C054 Land surveyors 690 790 2.7
C06 Mathematicians, statisticians and actuaries 420 470 2.4
C061 Mathematicians, statisticians and actuaries 410 450 2.3
C07 Computer and information systems professionals 30,710 36,100 3.5
C071 Information systems analysts and consultants 11,020 12,800 3.2
C072 Database analysts and data administrators 1,120 1,270 2.5
C073 Software engineers and designers 5,090 6,040 3.7
C074 Computer programmers and interactive media developers 10,690 12,660 3.7
C075 Web designers and developers 2,800 3,340 3.9
Produced by: BC Stats Page A

8/2/2019 DR Mainland Southwest Employment Projection 2010 2015
http://slidepdf.com/reader/full/dr-mainland-southwest-employment-projection-2010-2015 32/43
2010 2015
Mainland/Southwest Development Region
Projected Growth Rates: 4-digit
Estimated Employment
Avg Annua
Chng Ove
Years
2010 to 20
C1 Technical occupations related to natural and applied sciences 39,030 43,460 2.3
C11 Technical occupations in physical sciences 2,610 2,910 2.3
C111 Chemical technologists and technicians 1,960 2,180 2.3
C112 Geological and mineral technologists and technicians 630 720 2.6
C113 Meteorological technicians 50 50 1.4
C12 Technical occupations in life sciences 2,440 2,640 1.6
C121 Biological technologists and technicians 540 590 1.8
C122 Agricultural and fish products inspectors 410 420 0.9
C123 Forestry technologists and technicians 260 300 2.8
C124 Conservation and fishery officers 210 210 0.9
C125 Landscape and horticultural technicians and specialists 1,070 1,160 1.7
C13 Technical occupations in civil, mechanical and industrial engineering 3,880 4,310 2.2
C131 Civil engineering technologists and technicians 810 910 2.3
C132 Mechanical engineering technologists and technicians 770 860 2.5
C133 Industrial engineering and manufacturing technologists and technicians 740 810 2.1
C134 Construction estimators 1,580 1,750 2.1
C14 Technical occupations in electronics and electrical engineering 7,960 8,780 2.1
C141 Electrical and electronics engineering technologists and technicians 1,990 2,170 1.8
C142 Electronic service technicians (household and business equipment) 5,030 5,590 2.2
C143 Industrial instrument technicians and mechanics 360 390 1.8
C144 Aircraft instrument, electrical and avionics mechanics, technicians and inspectors 560 610 1.9
C15 Technical occupations in architecture, drafting, surveying and mapping 5,920 6,720 2.7
C151 Architectural technologists and technicians 970 1,120 3.0
C152 Industrial designers 860 980 2.7
C153 Drafting technologists and technicians 3,190 3,640 2.8C154 Land survey technologists and technicians 130 140 1.8
C155 Mapping and related technologists and technicians 670 750 2.2
C16 Other technical inspectors and regulatory officers 3,030 3,290 1.8
C161 Non-destructive testers and inspectors 160 180 3.2
C162 Engineering inspectors and regulatory officers 340 360 1.3
C163 Inspectors in public and environmental health and occupational health and safety 1,310 1,420 1.6
C164 Construction inspectors 1,170 1,280 1.8
C17 Transportation officers and controllers 3,330 3,610 1.7
C171 Air pilots, flight engineers and flying instructors 1,660 1,790 1.6
C172 Air traffic control and related occupations 410 450 1.6
C173 Deck officers, water transport 850 920 1.6
C174 Engineer officers, water transport340 370 1.9
C175 Railway traffic controllers and marine traffic regulators 60 60 1.4
C18 Technical occupations in computer and information systems 9,880 11,210 2.7
C181 Computer network technicians 3,990 4,480 2.4
C182 User support technicians 4,920 5,580 2.7
C183 Systems testing technicians 980 1,160 3.7
D Health occupations 84,050 93,230 2.2
D0 Professional occupations in health 19,920 22,080 2.2
D01 Physicians, dentists and veterinarians 11,270 12,530 2.2
D011 Specialist physicians 3,620 4,020 2.2
Produced by: BC Stats Page A

8/2/2019 DR Mainland Southwest Employment Projection 2010 2015
http://slidepdf.com/reader/full/dr-mainland-southwest-employment-projection-2010-2015 33/43
2010 2015
Mainland/Southwest Development Region
Projected Growth Rates: 4-digit
Estimated Employment
Avg Annua
Chng Ove
Years
2010 to 20
D012 General practitioners and family physicians 4,720 5,250 2.2
D013 Dentists 2,560 2,840 2.2
D014 Veterinarians 350 410 3.1
D02 Optometrists, chiropractors and other health diagnosing and treating professionals 880 970 2.2
D021 Optometrists 270 300 2.2
D022 Chiropractors 430 480 2.2
D023 Other professional occupations in health diagnosing and treating 200 220 2.1
D03 Pharmacists, dietitians and nutritionists 3,490 3,840 2.0
D031 Pharmacists 2,670 2,930 2.0
D032 Dietitians and nutritionists 830 920 2.2
D04 Therapy and assessment professionals 4,260 4,690 2.1
D041 Audiologists and speech-language pathologists 740 790 1.5
D042 Physiotherapists 1,780 1,970 2.2
D043 Occupational therapists 950 1,060 2.2
D044 Other professional occupations in therapy and assessment 790 880 2.1
D1 Nurse supervisors and registered nurses 24,610 27,310 2.2
D11 Nurse supervisors and registered nurses 24,590 27,290 2.2
D111 Head nurses and supervisors 830 920 2.2
D112 Registered nurses 23,780 26,390 2.2
D2 Technical and related occupations in health 18,090 20,090 2.2
D21 Medical technologists and technicians (except dental health) 7,740 8,630 2.3
D211 Medical laboratory technologists and pathologists' assistants 2,050 2,280 2.2
D212 Medical laboratory technicians 2,230 2,480 2.2
D213 Veterinary and animal health technologists and technicians 820 940 3.0
D214 Respiratory therapists, clinical perfusionists and cardio-pulmonary technologists 520 570 2.2D215 Medical radiation technologists 1,280 1,430 2.2
D216 Medical sonographers 320 350 2.2
D217 Cardiology technologists 280 310 2.2
D218 Electroencephalographic and other diagnostic technologists, n.e.c. 60 60 2.6
D219 Other medical technologists and technicians (except dental health) 180 200 2.0
D22 Technical occupations in dental health care 2,490 2,760 2.1
D221 Denturists 120 130 2.1
D222 Dental hygienists and dental therapists 1,350 1,500 2.2
D223 Dental technologists, technicians and laboratory bench workers 1,060 1,170 2.0
D23 Other technical occupations in health care (except dental) 7,800 8,640 2.2
D231 Opticians 860 950 2.0
D232 Midwives and practitioners of natural healing1,430 1,580 2.2
D233 Licensed practical nurses 2,520 2,800 2.2
D234 Ambulance attendants and other paramedical occupations 1,470 1,630 2.1
D235 Other technical occupations in therapy and assessment 1,560 1,730 2.2
D3 Assisting occupations in support of health services 21,430 23,760 2.2
D31 Assisting occupations in support of health services 21,420 23,740 2.2
D311 Dental assistants 3,930 4,360 2.2
D312 Nurse aides, orderlies and patient service associates 13,190 14,650 2.2
D313 Other assisting occupations in support of health services 4,290 4,730 2.0
E Occupations in social science, education, government service and religion 127,780 134,890 1.1
Produced by: BC Stats Page A
8/2/2019 DR Mainland Southwest Employment Projection 2010 2015
http://slidepdf.com/reader/full/dr-mainland-southwest-employment-projection-2010-2015 34/43
2010 2015
Mainland/Southwest Development Region
Projected Growth Rates: 4-digit
Estimated Employment
Avg Annua
Chng Ove
Years
2010 to 20
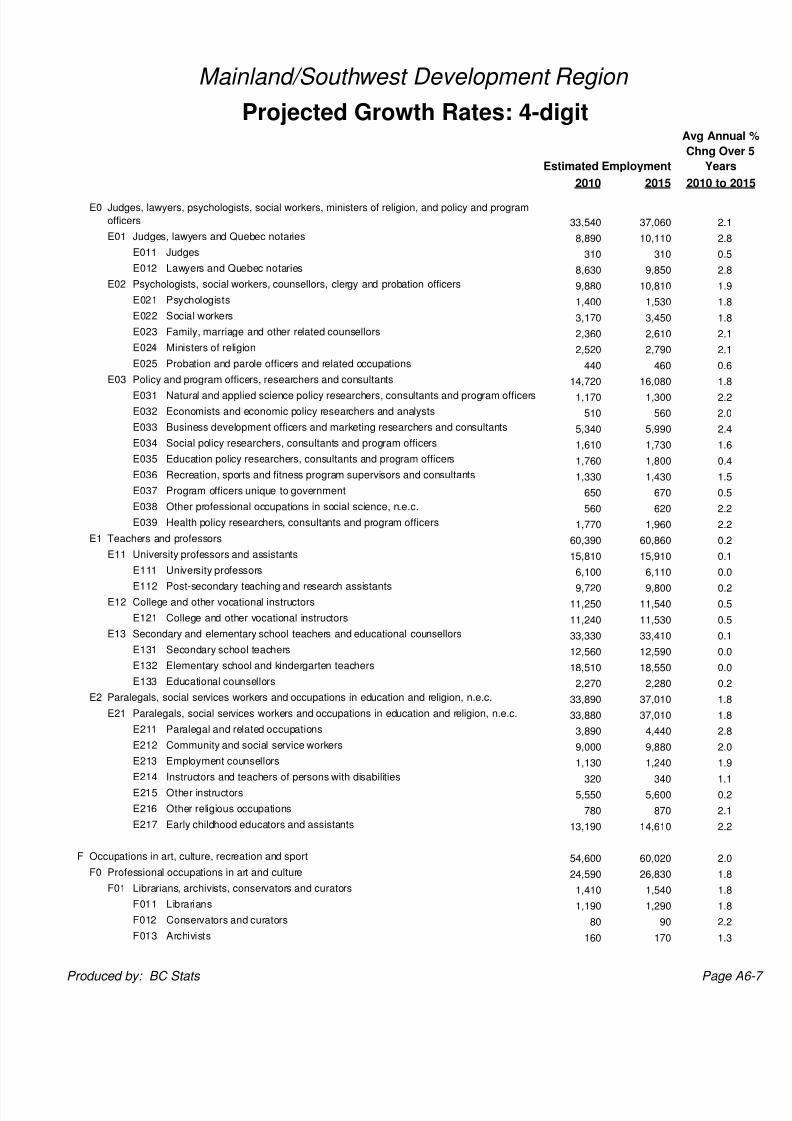
E0
33,540 37,060 2.1
E01 Judges, lawyers and Quebec notaries 8,890 10,110 2.8
E011 Judges 310 310 0.5
E012 Lawyers and Quebec notaries 8,630 9,850 2.8
E02 Psychologists, social workers, counsellors, clergy and probation officers 9,880 10,810 1.9
E021 Psychologists 1,400 1,530 1.8
E022 Social workers 3,170 3,450 1.8
E023 Family, marriage and other related counsellors 2,360 2,610 2.1
E024 Ministers of religion 2,520 2,790 2.1
E025 Probation and parole officers and related occupations 440 460 0.6
E03 Policy and program officers, researchers and consultants 14,720 16,080 1.8
E031 Natural and applied science policy researchers, consultants and program officers 1,170 1,300 2.2
E032 Economists and economic policy researchers and analysts 510 560 2.0
E033 Business development officers and marketing researchers and consultants 5,340 5,990 2.4
E034 Social policy researchers, consultants and program officers 1,610 1,730 1.6
E035 Education policy researchers, consultants and program officers 1,760 1,800 0.4
E036 Recreation, sports and fitness program supervisors and consultants 1,330 1,430 1.5
E037 Program officers unique to government 650 670 0.5
E038 Other professional occupations in social science, n.e.c. 560 620 2.2
E039 Health policy researchers, consultants and program officers 1,770 1,960 2.2
E1 Teachers and professors 60,390 60,860 0.2
E11 University professors and assistants 15,810 15,910 0.1
E111 University professors 6,100 6,110 0.0
E112 Post-secondary teaching and research assistants 9,720 9,800 0.2E12 College and other vocational instructors 11,250 11,540 0.5
E121 College and other vocational instructors 11,240 11,530 0.5
E13 Secondary and elementary school teachers and educational counsellors 33,330 33,410 0.1
E131 Secondary school teachers 12,560 12,590 0.0
E132 Elementary school and kindergarten teachers 18,510 18,550 0.0
E133 Educational counsellors 2,270 2,280 0.2
E2 Paralegals, social services workers and occupations in education and religion, n.e.c. 33,890 37,010 1.8
E21 Paralegals, social services workers and occupations in education and religion, n.e.c. 33,880 37,010 1.8
E211 Paralegal and related occupations 3,890 4,440 2.8
E212 Community and social service workers 9,000 9,880 2.0
E213 Employment counsellors 1,130 1,240 1.9
E214 Instructors and teachers of persons with disabilities 320 340 1.1
E215 Other instructors 5,550 5,600 0.2
E216 Other religious occupations 780 870 2.1
E217 Early childhood educators and assistants 13,190 14,610 2.2
F Occupations in art, culture, recreation and sport 54,600 60,020 2.0
F0 Professional occupations in art and culture 24,590 26,830 1.8
F01 Librarians, archivists, conservators and curators 1,410 1,540 1.8
F011 Librarians 1,190 1,290 1.8
F012 Conservators and curators 80 90 2.2
F013 Archivists 160 170 1.3
Judges, lawyers, psychologists, social workers, ministers of religion, and policy and program
officers
Produced by: BC Stats Page A
8/2/2019 DR Mainland Southwest Employment Projection 2010 2015
http://slidepdf.com/reader/full/dr-mainland-southwest-employment-projection-2010-2015 35/43
2010 2015
Mainland/Southwest Development Region
Projected Growth Rates: 4-digit
Estimated Employment
Avg Annua
Chng Ove
Years
2010 to 20
F02 Writing, translating and public relations professionals 9,210 10,240 2.2
F021 Authors and writers 2,920 3,290 2.5
F022 Editors 1,360 1,500 2.1
F023 Journalists 790 880 2.2
F024 Professional occupations in public relations and communications 2,930 3,230 2.0
F025 Translators, terminologists and interpreters 1,160 1,290 2.2
F03 Creative and performing artists 13,910 15,000 1.6
F031 Producers, directors, choreographers and related occupations 3,000 3,320 2.1
F032 Conductors, composers and arrangers 270 290 2.0
F033 Musicians and singers 4,370 4,550 0.8
F034 Dancers 1,060 1,090 0.5
F035 Actors and comedians 2,870 3,170 2.1
F036 Painters, sculptors and other visual artists 2,360 2,590 2.0
F1 Technical occupations in art, culture, recreation and sport 30,040 33,200 2.1
F11 Technical occupations in libraries, archives, museums and art galleries 1,850 2,000 1.7
F111 Library and archive technicians and assistants 1,540 1,660 1.6
F112 Technical occupations related to museums and art galleries 300 330 1.9
F12
7,010 7,840 2.4
F121 Photographers 1,200 1,380 3.0
F122 Film and video camera operators 640 710 2.2
F123 Graphic arts technicians 360 400 2.1
F124 Broadcast technicians 200 220 2.2
F125 Audio and video recording technicians 1,080 1,190 2.2
F126 Other technical and co-ordinating occupations in motion pictures, broadcastingand the performing arts 2,020 2,250 2.2
F127 Support occupations in motion pictures, broadcasting and the performing arts 1,530 1,700 2.2
F13 Announcers and other performers 930 1,040 2.2
F131 Announcers and other broadcasters 630 700 2.3
F132 Other performers 320 350 2.1
F14 Creative designers and craftspersons 10,610 11,950 2.5
F141 Graphic designers and illustrators 5,790 6,520 2.5
F142 Interior designers 1,850 2,120 2.9
F143 Theatre, fashion, exhibit and other creative designers 1,480 1,660 2.4
F144 Artisans and craftspersons 1,430 1,580 2.1
F145 Patternmakers - Textile, leather and fur products 60 70 2.2
F15 Athletes, coaches, referees and related occupations 9,630 10,380 1.6
F151 Athletes 220 240 2.1
F152 Coaches 1,070 1,120 0.9
F153 Sports officials and referees 690 760 2.1
F154 Program leaders and instructors in recreation, sport and fitness 7,670 8,280 1.6
G Sales and service occupations 351,120 385,320 1.9
G0 Sales and service supervisors 10,140 11,160 2.0
G01 Sales and service supervisors 10,140 11,170 2.0
G011 Retail trade supervisors 5,320 5,820 1.9
G012 Food service supervisors 2,740 3,060 2.3
Photographers, graphic arts technicians and technical and co-ordinating occupations in
motion pictures, broadcasting and the performing arts
Produced by: BC Stats Page A

8/2/2019 DR Mainland Southwest Employment Projection 2010 2015
http://slidepdf.com/reader/full/dr-mainland-southwest-employment-projection-2010-2015 36/43
2010 2015
Mainland/Southwest Development Region
Projected Growth Rates: 4-digit
Estimated Employment
Avg Annua
Chng Ove
Years
2010 to 20
G013 Executive housekeepers 210 240 2.4
G014 Dry cleaning and laundry supervisors 40 40 2.2
G015 Cleaning supervisors 790 860 1.8
G016 Other service supervisors 1,040 1,150 2.1
G1
31,460 34,180 1.7
G11 Sales representatives, wholesale trade 13,830 14,770 1.4
G111 Sales representatives, wholesale trade (non-technical) 13,830 14,780 1.4
G12 Technical sales specialists, wholesale trade 4,840 5,340 2.1
G121 Technical sales specialists, wholesale trade 4,830 5,340 2.1
G13 Insurance and real estate sales occupations and buyers 12,850 14,130 2.0
G131 Insurance agents and brokers 5,670 6,250 2.1
G132 Real estate agents and salespersons 4,960 5,470 2.1
G133 Retail and wholesale buyers 2,130 2,320 1.8
G134 Grain elevator operators 60 60 1.2
G2 Retail salespersons and sales clerks 69,890 76,580 1.9
G21 Retail salespersons and sales clerks 69,880 76,570 1.9
G211 Retail salespersons and sales clerks 69,870 76,560 1.9
G3 Cashiers 27,280 29,960 2.0
G31 Cashiers 27,290 29,970 2.0
G311 Cashiers 27,330 30,020 2.0
G4 Chefs and cooks 22,080 24,640 2.3
G41 Chefs and cooks 22,080 24,640 2.3
G411 Chefs 5,640 6,290 2.3
G412 Cooks 16,430 18,340 2.3G5 Occupations in food and beverage service 23,040 25,770 2.4
G51 Occupations in food and beverage service 23,050 25,780 2.4
G511 Maîtres d'hôtel and hosts/hostesses 2,550 2,850 2.4
G512 Bartenders 2,400 2,690 2.4
G513 Food and beverage servers 18,060 20,210 2.4
G6 Occupations in protective services 20,780 22,170 1.3
G61 Police officers and firefighters 8,050 8,290 0.6
G611 Police officers (except commissioned) 5,360 5,510 0.6
G612 Firefighters 2,720 2,810 0.6
G62 Other occupations in protective service 4,000 4,210 1.0
G621 Sheriffs and bailiffs 420 440 0.9
G622 Correctional service officers 1,170 1,200 0.6
G623 By-law enforcement and other regulatory officers, n.e.c. 580 610 1.0
G624 Other ranks, armed forces 800 820 0.5
G625 Other protective service occupations 1,040 1,150 1.9
G63 Security guards and related occupations 8,660 9,610 2.2
G631 Security guards and related occupations 8,710 9,660 2.2
G7 Occupations in travel and accommodation, including attendants in recreation and sport 18,580 20,450 2.0
G71 Occupations in travel and accommodation 12,080 13,280 2.0
G711 Travel counsellors 3,930 4,390 2.3
G712 Pursers and flight attendants 2,880 3,120 1.6
G713 Airline sales and service agents 2,690 2,910 1.7
Wholesale, technical, insurance, real estate sales specialists, and retail, wholesale and grain
buyers
Produced by: BC Stats Page A

8/2/2019 DR Mainland Southwest Employment Projection 2010 2015
http://slidepdf.com/reader/full/dr-mainland-southwest-employment-projection-2010-2015 37/43
2010 2015
Mainland/Southwest Development Region
Projected Growth Rates: 4-digit
Estimated Employment
Avg Annua
Chng Ove
Years
2010 to 20
G714 Ticket agents, cargo service representatives and related clerks (except airline) 660 720 1.7
G715 Hotel front desk clerks 1,930 2,160 2.4
G72 Tour and recreational guides and casino occupations 3,940 4,360 2.1
G721 Tour and travel guides 940 1,030 2.0
G722 Outdoor sport and recreational guides 280 300 1.6
G723 Casino occupations 2,750 3,050 2.2
G73 Other occupations in travel, accommodation, amusement and recreation 2,560 2,810 2.0
G731 Operators and attendants in amusement, recreation and sport 1,570 1,730 2.0
G732 Other attendants in accommodation and travel 1,010 1,110 1.9
G8 Child care and home support workers 24,280 26,160 1.5
G81 Child care and home support workers 24,280 26,160 1.5
G811 Visiting homemakers, housekeepers and related occupations 7,910 8,770 2.2
G812 Elementary and secondary school teacher assistants 7,290 7,320 0.1
G814 Babysitters, nannies and parents' helpers 9,090 10,080 2.2
G9 Sales and service occupations, n.e.c. 103,630 114,270 2.1
G91 Technical occupations in personal service 6,750 7,480 2.2
G911 Hairstylists and barbers 6,610 7,330 2.2
G912 Funeral directors and embalmers 150 170 2.2
G92 Other occupations in personal service 5,330 5,900 2.1
G921 Image, social and other personal consultants 490 540 2.0
G922 Estheticians, electrologists and related occupations 3,470 3,840 2.1
G923 Pet groomers and animal care workers 1,240 1,370 2.1
G924 Other personal service occupations 110 120 2.3
G93 Cleaners 34,090 37,450 2.0
G931 Light duty cleaners 13,390 14,890 2.2G932 Specialized cleaners 3,480 3,840 2.1
G933 Janitors, caretakers and building superintendents 17,240 18,730 1.7
G94 Butchers and bakers, retail and wholesale 5,620 6,040 1.5
G941 Butchers, meat cutters and fishmongers, retail and wholesale 1,820 1,980 1.8
G942 Bakers 3,820 4,090 1.4
G96 Food counter attendants, kitchen helpers and related occupations 29,090 32,440 2.3
G961 Food counter attendants, kitchen helpers and related occupations 29,090 32,440 2.3
G97 Other sales and related occupations 17,910 19,620 1.9
G971 Service station attendants 1,780 1,950 1.9
G972 Grocery clerks and store shelf stockers 11,660 12,730 1.8
G973 Other elemental sales occupations 4,440 4,900 2.1
G98 Other elemental service occupations4,810 5,320 2.1
G981 Dry cleaning and laundry occupations 1,670 1,850 2.2
G982 Ironing, pressing and finishing occupations 380 420 2.0
G983 Other elemental service occupations 2,790 3,070 2.0
H Trades, transport and equipment operators and related occupations 187,360 204,430 1.8
H0 Contractors and supervisors in trades and transportation 10,010 10,900 1.8
H01 Contractors and supervisors, trades and related workers 9,340 10,170 1.8
H011 Supervisors, machinists and related occupations 370 410 2.5
H012 Contractors and supervisors, electrical trades and telecommunications
occupations 1,050 1,150 1.8
Produced by: BC Stats Page A6
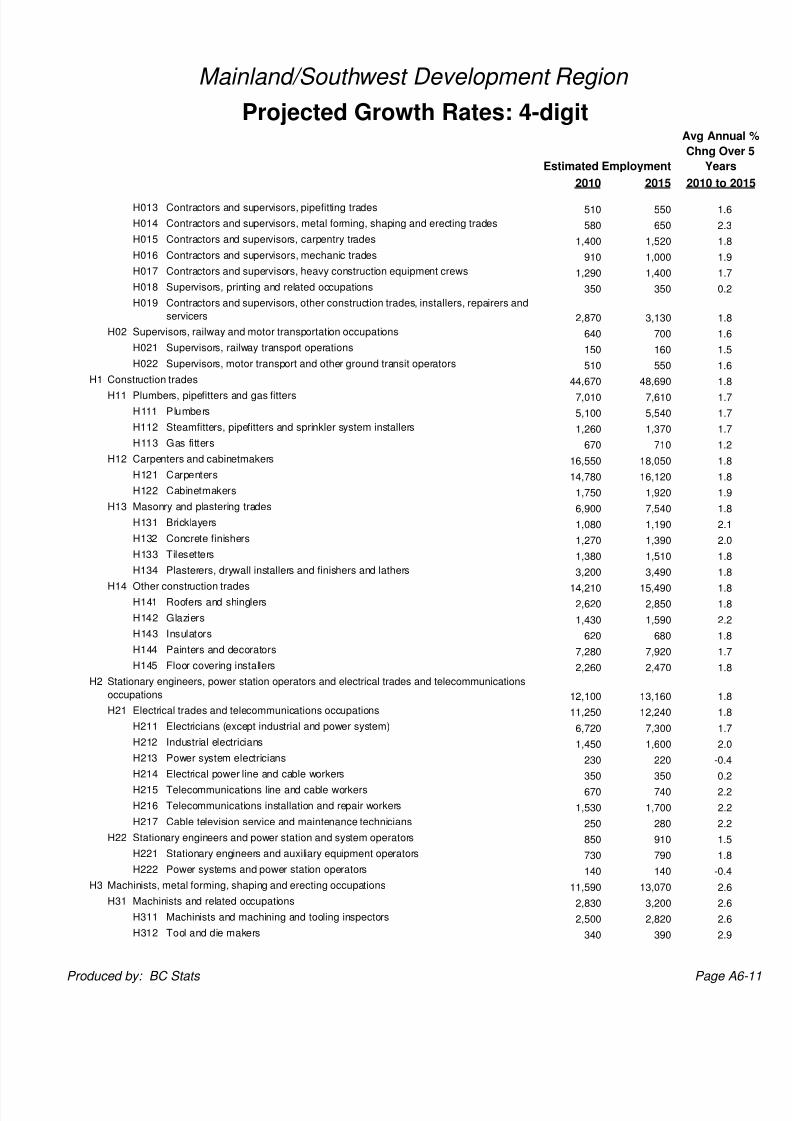
8/2/2019 DR Mainland Southwest Employment Projection 2010 2015
http://slidepdf.com/reader/full/dr-mainland-southwest-employment-projection-2010-2015 38/43
2010 2015
Mainland/Southwest Development Region
Projected Growth Rates: 4-digit
Estimated Employment
Avg Annua
Chng Ove
Years
2010 to 20
H013 Contractors and supervisors, pipefitting trades 510 550 1.6
H014 Contractors and supervisors, metal forming, shaping and erecting trades 580 650 2.3
H015 Contractors and supervisors, carpentry trades 1,400 1,520 1.8
H016 Contractors and supervisors, mechanic trades 910 1,000 1.9
H017 Contractors and supervisors, heavy construction equipment crews 1,290 1,400 1.7
H018 Supervisors, printing and related occupations 350 350 0.2
H019 Contractors and supervisors, other construction trades, installers, repairers and
servicers 2,870 3,130 1.8
H02 Supervisors, railway and motor transportation occupations 640 700 1.6
H021 Supervisors, railway transport operations 150 160 1.5
H022 Supervisors, motor transport and other ground transit operators 510 550 1.6
H1 Construction trades 44,670 48,690 1.8
H11 Plumbers, pipefitters and gas fitters 7,010 7,610 1.7
H111 Plumbers 5,100 5,540 1.7
H112 Steamfitters, pipefitters and sprinkler system installers 1,260 1,370 1.7
H113 Gas fitters 670 710 1.2
H12 Carpenters and cabinetmakers 16,550 18,050 1.8
H121 Carpenters 14,780 16,120 1.8
H122 Cabinetmakers 1,750 1,920 1.9
H13 Masonry and plastering trades 6,900 7,540 1.8
H131 Bricklayers 1,080 1,190 2.1
H132 Concrete finishers 1,270 1,390 2.0
H133 Tilesetters 1,380 1,510 1.8
H134 Plasterers, drywall installers and finishers and lathers 3,200 3,490 1.8
H14 Other construction trades 14,210 15,490 1.8H141 Roofers and shinglers 2,620 2,850 1.8
H142 Glaziers 1,430 1,590 2.2
H143 Insulators 620 680 1.8
H144 Painters and decorators 7,280 7,920 1.7
H145 Floor covering installers 2,260 2,470 1.8
H2
12,100 13,160 1.8
H21 Electrical trades and telecommunications occupations 11,250 12,240 1.8
H211 Electricians (except industrial and power system) 6,720 7,300 1.7
H212 Industrial electricians 1,450 1,600 2.0
H213 Power system electricians 230 220 -0.4
H214 Electrical power line and cable workers 350 350 0.2
H215 Telecommunications line and cable workers 670 740 2.2
H216 Telecommunications installation and repair workers 1,530 1,700 2.2
H217 Cable television service and maintenance technicians 250 280 2.2
H22 Stationary engineers and power station and system operators 850 910 1.5
H221 Stationary engineers and auxiliary equipment operators 730 790 1.8
H222 Power systems and power station operators 140 140 -0.4
H3 Machinists, metal forming, shaping and erecting occupations 11,590 13,070 2.6
H31 Machinists and related occupations 2,830 3,200 2.6
H311 Machinists and machining and tooling inspectors 2,500 2,820 2.6
H312 Tool and die makers 340 390 2.9
Stationary engineers, power station operators and electrical trades and telecommunications
occupations
Produced by: BC Stats Page A6

8/2/2019 DR Mainland Southwest Employment Projection 2010 2015
http://slidepdf.com/reader/full/dr-mainland-southwest-employment-projection-2010-2015 39/43
2010 2015
Mainland/Southwest Development Region
Projected Growth Rates: 4-digit
Estimated Employment
Avg Annua
Chng Ove
Years
2010 to 20
H32 Metal forming, shaping and erecting trades 8,780 9,890 2.5
H321 Sheet metal workers 1,840 2,050 2.3
H322 Boilermakers 150 170 2.9
H323 Structural metal and platework fabricators and fitters 1,580 1,800 2.8
H324 Ironworkers 970 1,080 2.3
H325 Blacksmiths and die setters - - -
H326 Welders and related machine operators 4,230 4,770 2.5
H4 Mechanics 20,590 22,640 2.0
H41 Machinery and transportation equipment mechanics (except motor vehicle) 8,730 9,590 2.0
H411 Construction millwrights and industrial mechanics (except textile) 2,580 2,870 2.2
H412 Heavy-duty equipment mechanics 1,380 1,490 1.7
H413 Refrigeration and air conditioning mechanics 1,430 1,560 1.8
H414 Railway carmen/women 320 350 1.6
H415 Aircraft mechanics and aircraft inspectors 2,220 2,440 2.0
H416 Machine fitters 180 210 2.8
H417 Textile machinery mechanics and repairers 20 30 2.7
H418 Elevator constructors and mechanics 550 600 1.8
H42 Automotive service technicians 10,190 11,210 2.0
H421 Automotive service technicians, truck and bus mechanics and mechanical 8,040 8,840 2.0
H422 Motor vehicle body repairers 2,150 2,380 2.1
H43 Other mechanics 1,690 1,850 1.9
H431 Oil and solid fuel heating mechanics 50 60 2.2
H432 Electric appliance servicers and repairers 710 780 1.9
H433 Electrical mechanics 200 220 1.5
H434 Motorcycle and other related mechanics 260 280 1.7H435 Other small engine and equipment mechanics 440 480 2.2
H5 Other trades, n.e.c. 9,530 10,320 1.7
H51 Upholsterers, tailors, shoe repairers, jewellers and related occupations 3,020 3,320 2.0
H511 Upholsterers 430 470 2.1
H512 Tailors, dressmakers, furriers and milliners 1,940 2,130 1.9
H513 Shoe repairers and shoemakers 190 210 2.1
H514 Jewellers, watch repairers and related occupations 450 490 2.0
H52
1,800 1,880 0.8
H521 Printing press operators 1,170 1,170 0.1
H522 Commercial divers 80 90 2.0
H523 Other trades and related occupations 580 640 2.3
H53 Other installers, repairers and servicers 4,700 5,120 1.8
H531 Residential and commercial installers and servicers 2,790 3,040 1.9
H532 Waterworks and gas maintenance workers 300 310 0.6
H533 Automotive mechanical installers and servicers 590 640 1.9
H534 Pest controllers and fumigators 190 210 2.2
H535 Other repairers and servicers 860 940 1.9
H6 Heavy equipment and crane operators, including drillers 4,400 4,800 1.8
H61 Heavy equipment operators 3,460 3,770 1.8
H611 Heavy equipment operators (except crane) 2,700 2,940 1.8
H612 Public works maintenance equipment operators 760 830 1.7
Printing press operators, commercial divers and other trades and related occupations,
n.e.c.
Produced by: BC Stats Page A6

8/2/2019 DR Mainland Southwest Employment Projection 2010 2015
http://slidepdf.com/reader/full/dr-mainland-southwest-employment-projection-2010-2015 40/43
2010 2015
Mainland/Southwest Development Region
Projected Growth Rates: 4-digit
Estimated Employment
Avg Annua
Chng Ove
Years
2010 to 20
H62 Crane operators, drillers and blasters 890 970 2.0
H621 Crane operators 750 830 2.1
H622 Drillers and blasters - Surface mining, quarrying and construction 130 140 1.8
H623 Water well drillers 10 10 1.8
H7 Transportation equipment operators and related workers, excluding labourers 36,720 39,800 1.7
H71 Motor vehicle and transit drivers 33,210 35,990 1.7
H711 Truck drivers 16,060 17,410 1.7
H712 Bus drivers and subway and other transit operators 5,260 5,690 1.6
H713 Taxi and limousine drivers and chauffeurs 4,010 4,350 1.7
H714 Delivery and courier service drivers 7,940 8,610 1.7
H72 Train crew operating occupations 650 700 1.7
H721 Railway and yard locomotive engineers 340 370 1.7
H722 Railway conductors and brakemen/women 310 340 1.6
H73 Other transport equipment operators and related workers 2,800 3,040 1.7
H731 Railway yard workers 160 180 1.6
H732 Railway track maintenance workers 110 120 1.8
H733 Deck crew, water transport 620 680 1.7
H734 Engine room crew, water transport 10 10 1.6
H735 Lock and cable ferry operators and related occupations 220 240 1.6
H736 Boat operators 190 210 2.0
H737 Air transport ramp attendants 1,500 1,630 1.7
H8 Trades helpers, construction and transportation labourers and related occupations 37,760 41,060 1.7
H81 Longshore workers and material handlers 18,840 20,490 1.8
H811 Longshore workers 2,430 2,650 1.8
H812 Material handlers 16,440 17,880 1.8H82 Trades helpers and labourers 16,840 18,370 1.8
H821 Construction trades helpers and labourers 16,060 17,520 1.8
H822 Other trades helpers and labourers 810 890 2.0
H83 Public works and other labourers, n.e.c. 2,100 2,220 1.1
H831 Public works and maintenance labourers 1,800 1,890 1.0
H832 Railway and motor transport labourers 290 310 1.7
I Occupations unique to primary industry 25,660 26,520 0.7
I0 Occupations unique to agriculture, excluding labourers 11,880 11,710 -0.3
I01 Contractors, operators and supervisors in agriculture, horticulture and aquaculture 5,580 5,580 0.0
I011 Farmers and farm managers 3,270 3,150 -0.7
I012 Agricultural and related service contractors and managers20 20 -0.1
I013 Farm supervisors and specialized livestock workers 360 360 0.3
I014 Nursery and greenhouse operators and managers 430 430 -0.2
I015 Landscaping and grounds maintenance contractors and managers 640 710 2.2
I016 Supervisors, landscape and horticulture 780 830 1.3
I017 Aquaculture operators and managers 30 30 -0.3
I02 Agriculture and horticulture workers 6,320 6,150 -0.6
I021 General farm workers 3,870 3,730 -0.7
I022 Nursery and greenhouse workers 2,460 2,430 -0.3
I1
1,450 1,590 1.9
Occupations unique to forestry operations, mining, oil and gas extraction and fishing,
excluding labourers
Produced by: BC Stats Page A6
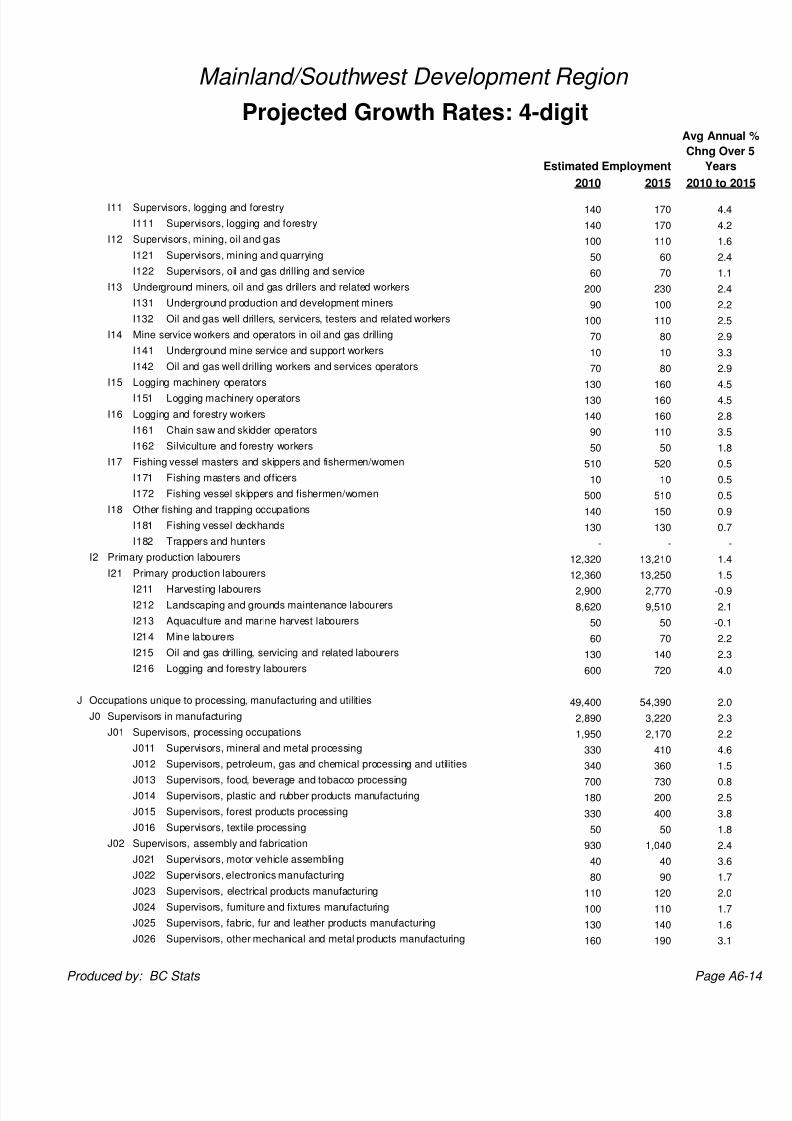
8/2/2019 DR Mainland Southwest Employment Projection 2010 2015
http://slidepdf.com/reader/full/dr-mainland-southwest-employment-projection-2010-2015 41/43
2010 2015
Mainland/Southwest Development Region
Projected Growth Rates: 4-digit
Estimated Employment
Avg Annua
Chng Ove
Years
2010 to 20
I11 Supervisors, logging and forestry 140 170 4.4
I111 Supervisors, logging and forestry 140 170 4.2
I12 Supervisors, mining, oil and gas 100 110 1.6
I121 Supervisors, mining and quarrying 50 60 2.4
I122 Supervisors, oil and gas drilling and service 60 70 1.1
I13 Underground miners, oil and gas drillers and related workers 200 230 2.4
I131 Underground production and development miners 90 100 2.2
I132 Oil and gas well drillers, servicers, testers and related workers 100 110 2.5
I14 Mine service workers and operators in oil and gas drilling 70 80 2.9
I141 Underground mine service and support workers 10 10 3.3
I142 Oil and gas well drilling workers and services operators 70 80 2.9
I15 Logging machinery operators 130 160 4.5
I151 Logging machinery operators 130 160 4.5
I16 Logging and forestry workers 140 160 2.8
I161 Chain saw and skidder operators 90 110 3.5
I162 Silviculture and forestry workers 50 50 1.8
I17 Fishing vessel masters and skippers and fishermen/women 510 520 0.5
I171 Fishing masters and officers 10 10 0.5
I172 Fishing vessel skippers and fishermen/women 500 510 0.5
I18 Other fishing and trapping occupations 140 150 0.9
I181 Fishing vessel deckhands 130 130 0.7
I182 Trappers and hunters - - -
I2 Primary production labourers 12,320 13,210 1.4
I21 Primary production labourers 12,360 13,250 1.5
I211 Harvesting labourers 2,900 2,770 -0.9I212 Landscaping and grounds maintenance labourers 8,620 9,510 2.1
I213 Aquaculture and marine harvest labourers 50 50 -0.1
I214 Mine labourers 60 70 2.2
I215 Oil and gas drilling, servicing and related labourers 130 140 2.3
I216 Logging and forestry labourers 600 720 4.0
J Occupations unique to processing, manufacturing and utilities 49,400 54,390 2.0
J0 Supervisors in manufacturing 2,890 3,220 2.3
J01 Supervisors, processing occupations 1,950 2,170 2.2
J011 Supervisors, mineral and metal processing 330 410 4.6
J012 Supervisors, petroleum, gas and chemical processing and utilities 340 360 1.5
J013 Supervisors, food, beverage and tobacco processing700 730 0.8
J014 Supervisors, plastic and rubber products manufacturing 180 200 2.5
J015 Supervisors, forest products processing 330 400 3.8
J016 Supervisors, textile processing 50 50 1.8
J02 Supervisors, assembly and fabrication 930 1,040 2.4
J021 Supervisors, motor vehicle assembling 40 40 3.6
J022 Supervisors, electronics manufacturing 80 90 1.7
J023 Supervisors, electrical products manufacturing 110 120 2.0
J024 Supervisors, furniture and fixtures manufacturing 100 110 1.7
J025 Supervisors, fabric, fur and leather products manufacturing 130 140 1.6
J026 Supervisors, other mechanical and metal products manufacturing 160 190 3.1
Produced by: BC Stats Page A6
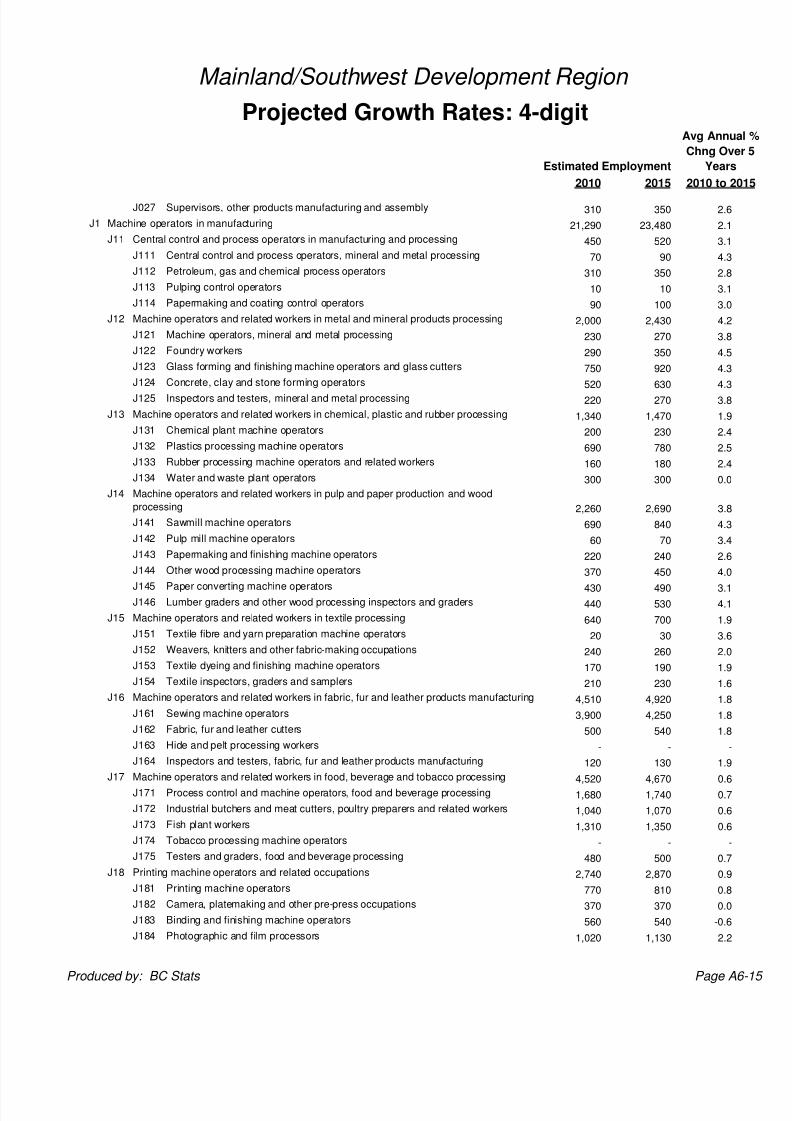
8/2/2019 DR Mainland Southwest Employment Projection 2010 2015
http://slidepdf.com/reader/full/dr-mainland-southwest-employment-projection-2010-2015 42/43
2010 2015
Mainland/Southwest Development Region
Projected Growth Rates: 4-digit
Estimated Employment
Avg Annua
Chng Ove
Years
2010 to 20
J027 Supervisors, other products manufacturing and assembly 310 350 2.6
J1 Machine operators in manufacturing 21,290 23,480 2.1
J11 Central control and process operators in manufacturing and processing 450 520 3.1
J111 Central control and process operators, mineral and metal processing 70 90 4.3
J112 Petroleum, gas and chemical process operators 310 350 2.8
J113 Pulping control operators 10 10 3.1
J114 Papermaking and coating control operators 90 100 3.0
J12 Machine operators and related workers in metal and mineral products processing 2,000 2,430 4.2
J121 Machine operators, mineral and metal processing 230 270 3.8
J122 Foundry workers 290 350 4.5
J123 Glass forming and finishing machine operators and glass cutters 750 920 4.3
J124 Concrete, clay and stone forming operators 520 630 4.3
J125 Inspectors and testers, mineral and metal processing 220 270 3.8
J13 Machine operators and related workers in chemical, plastic and rubber processing 1,340 1,470 1.9
J131 Chemical plant machine operators 200 230 2.4
J132 Plastics processing machine operators 690 780 2.5
J133 Rubber processing machine operators and related workers 160 180 2.4
J134 Water and waste plant operators 300 300 0.0
J14
2,260 2,690 3.8
J141 Sawmill machine operators 690 840 4.3
J142 Pulp mill machine operators 60 70 3.4
J143 Papermaking and finishing machine operators 220 240 2.6
J144 Other wood processing machine operators 370 450 4.0
J145 Paper converting machine operators 430 490 3.1J146 Lumber graders and other wood processing inspectors and graders 440 530 4.1
J15 Machine operators and related workers in textile processing 640 700 1.9
J151 Textile fibre and yarn preparation machine operators 20 30 3.6
J152 Weavers, knitters and other fabric-making occupations 240 260 2.0
J153 Textile dyeing and finishing machine operators 170 190 1.9
J154 Textile inspectors, graders and samplers 210 230 1.6
J16 Machine operators and related workers in fabric, fur and leather products manufacturing 4,510 4,920 1.8
J161 Sewing machine operators 3,900 4,250 1.8
J162 Fabric, fur and leather cutters 500 540 1.8
J163 Hide and pelt processing workers - - -
J164 Inspectors and testers, fabric, fur and leather products manufacturing 120 130 1.9
J17 Machine operators and related workers in food, beverage and tobacco processing 4,520 4,670 0.6
J171 Process control and machine operators, food and beverage processing 1,680 1,740 0.7
J172 Industrial butchers and meat cutters, poultry preparers and related workers 1,040 1,070 0.6
J173 Fish plant workers 1,310 1,350 0.6
J174 Tobacco processing machine operators - - -
J175 Testers and graders, food and beverage processing 480 500 0.7
J18 Printing machine operators and related occupations 2,740 2,870 0.9
J181 Printing machine operators 770 810 0.8
J182 Camera, platemaking and other pre-press occupations 370 370 0.0
J183 Binding and finishing machine operators 560 540 -0.6
J184 Photographic and film processors 1,020 1,130 2.2
Machine operators and related workers in pulp and paper production and wood
processing
Produced by: BC Stats Page A6
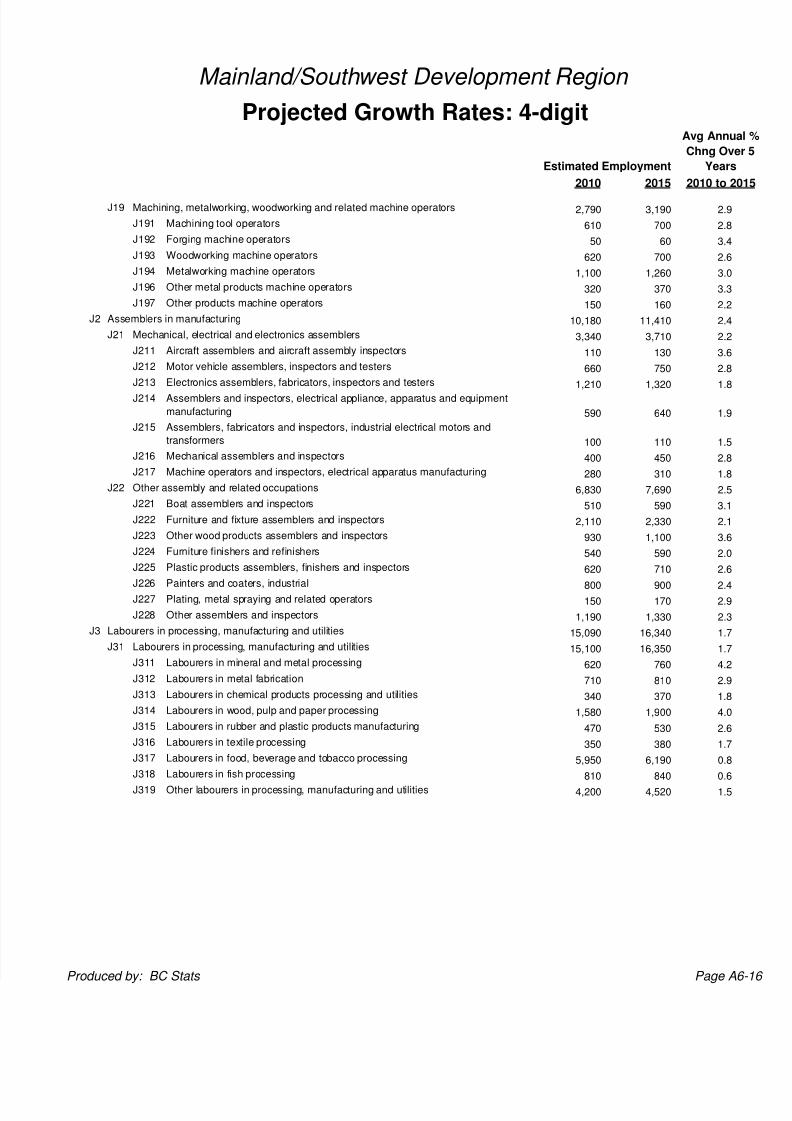
8/2/2019 DR Mainland Southwest Employment Projection 2010 2015
http://slidepdf.com/reader/full/dr-mainland-southwest-employment-projection-2010-2015 43/43
2010 2015
Mainland/Southwest Development Region
Projected Growth Rates: 4-digit
Estimated Employment
Avg Annua
Chng Ove
Years
2010 to 20
J19 Machining, metalworking, woodworking and related machine operators 2,790 3,190 2.9
J191 Machining tool operators 610 700 2.8
J192 Forging machine operators 50 60 3.4
J193 Woodworking machine operators 620 700 2.6
J194 Metalworking machine operators 1,100 1,260 3.0
J196 Other metal products machine operators 320 370 3.3
J197 Other products machine operators 150 160 2.2
J2 Assemblers in manufacturing 10,180 11,410 2.4
J21 Mechanical, electrical and electronics assemblers 3,340 3,710 2.2
J211 Aircraft assemblers and aircraft assembly inspectors 110 130 3.6
J212 Motor vehicle assemblers, inspectors and testers 660 750 2.8
J213 Electronics assemblers, fabricators, inspectors and testers 1,210 1,320 1.8
J214 Assemblers and inspectors, electrical appliance, apparatus and equipment
manufacturing 590 640 1.9
J215 Assemblers, fabricators and inspectors, industrial electrical motors and
transformers 100 110 1.5
J216 Mechanical assemblers and inspectors 400 450 2.8
J217 Machine operators and inspectors, electrical apparatus manufacturing 280 310 1.8
J22 Other assembly and related occupations 6,830 7,690 2.5
J221 Boat assemblers and inspectors 510 590 3.1
J222 Furniture and fixture assemblers and inspectors 2,110 2,330 2.1
J223 Other wood products assemblers and inspectors 930 1,100 3.6
J224 Furniture finishers and refinishers 540 590 2.0
J225 Plastic products assemblers, finishers and inspectors 620 710 2.6
J226 Painters and coaters, industrial800 900 2.4
J227 Plating, metal spraying and related operators 150 170 2.9
J228 Other assemblers and inspectors 1,190 1,330 2.3
J3 Labourers in processing, manufacturing and utilities 15,090 16,340 1.7
J31 Labourers in processing, manufacturing and utilities 15,100 16,350 1.7
J311 Labourers in mineral and metal processing 620 760 4.2
J312 Labourers in metal fabrication 710 810 2.9
J313 Labourers in chemical products processing and utilities 340 370 1.8
J314 Labourers in wood, pulp and paper processing 1,580 1,900 4.0
J315 Labourers in rubber and plastic products manufacturing 470 530 2.6
J316 Labourers in textile processing 350 380 1.7
J317 Labourers in food, beverage and tobacco processing 5,950 6,190 0.8
J318 Labourers in fish processing 810 840 0.6
J319 Other labourers in processing, manufacturing and utilities 4,200 4,520 1.5