Embed Size (px)
Citation preview
Dr. Martin T. AuerMTU Department of Civil & Environmental Engineering
Air Quality andPollution Control
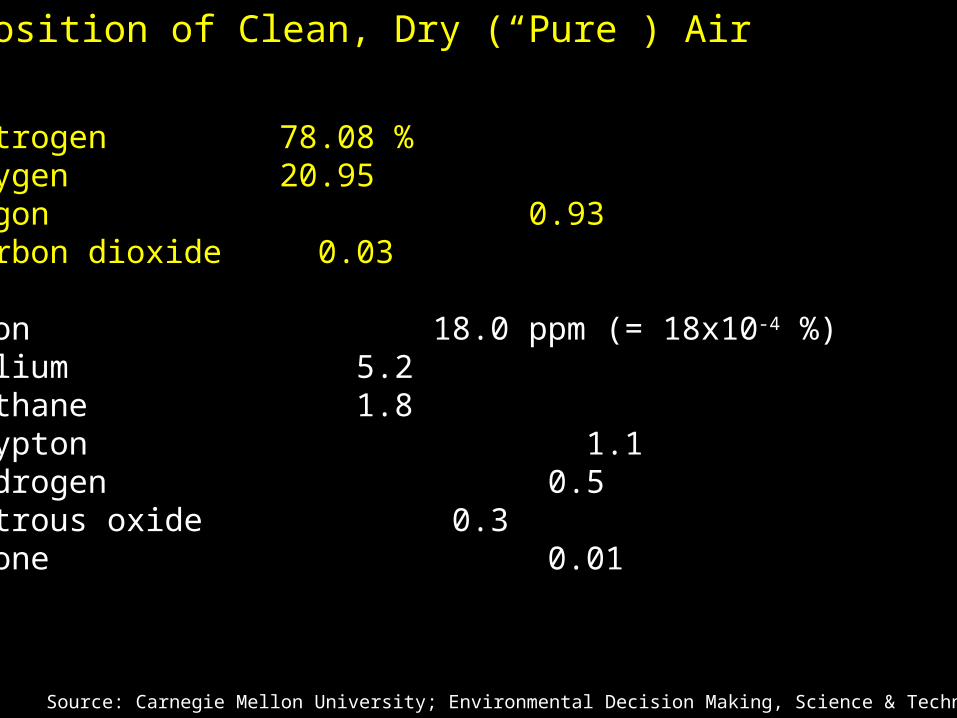
Nitrogen 78.08 %Oxygen 20.95Argon 0.93Carbon dioxide 0.03
Neon 18.0 ppm (= 18x10-4 %)Helium 5.2Methane 1.8Krypton 1.1Hydrogen 0.5Nitrous oxide 0.3Ozone 0.01
Composition of Clean, Dry (“Pure”) Air
Source: Carnegie Mellon University; Environmental Decision Making, Science & Technology

Figure 11.6: Definition of particulate pollutants by size

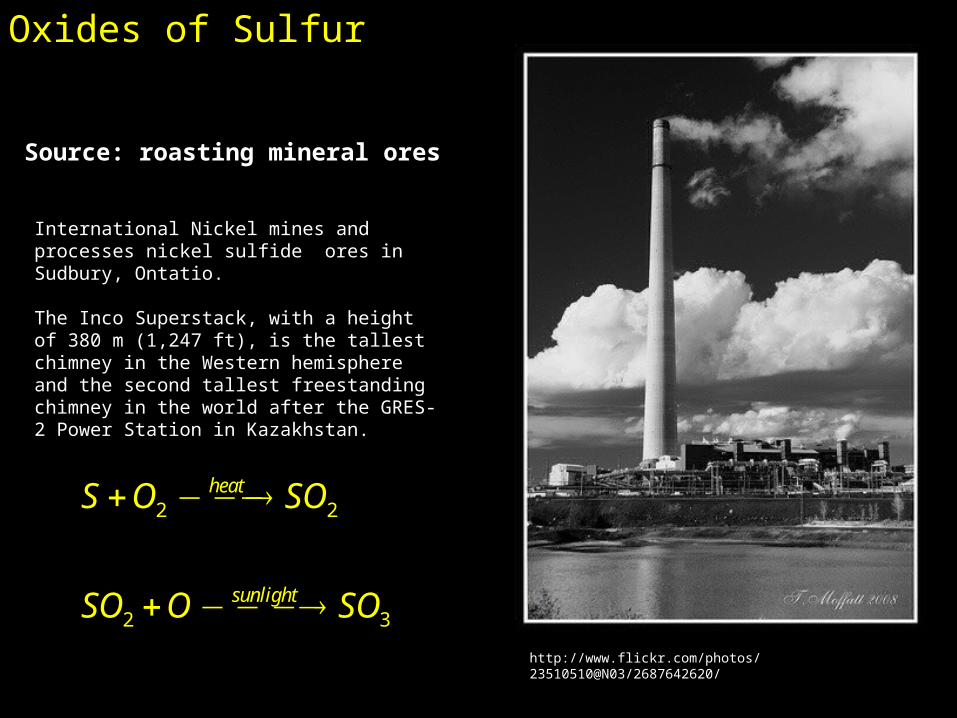
Oxides of Sulfur
H
COO-
CH2C
NH3+
SH
cystine
http://www.fieldmuseum.org/research_collections/ecp/ecp_sites/NPI_web/models_coal.htm
Source: fossil fuels
Oxides of Sulfur
2 2
2 3
heat
sunlight
S O SO
SO O SO
Source: roasting mineral ores
International Nickel mines and processes nickel sulfide ores in Sudbury, Ontatio.
The Inco Superstack, with a height of 380 m (1,247 ft), is the tallest chimney in the Western hemisphere and the second tallest freestanding chimney in the world after the GRES-2 Power Station in Kazakhstan.
http://www.flickr.com/photos/23510510@N03/2687642620/

Oxides of Nitrogen
http://www.uncp.edu/home/mcclurem/ptable/co.htm
Smog event in Santiago, Chile
Nitrogen dioxide

Figure 11.10: Effect of carbon monoxide on health (After W. Agnew. 1968. Proceedings of the Royal Society A307:153.)
CO: Concentration / Exposure
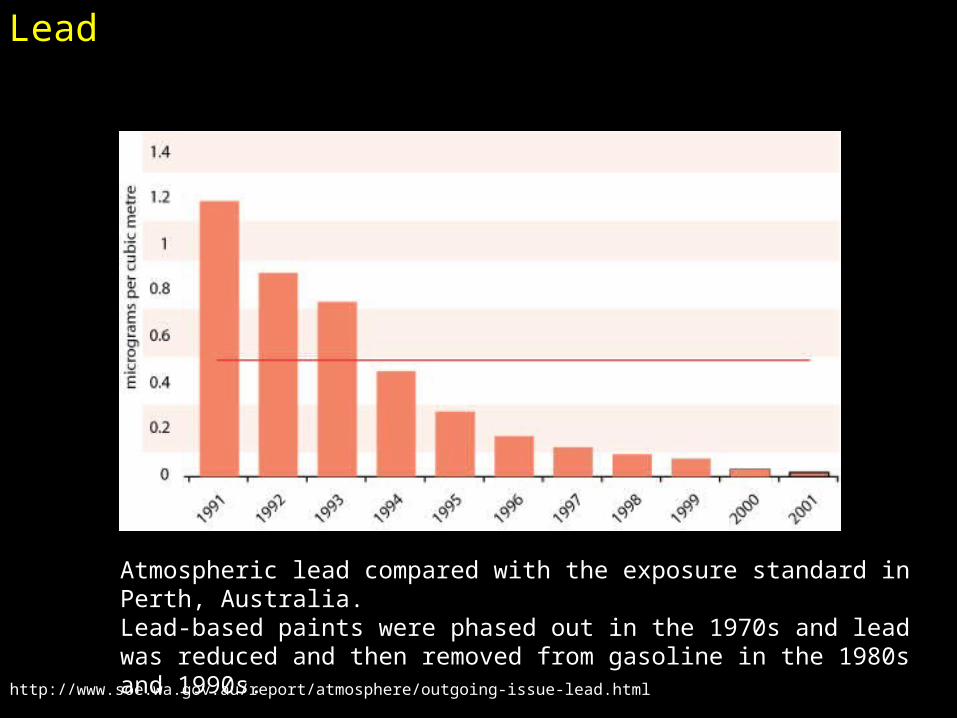
http://www.soe.wa.gov.au/report/atmosphere/outgoing-issue-lead.html
Lead
Atmospheric lead compared with the exposure standard in Perth, Australia.Lead-based paints were phased out in the 1970s and lead was reduced and then removed from gasoline in the 1980s and 1990s.
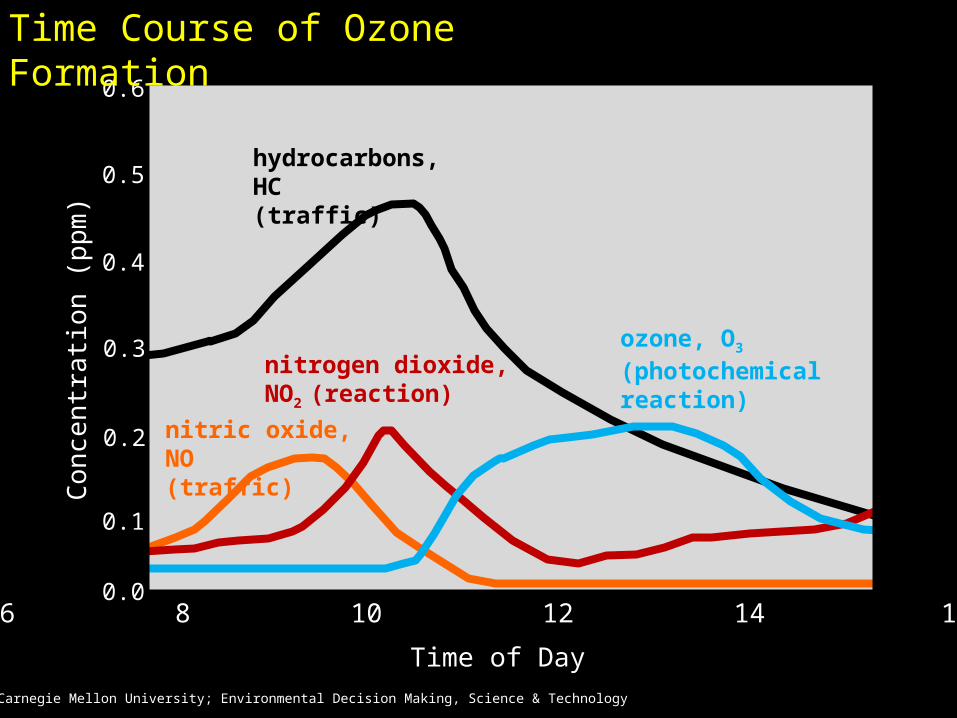
hydrocarbons, HC(traffic)
ozone, O3
(photochemical reaction)
nitric oxide, NO(traffic)
nitrogen dioxide, NO2
(reaction)
4 6 8 10 12 14 16 18
Time of Day
Co
nce
ntr
atio
n (
ppm
)
0.0
0.6
0.5
0.4
0.3
0.2
0.1
Source: Carnegie Mellon University; Environmental Decision Making, Science & Technology
Time Course of Ozone Formation
Ele
vati
on
(m
)
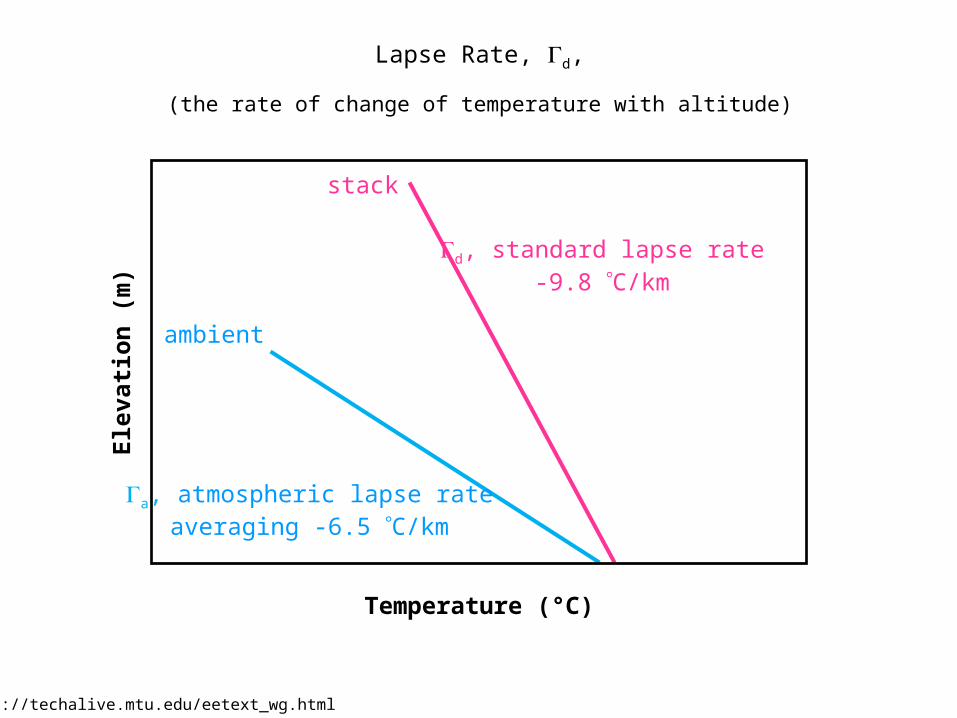
Temperature (°C)
d, standard lapse rate-9.8 C/km
Lapse Rate, d,
a, atmospheric lapse rateaveraging -6.5 C/km
ambient
stack
(the rate of change of temperature with altitude)
http://techalive.mtu.edu/eetext_wg.html
Ele
vati
on
(m
)
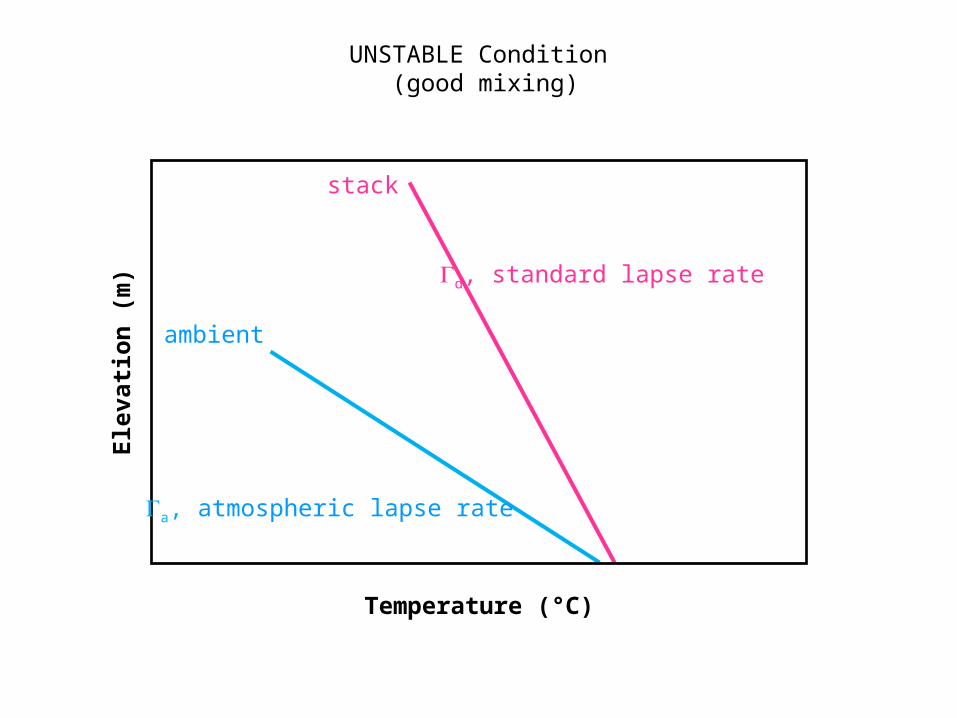
Temperature (°C)
d, standard lapse rate
UNSTABLE Condition (good mixing)
a, atmospheric lapse rate
ambient
stack

Ele
vati
on
(m
)
Temperature (°C)
STABLE Condition (poor mixing)
d, standardlapse rate
a, atmospheric lapse rate
ambientstack
Ele
vati
on
(m
)
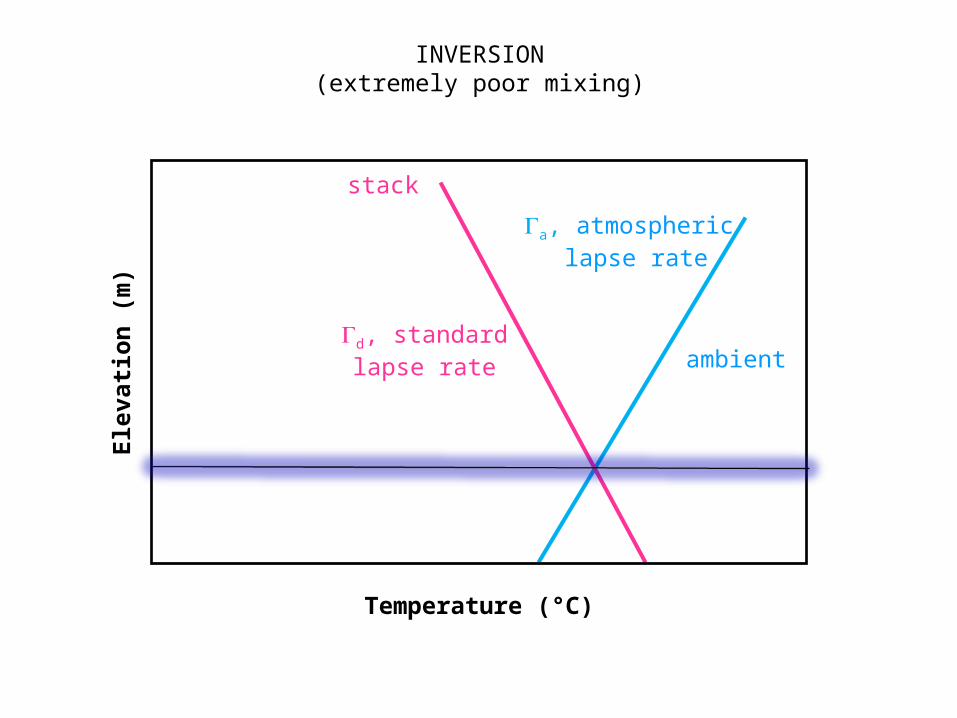
Temperature (°C)
INVERSION(extremely poor mixing)
d, standardlapse rate
a, atmospheric lapse rate
ambient
stack

Inversion
http://www.stuffintheair.com/weather-inversions.html
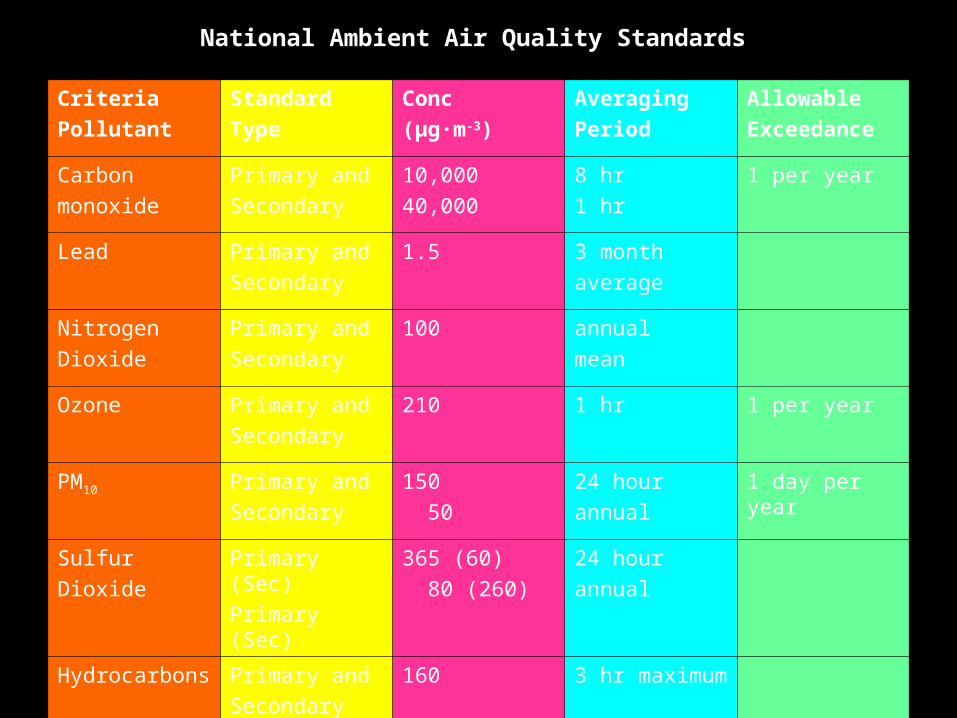
Criteria
Pollutant
Standard
Type
Conc
(µg∙m-3)
Averaging
Period
Allowable
Exceedance
Carbon
monoxide
Primary and
Secondary
10,000
40,000
8 hr
1 hr
1 per year
Lead Primary and
Secondary
1.5 3 month
average
Nitrogen
Dioxide
Primary and
Secondary
100 annual
mean
Ozone Primary and
Secondary
210 1 hr 1 per year
PM10 Primary and
Secondary
150
50
24 hour
annual
1 day per year
Sulfur
Dioxide
Primary (Sec)
Primary (Sec)
365 (60)
80 (260)
24 hour
annual
Hydrocarbons Primary and
Secondary
160 3 hr maximum
National Ambient Air Quality Standards
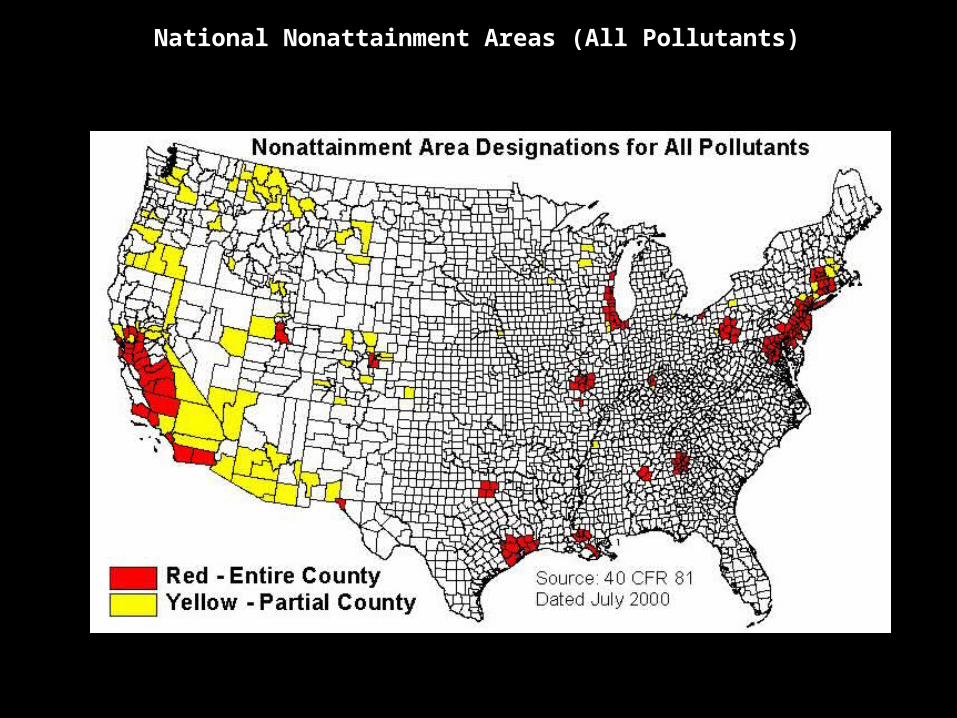
National Nonattainment Areas (All Pollutants)
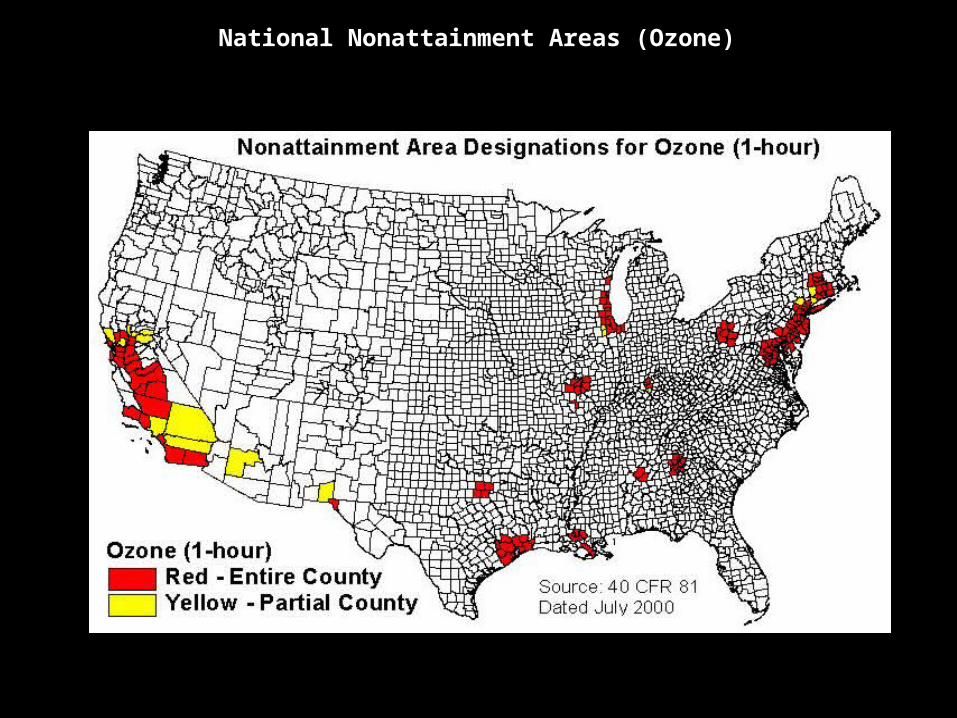
National Nonattainment Areas (Ozone)

National Nonattainment Areas (Sulfur Diozide)

Air Quality Indexhttp://www.deqmiair.org/index.cfm?page=home&sFlush=no


Figure 11.6: Definition of particulate pollutants by size

Figure 12.2: Cyclone used for dust collection

Figure 12.3: Bag filter used for control of particulate air pollutants

Figure 12.4:Scrubber

Figure 12.5: Electrostatic precipitator used for control of particulate air pollutants
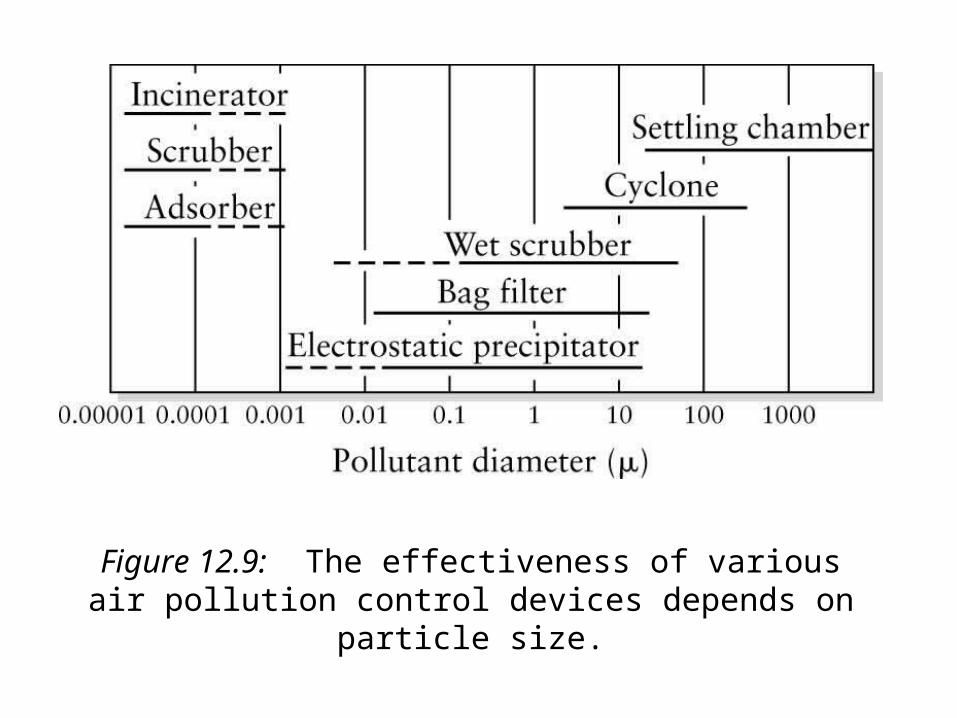
Figure 12.9: The effectiveness of various air pollution control devices depends on particle size.

Catalytic Converter
Noble metals: resistant to corrosion, e.g. platinum and palladium

Acid Rain

Ozone Hole

Global Warming

Gaia Hypothesis
The Gaia Hypothesis, formulated by James Lovelock in the mid-1960s, proposes that our planet functions as a single organism that maintains conditions necessary for its survival.