Embed Size (px)
Citation preview
DMAIC
Dr. Ron LembkeSCM 462
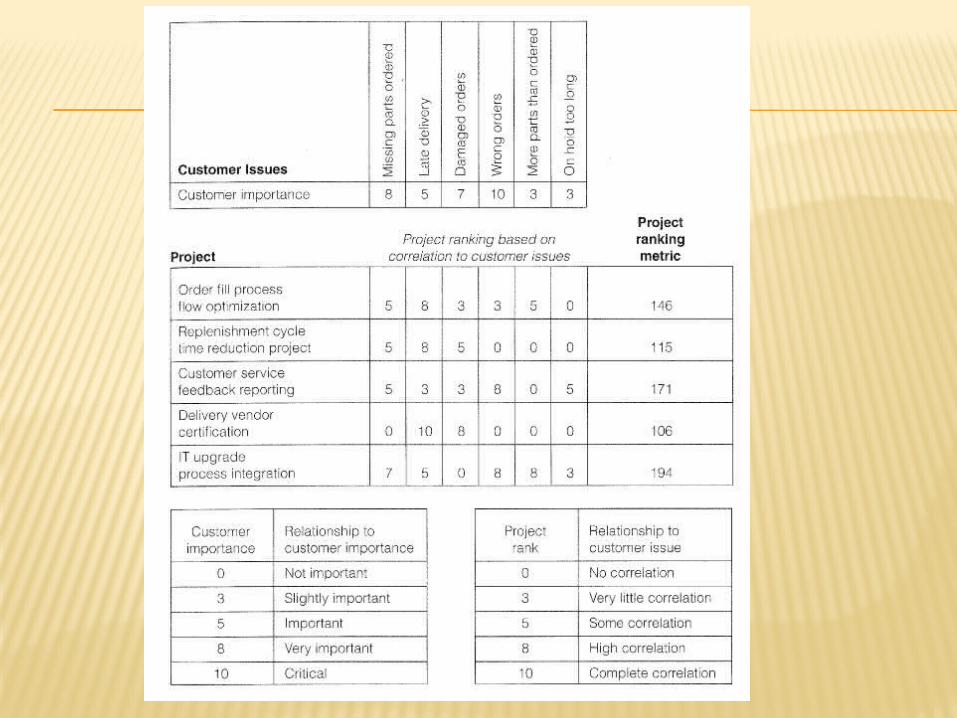
SELECTION CONSIDERATIONS
Financial return Impact on customers and
organizational effectiveness Probability of success Impact on employees Fit to strategy and competitive
advantage
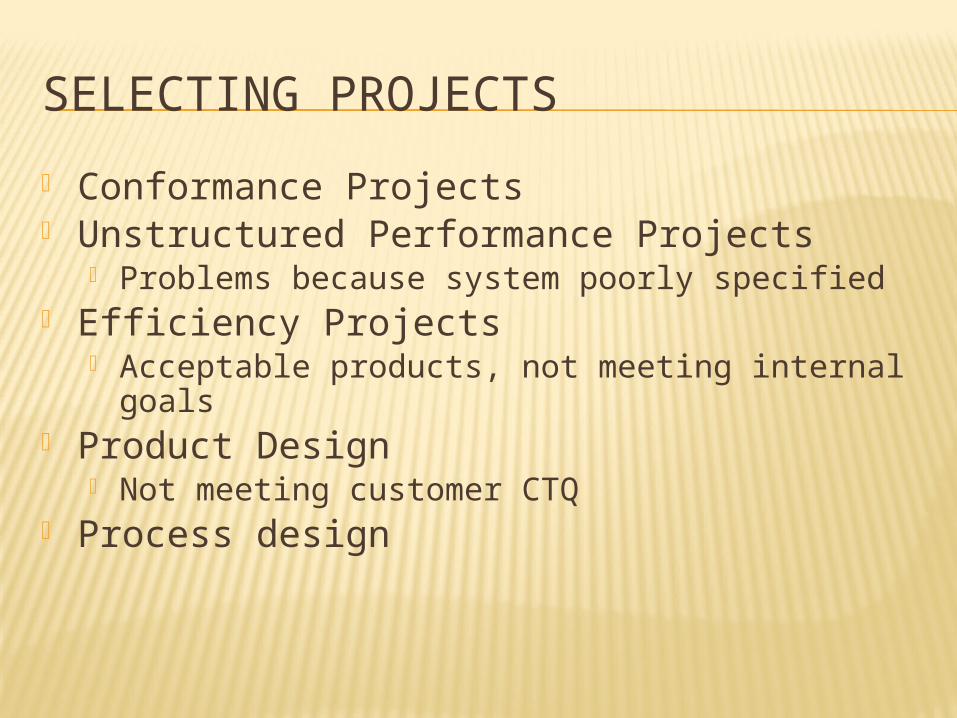
SELECTING PROJECTS
Conformance Projects Unstructured Performance Projects
Problems because system poorly specified Efficiency Projects
Acceptable products, not meeting internal goals Product Design
Not meeting customer CTQ Process design
DMAIC
Define Measure Analyze Improve Control
(Alternate meaning: Dumb Managers Always Ignore Customers)
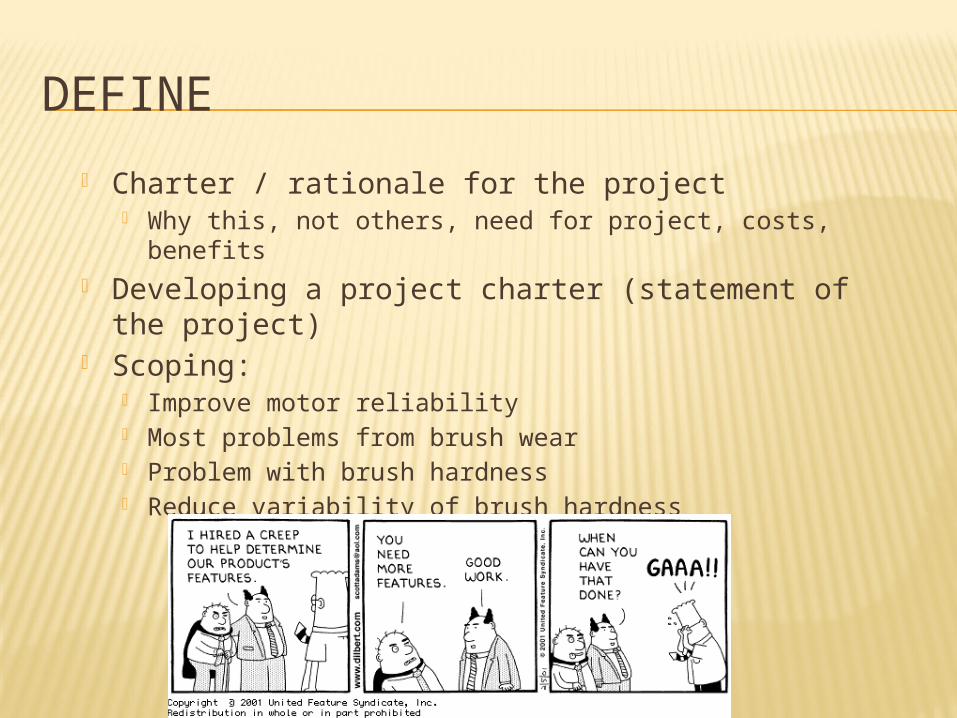
DEFINE
Charter / rationale for the project Why this, not others, need for project, costs, benefits
Developing a project charter (statement of the project)
Scoping: Improve motor reliability Most problems from brush wear Problem with brush hardness Reduce variability of brush hardness
DEFINE
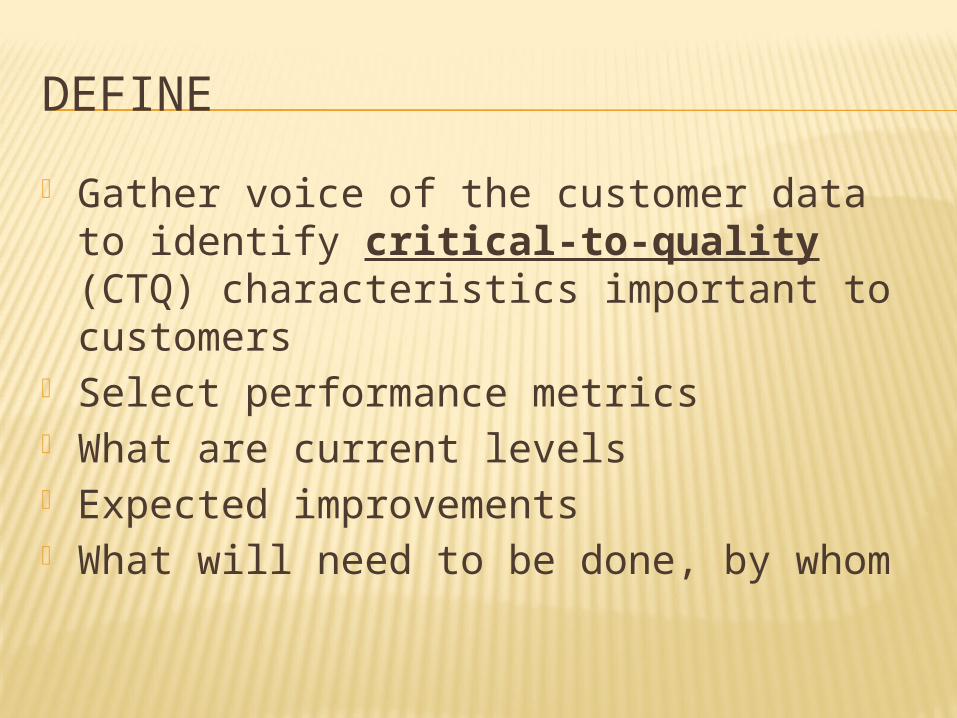
Gather voice of the customer data to identify critical-to-quality (CTQ) characteristics important to customers
Select performance metrics What are current levels Expected improvements What will need to be done, by whom
DEFINE
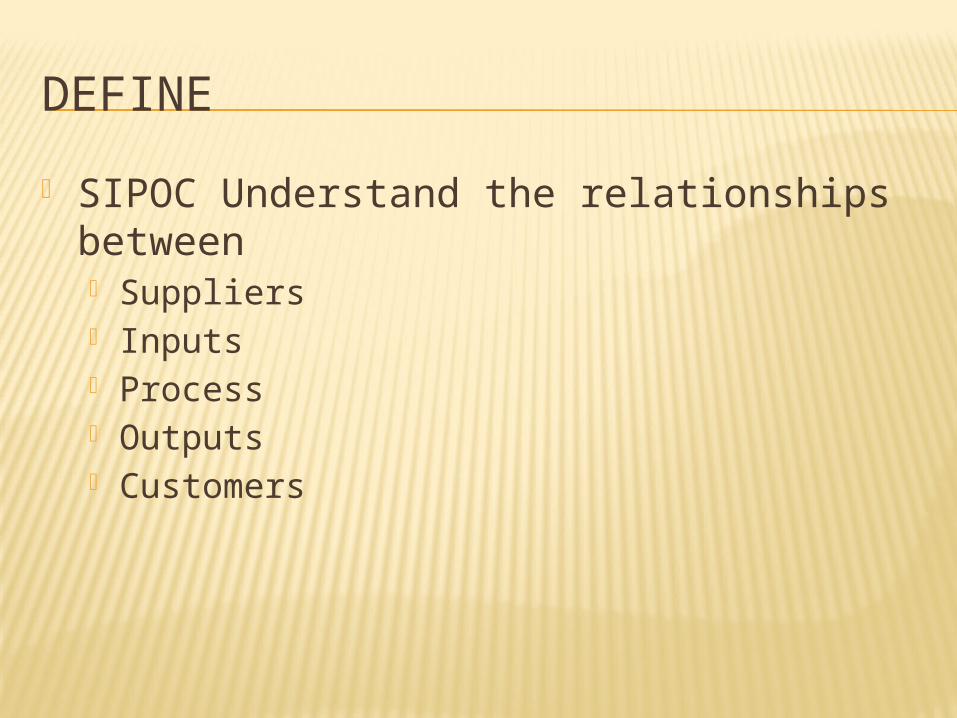
SIPOC Understand the relationships between Suppliers Inputs Process Outputs Customers
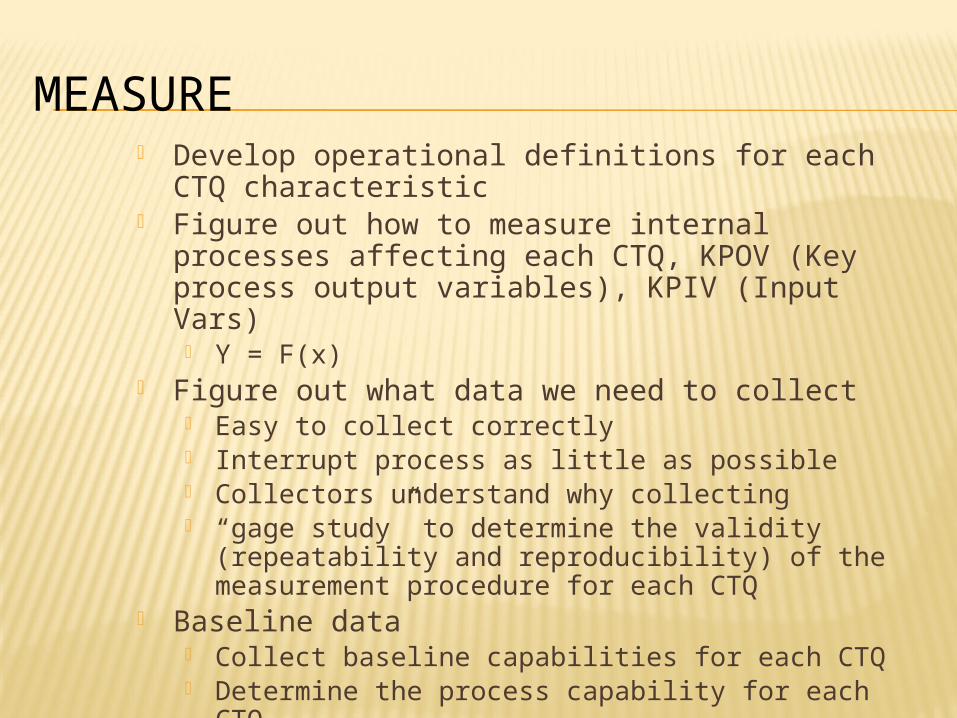
MEASURE Develop operational definitions for each CTQ
characteristic Figure out how to measure internal processes
affecting each CTQ, KPOV (Key process output variables), KPIV (Input Vars) Y = F(x)
Figure out what data we need to collect Easy to collect correctly Interrupt process as little as possible Collectors understand why collecting “gage study” to determine the validity (repeatability
and reproducibility) of the measurement procedure for each CTQ
Baseline data Collect baseline capabilities for each CTQ Determine the process capability for each CTQ
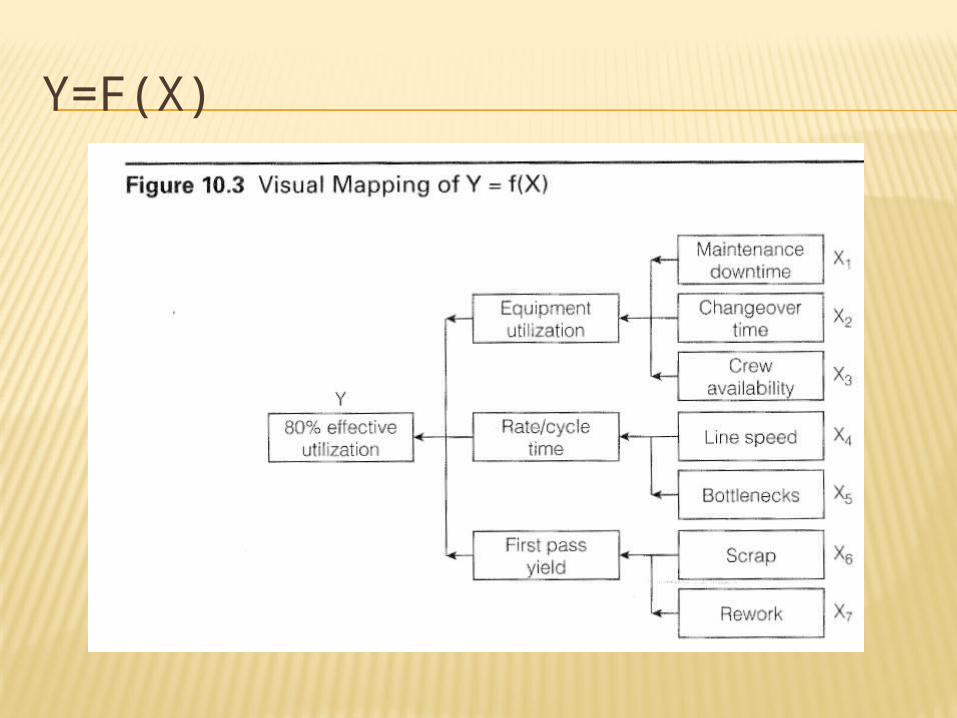
Y=F(X)
CHECKSHEET
Consider all possibilities Be clear – no guessing, training? You might have forgotten some Might need to revise – some cover too
many things Learn about different cases
PARETO CHART
3. Collect the data 5. Tabulate the data – Do as %, if you
want to (6. Put each problem into dollars of
cost, most complaints, lost employee minutes, etc.)
8. Sort biggest to smallest, graph. Analyze – p. 87 – what would you fix?
PARETO CHART
Further study of major categories Grouping together smaller ones Look for common causes
ANALYZE Understand why defects and
variation occur Find the root causes 5W = 1H Identify key causes
Experiments to verify impact Formulate hypothesis, collect data
ANALYZE
Does the process work the way we think it does? Identify upstream variables (x’s) for each CTQ
Process mapping Operationally define each x Collect baseline data for each x Perform studies to determine the validity
(repeatability and reproducibility) of the measurement process for each x
Establish baseline capabilities for each x Understand the effect of each x on each CTQ
IMPROVE
Brainstorm ideas of potential root causes– everyone participates Generate ideas about potential root causes Understanding the process, not solving the problem
yet
CAUSE AND EFFECT DIAGRAM
Ishikawa, Fishbone Puts things in an organized way Separate things into manageable parts (like KJ in
that way) Methods, Materials, Machines, People,
Environment, Information Create the diagram Analyze the diagram – look for cost
effective solutions!
WHY-WHY
Ask “why” 5 times, or as many as it takes
List of next steps, things to investigate
GRAPHS
Scatter plots - Look for trends Run charts – same thing
DJIA = Financial Performance?
IMPROVE
Determine optimal levels of critical x’s to optimize the spread, shape and center of the CTQ’s
Action plans to implement the optimal level of the x’s
Conduct pilot test of the revised process

RUN INTO RESISTANCE?
Force Field!
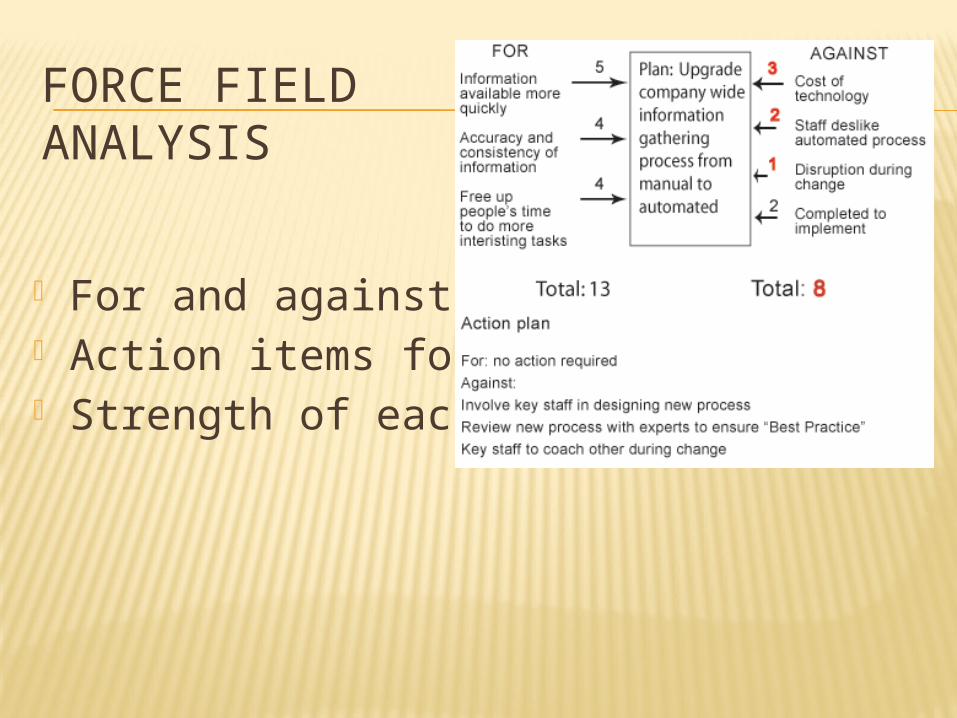
FORCE FIELD ANALYSIS
For and against Action items for each Strength of each
CONTROL
Risk abatement planning and mistake-proofing to avoid potential problems with the revised settings of the x’s
Standardize successful process revisions in training manuals
Control revised settings of the critical x’s Turn revised process over to the process owner
for continuous improvement using the PDSA cycle
REPORT PHASE
Tell everyone what you did, so they can learn from it
HW – P. 97
Questions 3, 4, 6, 7, 10, 16