Embed Size (px)
Citation preview

Dr Sizwe Phakathi29 April 2015
Transforming South Africa’s mining culture of health and safetyThe quest for zero harm and lasting benefits

Perth, Australia 2015 2
Important milestones in the quest for zero harm and lasting benefits
● 1996 – Introduction of Mine Health and Safety Act
● 1998 – Established Mine Health and Safety Council (MHSC) – tripartite institution
● 2003 – Stakeholders agreed 2013 milestones on health and safety
● 2008 – Developed Tripartite Action Plan to achieve health and safety milestones, established
Chamber’s MOSH Learning Hub and Regional Tripartite Health and Safety Forums
● 2010 – Health and safety included in Revised Mining Charter
● 2011 – Approved Safety Culture Transformation Framework for the South African mining sector
● 2012 – Established Chamber’s CEO Elimination of Fatalities Team
● 2014 – Stakeholders agreed 2014 milestones on health and safety

3Perth, Australia 2015
Employment statistics by commodity
2001 2002 2003 2004 2005 2006 2007 2008 2009 2010 2011 2012 2013
Gold 201673 199378 198465 179964 160634 159782 169057 166424 159925 157019 144799 142201 131591
Platinum 99575 111419 127672 150630 155034 168530 186411 199948 184163 181969 194745 197847 191261
Coal 50740 47469 47239 50327 56971 57778 60439 65484 70791 74025 78579 83240 87768
Other 55008 57722 62251 67988 71493 70247 79277 86873 76915 85893 94755 101344 99477
Total 406996 415988 435627 448909 444132 456337 495184 518729 491794 498906 512878 524632 510097
50000
150000
250000
350000
450000
550000

4Perth, Australia 2015
Employment statistics by gender
2001 2002 2003 2004 2005 2006 2007 2008 2009 2010 2011 2012 2013
Female 10554 11445 12645 13757 15553 18443 24659 31029 34432 39874 44286 48420 50179
Male 396440 404543 422983 435152 428579 437894 470491 487700 457362 459032 468592 476212 459918
Total 406994 415988 435628 448909 444132 456337 495150 518729 491794 498906 512878 524632 510097
50000
150000
250000
350000
450000
550000

Perth, Australia 2015 5
Fatalities and fatality frequency rates (per million hours worked) by commodity
2003
2004
2005
2006
2007
2008
2009
2010
2011
2012
2013
2014
Gold
0.37772727272727
3
0.27727272727272
7
0.26909090909090
9
0.33445454545454
5
0.34990909090909
1
0.24995350842546
0.24338081741951
9
0.18305152234007
1
0.16466876848571
5
0.17699692441814
9
0.12840953340140
2
0.16
Platinum
0.23636363636363
6
0.20909090909090
9
0.14545454545454
5
0.11363636363636
4
0.13636363636363
6
0.0875439969379055
0.11034747072831
5
0.0916721265506745
0.0973943932085627
0.0707031427546954
0.0681780305134563
0.04
Coal
0.21363636363636
4
0.19090909090909
1
0.13181818181818
2
0.13181818181818
2
0.11818181818181
8
0.14602697118157
7
0.12031024000556
1
0.0761957010385474
0.0717807242435808
0.0620485964607481
0.0394854704750215
0.05
Other
0.24837531497094
6
0.32491616549880
8
0.19499512512187
2
0.13535575657620
7
0.18854886677035
2
0.13696903951830
7
0.11043481584994
5
0.0885908093096819
0.10713819896029
4
0.0930128729816207
0.0870549316618787
0.06
All
0.29545454545454
6
0.25558019216555
8
0.20352781546811
4
0.2 0.20454545454545
5
0.15180811454321
7
0.15615205221423
6
0.11988825282034
8
0.11186673197986
1
0.10052443237353
5
0.0857064338990512
0.08
0.03
0.08
0.13
0.18
0.23
0.28
0.33
0.38
2003 2004 2005 2006 2007 2008 2009 2010 2011 2012 2013 2014
Gold
149 110 105 114 115 85 81 62 51 53 37 44
Platinum
58 64 47 40 53 36 41 34 37 28 28 15
Coal
23 20 16 20 15 20 18 12 12 11 7 9
Other
40 54 32 26 37 29 27 19 23 20 21 16
All
270 248 200 200 220 170 167 127 123 112 93 84
25
75
125
175
225
275

Perth, Australia 2015 6
Injuries and injury frequency rates (per million hours worked) by commodity
2003 2004 2005 2006 2007 2008 2009 2010 2011 2012 2013 2014
Gold
7.13 6.9 6.06 6.87 6.77 5.72 5.23 4.1 4.37 5.13 4.27 4.11
Platinum
3.56 3.62 3.74 4.11 3.29 3.05 3.15 4.08 3.47 3.37 3.41348832713341
1.57
Coal
1.85 1.74 1.73 2.05 1.5 2.37 2.15 1.82 1.53 1.61 1.48 0.91
Other
1.97 1.92 1.84 1.31 1.26 1.04 1.27 1.23 1.29 1.13 1.02 1.14
All
5.05 4.63 4.08 3.96 3.82 3.03 3.43 3.24 3.02 2.91 2.78 2.13
0.5
2.5
4.5
6.5
2003 2004 2005 2006 2007 2008 2009 2010 2011 2012 2013 2014
Gold
3079 2861 2338 2318 2274 1937 1760 1379 1498 1477 1243 1142
Platinum
738 898 1155 1344 1180 1221 1299 1515 1283 1360 1231 771
Coal
188 187 181 266 205 333 295 273 241 269 263 249
Other
296 314 309 257 261 255 296 271 277 276 276 372
All
4301 4260 3983 4185 3920 3746 3650 3438 3299 3382 3013 2534
250
1250
2250
3250
4250

Perth, Australia 2015 7
Female mineworker injuries and fatalities
2003 2004 2005 2006 2007 2008 2009 2010 2011 2012 2013
Injuries 13 25 26 39 57 80 45 59 90 80 93
Fatalities 0 1 0 1 1 1 1 0 1 5 3
5
15
25
35
45
55
65
75
85
95

8Perth, Australia 2015
My role and first hand experience in the quest for zero harm and lasting benefits (as per my IM4DC ELAM return to work plan)
• Facilitate effective implementation of culture transformation framework for the South African mining
industry as expected by legislation – the Mining Charter
• Conduct in-depth comparative review of South Africa’s mine safety performance against international
benchmark mining countries (Australia, US and Canada):
To guide industry tripartite stakeholders in setting-up 2014 safety milestones including pillars of the culture
transformation framework
• Research, knowledge production and dissemination of research outcomes – write up research papers
for peer-reviewed journal publications and prepare manuscript for book publication
• Initiate, conduct and collaborate with researchers on IM4DC OHS related research and sustainable
development programmes and with researchers locally and internationally
9Perth, Australia 2015
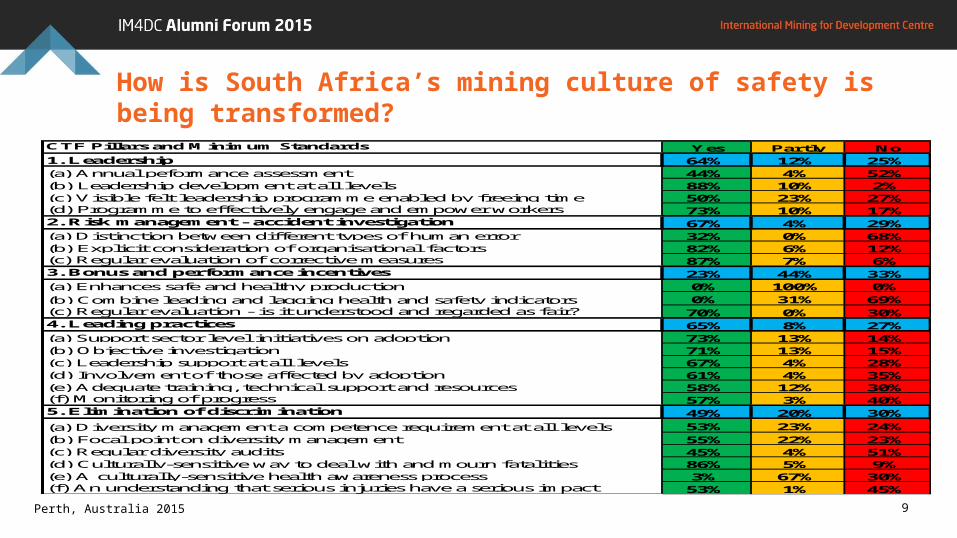
How is South Africa’s mining culture of safety is being transformed?
CTF Pillars and Minimum Standards Yes Partly No1. Leadership 64% 12% 25%(a) Annual peformance assessment 44% 4% 52%(b) Leadership development at all levels 88% 10% 2%(c) Visible felt leadership programme enabled by freeing time 50% 23% 27%(d) Programme to effectively engage and empower workers 73% 10% 17%2. Risk management - accident investigation 67% 4% 29%(a) Distinction between different types of human error 32% 0% 68%(b) Explicit consideration of organisational factors 82% 6% 12%(c) Regular evaluation of corrective measures 87% 7% 6%3. Bonus and performance incentives 23% 44% 33%(a) Enhances safe and healthy production 0% 100% 0%(b) Combine leading and lagging health and safety indicators 0% 31% 69%(c) Regular evaluation - is it understood and regarded as fair? 70% 0% 30%4. Leading practices 65% 8% 27%(a) Support sector level initiatives on adoption 73% 13% 14%(b) Objective investigation 71% 13% 15%(c) Leadership support at all levels 67% 4% 28%(d) Involvement of those affected by adoption 61% 4% 35%(e) Adequate training, technical support and resources 58% 12% 30%(f) Monitoring of progress 57% 3% 40%5. Elimination of discrimination 49% 20% 30%
(a) Diversity management a competence requirement at all levels 53% 23% 24%(b) Focal point on diversity management 55% 22% 23%(c) Regular diversity audits 45% 4% 51%(d) Culturally-sensitive way to deal with and mourn fatalities 86% 5% 9%(e) A culturally-sensitive health awareness process 3% 67% 30%(f) An understanding that serious injuries have a serious impact 53% 1% 45%
10Perth, Australia 2015
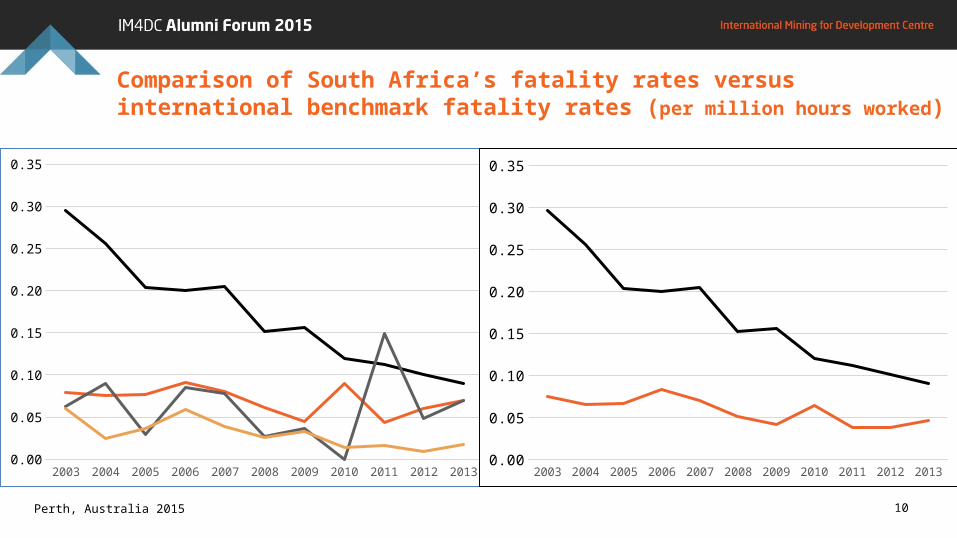
Comparison of South Africa’s fatality rates versus international benchmark fatality rates (per million hours worked)
2003 2004 2005 2006 2007 2008 2009 2010 2011 2012 2013
South Africa
0.29545454545454
6
0.25558019216555
8
0.20352781546811
4
0.2 0.20454545454545
5
0.15180811454321
7
0.15615205221423
6
0.11988825282034
8
0.11186673197986
1
0.10052443237353
5
0.09
USA
0.07950843343113
83
0.07598599426153
77
0.07645245830243
38
0.09128498497049
0.08054137266060
38
0.06133966759918
39
0.04472363350132
39
0.08935457304119
68
0.04411800827940
01
0.06 0.07
Canada (Ontario)
0.06260525508511
18
0.09011606949751
29
0.02987678812576
94
0.08551588885214
88
0.07860481690317
98
0.02687391832478
75
0.03668351662863
81
0 0.14951333409751
3
0.04846158692312
54
0.07
Australia
0.06028308938776
49
0.02494514562477
12
0.03634582690845
12
0.05896439361386
14
0.03873746842896
33
0.02631708801421
12
0.03340956281916
58
0.01373896623621
57
0.01635366530027
9
0.00966542176034394
0.01791008635169
03
0.030.080.130.180.230.280.33
2003 2004 2005 2006 2007 2008 2009 2010 2011 2012 2013
South Africa
0.29545454545454
6
0.25558019216555
8
0.20352781546811
4
0.2 0.20454545454545
5
0.15180811454321
7
0.15615205221423
6
0.11988825282034
8
0.11186673197986
1
0.10052443237353
5
0.09
Combined Australia, Canada & USA
0.07510233509486
4
0.06579306014801
57
0.06619114421766
02
0.08317325495278
65
0.07019070207166
56
0.05144216448715
07
0.04105993484472
68
0.06365045048606
33
0.03826056454534
28
0.03790207267925
17
0.04668202332337
63
0.03
0.13
0.23
0.33

Perth, Australia 2015 11
Research, knowledge production and dissemination of research outcomes
• I continue to publish research related work to
contribute to knowledge generation, dissemination of
research outcomes and thought leadership
• Published peer-reviewed paper selected as 2014 Most
Outstanding Paper in 2013 Volume of Journal of
Organizational Ethnography:
http://www.emeraldinsight.com/10.1108/JOE-05-2012-0026
• Statistics from Emerald Group Publishing indicated
this award-winning paper is in the top three (3) of most
downloaded list of 20 outstanding papers across the
globe

12Perth, Australia 2015
Achievements towards zero harm and lasting benefits ● Since 2003 when stakeholders agreed on road map to zero harm – there has been downward trend
in fatalities for seven consecutive years
● Despite challenging mining conditions, SA platinum mines performed better than mines in
Northern America whereas SA coal performs better than the US coal mines
● Conducted safety culture transformation gap analysis
● Facilitated, conducted and compiled report on health and safety leadership assessment
● Developed guidance document on safety production bonus systems
● Partnered with ICMM to arrange workshop on critical management of health and safety and
participated in technical study to Escondida copper mine, Chile
● Establishment of Chamber’s MOSH Learning Hub and progress of leading practices such as nets
with bolts (fall of ground) and proximity detection systems (transport and machinery) – leading to
80% reduction of fall of ground related fatalities from 131 in 2003 to 26 in 2012.

13Perth, Australia 2015
Achievements (cont’d)● Establishment of Chamber’s CEO Elimination of Fatalities Team strengthened leadership commitment to safety
● Strong collaboration between Business, Government and Orgarnised Labour
● Agreement and signing of new ten-year (2014) mine health and safety milestones
● Launch of Centre of Excellence – innovation and technology to drive future of SA mining
● Published some peer-reviewed articles on occupational safety – one voted 2014 most outstanding paper by
Emerald Group Publishers
● Book manuscript chapters 80% completed and book publication proposal to be sent to Emerald Group
Publishers by end of May 2015
● Collaborating with Accelerated Learning Laboratory (ALL)/Centre for Safety and IM4DC on two occupational
safety research in extractive industry
* Benchmarking status of safety in developing countries
* Safety challenges of informal coal mining in KwaZulu Natal peri-urban area

14Perth, Australia 2015
Challenges towards achieving goal of zero harm● Effective implementation of safety culture transformation framework – especially for smaller and
emerging mining companies
● Empowerment of workers to refrain from dangerous work and take ownership of their safety
● Fall of ground, General and TMM risks present significant obstacle to achieving zero harm
● Prevention of fire accidents and emergency preparedness
● Faster adoption of research and leading practices (proximity detection systems and safety nets
● Women health, safety and security in the mines
● Depth (geology), literacy and skills
● Labour relations environment
● Finding enough time to write up peer review journal articles and completing book manuscript for publication