Embed Size (px)
Citation preview
Exposure Analysis for Risk Assessment Dr. V. Sudershan Rao National Institute of Nutrition Hyderabad
Seminar on Regulatory Practices: Interpretation and Compliance, 18th April,2016
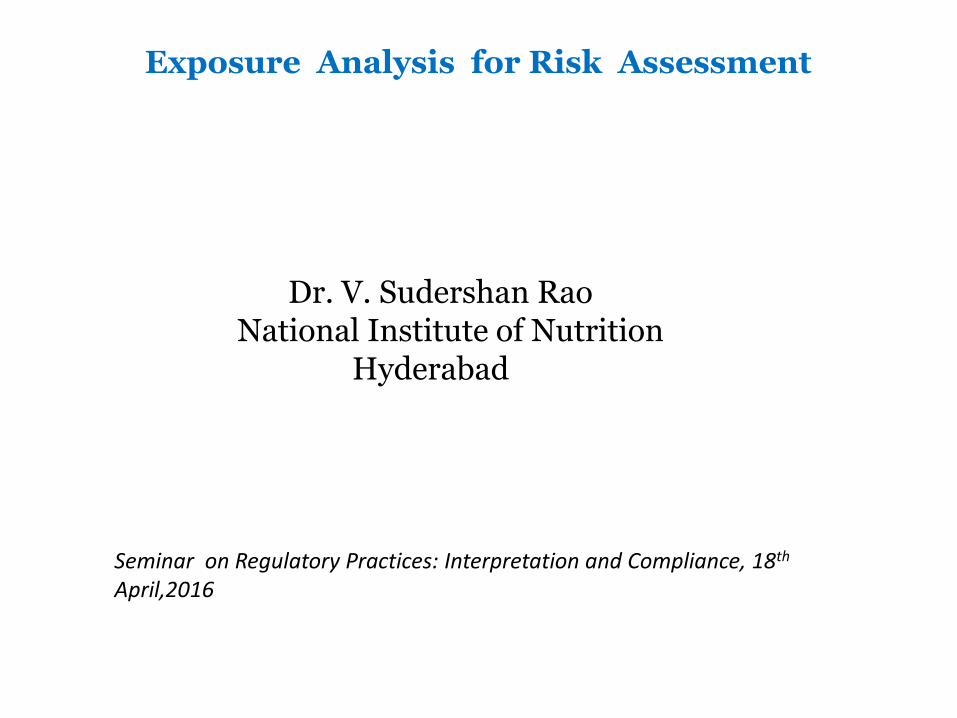
Exposure analysis
Nutrients Macro RDA Micro RDA & ULs Non –Nutrients Additives Permitted Levels ADI Contaminants Metal & Crop contaminants Tolerance limits PTWI/TDI Residues Pesticide Residues, Antibiotic & pharmacologically active substances MRLs- ADI Toxins Naturally occurring toxins Tolerance Limits
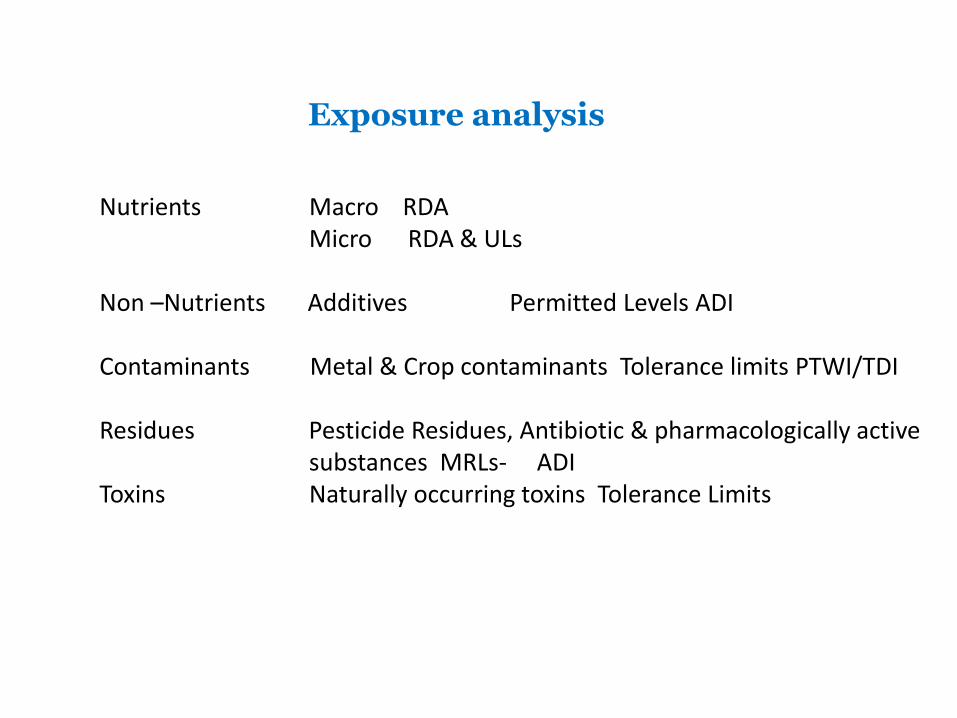
A typical diet survey Age 18 years male Sedentary worker ( 2320 calories)
Milk 200ml+ 10 grams sugar Rice 243 g Brinjal curry :Brinjal 45.0g +onion 3.3g+3.94 oil+13.3 dry chillies+0.3g Turmeric +1.31g iodized salt) Tea : Milk 88.9+ sugar 8.9g Chapatti : wheat flour 112.5g +2.5g salt+oil 10.0g Curry for chapathi :Potato 82.0g+onion 9.0g+Green chillies3.5g+ salt 2.3g+ oil 4.7g + zeera 1.1g+Curry leaves 1.17g+Turmeric 0.5g.

Food group wise consumption Cereals and millets 355g Leafy vegetables 1.1 g Other vegetables 65.0g Roots & Tubers 94.0 g Condiments 19.0 g Fats 18.1g Sugar 18.9g Other foods 6.1g
Nutrient wise intake (Using NVIF, NIN) Calories 1916 Thiamin 1.0mg Protein 46.0g Riboflavin 0.8mg Fats (invisible) 41.0g Niacin 11.6mg Fats visible 18.1 g Vitamin C 44.7mg Calcium 745.0 mg Iron 9.9mg Phosphorus 1255.0mg Folic acid 111.1mg Vitamin A 202.0 Zinc 6.9mg

Average Intake of Foodstuffs (per CU/day) as % of RDA by Period of Survey
110
85
20
90
77
112
7077
102
80
23
82
61
82
65
9798
68
38
78
57
88
60
70
86
70
40
82
55
120
70
47
8380
43
75
59
116
80
43
0
20
40
60
80
100
120
140
Cereals Pulses GLV O.Veg. MMP Roots Fats Sugar
1975-77 1988-90 1996-97 2005-06 2011-12
Percent
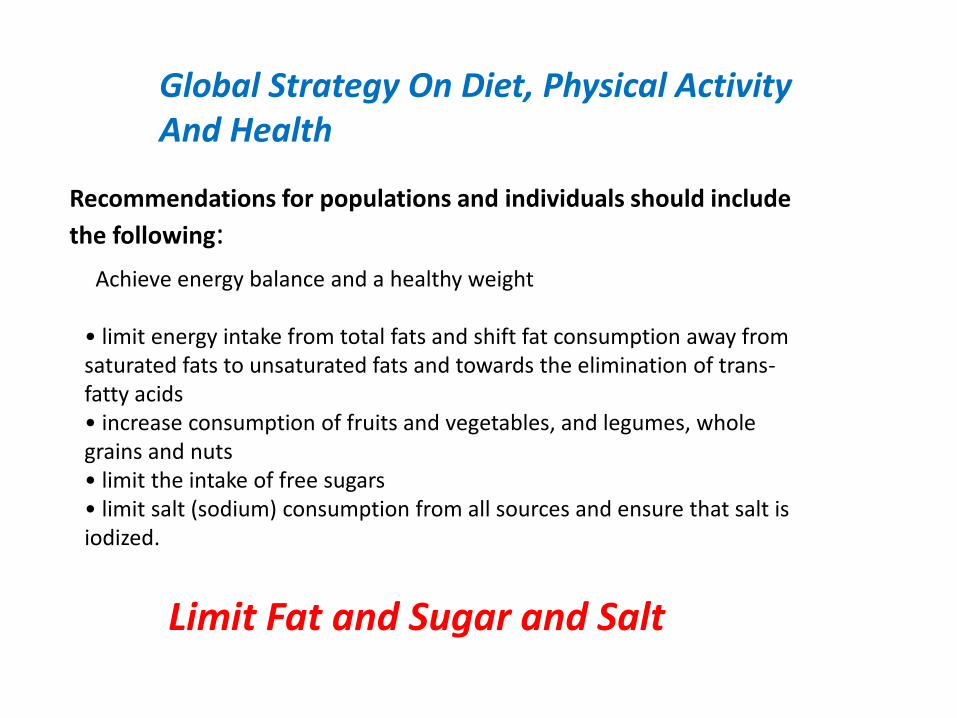
Achieve energy balance and a healthy weight • limit energy intake from total fats and shift fat consumption away from saturated fats to unsaturated fats and towards the elimination of trans-fatty acids • increase consumption of fruits and vegetables, and legumes, whole grains and nuts • limit the intake of free sugars • limit salt (sodium) consumption from all sources and ensure that salt is iodized.
Limit Fat and Sugar and Salt
Recommendations for populations and individuals should include
the following:
Global Strategy On Diet, Physical Activity And Health
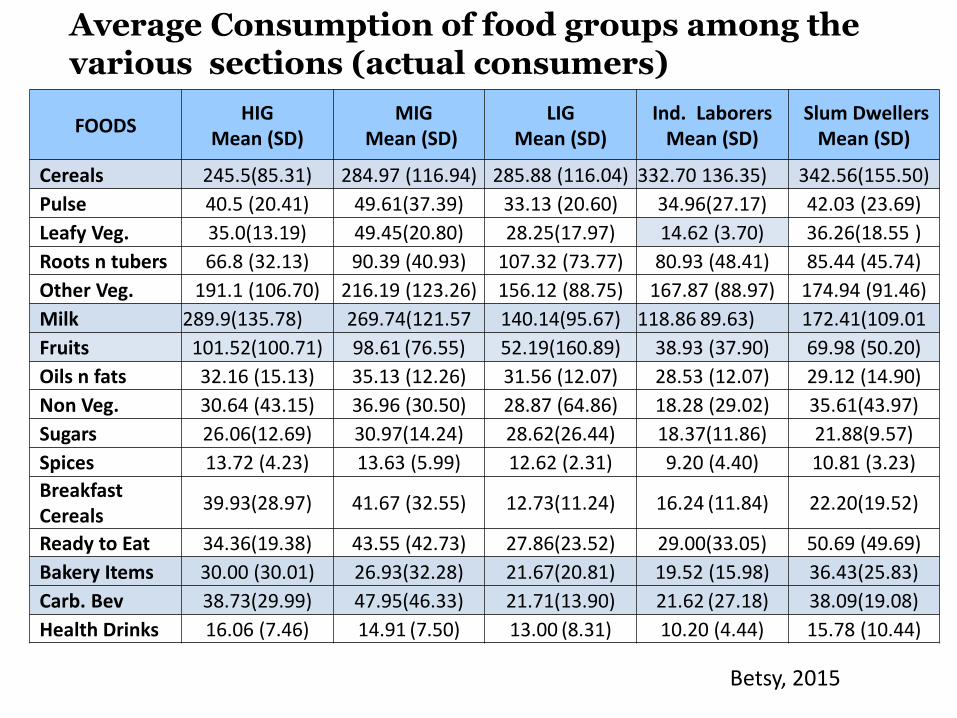
Average Consumption of food groups among the various sections (actual consumers)
FOODS HIG
Mean (SD) MIG
Mean (SD) LIG
Mean (SD) Ind. Laborers
Mean (SD) Slum Dwellers
Mean (SD)
Cereals 245.5(85.31) 284.97 (116.94) 285.88 (116.04) 332.70 136.35) 342.56(155.50)
Pulse 40.5 (20.41) 49.61(37.39) 33.13 (20.60) 34.96(27.17) 42.03 (23.69)
Leafy Veg. 35.0(13.19) 49.45(20.80) 28.25(17.97) 14.62 (3.70) 36.26(18.55 )
Roots n tubers 66.8 (32.13) 90.39 (40.93) 107.32 (73.77) 80.93 (48.41) 85.44 (45.74)
Other Veg. 191.1 (106.70) 216.19 (123.26) 156.12 (88.75) 167.87 (88.97) 174.94 (91.46)
Milk 289.9(135.78) 269.74(121.57 140.14(95.67) 118.86 89.63) 172.41(109.01
Fruits 101.52(100.71) 98.61 (76.55) 52.19(160.89) 38.93 (37.90) 69.98 (50.20)
Oils n fats 32.16 (15.13) 35.13 (12.26) 31.56 (12.07) 28.53 (12.07) 29.12 (14.90)
Non Veg. 30.64 (43.15) 36.96 (30.50) 28.87 (64.86) 18.28 (29.02) 35.61(43.97)
Sugars 26.06(12.69) 30.97(14.24) 28.62(26.44) 18.37(11.86) 21.88(9.57)
Spices 13.72 (4.23) 13.63 (5.99) 12.62 (2.31) 9.20 (4.40) 10.81 (3.23)
Breakfast Cereals
39.93(28.97) 41.67 (32.55) 12.73(11.24) 16.24 (11.84) 22.20(19.52)
Ready to Eat 34.36(19.38) 43.55 (42.73) 27.86(23.52) 29.00(33.05) 50.69 (49.69)
Bakery Items 30.00 (30.01) 26.93(32.28) 21.67(20.81) 19.52 (15.98) 36.43(25.83)
Carb. Bev 38.73(29.99) 47.95(46.33) 21.71(13.90) 21.62 (27.18) 38.09(19.08)
Health Drinks 16.06 (7.46) 14.91 (7.50) 13.00 (8.31) 10.20 (4.44) 15.78 (10.44)
Betsy, 2015

Major foods contributing to fat intake (g/day)
FOODS HIG MIG LIG IL SD
Wheat 0.8 ± 0.56 0.9 ± .64 0.9 ± 1.08 0.6 ± 0.86 0.6 ± 0.48
Rice 0.9 ± 0.35 1.1 ±0.46 1.1 ± 0.46 1.4 ± 0.60 1.4 ± 0.71
Milk (toned) 11.9+ 5.56 11.1 ±4.98 4.7 ± 4.19 4.6 ± 3.76 7.1 ± 4.47
Cooking oil 30.4 ± 15.58 32.2 ±10.51
27.7 ±
13.75
25.6 ±
10.99 28.5 ± 15.35
Other fats 2.9 ± 5.00 2.9 ± 5.01 2.0 ± 4.22 2.9 ± 5.91 0.6 ± 1.48
Egg (hen) 1.3 ± 1.79 1.8 ± 1.59 2.9 ± 2.75 1.5 ± 1.45 2.2 ± 1.64
Goat meat 0.3 ± 0.59 0.3 ± 0.37 0.4 ± 0.47 0.3 ± 0.36 0.8 ± 0.89
Red chili pwdr 0.5 ± 0.40 0.3 ± 0.19 0.3 ± 0.23 0.4 ± 0.32 0.5 ± 0.39
Pastries 1.0+ 3.95 0.1 ± 0.23 0.04 ± 0.01 0.1 ± 0.31 0.2 ± 0.48
Puffs 1.1+ 2.28 0.2 ± 0.45 0.05 ± 0.19 0.4 ± 0.87 0.3 ± 0.71
Bakery
Biscuits 5.8+ 6.87 5.8 ± 6.87 3.7 ± 5.56 2.9 ± 2.83 3.7 ± 6.42
Potato chips 1.5+ 4.36 1.5 ± 4.36 0.4 ± 1.04 0.2 ± 0.94 0.5 ± 1.70
Health drinks 1.1+ 0.93 1.1 ± 0.93 0.4 ± 0.74 0.2 ± 0.42 0.4 ± 0.89
Total 47.46 63.82 47.29 43.03 49.94 Betsy, 2015
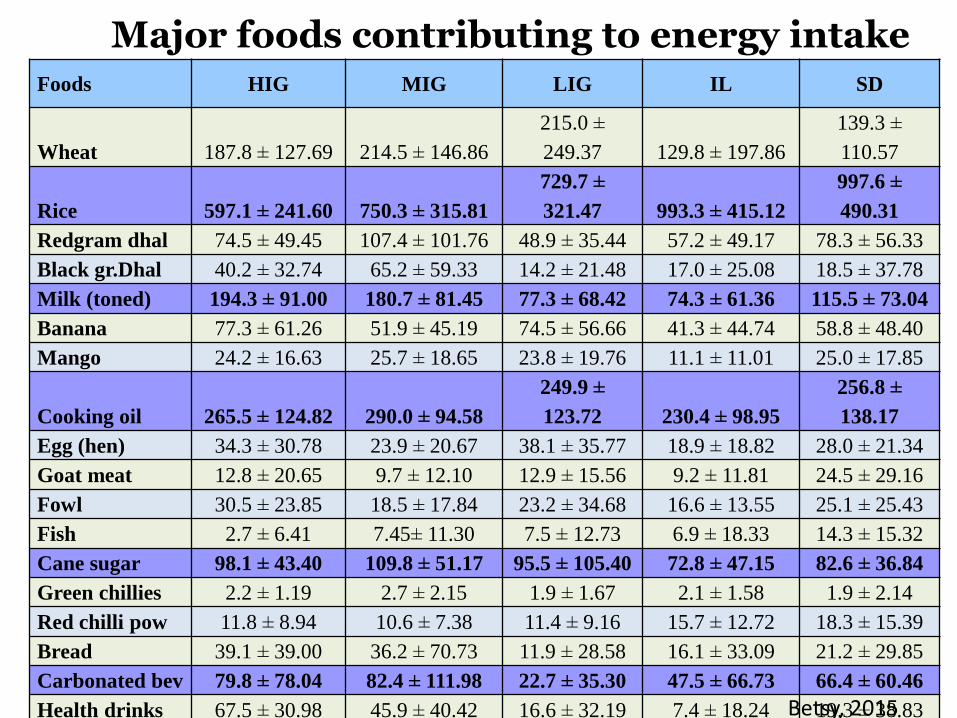
Major foods contributing to energy intake Foods HIG MIG LIG IL SD
Wheat 187.8 ± 127.69 214.5 ± 146.86
215.0 ±
249.37 129.8 ± 197.86
139.3 ±
110.57
Rice 597.1 ± 241.60 750.3 ± 315.81
729.7 ±
321.47 993.3 ± 415.12
997.6 ±
490.31
Redgram dhal 74.5 ± 49.45 107.4 ± 101.76 48.9 ± 35.44 57.2 ± 49.17 78.3 ± 56.33
Black gr.Dhal 40.2 ± 32.74 65.2 ± 59.33 14.2 ± 21.48 17.0 ± 25.08 18.5 ± 37.78
Milk (toned) 194.3 ± 91.00 180.7 ± 81.45 77.3 ± 68.42 74.3 ± 61.36 115.5 ± 73.04
Banana 77.3 ± 61.26 51.9 ± 45.19 74.5 ± 56.66 41.3 ± 44.74 58.8 ± 48.40
Mango 24.2 ± 16.63 25.7 ± 18.65 23.8 ± 19.76 11.1 ± 11.01 25.0 ± 17.85
Cooking oil 265.5 ± 124.82 290.0 ± 94.58
249.9 ±
123.72 230.4 ± 98.95
256.8 ±
138.17
Egg (hen) 34.3 ± 30.78 23.9 ± 20.67 38.1 ± 35.77 18.9 ± 18.82 28.0 ± 21.34
Goat meat 12.8 ± 20.65 9.7 ± 12.10 12.9 ± 15.56 9.2 ± 11.81 24.5 ± 29.16
Fowl 30.5 ± 23.85 18.5 ± 17.84 23.2 ± 34.68 16.6 ± 13.55 25.1 ± 25.43
Fish 2.7 ± 6.41 7.45± 11.30 7.5 ± 12.73 6.9 ± 18.33 14.3 ± 15.32
Cane sugar 98.1 ± 43.40 109.8 ± 51.17 95.5 ± 105.40 72.8 ± 47.15 82.6 ± 36.84
Green chillies 2.2 ± 1.19 2.7 ± 2.15 1.9 ± 1.67 2.1 ± 1.58 1.9 ± 2.14
Red chilli pow 11.8 ± 8.94 10.6 ± 7.38 11.4 ± 9.16 15.7 ± 12.72 18.3 ± 15.39
Bread 39.1 ± 39.00 36.2 ± 70.73 11.9 ± 28.58 16.1 ± 33.09 21.2 ± 29.85
Carbonated bev 79.8 ± 78.04 82.4 ± 111.98 22.7 ± 35.30 47.5 ± 66.73 66.4 ± 60.46
Health drinks 67.5 ± 30.98 45.9 ± 40.42 16.6 ± 32.19 7.4 ± 18.24 19.3 ± 38.83
Total 2081.6 2299.5 1919.3 1977.4 2226.3
Betsy, 2015
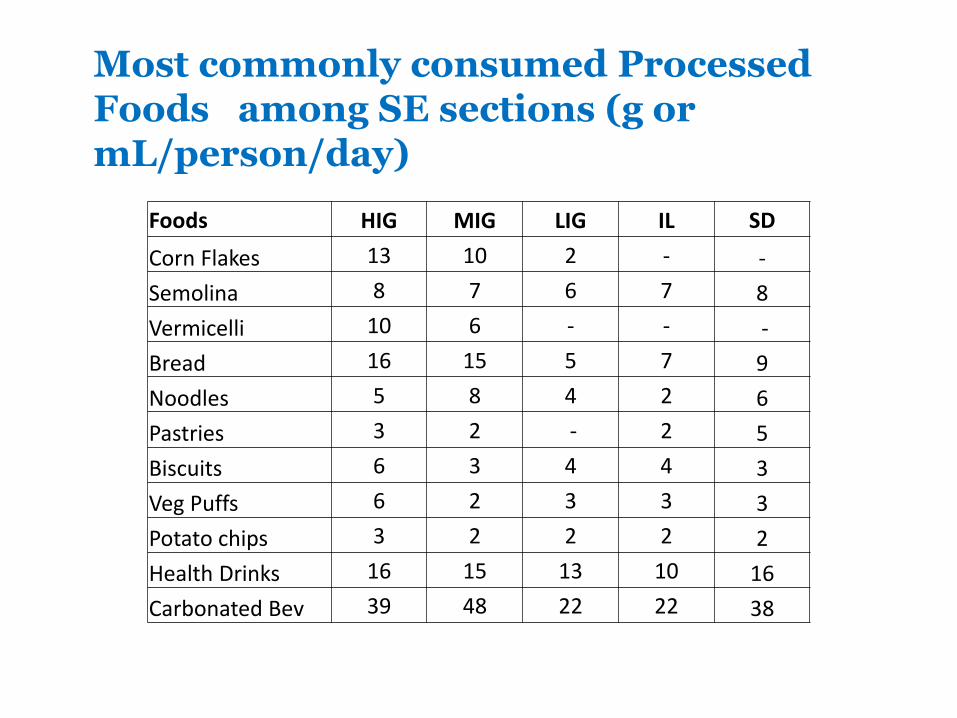
Most commonly consumed Processed Foods among SE sections (g or mL/person/day)
Foods HIG MIG LIG IL SD
Corn Flakes 13 10 2 - -
Semolina 8 7 6 7 8
Vermicelli 10 6 - - -
Bread 16 15 5 7 9
Noodles 5 8 4 2 6
Pastries 3 2 - 2 5
Biscuits 6 3 4 4 3
Veg Puffs 6 2 3 3 3
Potato chips 3 2 2 2 2
Health Drinks 16 15 13 10 16
Carbonated Bev 39 48 22 22 38
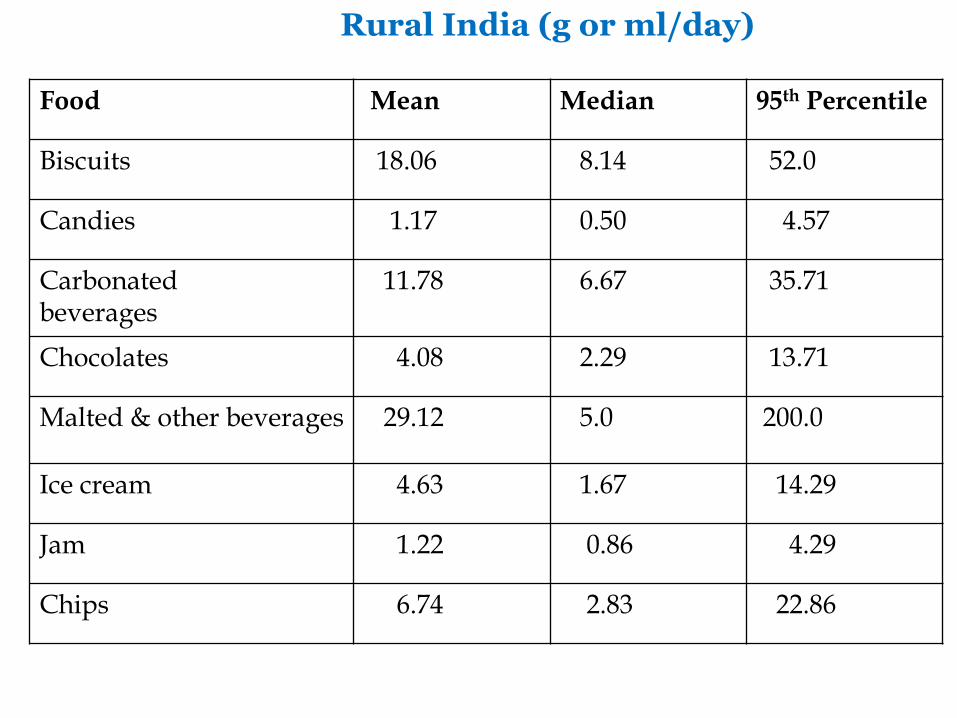
Food Mean Median 95th Percentile
Biscuits 18.06 8.14 52.0
Candies 1.17 0.50 4.57
Carbonated beverages
11.78
6.67 35.71
Chocolates 4.08 2.29 13.71
Malted & other beverages 29.12 5.0 200.0
Ice cream 4.63 1.67 14.29
Jam 1.22 0.86 4.29
Chips 6.74 2.83 22.86
Rural India (g or ml/day)
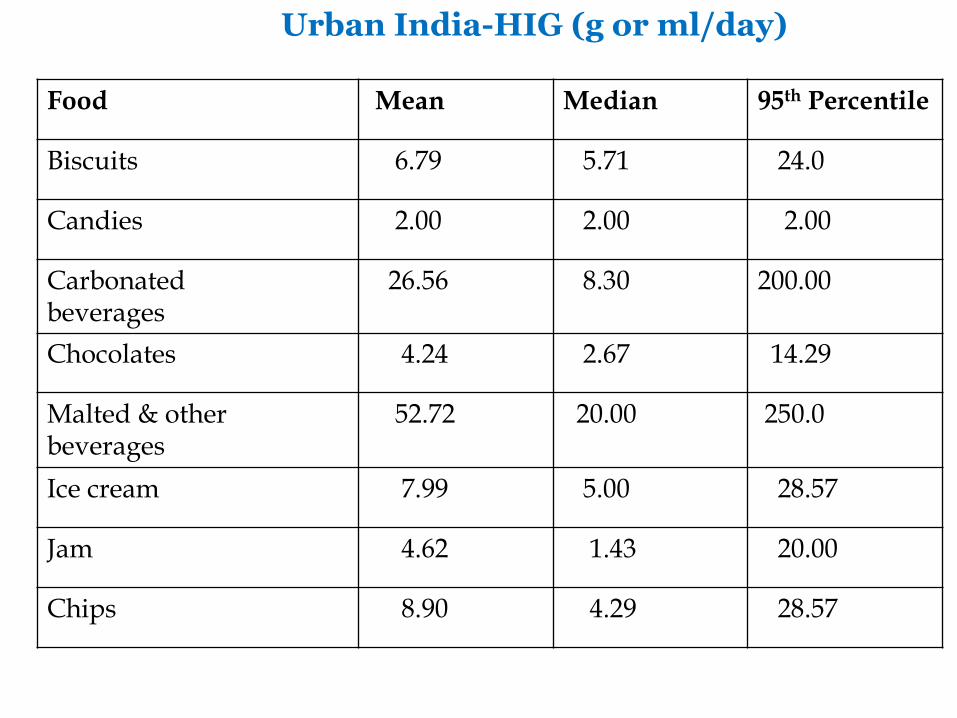
Food Mean Median 95th Percentile
Biscuits 6.79 5.71 24.0
Candies 2.00 2.00 2.00
Carbonated beverages
26.56
8.30 200.00
Chocolates 4.24 2.67 14.29
Malted & other beverages
52.72 20.00 250.0
Ice cream 7.99 5.00 28.57
Jam 4.62 1.43 20.00
Chips 8.90 4.29 28.57
Urban India-HIG (g or ml/day)
Salt – Sodium intake About 10g/day- ≈4000mg Recommended 6g/day- ≈ 2400mg

processed foods
home cooking
table
natural from foods
12% 5%
6%
76%
Source of Dietary Sodium for Americans (CDC, 2014)
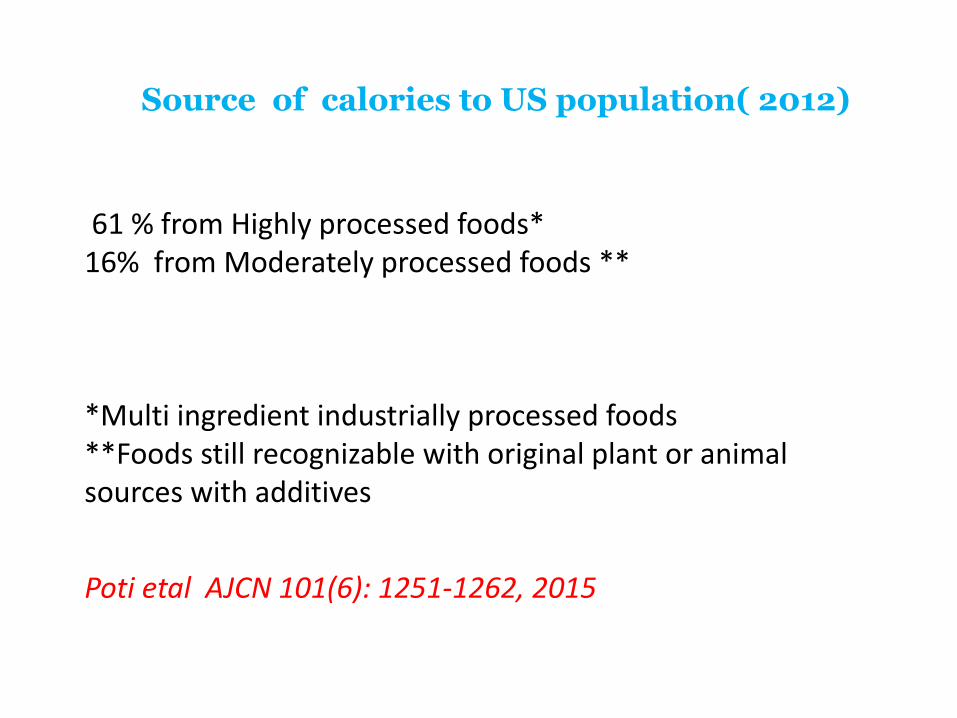
Source of calories to US population( 2012)
61 % from Highly processed foods* 16% from Moderately processed foods ** *Multi ingredient industrially processed foods **Foods still recognizable with original plant or animal sources with additives
Poti etal AJCN 101(6): 1251-1262, 2015
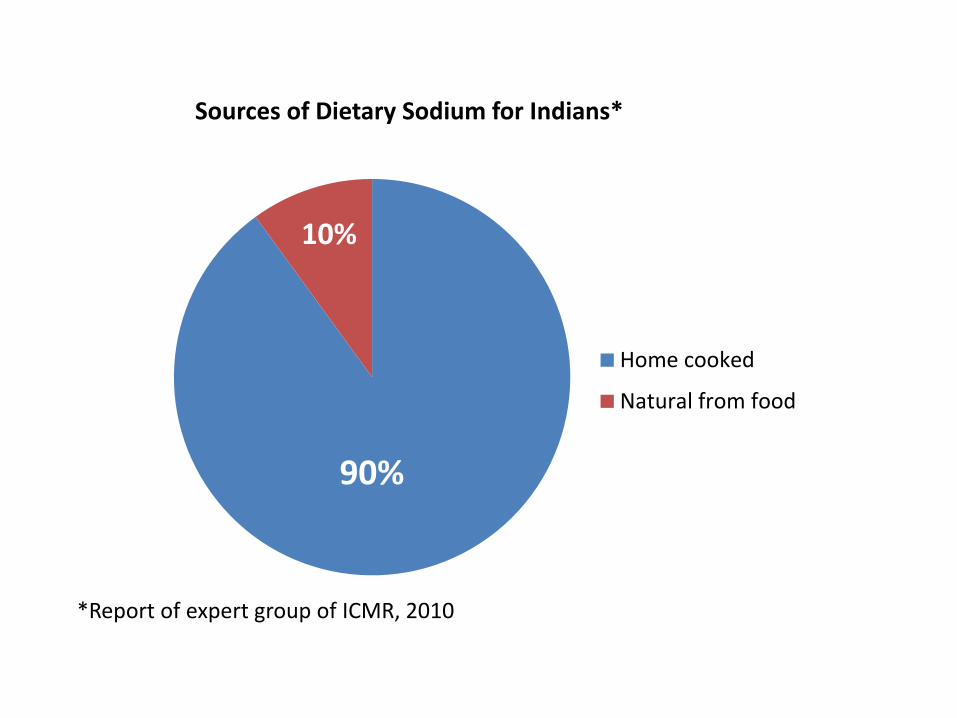
Home cooked
Natural from food
90%
10%
Sources of Dietary Sodium for Indians*
*Report of expert group of ICMR, 2010
Nutrition Facts of Snacks
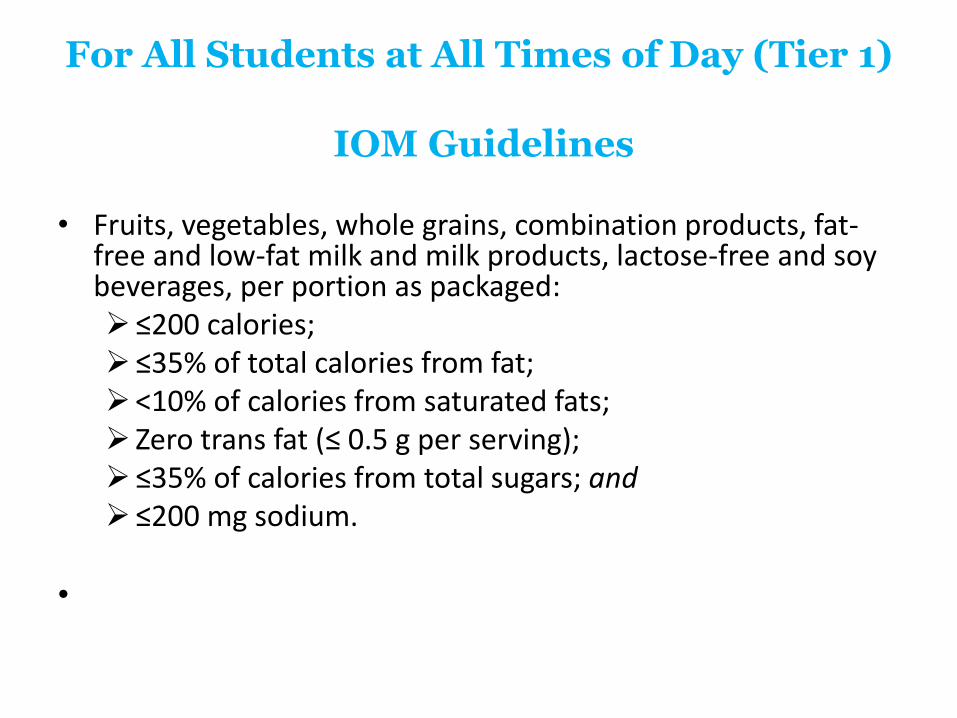
For All Students at All Times of Day (Tier 1)
IOM Guidelines
• Fruits, vegetables, whole grains, combination products, fat-
free and low-fat milk and milk products, lactose-free and soy beverages, per portion as packaged: ≤200 calories; ≤35% of total calories from fat; <10% of calories from saturated fats; Zero trans fat (≤ 0.5 g per serving); ≤35% of calories from total sugars; and ≤200 mg sodium.
•
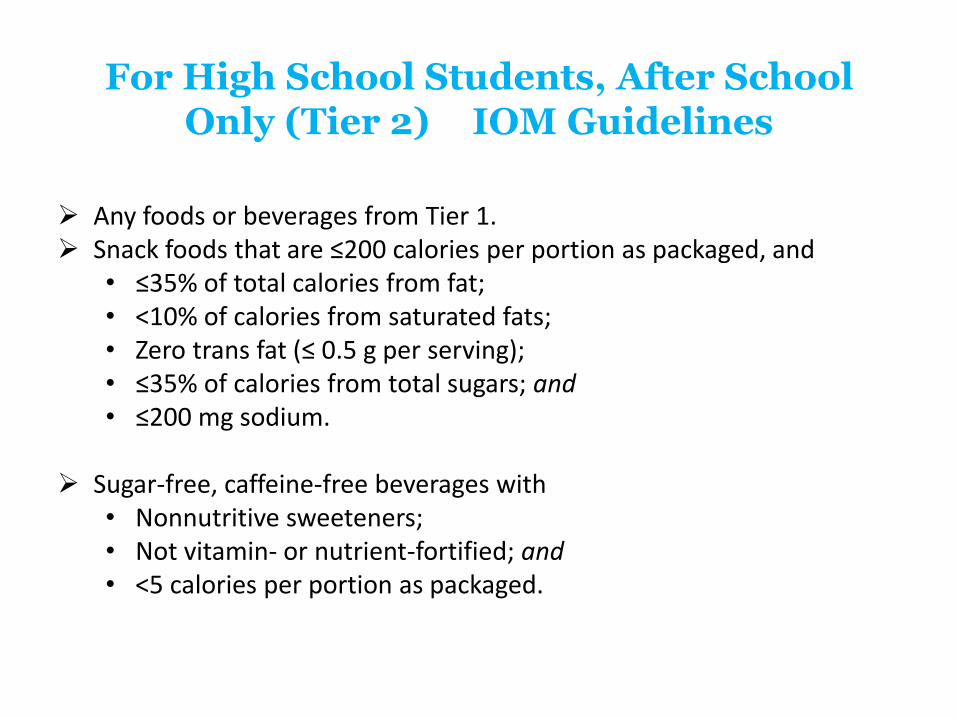
For High School Students, After School
Only (Tier 2) IOM Guidelines
Any foods or beverages from Tier 1. Snack foods that are ≤200 calories per portion as packaged, and
• ≤35% of total calories from fat; • <10% of calories from saturated fats; • Zero trans fat (≤ 0.5 g per serving); • ≤35% of calories from total sugars; and • ≤200 mg sodium.
Sugar-free, caffeine-free beverages with
• Nonnutritive sweeteners; • Not vitamin- or nutrient-fortified; and • <5 calories per portion as packaged.

Nutrition Facts Per 100 gram
Product* Energy (Kcal)
Protein (g)
Carbohydrate (g)
Sugar (g)
Fat (g)
Sodium (mg)
Product 1 464 6.3 73.6 8.8 16 740
Product 2 460 11 65 6 17 1100
451 17.5 62.1 5.6 14.7 851
Product 3 444 9 72 6.8 13.3 900 Product 4 444 7.9 69.9 8 14.8 1258 Product 5 430 8 72.3 3 12.1 1007
Product 6 459 7.4 72.7 10.5 15.4 607
Product 7 459 7.4 72.7 9.4 15.4 729
Product 8 459 7.4 72.7 8.7 15.4 661
Product 9 471 8.1 71 2.4 17.4 495 Product 10
410 20 60 0 10 890
*Popular pre packaged snacks available in the market

Satisfying IOM guidelines for approx. serving size for Sodium
Product Approx. Serving
size (gm)
Energy (Kcal)
Protein (%)
Carbohydrate
(%)
Sugar (%)
Fat (%)
Sodium (mg)
Product 1 28.30 125.41 5.43 63.45 7.59 31.03 200 Product 1 18.00 83.64 9.57 56.52 5.22 33.26 200 Product 2 23.48 105.99 15.52 55.08 4.97 29.33 200 Product 3 22.47 98.67 8.11 64.86 6.13 26.96 200 Product 4 15.99 70.59 7.12 62.97 7.21 30.00 200 Product 5 18.95 85.40 7.44 67.26 2.79 25.33 200 Product 6 34.93 151.24 6.45 63.36 9.15 30.20 200
Product 7 28.78 125.93 6.45 63.36 8.19 30.20 200
Product 8 31.53 138.88 6.45 63.36 7.58 30.20 200
Product 9 39.96 190.30 6.88 60.30 2.04 33.25 200 Product 10
20.22 92.13 19.51 58.54 0.00 21.95 200

Nutritional facts of Common Sweets
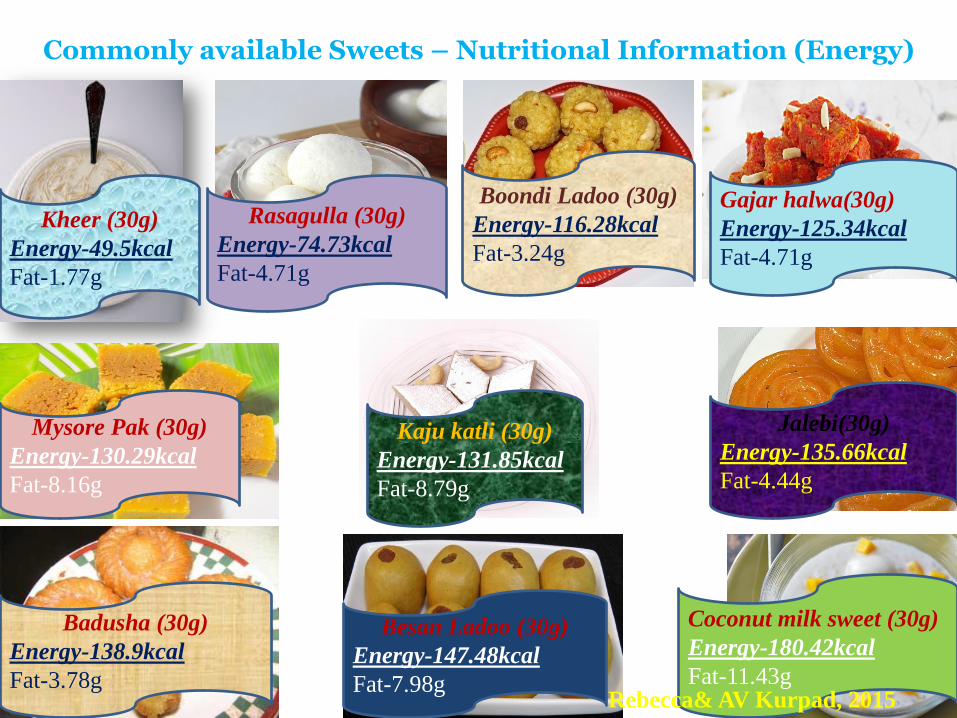
Commonly available Sweets – Nutritional Information (Energy)
Kheer (30g)
Energy-49.5kcal
Fat-1.77g
Mysore Pak (30g)
Energy-130.29kcal
Fat-8.16g
Kaju katli (30g)
Energy-131.85kcal
Fat-8.79g
Badusha (30g)
Energy-138.9kcal
Fat-3.78g
Besan Ladoo (30g)
Energy-147.48kcal
Fat-7.98g
Rasagulla (30g)
Energy-74.73kcal
Fat-4.71g
Boondi Ladoo (30g)
Energy-116.28kcal
Fat-3.24g
Coconut milk sweet (30g)
Energy-180.42kcal
Fat-11.43g
Gajar halwa(30g)
Energy-125.34kcal
Fat-4.71g
Jalebi(30g)
Energy-135.66kcal
Fat-4.44g
Rebecca& AV Kurpad, 2015
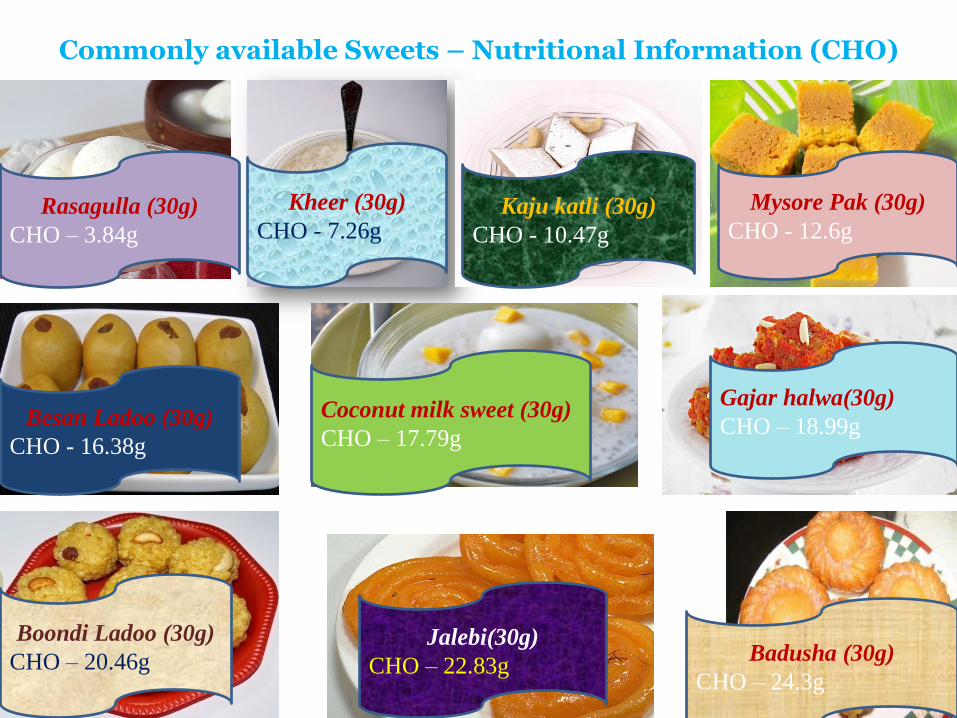
Commonly available Sweets – Nutritional Information (CHO)
Kheer (30g)
CHO - 7.26g
Mysore Pak (30g)
CHO - 12.6g
Kaju katli (30g)
CHO - 10.47g
Badusha (30g)
CHO – 24.3g
Besan Ladoo (30g)
CHO - 16.38g
Rasagulla (30g)
CHO – 3.84g
Boondi Ladoo (30g)
CHO – 20.46g
Coconut milk sweet (30g)
CHO – 17.79g
Gajar halwa(30g)
CHO – 18.99g
Jalebi(30g)
CHO – 22.83g
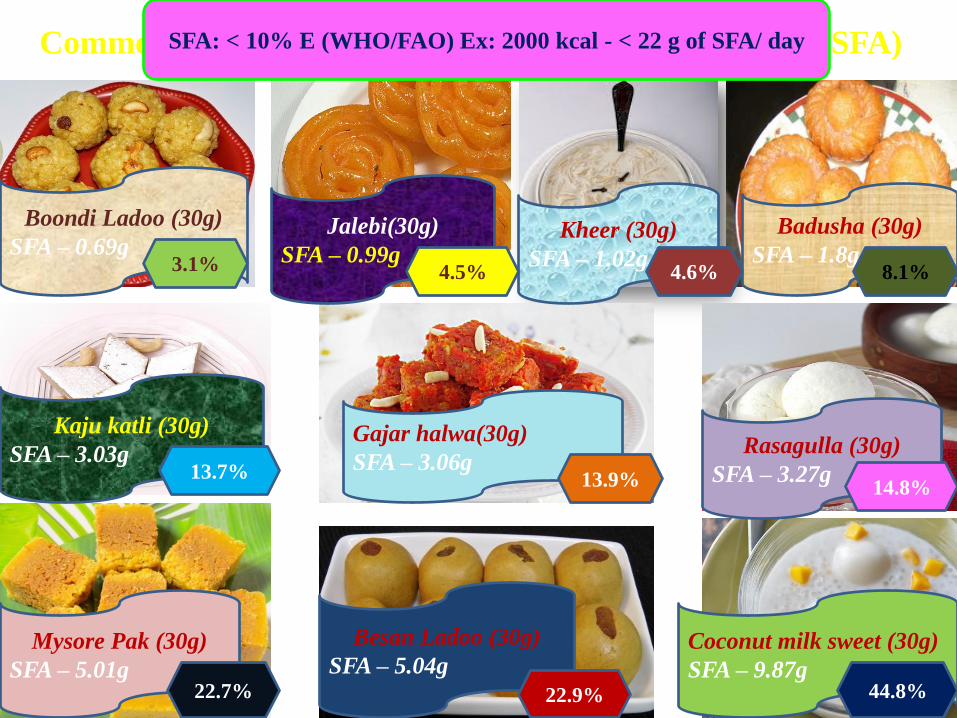
Commonly available Sweets – Nutritional Information (SFA)
Kheer (30g)
SFA – 1.02g
Mysore Pak (30g)
SFA – 5.01g
Kaju katli (30g)
SFA – 3.03g
Badusha (30g)
SFA – 1.8g
Besan Ladoo (30g)
SFA – 5.04g
Rasagulla (30g)
SFA – 3.27g
Boondi Ladoo (30g)
SFA – 0.69g
Coconut milk sweet (30g)
SFA – 9.87g
Gajar halwa(30g)
SFA – 3.06g
Jalebi(30g)
SFA – 0.99g
SFA: < 10% E (WHO/FAO) Ex: 2000 kcal - < 22 g of SFA/ day
3.1% 4.5% 4.6% 8.1%
13.7% 13.9% 14.8%
22.7% 22.9% 44.8%

Some thing is good, more is more good Does it apply to vitamins and minerals ? Dietary supplements RDA ULs

Average Intake of Nutrients (per CU/day) as % of RDA by Period of Survey
10397
152
108
97.5
41
57.1
125
91.99794
141
97 92.5
47
64.3
108.3
88.89087
130
89
100
5064.3
100
79.48276
110
53
110
4343
100 92
84.577
106
53.2
113
49 50
108
90.6
0
40
80
120
160
Protein Energy Calcium Iron Vit. C Vit. A RiboflavinThiamin Niacin
1975-79 1988-90 1996-97 2005-06 2011-12
Percent
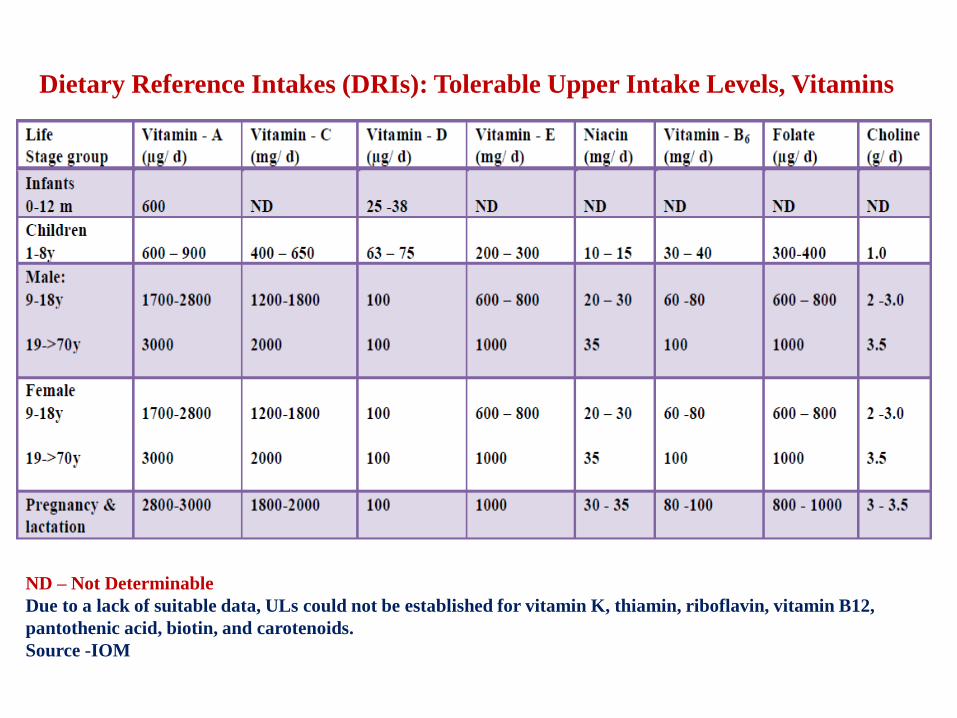
Dietary Reference Intakes (DRIs): Tolerable Upper Intake Levels, Vitamins
ND – Not Determinable
Due to a lack of suitable data, ULs could not be established for vitamin K, thiamin, riboflavin, vitamin B12,
pantothenic acid, biotin, and carotenoids.
Source -IOM
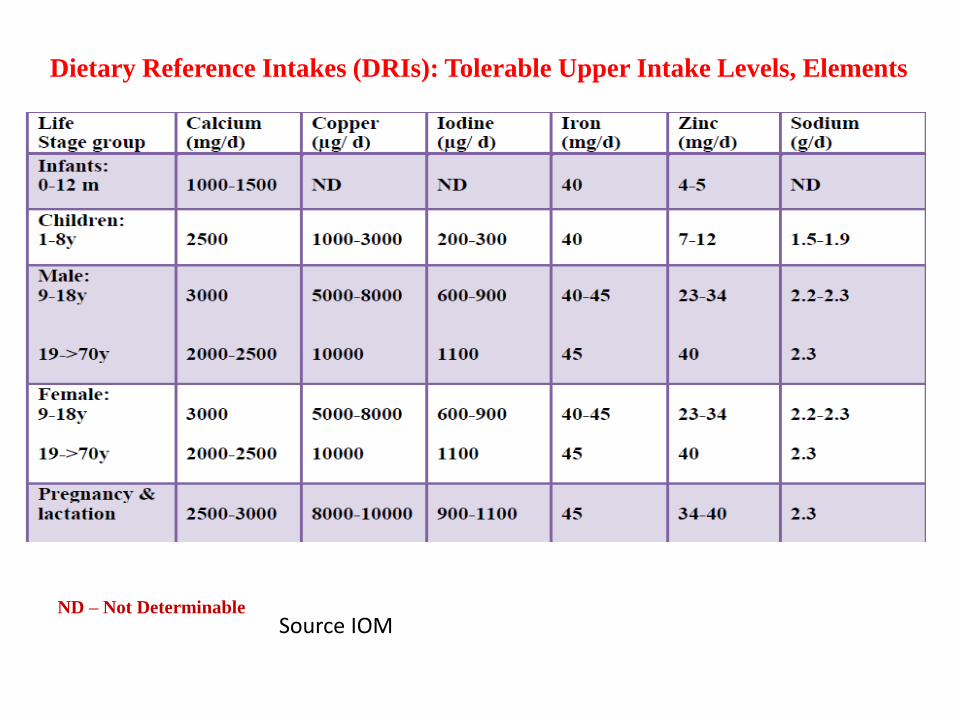
Dietary Reference Intakes (DRIs): Tolerable Upper Intake Levels, Elements
ND – Not Determinable
Source IOM
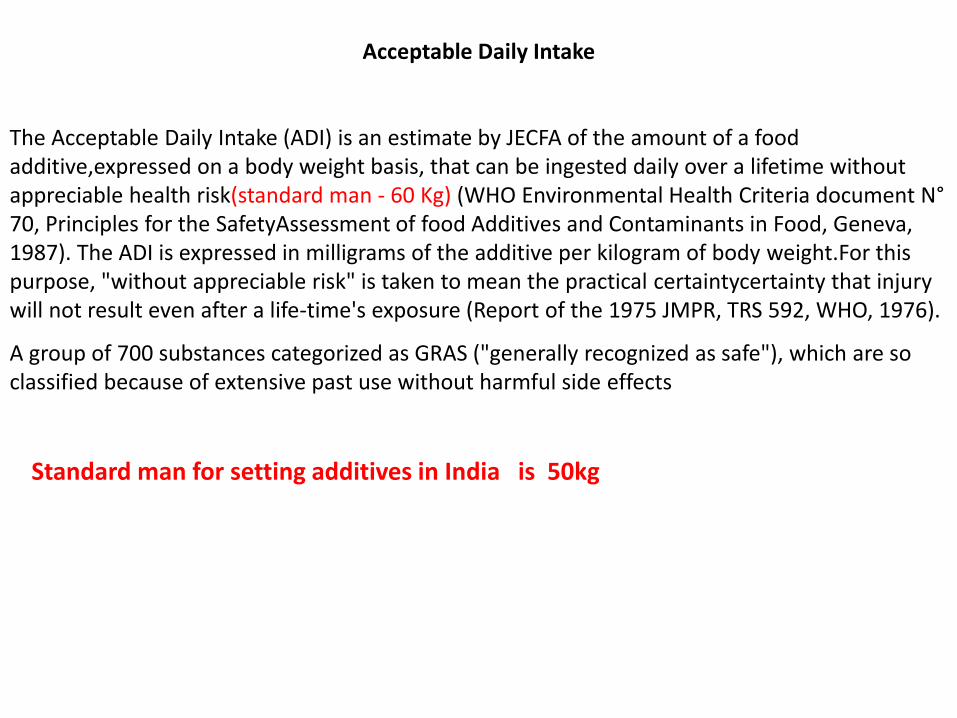
Acceptable Daily Intake
The Acceptable Daily Intake (ADI) is an estimate by JECFA of the amount of a food additive,expressed on a body weight basis, that can be ingested daily over a lifetime without appreciable health risk(standard man - 60 Kg) (WHO Environmental Health Criteria document N° 70, Principles for the SafetyAssessment of food Additives and Contaminants in Food, Geneva, 1987). The ADI is expressed in milligrams of the additive per kilogram of body weight.For this purpose, "without appreciable risk" is taken to mean the practical certaintycertainty that injury will not result even after a life-time's exposure (Report of the 1975 JMPR, TRS 592, WHO, 1976).
A group of 700 substances categorized as GRAS ("generally recognized as safe"), which are so classified because of extensive past use without harmful side effects
Standard man for setting additives in India is 50kg

Estimates of intakes of BHT (Example) First level screening by Budget method ----- Exceeded the ADI Estimates provided by 10 countries - using GSFA levels of use - consistently exceeded ADI Mean intake 230 % ADI China 240% ADI US High intake 600-2000 % ADI
% of ADI Method of estimate
30 Poundage method
20-30 Household surveys and sales data
10-30 Model diet
0.1-30 Individual data
0.003 Total diet study (Japan)
Intake estimates using national levels of use
Conclusion : Unlikely to exceed ADI Recommendation: May review MLs potentially contributing to high intake ie Fats and oils free from water, chewing gum & processed fish and fish products

To conclude
Understand the major sources of exposures for risk assessment Need to carry out Total diet studies for realistic exposures

Thank you for your attention