Embed Size (px)
Citation preview
DRAFT Channel Migration Assessment Clallam County
April 2013
DRAFT Channel Migration Assessment Clallam County
April 2013
Draft Channel Migration Assessment Clallam County
April 2013 Page i
Table of Contents
Chapter 1 Introduction...................................................................................................................................... 1
1.1 Channel Migration Zones ...................................................................................... 1
1.2 CMZs Developed by Department of Ecology for the Shoreline Master
Program .................................................................................................................. 4
Chapter 2 Regulatory Context ......................................................................................................................... 7
Chapter 3 Landscape Context ....................................................................................................................... 10
3.1 Topography .......................................................................................................... 10
3.2 Geology ................................................................................................................ 10
3.3 Precipitation and Runoff ...................................................................................... 12
Chapter 4 Planning-Level Method ................................................................................................................. 14
4.1 Definitions ........................................................................................................... 14
4.2 Stream Selection .................................................................................................. 16
4.3 Data Sources and Processing ............................................................................... 17
4.4 Planning-level Method for Channel Migration Assessment ................................ 24
Chapter 5 Quality Control and Quality Assurance ....................................................................................... 40
5.1 Draft Quality Assurance Project Plan (QAPP) .................................................... 40
5.2 Limits of Analysis and Utility ............................................................................. 40
Chapter 6 Results and Sub basin Descriptions ........................................................................................... 40
6.1 Creeks in the Southwest Interior and Olympic Mountain Foothills .................... 41
6.2 Creeks in the northwest interior and western coast physiographic zone ............. 42
Chapter 7 References ..................................................................................................................................... 44
Chapter 8 Maps of Channel Migration Zones for Clallam County Streams ............................................... 47
Appendices
Appendix A Acronym List and Glossary
Appendix B Shoreline Master Program Regulations Addressing Channel Migration
Appendix C Identifying Channel Migration Reaches
Appendix D Relative Water Surface Elevation (RWSE) Method Description
Tables
Table 4.1 Terms used in this report and similar terms used in Rapp and Abbe (2003). ...............14
Table 4.2 Surface geology and erosion potential. .......................................................................20
Table 4.3 Typical bedrock types, strength, and fluvial erosion potential. (Adapted from
Attewell and Farmer 1976) ....................................................................................21
Draft Channel Migration Assessment Clallam County
Page ii April 2013
Table 4.4 GIS data layers used in mapping general channel migration zones for Shoreline
Master Program updates. .......................................................................................22
Table 4.5 GIS files created for the channel migration assessment. ..............................................24
Table 4.6 Decision guidelines used to identify the erosion hazard buffer and geomorphic
features ...................................................................................................................30
Figures
Figure 1.1 Mission Creek near Belfair, WA. Note the change in width of the channel
and additional deposition between 1990 (upper photo) and 2009 (lower
photo) in this residential neighborhood. ..................................................................3
Figure 3.1 General geology and physiographic zones of the Clallam County assessment
area. ........................................................................................................................11
Figure 4.1. Streams selected for assessment in Clallam County. Some streams on federal
lands were not assessed. .........................................................................................16
Figure 4.2. Example of LiDAR map with geologic map overlay (above) and aerial
imagery (below) from Clallam River showing features visible on a high-
resolution DEM including stream channels, roads, and development. Note
that the topography and stream channel are clearly visible on the LiDAR
map. ........................................................................................................................18
Figure 4.3. Relative elevation model (REM) map for the same section of Clallam River
as Figure 4.2. ..........................................................................................................19
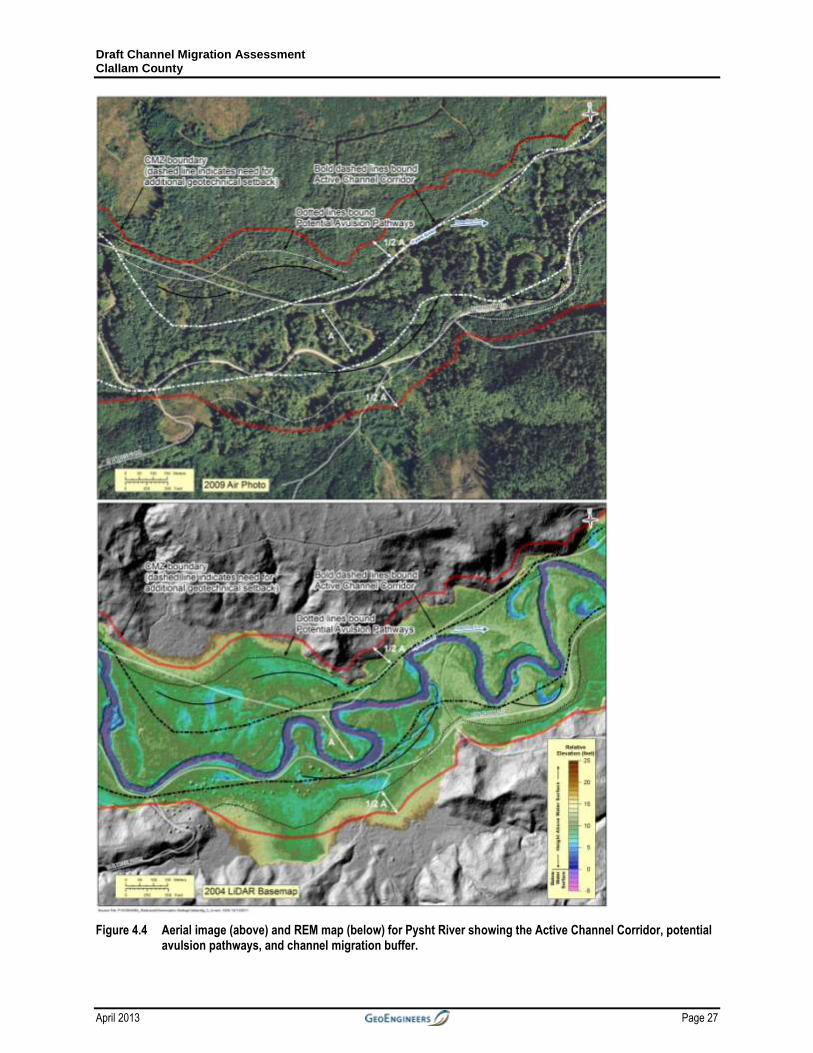
Figure 4.4 Aerial image (above) and REM map (below) for Pysht River showing the
Active Channel Corridor, potential avulsion pathways, and channel
migration buffer. ....................................................................................................27
Figure 4.5 Mission Creek near Belfair, Washington. Example of wood
accumulations that trigger channel migration (channel widening and
lateral migration). This section of Mission Creek is downstream of the
location shown in Figure 1.1, and may contain some of the riparian woody
material removed from the streambanks at that location. ......................................29
Figure 4.6 Aerial imagery (above) and REM map (below) showing a reach on the
Lyre River where the stream is actively widening its valley. ................................32
Figure 4.7 DEM hillshade with relative elevation map (from 10m USGS DEM)
(above) and Aerial image (below) for a reach of Sooes River that is
considered underfit. In general, underfit streams are not as likely to
migrate across entire valley bottom. ......................................................................34
Figure 4.8 REM map of the delta of Hoko River showing a typical pattern of avulsion
channels. A longshore bar has formed filling in the historical channel to
the west of the current river mouth. .......................................................................36
Draft Channel Migration Assessment Clallam County
April 2013 Page iii
Figure 4.9 Disconnected migration area along Physht River. This figure shows the same
location as figure 4.4 ..............................................................................................37
Figure 4.10 Illustration showing the basis for the geotechnical setback buffer. For
purposes of this study, a geotechnical buffer was recommended any time
H (height) was greater than 25 feet. The width of the geotechnical setback
buffer was not determined for this study since it requires additional field
data. (Adapted from Rapp and Abbe 2003). .........................................................39
Figure 6.1 Relative elevation model shows the active channel entrenched in glacial
terraces. ..................................................................................................................42
Figure 6.2 Sediment deposition, bank erosion, and channel widening are taking place
in Big Creek in areas of significant recent tracts of clearcutting. ..........................43
Draft Channel Migration Assessment Clallam County
Page iv April 2013
This Page Intentionally Left Blank
Draft Channel Migration Assessment Clallam County
April 2013 Page 1
Chapter 1 Introduction
1.1 Channel Migration Zones
Dynamic physical processes in rivers can cause channels in some areas to move or “migrate”
over time. The natural meander patterns of stream channels are the result of the dissipation of
energy of flowing water and the transportation of sediment. The area within which a river
channel is likely to move over a period of time is referred to as the channel migration zone
(CMZ). Since the ground within a CMZ is subject to erosion, it represents a hazardous area for
development. Roads, pipelines, buildings, and other property are all at risk within a CMZ.
Protecting development within a CMZ can alter natural processes and adversely impact critical
salmon habitat. Delineation of CMZs allows landowners, planners and other entities to
determine if they have facilities or property that could be subject to erosion, plan for future
development that safeguards human welfare and critical habitat, and identify sites that may need
erosion protection or habitat restoration opportunities.
Channel migration can occur gradually, as a river erodes one bank and deposits sediment along
the other. Erosion occurs when the stream has sufficient energy to cut into a bank, so it is
dependent on both flow conditions and the resistance of the bank material. Channel migration
also can occur abruptly, such as cases of channel widening associated with large floods or
channel downcutting (“incision”) that oversteepens and destabilizes stream banks. Channel
incision is a common occurrence in urbanizing basins due to changes in amount and timing of
runoff due to increases in impervious surfaces in a basin. Abrupt migration also occurs when
stream takes another path within its floodplain, typically because it offers less resistance (for
example, a more direct path or a way around an obstruction). This circumstance is referred to as
an ‘avulsion.’ While areas susceptible to avulsions can be identified, the timing of an avulsion
depends on flood events and debris accumulations that are less predictable.
Channel migration can occur in streams of all sizes, generally increasing with the size of the
channel. The highest rates of channel migration generally occur along large channels with
erodible banks, particularly where the original forest was removed. The other areas prone to
rapid channel migration are areas where steep tributaries enter larger, flatter valleys. Frequent
channel migration in these sites forms an alluvial fan, thus fans are considered high risk areas for
erosion and are included in the maps. Both gradual and abrupt channel changes are natural
processes important in sustaining critical habitat for aquatic species, while also posing risks to
property and infrastructure, and thus are important to consider in land-use planning within
Clallam County.
A CMZ typically consists of several distinct zones (Rapp and Abbe, 2003). The area where the
stream has been in the past as recorded in old maps and photos is referred to as the “historical
migration zone” and clearly an area susceptible to future channel migration. This zone may also
include pre-historic channels evident in site topography. The CMZ also includes “avulsion
hazard areas” such as low lying floodplain or cleared areas between large bends in the river or
stream. The CMZ also includes an “erosion hazard area” that represents areas where the channel
Draft Channel Migration Assessment Clallam County
Page 2 April 2013
may not have been historically, but may move in the future based on ground erodibility, evidence
of migration in similar areas, and rates of historic migration. The erosion hazard zone includes
valley hillslopes in valleys that are actively forming, which are common in the young landscape
of Western Washington. Where a channel cuts into a valley margin, it will tend to over-steepen
the hillslope and create an increased risk of a landslide, referred to as a “geotechnical hazard,”
that can pose a significant threat to areas that may be situated outside CMZ or flood hazard zone.
Therefore it is important to remember that CMZs may affect higher ground susceptible to erosion
driven by the stream. In such circumstances the CMZ may extend beyond delineated FEMA
flood hazard zones. In other cases, such as heavily vegetated small channels, the CMZ may be
considerably smaller than the FEMA flood hazard zone.
In the Puget Sound ecoregion, channel migration is the primary floodplain geomorphic process
that creates a shifting mosaic of habitat patches of different ages within the river corridor, by
re-setting vegetation communities and aquatic habitats. This mosaic provides highly productive
ecological areas for aquatic organisms as well as terrestrial species. The channel migration
processes occur on a variety of spatial and temporal scales from local bank erosion to avulsions
that create many kilometers of new channel to entire reworking of floodplains. Rivers erode
some patches each year while other patches accrete sediment and gradually rise in elevation
above the river bed (Nanson and Beach, 1977; Abbe and Montgomery, 1996; Brummer, Abbe
and others, 2006). The high density of complex boundaries between ecotones (Ward et al, 1999)
creates more environmental complexity, maintained by interactions between river channels and
floodplain forests.
Channel migration commonly threatens infrastructure like roads, levees, and private property.
Actions to protect property are expensive and have historically had a severe impact on aquatic
habitat. In cases where channel migration rates have been affected by land development such as
forest clearing, land tilling, and increased runoff from development, it can have negative impacts
on water quality, delivering un-naturally high sediment and pollutant loads to downstream water
bodies like Puget Sound. Where rapid migration occurs, risk to people and infrastructure often is
much greater than flooding alone. Channel migration can also include channel widening
associated with major flood events or increases in discharge resulting from urbanization common
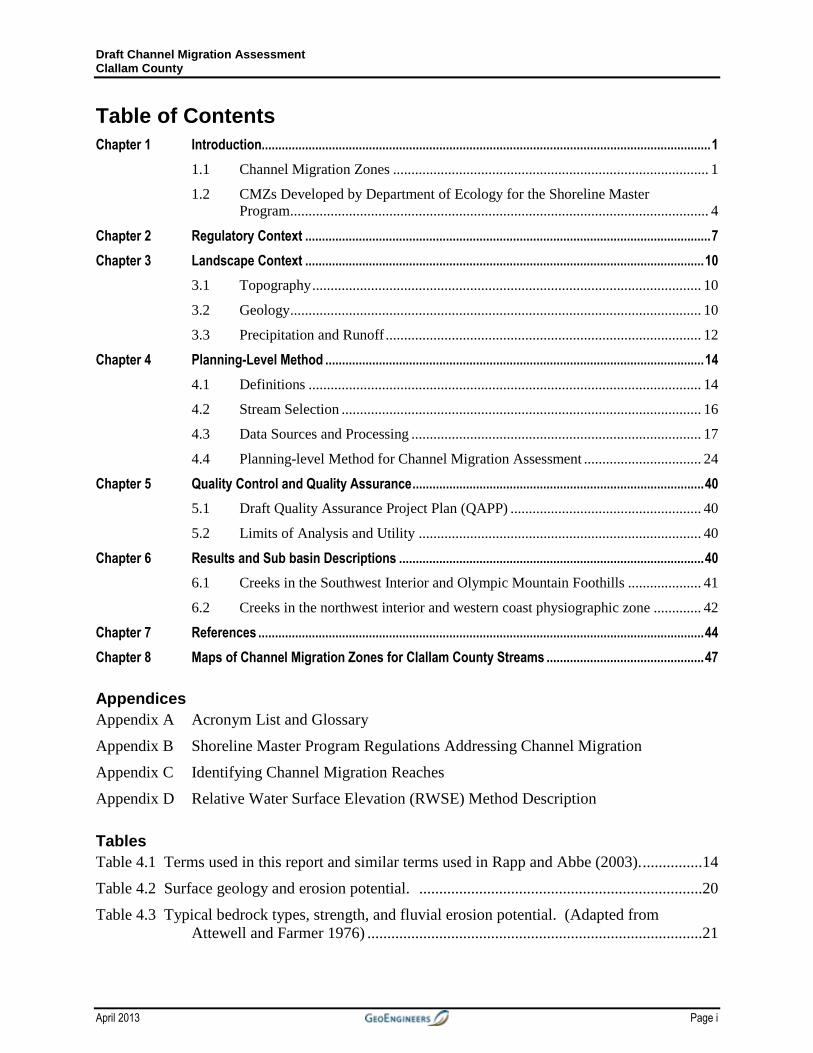
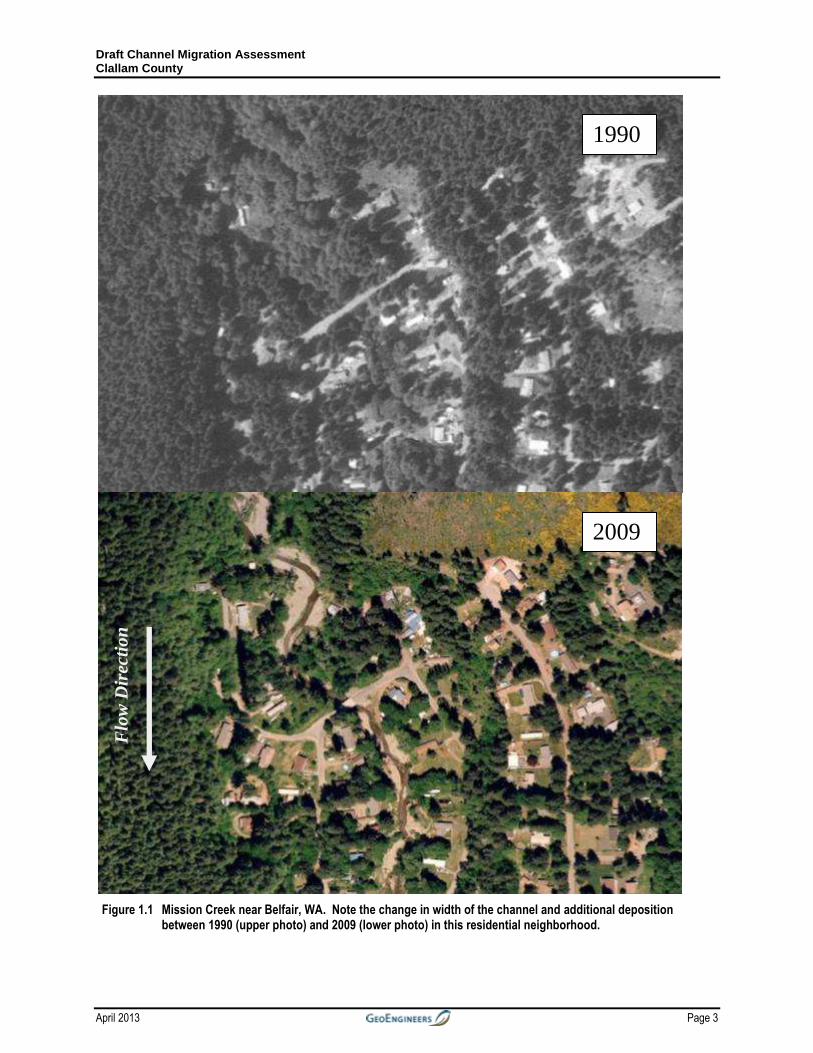
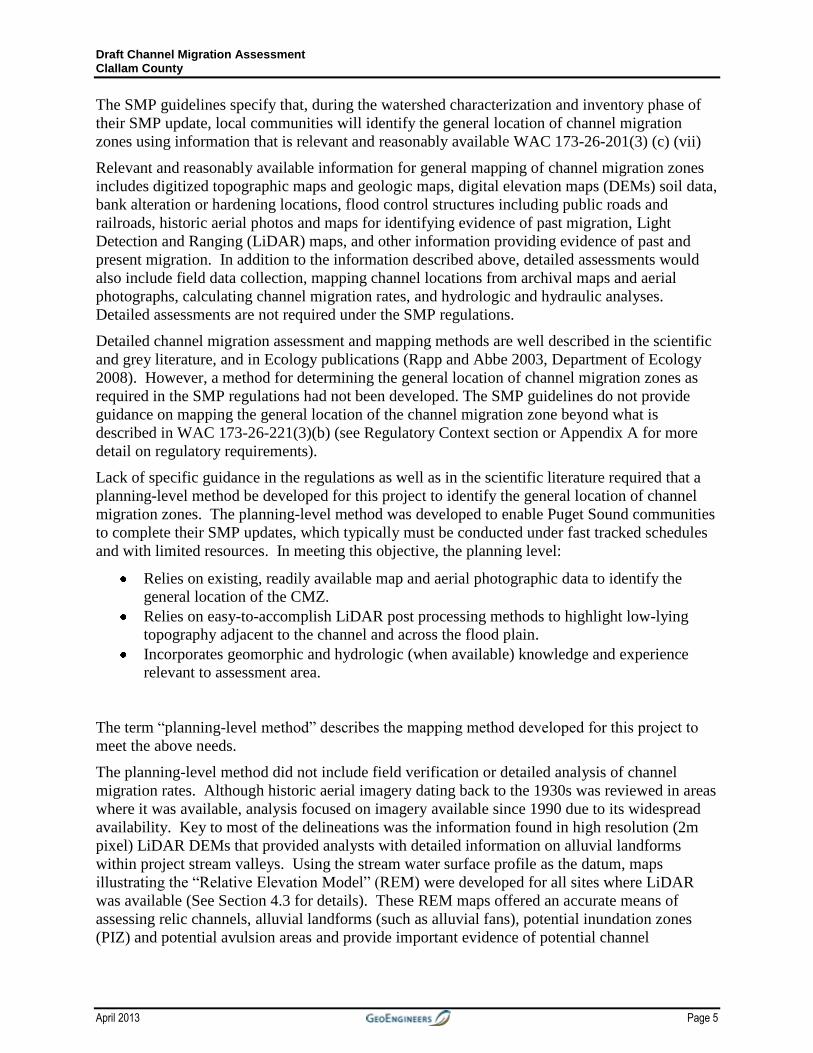
throughout Western Washington. Figure 1.1 shows a residential development with homes built
next to a stream that has changed considerably between 1990 and 2009. The image from 2009
shows that the stream in this residential development has moved, eroded and deposited sediment
along the banks, and removed trees and vegetation along the banks. The loss of vegetation along
the stream banks increases the likelihood that the channel will continue to migrate, and cause
further bank erosion.
Draft Channel Migration Assessment Clallam County
April 2013 Page 3
Figure 1.1 Mission Creek near Belfair, WA. Note the change in width of the channel and additional deposition between 1990 (upper photo) and 2009 (lower photo) in this residential neighborhood.
Flo
w D
irec
tio
n
1990
2009
Draft Channel Migration Assessment Clallam County
Page 4 April 2013
Areas that that have not experienced channel migration in historic times can still be at significant
risk, particularly in areas that have experienced upstream land development or are responding to
sediment and wood accumulation. Historic actions to limit channel migration not only had
severe impacts on salmon habitat and floodplain ecosystems, but are extremely expensive and
still susceptible to future erosion. These historic actions included excavating straight channels
(‘channelization’), dredging or gravel mining in existing channels and floodplains, construction
of revetments (i.e., bank hardening), levees/dikes, and riparian and channel clearing (i.e., tree
and wood removal) and contributed to cumulative impacts that reduced the geomorphic and
ecologic complexity of streams and contributed to the listing of salmon under the Endangered
Species Act (NMFS, 2008). Delineating CMZs helps municipalities and private landowners
avoid developing in hazardous areas, manage property or infrastructure currently at risk, and
identify potential restoration opportunities.
1.2 CMZs Developed by Department of Ecology for the Shoreline Master Program
The Washington Department of Ecology (Ecology), Shorelines and Environmental Assistance
Program (SEA) is responsible for managing Shoreline Master Program (SMP) updates and
providing technical and policy assistance to local communities.
Since many local communities do not have the resources (staff with necessary expertise in fluvial
geomorphology or budgets to conduct channel migration assessments), Ecology applied for
grants to provide technical assistance for channel migration mapping. Ecology received a
scientific and technical investigations grant from the Environmental Protection Agency (EPA),
Region X. One objective of the grant is to delineate “general” channel migration zones for
county governments in the Puget Sound region that have not yet done CMZ delineations and are
currently updating their SMPs. Identification of channel migration zones also supports
community efforts at complying with new FEMA regulations related to endangered species (see
Chapter 2, Regulatory Context, for more details).
A draft Channel Migration Assessment report, dated December 2011, was prepared by SEA for
Clallam County streams that fall under the jurisdiction of SMA. Channel Migration Zone maps
were delineated for all designated streams, which total approximately 140 miles, and are
presented with the December 2011 draft report.
This report, also prepared by the SEA, provides information, methods, and maps for an
additional 170 miles of streams in Clallam County to augment work on the county’s Shoreline
Master Program already in progress. Funding for this work was provided by the State General
Fund. Streams selected for delineation included those with a high probability of being subject to
channel movement based on the historic record, geologic character and evidence of past
migration (WAC 173-26-221(3)). The delineations included in this report are “general” because
they relied on GIS data and did not include a detailed analysis of historic migration rates, nor did
they include field verification or geotechnical assessments done as part of delineating a CMZ
using the more detailed method described in Rapp and Abbe (2003). These general CMZs are
intended to provide preliminary maps that comply with SMP guidelines, assist with planning,
and indicate areas where additional data and analysis should be conducted to complete a more
detailed delineation. The methods used to complete the general CMZ delineations are
summarized here and described in detail in Chapter 4.
Draft Channel Migration Assessment Clallam County
April 2013 Page 5
The SMP guidelines specify that, during the watershed characterization and inventory phase of
their SMP update, local communities will identify the general location of channel migration
zones using information that is relevant and reasonably available WAC 173-26-201(3) (c) (vii)
Relevant and reasonably available information for general mapping of channel migration zones
includes digitized topographic maps and geologic maps, digital elevation maps (DEMs) soil data,
bank alteration or hardening locations, flood control structures including public roads and
railroads, historic aerial photos and maps for identifying evidence of past migration, Light
Detection and Ranging (LiDAR) maps, and other information providing evidence of past and
present migration. In addition to the information described above, detailed assessments would
also include field data collection, mapping channel locations from archival maps and aerial
photographs, calculating channel migration rates, and hydrologic and hydraulic analyses.
Detailed assessments are not required under the SMP regulations.
Detailed channel migration assessment and mapping methods are well described in the scientific
and grey literature, and in Ecology publications (Rapp and Abbe 2003, Department of Ecology
2008). However, a method for determining the general location of channel migration zones as
required in the SMP regulations had not been developed. The SMP guidelines do not provide
guidance on mapping the general location of the channel migration zone beyond what is
described in WAC 173-26-221(3)(b) (see Regulatory Context section or Appendix A for more
detail on regulatory requirements).
Lack of specific guidance in the regulations as well as in the scientific literature required that a
planning-level method be developed for this project to identify the general location of channel
migration zones. The planning-level method was developed to enable Puget Sound communities
to complete their SMP updates, which typically must be conducted under fast tracked schedules
and with limited resources. In meeting this objective, the planning level:
Relies on existing, readily available map and aerial photographic data to identify the
general location of the CMZ.
Relies on easy-to-accomplish LiDAR post processing methods to highlight low-lying
topography adjacent to the channel and across the flood plain.
Incorporates geomorphic and hydrologic (when available) knowledge and experience
relevant to assessment area.
The term “planning-level method” describes the mapping method developed for this project to
meet the above needs.
The planning-level method did not include field verification or detailed analysis of channel
migration rates. Although historic aerial imagery dating back to the 1930s was reviewed in areas
where it was available, analysis focused on imagery available since 1990 due to its widespread
availability. Key to most of the delineations was the information found in high resolution (2m
pixel) LiDAR DEMs that provided analysts with detailed information on alluvial landforms
within project stream valleys. Using the stream water surface profile as the datum, maps
illustrating the “Relative Elevation Model” (REM) were developed for all sites where LiDAR
was available (See Section 4.3 for details). These REM maps offered an accurate means of
assessing relic channels, alluvial landforms (such as alluvial fans), potential inundation zones
(PIZ) and potential avulsion areas and provide important evidence of potential channel
Draft Channel Migration Assessment Clallam County
Page 6 April 2013
migration. Although the planning-level method was designed to be consistent and repeatable,
professional judgment was an important part of the process and required experienced
practitioners.
This document is not intended as a primer on geomorphology, nor is it intended to be used as
guide for delineating channel migration zones. The ‘planning-level’ method used to identify
areas of potential channel migration in this report differs from the more detailed method
described on the Ecology website and in A Framework for Delineating Channel Migration Zones
(Rapp and Abbe 2003), and should only be used as a guideline for where more detailed channel
migration zone studies should be conducted.
Detailed guidance for identifying CMZs is available on the Ecology website, which includes
instructions and references related to channel migration zones, a glossary, a more detailed
description of the regulatory framework, and example CMZ delineation reports (using more
detailed methods):
http://www.ecy.wa.gov/programs/sea/sma/cma/index.html
The other comprehensive reference for delineating channel migration zones in Puget Sound is
the Framework for Delineating Channel Migration Zones by Rapp and Abbe (2003):
http://www.ecy.wa.gov/biblio/0306027.html
Draft Channel Migration Assessment Clallam County
April 2013 Page 7
Chapter 2 Regulatory Context
The Shoreline Master Program (SMP) Guidelines are state standards that local governments must
follow in drafting their shoreline master programs (see Appendix B for regulations relating to
CMZs). The Guidelines translate the broad policies of the Shoreline Management Act
(RCW 90.58.020) into standards for regulation of shoreline uses.
The Shoreline Management Act (SMA) provides for the protection of ecological functions while
allowing for reasonable and appropriate uses (RCW 90.58.020). It also describes the
responsibilities and relationship between local and state government.
The SMA “establishes a cooperative program of shoreline management between local
government and the state. Local government shall have the primary responsibility for initiating
the planning required by this chapter and administering the regulatory program consistent with
the policy and provisions of this chapter. The department shall act primarily in a supportive and
review capacity with an emphasis on providing assistance to local government and on insuring
compliance with the policy and provisions of this chapter” (RCW 90.58.05).
The Washington State Shoreline Master Program guidelines, administered through the
Washington Department of Ecology (Ecology), identify channel migration zones as critical
freshwater habitats. Guidelines for Shoreline Master Program updates require that local
jurisdictions identify potential conflicts along shorelines based on current and projected use
(WAC 173-26-201(3)(d)(ii)). Specifically, channel migration zones are to be identified as part
of an inventory of shoreline conditions (WAC 173-26-201(3) (c) (vii)).
The purpose for identifying Channel Migration Zones is described in the rules governing flood
hazard reduction in the general master program provisions (WAC 173-26-221):
“Over the long term, the most effective means of flood hazard reduction is to prevent or
remove development in flood-prone areas, to manage storm water within the flood plain,
and to maintain or restore river and stream system's natural hydrological and
geomorphological processes…
The dynamic physical processes of rivers, including the movement of water, sediment
and wood, cause the river channel in some areas to move laterally, or “migrate,” over
time. This is a natural process in response to gravity and topography and allows the river
to release energy and distribute its sediment load. The area within which a river channel
is likely to move over a period of time is referred to as the channel migration zone
(CMZ). Scientific examination as well as experience has demonstrated that interference
with this natural process often has unintended consequences for human users of the river
and its valley such as increased or changed flood, sedimentation and erosion patterns. It
also has adverse effects on fish and wildlife through loss of critical habitat for river and
riparian dependent species. Failing to recognize the process often leads to damage to, or
loss of, structures and threats to life safety.
Applicable shoreline master programs should include provisions to limit development
and shoreline modifications that would result in interference with the process of channel
migration that may cause significant adverse impacts to property or public improvements
Draft Channel Migration Assessment Clallam County
Page 8 April 2013
and/or result in a net loss of ecological functions associated with the rivers and streams.”
WAC 173-26-221(3).
WAC 173-26-201(3) (c) (vii) states that local government shall, at a minimum, and to the extent
such information is relevant and reasonably available, collect the following information: General
location of channel migration zones, and flood plains. Ecology interprets this requirement to
mean that a channel migration map will be developed. The guidelines only require that the
general location be identified based on existing data rather than identifying channel migration
zones based on detailed channel migration assessment.
The regulations provide limited guidance for collecting information on the general location of
channel migration zones:
“The channel migration zone should be established to identify those areas with a high
probability of being subject to channel movement based on the historic record, geologic
character and evidence of past migration. It should also be recognized that past action is
not a perfect predictor of the future and that human and natural changes may alter
migration patterns. Consideration should be given to such changes that may have
occurred and their effect on future migration patterns.
For management purposes, the extent of likely migration along a stream reach can be
identified using evidence of active stream channel movement over the past one hundred
years. Evidence of active movement can be provided from historic and current aerial
photos and maps and may require field analysis of specific channel and valley bottom
characteristics in some cases. A time frame of one hundred years was chosen because
aerial photos, maps and field evidence can be used to evaluate movement in this time
frame.” WAC 173-26-221(3) (emphasis added).
The federal regulatory and legal environment also recognizes the importance of channel
migration areas and their relationship to critical habitat in the Puget Sound. The Washington
Forest Practices Habitat Conservation Plan, authorized under the Endangered Species Act,
provides authorization for incidental take of listed fish species provided that authorized forest
practices are followed. Forest practices regulations define the channel migration zone as an area
where the active channel of a stream or river is prone to move and the movement results in a
potential near-term loss of riparian function and associated habitat adjacent to the stream
(WAC 222-16-010). Although the definition of the CMZ used in the forest practices regulation
is similar to the definition used in the SMP, the forest practice rules include the near-term loss of
riparian function and habitat as part of the definition. No timber harvest, road construction or
salvage is permitted within CMZs except for the construction and maintenance of road crossings
and the creation and use of yarding corridors in accordance with applicable rules (WAC 222-30-
020(12)).
More recently, the National Marine Fisheries Service (NMFS) Biological Opinion declared the
Federal Emergency Management Agency (FEMA) floodplain management program results in a
“take” of Puget Sound Chinook salmon, steelhead and Orca whales (NMFS 2008). NMFS
opinion allows for reasonable and prudent alternatives to be implemented that would avoid the
likelihood of jeopardizing the continued existence of listed species or result in destruction or
Draft Channel Migration Assessment Clallam County
April 2013 Page 9
adverse modification of critical habitat. NMFS discussed with FEMA the availability of a
reasonable and prudent alternative that FEMA can take to avoid violation of the Endangered
Species Act section 7(a)(2) responsibilities (50 CFR 402.14(g)(5)). FEMA lists the Washington
State Shoreline Master Program updates as a reasonable and prudent alternative to implementing
the channel migration requirements of the biological opinion.
Draft Channel Migration Assessment Clallam County
Page 10 April 2013
Chapter 3 Landscape Context
The topography, geology, climate, soils, vegetation, and land use characteristics for an area
collectively describe the landscape context for hydrologic and geomorphic processes. These
basin-scale conditions exert physical controls on characteristics such as valley slope, stream
discharge, sediment load input, and bank material composition. This section presents the
generalized landscape context for the study area to provide background information on the
basin-scale conditions and processes affecting channel migration.
3.1 Topography The area of Clallam County evaluated in this study includes two distinct physiographic zones,
the southwestern interior and Olympic Foothills and the northwest interior and western coastal
area. See inset map in Figure 3.1 showing the locations of the streams and the area of the
physiographic zones. The Olympic Mountains lie outside of the area evaluated in this study.
The first physiographic zone is the southwestern interior and Olympic Foothills, the area that lies
south of Lake Crescent and extends to the County line on the south and the Pacific Coast on the
west. Streams in this zone generally flow west from headwaters in the western Olympic
Mountain foothills onto a broad glacio-fluvial plain. Streams in this zone include tributaries of
the Quillayute River: the Sol Duc, Bogachiel, Calawah, and Sitkum Rivers. This area has
moderate relief at the eastern end in the Olympic foothills where elevations vary between 4,000-
foot ridges to 1,450-foot valley bottoms. Relief on the glacio-fluvial plain is modest, ranging
from 250 feet on the highest terraces to 50 feet on the active alluvial plain.
The second physiographic zone in the study area is the northwest interior and western coast,
which lies southwest of the Crescent formation (see figure 3.1). Streams in this zone flow
through relatively deep canyons into Lake Ozette (Big, Umbrella and Crooked Creek),
southward to a confluence with the Quillayute River (Dickey River) and north northwest to
confluences with Sooes River (Pilchuck and Snag Creeks). This study area has modest relief.
Highlands reach elevations of nearly 1,600 feet and valley bottoms are around 50 feet. Valleys
are typically broad and most were glacially formed.
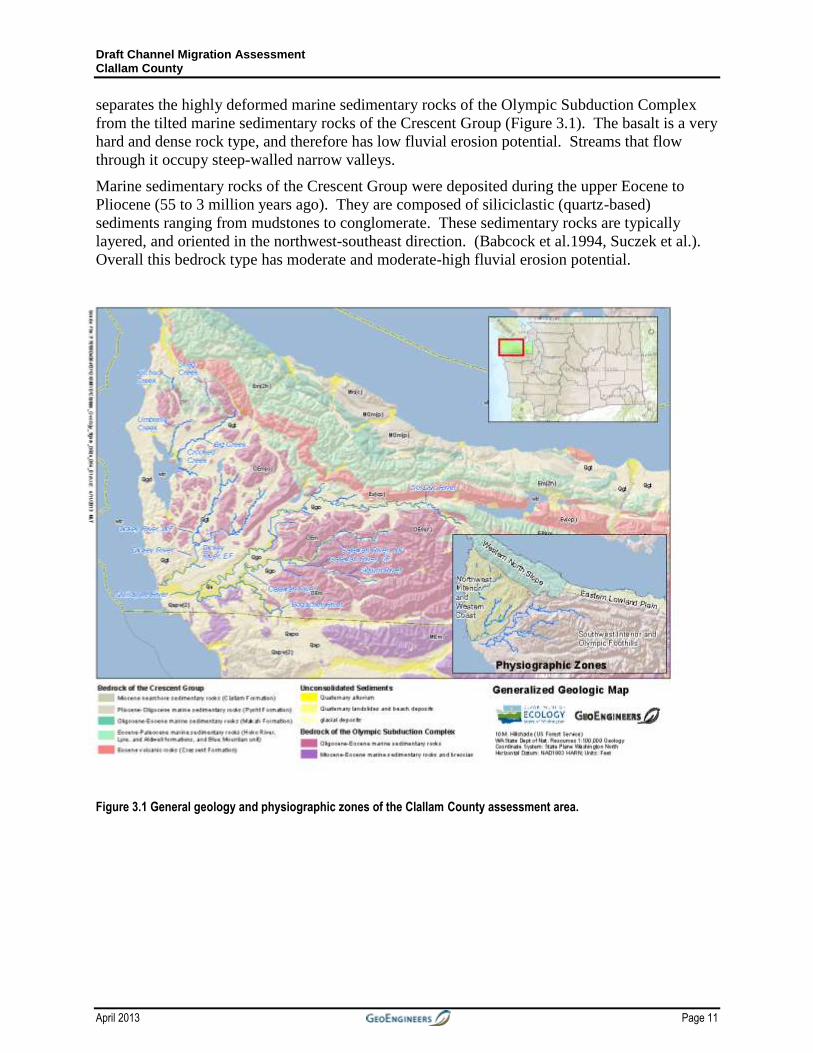
3.2 Geology Three principle types of bedrock underlie the study area: highly deformed marine sedimentary
rocks of the Olympic Subduction Complex, basalts of the Crescent Formation, and marine
sedimentary rocks of the Crescent Group (Figure 3.1). See Table 4.2 for descriptions of the
erosion potential for these bedrock types.
The highly deformed marine sedimentary rocks of the Olympic Subduction Complex consist of
sediment that was deposited on the Juan de Fuca plate and accreted to the base of the North
American Plate during subduction of the Juan de Fuca plate (Brandon and Vance, 1992).
Because they are highly deformed and often highly fractured, these rocks have moderate to high
fluvial erosion potential and may be prone to landslides.
The basalt unit of the Crescent formation formed from lava flows in a rift zone on the seafloor
during the Eocene epoch (between 34 and 55 Million years ago). Subsequent tectonic processes
have uplifted and tilted the Crescent Formation to its current position. The Crescent Formation
Draft Channel Migration Assessment Clallam County
April 2013 Page 11
separates the highly deformed marine sedimentary rocks of the Olympic Subduction Complex
from the tilted marine sedimentary rocks of the Crescent Group (Figure 3.1). The basalt is a very
hard and dense rock type, and therefore has low fluvial erosion potential. Streams that flow
through it occupy steep-walled narrow valleys.
Marine sedimentary rocks of the Crescent Group were deposited during the upper Eocene to
Pliocene (55 to 3 million years ago). They are composed of siliciclastic (quartz-based)
sediments ranging from mudstones to conglomerate. These sedimentary rocks are typically
layered, and oriented in the northwest-southeast direction. (Babcock et al.1994, Suczek et al.).
Overall this bedrock type has moderate and moderate-high fluvial erosion potential.
Figure 3.1 General geology and physiographic zones of the Clallam County assessment area.
Draft Channel Migration Assessment Clallam County
Page 12 April 2013
The modern landscape of Clallam County was primarily formed by glaciation, paraglacial
processes, and large changes in relative sea level. Continental glaciers advanced and retreated
from the study area numerous times during the Quaternary period (approximately the last two
million years). The most recent advance of the continental ice sheet overrode low elevations
approximately 15,000 years ago. Extensive glacial deposits cover the lowland parts of Clallam
County and glacial outwash fills the broad valleys in the south central part of the County (Figure
3.1). The Juan de Fuca Lobe of the continental ice sheet filled what is now the Strait of Juan de
Fuca. It influenced the landscape to elevations of up to 3000 feet along the north coast of the
Olympic Peninsula (Polenz et al., 2004) and flowed over the foothills in the northwest part of the
peninsula to the Pacific Ocean. Alpine Glaciers occupied mountain valleys of the Olympic
peninsula. With the exception of the glacier that occupied the Elwha River valley, these alpine
glaciers were not connected to the Juan de Fuca Lobe but flowed either west into the Pacific
Ocean, or east to merge with the Puget Lobe.
Glacial deposits in the study area include outwash, drift, and till. Glacial outwash is generally
well-sorted sand and gravel deposited by meltwater draining off the glacier. As is described in
Table 4.2, glacial outwash deposits have moderate to high fluvial erosion potential. Glacial drift
either was deposited directly from floating ice masses or consists of variable, layered glacial
deposits that may include outwash, till, and glacial lacustrine deposits (Gerstel and Lingley,
2000); thus drift has a generally moderate fluvial erosion potential. Glacial till is unsorted sand,
gravel, silt, and clay deposited beneath the base of a glacier. Un-fractured basal till has low
fluvial erosion potential and fractured till has high fluvial erosion potential.
Dramatic changes in relative sea level elevation from the time of deglaciation to the present have
had important effects on stream valleys in the study area. These changes in relative sea level
were caused both by fluctuations in the absolute (global) sea level and the absolute elevation of
the local land surface. The weight of the large continental glacier depressed the absolute
elevation of the land surface. Following the retreat of the continental glaciers about 13,000 years
ago, the local land surface was still depressed relative to sea level. During this period of high
relative sea level, streams graded to this higher sea level migrated across the low gradient plain
depositing thick alluvial sediment deposits. As the land surface rebounded after the weight of
glacial ice was removed, relative sea level dropped and streams incised deep valleys into the
lowland plain and western foothills. A series of alluvial terraces on valley walls record stream
incision as river valley elevations graded to this sea level minimum. After about 11,000 years
ago crustal rebound slowed but absolute global sea level continued to rise. This caused the
relative sea level along the Olympic Peninsula to rise until it reached current sea level elevation
about 6,000 years ago. The valleys that had graded to a much lower relative sea level then filled
with alluvial sediment to form the current flood plains along the western lowland (Schasse et al.,
2004; Polenz et al., 2004; and citations therein). The resulting alluvial valley fill is highly
erodible and forms a very low relief surface, enabling streams to readily migrate across the
whole valley bottom. Stream reaches upgradient from the effects of sea level fluctuation, are
largely controlled by bedrock; these reaches have slowly incised since the retreat of the glaciers,
and continue to degrade to the present day (Polenz et al., 2004).
3.3 Precipitation and Runoff Climatic conditions in Clallam County are characterized by seasonal variations with cool, wet
winters and generally dry summers. There is a very strong precipitation gradient across the
county. Rainfall in the northwestern foothills along the pacific coast averages up to 140 inches
Draft Channel Migration Assessment Clallam County
April 2013 Page 13
per year while rainfall in the extreme northeast part of the county averages as little as 15 inches
per year (Daly, 2000).
Rainfall is the dominant form of precipitation affecting surface runoff and streamflow
characteristics. High flows typically persist through the winter and peak flows are generated by
winter storms. Snowfall is uncommon in the lowland areas but accumulates in the mountains
during winter. Snowmelt contributes to spring runoff volumes for streams draining the
Olympic Mountains but does not raise flows to flood stages.
Extreme flood events occur in response to episodic events known as atmospheric rivers or “the
pineapple express.” These narrow plumes transport large amounts of moisture directly from the
subtropics and produce large amounts of precipitation. Recent studies indicate that extreme
flood events in Western Washington have increased in frequency and magnitude during recent
decades and suggest a likelihood that this trend will continue under projected climate change
scenarios (e.g., Abbe et al., 2008; Tohver and Hamlet, 2010). Muschinski and Katz (2013) using
hourly precipitation at Aberdeen weather station found that frequency and intensity of extreme
storm events significantly increased since 1940.
Draft Channel Migration Assessment Clallam County
Page 14 April 2013
Chapter 4 Planning-Level Method
This chapter describes the planning-level method developed for determining general CMZ for
the SMP update process. This section is not intended to be used as guidance for delineating
CMZs, but rather to describe the methods used in estimating the general CMZ mapped in this
report. The delineations were conducted by trained geomorphologists, reviewed by three
licensed geologists each with over 25 years of geomorphology expertise, and approved by the
Department of Ecology consistent with the QAPP (Appendix D).
4.1 Definitions
This report uses language specific to the field of geomorphology as well as terms and acronyms
specific to the planning-level method developed for this investigation. To provide context for
the reader, this section will define some of the terms specific to this report. For definitions of
other technical terms, refer to the glossary of terms and acronyms in Appendix A.
As explained in Chapter 1, the planning-level method developed for the general CMZ
delineations included in this report differs from the method described in Rapp and Abbe (2003)
and the Department of Ecology website. The planning-level method only uses available remote-
sensed data, is less quantitative, does not rely on field-verified data, and is therefore much less
specific than the other more detailed methods. In order to avoid confusion with the terms used in
Rapp and Abbe (2003), this report used different terms to describe similar phenomena. Table 4.1
lists the terms used in this report as well as the similar terms from Rapp and Abbe (2003).
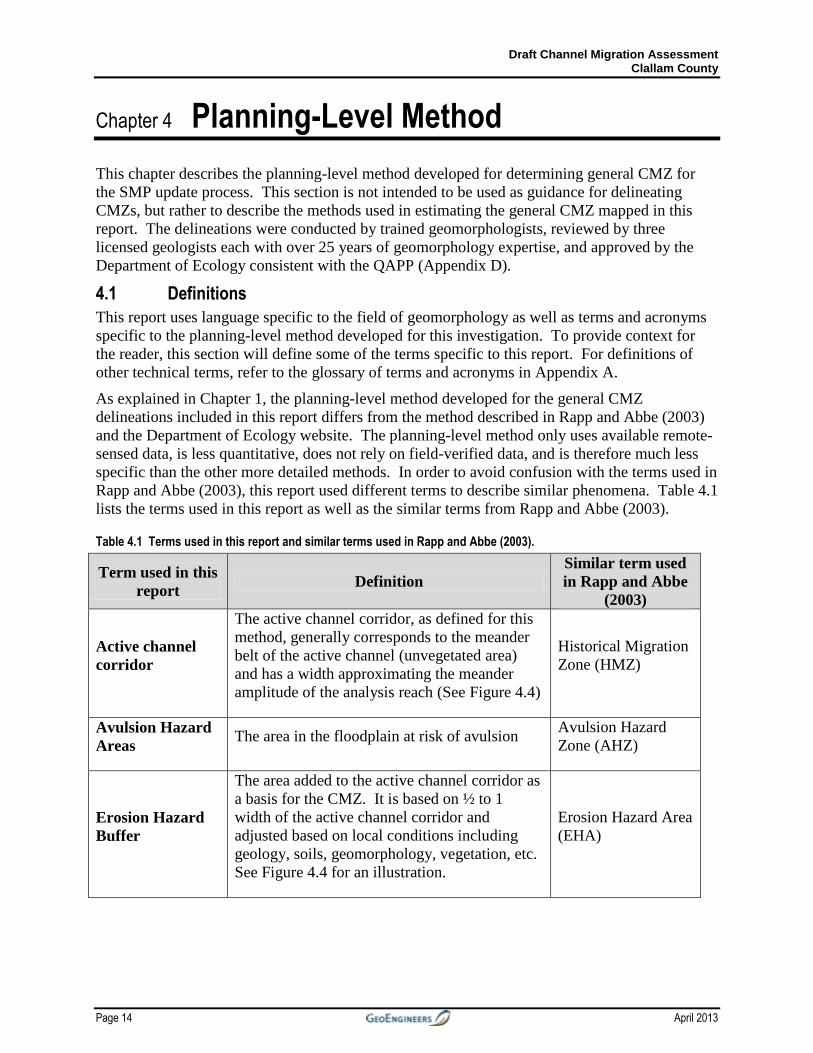
Table 4.1 Terms used in this report and similar terms used in Rapp and Abbe (2003).
Term used in this
report Definition
Similar term used
in Rapp and Abbe
(2003)
Active channel
corridor
The active channel corridor, as defined for this
method, generally corresponds to the meander
belt of the active channel (unvegetated area)
and has a width approximating the meander
amplitude of the analysis reach (See Figure 4.4)
Historical Migration
Zone (HMZ)
Avulsion Hazard
Areas The area in the floodplain at risk of avulsion
Avulsion Hazard
Zone (AHZ)
Erosion Hazard
Buffer
The area added to the active channel corridor as
a basis for the CMZ. It is based on ½ to 1
width of the active channel corridor and
adjusted based on local conditions including
geology, soils, geomorphology, vegetation, etc.
See Figure 4.4 for an illustration.
Erosion Hazard Area
(EHA)
Draft Channel Migration Assessment Clallam County
April 2013 Page 15
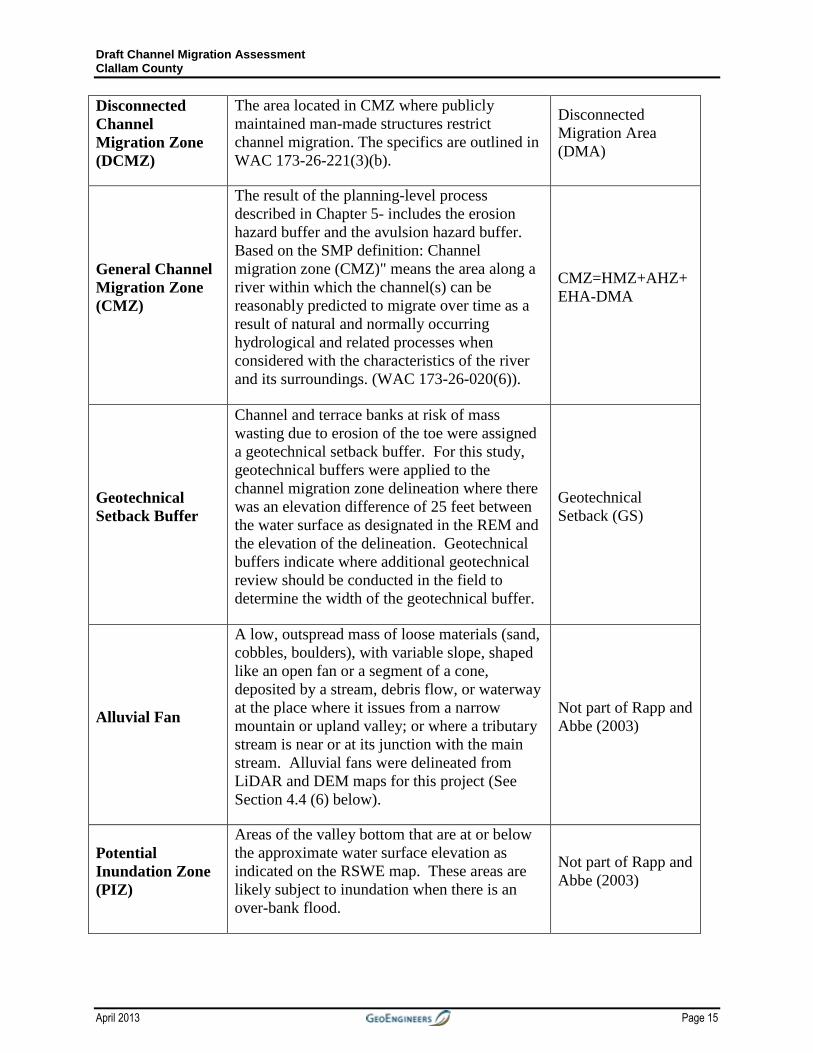
Disconnected
Channel
Migration Zone
(DCMZ)
The area located in CMZ where publicly
maintained man-made structures restrict
channel migration. The specifics are outlined in
WAC 173-26-221(3)(b).
Disconnected
Migration Area
(DMA)
General Channel
Migration Zone
(CMZ)
The result of the planning-level process
described in Chapter 5- includes the erosion
hazard buffer and the avulsion hazard buffer.
Based on the SMP definition: Channel
migration zone (CMZ)" means the area along a
river within which the channel(s) can be
reasonably predicted to migrate over time as a
result of natural and normally occurring
hydrological and related processes when
considered with the characteristics of the river
and its surroundings. (WAC 173-26-020(6)).
CMZ=HMZ+AHZ+
EHA-DMA
Geotechnical
Setback Buffer
Channel and terrace banks at risk of mass
wasting due to erosion of the toe were assigned
a geotechnical setback buffer. For this study,
geotechnical buffers were applied to the
channel migration zone delineation where there
was an elevation difference of 25 feet between
the water surface as designated in the REM and
the elevation of the delineation. Geotechnical
buffers indicate where additional geotechnical
review should be conducted in the field to
determine the width of the geotechnical buffer.
Geotechnical
Setback (GS)
Alluvial Fan
A low, outspread mass of loose materials (sand,
cobbles, boulders), with variable slope, shaped
like an open fan or a segment of a cone,
deposited by a stream, debris flow, or waterway
at the place where it issues from a narrow
mountain or upland valley; or where a tributary
stream is near or at its junction with the main
stream. Alluvial fans were delineated from
LiDAR and DEM maps for this project (See
Section 4.4 (6) below).
Not part of Rapp and
Abbe (2003)
Potential
Inundation Zone
(PIZ)
Areas of the valley bottom that are at or below
the approximate water surface elevation as
indicated on the RSWE map. These areas are
likely subject to inundation when there is an
over-bank flood.
Not part of Rapp and
Abbe (2003)
Draft Channel Migration Assessment Clallam County
Page 16 April 2013
4.2 Stream Selection
Puget Sound streams within Clallam County were selected for planning-level channel migration
assessments based on several criteria including:
Puget Sound SMP update schedule
Channel confinement, gradient, and floodplain
Erosion potential of stream banks
Evidence of channel movement
Land Ownership
Existing CMZ delineations
A draft report describing the method used by the Department of Ecology (Ecology) to select
streams for channel migration assessment is attached as Appendix B, and includes more detail on
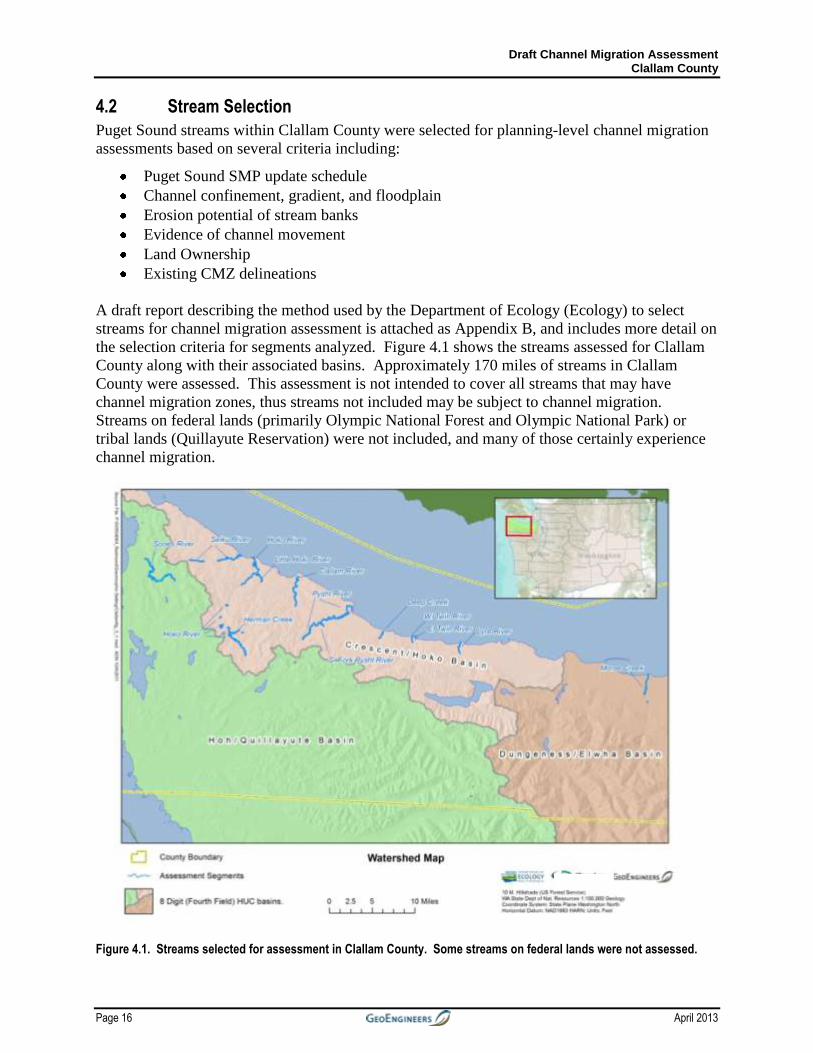
the selection criteria for segments analyzed. Figure 4.1 shows the streams assessed for Clallam
County along with their associated basins. Approximately 170 miles of streams in Clallam
County were assessed. This assessment is not intended to cover all streams that may have
channel migration zones, thus streams not included may be subject to channel migration.
Streams on federal lands (primarily Olympic National Forest and Olympic National Park) or
tribal lands (Quillayute Reservation) were not included, and many of those certainly experience
channel migration.
Figure 4.1. Streams selected for assessment in Clallam County. Some streams on federal lands were not assessed.
Draft Channel Migration Assessment Clallam County
April 2013 Page 17
4.3 Data Sources and Processing
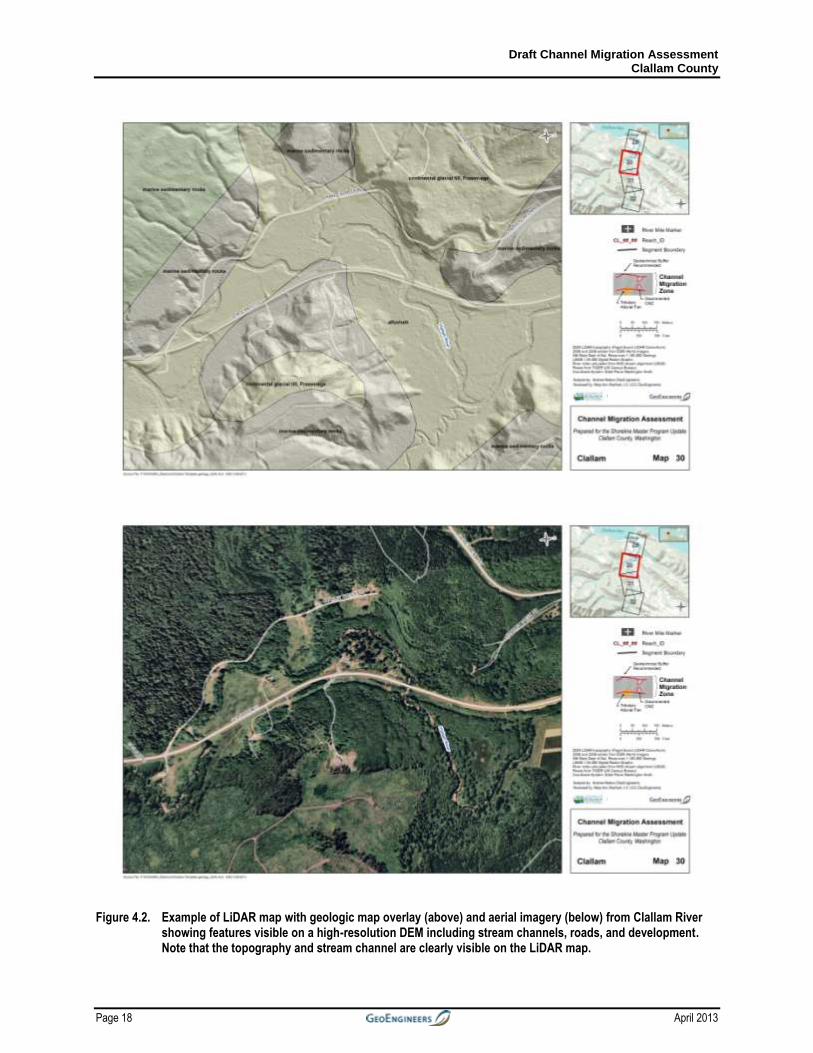
The method developed for this report is a planning-level approach that primarily relies on recent
airphotos and LiDAR ‘bare earth’ digital elevation models (DEMs) to estimate the area where
stream channels have a high probability of moving given current hydrologic and geomorphic
conditions. LiDAR DEMs typically have a horizontal resolution of 2 m (pixel size) and sub-
meter vertical accuracy, although in heavily vegetated areas vertical accuracy can be in error by
over a meter. LiDAR accuracy is more than sufficient for purposes of this analysis. LiDAR-
based DEMs show much more detail than USGS 10m DEMs; geomorphic features such as
channels, alluvial fans, landslide scarps, and infrastructure such as roads and railroad beds are
clearly displayed even for smaller streams that are obscured by vegetation (Figure 4.2). In areas
where LiDAR was unavailable, USGS 10m DEMs and topographic maps were used.
Draft Channel Migration Assessment Clallam County
Page 18 April 2013
Figure 4.2. Example of LiDAR map with geologic map overlay (above) and aerial imagery (below) from Clallam River showing features visible on a high-resolution DEM including stream channels, roads, and development. Note that the topography and stream channel are clearly visible on the LiDAR map.
Draft Channel Migration Assessment Clallam County
April 2013 Page 19
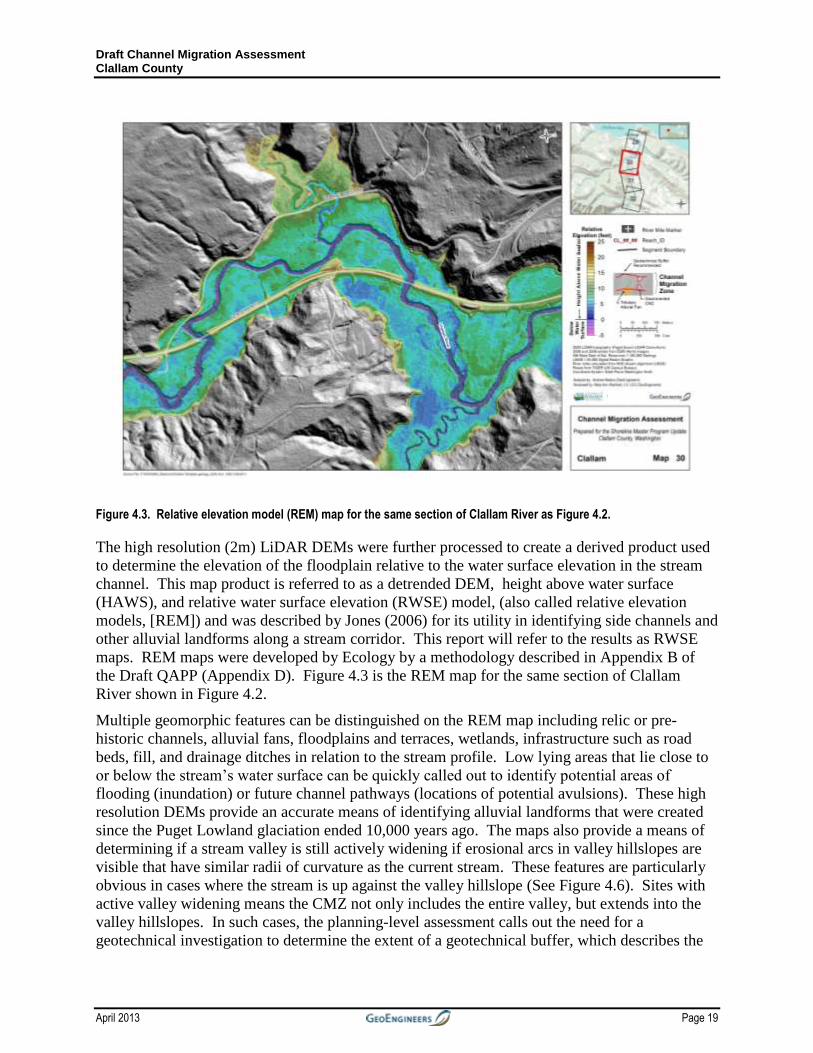
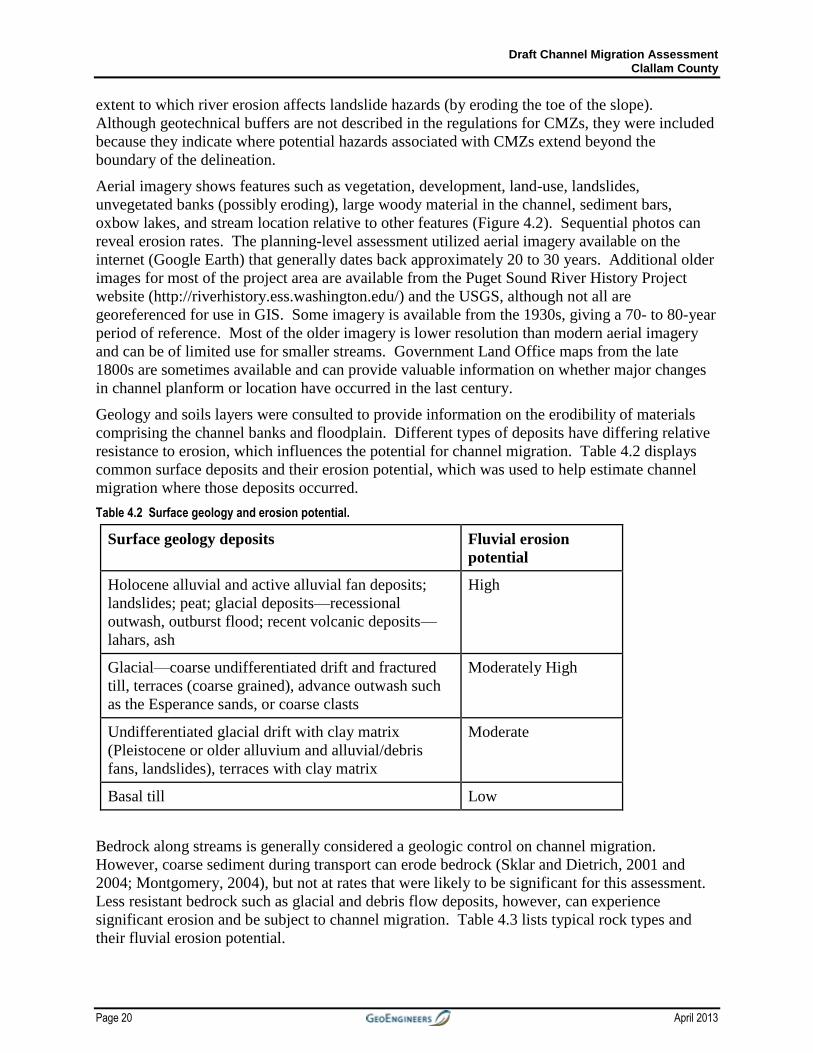
Figure 4.3. Relative elevation model (REM) map for the same section of Clallam River as Figure 4.2.
The high resolution (2m) LiDAR DEMs were further processed to create a derived product used
to determine the elevation of the floodplain relative to the water surface elevation in the stream
channel. This map product is referred to as a detrended DEM, height above water surface
(HAWS), and relative water surface elevation (RWSE) model, (also called relative elevation
models, [REM]) and was described by Jones (2006) for its utility in identifying side channels and
other alluvial landforms along a stream corridor. This report will refer to the results as RWSE
maps. REM maps were developed by Ecology by a methodology described in Appendix B of
the Draft QAPP (Appendix D). Figure 4.3 is the REM map for the same section of Clallam
River shown in Figure 4.2.
Multiple geomorphic features can be distinguished on the REM map including relic or pre-
historic channels, alluvial fans, floodplains and terraces, wetlands, infrastructure such as road
beds, fill, and drainage ditches in relation to the stream profile. Low lying areas that lie close to
or below the stream’s water surface can be quickly called out to identify potential areas of
flooding (inundation) or future channel pathways (locations of potential avulsions). These high
resolution DEMs provide an accurate means of identifying alluvial landforms that were created
since the Puget Lowland glaciation ended 10,000 years ago. The maps also provide a means of
determining if a stream valley is still actively widening if erosional arcs in valley hillslopes are
visible that have similar radii of curvature as the current stream. These features are particularly
obvious in cases where the stream is up against the valley hillslope (See Figure 4.6). Sites with
active valley widening means the CMZ not only includes the entire valley, but extends into the
valley hillslopes. In such cases, the planning-level assessment calls out the need for a
geotechnical investigation to determine the extent of a geotechnical buffer, which describes the
Draft Channel Migration Assessment Clallam County
Page 20 April 2013
extent to which river erosion affects landslide hazards (by eroding the toe of the slope).
Although geotechnical buffers are not described in the regulations for CMZs, they were included
because they indicate where potential hazards associated with CMZs extend beyond the
boundary of the delineation.
Aerial imagery shows features such as vegetation, development, land-use, landslides,
unvegetated banks (possibly eroding), large woody material in the channel, sediment bars,
oxbow lakes, and stream location relative to other features (Figure 4.2). Sequential photos can
reveal erosion rates. The planning-level assessment utilized aerial imagery available on the
internet (Google Earth) that generally dates back approximately 20 to 30 years. Additional older
images for most of the project area are available from the Puget Sound River History Project
website (http://riverhistory.ess.washington.edu/) and the USGS, although not all are
georeferenced for use in GIS. Some imagery is available from the 1930s, giving a 70- to 80-year
period of reference. Most of the older imagery is lower resolution than modern aerial imagery
and can be of limited use for smaller streams. Government Land Office maps from the late
1800s are sometimes available and can provide valuable information on whether major changes
in channel planform or location have occurred in the last century.
Geology and soils layers were consulted to provide information on the erodibility of materials
comprising the channel banks and floodplain. Different types of deposits have differing relative
resistance to erosion, which influences the potential for channel migration. Table 4.2 displays
common surface deposits and their erosion potential, which was used to help estimate channel
migration where those deposits occurred.
Table 4.2 Surface geology and erosion potential.
Surface geology deposits Fluvial erosion
potential
Holocene alluvial and active alluvial fan deposits;
landslides; peat; glacial deposits—recessional
outwash, outburst flood; recent volcanic deposits—
lahars, ash
High
Glacial—coarse undifferentiated drift and fractured
till, terraces (coarse grained), advance outwash such
as the Esperance sands, or coarse clasts
Moderately High
Undifferentiated glacial drift with clay matrix
(Pleistocene or older alluvium and alluvial/debris
fans, landslides), terraces with clay matrix
Moderate
Basal till Low
Bedrock along streams is generally considered a geologic control on channel migration.
However, coarse sediment during transport can erode bedrock (Sklar and Dietrich, 2001 and
2004; Montgomery, 2004), but not at rates that were likely to be significant for this assessment.
Less resistant bedrock such as glacial and debris flow deposits, however, can experience
significant erosion and be subject to channel migration. Table 4.3 lists typical rock types and
their fluvial erosion potential.
Draft Channel Migration Assessment Clallam County
April 2013 Page 21
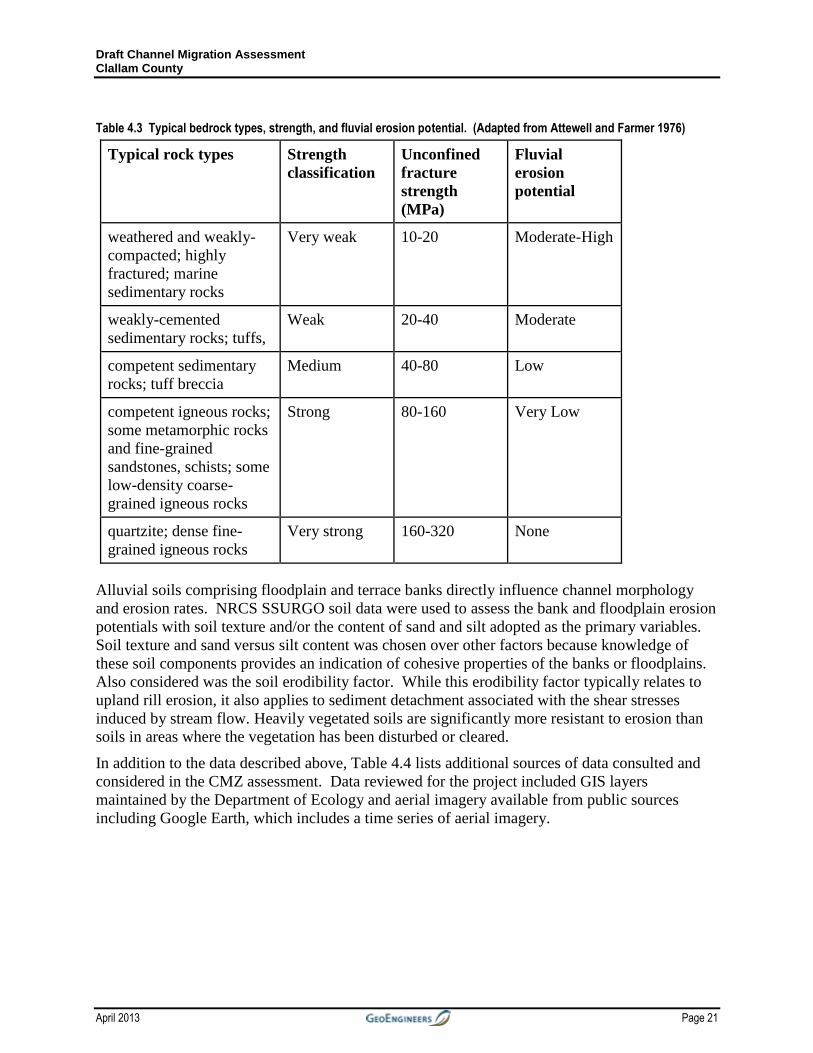
Table 4.3 Typical bedrock types, strength, and fluvial erosion potential. (Adapted from Attewell and Farmer 1976)
Typical rock types Strength
classification
Unconfined
fracture
strength
(MPa)
Fluvial
erosion
potential
weathered and weakly-
compacted; highly
fractured; marine
sedimentary rocks
Very weak 10-20 Moderate-High
weakly-cemented
sedimentary rocks; tuffs,
Weak 20-40 Moderate
competent sedimentary
rocks; tuff breccia
Medium 40-80 Low
competent igneous rocks;
some metamorphic rocks
and fine-grained
sandstones, schists; some
low-density coarse-
grained igneous rocks
Strong 80-160 Very Low
quartzite; dense fine-
grained igneous rocks
Very strong 160-320 None
Alluvial soils comprising floodplain and terrace banks directly influence channel morphology
and erosion rates. NRCS SSURGO soil data were used to assess the bank and floodplain erosion
potentials with soil texture and/or the content of sand and silt adopted as the primary variables.
Soil texture and sand versus silt content was chosen over other factors because knowledge of
these soil components provides an indication of cohesive properties of the banks or floodplains.
Also considered was the soil erodibility factor. While this erodibility factor typically relates to
upland rill erosion, it also applies to sediment detachment associated with the shear stresses
induced by stream flow. Heavily vegetated soils are significantly more resistant to erosion than
soils in areas where the vegetation has been disturbed or cleared.
In addition to the data described above, Table 4.4 lists additional sources of data consulted and
considered in the CMZ assessment. Data reviewed for the project included GIS layers
maintained by the Department of Ecology and aerial imagery available from public sources
including Google Earth, which includes a time series of aerial imagery.
Draft Channel Migration Assessment Clallam County
Page 22 April 2013
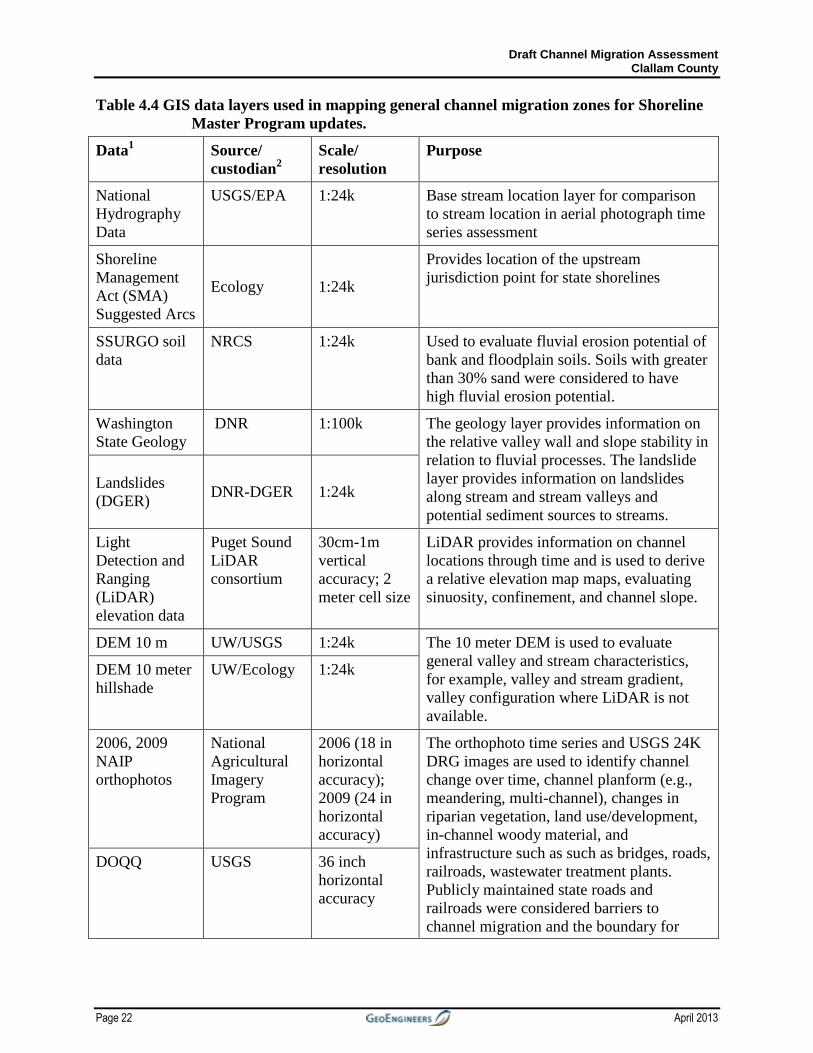
Table 4.4 GIS data layers used in mapping general channel migration zones for Shoreline
Master Program updates.
Data1
Source/
custodian2
Scale/
resolution
Purpose
National
Hydrography
Data
USGS/EPA 1:24k Base stream location layer for comparison
to stream location in aerial photograph time
series assessment
Shoreline
Management
Act (SMA)
Suggested Arcs
Ecology 1:24k
Provides location of the upstream
jurisdiction point for state shorelines
SSURGO soil
data
NRCS 1:24k Used to evaluate fluvial erosion potential of
bank and floodplain soils. Soils with greater
than 30% sand were considered to have
high fluvial erosion potential.
Washington
State Geology
DNR 1:100k The geology layer provides information on
the relative valley wall and slope stability in
relation to fluvial processes. The landslide
layer provides information on landslides
along stream and stream valleys and
potential sediment sources to streams.
Landslides
(DGER) DNR-DGER 1:24k
Light
Detection and
Ranging
(LiDAR)
elevation data
Puget Sound
LiDAR
consortium
30cm-1m
vertical
accuracy; 2
meter cell size
LiDAR provides information on channel
locations through time and is used to derive
a relative elevation map maps, evaluating
sinuosity, confinement, and channel slope.
DEM 10 m UW/USGS 1:24k The 10 meter DEM is used to evaluate
general valley and stream characteristics,
for example, valley and stream gradient,
valley configuration where LiDAR is not
available.
DEM 10 meter
hillshade
UW/Ecology 1:24k
2006, 2009
NAIP
orthophotos
National
Agricultural
Imagery
Program
2006 (18 in
horizontal
accuracy);
2009 (24 in
horizontal
accuracy)
The orthophoto time series and USGS 24K
DRG images are used to identify channel
change over time, channel planform (e.g.,
meandering, multi-channel), changes in
riparian vegetation, land use/development,
in-channel woody material, and
infrastructure such as such as bridges, roads,
railroads, wastewater treatment plants.
Publicly maintained state roads and
railroads were considered barriers to
channel migration and the boundary for
DOQQ USGS 36 inch
horizontal
accuracy
Draft Channel Migration Assessment Clallam County
April 2013 Page 23
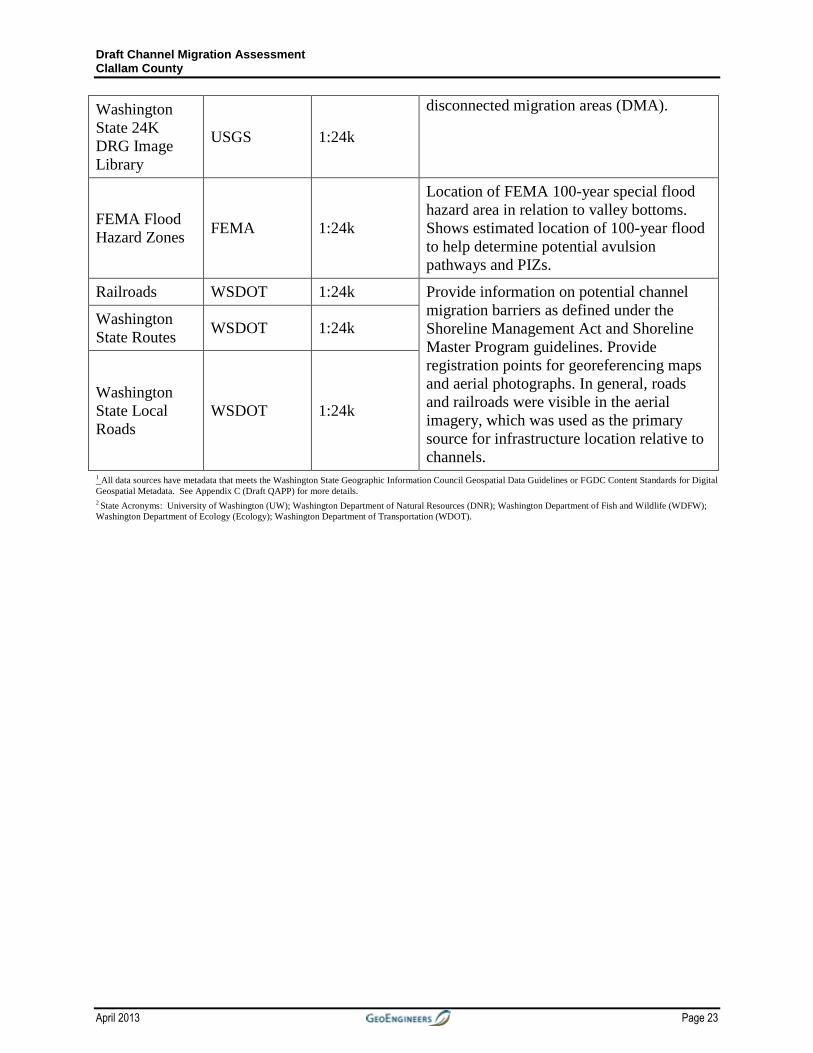
Washington
State 24K
DRG Image
Library
USGS 1:24k
disconnected migration areas (DMA).
FEMA Flood
Hazard Zones FEMA 1:24k
Location of FEMA 100-year special flood
hazard area in relation to valley bottoms.
Shows estimated location of 100-year flood
to help determine potential avulsion
pathways and PIZs.
Railroads WSDOT 1:24k Provide information on potential channel
migration barriers as defined under the
Shoreline Management Act and Shoreline
Master Program guidelines. Provide
registration points for georeferencing maps
and aerial photographs. In general, roads
and railroads were visible in the aerial
imagery, which was used as the primary
source for infrastructure location relative to
channels.
Washington
State Routes WSDOT 1:24k
Washington
State Local
Roads
WSDOT 1:24k
1 All data sources have metadata that meets the Washington State Geographic Information Council Geospatial Data Guidelines or FGDC Content Standards for Digital
Geospatial Metadata. See Appendix C (Draft QAPP) for more details.
2 State Acronyms: University of Washington (UW); Washington Department of Natural Resources (DNR); Washington Department of Fish and Wildlife (WDFW);
Washington Department of Ecology (Ecology); Washington Department of Transportation (WDOT).
Draft Channel Migration Assessment Clallam County
April 2013 Page 24
4.4 Planning-level Method for Channel Migration Assessment
The general channel migration assessment completed for this study is based on analysis of
existing GIS data. The planning-level method used for this study differs from more detailed
methods such as Rapp and Abbe (2003), which estimates historic channel migration rates,
avulsion hazards, erosion hazards, and disconnected migration areas. Rapp and Abbe (2003) or
other more specific methods should be used for site-specific investigations to delineate detailed
channel migration zones in areas designated in this report as having the potential for channel
migration.
The following outlines the procedure used to delineate the areas that have a high probability for
channel migration.
1. GIS Database Management
GIS-mapping projects were created to develop the channel migration assessment for each stream
in the analysis. Data sources included in the review and delineation are described in the section
above. Due to the size of the project area and budget limitations, field data were not collected.
GIS shapefiles were created for the channel migration assessment, as well as for supporting
features such the stream line with segment breaks and river miles, alluvial fans and features,
geomorphic features, and areas that should have a geotechnical assessment where the channel
migration assessment intersects a valley wall or terrace (Table 4.5). Each feature is described in
more detail in the sections below.
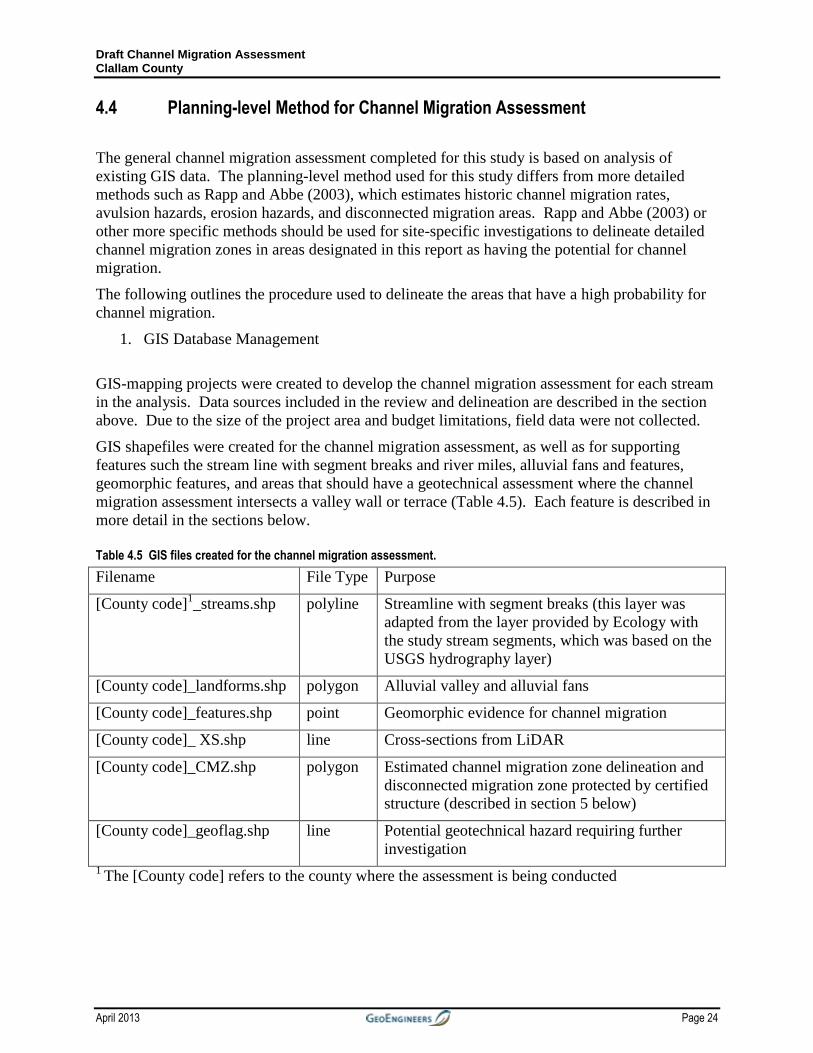
Table 4.5 GIS files created for the channel migration assessment.
Filename File Type Purpose
[County code]1_streams.shp polyline Streamline with segment breaks (this layer was
adapted from the layer provided by Ecology with
the study stream segments, which was based on the
USGS hydrography layer)
[County code]_landforms.shp polygon Alluvial valley and alluvial fans
[County code]_features.shp point Geomorphic evidence for channel migration
[County code]_ XS.shp line Cross-sections from LiDAR
[County code]_CMZ.shp polygon Estimated channel migration zone delineation and
disconnected migration zone protected by certified
structure (described in section 5 below)
[County code]_geoflag.shp line Potential geotechnical hazard requiring further
investigation
1 The [County code] refers to the county where the assessment is being conducted
Draft Channel Migration Assessment Clallam County
April 2013 Page 25
2. Reach Delineation
Streams were subdivided into geomorphic reaches for the channel migration assessment. Each
reach was assigned a unique identifier using the format: [County code]_[stream
number]_[segment number]. Numbering of geomorphic reaches started at the downstream end
and increased in the upstream direction. Criteria considered when delineating reach breaks
included:
a. Changes in gradient (proportional to sediment transport capacity)
b. Changes in valley width
c. Tributary inputs (increasing discharge)
d. Change in channel type
i. Braided channels
ii. Meandering braided channels
iii. Anabranching channels
iv. Single thread straight channel
v. Single thread meandering channel
e. Changes in infrastructure or channelization
f. Changes in geology/erodibility of substrate
g. Changes in land use pattern
3. Document Reach Characteristics
Physical characteristics of the stream were documented in a data sheet (see completed segment
data sheets in Appendix E for each geomorphic reach). The data sheet provides information on
the data used to complete the assessment, geomorphic features observed in each reach, stream
characteristics, infrastructure, and notes from the analyst and QA/QC review (See Appendix E
for more details, and data sheets for each segment as an example). The data sheet provides
supporting details for each segment map, and factors considered in the delineation. Some data
sheets may contain more or less information, depending on the features present, data included on
forms for adjacent segments, and professional judgment.
4. Delineate areas of potential channel migration
The area of potential channel migration was defined for this study as the area with a high
probability of channel movement, according to the regulations (WAC 173-26-020(6)). The
general channel migration zone includes the active channel corridor, the avulsion hazard areas,
and the erosion hazard buffer, which will be explained in detail in this section. Once the general
channel migration zone was established, additional features such as potential inundation zones,
disconnected channel migration zones, alluvial fans, and the geotechnical buffer were added.
Active Channel Corridor
Draft Channel Migration Assessment Clallam County
Page 26 April 2013
The active channel corridor, as defined for this method, generally corresponds to the meander
belt of the active channel and has a width approximating the meander amplitude of the analysis
reach (Figure 4.4).
The active channel corridor varies in width depending on the characteristics of the stream
channel in a given reach. In some cases, the active channel corridor was difficult to determine
and meander amplitudes from other nearby sections of channel were used. For example, in areas
where the channel had been modified or straightened, meander amplitudes from nearby reference
sections that had not been modified were used instead if the geomorphic characteristics of the
reaches were similar. In cases where the stream is well entrenched in glacial soils, the active
corridor included only the stream/river channel.
Draft Channel Migration Assessment Clallam County
April 2013 Page 27
Figure 4.4 Aerial image (above) and REM map (below) for Pysht River showing the Active Channel Corridor, potential avulsion pathways, and channel migration buffer.
Draft Channel Migration Assessment Clallam County
Page 28 April 2013
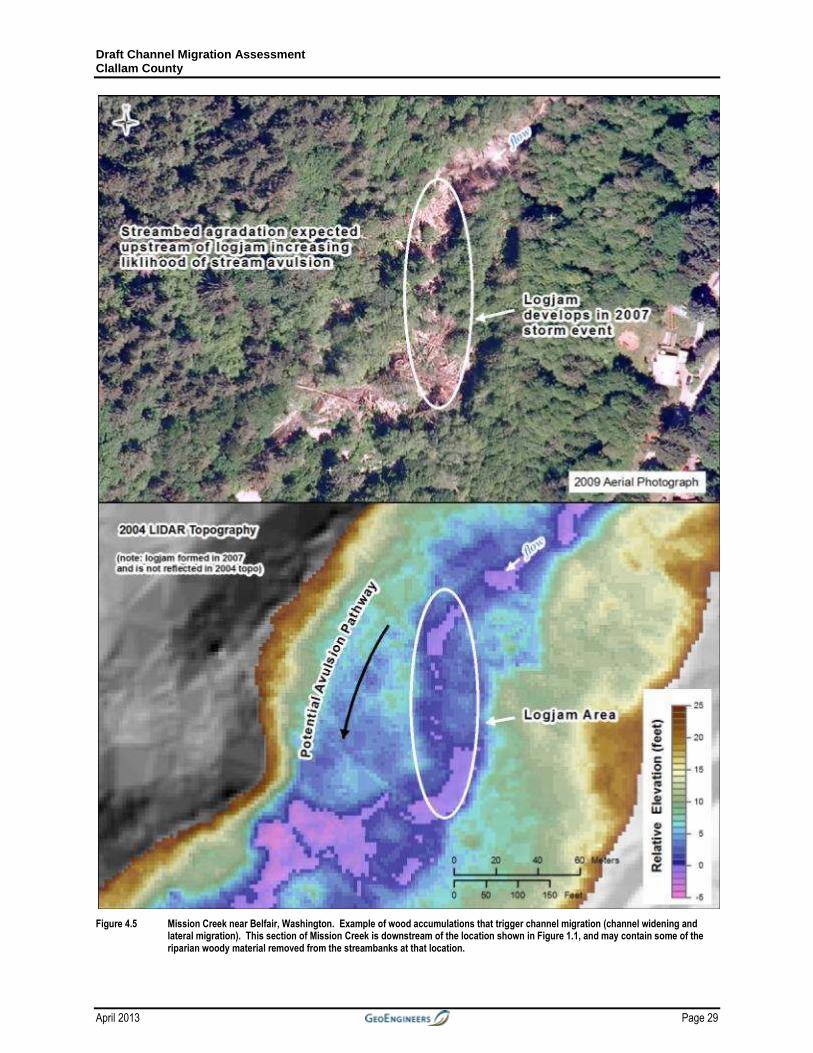
Avulsion Hazard Areas
Avulsion hazard areas typically occur in side channels or low-lying portions of the floodplain
that could be activated if accumulations of wood or sediment were to obstruct and deflect flows
laterally, or if flooding were sufficiently intense. Such avulsions are common in streams flowing
through forested floodplains around Puget Sound. Accumulations of wood can produce stable
structures which alter flow hydraulics and trigger sedimentation on the upstream side (Abbe and
Montgomery 1996, 2003, Montgomery and Abbe 2006). Accumulation of sediment in the
stream channel (aggradation) increases the potential for channel migration. An example of a
recently formed logjam affecting channel migration is shown in Figure 4.5. Rapp and Abbe
(2003) discuss the importance of considering vertical channel variability in assessing channel
migration and Brummer et al. (2006) recommend that CMZ delineations in forested areas in
Washington account for 2 m of vertical variability of the streambed and that areas of the valley
bottom within 2 m of the bankfull elevation are susceptible to channel migration. Potential
avulsion pathways and low-lying portions of the floodplain were delineated from the REM maps
in GIS and included in the channel migration boundary.
Draft Channel Migration Assessment Clallam County
April 2013 Page 29
Figure 4.5 Mission Creek near Belfair, Washington. Example of wood accumulations that trigger channel migration (channel widening and
lateral migration). This section of Mission Creek is downstream of the location shown in Figure 1.1, and may contain some of the riparian woody material removed from the streambanks at that location.
Draft Channel Migration Assessment Clallam County
Page 30 April 2013
Erosion Hazard Buffer
An erosion hazard buffer was applied to account for future channel migration beyond the active
channel corridor and potential avulsion pathways. The buffer width was based on the meander
geometry of the study reach, topography near the stream, and erodability of earth materials near
the stream (the substrate). In low relief areas with highly erodible substrate the buffer was set at
50% to 100% of the meander amplitude. In areas of modest to high relief and in areas with less
erodible substrates the erosion buffer was set at 1 channel width to 50% of the meander
amplitude. This buffer width was based on historic activity, professional judgment of
assessment team, and King County Critical Area Ordinances for channel migration zones (King
County 1999, Figure 4.4). The width of the erosion hazard buffer was adjusted based on
geomorphic conditions in each reach, including rate of recent channel migration, erodibility of
the substrate, floodplain development, stream size and power, location in the valley bottom, and
geomorphic setting such as an underfit or actively forming valley (described below).
Physical characteristics of the reach informed the decision where the erosion hazard boundary
was located beyond the active channel corridor and avulsion hazard areas. Factors considered in
this process included:
Indicators of past channel migration from aerial imagery,
Floodplain topography such as side channels and oxbows,
Erosion potential of bank materials based on soils and geologic data,
Characteristics of the valley margin such as indicators of previous stream erosion,
Potential influence of wood accumulations or landslides that obstruct and deflect flows
and raise water elevations.
Table 4.6 summarizes the general guidelines used for initial delineation of the erosion hazard
buffer, which were then adjusted based on the factors described above. The next sections
describe typical geomorphic valley types in Clallam County and how they were delineated.
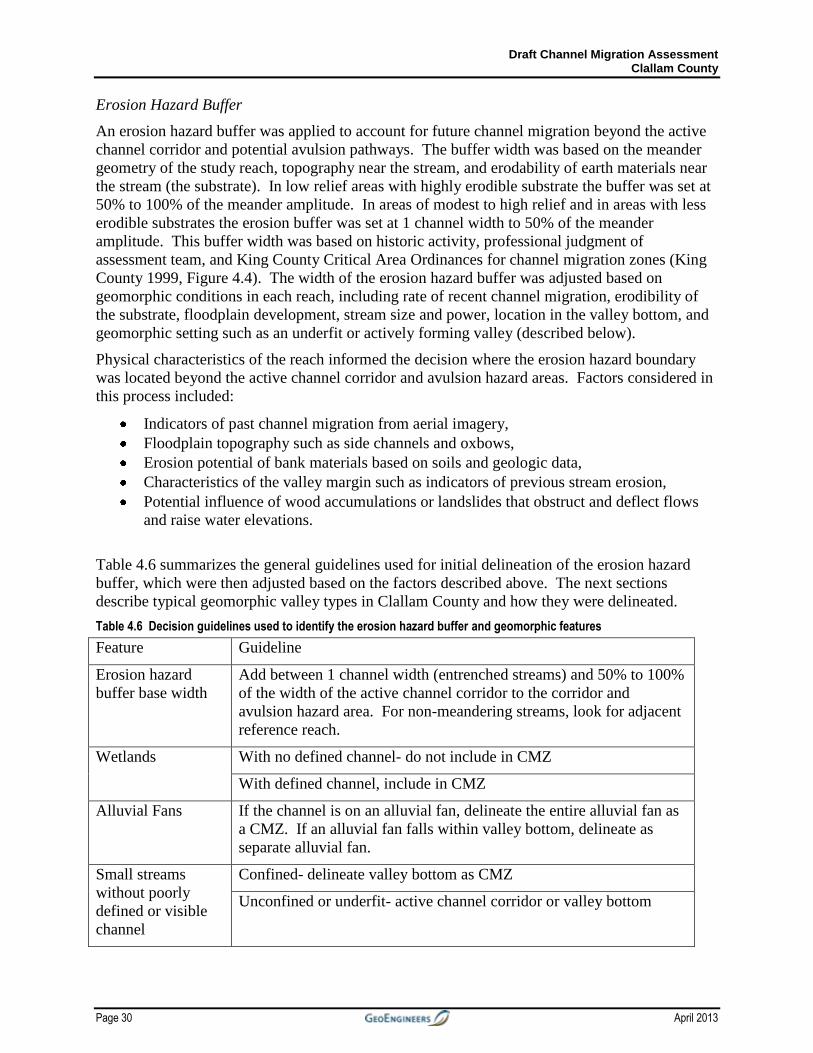
Table 4.6 Decision guidelines used to identify the erosion hazard buffer and geomorphic features
Feature Guideline
Erosion hazard
buffer base width
Add between 1 channel width (entrenched streams) and 50% to 100%
of the width of the active channel corridor to the corridor and
avulsion hazard area. For non-meandering streams, look for adjacent
reference reach.
Wetlands With no defined channel- do not include in CMZ
With defined channel, include in CMZ
Alluvial Fans If the channel is on an alluvial fan, delineate the entire alluvial fan as
a CMZ. If an alluvial fan falls within valley bottom, delineate as
separate alluvial fan.
Small streams
without poorly
defined or visible
channel
Confined- delineate valley bottom as CMZ
Unconfined or underfit- active channel corridor or valley bottom
Draft Channel Migration Assessment Clallam County
April 2013 Page 31
Valley edges or
terraces
If unconsolidated or easily erodible, include valley edge in buffer and
include geotechnical setback buffer
If resistant to erosion, look for indicators of past erosion (scallops,
etc), and place CMZ boundary at extent of past erosion in valley wall
and include geotechnical buffer. Indicators of past valley wall erosion
include: scallops in valley walls, slumps, landslides, undercutting.
Potential
Inundation Zone
(PIZ)
Label areas of the valley bottom that are at or below the approximate
water surface elevation as indicated on the REM RSWE map.
Disconnected
Channel Migration
Zone (DCM)
Identify infrastructure in the valley bottom that meet the criteria for
barriers to channel migration. In Clallam county, these include
railroads and state highways. Delineate area within the erosion
hazard buffer and behind the infrastructure as a DCM.
Geotechnical
setback buffer
If the regulatory CMZ boundary intersects a terrace or valley wall
greater than 25ft above the approximate water surface elevation, add
geotechnical buffer flag
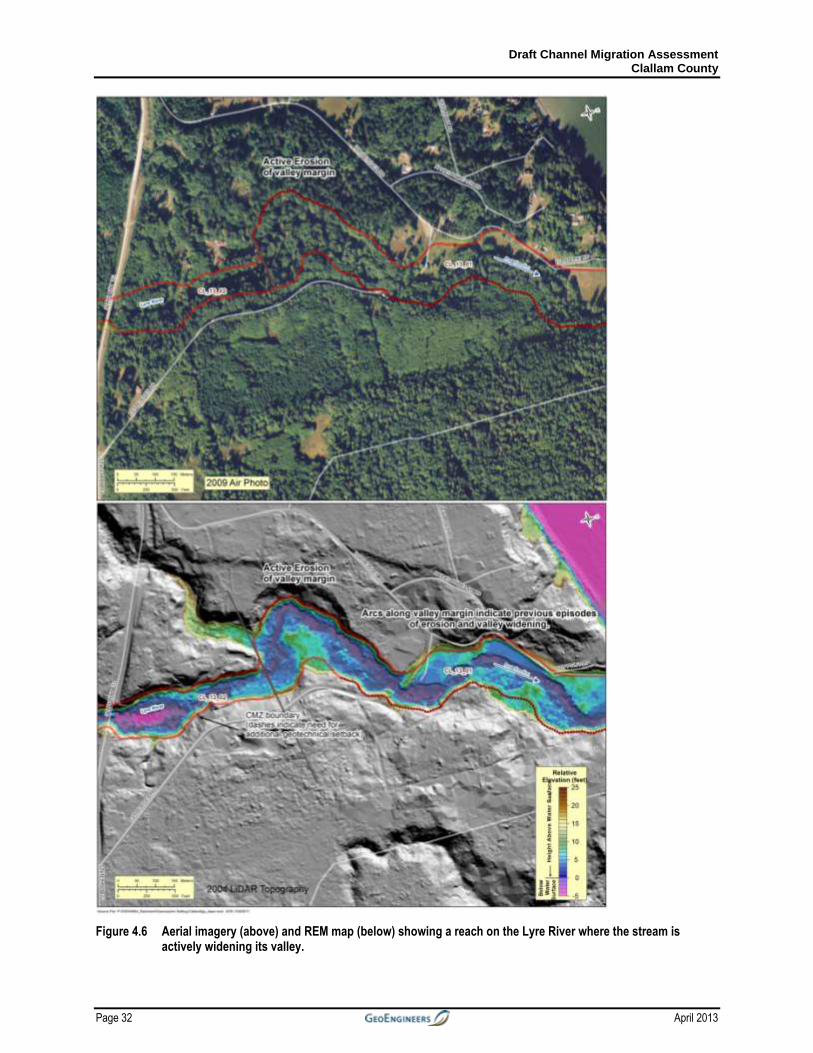
Actively Forming Valleys
Many streams evaluated by this study have formed the valley in which they flow by incision into
an upland surface composed of unconsolidated sediments. These valleys formed during the
Holocene period (following the recession of the Puget Ice lobe approximately 10,000 years ago)
and continue to expand as the stream episodically erodes the valley margin. A key indicator that
a stream valley is actively forming and expanding the valley is the presence of crescentric arcs
along the valley margin that have a radius of curvature similar to the meander geometry of the
adjacent stream. Figure 4.6 illustrates an example of such erosion in an actively forming valley.
The stream is presently flowing directly against the hillslope at a 90 degree bend and has eroded
a crescentric arc into the valley margin. Topography above the stream channel indicates mass
wasting (slumps) are occurring and young vegetation visible in the air photo indicates recent
instability. This example provides evidence that the stream has sufficient power to erode
material at the valley margin in that section of the river. Note that the valley margin has similar
sized arcs in areas up- and downstream where the channel is not flowing against the hillslope.
These arcs in the valley margin are evidence that the river migrates across its valley over time
and episodically removes sections of the hillslope at the valley margin. Given that such erosion
is expected to continue into the future, the channel migration boundary must be set back from the
valley margin (into the hillslope) in anticipation of additional valley wall erosion.
Draft Channel Migration Assessment Clallam County
Page 32 April 2013
Figure 4.6 Aerial imagery (above) and REM map (below) showing a reach on the Lyre River where the stream is actively widening its valley.
Draft Channel Migration Assessment Clallam County
April 2013 Page 33
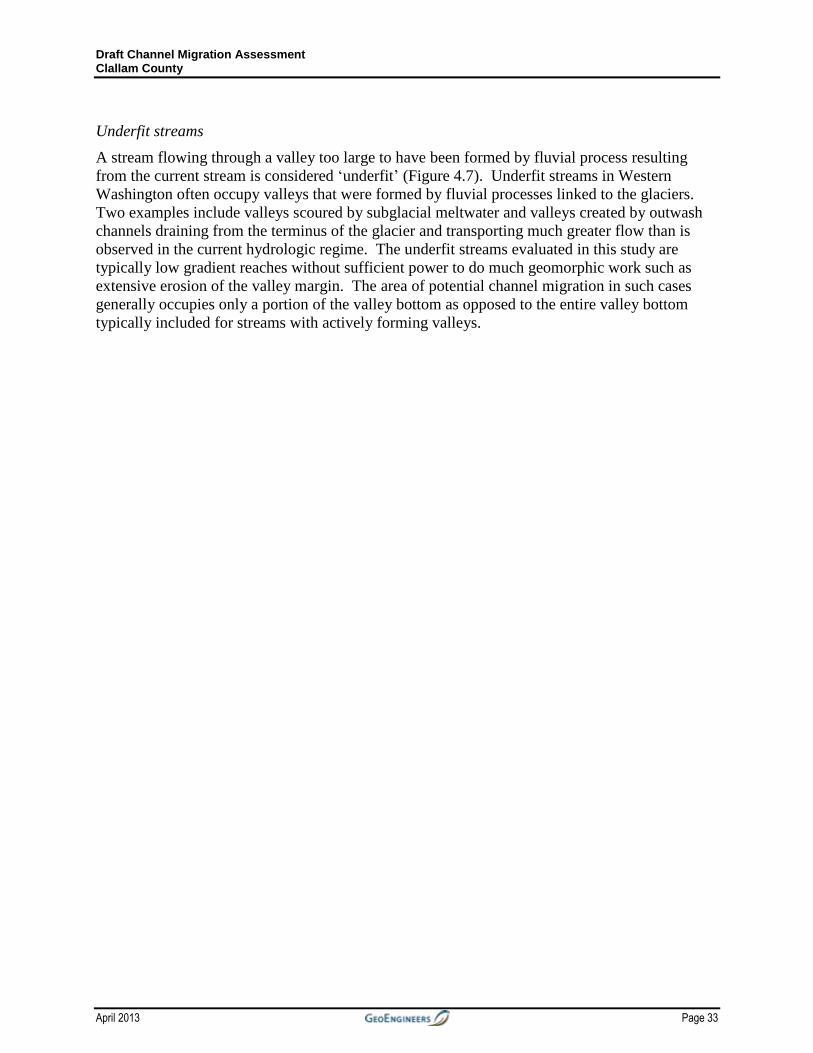
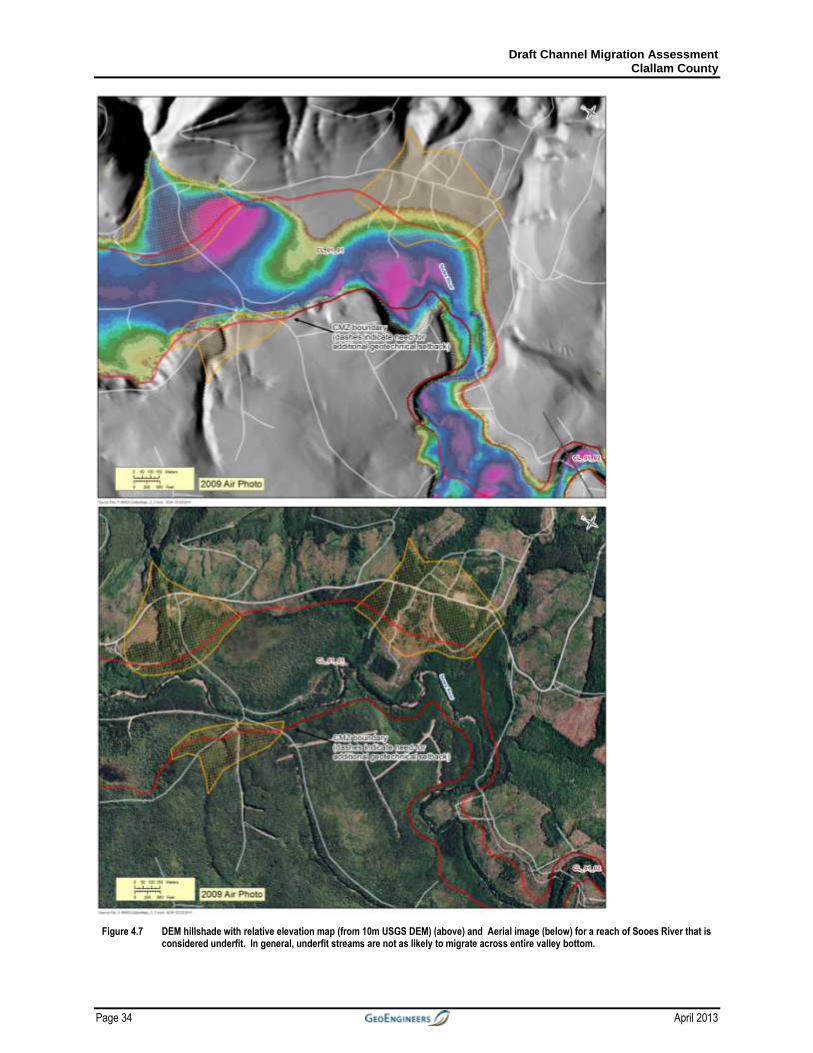
Underfit streams
A stream flowing through a valley too large to have been formed by fluvial process resulting
from the current stream is considered ‘underfit’ (Figure 4.7). Underfit streams in Western
Washington often occupy valleys that were formed by fluvial processes linked to the glaciers.
Two examples include valleys scoured by subglacial meltwater and valleys created by outwash
channels draining from the terminus of the glacier and transporting much greater flow than is
observed in the current hydrologic regime. The underfit streams evaluated in this study are
typically low gradient reaches without sufficient power to do much geomorphic work such as
extensive erosion of the valley margin. The area of potential channel migration in such cases
generally occupies only a portion of the valley bottom as opposed to the entire valley bottom
typically included for streams with actively forming valleys.
Draft Channel Migration Assessment Clallam County
Page 34 April 2013
Figure 4.7 DEM hillshade with relative elevation map (from 10m USGS DEM) (above) and Aerial image (below) for a reach of Sooes River that is
considered underfit. In general, underfit streams are not as likely to migrate across entire valley bottom.
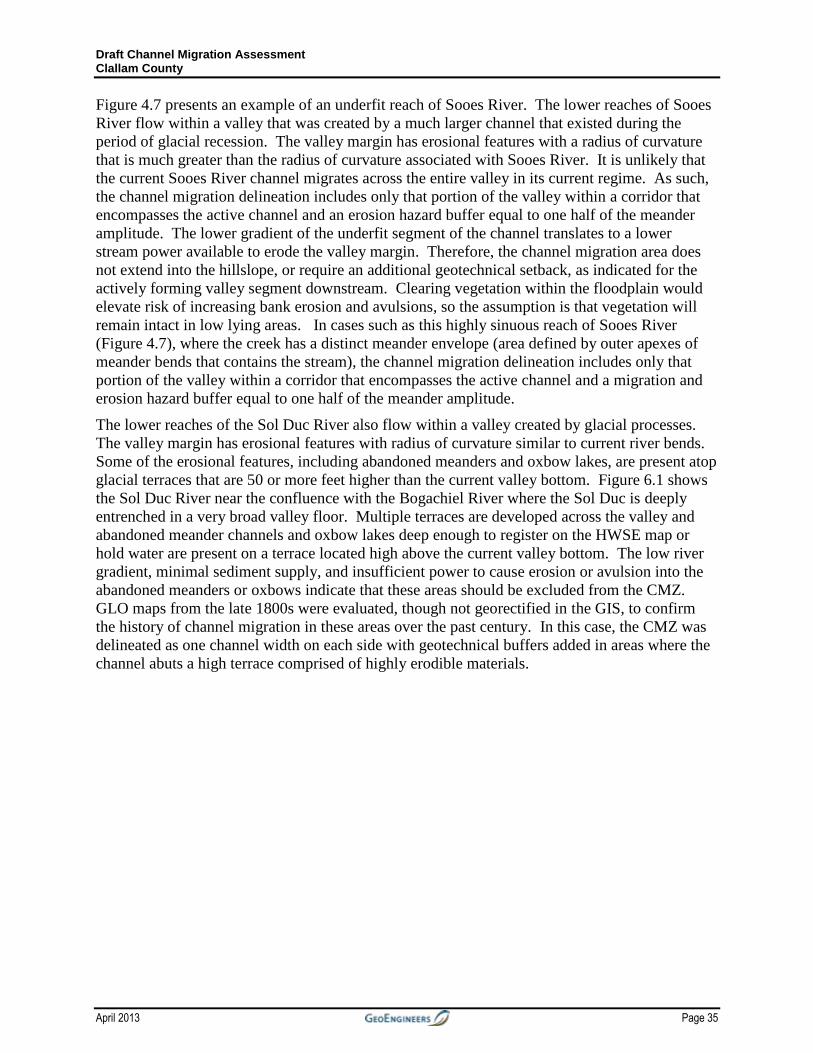
Draft Channel Migration Assessment Clallam County
April 2013 Page 35
Figure 4.7 presents an example of an underfit reach of Sooes River. The lower reaches of Sooes
River flow within a valley that was created by a much larger channel that existed during the
period of glacial recession. The valley margin has erosional features with a radius of curvature
that is much greater than the radius of curvature associated with Sooes River. It is unlikely that
the current Sooes River channel migrates across the entire valley in its current regime. As such,
the channel migration delineation includes only that portion of the valley within a corridor that
encompasses the active channel and an erosion hazard buffer equal to one half of the meander
amplitude. The lower gradient of the underfit segment of the channel translates to a lower
stream power available to erode the valley margin. Therefore, the channel migration area does
not extend into the hillslope, or require an additional geotechnical setback, as indicated for the
actively forming valley segment downstream. Clearing vegetation within the floodplain would
elevate risk of increasing bank erosion and avulsions, so the assumption is that vegetation will
remain intact in low lying areas. In cases such as this highly sinuous reach of Sooes River
(Figure 4.7), where the creek has a distinct meander envelope (area defined by outer apexes of
meander bends that contains the stream), the channel migration delineation includes only that
portion of the valley within a corridor that encompasses the active channel and a migration and
erosion hazard buffer equal to one half of the meander amplitude.
The lower reaches of the Sol Duc River also flow within a valley created by glacial processes.
The valley margin has erosional features with radius of curvature similar to current river bends.
Some of the erosional features, including abandoned meanders and oxbow lakes, are present atop
glacial terraces that are 50 or more feet higher than the current valley bottom. Figure 6.1 shows
the Sol Duc River near the confluence with the Bogachiel River where the Sol Duc is deeply
entrenched in a very broad valley floor. Multiple terraces are developed across the valley and
abandoned meander channels and oxbow lakes deep enough to register on the HWSE map or
hold water are present on a terrace located high above the current valley bottom. The low river
gradient, minimal sediment supply, and insufficient power to cause erosion or avulsion into the
abandoned meanders or oxbows indicate that these areas should be excluded from the CMZ.
GLO maps from the late 1800s were evaluated, though not georectified in the GIS, to confirm
the history of channel migration in these areas over the past century. In this case, the CMZ was
delineated as one channel width on each side with geotechnical buffers added in areas where the
channel abuts a high terrace comprised of highly erodible materials.
Draft Channel Migration Assessment Clallam County
Page 36 April 2013
Figure 4.8 REM map of the delta of Hoko River showing a typical pattern of avulsion channels. A longshore bar has formed filling in the historical channel to the west of the current river mouth.
5. Identify infrastructure that is likely to affect migration and delineate Disconnected
Channel Migration Zone (DCMZ)
Infrastructure construction and land development has commonly occurred in the floodplain and
within the channel migration zone. Depending on the type of infrastructure and how it is
constructed and the power of the stream, infrastructure can act as a barrier to channel migration
or be susceptible to erosion and failure. In the event of a flood or failure, the infrastructure will
often be repaired or replaced depending on the importance of the infrastructure and the extent of
the damage. In general, only infrastructure with a public agency commitment for maintenance
and that are substantial enough to withstand channel migration were considered barriers to
channel migration. Levees that are certified by the Army Corps of Engineers and state highways
are the two cases which we assumed to act as barriers to channel migration. In both these cases,
we assume the facilities were built to withstand channel migration or will be repaired in place
(though there are cases where facilities have been moved after being damaged). State highways
and federal levees and the areas behind them were mapped as disconnected channel migration
zones (Disconnected CMZs, or DCMZs). See Figure 4.9 for an example of a disconnected
channel migration zone.
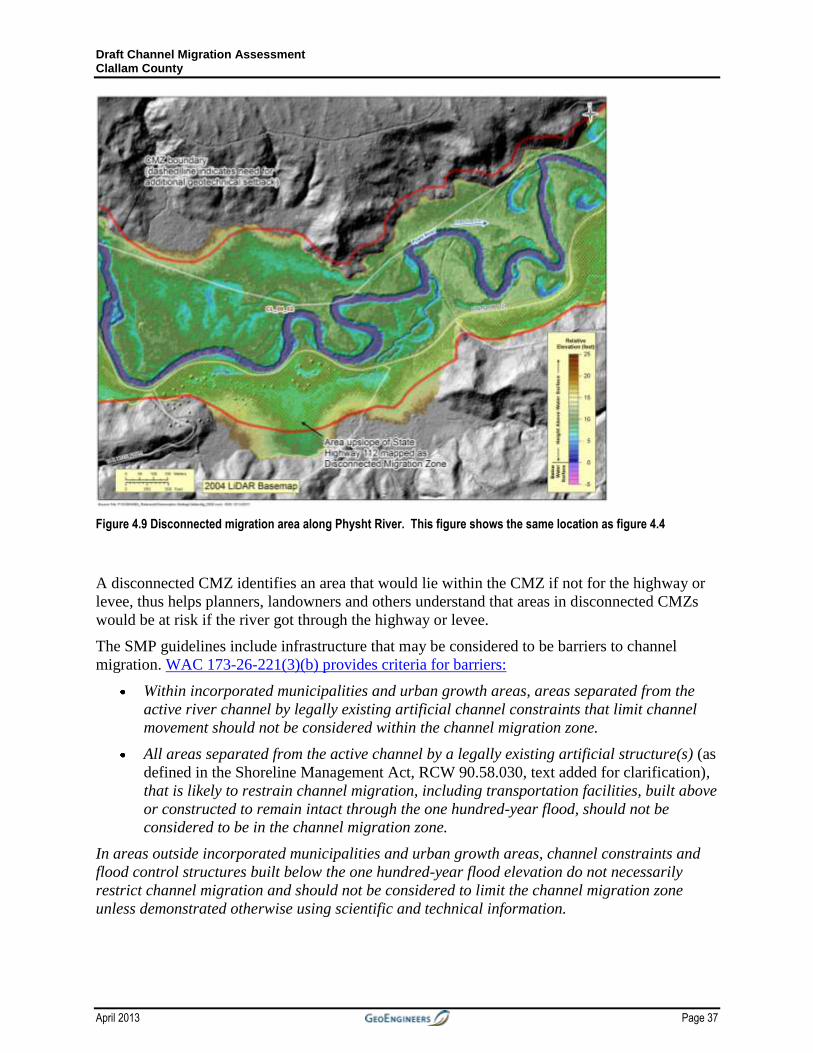
Draft Channel Migration Assessment Clallam County
April 2013 Page 37
Figure 4.9 Disconnected migration area along Physht River. This figure shows the same location as figure 4.4
A disconnected CMZ identifies an area that would lie within the CMZ if not for the highway or
levee, thus helps planners, landowners and others understand that areas in disconnected CMZs
would be at risk if the river got through the highway or levee.
The SMP guidelines include infrastructure that may be considered to be barriers to channel
migration. WAC 173-26-221(3)(b) provides criteria for barriers:
Within incorporated municipalities and urban growth areas, areas separated from the
active river channel by legally existing artificial channel constraints that limit channel
movement should not be considered within the channel migration zone.
All areas separated from the active channel by a legally existing artificial structure(s) (as
defined in the Shoreline Management Act, RCW 90.58.030, text added for clarification),
that is likely to restrain channel migration, including transportation facilities, built above
or constructed to remain intact through the one hundred-year flood, should not be
considered to be in the channel migration zone.
In areas outside incorporated municipalities and urban growth areas, channel constraints and
flood control structures built below the one hundred-year flood elevation do not necessarily
restrict channel migration and should not be considered to limit the channel migration zone
unless demonstrated otherwise using scientific and technical information.
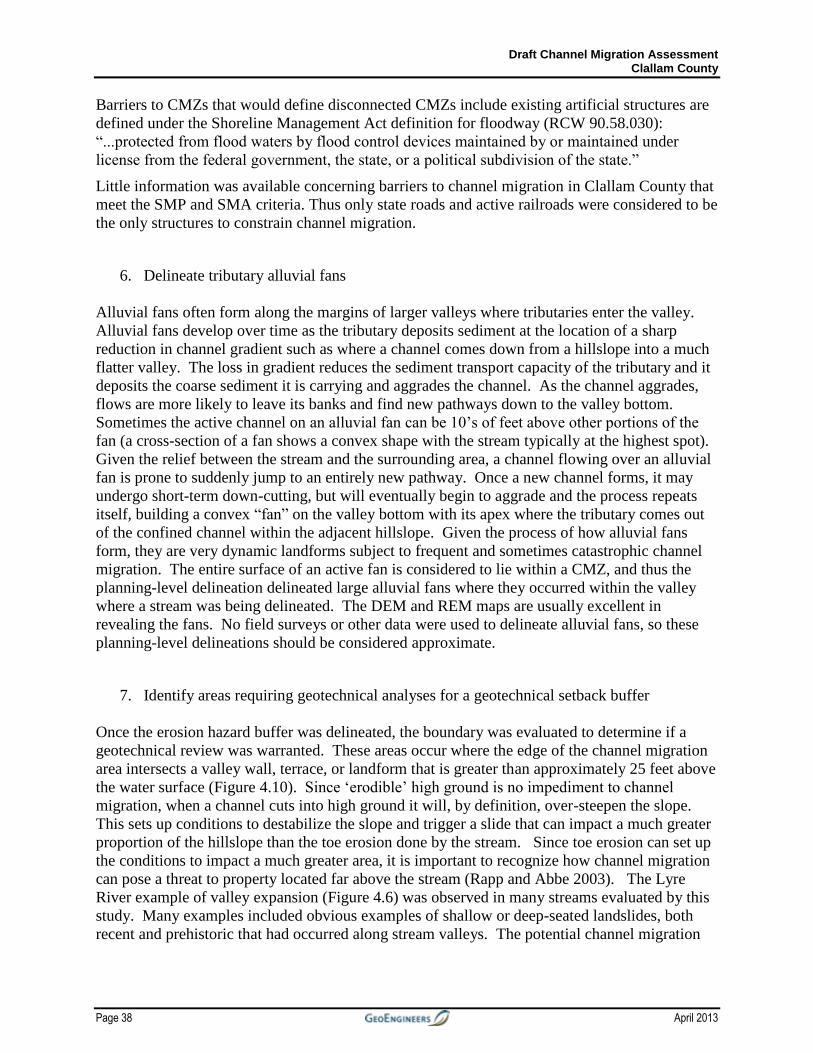
Draft Channel Migration Assessment Clallam County
Page 38 April 2013
Barriers to CMZs that would define disconnected CMZs include existing artificial structures are
defined under the Shoreline Management Act definition for floodway (RCW 90.58.030):
“...protected from flood waters by flood control devices maintained by or maintained under
license from the federal government, the state, or a political subdivision of the state.”
Little information was available concerning barriers to channel migration in Clallam County that
meet the SMP and SMA criteria. Thus only state roads and active railroads were considered to be
the only structures to constrain channel migration.
6. Delineate tributary alluvial fans
Alluvial fans often form along the margins of larger valleys where tributaries enter the valley.
Alluvial fans develop over time as the tributary deposits sediment at the location of a sharp
reduction in channel gradient such as where a channel comes down from a hillslope into a much
flatter valley. The loss in gradient reduces the sediment transport capacity of the tributary and it
deposits the coarse sediment it is carrying and aggrades the channel. As the channel aggrades,
flows are more likely to leave its banks and find new pathways down to the valley bottom.
Sometimes the active channel on an alluvial fan can be 10’s of feet above other portions of the
fan (a cross-section of a fan shows a convex shape with the stream typically at the highest spot).
Given the relief between the stream and the surrounding area, a channel flowing over an alluvial
fan is prone to suddenly jump to an entirely new pathway. Once a new channel forms, it may
undergo short-term down-cutting, but will eventually begin to aggrade and the process repeats
itself, building a convex “fan” on the valley bottom with its apex where the tributary comes out
of the confined channel within the adjacent hillslope. Given the process of how alluvial fans
form, they are very dynamic landforms subject to frequent and sometimes catastrophic channel
migration. The entire surface of an active fan is considered to lie within a CMZ, and thus the
planning-level delineation delineated large alluvial fans where they occurred within the valley
where a stream was being delineated. The DEM and REM maps are usually excellent in
revealing the fans. No field surveys or other data were used to delineate alluvial fans, so these
planning-level delineations should be considered approximate.
7. Identify areas requiring geotechnical analyses for a geotechnical setback buffer
Once the erosion hazard buffer was delineated, the boundary was evaluated to determine if a
geotechnical review was warranted. These areas occur where the edge of the channel migration
area intersects a valley wall, terrace, or landform that is greater than approximately 25 feet above
the water surface (Figure 4.10). Since ‘erodible’ high ground is no impediment to channel
migration, when a channel cuts into high ground it will, by definition, over-steepen the slope.
This sets up conditions to destabilize the slope and trigger a slide that can impact a much greater
proportion of the hillslope than the toe erosion done by the stream. Since toe erosion can set up
the conditions to impact a much greater area, it is important to recognize how channel migration
can pose a threat to property located far above the stream (Rapp and Abbe 2003). The Lyre
River example of valley expansion (Figure 4.6) was observed in many streams evaluated by this
study. Many examples included obvious examples of shallow or deep-seated landslides, both
recent and prehistoric that had occurred along stream valleys. The potential channel migration
Draft Channel Migration Assessment Clallam County
April 2013 Page 39
boundary in reaches where evidence of valley widening is occurring includes the entire valley
bottom plus a portion of the valley wall. The planning-level CMZ delineations were not intended
to be precise, simply call out areas where a more detailed assessment, including a geotechnical
analysis, is needed to determine the geographic extent of the hazard. The areas where
geotechnical setback buffer is needed is indicated on the maps with black dots in the CMZ
boundary line.
Figure 4.10 Illustration showing the basis for the geotechnical setback buffer. For purposes of this study, a geotechnical buffer was recommended any time H (height) was greater than 25 feet. The width of the geotechnical setback buffer was not determined for this study since it requires additional field data. (Adapted from Rapp and Abbe 2003).
8. Closed Canopy Streams
Closed canopy streams present unique challenges to CMZ delineations using methods that rely
solely on remote sensing data without field verification of stream conditions. Significant
erosion, stream widening, and channel migration generally will impact even large trees in the
riparian zone, allowing detection on aerial photographs by trained reviewers. However, where
the historical aerial photograph record covers a short period (less than 20 years) and LiDAR
imagery is unavailable, as is the case with portions of the Dickey River West, Middle and East
Forks, Skunk Creek, and Umbrella Creek, recognition of relic channels and potential avulsion
pathways is further constrained. For closed canopy streams, an approximate CMZ represented
by the topographic valley bottom and riparian corridor was delineated.
9. QA/QC review
The final step in the general CMZ delineation consisted of review by senior geomorphologists.
Initially, the QA/QC reviewers evaluated the channel migration maps and recommended any
changes, if necessary. Then the reviewers met with Ecology and discussed the draft channel
migration maps and the individual reviewers’ recommendations for changes to the maps. Once
changes were agreed upon, the changes were made and the maps finalized in draft form.
Draft Channel Migration Assessment Clallam County
Page 40 April 2013
Chapter 5 Quality Control and Quality Assurance
5.1 Draft Quality Assurance Project Plan (QAPP)
As part of the EPA grant, Ecology prepared a Draft Quality Assurance Project Plan (available
through Department of Ecology publications,
https://fortress.wa.gov/ecy/publications/SummaryPages/1206006.html ) that describes the project
and the quality control procedures in place for the entire study, which includes additional
components to review existing CMZ delineations to see how they have responded to flood events
since the delineation was conducted, and to update CMZ delineation methods based on new
information. In addition to the data quality control in place by Ecology, quality control and
assurance procedures employed for this phase of the project included analyst training,
documented review of all delineation products by senior geomorphologists, and review by
Ecology.
5.2 Limits of Analysis and Utility
As described above, this is a planning-level assessment that used available remote-sensed data as
a basis for delineating areas of potential channel migration. It should be noted that the boundary
line is an approximation- it does not represent a sharp boundary where one side of the line is
subject to channel migration, and the other side is immune. Although LiDAR data and the
derived REM map are powerful new tools for analyzing geomorphic features, they are not a
substitute for field data collected on the ground. Therefore, this assessment should only be used
as guidance as to where more specific channel migration and geotechnical studies should be
conducted if development is planned within the approximate boundaries established by this
study.
Chapter 6 Results and Sub basin Descriptions
The results of the study include maps with relative surface elevations, general channel migration
zones, disconnected channel migration zones, alluvial fans, geomorphic features, and areas
where geotechnical buffers are recommended. Data sheets include notes on the physical
characteristics and the geomorphology of each reach. This section summarizes the general
geomorphic character of the streams within the study area.
Streams assessed in this study represent a variety of stream types and occur in drainage basins
that range in size from 6 to greater than 70 miles in area. Key differences in geomorphic
characteristics of individual streams affected the channel migration assessment. As described in
Chapter 4, consideration was given to channel gradient, planform geometry, valley confinement,
and geology. Streams flowing through an erodible substrate were assumed to have the potential
for channel migration given adequate sediment supply and stream power for bedforms such as
alluvial bars to develop. Brief basin summaries are presented here to provide general context
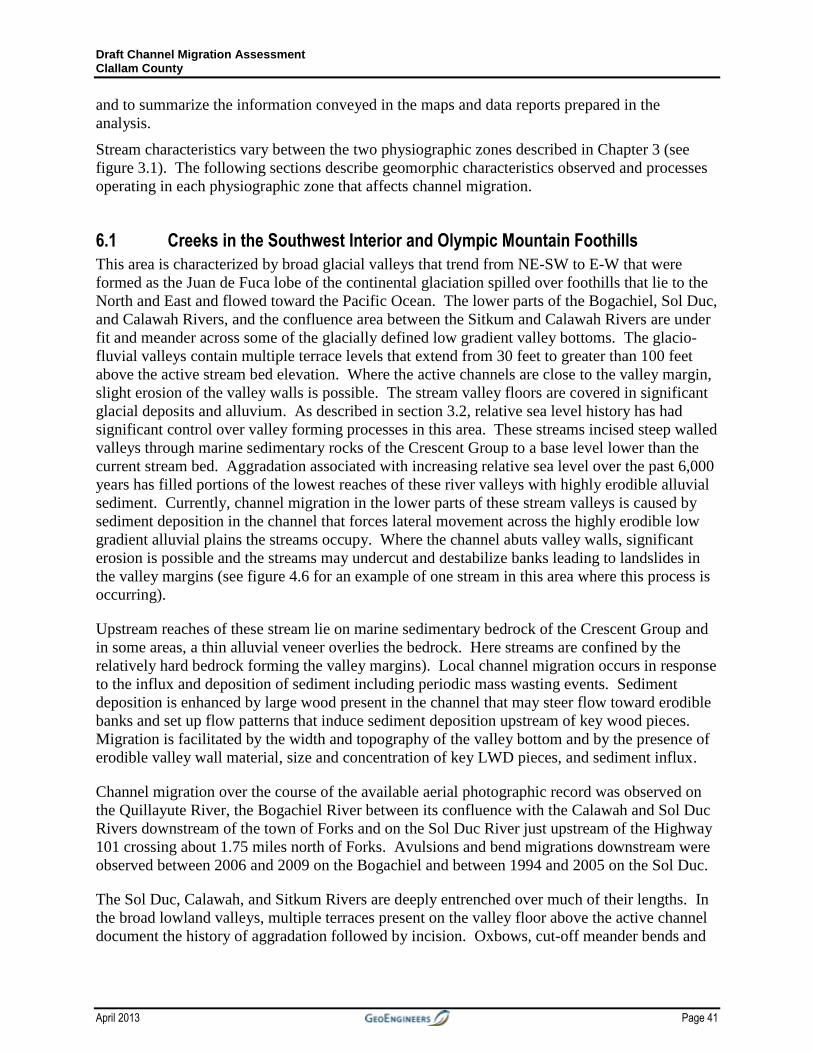
Draft Channel Migration Assessment Clallam County
April 2013 Page 41
and to summarize the information conveyed in the maps and data reports prepared in the
analysis.
Stream characteristics vary between the two physiographic zones described in Chapter 3 (see
figure 3.1). The following sections describe geomorphic characteristics observed and processes
operating in each physiographic zone that affects channel migration.
6.1 Creeks in the Southwest Interior and Olympic Mountain Foothills
This area is characterized by broad glacial valleys that trend from NE-SW to E-W that were
formed as the Juan de Fuca lobe of the continental glaciation spilled over foothills that lie to the
North and East and flowed toward the Pacific Ocean. The lower parts of the Bogachiel, Sol Duc,
and Calawah Rivers, and the confluence area between the Sitkum and Calawah Rivers are under
fit and meander across some of the glacially defined low gradient valley bottoms. The glacio-
fluvial valleys contain multiple terrace levels that extend from 30 feet to greater than 100 feet
above the active stream bed elevation. Where the active channels are close to the valley margin,
slight erosion of the valley walls is possible. The stream valley floors are covered in significant
glacial deposits and alluvium. As described in section 3.2, relative sea level history has had
significant control over valley forming processes in this area. These streams incised steep walled
valleys through marine sedimentary rocks of the Crescent Group to a base level lower than the
current stream bed. Aggradation associated with increasing relative sea level over the past 6,000
years has filled portions of the lowest reaches of these river valleys with highly erodible alluvial
sediment. Currently, channel migration in the lower parts of these stream valleys is caused by
sediment deposition in the channel that forces lateral movement across the highly erodible low
gradient alluvial plains the streams occupy. Where the channel abuts valley walls, significant
erosion is possible and the streams may undercut and destabilize banks leading to landslides in
the valley margins (see figure 4.6 for an example of one stream in this area where this process is
occurring).
Upstream reaches of these stream lie on marine sedimentary bedrock of the Crescent Group and
in some areas, a thin alluvial veneer overlies the bedrock. Here streams are confined by the
relatively hard bedrock forming the valley margins). Local channel migration occurs in response
to the influx and deposition of sediment including periodic mass wasting events. Sediment
deposition is enhanced by large wood present in the channel that may steer flow toward erodible
banks and set up flow patterns that induce sediment deposition upstream of key wood pieces.
Migration is facilitated by the width and topography of the valley bottom and by the presence of
erodible valley wall material, size and concentration of key LWD pieces, and sediment influx.
Channel migration over the course of the available aerial photographic record was observed on
the Quillayute River, the Bogachiel River between its confluence with the Calawah and Sol Duc
Rivers downstream of the town of Forks and on the Sol Duc River just upstream of the Highway
101 crossing about 1.75 miles north of Forks. Avulsions and bend migrations downstream were
observed between 2006 and 2009 on the Bogachiel and between 1994 and 2005 on the Sol Duc.
The Sol Duc, Calawah, and Sitkum Rivers are deeply entrenched over much of their lengths. In
the broad lowland valleys, multiple terraces present on the valley floor above the active channel
document the history of aggradation followed by incision. Oxbows, cut-off meander bends and
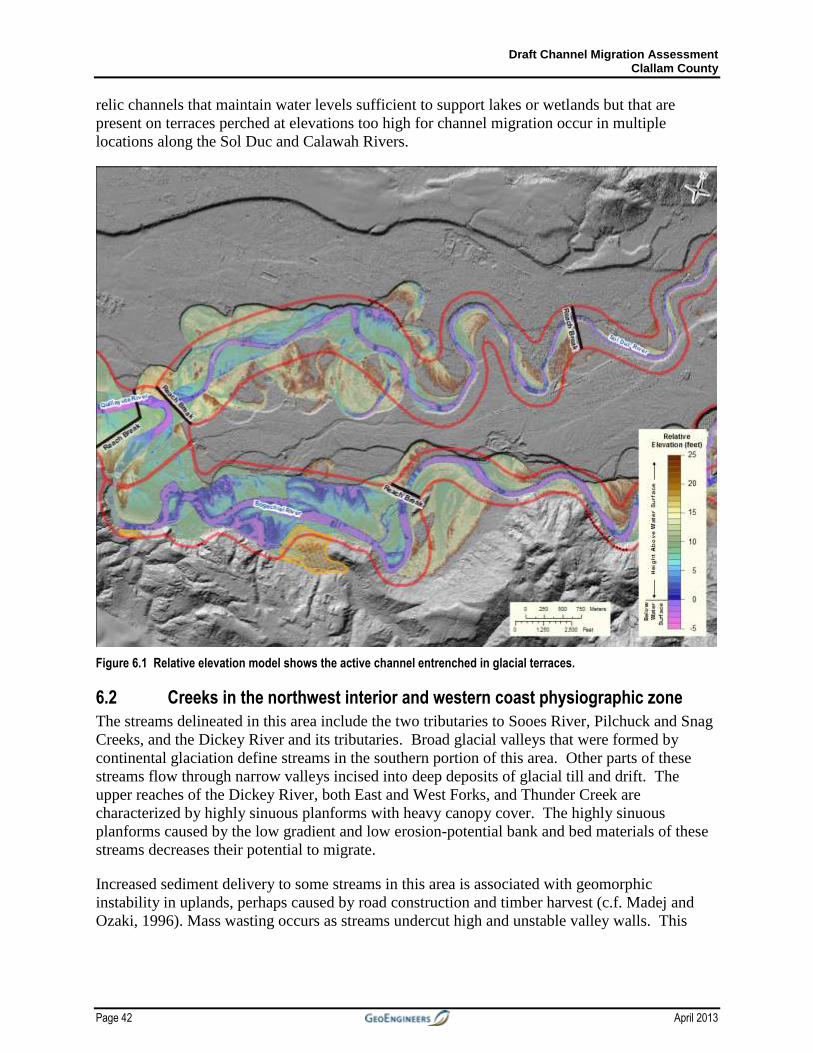
Draft Channel Migration Assessment Clallam County
Page 42 April 2013
relic channels that maintain water levels sufficient to support lakes or wetlands but that are
present on terraces perched at elevations too high for channel migration occur in multiple
locations along the Sol Duc and Calawah Rivers.
Figure 6.1 Relative elevation model shows the active channel entrenched in glacial terraces.
6.2 Creeks in the northwest interior and western coast physiographic zone
The streams delineated in this area include the two tributaries to Sooes River, Pilchuck and Snag
Creeks, and the Dickey River and its tributaries. Broad glacial valleys that were formed by
continental glaciation define streams in the southern portion of this area. Other parts of these
streams flow through narrow valleys incised into deep deposits of glacial till and drift. The
upper reaches of the Dickey River, both East and West Forks, and Thunder Creek are
characterized by highly sinuous planforms with heavy canopy cover. The highly sinuous
planforms caused by the low gradient and low erosion-potential bank and bed materials of these
streams decreases their potential to migrate.
Increased sediment delivery to some streams in this area is associated with geomorphic
instability in uplands, perhaps caused by road construction and timber harvest (c.f. Madej and
Ozaki, 1996). Mass wasting occurs as streams undercut high and unstable valley walls. This
Draft Channel Migration Assessment Clallam County
April 2013 Page 43
mass wasting provides a sediment source that can drive lateral migration on the valley bottom
and can directly influence stream position.
Large, prehistoric landslides originating in the uplands on the east side of north-flowing Snag
Creek control the creek’s channel location, pinning the creek against the west valley wall.
Figure 6.2 Sediment deposition, bank erosion, and channel widening are taking place in Big Creek in areas of significant recent tracts of clearcutting.
Draft Channel Migration Assessment Clallam County
Page 44 April 2013
Chapter 7 References
Abbe, T. B., and D. R. Montgomery. 1996. Large woody debris jams, channel hydraulics, and
habitat formation in large rivers. Regulated Rivers: Research & Management 12:201-221.
Abbe, T. B., and D. R. Montgomery. 2003. Patterns and processes of wood debris accumulation
in the Queets River Basin, Washington. Geomorphology 51:81-107.
Attewell, I., and W. Farmer. 1976. Principles of Engineering Geology. Chapman and Hall.
1045 pages.
Babcock R.S., Suczek, C.A., Engebreston, D.C., (1994) The Crescent “Terrane”, Olympic
Peninsula and Southern Vancouver Island, in Washington State Department of Natural
Resources Division of Geology and Earth Resources Bulletin 80 p 141-158.
Booth, D. and B. Hallet. 1993. Channel networks carved by subglacial water: Observations and
reconstruction in the eastern Puget Lowland of Washington. Geological Society of America
Bulletin, v. 105, p. 671-683.
Brandon, M.T., Vance, J.A., Techtronic Evolution of the Cenozoic Olympic Subduction
Complex, Washington State, as deduced from fission track ages for detrital zircons. American
Journal of Science vol. 292 p 565-636.
Brummer, C. J., T. B. Abbe, et al. 2006. Influence of vertical channel change associated with
wood accumulations on delineating channel migration zones, Washington, USA.
Geomorphology, 80(3-4): 295-309.
Bureau of Reclamation (BOR). 2009. Geomorphic Analysis of the Skokomish River, Mason
County, Washington. Report No. SRH-2009-22. 130 p.
Canning, D.J., L. Randlette, and W.A. Haskins. 1988. Skokomish River Comprehensive Flood
Control Management Plan: Olympia, Washington, Washington Department of Ecology Report
87-24.
Daly, C., Spatial Climate Analysis Service, (2000), United States Average Annual Precipitation,
1961-1990, in National Atlas of the United States, http://nationalatlas.gov
Department of Ecology. 2008. Channel Migration Assessment website. Available online at:
http://www.ecy.wa.gov/programs/sea/sma/cma/index.html
Fetherston, K.L., Naiman, R.J., Bilby, R.E., 1995. Large woody debris, physical process, and
riparian forest development in montane river networks of the Pacific Northwest. Geomorphology
13, 133-144.
Draft Channel Migration Assessment Clallam County
April 2013 Page 45
GeoEngineers, Inc. 2007. Channel migration and avulsion potential analyses, Skokomish River
Valley, Mason County, Washington. Prepared for Mason County Public Works Department, File
No. 2221-026-00, 17 p.
Gerstell, Wendy J. and Lingley, William S. Geologic Map of the Forks 1:100,00 Quadrangle,
Washington. Washington Division of Geology and Earth Resources Open file Report 2000-4.
HDR Engineering, Inc. 2000. Miscellaneous planning studies—Skokomish River diking
inventory [Draft report]: Bellevue, Washington, Report prepared for U.S. Army Corps of
Engineers, Seattle, Washington, Contract No. DACW 67-98-D1007. 48 p.
Jay, D.A. and C.A. Simenstad. 1996. Downstream effects of water withdrawal in a small, high-
gradient basin: Erosion and deposition on the Skokomish River Delta: Estuaries, v. 19, no. 3, p.
501-517.
Jones, J.L. 2006. Side channel mapping and fish habitat suitability analysis using LIDAR
topography and orthophotography. Photogrammetric Engineering & Remote Sensing,
November 2006, vol. 71, no. 11, p. 1202-1206.
KCM, Inc. 1996. Skokomish River Comprehensive Flood Hazard Management Plan, volume 1.
Prepared for Mason County Department of Community Development. Variously paginated.
King County 1999. King County Public Rules. Department of Development and Environmental
Services. Chapter 21A-24. Accessed online at:
http://your.kingcounty.gov/ddes/pub_rule/acrobat/21a-24cma.pdf
M2 Environmental Services. 2003. South Fork Skokomish Watershed Analysis. Prepared for
Simpson Timber Company and Washington Department of Natural Resources South Puget
Sound Region, 48 p.
Madaj, M.A., Ozaki, V., (1996) Channel Response to Sediment Wave Propagation and
Movement, Redwood Creek, California, USA. Earth Surface Processes and Landforms, vol. 21
p. 911-927.
Montgomery, D.R. 2004. Observations on the role of lithology in strath terrace formation and
bedrock channel width. American Journal of Science, Vol. 304, p. 454–476.
Montgomery, D. R.,, and Abbe, T. B. 2006. Floodplain and terrace formation in an old-growth
forest valley, Queets River, Washington. Quaternary Research, v. 65, p. 147-155
Muschinski, T. and J. I. Katz (2013). "Trends in hourly rainfall statistics in the United States
under a warming climate." Nature Clim. Change advance online publication.
http://dx.doi.org/10.1038/nclimate1828
Nanson, G.C., Beach, H.F., 1977. Forest Succession and sedimentation on a meandering river
floodplain, northeast British Columbia, Canada. Journal of Biogeography 4, 229-251.
National Marine Fisheries Service (NMFS), 2008. Biological Opinion from the Endangered
Species Act Section 7 Formal Consultation and Magnuson-Stevens Fishery Conservation and
Draft Channel Migration Assessment Clallam County
Page 46 April 2013
Management Act Essential Fish Habitat Consultation for the on-going National Flood Insurance
Program carried out in the Puget Sound area in Washington State. HUC 17110020 Puget Sound.,
238 pp, September 22, 2008, NOAA, Seattle, WA.
Polenz, M., Wegmannm K., Schasse, H. (2004) Geologic Map of the Elwha and Angeles Point
7.5-minute Quadrangles, Clallam County, Washington.
Rapp, C. and Abbe, T., 2003. A Framework for Delineating Channel Migration Zones,
Washington Department of Ecology Publication 03-06-027, Olympia WA,
http://www.ecy.wa.gov/biblio/0306027.html
Schasse, H.W., Wegmann, K.W., Polenz, M., (2004) Geologic Map of the Port Angeles and Ediz
Hook 7.5-minute Quadrangles, Clallam County, Washington.
Sklar, L. S. and W. E. Dietrich. 2001. "Sediment and rock strength controls on river incision
into bedrock." Geology 29(12): 1087-1090.
Sklar, L. S., and W. E. Dietrich. 2004. A mechanistic model for river incision into bedrock by
saltating bed load, Water Resour. Res., 40, W06301, doi:10.1029/2003WR002496
Stover, S.C. and Montgomery, D.R. (2001) Channel change and flooding, Skokomish River,
Washington. J. Hydrol., 243 (3-4), pp. 272-286.
Tohver, I. and A.F. Hamlet. 2010. Impacts of 21st century climate change on hydrologic
extremes in the Pacific Northwest region of North America. Chapter 7 in Hydrologic Climate
Change Scenarios for the Pacific Northwest Columbia River Basin and Coastal Drainages:
Project Report. (in draft, accessed May 20, 2010, via http://www.hydro.washington.edu/2860/)
Ward, J. V., Tockner, K. and Schiemer, F. 1999. Biodiversity of floodplain river ecosystems:
ecotones and connectivity. Regul. Rivers 15: 125–139.
Watershed Management Team, 1995. South Fork Skokomish Watershed Analysis.
U.S.Department of Agriculture, Forest Service, variously paginated.
Draft Channel Migration Assessment Clallam County
Page 47 April 2013
Chapter 8 Maps of Channel Migration Zones for Clallam County Streams
Draft Channel Migration Assessment Clallam County
Page 48 April 2013
Appendix A Acronym List and Glossary
Acronyms
BOR: Bureau of Reclamation
CMZ: Channel migration zone
DCMZ: Disconnected Channel Migration Zone
DEM: Digital Elevation Model
DNR: Department of Natural Resources (Washington)
Ecology: Washington Department of Ecology
EPA: Environmental Protection Agency
FEMA: Federal Emergency Management Agency
GIS: Geographic Information System
HUC: Hydrologic Unit Code
LiDAR: Light Detection and Ranging
NMFS: National Marine Fisheries Service
NRCS: Natural Resource Conservation Service
PIZ: Potential Inundation Zone
QAPP: Quality Assurance and Project Plan
RCW: Revised Code of Washington
REM: Relative Elevation Map
SEA: Shorelines and Environmental Assistance Program
SMA: Shoreline Management Act
SMP: Shoreline Master Program
SSURGO: Soil Survey Geographic Database
UW: University of Washington
WAC: Washington Administrative Code
WDFW: Washington Department of Fish and Wildlife
WDOT: Washington Department of Transportation
Draft Channel Migration Assessment Clallam County
April 2013 Page 49
Glossary
Accretion: The gradual deposition of sediment along the edges of a channel by lateral migration.
One of the bar formation processes that creates bars opposite of the meander bend.
Active channel corridor/meander belt: The area between the outside edges of meander bends
of the main stream channel. See Figure 4.4 in the main report.
Aggradation: An increase in sediment supply and/or decrease in sediment transport capacity
that leads to an increase in the channel bed elevation. An increase in base level can decrease
sediment transport capacity, thereby initiating aggradation.
Alluvial channel: A channel formed in material (sand, gravel, cobbles, or small boulders) that
moves during floods. Alluvial channels convey channel bed and bank materials under present
flow conditions and adjust their dimensions, shape, and gradient under the present hydrologic
regime. For the most part, streamflow, sediment supply, and woody debris control how alluvial
channels change over time.
Alluvial fan: A low, outspread mass of loose materials (sand, cobbles, boulders), with variable
slope, shaped like an open fan or a segment of a cone, deposited by a stream at the place where it
issues from a narrow mountain or upland valley; or where a tributary stream is near or at its
junction with the main stream. It is steepest near its apex which points upstream and slopes
convexly outward (downstream) with a gradual decrease in gradient.
Alluvial landscape: The area of land near an alluvial channel that has been modified by that
channel in the past. In the Puget Sound, the alluvial landscape represents the area, typically in a
valley bottom, where a stream channel has been located since the end of the last glaciations.
Alluvial terrace: An abandoned floodplain, produced by past vertical instability in the fluvial
system. Alluvial terraces are inactive depositional surfaces within a current hydrologic, climatic,
and tectonic setting. Alluvial terraces can result from a lowering of the river’s base level, from
channel incision, or from changes in hydrology.
Alluvium: Material (sand, gravel, cobbles, or small boulders) that is deposited by flowing water.
Two processes occur simultaneously in anastomosing channels: (1) avulsion, which creates a
pattern of multiple channels; and (2) lateral migration of the individual channels that exist within
the anastomosing pattern (i.e., individual meander belts).
Avulsion: The process in which a stream rapidly abandons a developed channel and creates a
new one. Channels may avulse into an abandoned channel (second-order avulsion) or create a
new channel (first-order avulsion) depending on the preexisting boundary conditions that initiate
the avulsion.
Avulsion hazard area: The portion of the CMZ where the channel could suddenly move to
during an avulsion.
Draft Channel Migration Assessment Clallam County
Page 50 April 2013
Bankfull stage: The stream level that corresponds to the discharge at which channel activity
(sediment transport, the formation and/or reformation of bars, the formation and/or alteration of
bends and meanders, etc.) results in the normally occurring morphologic characteristics of
channel.
Bar: [streams] a general term for a ridge-like accumulation of sand, gravel, or other alluvial
material formed in the channel, along the banks, or at the mouth of a stream where a decrease in
velocity induces deposition; e.g. a channel bar or a meander bar. Examples include:
Point bars - Bars that are formed on the inside of meander channels.
Side bars - Bars that are formed along the edges of relatively straight sections of rivers.
Mid-channel bars - Bars found within the channel that become more noticeable during low flow
periods.
Delta bars - Bars formed immediately downstream of the main confluences of a tributary and
the main channel.
Biological Opinion: Under ESA section 7, all Federal agencies are required, "in consultation
with and with the assistance of the Secretary, to insure that any action authorized, funded, or
carried out by such agency is not likely to jeopardize the continued existence of any threatened
or endangered species or result in the destruction or adverse modification of designated critical
habitat." Thus, before a permit can be issued, "a written statement setting forth the Secretary's
opinion and a summary of the information on which the opinion is based" that the issuance of the
permit is not likely to jeopardize any protected species must be obtained.
Braided stream: A channel or stream that has interconnecting multiple channels formed by flow
that repeatedly divides and converges around mid-channel bars. In the plan view, the channel
resembles strands of a complex braid. Braiding is generally confined to broad, shallow streams
of low sinuosity, variable discharge, high bedload, non-cohesive bank material, and a steep
gradient. At bank-full discharge, braided streams often have steeper slopes and shallower,
broader, and less stable channel cross sections than meandering streams. During periods of high
discharge, the entire stream channel may contain water and the islands are covered to become
submerged bars. During such high discharge, some of the islands could erode, but the sediment
would be re-deposited as the discharge decreases, forming new islands or submerged bars.
Islands may become resistant to erosion if they become inhabited by vegetation.
Channel confinement: The width between the channel’s valley walls relative to the width of the
active channel. Used to describe how much a channel can potentially shift within its valley.
Channel gradient: The angle between the channel flow and the horizontal length of the stream
reach. Measured as the change in channel elevation divided by stream or reach length. .
Channel migration: The lateral or downstream shifting of a river channel within a river valley.
The dynamic physical processes of rivers, including the movement of water, sediment and wood,
cause the river channel in some areas to move, or "migrate," over time. This is a natural process
in response to gravity and topography and allows the river to release energy and distribute its
sediment load. Migration processes include bank erosion and avulsion. Aggradation causes
Draft Channel Migration Assessment Clallam County
April 2013 Page 51
vertical channel change which is another migration process. The area within which a river
channel is likely to move over a period of time is referred to as the channel migration zone
(CMZ)
Channel migration zone: 1) WAC 173-26-020(6): "Channel migration zone (CMZ)" means the
area along a river within which the channel(s) can be reasonably predicted to migrate over time
as a result of natural and normally occurring hydrological and related processes when considered
with the characteristics of the river and its surroundings.” 2) Channel migration is a natural
process associated with streams. Streams may migrate across valleys due to a variety of reasons
including channel and bank erosion, meander chute cutoff, avulsion, aggradation and incision.
The channel migration zone represents the area within which a given stream may migrate over
time and includes avulsion hazard and erosion hazard areas (Rapp and Abbe 2003).
Channel reach: A specific portion of the length of a channel that has similar physical features,
such as gradient and confinement.
Channel pattern: A configuration of a stream reach as seen in planform. Generally recognized
channel patterns include meandering, braided, wandering, island braided and straight.
Critical Habitat: 1) Specific areas within the geographical area occupied by the species at the
time of listing under ESA, if they contain physical or biological features essential to
conservation, and those features may require special management considerations or protection;
and 2) Specific areas outside the geographical area occupied by the species if the federal agency
determines that the area itself is essential for conservation.
Degradation: Incision, or down-cutting of the channel bed.
Delta: A body of alluvium consisting mostly of stratified clay, silt, sand and gravel, nearly flat
and fan-shaped, deposited at or near the mouth of a river or stream where it enters a body of
relatively quiet water, usually a sea or lake.
DEM (Digital Elevation Model): A digital map representing the elevation of
Detailed channel migration assessment: Detailed assessments usually include geomorphic and
hydrologic analyses, field measurements and evidence, mapping channel locations and fluvial
features over time from archival maps, aerial photographs, and LiDAR, calculating channel
migration rates, and evaluating avulsion hazard or probability. Detailed assessments may include
hazard assessment, hydraulic modeling, hydrologic modeling to evaluate changes in high flow
regimes, channel location probability analysis, bank stability analysis and geotechnical
assessment for slope erosion including a geotechnical setback.
Disconnected CMZ/Disconnected migration area: The area located landward of man-made
structures that restrict channel migration. Not all man-made structures are exempted from the
CMZ shoreline regulations. The specific exemptions are outlined in WAC 173-26-221(3)(b), and
are described below.
Draft Channel Migration Assessment Clallam County
Page 52 April 2013
The DMA/DCMZ is based on regulatory exemptions that assume that existing human
infrastructure control migration. The Washington State Shoreline Master Program defines
exemptions, WAC 173-26-221(3)(b): Exemptions (DMA):
o Within incorporated municipalities and urban growth areas, areas separated from the
active river channel by legally existing artificial channel constraints that limit channel
movement should not be considered within the channel migration zone.
o All areas separated from the active channel by a legally existing artificial structure(s) that
is likely to restrain channel migration, including transportation facilities, built above or
constructed to remain intact through the one hundred-year flood, should not be
considered to be in the channel migration zone.
o In areas outside incorporated municipalities and urban growth areas, channel constraints
and flood control structures built below the one hundred-year flood elevation do not
necessarily restrict channel migration and should not be considered to limit the channel
migration zone unless demonstrated otherwise using scientific and technical information
Legally existing structures: defined under the Shoreline Management Act (SMA) under the
definition for floodway (RCW 90.58.030): ” lands that can reasonably be expected to be
protected from flood waters by flood control devices maintained by or maintained under license
from the federal government, the state, or a political subdivision of the state.”
Effective barriers to channel migration (Part of DMA):
Structures that will endure beyond the design life of the CMZ (100+ years).
Structures that have a public commitment to keep them intact and that protect populated
areas.
Ineffective barriers to channel migration (Not part of a DMA):
Constructed structures with no public commitment for maintenance.
Structures made of erodible materials (such as sugar dikes).
Areas that may be restored by removing levees, revetments, or other infrastructure.
Within incorporated areas, structures built below the 100-year flood elevation.
Within unincorporated areas, structures built above the 100-year flood elevation but will not
remain intact during a 100-year event.
Ecotone: A transition area of vegetation between two different plant communities, such as forest
and grassland. It has some of the characteristics of each bordering community and often contains
species not found in the overlapping communities.
Entrenched channel: A channel that has cut vertically downward into streambed deposits or
bedrock, resulting in a channel that is much deeper than it is wide.
Erosion Hazard Area (EHA): The area not included in the HMZ or the AHZ that is at risk of
stream erosion including unstable valley slopes. From Rapp and Abbe (2003).
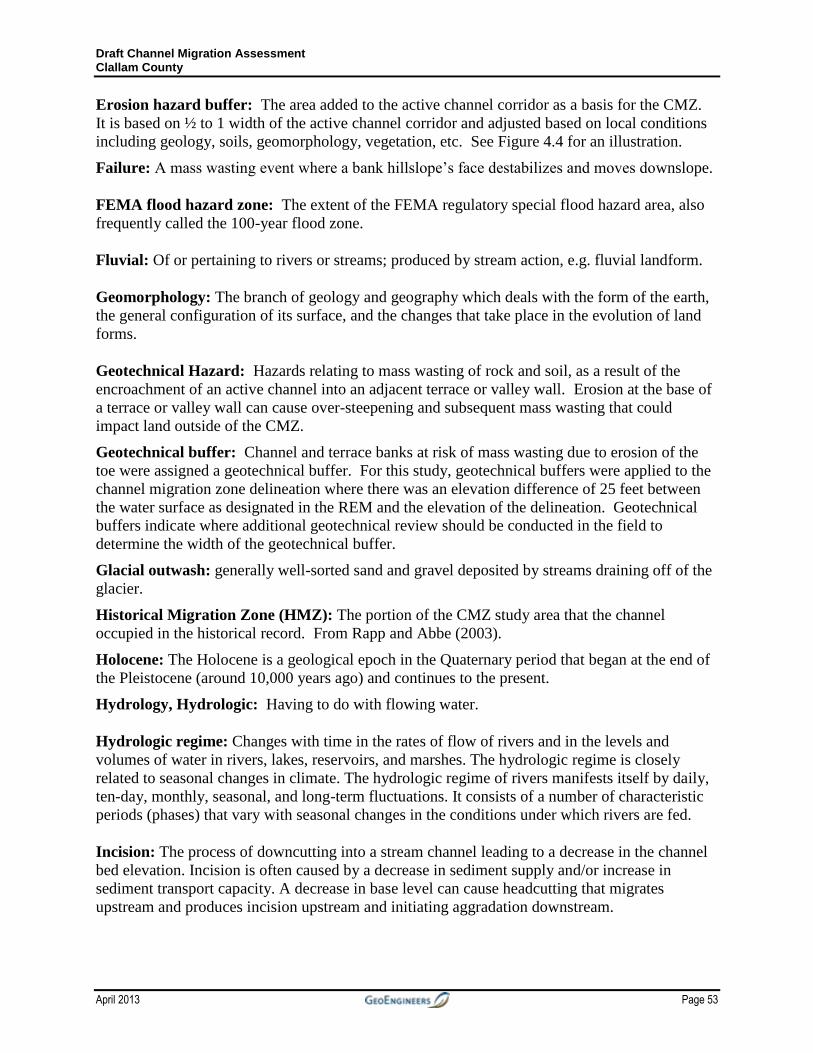
Draft Channel Migration Assessment Clallam County
April 2013 Page 53
Erosion hazard buffer: The area added to the active channel corridor as a basis for the CMZ.
It is based on ½ to 1 width of the active channel corridor and adjusted based on local conditions
including geology, soils, geomorphology, vegetation, etc. See Figure 4.4 for an illustration.
Failure: A mass wasting event where a bank hillslope’s face destabilizes and moves downslope.
FEMA flood hazard zone: The extent of the FEMA regulatory special flood hazard area, also
frequently called the 100-year flood zone.
Fluvial: Of or pertaining to rivers or streams; produced by stream action, e.g. fluvial landform.
Geomorphology: The branch of geology and geography which deals with the form of the earth,
the general configuration of its surface, and the changes that take place in the evolution of land
forms.
Geotechnical Hazard: Hazards relating to mass wasting of rock and soil, as a result of the
encroachment of an active channel into an adjacent terrace or valley wall. Erosion at the base of
a terrace or valley wall can cause over-steepening and subsequent mass wasting that could
impact land outside of the CMZ.
Geotechnical buffer: Channel and terrace banks at risk of mass wasting due to erosion of the
toe were assigned a geotechnical buffer. For this study, geotechnical buffers were applied to the
channel migration zone delineation where there was an elevation difference of 25 feet between
the water surface as designated in the REM and the elevation of the delineation. Geotechnical
buffers indicate where additional geotechnical review should be conducted in the field to
determine the width of the geotechnical buffer.
Glacial outwash: generally well-sorted sand and gravel deposited by streams draining off of the
glacier.
Historical Migration Zone (HMZ): The portion of the CMZ study area that the channel
occupied in the historical record. From Rapp and Abbe (2003).
Holocene: The Holocene is a geological epoch in the Quaternary period that began at the end of
the Pleistocene (around 10,000 years ago) and continues to the present.
Hydrology, Hydrologic: Having to do with flowing water.
Hydrologic regime: Changes with time in the rates of flow of rivers and in the levels and
volumes of water in rivers, lakes, reservoirs, and marshes. The hydrologic regime is closely
related to seasonal changes in climate. The hydrologic regime of rivers manifests itself by daily,
ten-day, monthly, seasonal, and long-term fluctuations. It consists of a number of characteristic
periods (phases) that vary with seasonal changes in the conditions under which rivers are fed.
Incision: The process of downcutting into a stream channel leading to a decrease in the channel
bed elevation. Incision is often caused by a decrease in sediment supply and/or increase in
sediment transport capacity. A decrease in base level can cause headcutting that migrates
upstream and produces incision upstream and initiating aggradation downstream.
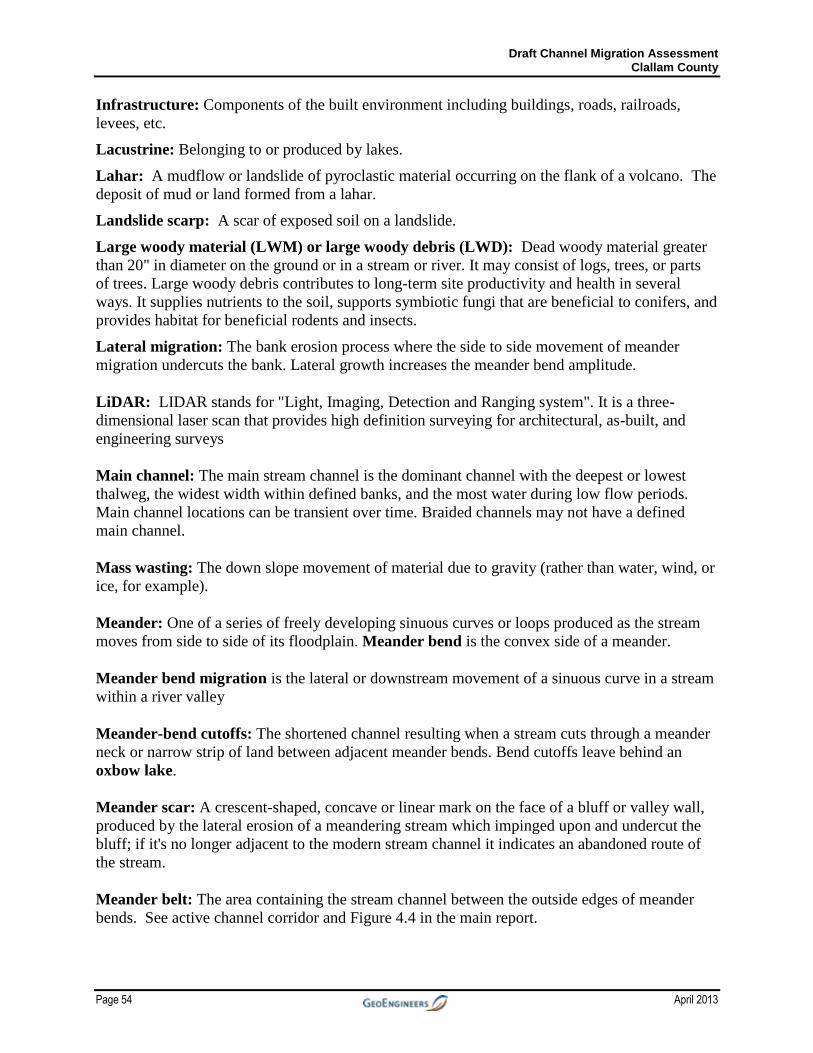
Draft Channel Migration Assessment Clallam County
Page 54 April 2013
Infrastructure: Components of the built environment including buildings, roads, railroads,
levees, etc.
Lacustrine: Belonging to or produced by lakes.
Lahar: A mudflow or landslide of pyroclastic material occurring on the flank of a volcano. The
deposit of mud or land formed from a lahar.
Landslide scarp: A scar of exposed soil on a landslide.
Large woody material (LWM) or large woody debris (LWD): Dead woody material greater
than 20" in diameter on the ground or in a stream or river. It may consist of logs, trees, or parts
of trees. Large woody debris contributes to long-term site productivity and health in several
ways. It supplies nutrients to the soil, supports symbiotic fungi that are beneficial to conifers, and
provides habitat for beneficial rodents and insects.
Lateral migration: The bank erosion process where the side to side movement of meander
migration undercuts the bank. Lateral growth increases the meander bend amplitude.
LiDAR: LIDAR stands for "Light, Imaging, Detection and Ranging system". It is a three-
dimensional laser scan that provides high definition surveying for architectural, as-built, and
engineering surveys
Main channel: The main stream channel is the dominant channel with the deepest or lowest
thalweg, the widest width within defined banks, and the most water during low flow periods.
Main channel locations can be transient over time. Braided channels may not have a defined
main channel.
Mass wasting: The down slope movement of material due to gravity (rather than water, wind, or
ice, for example).
Meander: One of a series of freely developing sinuous curves or loops produced as the stream
moves from side to side of its floodplain. Meander bend is the convex side of a meander.
Meander bend migration is the lateral or downstream movement of a sinuous curve in a stream
within a river valley
Meander-bend cutoffs: The shortened channel resulting when a stream cuts through a meander
neck or narrow strip of land between adjacent meander bends. Bend cutoffs leave behind an
oxbow lake.
Meander scar: A crescent-shaped, concave or linear mark on the face of a bluff or valley wall,
produced by the lateral erosion of a meandering stream which impinged upon and undercut the
bluff; if it's no longer adjacent to the modern stream channel it indicates an abandoned route of
the stream.
Meander belt: The area containing the stream channel between the outside edges of meander
bends. See active channel corridor and Figure 4.4 in the main report.
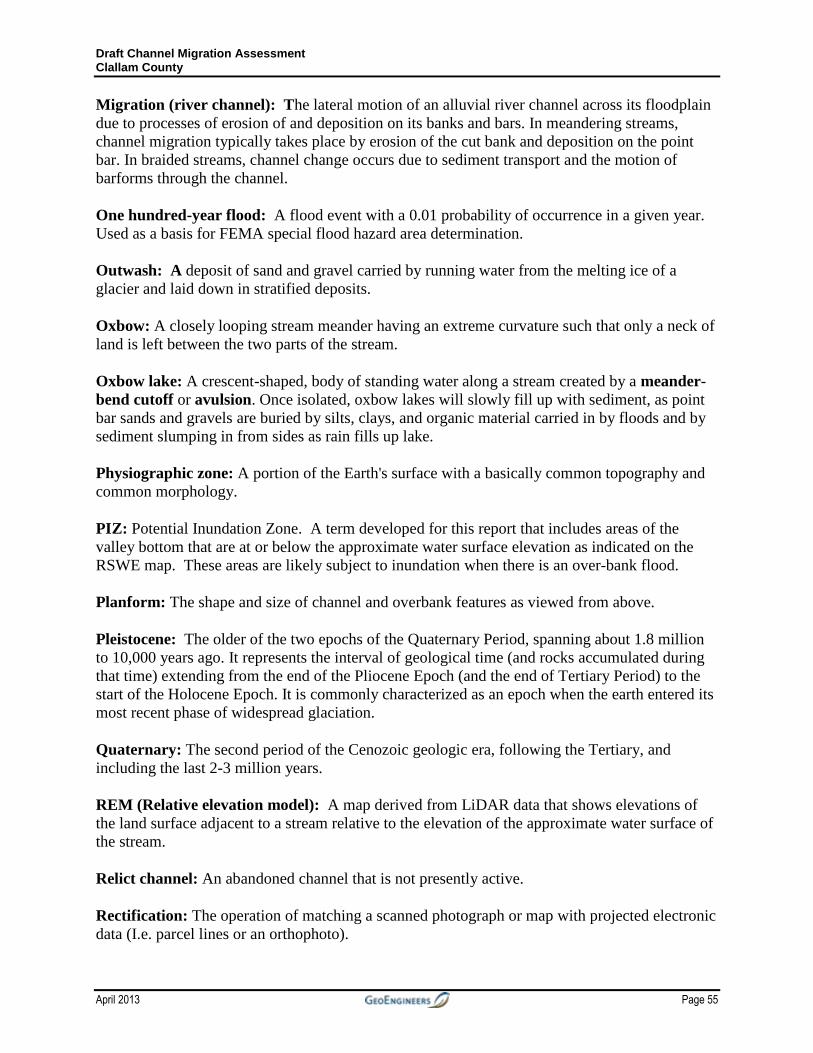
Draft Channel Migration Assessment Clallam County
April 2013 Page 55
Migration (river channel): The lateral motion of an alluvial river channel across its floodplain
due to processes of erosion of and deposition on its banks and bars. In meandering streams,
channel migration typically takes place by erosion of the cut bank and deposition on the point
bar. In braided streams, channel change occurs due to sediment transport and the motion of
barforms through the channel.
One hundred-year flood: A flood event with a 0.01 probability of occurrence in a given year.
Used as a basis for FEMA special flood hazard area determination.
Outwash: A deposit of sand and gravel carried by running water from the melting ice of a
glacier and laid down in stratified deposits.
Oxbow: A closely looping stream meander having an extreme curvature such that only a neck of
land is left between the two parts of the stream.
Oxbow lake: A crescent-shaped, body of standing water along a stream created by a meander-
bend cutoff or avulsion. Once isolated, oxbow lakes will slowly fill up with sediment, as point
bar sands and gravels are buried by silts, clays, and organic material carried in by floods and by
sediment slumping in from sides as rain fills up lake.
Physiographic zone: A portion of the Earth's surface with a basically common topography and
common morphology.
PIZ: Potential Inundation Zone. A term developed for this report that includes areas of the
valley bottom that are at or below the approximate water surface elevation as indicated on the
RSWE map. These areas are likely subject to inundation when there is an over-bank flood.
Planform: The shape and size of channel and overbank features as viewed from above.
Pleistocene: The older of the two epochs of the Quaternary Period, spanning about 1.8 million
to 10,000 years ago. It represents the interval of geological time (and rocks accumulated during
that time) extending from the end of the Pliocene Epoch (and the end of Tertiary Period) to the
start of the Holocene Epoch. It is commonly characterized as an epoch when the earth entered its
most recent phase of widespread glaciation.
Quaternary: The second period of the Cenozoic geologic era, following the Tertiary, and
including the last 2-3 million years.
REM (Relative elevation model): A map derived from LiDAR data that shows elevations of
the land surface adjacent to a stream relative to the elevation of the approximate water surface of
the stream.
Relict channel: An abandoned channel that is not presently active.
Rectification: The operation of matching a scanned photograph or map with projected electronic
data (I.e. parcel lines or an orthophoto).
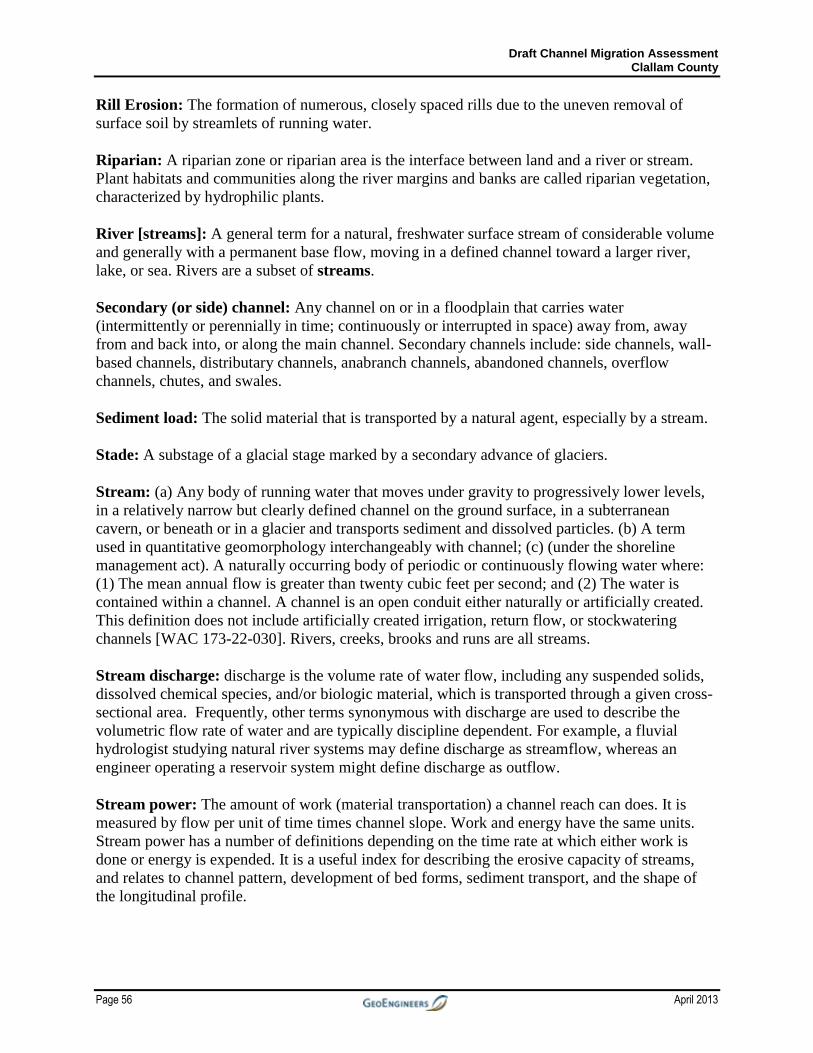
Draft Channel Migration Assessment Clallam County
Page 56 April 2013
Rill Erosion: The formation of numerous, closely spaced rills due to the uneven removal of
surface soil by streamlets of running water.
Riparian: A riparian zone or riparian area is the interface between land and a river or stream.
Plant habitats and communities along the river margins and banks are called riparian vegetation,
characterized by hydrophilic plants.
River [streams]: A general term for a natural, freshwater surface stream of considerable volume
and generally with a permanent base flow, moving in a defined channel toward a larger river,
lake, or sea. Rivers are a subset of streams.
Secondary (or side) channel: Any channel on or in a floodplain that carries water
(intermittently or perennially in time; continuously or interrupted in space) away from, away
from and back into, or along the main channel. Secondary channels include: side channels, wall-
based channels, distributary channels, anabranch channels, abandoned channels, overflow
channels, chutes, and swales.
Sediment load: The solid material that is transported by a natural agent, especially by a stream.
Stade: A substage of a glacial stage marked by a secondary advance of glaciers.
Stream: (a) Any body of running water that moves under gravity to progressively lower levels,
in a relatively narrow but clearly defined channel on the ground surface, in a subterranean
cavern, or beneath or in a glacier and transports sediment and dissolved particles. (b) A term
used in quantitative geomorphology interchangeably with channel; (c) (under the shoreline
management act). A naturally occurring body of periodic or continuously flowing water where:
(1) The mean annual flow is greater than twenty cubic feet per second; and (2) The water is
contained within a channel. A channel is an open conduit either naturally or artificially created.
This definition does not include artificially created irrigation, return flow, or stockwatering
channels [WAC 173-22-030]. Rivers, creeks, brooks and runs are all streams.
Stream discharge: discharge is the volume rate of water flow, including any suspended solids,
dissolved chemical species, and/or biologic material, which is transported through a given cross-
sectional area. Frequently, other terms synonymous with discharge are used to describe the
volumetric flow rate of water and are typically discipline dependent. For example, a fluvial
hydrologist studying natural river systems may define discharge as streamflow, whereas an
engineer operating a reservoir system might define discharge as outflow.
Stream power: The amount of work (material transportation) a channel reach can does. It is
measured by flow per unit of time times channel slope. Work and energy have the same units.
Stream power has a number of definitions depending on the time rate at which either work is
done or energy is expended. It is a useful index for describing the erosive capacity of streams,
and relates to channel pattern, development of bed forms, sediment transport, and the shape of
the longitudinal profile.
Draft Channel Migration Assessment Clallam County
April 2013 Page 57
Stream reach: A length of a stream channel that is uniform with respect to discharge, gradient,
channel shape, bank composition, valley shape, sediment supply and other factors.
Planning-level method: The method used in this study to identify the general location of
channel migration zones in accordance with WAC 173-26-201(c)(vii). This method identifies
the general location of the channel migration zone using only existing GIS data without field
data collection, calculating channel migration rates, or modeling. The general channel migration
zone includes historic channel locations, potential avulsion hazard zones, potential erosion
hazard areas, and disconnected migration areas. This assessment should only be used as
guidance as to where more specific channel migration and geotechnical studies should be
conducted if development is planned within the approximate boundaries established by this
study.
Study reach: The portion of the channel that is within the study area.
Substrate: A substratum or an underlying stratum. The underlying layer of rock or material.
Terrace: An elevated surface above the existing level of a floodplain or shore that is created by
past stream erosion.
Till: Unsorted sand, gravel, silt, and clay deposited beneath the base of a glacier.
Topographic relief: The configuration of a surface including its elevation and the position of its
natural features.
Translational migration: The down valley movement of meander bends caused by bank erosion
concentrated at the outer bank between the bend apex and the downstream crossing.
Unconfined fracture strength: The amount of force necessary to fracture, or crush a sample of
rock that is unconfined or compressed.
Underfit stream: A misfit stream (or underfit stream) is a stream that is too small to have
eroded the valley which the stream occupies. When a period of glaciation modifies the landscape
by creating glacial valleys, the rivers that occupy such valleys after the ice has retreated are not
in proportion with the size of the valley. Given the scale of most glacial valleys, most of them
contain misfit streams.
Valley: An elongate, relatively large, externally drained depression that is primarily developed
by stream erosion or glacial activity.
Draft Channel Migration Assessment Clallam County
Page 58 April 2013
Appendix B Shoreline Master Program Regulations Addressing Channel Migration
Inventory and Analysis requirements: WAC 173-26-201(3)(c)(vii): Inventory shoreline conditions:
Local governments shall, at a minimum, and to extent information is relevant and reasonably available, collect the following information: (vii): General location of channel migration zones and flood plains.
What does reasonably available mean for determining a potential migration area? Information on channel characteristics such as channel gradient and confinement. Existing GIS geology and soils data to evaluate erosion potential WAC 173-26-221(3)(b): based on the historic record, geologic character and
evidence of past migration over the past 100 years 2 to 3 time series of aerial photographs, maps, LiDAR or whatever is available.
o ix) Already states that aerial photographs may be necessary to identify cumulative impacts
WAC 173-26-201(3)(d)(i)(D):The species composition and structural diversity of plant communities in river and stream areas and wetlands that provides summer and winter thermal regulation, nutrient filtering, appropriate rates of surface erosion, bank erosion, and channel migration and to supply amounts and distributions of woody debris sufficient to sustain physical complexity and stability.
Critical area requirements: The SMP regulations include channel migration under guideline sections that address shoreline habitat, resources, and critical areas
WAC 173-26-201(3)(d)(i)(D): channel migration included as one of the ecosystem functions and processes of overall condition
WAC 173-26-221(2)(c)(iv): Critical areas CMZ included as a critical freshwater habitat New development in the CMZ limited to that which does not:
o Cause net loss of ecological functions WAC 173-26-221(2)(c)(iv)(C)(IV): Requires that SMPs include standards to
implement principles described above .
Flood Hazard Reduction provisions: The SMP guidelines section on Flood Hazard Reduction WAC 173-26-221(3) has greater detail WAC 173-26-221(3)(b): Applicable shoreline master programs should include
provisions to limit development and shoreline modifications that would result in interference with the process of channel migration that may cause significant adverse impacts to property or public improvements and/or result in a net loss of ecological functions associated with the rivers and streams.
Draft Channel Migration Assessment Clallam County
April 2013 Page 59
WAC 173-26-221(3)(b): Failing to recognize the [channel migration] process often leads to damage to, or loss of, structures and threats to life safety
WAC 173-26-221(3)(b): Exemptions The SMP guidelines recognize that previous human actions may deter channel migration. Areas may be removed from the channel migration area if:
Within incorporated municipalities and urban growth areas, areas separated from the active river channel by legally existing artificial channel constraints that limit channel movement should not be considered within the channel migration zone.
All areas separated from the active channel by a legally existing artificial structure(s) (as defined in RCW 90.58.030) that is likely to restrain channel migration, including transportation facilities, built above or constructed to remain intact through the one hundred-year flood, should not be considered to be in the channel migration zone.
In areas outside incorporated municipalities and urban growth areas, channel constraints and flood control structures built below the one hundred-year flood elevation do not necessarily restrict channel migration and should not be considered to limit the channel migration zone unless demonstrated otherwise using scientific and technical information.
Legally existing artificial structures are defined under the Shoreline Management Act definition for floodway (RCW 90.58.030): “...protected from flood waters by flood control devices maintained by or maintained under license from the federal government, the state, or a political subdivision of the state.”
These exemptions need further consideration because in reality, structures do not always constrain channel migration or bank erosion. WAC 173-26-221(3)(b)(i) - (vii): Describes more specific flood hazard prevention
principles, including encouragement to plan for and facilitate removal of artificial restrictions to natural channel migration.
WAC 173-26-221(3)(c)(i): Standard generally prohibiting new development in shoreline jurisdiction where it would require new dikes or levees within the CMZ. “New development or new uses in shoreline jurisdiction, including the subdivision of land, should not be established when it would be reasonably foreseeable that the development or use would require structural flood hazard reduction measures within the channel migration zone or floodway.” Includes list of specific developments that may be appropriate exceptions to the standard.
Modifications and Conditional Use provisions: WAC 173-26-231(3)(c): Fills must protect shoreline ecological functions, including
channel migration processes. WAC 173-26-231(3)(f): Requiring conditional use permit for disposal of dredge material
on shorelands or wetlands within CMZs. WAC 173-26-241(3)(ii)(E): Requiring conditional use permit for mining within CMZ WAC 173-26-241(3)(ii)(D) Mining within the active channel or channels (a location
waterward of the ordinary high-water mark) of a river shall not be permitted unless: (I) Removal of specified quantities of sand and gravel or other materials at specific locations will not adversely affect the natural processes of gravel transportation for the
Draft Channel Migration Assessment Clallam County
Page 60 April 2013
river system as a whole; and (II) The mining and any associated permitted activities will not have significant adverse impacts to habitat for priority species nor cause a net loss of ecological functions of the shoreline.
Shoreline Stabilization: WAC 173-26-231(3)(a)(iii)(A): New development should be located and designed to
avoid future bank stabilization. New development that would cause impacts to adjacent or other properties and shoreline areas should not be allowed.
WAC 173-26-231(3)(a)(iii)(B): New structural stabilization measures not allowed except when need is demonstrated to protect an existing primary structure and meets criteria outlined in WAC 173-26-231(3)(a)(iii)(B)(I-IV).
WAC 173-26-231(3)(a)(iii)(C): Existing structures can be replaced if there is a demonstrated need to protect principle use or structures from erosion based on criteria listed in this section
WAC 173-26-231(3)(a)(iii)(D): Geotechnical reports are needed to demonstrate need to prevent damage to primary structure. The report must show time frames and rates of erosion, and urgency for stabilization. Stabilization methods using Hard armoring solutions (defined in WAC 173-26-231(3)(a)(ii)) should not be permitted except if the structure will be damaged within 3 years.
WAC 173-26-231(3)(a)(iii)(E): Standards for new stabilization structures (besides geotechnical reports) when found to be necessary include limiting the size to minimum, using measures to assure no net loss of shoreline ecological functions, using soft approaches, and mitigating for impacts.
Appendix C: Draft Channel Migration Assessment Clallam County
Appendix C Identifying Channel Migration Reaches
DEPARTMENT OF ECOLOGY, SHORELANDS AND ENVIRONMENTAL ASSISTANCE
SMP Master Program Update: Identifying Potential Channel Migration Reaches
10/9/2009
Draft Channel Migration Assessment Clallam County
Patricia Olson, PhD, LHG, SEA, Ecology 2 9/7/2009
SMP UPDATE: CHANNEL MIGRATION REQUIREMENTS
Channel migration is a natural process associated with streams1. Streams may migrate across valleys due to a variety of reasons including channel and bank erosion, meander chute cutoff, avulsion and aggradation. The channel migration zone represents the area within which a given stream may migrate over time.
Channel migration is an ecosystem process supporting a number of ecological functions including the creation of aquatic and riparian habitat. The channel migration process is also an important risk factor for human settlements in that migration may endanger human welfare and can result in property damage, and change flooding dynamics.
Chapter 173-26 WAC requires that channel migration areas be generally identified during the inventory and characterization phase of Shoreline Master Program updates:
WAC 173-26-201(3) (c): Inventory shoreline conditions:
Local governments shall, at a minimum, and to extent information is relevant and reasonably available, collect the following information:
(ii) Information on critical areas
(vii)General location of channel migration zones and flood plains
What does reasonably available data mean for determining channel migration areas?
WAC 173-26-221(3) (b) indicates that the assessment should be based on the historic record, geologic character and evidence of past migration over the past 100 years. Much of this information is collected for other inventory items as well. Existing relevant data include:
Information on channel characteristics such as channel gradient and confinement.
Existing GIS geology and soils data to evaluate erosion potential
2 to 3 time series of aerial photographs, maps, LiDAR or other spatial and temporal data that is available.
Already states that aerial photographs may be necessary to identify cumulative impacts
Since, channel migration areas vary over space; mapping provides a more efficient means to identify their location. Mapping occurs during the communities Shoreline Master Program updates if it hasn’t already been done in their Critical Area ordinance updates.
The SMP regulations also address development and other modifications within the channel migration zone (CMZ) (Figure 1, with hyperlinks to appropriate WAC sections)
1 The term stream encompasses all sizes of flowing water bodies.
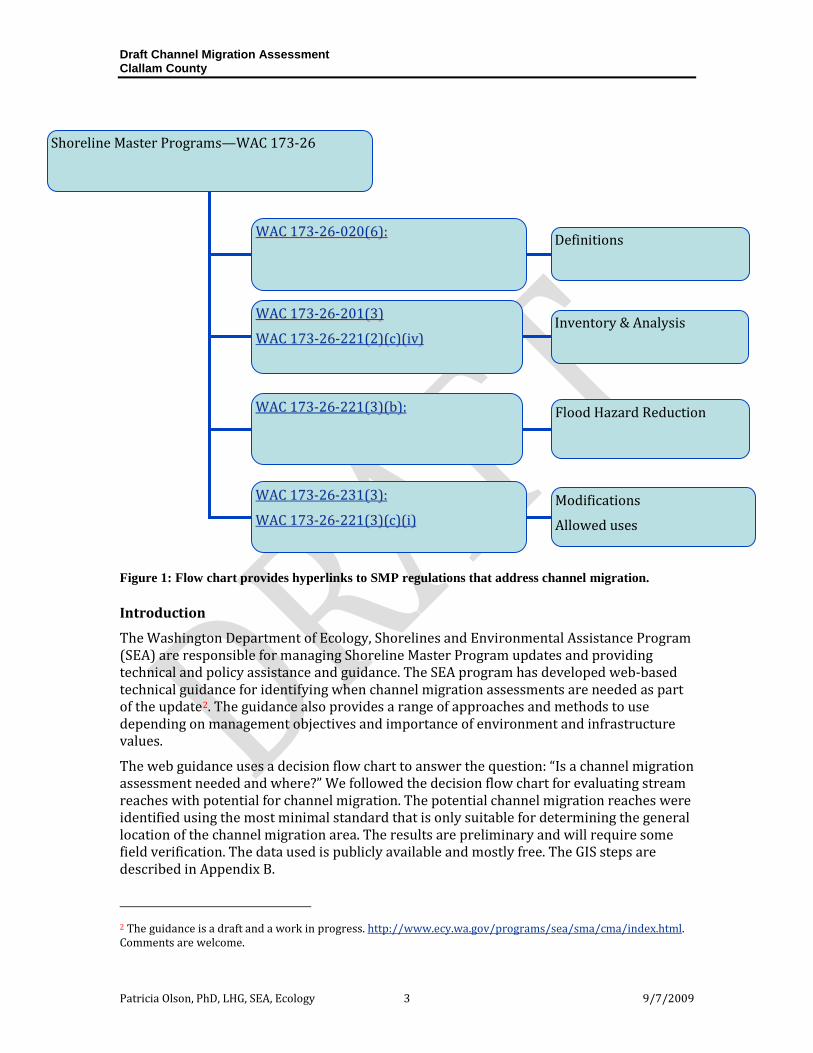
Draft Channel Migration Assessment Clallam County
Patricia Olson, PhD, LHG, SEA, Ecology 3 9/7/2009
Figure 1: Flow chart provides hyperlinks to SMP regulations that address channel migration.
Introduction
The Washington Department of Ecology, Shorelines and Environmental Assistance Program (SEA) are responsible for managing Shoreline Master Program updates and providing technical and policy assistance and guidance. The SEA program has developed web-based technical guidance for identifying when channel migration assessments are needed as part of the update2. The guidance also provides a range of approaches and methods to use depending on management objectives and importance of environment and infrastructure values.
The web guidance uses a decision flow chart to answer the question: “Is a channel migration assessment needed and where?” We followed the decision flow chart for evaluating stream reaches with potential for channel migration. The potential channel migration reaches were identified using the most minimal standard that is only suitable for determining the general location of the channel migration area. The results are preliminary and will require some field verification. The data used is publicly available and mostly free. The GIS steps are described in Appendix B.
2 The guidance is a draft and a work in progress. http://www.ecy.wa.gov/programs/sea/sma/cma/index.html. Comments are welcome.
Shoreline Master Programs—WAC 173-26
WWAACC 117733--2266--002200((66))::
WWAACC 117733--2266--220011((33))
WWAACC 117733--2266--222211((22))((cc))((iivv))
WWAACC 117733--2266--222211((33))((bb))::
WWAACC 117733--2266--223311((33))::
WWAACC 117733--2266--222211((33))((cc))((ii))
Definitions
Inventory & Analysis
Flood Hazard Reduction
Modifications
Allowed uses
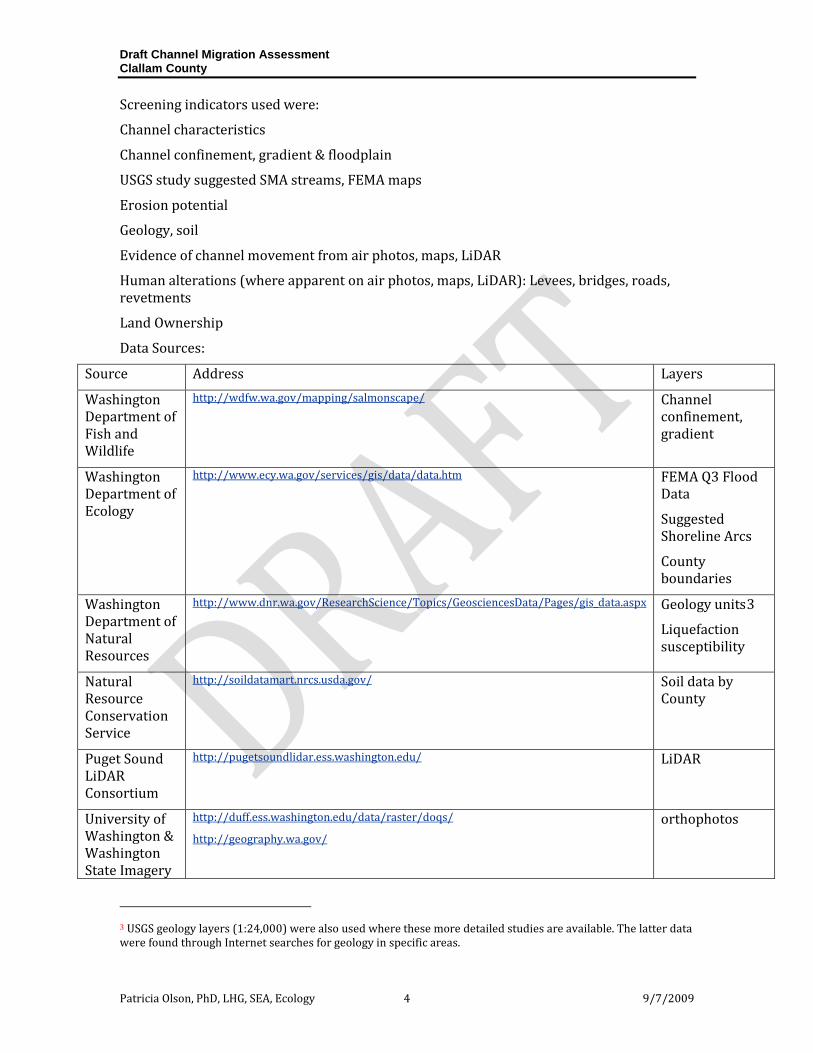
Draft Channel Migration Assessment Clallam County
Patricia Olson, PhD, LHG, SEA, Ecology 4 9/7/2009
Screening indicators used were:
Channel characteristics
Channel confinement, gradient & floodplain
USGS study suggested SMA streams, FEMA maps
Erosion potential
Geology, soil
Evidence of channel movement from air photos, maps, LiDAR
Human alterations (where apparent on air photos, maps, LiDAR): Levees, bridges, roads, revetments
Land Ownership
Data Sources:
Source Address Layers
Washington Department of Fish and Wildlife
http://wdfw.wa.gov/mapping/salmonscape/ Channel confinement, gradient
Washington Department of Ecology
http://www.ecy.wa.gov/services/gis/data/data.htm FEMA Q3 Flood Data
Suggested Shoreline Arcs
County boundaries
Washington Department of Natural Resources
http://www.dnr.wa.gov/ResearchScience/Topics/GeosciencesData/Pages/gis_data.aspx Geology units3
Liquefaction susceptibility
Natural Resource Conservation Service
http://soildatamart.nrcs.usda.gov/ Soil data by County
Puget Sound LiDAR Consortium
http://pugetsoundlidar.ess.washington.edu/ LiDAR
University of Washington & Washington State Imagery
http://duff.ess.washington.edu/data/raster/doqs/
http://geography.wa.gov/ orthophotos
3 USGS geology layers (1:24,000) were also used where these more detailed studies are available. The latter data were found through Internet searches for geology in specific areas.
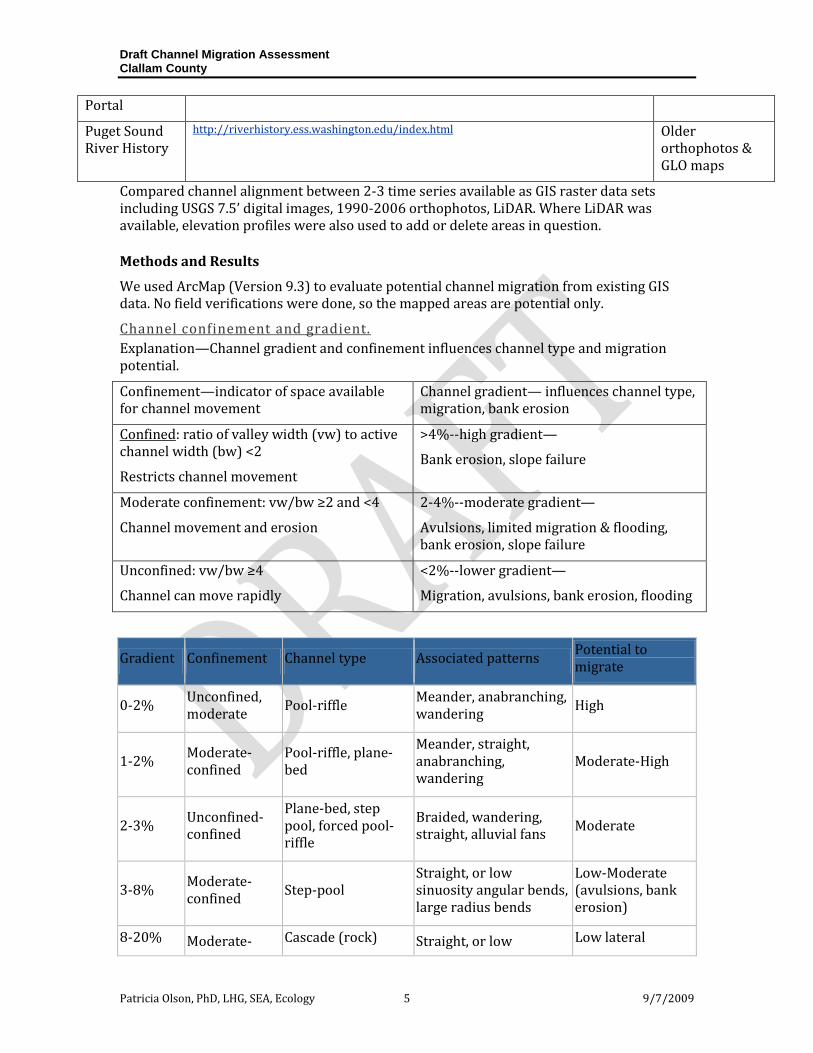
Draft Channel Migration Assessment Clallam County
Patricia Olson, PhD, LHG, SEA, Ecology 5 9/7/2009
Portal
Puget Sound River History
http://riverhistory.ess.washington.edu/index.html Older orthophotos & GLO maps
Compared channel alignment between 2-3 time series available as GIS raster data sets including USGS 7.5’ digital images, 1990-2006 orthophotos, LiDAR. Where LiDAR was available, elevation profiles were also used to add or delete areas in question.
Methods and Results
We used ArcMap (Version 9.3) to evaluate potential channel migration from existing GIS data. No field verifications were done, so the mapped areas are potential only.
Channel confinement and gradient. Explanation—Channel gradient and confinement influences channel type and migration potential.
Confinement—indicator of space available for channel movement
Channel gradient— influences channel type, migration, bank erosion
Confined: ratio of valley width (vw) to active channel width (bw) <2
Restricts channel movement
>4%--high gradient—
Bank erosion, slope failure
Moderate confinement: vw/bw ≥2 and <4
Channel movement and erosion
2-4%--moderate gradient—
Avulsions, limited migration & flooding, bank erosion, slope failure
Unconfined: vw/bw ≥4
Channel can move rapidly
<2%--lower gradient—
Migration, avulsions, bank erosion, flooding
Gradient Confinement Channel type Associated patterns Potential to migrate
0-2% Unconfined, moderate Pool-riffle Meander, anabranching,
wandering High
1-2% Moderate-confined
Pool-riffle, plane-bed
Meander, straight, anabranching, wandering
Moderate-High
2-3% Unconfined-confined
Plane-bed, step pool, forced pool-riffle
Braided, wandering, straight, alluvial fans Moderate
3-8% Moderate-confined Step-pool
Straight, or low sinuosity angular bends, large radius bends
Low-Moderate (avulsions, bank erosion)
8-20% Moderate- Cascade (rock) Straight, or low Low lateral
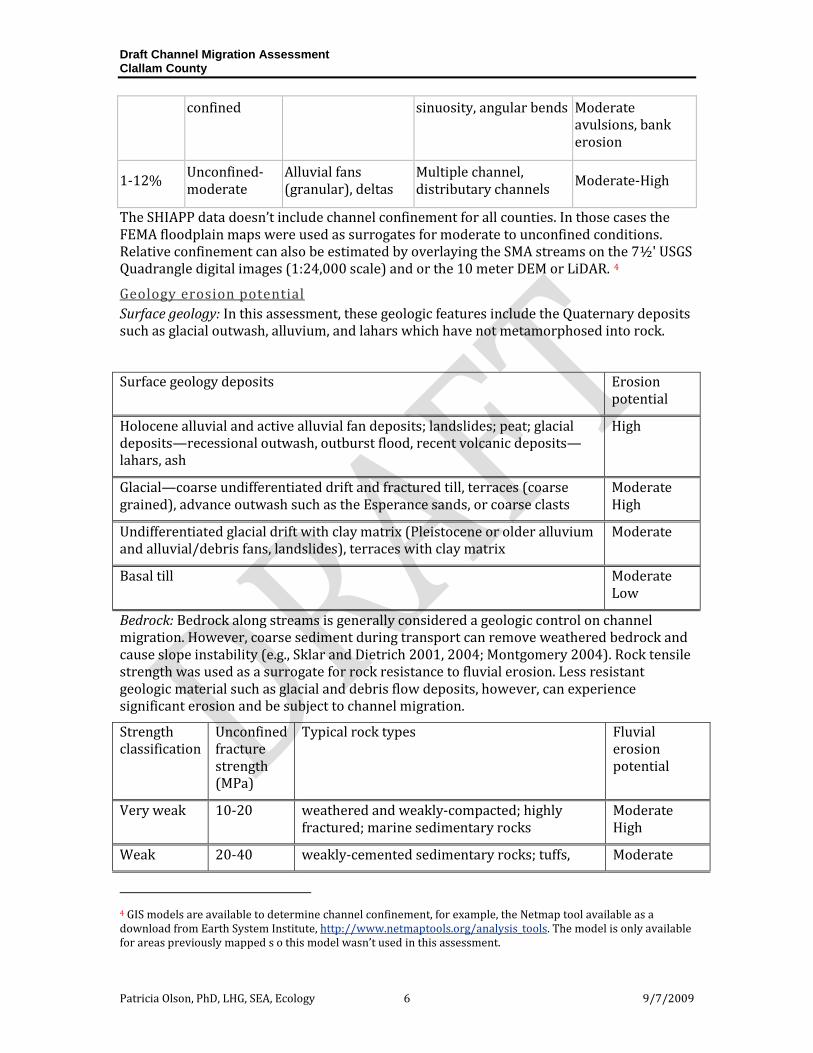
Draft Channel Migration Assessment Clallam County
Patricia Olson, PhD, LHG, SEA, Ecology 6 9/7/2009
confined sinuosity, angular bends Moderate avulsions, bank erosion
1-12% Unconfined-moderate
Alluvial fans (granular), deltas
Multiple channel, distributary channels Moderate-High
The SHIAPP data doesn’t include channel confinement for all counties. In those cases the FEMA floodplain maps were used as surrogates for moderate to unconfined conditions. Relative confinement can also be estimated by overlaying the SMA streams on the 7½' USGS Quadrangle digital images (1:24,000 scale) and or the 10 meter DEM or LiDAR. 4
Geology erosion potential Surface geology: In this assessment, these geologic features include the Quaternary deposits such as glacial outwash, alluvium, and lahars which have not metamorphosed into rock.
Surface geology deposits Erosion potential
Holocene alluvial and active alluvial fan deposits; landslides; peat; glacial deposits—recessional outwash, outburst flood, recent volcanic deposits—lahars, ash
High
Glacial—coarse undifferentiated drift and fractured till, terraces (coarse grained), advance outwash such as the Esperance sands, or coarse clasts
Moderate High
Undifferentiated glacial drift with clay matrix (Pleistocene or older alluvium and alluvial/debris fans, landslides), terraces with clay matrix
Moderate
Basal till Moderate Low
Bedrock: Bedrock along streams is generally considered a geologic control on channel migration. However, coarse sediment during transport can remove weathered bedrock and cause slope instability (e.g., Sklar and Dietrich 2001, 2004; Montgomery 2004). Rock tensile strength was used as a surrogate for rock resistance to fluvial erosion. Less resistant geologic material such as glacial and debris flow deposits, however, can experience significant erosion and be subject to channel migration.
Strength classification
Unconfined fracture strength (MPa)
Typical rock types Fluvial erosion potential
Very weak 10-20 weathered and weakly-compacted; highly fractured; marine sedimentary rocks
Moderate High
Weak 20-40 weakly-cemented sedimentary rocks; tuffs, Moderate
4 GIS models are available to determine channel confinement, for example, the Netmap tool available as a download from Earth System Institute, http://www.netmaptools.org/analysis_tools. The model is only available for areas previously mapped s o this model wasn’t used in this assessment.
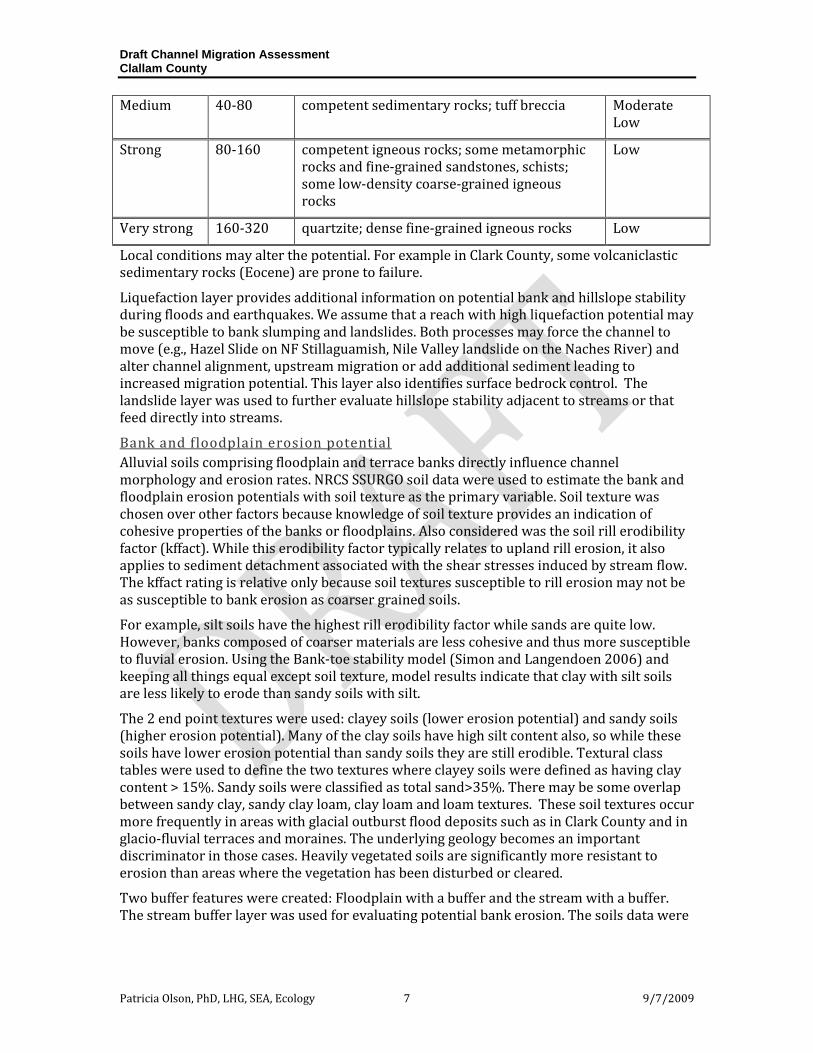
Draft Channel Migration Assessment Clallam County
Patricia Olson, PhD, LHG, SEA, Ecology 7 9/7/2009
Medium 40-80 competent sedimentary rocks; tuff breccia Moderate Low
Strong 80-160 competent igneous rocks; some metamorphic rocks and fine-grained sandstones, schists; some low-density coarse-grained igneous rocks
Low
Very strong 160-320 quartzite; dense fine-grained igneous rocks Low
Local conditions may alter the potential. For example in Clark County, some volcaniclastic sedimentary rocks (Eocene) are prone to failure.
Liquefaction layer provides additional information on potential bank and hillslope stability during floods and earthquakes. We assume that a reach with high liquefaction potential may be susceptible to bank slumping and landslides. Both processes may force the channel to move (e.g., Hazel Slide on NF Stillaguamish, Nile Valley landslide on the Naches River) and alter channel alignment, upstream migration or add additional sediment leading to increased migration potential. This layer also identifies surface bedrock control. The landslide layer was used to further evaluate hillslope stability adjacent to streams or that feed directly into streams.
Bank and floodplain erosion potential Alluvial soils comprising floodplain and terrace banks directly influence channel morphology and erosion rates. NRCS SSURGO soil data were used to estimate the bank and floodplain erosion potentials with soil texture as the primary variable. Soil texture was chosen over other factors because knowledge of soil texture provides an indication of cohesive properties of the banks or floodplains. Also considered was the soil rill erodibility factor (kffact). While this erodibility factor typically relates to upland rill erosion, it also applies to sediment detachment associated with the shear stresses induced by stream flow. The kffact rating is relative only because soil textures susceptible to rill erosion may not be as susceptible to bank erosion as coarser grained soils.
For example, silt soils have the highest rill erodibility factor while sands are quite low. However, banks composed of coarser materials are less cohesive and thus more susceptible to fluvial erosion. Using the Bank-toe stability model (Simon and Langendoen 2006) and keeping all things equal except soil texture, model results indicate that clay with silt soils are less likely to erode than sandy soils with silt.
The 2 end point textures were used: clayey soils (lower erosion potential) and sandy soils (higher erosion potential). Many of the clay soils have high silt content also, so while these soils have lower erosion potential than sandy soils they are still erodible. Textural class tables were used to define the two textures where clayey soils were defined as having clay content > 15%. Sandy soils were classified as total sand>35%. There may be some overlap between sandy clay, sandy clay loam, clay loam and loam textures. These soil textures occur more frequently in areas with glacial outburst flood deposits such as in Clark County and in glacio-fluvial terraces and moraines. The underlying geology becomes an important discriminator in those cases. Heavily vegetated soils are significantly more resistant to erosion than areas where the vegetation has been disturbed or cleared.
Two buffer features were created: Floodplain with a buffer and the stream with a buffer. The stream buffer layer was used for evaluating potential bank erosion. The soils data were
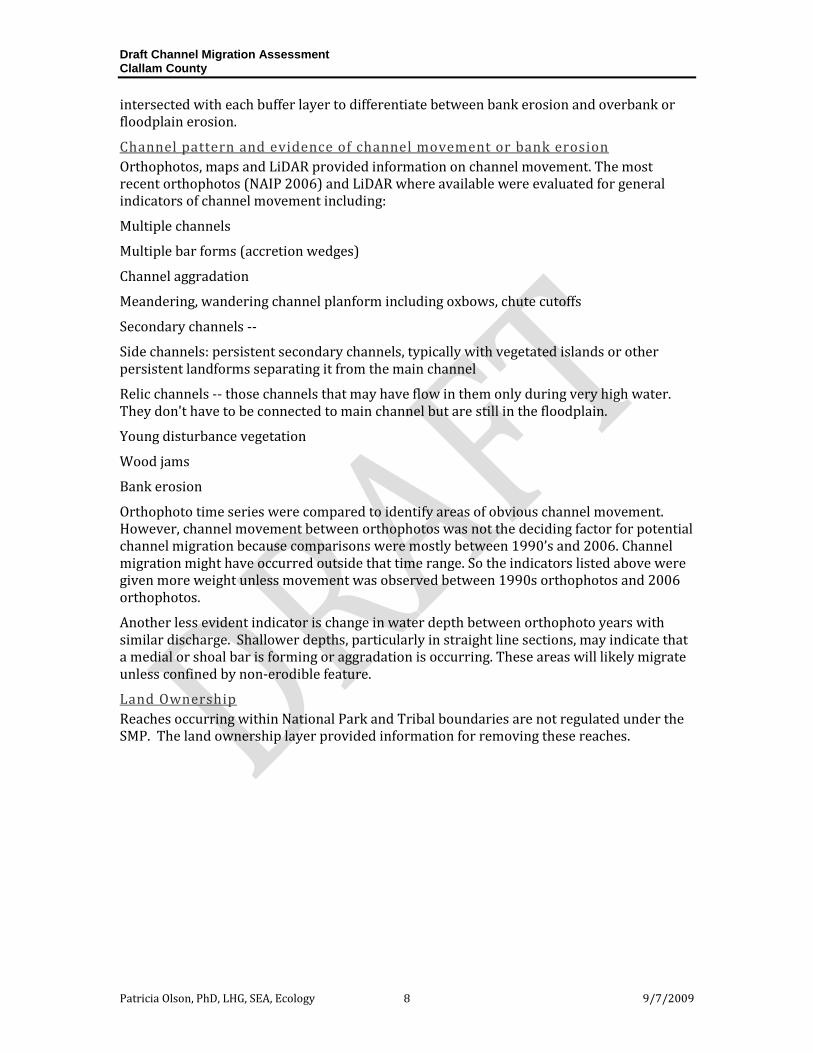
Draft Channel Migration Assessment Clallam County
Patricia Olson, PhD, LHG, SEA, Ecology 8 9/7/2009
intersected with each buffer layer to differentiate between bank erosion and overbank or floodplain erosion.
Channel pattern and evidence of channel movement or bank erosion Orthophotos, maps and LiDAR provided information on channel movement. The most recent orthophotos (NAIP 2006) and LiDAR where available were evaluated for general indicators of channel movement including:
Multiple channels
Multiple bar forms (accretion wedges)
Channel aggradation
Meandering, wandering channel planform including oxbows, chute cutoffs
Secondary channels --
Side channels: persistent secondary channels, typically with vegetated islands or other persistent landforms separating it from the main channel
Relic channels -- those channels that may have flow in them only during very high water. They don't have to be connected to main channel but are still in the floodplain.
Young disturbance vegetation
Wood jams
Bank erosion
Orthophoto time series were compared to identify areas of obvious channel movement. However, channel movement between orthophotos was not the deciding factor for potential channel migration because comparisons were mostly between 1990’s and 2006. Channel migration might have occurred outside that time range. So the indicators listed above were given more weight unless movement was observed between 1990s orthophotos and 2006 orthophotos.
Another less evident indicator is change in water depth between orthophoto years with similar discharge. Shallower depths, particularly in straight line sections, may indicate that a medial or shoal bar is forming or aggradation is occurring. These areas will likely migrate unless confined by non-erodible feature.
Land Ownership Reaches occurring within National Park and Tribal boundaries are not regulated under the SMP. The land ownership layer provided information for removing these reaches.
Patricia Olson, PhD, LHG, SEA, Ecology 9 9/7/2009
References
Montgomery, D.R. 2004. Observations on the role of lithology in strath terrace formation and bedrock channel width [American Journal of Science, Vol. 304, May, 2004, P. 454–476]
Simon, A., Langendoen, E.J. 2006. A deterministic bank-stability and toe-erosion model for stream restoration. In: Proceedings of the Environmental and Water Resources Congress (R. Graham, Ed.), May 21-25, 2006, Omaha, Nebraska.
Sklar, L. S., and W. E. Dietrich (2004). A mechanistic model for river incision into bedrock by saltating bed load, Water Resour. Res., 40, W06301, doi:10.1029/2003WR002496
Sklar, L. S. and W. E. Dietrich (2001). "Sediment and rock strength controls on river incision into bedrock." Geology 29(12): 1087-1090
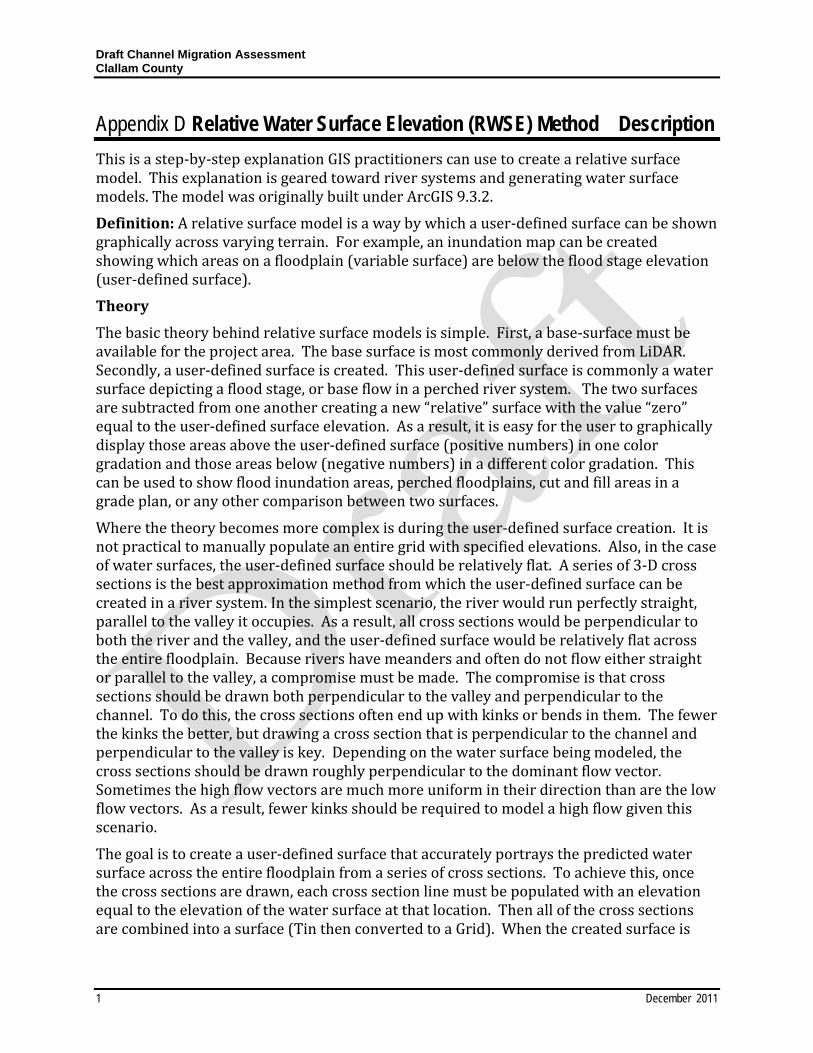
Draft Channel Migration Assessment Clallam County
1 December 2011
Appendix D Relative Water Surface Elevation (RWSE) Method Description This is a step-by-step explanation GIS practitioners can use to create a relative surface model. This explanation is geared toward river systems and generating water surface models. The model was originally built under ArcGIS 9.3.2.
Definition: A relative surface model is a way by which a user-defined surface can be shown graphically across varying terrain. For example, an inundation map can be created showing which areas on a floodplain (variable surface) are below the flood stage elevation (user-defined surface).
Theory
The basic theory behind relative surface models is simple. First, a base-surface must be available for the project area. The base surface is most commonly derived from LiDAR. Secondly, a user-defined surface is created. This user-defined surface is commonly a water surface depicting a flood stage, or base flow in a perched river system. The two surfaces are subtracted from one another creating a new “relative” surface with the value “zero” equal to the user-defined surface elevation. As a result, it is easy for the user to graphically display those areas above the user-defined surface (positive numbers) in one color gradation and those areas below (negative numbers) in a different color gradation. This can be used to show flood inundation areas, perched floodplains, cut and fill areas in a grade plan, or any other comparison between two surfaces.
Where the theory becomes more complex is during the user-defined surface creation. It is not practical to manually populate an entire grid with specified elevations. Also, in the case of water surfaces, the user-defined surface should be relatively flat. A series of 3-D cross sections is the best approximation method from which the user-defined surface can be created in a river system. In the simplest scenario, the river would run perfectly straight, parallel to the valley it occupies. As a result, all cross sections would be perpendicular to both the river and the valley, and the user-defined surface would be relatively flat across the entire floodplain. Because rivers have meanders and often do not flow either straight or parallel to the valley, a compromise must be made. The compromise is that cross sections should be drawn both perpendicular to the valley and perpendicular to the channel. To do this, the cross sections often end up with kinks or bends in them. The fewer the kinks the better, but drawing a cross section that is perpendicular to the channel and perpendicular to the valley is key. Depending on the water surface being modeled, the cross sections should be drawn roughly perpendicular to the dominant flow vector. Sometimes the high flow vectors are much more uniform in their direction than are the low flow vectors. As a result, fewer kinks should be required to model a high flow given this scenario.
The goal is to create a user-defined surface that accurately portrays the predicted water surface across the entire floodplain from a series of cross sections. To achieve this, once the cross sections are drawn, each cross section line must be populated with an elevation equal to the elevation of the water surface at that location. Then all of the cross sections are combined into a surface (Tin then converted to a Grid). When the created surface is
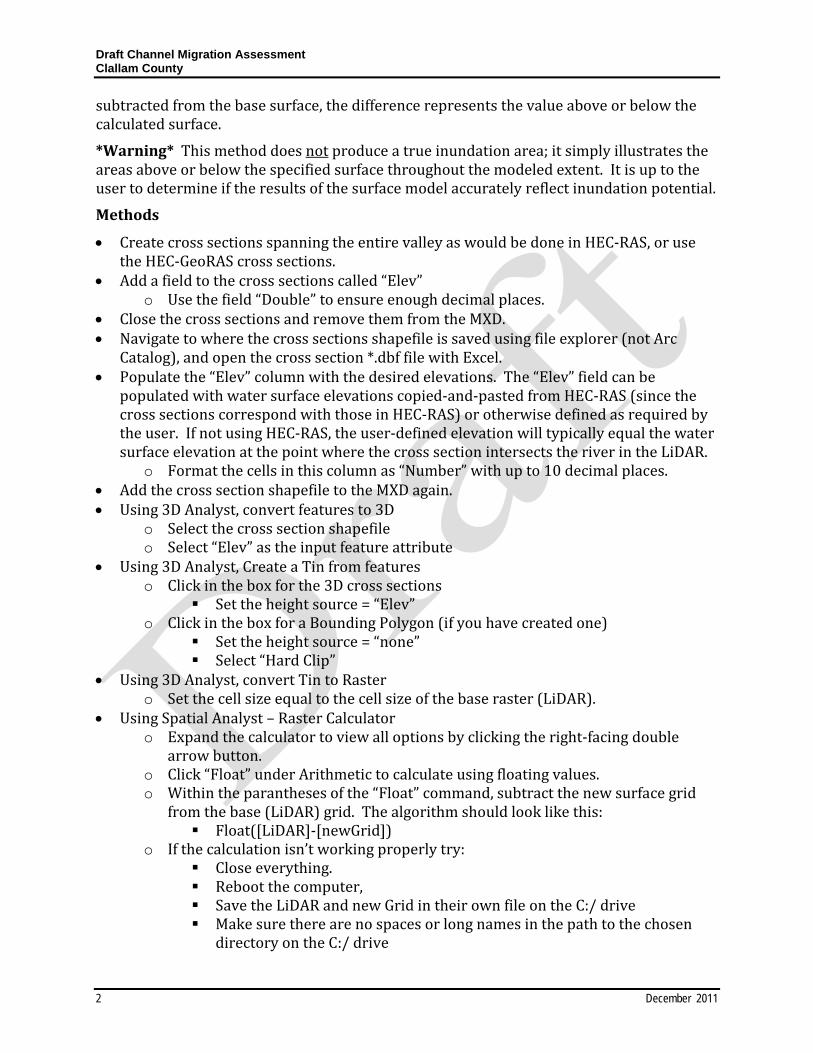
Draft Channel Migration Assessment Clallam County
2 December 2011
subtracted from the base surface, the difference represents the value above or below the calculated surface.
*Warning* This method does not produce a true inundation area; it simply illustrates the areas above or below the specified surface throughout the modeled extent. It is up to the user to determine if the results of the surface model accurately reflect inundation potential.
Methods
• Create cross sections spanning the entire valley as would be done in HEC-RAS, or use the HEC-GeoRAS cross sections.
• Add a field to the cross sections called “Elev” o Use the field “Double” to ensure enough decimal places.
• Close the cross sections and remove them from the MXD. • Navigate to where the cross sections shapefile is saved using file explorer (not Arc
Catalog), and open the cross section *.dbf file with Excel. • Populate the “Elev” column with the desired elevations. The “Elev” field can be
populated with water surface elevations copied-and-pasted from HEC-RAS (since the cross sections correspond with those in HEC-RAS) or otherwise defined as required by the user. If not using HEC-RAS, the user-defined elevation will typically equal the water surface elevation at the point where the cross section intersects the river in the LiDAR.
o Format the cells in this column as “Number” with up to 10 decimal places. • Add the cross section shapefile to the MXD again. • Using 3D Analyst, convert features to 3D
o Select the cross section shapefile o Select “Elev” as the input feature attribute
• Using 3D Analyst, Create a Tin from features o Click in the box for the 3D cross sections
Set the height source = “Elev” o Click in the box for a Bounding Polygon (if you have created one)
Set the height source = “none” Select “Hard Clip”
• Using 3D Analyst, convert Tin to Raster o Set the cell size equal to the cell size of the base raster (LiDAR).
• Using Spatial Analyst – Raster Calculator o Expand the calculator to view all options by clicking the right-facing double
arrow button. o Click “Float” under Arithmetic to calculate using floating values. o Within the parantheses of the “Float” command, subtract the new surface grid
from the base (LiDAR) grid. The algorithm should look like this: Float([LiDAR]-[newGrid])
o If the calculation isn’t working properly try: Close everything. Reboot the computer, Save the LiDAR and new Grid in their own file on the C:/ drive Make sure there are no spaces or long names in the path to the chosen
directory on the C:/ drive
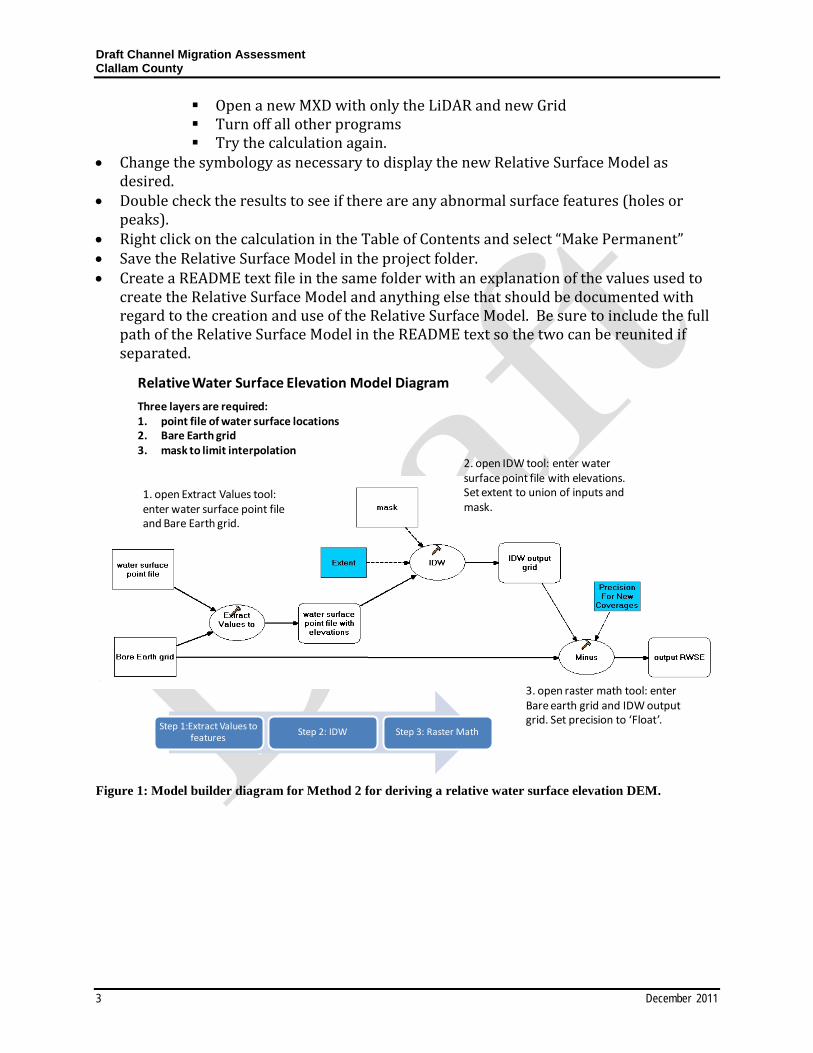
Draft Channel Migration Assessment Clallam County
3 December 2011
Open a new MXD with only the LiDAR and new Grid Turn off all other programs Try the calculation again.
• Change the symbology as necessary to display the new Relative Surface Model as desired.
• Double check the results to see if there are any abnormal surface features (holes or peaks).
• Right click on the calculation in the Table of Contents and select “Make Permanent” • Save the Relative Surface Model in the project folder. • Create a README text file in the same folder with an explanation of the values used to
create the Relative Surface Model and anything else that should be documented with regard to the creation and use of the Relative Surface Model. Be sure to include the full path of the Relative Surface Model in the README text so the two can be reunited if separated.
Figure 1: Model builder diagram for Method 2 for deriving a relative water surface elevation DEM.
Step 1:Extract Values to features
Step 2: IDW Step 3: Raster Math
1. open Extract Values tool: enter water surface point file and Bare Earth grid.
2. open IDW tool: enter water surface point file with elevations.Set extent to union of inputs and mask.
3. open raster math tool: enter Bare earth grid and IDW output grid. Set precision to ‘Float’.
Relative Water Surface Elevation Model Diagram
Three layers are required: 1. point file of water surface locations 2. Bare Earth grid 3. mask to limit interpolation
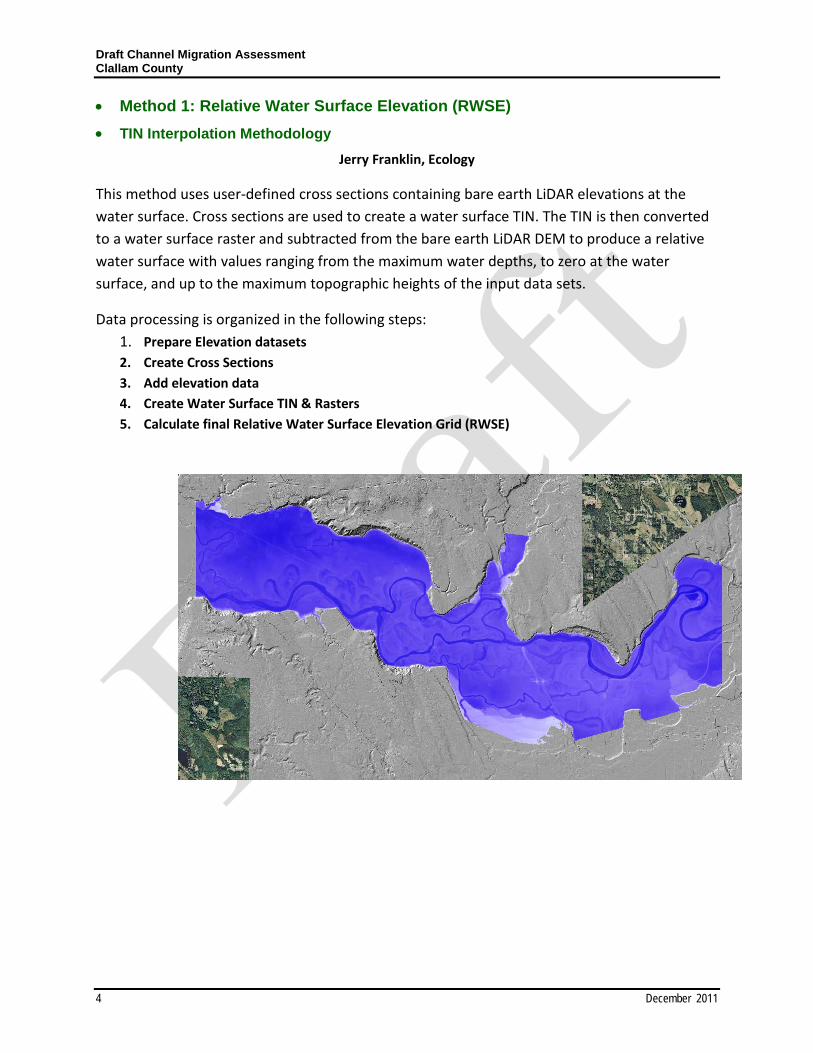
Draft Channel Migration Assessment Clallam County
4 December 2011
• Method 1: Relative Water Surface Elevation (RWSE) • TIN Interpolation Methodology
Jerry Franklin, Ecology
This method uses user-defined cross sections containing bare earth LiDAR elevations at the water surface. Cross sections are used to create a water surface TIN. The TIN is then converted to a water surface raster and subtracted from the bare earth LiDAR DEM to produce a relative water surface with values ranging from the maximum water depths, to zero at the water surface, and up to the maximum topographic heights of the input data sets.
Data processing is organized in the following steps: 1. Prepare Elevation datasets 2. Create Cross Sections 3. Add elevation data 4. Create Water Surface TIN & Rasters 5. Calculate final Relative Water Surface Elevation Grid (RWSE)
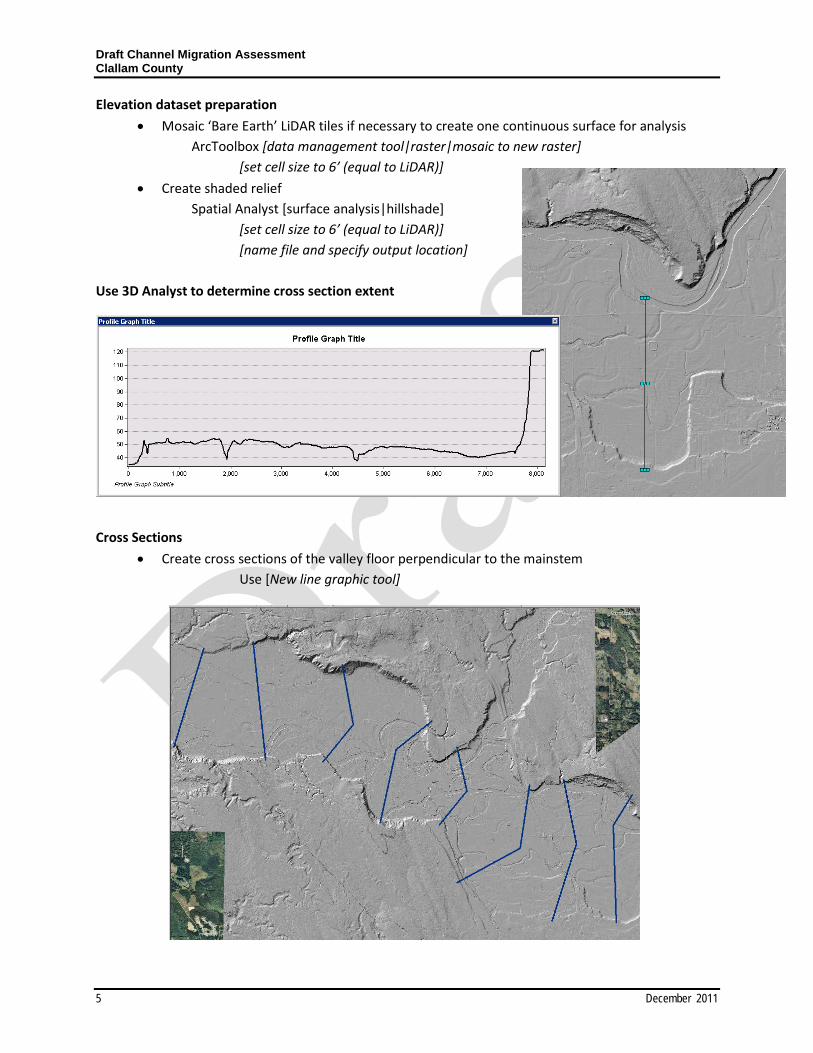
Draft Channel Migration Assessment Clallam County
5 December 2011
Elevation dataset preparation
• Mosaic ‘Bare Earth’ LiDAR tiles if necessary to create one continuous surface for analysis ArcToolbox [data management tool|raster|mosaic to new raster] [set cell size to 6’ (equal to LiDAR)]
• Create shaded relief Spatial Analyst [surface analysis|hillshade] [set cell size to 6’ (equal to LiDAR)]
[name file and specify output location] Use 3D Analyst to determine cross section extent Cross Sections
• Create cross sections of the valley floor perpendicular to the mainstem Use [New line graphic tool]
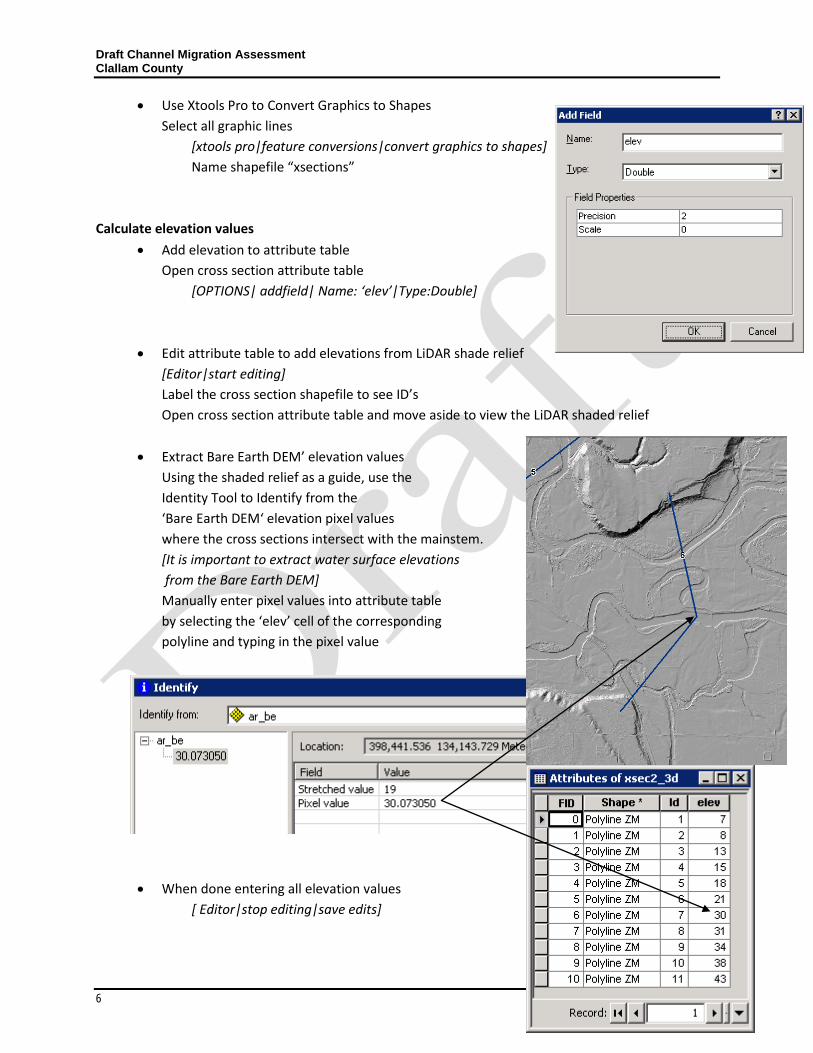
Draft Channel Migration Assessment Clallam County
6 December 2011
• Use Xtools Pro to Convert Graphics to Shapes Select all graphic lines
[xtools pro|feature conversions|convert graphics to shapes] Name shapefile “xsections”
Calculate elevation values
• Add elevation to attribute table Open cross section attribute table
[OPTIONS| addfield| Name: ‘elev’|Type:Double]
• Edit attribute table to add elevations from LiDAR shade relief [Editor|start editing] Label the cross section shapefile to see ID’s Open cross section attribute table and move aside to view the LiDAR shaded relief
• Extract Bare Earth DEM’ elevation values Using the shaded relief as a guide, use the Identity Tool to Identify from the ‘Bare Earth DEM‘ elevation pixel values where the cross sections intersect with the mainstem. [It is important to extract water surface elevations from the Bare Earth DEM] Manually enter pixel values into attribute table by selecting the ‘elev’ cell of the corresponding polyline and typing in the pixel value
• When done entering all elevation values [ Editor|stop editing|save edits]
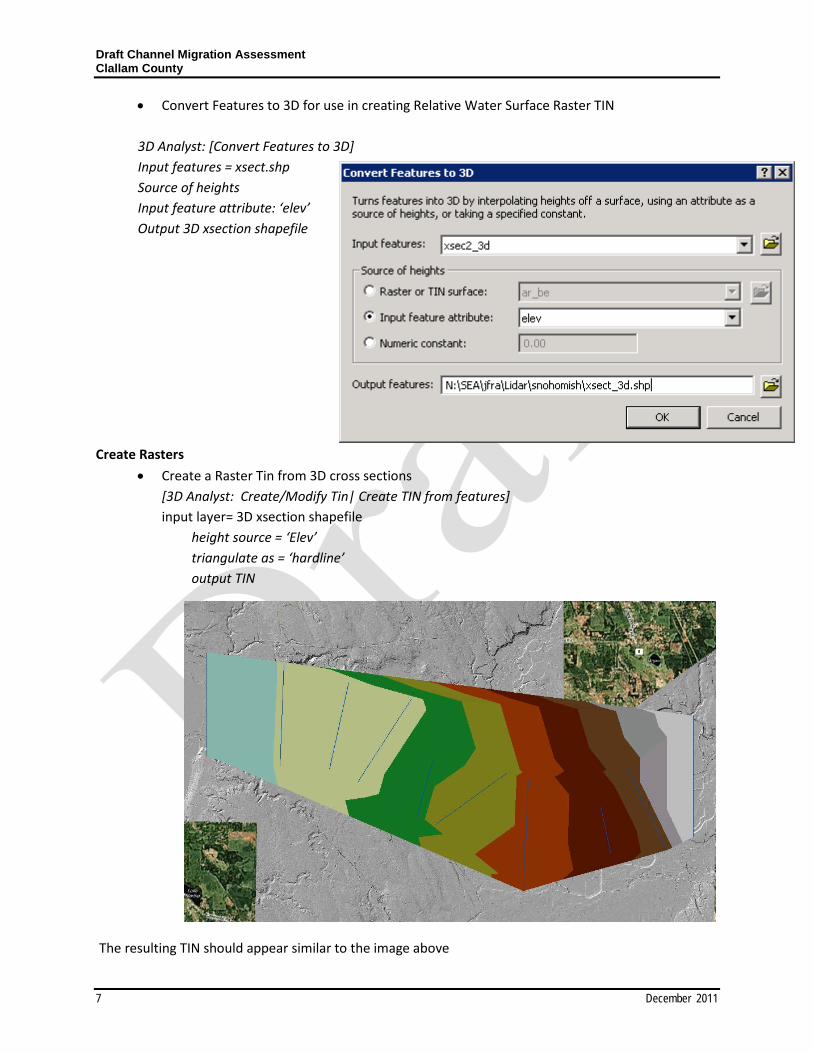
Draft Channel Migration Assessment Clallam County
7 December 2011
• Convert Features to 3D for use in creating Relative Water Surface Raster TIN 3D Analyst: [Convert Features to 3D] Input features = xsect.shp Source of heights Input feature attribute: ‘elev’ Output 3D xsection shapefile
Create Rasters
• Create a Raster Tin from 3D cross sections [3D Analyst: Create/Modify Tin| Create TIN from features] input layer= 3D xsection shapefile
height source = ‘Elev’ triangulate as = ‘hardline’ output TIN
The resulting TIN should appear similar to the image above
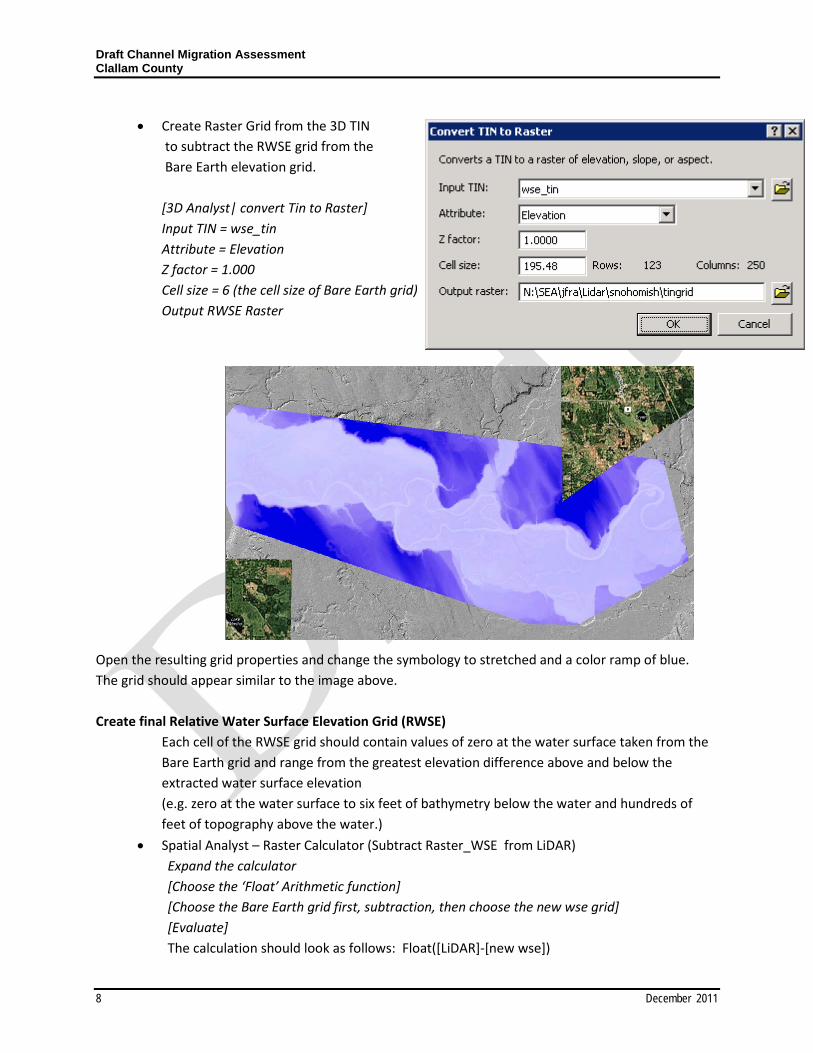
Draft Channel Migration Assessment Clallam County
8 December 2011
• Create Raster Grid from the 3D TIN to subtract the RWSE grid from the Bare Earth elevation grid. [3D Analyst| convert Tin to Raster] Input TIN = wse_tin Attribute = Elevation Z factor = 1.000 Cell size = 6 (the cell size of Bare Earth grid) Output RWSE Raster
Open the resulting grid properties and change the symbology to stretched and a color ramp of blue. The grid should appear similar to the image above. Create final Relative Water Surface Elevation Grid (RWSE)
Each cell of the RWSE grid should contain values of zero at the water surface taken from the Bare Earth grid and range from the greatest elevation difference above and below the extracted water surface elevation (e.g. zero at the water surface to six feet of bathymetry below the water and hundreds of feet of topography above the water.)
• Spatial Analyst – Raster Calculator (Subtract Raster_WSE from LiDAR) Expand the calculator [Choose the ‘Float’ Arithmetic function] [Choose the Bare Earth grid first, subtraction, then choose the new wse grid] [Evaluate] The calculation should look as follows: Float([LiDAR]-[new wse])
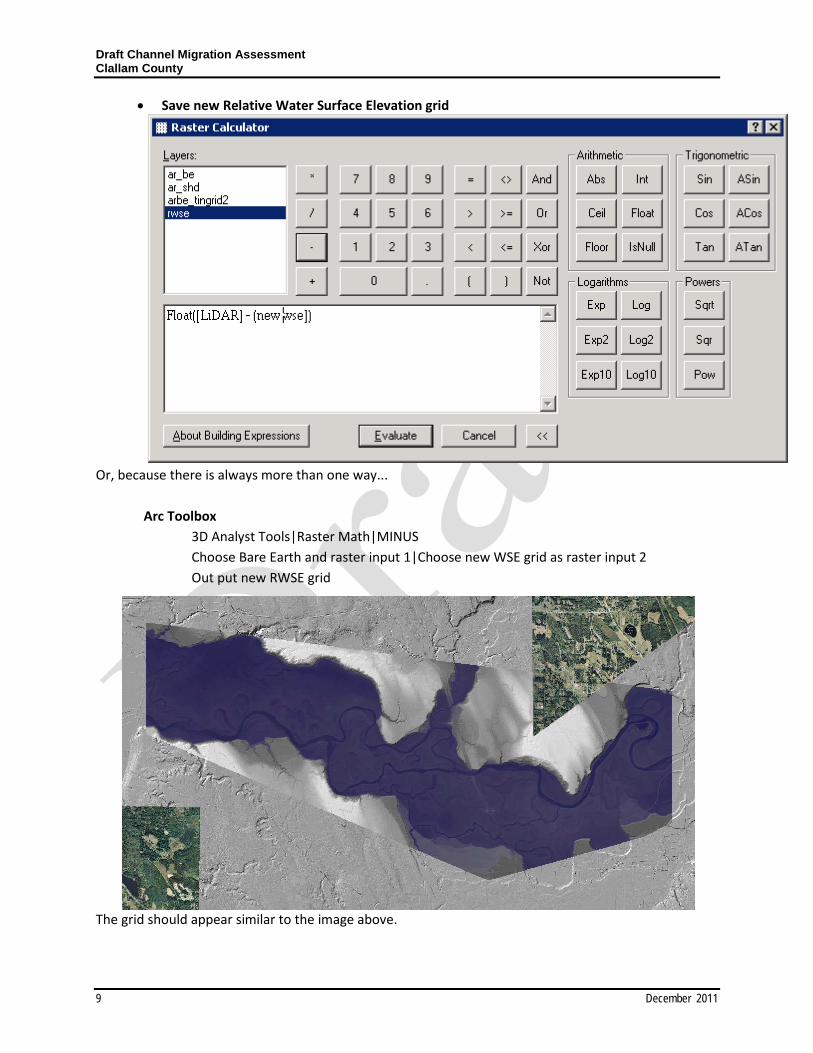
Draft Channel Migration Assessment Clallam County
9 December 2011
• Save new Relative Water Surface Elevation grid Right click on the calculation grid in the Table of Contents and select “Make Permanent”
Or, because there is always more than one way...
Arc Toolbox 3D Analyst Tools|Raster Math|MINUS
Choose Bare Earth and raster input 1|Choose new WSE grid as raster input 2 Out put new RWSE grid
The grid should appear similar to the image above.
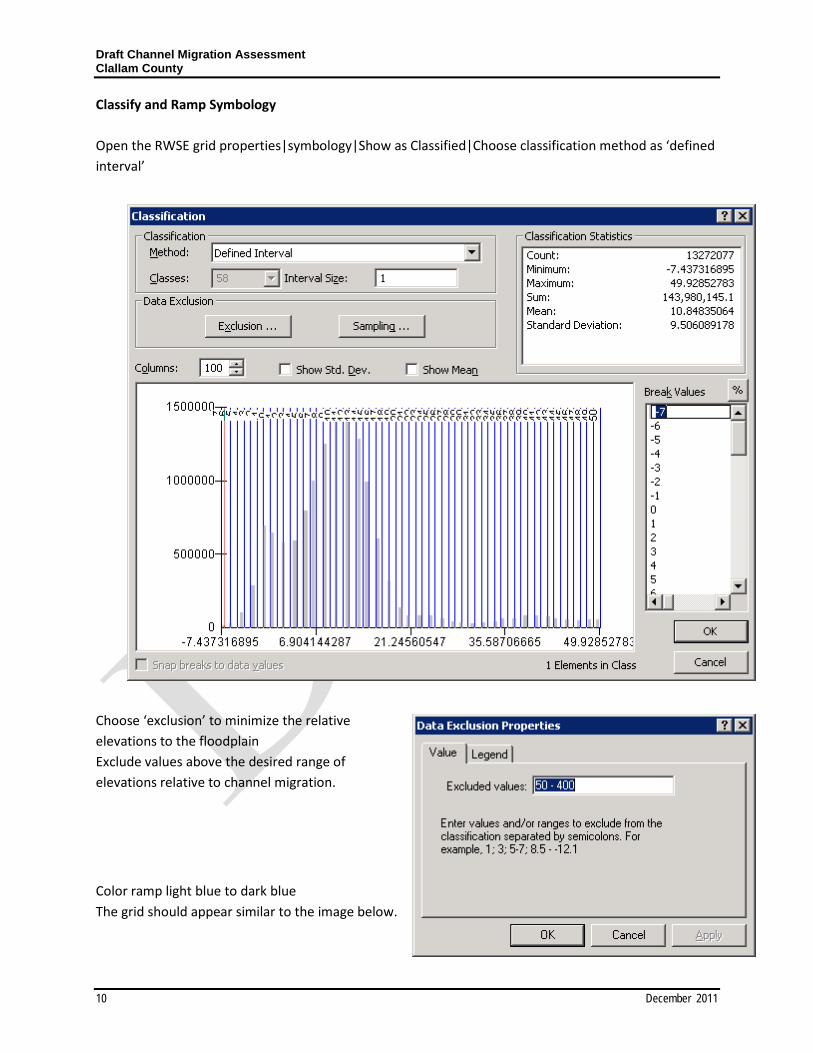
Draft Channel Migration Assessment Clallam County
10 December 2011
Classify and Ramp Symbology Open the RWSE grid properties|symbology|Show as Classified|Choose classification method as ‘defined interval’ Choose ‘exclusion’ to minimize the relative elevations to the floodplain Exclude values above the desired range of elevations relative to channel migration.
Color ramp light blue to dark blue The grid should appear similar to the image below.
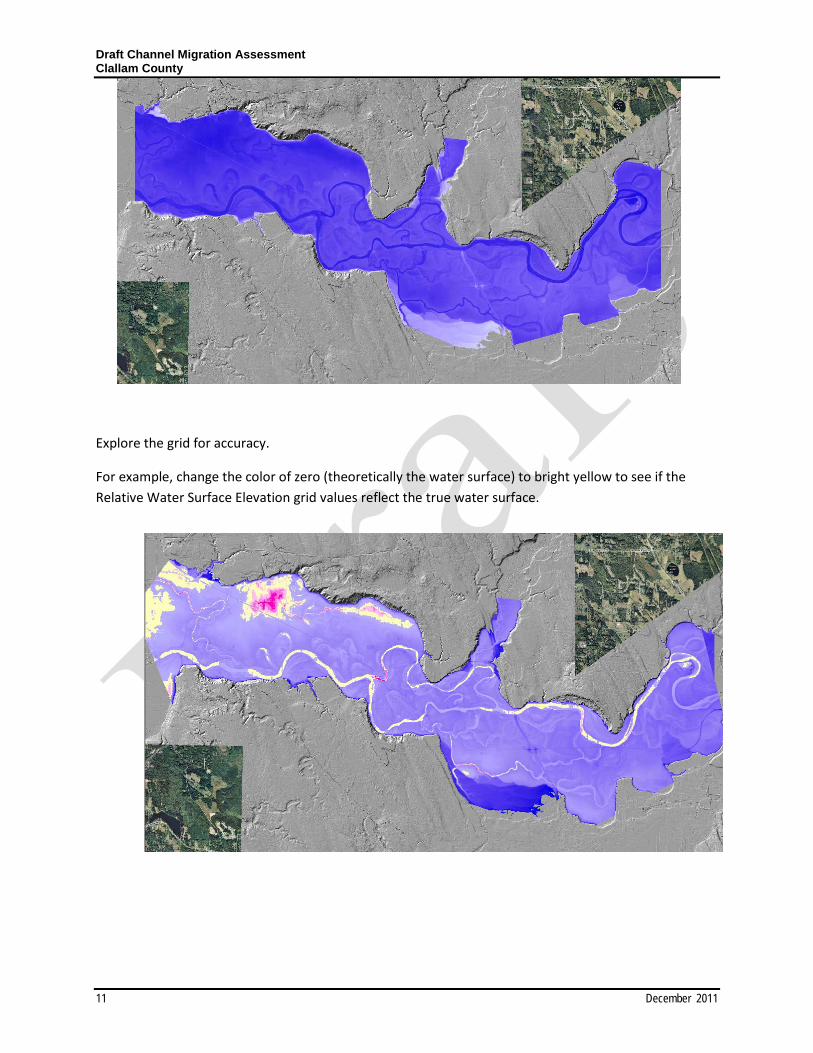
Draft Channel Migration Assessment Clallam County
11 December 2011
Explore the grid for accuracy.
For example, change the color of zero (theoretically the water surface) to bright yellow to see if the Relative Water Surface Elevation grid values reflect the true water surface.
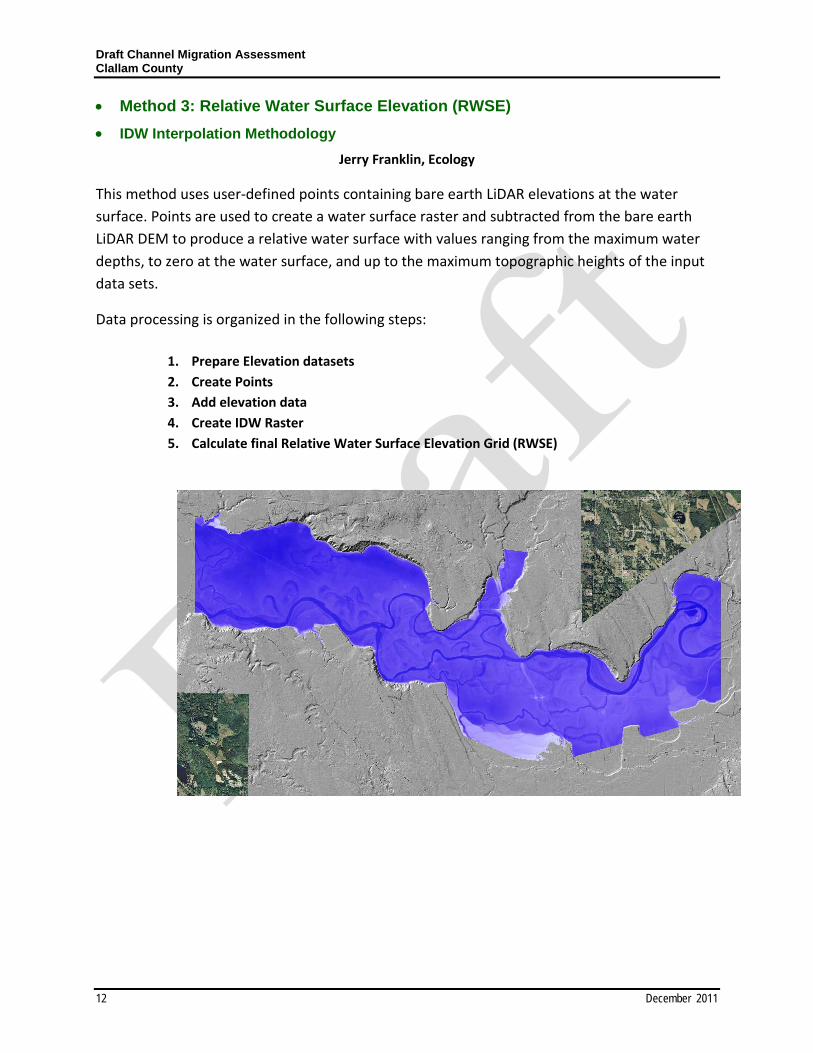
Draft Channel Migration Assessment Clallam County
12 December 2011
• Method 3: Relative Water Surface Elevation (RWSE) • IDW Interpolation Methodology
Jerry Franklin, Ecology
This method uses user-defined points containing bare earth LiDAR elevations at the water surface. Points are used to create a water surface raster and subtracted from the bare earth LiDAR DEM to produce a relative water surface with values ranging from the maximum water depths, to zero at the water surface, and up to the maximum topographic heights of the input data sets.
Data processing is organized in the following steps:
1. Prepare Elevation datasets 2. Create Points 3. Add elevation data 4. Create IDW Raster 5. Calculate final Relative Water Surface Elevation Grid (RWSE)
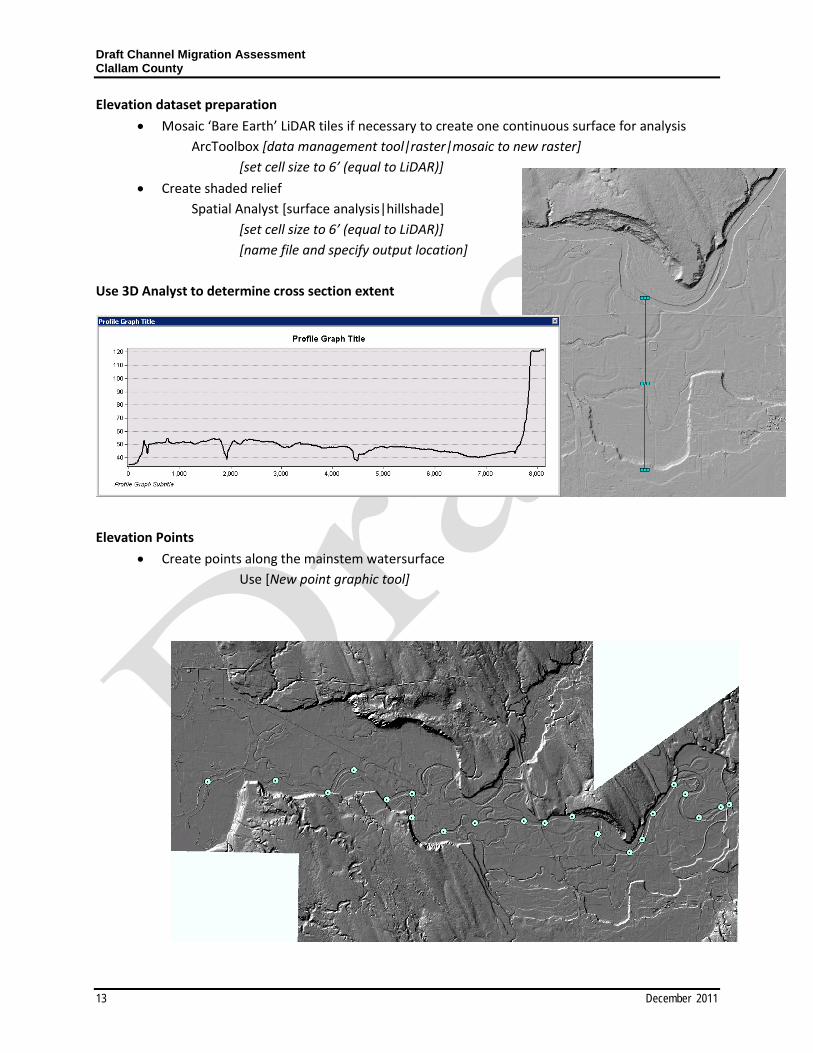
Draft Channel Migration Assessment Clallam County
13 December 2011
Elevation dataset preparation
• Mosaic ‘Bare Earth’ LiDAR tiles if necessary to create one continuous surface for analysis ArcToolbox [data management tool|raster|mosaic to new raster] [set cell size to 6’ (equal to LiDAR)]
• Create shaded relief Spatial Analyst [surface analysis|hillshade] [set cell size to 6’ (equal to LiDAR)]
[name file and specify output location] Use 3D Analyst to determine cross section extent Elevation Points
• Create points along the mainstem watersurface Use [New point graphic tool]
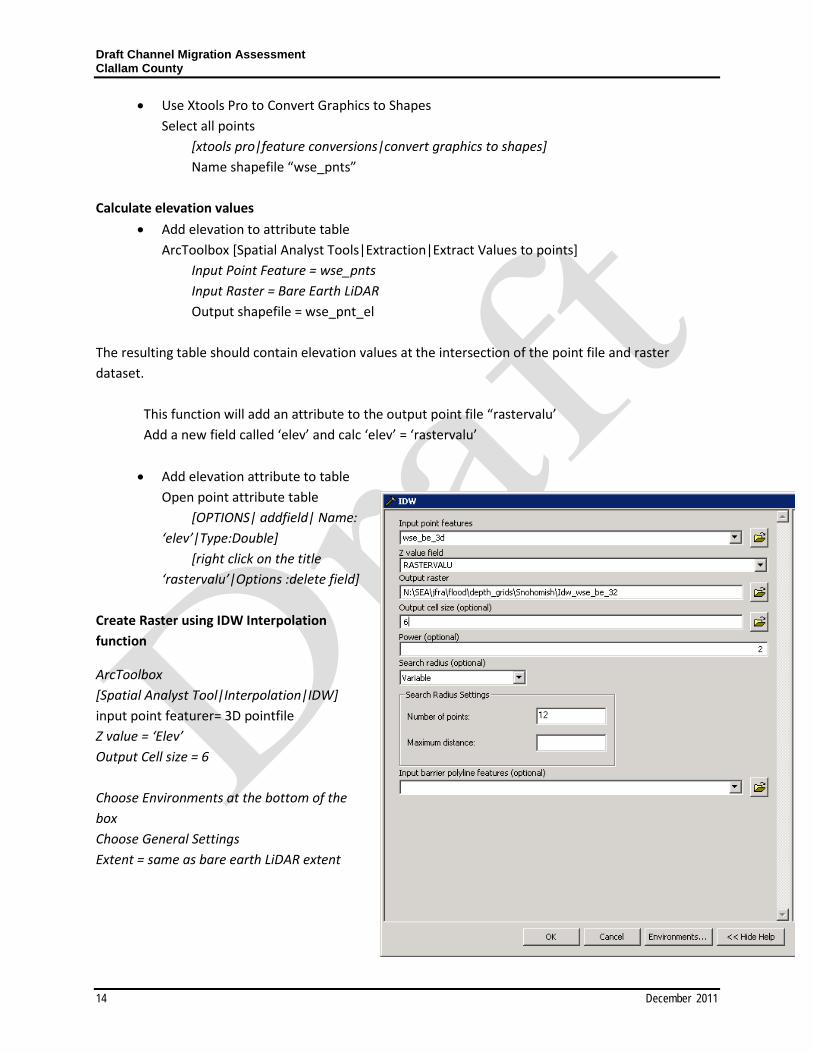
Draft Channel Migration Assessment Clallam County
14 December 2011
• Use Xtools Pro to Convert Graphics to Shapes Select all points
[xtools pro|feature conversions|convert graphics to shapes] Name shapefile “wse_pnts”
Calculate elevation values
• Add elevation to attribute table ArcToolbox [Spatial Analyst Tools|Extraction|Extract Values to points]
Input Point Feature = wse_pnts Input Raster = Bare Earth LiDAR
Output shapefile = wse_pnt_el The resulting table should contain elevation values at the intersection of the point file and raster dataset.
This function will add an attribute to the output point file “rastervalu’ Add a new field called ‘elev’ and calc ‘elev’ = ‘rastervalu’
• Add elevation attribute to table Open point attribute table
[OPTIONS| addfield| Name: ‘elev’|Type:Double]
[right click on the title ‘rastervalu’|Options :delete field]
Create Raster using IDW Interpolation function
ArcToolbox [Spatial Analyst Tool|Interpolation|IDW] input point featurer= 3D pointfile Z value = ‘Elev’ Output Cell size = 6 Choose Environments at the bottom of the box Choose General Settings Extent = same as bare earth LiDAR extent
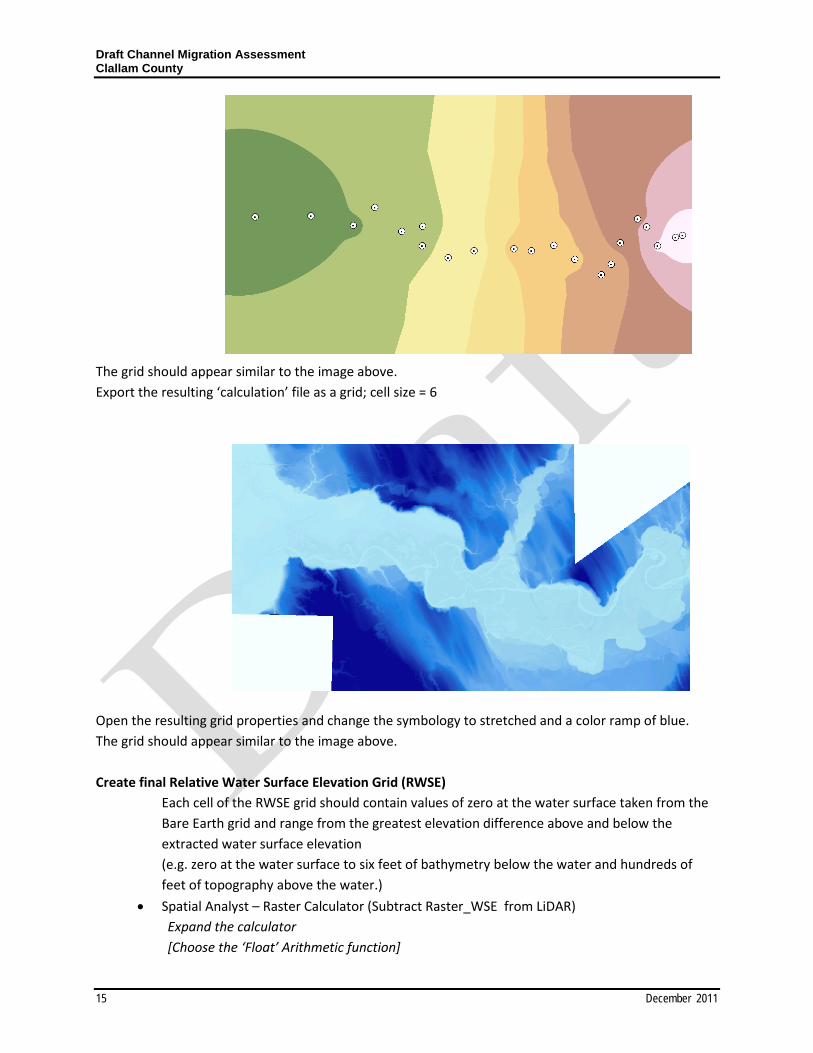
Draft Channel Migration Assessment Clallam County
15 December 2011
The grid should appear similar to the image above. Export the resulting ‘calculation’ file as a grid; cell size = 6
Open the resulting grid properties and change the symbology to stretched and a color ramp of blue. The grid should appear similar to the image above. Create final Relative Water Surface Elevation Grid (RWSE)
Each cell of the RWSE grid should contain values of zero at the water surface taken from the Bare Earth grid and range from the greatest elevation difference above and below the extracted water surface elevation (e.g. zero at the water surface to six feet of bathymetry below the water and hundreds of feet of topography above the water.)
• Spatial Analyst – Raster Calculator (Subtract Raster_WSE from LiDAR) Expand the calculator [Choose the ‘Float’ Arithmetic function]
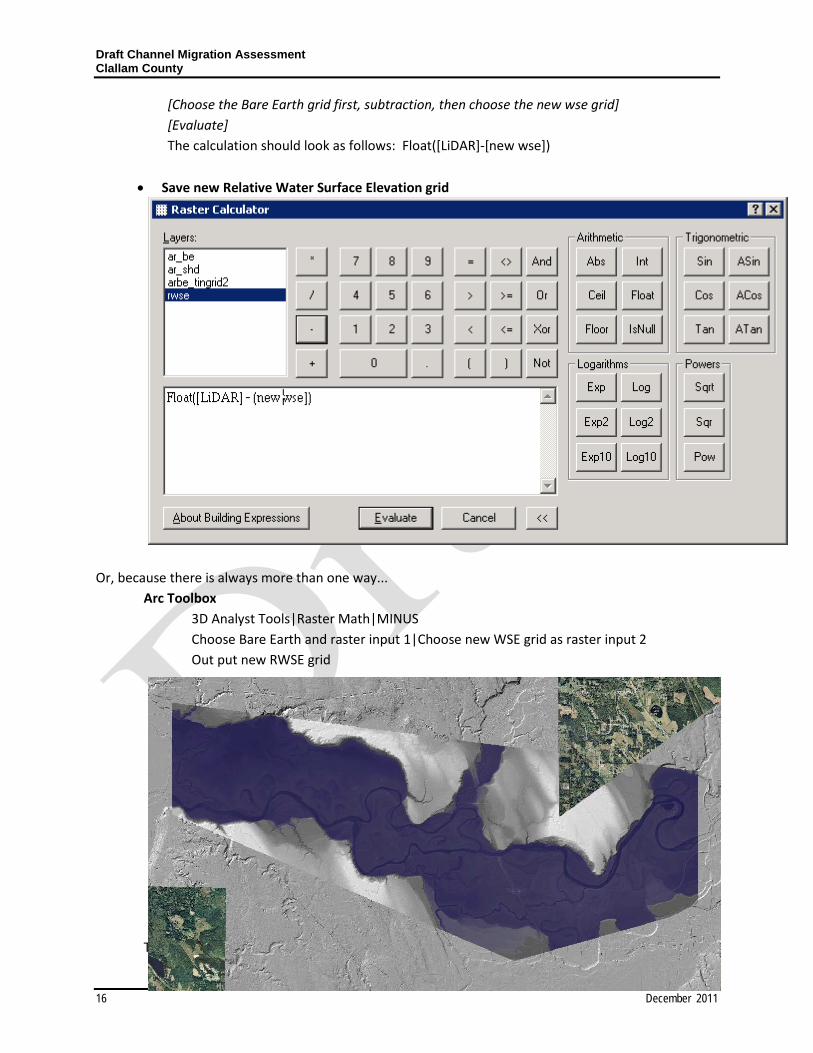
Draft Channel Migration Assessment Clallam County
16 December 2011
[Choose the Bare Earth grid first, subtraction, then choose the new wse grid] [Evaluate] The calculation should look as follows: Float([LiDAR]-[new wse])
• Save new Relative Water Surface Elevation grid Right click on the calculation grid in the Table of Contents and select “Make Permanent”
Or, because there is always more than one way...
Arc Toolbox 3D Analyst Tools|Raster Math|MINUS
Choose Bare Earth and raster input 1|Choose new WSE grid as raster input 2 Out put new RWSE grid
The grid should appear similar to the image above.
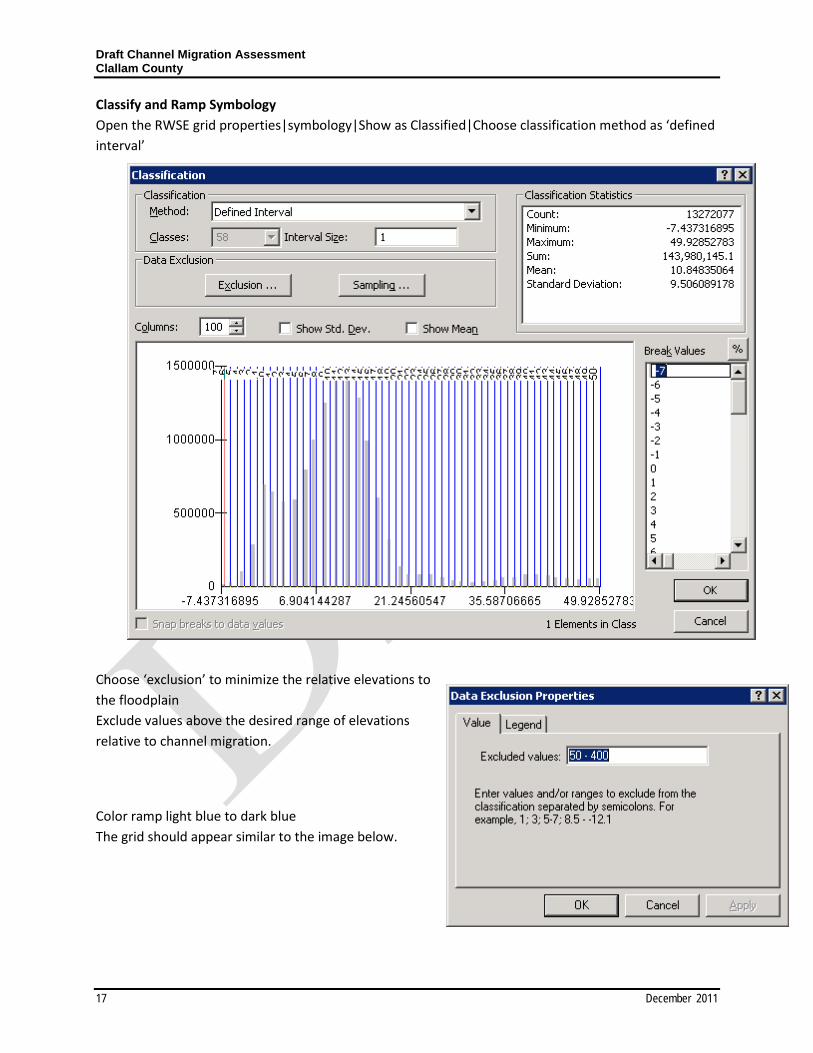
Draft Channel Migration Assessment Clallam County
17 December 2011
Classify and Ramp Symbology Open the RWSE grid properties|symbology|Show as Classified|Choose classification method as ‘defined interval’ Choose ‘exclusion’ to minimize the relative elevations to the floodplain Exclude values above the desired range of elevations relative to channel migration.
Color ramp light blue to dark blue The grid should appear similar to the image below.
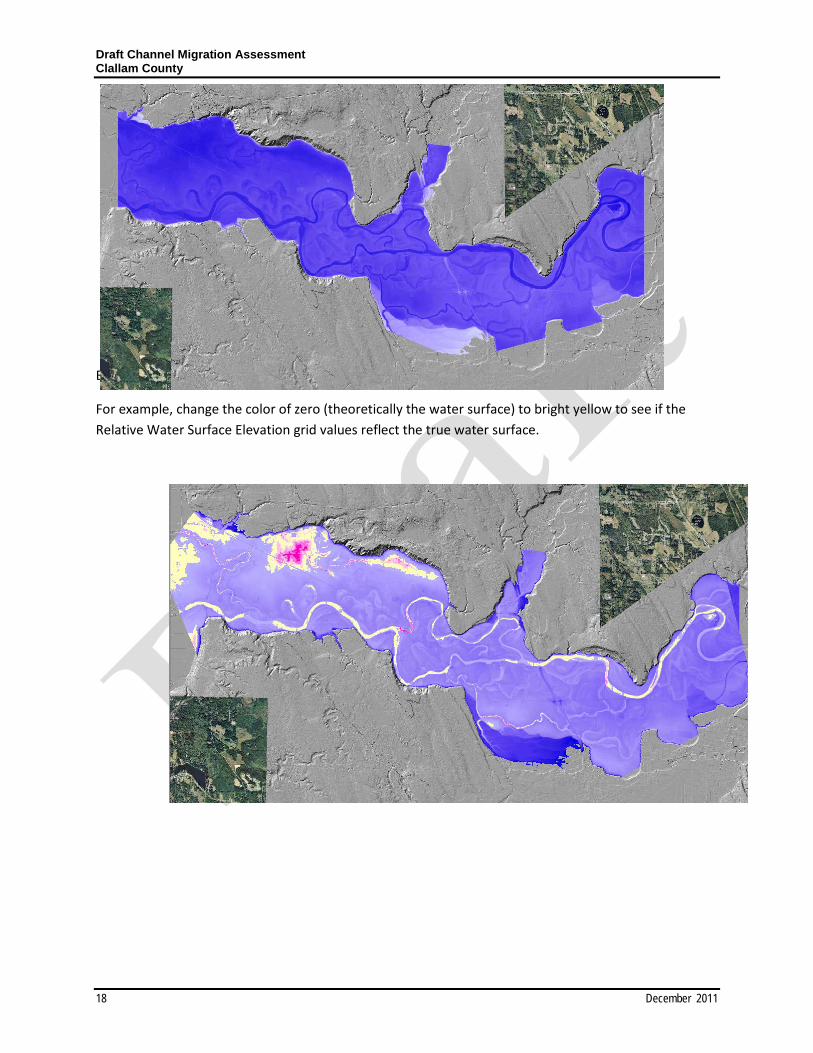
Draft Channel Migration Assessment Clallam County
18 December 2011
Explore the grid for accuracy.
For example, change the color of zero (theoretically the water surface) to bright yellow to see if the Relative Water Surface Elevation grid values reflect the true water surface.