Embed Size (px)
Citation preview

D R A F T M E M O R A N D U M
To: Joe Speaks, CH2M
From: Darin Smith and Matt Loftis
Subject: Secondary Costs Analysis for RAB Alternatives
Date: August 14, 2017
Working on a consultant team led by CH2M Hill, Economic & Planning
Systems, Inc. (EPS) has prepared this memorandum to evaluate the
potential implications of various rail alignments for the City of San
Francisco’s RAB study. This document is designed to help illustrate
selected cost impacts associated with identified RAB alignments. The
analysis contained herein does not take into consideration construction
or operating costs of the various rail alignments, rather it quantifies
costs associated with construction disruption, property loss, and changes
in travel time. The three levels of impacts examined in this memo are
explained further below:
Temporary Construction Disruption Costs:
o Impacts that street closures will have on aggregate travel
times.
o Loss of parking revenues associated with street closures.
Grade Separation Impacts:
o Impacts that various grade separation configurations will
have on aggregate travel times.
o Diminished property values associated with lost street
frontage.
o Lost bonding potential from diminished property tax
proceeds.
Train Travel Time Impacts
o Value of potential time savings achieved through theMission Bay alignment that would otherwise not be
realized through the DTX or Pennsylvania alignments.
page D-35

Draft Memorandum August 14, 2017
Secondary Costs Analysis of RAB Alternatives Page 2
P:\141000s\141018 4thKingRAB\Report\141018_Phase 2 Memo_08.14.17.docx
Summar y o f F ind ings
1. Construction of the DTX “Cut and Cover” project is expected to last six to seven years and would result in significant disruption costs. Construction of this nature would require street closures of 12 city blocks for 6 months each. These closures would result in increased travel times for individuals moving to and from adjacent properties, as well as through the affected area. EPS estimates that this additional travel time would represent approximately $88 million in productivity losses over the construction period
(in Year 2026 dollars). In addition to this, the City of San Francisco would lose out on another $720,000 in on-street parking revenue during this construction period.
2. There is considerable variation in vehicle travel times associated with grade separation scenarios for the DTX (Future with Surface Rail) and Pennsylvania
Avenue alignments. A scenario in which 16th Street becomes an underpass beneath
Caltrain and HSR at the current surface grade would perform the best from a vehicle travel time savings standpoint when compared to its alternatives, and even improves
upon existing conditions. Alternatively, running HSR on the surface with the existing at-
grade street configuration would result in substantial delays and productivity losses
(see Table 3).
3. If the City elects to undergo a grade separation strategy that trenches intersections and allows HSR to run on the surface, some property owners will lose a portion of their site’s accessibility and value. EPS estimates that in all, 57 such parcels would be affected by trenching along 16th Street, 7th Street, and Mission Bay Drive. The combined assessed property value loss for all of the affected parcels is estimated to total approximately $114 million. This diminished property value will decrease the City’s bonding ability by approximately $8.3 million in 2026 dollars.
4. Due to differences in the physical characteristics and alignment of the rail alternatives, the Mission Bay alignment will generate rail travel time savings and associated productivity gains compared to the DTX or Pennsylvania Avenue alignments. It is estimated that the Mission Bay alignment will result in travel time savings of 0.35 minutes and 0.3 minutes for Caltrain and HSR respectively. With this time savings applied to millions of annual riders, the annual aggregate time savings is significant. Annually, EPS estimates that roughly 93,000 hours would be saved through the Mission Bay alignment compared to the DTX and Pennsylvania Avenue alignments. This represents an annual value of times savings of $1.6 million, and more than $80 million when applied to a period of 50 years (in 2026 dollars).
page D-36

Draft Memorandum August 14, 2017
Secondary Costs Analysis of RAB Alternatives Page 3
P:\141000s\141018 4thKingRAB\Report\141018_Phase 2 Memo_08.14.17.docx
Tempo ra ry Cons t ruc t io n D i sr upt io n Co s t s
This section of the memorandum seeks to quantify the costs associated with the nature and
length of physical construction of high speed rail infrastructure. Information provided to EPS
indicates that the construction of the DTX “Cut and Cover” project will occur over a duration of 7
years.1 The construction will be phased and will affect each impacted city block for a period of
six months. Furthermore, through conversations with the larger consulting team, EPS assumes
that construction will begin in the year 2019 and will be complete in the year 2025.
This construction endeavor will result in the closure of existing streets and will therefore have
measureable impacts on travel times. In particular, individuals that currently move through this
project area will likely experience longer travel times as a result of street-closures. Travel time
increases have an adverse effect on a region’s economic output as delays impact productivity.
Table 1 below summarizes these travel time impacts by project year and monetizes the value of
lost time. The annual travel time delay inputs for this analysis were provided by Fehr & Peers.
It is important to note that the travel time delays shown are derived from estimating the number
of trips to destinations on the affected streets, and are not representative of any aggregated
system-wide travel delays. That being said, this approach is conservative in nature and the
reality is that additional system-wide delays will likely occur. This analysis is consistent with the
framework laid out by the United States Department of Transportation for monetizing travel time
savings or losses. As planned, disruption associated with the DTX “Cut and Cover” project is
estimated to result in a loss of approximately $65.5 million, or $88 million in year-2026 dollars. .
Table 1 DTX Cut and Cover Construction Travel Time Impacts
1 EPS is not estimating potential travel time delays from construction of the Mission Bay alignment.
The deep tunneling nature of the Mission Bay alignment will likely have significantly less impact on
surface disruption.
Business Personal Total Business Personal Total
4.6% 95.4% $24.90/ hr $12.90/ hr
1 2019 30,736 637,446 668,182 -$765,336 -$8,223,049 -$8,988,384
2 2020 31,155 646,118 677,273 -$775,748 -$8,334,928 -$9,110,676
3 2021 31,573 654,791 686,364 -$786,161 -$8,446,807 -$9,232,969
4 2022 31,991 663,464 695,455 -$796,574 -$8,558,687 -$9,355,261
5 2023 32,409 672,136 704,545 -$806,986 -$8,670,553 -$9,477,539
6 2024 32,827 680,809 713,636 -$817,399 -$8,782,433 -$9,599,831
7 2025 33,245 689,482 722,727 -$827,812 -$8,894,312 -$9,722,124
Total (2016$) 223,936 4,644,246 4,868,182 -$5,576,016 -$59,910,769 -$65,486,784
Total (2026$) -$7,493,699 -$80,515,063 -$88,008,762
Sources: CH2M Hill, Fehr and Peers; US Department of Transportation; Economic & Plannings Systems.
Calendar
Year
Construction
Year
Annual Delay Time (Hrs) Cost of Delayed Time
page D-37
Draft Memorandum August 14, 2017
Secondary Costs Analysis of RAB Alternatives Page 4
P:\141000s\141018 4thKingRAB\Report\141018_Phase 2 Memo_08.14.17.docx
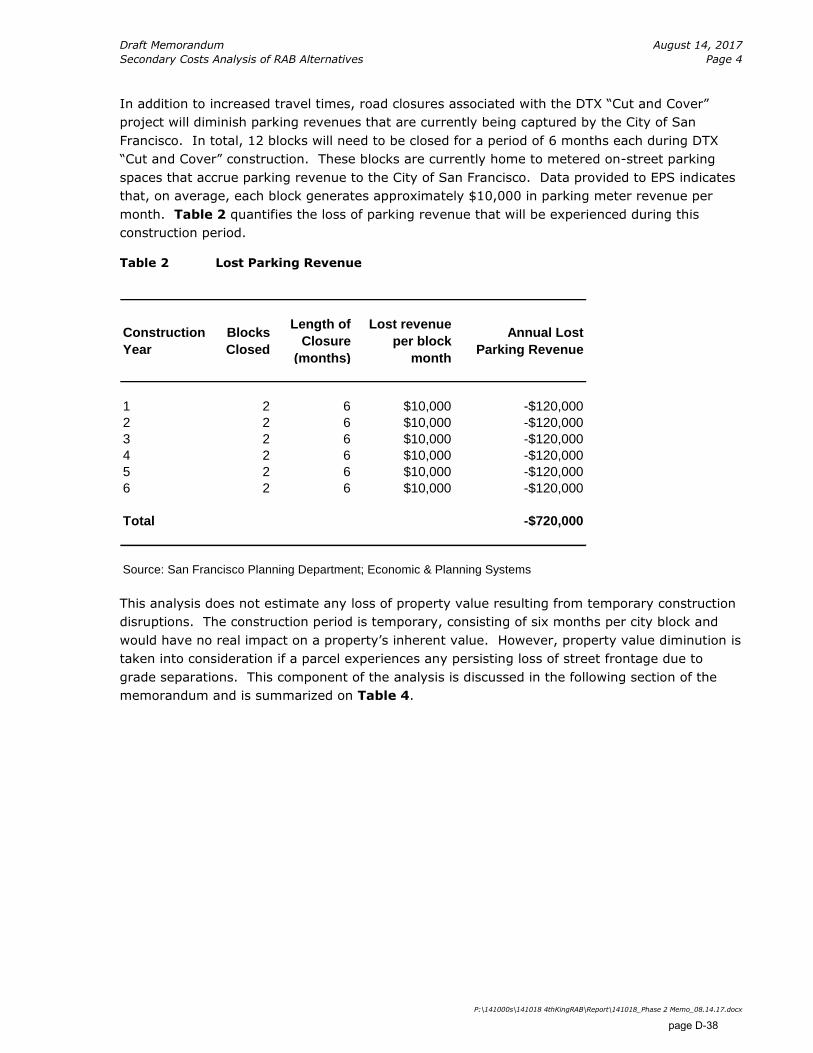
In addition to increased travel times, road closures associated with the DTX “Cut and Cover”
project will diminish parking revenues that are currently being captured by the City of San
Francisco. In total, 12 blocks will need to be closed for a period of 6 months each during DTX
“Cut and Cover” construction. These blocks are currently home to metered on-street parking
spaces that accrue parking revenue to the City of San Francisco. Data provided to EPS indicates
that, on average, each block generates approximately $10,000 in parking meter revenue per
month. Table 2 quantifies the loss of parking revenue that will be experienced during this
construction period.
Table 2 Lost Parking Revenue
This analysis does not estimate any loss of property value resulting from temporary construction
disruptions. The construction period is temporary, consisting of six months per city block and
would have no real impact on a property’s inherent value. However, property value diminution is
taken into consideration if a parcel experiences any persisting loss of street frontage due to
grade separations. This component of the analysis is discussed in the following section of the
memorandum and is summarized on Table 4.
Construction
Year
Blocks
Closed
Length of
Closure
(months)
Lost revenue
per block
month
Annual Lost
Parking Revenue
1 2 6 $10,000 -$120,000
2 2 6 $10,000 -$120,000
3 2 6 $10,000 -$120,000
4 2 6 $10,000 -$120,000
5 2 6 $10,000 -$120,000
6 2 6 $10,000 -$120,000
Total -$720,000
Source: San Francisco Planning Department; Economic & Planning Systems
page D-38

Draft Memorandum August 14, 2017
Secondary Costs Analysis of RAB Alternatives Page 5
P:\141000s\141018 4thKingRAB\Report\141018_Phase 2 Memo_08.14.17.docx
Gr ade Separ at io n I mpact s
Similar to the disruption costs described above, grade separation will have measurable economic
implications on both local transportation and land values. At present, trains regularly disrupt
traffic flow at at-grade crossings. With train traffic increasing through diminished Caltrain
headways and the introduction of high speed rail, the number of automobiles being delayed
would be expected to increase after project buildout and further contribute to time and
productivity loss within San Francisco if there continue to be at-grade crossings. Alternatively,
new grade separations would allow traffic to move freely even with trains present, and would
represent an improvement over existing conditions. The vehicle travel time changes associated
with each alternative have been contrasted with existing conditions and are shown on Table 3.
In order to calculate travel time impacts, Fehr & Peers provided EPS with average daily
automobile delays corresponding to the possible future scenarios. Approximate daily automobile
delay was given in hours for each alternative for the year 2030. Additionally, delay time was
provided for the year 2016 under the existing configuration without electrification or HSR. EPS
assumed that no travel times savings differences would be achieved until the infrastructure
project is complete in the year 2026. After infrastructure buildout, the growth in average daily
delay time has been extrapolated linearly to account for expected general population and trip
generation growth.
Unlike construction disruption impacts, travel time delays will be ongoing and will persist, and
increase, for the duration of the planned infrastructure. To represent these ongoing costs, EPS
has estimated the travel time implications for each alternative over a period of 50 years after
HSR service begins. Each alternative is benchmarked against the projected travel time impacts
of the existing configuration without high speed rail. Unsurprisingly, the existing configuration
with high speed rail and at-grade crossings is the only alternative that will experience travel time
increases above and beyond the baseline conditions. This is due to the greater frequency of
train movements through the study area and the increasing events of at-grade rail crossings.
Please note that these comparisons account only for the differences between potential
configurations of Caltrain and HSR through either the DTX or Pennsylvania Avenue alignment.
The findings shown below do not account for any time savings that could presumably be
achieved through the Mission Bay alignment, which may eliminate existing at-grade crossings
and associated delays.
page D-39

Draft Memorandum August 14, 2017
Secondary Costs Analysis of RAB Alternatives Page 6
P:\141000s\141018 4thKingRAB\Report\141018_Phase 2 Memo_08.14.17.docx
Table 3 Grade Separation Travel Time Impacts
Calendar
Year
Existing At-
Grade
Crossings
without HSR
Existing At-
Grade Crossing
with HR
16th St.
Underpass
Below Rail At-
Grade
Rail
Underground
with 16th St. At-
Grade
Existing At-
Grade
Crossings
without HSR
Existing At-
Grade Crossing
with HR
16th St.
Underpass Below
Rail At-Grade
Rail
Underground
with 16th St. At-
Grade
2026 1,036 1,243 621 746 $3,482,589 $4,179,107 $2,089,554 $2,507,464
2027 1,089 1,307 654 784 $3,662,723 $4,395,268 $2,197,634 $2,637,161
2028 1,143 1,371 686 823 $3,842,857 $4,611,429 $2,305,714 $2,766,857
2029 1,196 1,436 718 861 $4,022,991 $4,827,589 $2,413,795 $2,896,554
2030 1,250 1,500 750 900 $4,203,125 $5,043,750 $2,521,875 $3,026,250
2031 1,304 1,564 782 939 $4,383,259 $5,259,911 $2,629,955 $3,155,946
2032 1,357 1,629 814 977 $4,563,393 $5,476,071 $2,738,036 $3,285,643
2033 1,411 1,693 846 1,016 $4,743,527 $5,692,232 $2,846,116 $3,415,339
2034 1,464 1,757 879 1,054 $4,923,661 $5,908,393 $2,954,196 $3,545,036
2035 1,518 1,821 911 1,093 $5,103,795 $6,124,554 $3,062,277 $3,674,732
2036 1,571 1,886 943 1,131 $5,283,929 $6,340,714 $3,170,357 $3,804,429
2037 1,625 1,950 975 1,170 $5,464,063 $6,556,875 $3,278,438 $3,934,125
2038 1,679 2,014 1,007 1,209 $5,644,196 $6,773,036 $3,386,518 $4,063,821
2039 1,732 2,079 1,039 1,247 $5,824,330 $6,989,196 $3,494,598 $4,193,518
2040 1,786 2,143 1,071 1,286 $6,004,464 $7,205,357 $3,602,679 $4,323,214
2041 1,839 2,207 1,104 1,324 $6,184,598 $7,421,518 $3,710,759 $4,452,911
2042 1,893 2,271 1,136 1,363 $6,364,732 $7,637,679 $3,818,839 $4,582,607
2043 1,946 2,336 1,168 1,401 $6,544,866 $7,853,839 $3,926,920 $4,712,304
2044 2,000 2,400 1,200 1,440 $6,725,000 $8,070,000 $4,035,000 $4,842,000
2045 2,054 2,464 1,232 1,479 $6,905,134 $8,286,161 $4,143,080 $4,971,696
2046 2,107 2,529 1,264 1,517 $7,085,268 $8,502,321 $4,251,161 $5,101,393
2047 2,161 2,593 1,296 1,556 $7,265,402 $8,718,482 $4,359,241 $5,231,089
2048 2,214 2,657 1,329 1,594 $7,445,536 $8,934,643 $4,467,321 $5,360,786
2049 2,268 2,721 1,361 1,633 $7,625,670 $9,150,804 $4,575,402 $5,490,482
2050 2,321 2,786 1,393 1,671 $7,805,804 $9,366,964 $4,683,482 $5,620,179
2051 2,375 2,850 1,425 1,710 $7,985,938 $9,583,125 $4,791,563 $5,749,875
2052 2,429 2,914 1,457 1,749 $8,166,071 $9,799,286 $4,899,643 $5,879,571
2053 2,482 2,979 1,489 1,787 $8,346,205 $10,015,446 $5,007,723 $6,009,268
2054 2,536 3,043 1,521 1,826 $8,526,339 $10,231,607 $5,115,804 $6,138,964
2055 2,589 3,107 1,554 1,864 $8,706,473 $10,447,768 $5,223,884 $6,268,661
2056 2,643 3,171 1,586 1,903 $8,886,607 $10,663,929 $5,331,964 $6,398,357
2057 2,696 3,236 1,618 1,941 $9,066,741 $10,880,089 $5,440,045 $6,528,054
2058 2,750 3,300 1,650 1,980 $9,246,875 $11,096,250 $5,548,125 $6,657,750
2059 2,804 3,364 1,682 2,019 $9,427,009 $11,312,411 $5,656,205 $6,787,446
2060 2,857 3,429 1,714 2,057 $9,607,143 $11,528,571 $5,764,286 $6,917,143
2061 2,911 3,493 1,746 2,096 $9,787,277 $11,744,732 $5,872,366 $7,046,839
2062 2,964 3,557 1,779 2,134 $9,967,411 $11,960,893 $5,980,446 $7,176,536
2063 3,018 3,621 1,811 2,173 $10,147,545 $12,177,054 $6,088,527 $7,306,232
2064 3,071 3,686 1,843 2,211 $10,327,679 $12,393,214 $6,196,607 $7,435,929
2065 3,125 3,750 1,875 2,250 $10,507,813 $12,609,375 $6,304,688 $7,565,625
2066 3,179 3,814 1,907 2,289 $10,687,946 $12,825,536 $6,412,768 $7,695,321
2067 3,232 3,879 1,939 2,327 $10,868,080 $13,041,696 $6,520,848 $7,825,018
2068 3,286 3,943 1,971 2,366 $11,048,214 $13,257,857 $6,628,929 $7,954,714
2069 3,339 4,007 2,004 2,404 $11,228,348 $13,474,018 $6,737,009 $8,084,411
2070 3,393 4,071 2,036 2,443 $11,408,482 $13,690,179 $6,845,089 $8,214,107
2071 3,446 4,136 2,068 2,481 $11,588,616 $13,906,339 $6,953,170 $8,343,804
2072 3,500 4,200 2,100 2,520 $11,768,750 $14,122,500 $7,061,250 $8,473,500
2073 3,554 4,264 2,132 2,559 $11,948,884 $14,338,661 $7,169,330 $8,603,196
2074 3,607 4,329 2,164 2,597 $12,129,018 $14,554,821 $7,277,411 $8,732,893
2075 3,661 4,393 2,196 2,636 $12,309,152 $14,770,982 $7,385,491 $8,862,589
Total 2026 - 2075 (in 2016$) $394,793,527 $473,752,232 $236,876,116 $284,251,339
Total 2026 - 2075 (in 2026$) $530,569,487 $636,683,385 $318,341,692 $382,010,031
Savings Compared to Existing At-Grade without HSR -$106,113,897 $212,227,795 $148,559,456
Sources: Fehr & Peers; US Department of Transportation; Economic & Planning Systems.
Daily Travel Time Delay (hours)1
Annual Travel Time Costs2
[1] Fehr & Peers provided daily automobile delay estimates for the years 2016 and 2030. EPS has extrapolated this delay time linearly to adjust for future
delays associated with additional vehicular traffic over time.
[2] EPS is using the US DOT standard for monetized value of time of $13.45 per hour. This is a blended figure that includes both personal and business
travel. Additionally, EPS is using an annualization factor of 250 days per year, consistent with other ongoing studies in San Francisco.
page D-40

Draft Memorandum August 14, 2017
Secondary Costs Analysis of RAB Alternatives Page 7
P:\141000s\141018 4thKingRAB\Report\141018_Phase 2 Memo_08.14.17.docx
As demonstrated in the previous table, a grade separation in which 16th Street is converted to an
underpass beneath rail tracks at the current grade would enjoy the greatest travel time benefits
of any of the identified alternatives. However, for this alternative to function effectively, the City
has indicated that reconfigurations would be required to both 16th Street and 7th Street. The
Department of Public Works and the Planning Department have indicated that 7th Street would be
depressed in a “trench” from roughly Brannan Street on the north to Hubbell Street on the south,
before returning to the current grade level as it crosses over 16th Street. To achieve a grade
separation at 7th and 16th, 16th Street would itself be depressed in a trench from roughly
Wisconsin Street to 4th Street. A trenching project of this nature would result in significant loss
of street frontage for many property owners within the study area. The reduction of street
frontage would likely be detrimental to property values as it would reduce a parcel’s accessibility.
While forecasting the exact diminution of property value that would result from this trenching
project is impossible, EPS has developed a conservative methodology to estimate the general
order of magnitude of lost property value. This methodology is based on two primary principles:
1) there is a relationship between the percentage of lost street frontage and the corresponding
reduction in property value, and 2) any given site will maintain its inherent land value regardless
of frontage lost. That being said, EPS assumes that the percent of street frontage lost is directly
proportional to the percent of property value diminution. Furthermore, EPS is using a
conservative assumption that even if a parcel loses its entire street frontage and associated
access points, it can still be sold to an adjacent land owner for a potential expansion or
redevelopment project, thus maintaining its land value. For example, a property that has an
assessed value of $20 million, split evenly between “land value” and “improvement value” ($10
million each) and suffering a 50 percent reduction in street frontage is assumed to have a new
value of $15 million ($10 million land value remains plus 50 percent of the $10 million
improvement value). Table 4 illustrates that a future trenching project of this magnitude would
result in approximately $114 million of diminished property value. Figure 1 provides a visual
representation of the affected parcels that are aggregated in the table below.
Table 4 Diminished Property Value from Trenching Project
Percent of Frontage
Lost
# of
Parcels
Aggregated Loss of
Value
0-24% 33 -$26,276,577
25-49% 9 -$37,060,400
50-74% 12 -$50,225,058
75-100% 3 -$365,958
Total 57 -$113,927,993
Source: San Francisco Department of Public Works; Economic
& Planning Systems
page D-41

Draft Memorandum August 14, 2017
Secondary Costs Analysis of RAB Alternatives Page 8
P:\141000s\141018 4thKingRAB\Report\141018_Phase 2 Memo_08.14.17.docx
Figure 1 Parcels Impacted by Trenching Project
page D-42

Draft Memorandum August 14, 2017
Secondary Costs Analysis of RAB Alternatives Page 9
P:\141000s\141018 4thKingRAB\Report\141018_Phase 2 Memo_08.14.17.docx
The reduction in property value that would be experienced through the grade separation
trenching project would adversely impact the City’s available bonding potential as the City would
lose access to critical tax revenues from which a bond could be repaid. EPS estimates this lost
bonding potential at approximately $8.3 million in Year 2026 dollars – the timeframe used by
CH2M Hill and the City to estimate RAB construction costs.
Table 5 Lost Bonding Potential from Diminished Property Values
Fut ur e Tr a in T r ave l T ime Sav ings
Due to differences in track curves, vertical changes, and other factors, the alternative rail
alignments have different implications for the pace at which trains can reach their destinations.
These train speed differences can be critical in HSR achieving its planned trip duration from San
Francisco to Los Angeles, and also can mean significant value for its riders. According to CH2M
Hill, there is no difference between the travel time savings for Caltrain or HSR between the DTX
and Pennsylvania alignments. However, the Mission Bay alignment would achieve modest time
savings per trip when compared to its alternatives.
Table 6 below documents the calculations of annual time savings for the Mission Bay alignment
and monetizes this time based on USDOT standards. EPS estimates this monetary value of time
savings to be $1.2 million annually in 2016 dollars. This figure is shown as a positive value as it
represents the time savings associated with the Mission Bay alternative. Alternatively, this figure
could be looked at as an opportunity cost for either the DTX or Pennsylvania alignments. When
valued in 2026 dollars over a 50-year period, the travel time savings of the Mission Bay
alignment is approximately $81.8 million.
Item Value
2021 Property Loss Associated
with Trenching-$113,927,993
Lost Annual Property Tax
General Fund Share1 -$634,351
Lost Bonding Potential 2016$2
-$6,343,511
Lost Bonding Potential 2026$ -$8,276,843
[1] Assuming 55.68 percent of the 1 percent annual tax
levy to the City's General Fund.
[2] According to City sources, bonding potential is equal to
10 times that of annual revenue.
page D-43

Draft Memorandum August 14, 2017
Secondary Costs Analysis of RAB Alternatives Page 10
P:\141000s\141018 4thKingRAB\Report\141018_Phase 2 Memo_08.14.17.docx
Table 6 Mission Bay Train Travel Time Savings
Item Caltrain HSR Total
Travel Time Savings (minutes per trip) 0.35 0.30
Daily Riders at Buildout 31,500 35,460 66,960
Annual Riders at Buildout1
7,875,000 8,865,000 16,740,000
Annual Time Savings (Hrs) 45,938 44,325 90,263
Annual Value of Time Savings (2016$)2
$619,697 $597,944 $1,217,641
Annual Value of Time Savings (2026$) $832,821 $803,587 $1,636,408
Value over 50 Years (in 2026$) $41,641,039 $40,179,354 $81,820,393
Sources: CH2M Hill; US DOT; Economic & Planning Systems
[1] Reflects annualization factor of 250 day per year, consistent with other ongoing studies in San
Francisco
[2] Based on the US DOT standard for monetized value of time of $13.45 per hour
page D-44
![contenthub.bvsd.org Course... · Web viewDRAFT. DRAFT. DRAFT. DRAFT. DRAFT. DRAFT. DRAFT. DRAFT. DRAFT. DRAFT. DRAFT. DRAFT. 12/28/2015BVSD Curriculum Essentials32 [Course Name]](https://img.pdfslide.net/doc/110x75/5e38c5b23f41ba01b81b757e/course-web-view-draft-draft-draft-draft-draft-draft-draft-draft-draft.jpg)


![contenthub.bvsd.org Course... · Web viewDRAFT. DRAFT. DRAFT. DRAFT. DRAFT. DRAFT. DRAFT. DRAFT. DRAFT. DRAFT. DRAFT. DRAFT. 6/15/2016BVSD Curriculum Essentials44 [Course Name] Curriculum](https://img.pdfslide.net/doc/110x75/5a9eefd17f8b9a67178c19c5/doc-courseweb-viewdraft-draft-draft-draft-draft-draft-draft-draft-draft.jpg)