Embed Size (px)
Citation preview


DISCLAIMER STATEMENT
This document is disseminated in the interest of information exchange. The contents of this report reflect the views of the authors who are responsible for the facts and accuracy of the data presented herein. The contents do not necessarily reflect the official views or policies of the State of California or the Federal Highway Administration. This publication does not constitute a standard, specification or regulation. This report does not constitute an endorsement by the Department of any product described herein.
For individuals with sensory disabilities, this document is available in alternate formats. For information, call (916) 654-8899, TTY 711, or write to California Department of Transportation, Division of Research, Innovation and System Information, MS-83, P.O. Box 942873, Sacramento, CA 94273-0001.
CALIFORNIA PATH PROGRAM INSTITUTE OF TRANSPORTATION STUDIES UNIVERSITY OF CALIFORNIA, BERKELEY
Congestion-Responsive On-Ramp Metering: Before and After Studies – Phase 1 Michael Mauch Xiao-Yun Lu Alexander Skabardonis California PATH Research Report UCB-ITS-PRR-2016-01 This work was performed as part of the California PATH program of the University of California, in cooperation with the State of California Business, Transportation and Housing Agency, Department of Transportation, and the United States Department of Transportation, Federal Highway Administration. The contents of this report reflect the views of the authors who are responsible for the facts and accuracy of the data presented herein. The contents do not necessarily reflect the official views or policies of the State of California. This publication does not constitute a standard, specification or regulation. Final Report for Agreement 65A0528 TO 005 July 06, 2016
CALIFORNIA PARTNERS FOR ADVANCED TRANSIT AND HIGHWAYS

ii
ABSTRACT
The objective of this project was to develop recommendations toward a statewide policy of congestion responsive freeway ramp metering operation. The research is performed in two phases. In phase 1, alternative ramp metering activation strategies were evaluated through simulation modeling on a real-world freeway test site. In Phase 2, “before” and “after” field data will be collected and analyzed on freeway test sites that have implemented congestion responsive ramp metering activation. This report describes the research performed in Phase 1 of the project.
A section of the US-101 freeway in the San Francisco Bay Area was selected as the test site. Field data on traffic and operational characteristics were collected and analyzed to establish the baseline operating conditions at the selected site. Several ramp metering activation strategies were simulated with the VISSIM microscopic model. The analysis of the simulation results showed that 24-7 ramp metering operation could improve the mainline freeway’s performance by increasing the average travel speeds, and reducing the overall corridor travel-times at the specific site. No significant changes were found on bottleneck discharge flows and the travel-time reliability.

iii
ACKNOWLEDGEMENTS
This work is being performed by the California Partners for Advanced Transportation Technology (PATH) Program at the University of California at Berkeley, in cooperation with the State of California Business, Transportation and Housing Agency, Department of Transportation (Caltrans), Division of Traffic Operations through the Interagency Agreement #65A0528 TO 005. The contents of this report reflect the views of the author, who is responsible for the facts and the accuracy of the data presented herein. The contents do not necessarily reflect the official views or policies of the State of California.
The authors wish to thank the project monitor Mr. Hassan Aboukhadijeh of Caltrans Division of Research & Innovation and Systems Information (DRISI) and the members of the technical advisory group (TAG) for their guidance and support during the project.

iv
DISCLAIMER STATEMENT
This document is disseminated in the interest of information exchange. The contents of this report reflect the views of the authors who are responsible for the facts and accuracy of the data presented herein. The contents do not necessarily reflect the official views or policies of the State of California or the Federal Highway Administration. This publication does not constitute a standard, specification or regulation. This report does not constitute an endorsement by the Department of any product described herein.
For individuals with sensory disabilities, this document is available in Braille, large print, audiocassette, or compact disk. To obtain a copy of this document in one of these alternate formats, please contact: the Division of Research and Innovation, MS-83, California Department of Transportation, P.O. Box 942873, Sacramento, CA 94273-0001.

v
TABLE OF CONTENTS
ABSTRACT ................................................................................................................................................. ii
ACKNOWLEDGEMENTS ...................................................................................................................... iii
LIST OF FIGURES .................................................................................................................................. vi
LIST OF TABLES ................................................................................................................................... vii
EXECUTIVE SUMMARY ....................................................................................................................... 1
1. INTRODUCTION ................................................................................................................................ 3
1.1 Problem Statement .................................................................................................................... 3
1.2 Objectives of the Study ............................................................................................................. 3
1.2 Overview of the Research Effort ............................................................................................... 3
1.4 Organization of the Report ....................................................................................................... 4
2. SITE SELECTION ............................................................................................................................... 5
2.1 Site Selection Process and Potential Demonstration Sites ........................................................ 5
2.2 The Selected Site – US-101 Northbound in San Mateo County ............................................... 7
3. EMPIRICAL STUDY AT SELECTED SITE ..................................................................................... 8
3.1 Ramp Metering Control Strategies on US-101 ......................................................................... 8
3.2 Data Sources for the Empirical Evaluation ............................................................................... 8
3.3 Traffic Demands – US-101 Northbound ................................................................................... 9
3.4 High Occupancy Vehicle Lanes and HOV Lane Utilization .................................................. 19
3.5 Corridor Bottlenecks and Congestion Patterns ....................................................................... 21
3.6 US-101 Northbound On-ramp Metering & PeMS Mainline Detector Occupancy ................. 24
4. SIMULATION MODELING ............................................................................................................. 31
4.1 Model Background ................................................................................................................. 31
4.2 Updating the US-101 Simulation Model & Model Refinements ............................................ 32
4.3 Calibration & Validation of the Updated US-101 Simulation Model ..................................... 34
4.4 US-101 Ramp Metering Simulation Model Results – Performance Measures ........................ 39
5. CONCLUSIONS ................................................................................................................................. 51
5.1 Summary of the Study Findings ............................................................................................. 51
5.2 Recommendations and Next Steps ......................................................................................... 51
REFERENCES .......................................................................................................................................... 53
APPENDIX A. ACTIVE RAMP METER LOCATIONS, US-101 IN SAN MATEO COUNTY .... 54

vi
LIST OF FIGURES
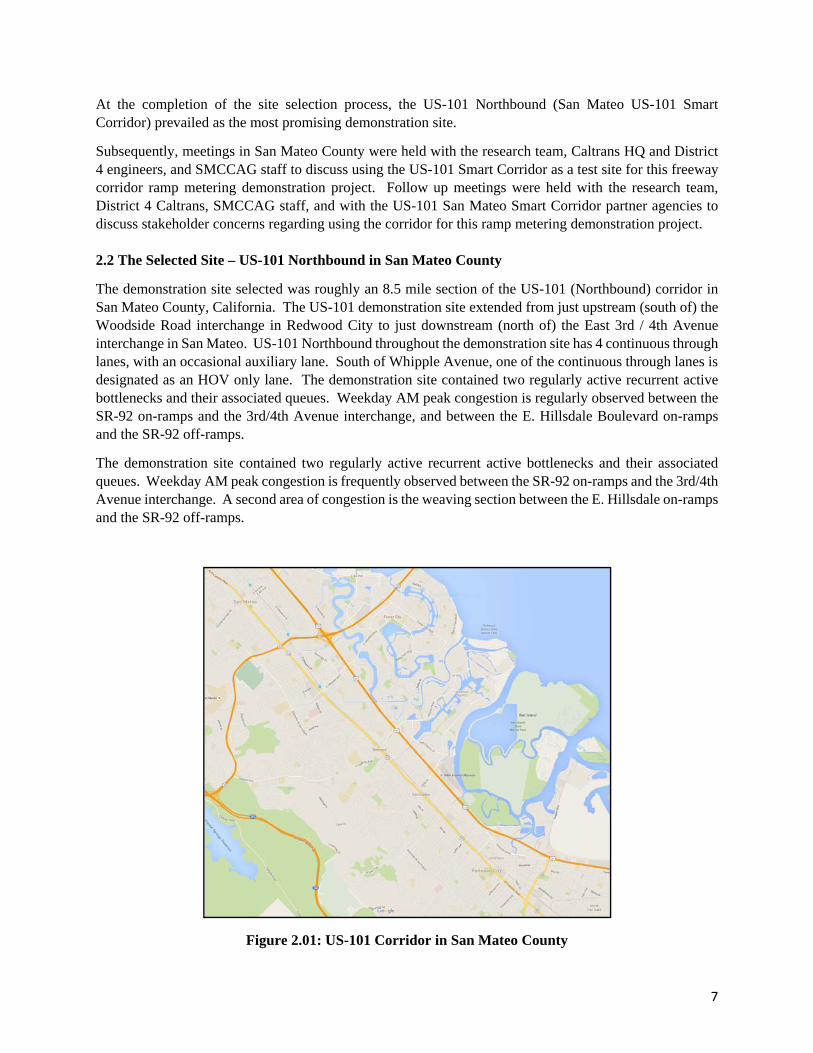
Figure 2.01 US-101 Corridor in San Mateo County (map) ........................................................................ 7
Figure 3.01 Mainline Hourly Traffic Volumes and Speeds (Weekday, PeMS Station: 405827) ............. 13
Figure 3.02 Mainline Hourly Traffic Volumes and Speeds (Weekday, PeMS Station: 405859) ............. 14
Figure 3.03 Mainline Hourly Traffic Volumes and Speeds (Weekday, PeMS Station: 401832) ............. 15
Figure 3.04 Mainline Hourly Traffic Volumes and Speeds (Weekend, PeMS Station: 405827) ............. 16
Figure 3.05 Mainline Hourly Traffic Volumes and Speeds (Weekend, PeMS Station: 405859) ............. 17
Figure 3.06 Mainline Hourly Traffic Volumes and Speeds (Weekend, PeMS Station: 401832) ............. 18
Figure 3.07 Observed Traffic Speeds, US-101 Northbound (Weekday, PeMS & INRIX) ...................... 22
Figure 3.08 Observed Traffic Speeds, US-101 Northbound (Weekend, PeMS & INRIX) ...................... 23
Figure 3.09 Mainline Occupancies and Metering Activation Rates (Weekday, PeMS: 405827) ............. 25
Figure 3.10 Mainline Occupancies and Metering Activation Rates (Weekday, PeMS: 405859) ............. 26
Figure 3.11 Mainline Occupancies and Metering Activation Rates (Weekday, PeMS: 401832) ............. 27
Figure 3.12 Mainline Occupancies and Metering Activation Rates (Weekend, PeMS: 405827) ............. 28
Figure 3.13 Mainline Occupancies and Metering Activation Rates (Weekend, PeMS: 405859) ............. 29
Figure 3.14 Mainline Occupancies and Metering Activation Rates (Weekend, PeMS: 401832) ............. 30
Figure 4.01 San Mateo US-101 Test Site ................................................................................................ 31
Figure 4.02 VISSIM Network with Mainline & Ramp Detectors (loops) ............................................... 33
Figure 4.03 US-101 NB Congestion Scans (PeMS Corridor & VISSIM Simulation Model) ................. 35
Figure 4.04 US-101 NB Traffic Volumes (PeMS 401833 & VISSIM Simulation Model) ...................... 36
Figure 4.05 US-101 NB Traffic Volumes (PeMS 401882 & VISSIM Simulation Model) ...................... 37
Figure 4.06 US-101 NB Traffic Volumes (PeMS 401914 & VISSIM Simulation Model) ...................... 37
Figure 4.07 US-101 NB Traffic Volumes (PeMS 400107 & VISSIM Simulation Model) ....................... 38
Figure 4.08 US-101 NB Traffic Volumes (PeMS 402389 & VISSIM Simulation Model) ...................... 38
Figure 4.09 Change in Mainline Flows (PeMS Station 402383) .............................................................. 41
Figure 4.10 Change in Mainline Flows (PeMS Station 400645) .............................................................. 42
Figure 4.11 Change in Mainline Flows (PeMS Station 402387) .............................................................. 43
Figure 4.12 Vehicle Hours of Delay, US-101 Northbound, Weekday Off-Peak Period .......................... 44

vii
LIST OF TABLES
Table 3.01 Average Daily Traffic (ADT) on US-101 Mainline Freeway Segments .............................. 10
Table 3.02 Average Daily Traffic (ADT) on US-101 On-Ramps ........................................................... 11
Table 3.03 Average Daily Traffic (ADT) on US-101 Off-Ramps .......................................................... 12
Table 3.04 Average HOV Lane Volumes on US-101 Northbound On-Ramps ....................................... 20
Table 3.05 Average HOV Lane Utilization on US-101 Northbound On-Ramps .................................... 20
Table 4.01 Scenario Descriptions for the 24-7 RM Evaluation .............................................................. 39
Table 4.02 Mainline Flows – Between the Ralston & Hillsdale Interchanges (PeMS 402383) .............. 41
Table 4.03 Mainline Flows – Just Downstream of SR92 Off-Ramp (PeMS 400645) ............................. 42
Table 4.04 Mainline Flows – Downstream of SR92 Merge Bottleneck (PeMS 402387) ........................ 43
Table 4.05 Performance of 24-7 RM Strategies – Vehicular Delays ....................................................... 45
Table 4.06 Freeway Mainline Travel-time Reporting Segments ............................................................. 47
Table 4.07 Freeway On-Ramp Travel-time Reporting Segments ............................................................ 47
Table 4.08 Freeway On-Ramps, Average Weekday Travel Times (in seconds) ..................................... 48
Table 4.09 Freeway On-Ramps, Changes in Average Weekday Travel Times (in percent) ................... 48
Table 4.10 Freeway Mainline, Average Weekday Travel Times (in seconds) ........................................ 49
Table 4.11 Freeway Mainline, Changes in Average Weekday Travel Times (in percent) ...................... 49
Table 4.12 Performance of 24-7 RM Strategies – Travel-Time Reliability ............................................ 50
1
EXECUTIVE SUMMARY
Objectives and Methodology
Freeway ramp metering (RM) is widely used on California freeways. RM operation is typically activated regularly on a time-of-day basis (e.g., AM peak and PM peak) regardless of traffic conditions. Some Caltrans Districts operate RM for extended hours beyond the peak periods, but there is no guidelines for RM activation based on freeway operating conditions. There is a need to systematically evaluate the need and potential benefits of extending the current peak period RM operating policy to 24-7 metering operation.
The objective of this project was to develop recommendations toward a statewide policy of congestion responsive freeway ramp metering operation. The evaluation is performed in two phases. In phase 1, alternative ramp metering activation strategies were evaluated through simulation modeling on a real-world freeway test site. In Phase 2, “before” and “after” field data will be collected and analyzed on freeway test sites that have implemented congestion responsive ramp metering activation. This report describes the research performed in Phase1 of the project. The Phase 1 research was performed in the following tasks:
Site Selection: A section of the US-101 freeway in the San Francisco Bay Area was selected as the test site. The selected NB101 corridor has two regularly active (recurrent) bottlenecks. The upstream most bottleneck is a weave bottleneck bounded by the Hillsdale Blvd. on-ramps and the SR-92 off-ramps. The second bottleneck, a merge (and lane drop) bottleneck, is downstream of the SR-92 on-ramps. The typical weekday congestion patterns and mainline detector occupancies show that the demand for on-ramp metering extends well beyond the normal 6:00 AM to 10:00 AM morning peak period, and may very well start in the afternoon prior to the 3:00 PM beginning of the PM peak metering period. Caltrans currently operates a Local Mainline Responsive Ramp Metering (LMRRM) strategy whereby the metering rates are set based on the occupancy of the immediate upstream mainline detector(s).
Empirical Study at Selected Site: Data on traffic characteristics were obtained from the freeway performance measurement system (PeMS) to establish the baseline operating conditions at the selected site. The following types of data were collected: a) arrival flows and demands at all on-ramps and at the upstream-most freeway link, b) exit flows via all off-ramps and at the freeway’s downstream-most bottleneck, c) flows, detector occupancies and speeds from all loop detectors along the test site. Additional data collected included a) on-ramp metering system characteristics (ramp metering strategy and parameters, hours of operation), b) probe vehicle based travel times in the test section from INRIX and other available sources, and c) incident data, used to explain unusual traffic patterns in the data.
Simulation Modeling: Traffic operations at the selected site were modeled using the VISSIM microscopic simulation model. The simulation model was calibrated based on the performance data collected in Task 2 to ensure that it faithfully replicated the site’s traffic operational characteristics. The performance measures (MOEs) selected to evaluate the ramp metering operating strategies included the total discharge flows exiting the freeway section, the delays on the freeway and on the on-ramps, and the average freeway mainline travel time and travel time variability.
Summary of the Findings and Recommendations
The analysis of the VISSIM simulation model results showed that 24-7 ramp metering could improve the mainline freeway’s performance by increasing the average travel speeds (or reducing the overall corridor travel-times), and stabilize flows through the corridor’s bottlenecks. The measured bottleneck discharge

2
flows did not show improvements from the 24-7 metering strategies evaluated, and the travel-time reliability was largely unaffected by the implementation of the 24-7 metering strategies.
As expected, the VISSIM model showed that the 24-7 ramp metering increased the vehicular delays suffered by motorist at the on-ramps. The corridor’s overall performance (combining the mainline delay reductions with the on-ramp’s increases in delays) could be improved through moderate 24-7 ramp metering, with a mainline detector occupancy threshold in the range of 8% – 10%.
The findings from this research effort were promising in that gains could be attained through 24-7 ramp metering practices. This research evaluation was a simulation model based evaluation that focused on the potential performance gains for a single freeway corridor (the US-101 Northbound corridor in San Mateo County). Additional data-driven quantitative evaluations should be performed prior to revising Caltrans state-wide RM operating policies. Real-world traffic data, like that available from the Caltrans PeMS system, could be used to perform a set of “before” and “after” comparisons to facilitate an empirical evaluation (based on directly measured real-world data) where benefits from changes to ramp metering policies and strategies can be directly measured, and potential outcomes of proposed RM strategy/policy changes could be inferred. These RM empirical evaluations should recognize and accommodate the differences between Districts and freeway corridors.

3
CHAPTER 1 INTRODUCTION
1.1 Problem Statement
Freeway ramp metering (RM) is the most widely used strategy to manage congestion on freeway facilities. Metering traffic at the on-ramps may preserve the freeway capacity, improve freeway travel times and discharge flows. Several RM algorithms strategies have been developed and tested ranging from fixed-time strategies to local traffic responsive strategies to system-wide adaptive strategies. Readers may refer to [1] for a recent comprehensive review of algorithms and implementations. Currently, most Caltrans districts operate a Local Mainline Responsive Ramp Metering (LMRRM) strategy that determines the metering rate at an onramp entrance based on the mainline freeway detector occupancy value at its immediately upstream location.
RM operation is typically activated regularly on a time-of-day basis regardless of traffic conditions: it is switched on even if there is no traffic congestion during the scheduled RM operation hours, and it is deactivated off even if there is traffic congestion outside the scheduled operation hours (AM peak, PM peak, or both). Some Caltrans Districts operate RM for extended hours beyond the critical peak periods. Since the infrastructure is already available, it might improve operational efficiencies to update the current ramp metering strategies under certain circumstances during specific time periods. Examples include: (a) off-peak periods, update the ramp metering policies to address traffic congestion caused by incidents/accidents and/or recurring congestion that occurs outside the currently metered peaks; (b) on weekends, update the RM policies similar to those for off-peak conditions and for special events; and (c) allow for ramp metering to be more responsive to local traffic conditions instead of operating only within predefined or fixed hours of operation. However, before Caltrans adopt a statewide implementation of revised RM operating policies/strategies, there is a need to systematically evaluate the need and potential benefits of extending the current (weekday) peak period RM policy to 24-7 metering operation. 1.2 Project Objectives
The objective of this project is to develop recommendations toward a statewide policy of congestion responsive freeway ramp metering operation. The recommendations will be based on the evaluation of the effectiveness of enacting on-ramp metering in direct response to the varied start and end times of recurrent freeway congestion. The evaluation will be performed in two phases. In phase 1, alternative ramp metering activation strategies will be evaluated through simulation modeling on a real-world freeway test site. In Phase 2, “before” and “after” field data will be collected and analyzed on freeway test sites that have implemented congestion responsive ramp metering activation. The end product of the study will be recommendations to assist in a statewide policy on ramp metering operations. This report describes the research performed in Phase1 of the project.
1.3 Overview of the Research Effort
The research in Phase 1 of the project was performed in four major tasks. The work was performed in close collaboration with Caltrans technical project panel, and staff in District 4, the district of the selected study site. The project tasks are described below. Task 1. Site Selection: In this task, the test freeway section was selected, based on criteria jointly established with Caltrans staff. The selected site should include several metered on-ramps and at a minimum

4
one active bottleneck. Additionally, the site will need to be equipped with closely spaced and functioning loop detectors that report data to the freeway performance measurement system (PeMS) [2].
Several potential sites were suggested in Caltrans districts #11 (San Diego), #12 (Orange County), #3 (Sacramento), and #7 (Los Angeles). An examination of the geometric and traffic characteristics of each suggested site was undertaken using aerial photos (available through Google Earth and other means) and detector data from PeMS. Site visits were performed to confirm the suitability of the candidate site(s), prior to final selection. A section of the US101 in the San Francisco Bay Area was selected as the test site.
Task 2. Empirical Study at Selected Site: In this task, the research team collected data on traffic characteristics to establish the baseline operating conditions at the selected site. The data was obtained from the PeMS system over multiple days during periods that span each rush. The following types of data were collected: a)arrival flows and demands at all on-ramps and at the upstream-most freeway link, b) exit flows via all off-ramps and at the freeway’s downstream-most bottleneck, c) flows, detector occupancies and speeds from all detectors along the selected test site.
Additional data collected included a) on-ramp metering system characteristics (ramp metering strategy and parameters, hours of operation), b) probe vehicle based travel times in the test section from INRIX and other available sources, and c) incident data, used to explain unusual traffic patterns in the data.
Task 3. Simulation Modeling: In this task, traffic operations at the selected site were modeled using a simulation model. The research team has access to and is experienced in the state-of-art simulation models VISSIM, AIMSUN and CORSIM. The research team selected the VISSIM microscopic model [3] that was best suited to this study. The simulation model was calibrated based on the performance data collected in Task 2 to ensure that it faithfully replicated the site’s traffic operational characteristics.
Following the model calibration, the model was applied to model congestion-responsive RM strategies, including i) when to initiate ramp metering in response to real-time traffic measurements, ii) how to coordinate metering across multiple neighboring on-ramps, and iii) when to terminate metering at each on-ramp. The simulation experiments assumed the LMRRM metering logic for the baseline conditions. The study only modeled recurrent congestion conditions at the test site. The results of the simulation were analyzed and the best metering policy was selected based on the predicted performance measures (MOEs).
The total discharge flows exiting the freeway section corridor was selected as the primary MOE to evaluate the RM operating strategies. The total discharge flow is the (time-varying) sum of the discharge flow through the site’s downstream-most freeway bottleneck, and the exit flows form each off-ramp. Additional MOEs calculated from the simulation model include a) the delay on the freeway and on the on-ramps, and b) travel time including the average travel time and travel time variability.
Task 4. Preparation of Final Report: A final report was prepared describing in detail the work performed and presenting the findings and recommendations in Phase 1 of this research effort.
1.4 Organization of the Report
This document is a final report for Phase 1 of this two-phase research project. Chapter 2 describes the site selection process and the final selected site. The findings from the empirical evaluation of the selected site are presented in Chapter 3. Chapter 4 describes the simulation modeling work effort and the associated findings. The final chapter, Chapter 5, summarizes the study findings and provides recommendations for Phase 2 of this research effort.

5
CHAPTER 2 TEST SITE SELECTION
2.1 Site Selection Process and Potential Demonstration Sites
A set of test site criteria was established in cooperation with Caltrans. The demonstration site selection criteria were:
The test freeway section should be of sufficient physical length to include several metered on-ramps.
The test section should include at least a single bottleneck activated during peak period recurrent congestion, and ideally multiple bottlenecks with queues that interact.
The site should exhibit variability in the onset and dissipation of congestion, in order the traffic activated ramp control be of benefit.
The test section is not impacted by freeway queues that spill-over from downstream bottleneck(s); i.e., the site’s downstream-most freeway bottleneck is “active” characterized by queues immediately upstream and free-flow traffic immediately downstream.
The site will need to be equipped with ramp-metering infrastructure operating under the State’s Universal Ramp Metering Software.
The site needs to be equipped with closely spaced and functioning loop detectors plus suitable locations for installing supplemental data collection equipment (e.g., video cameras) as needed.
Willingness and availability of Caltrans operations staff to support the study. Ongoing (or recently completed) freeway operations studies: this criterion looks to leverage
resources with other empirical or simulation studies provided that the site satisfies the rest of the criteria.
The initial search for a site that meets these criteria entailed the examination of two web-based data sources. These are: Google Earth, from which aerial photos of candidate sites were downloaded and examined; and PeMS from which the coarse spatiotemporal patterns of freeway congestion were unveiled.
Furthermore, the proposed site’s suitability depended upon more than just its geometric configuration and traffic conditions. The potential sites needed to be equipped with ramp-metering infrastructure operating under the state’s Universal Ramp Metering Software. Very importantly, the site needed reside in a District where Caltrans personnel were amenable to, and supportive of, our proposed work.
During the site selection process, consideration of the impacts of ongoing or upcoming freeway construction projects was added to the site selection criteria. The site could not have ongoing construction projects that interfered with the mainline freeway traffic flows within the site (or flows delivered to the site from upstream) during the data collection period of this study.
The site selection process was initiated and inputs from Caltrans HQ and District offices was collected. Information on potential sites was also collected from previous ITS/PATH work efforts.
Several sites were considered and during the site selection process. Preliminary evaluation of the candidate sites was performed and the candidate sites which failed to meet the project’s criteria were eliminated from the selection process.
The more promising sites considered during the Site Selection work efforts were:

6
District 11 San Diego I-8 Eastbound: Some congestion was observed outside the AM and PM peak periods; only nominal
congestion was observed on weekends. A site with more midday congestion (and more day-to-day variation in congestion) would be more appropriate for this demonstration project (i.e., probably show more benefit).
I-8 Westbound: Only nominal congestion was observed outside the AM and PM peak periods and almost no congestion observed on weekends.
I-805 Northbound: Only nominal congestion was observed outside the AM and PM peak periods and almost no congestion observed on weekends.
I-805 Southbound: Congestion and queueing spanned across freeway interchanges (metering freeway-to-freeway interchange ramps not plausible) and metering upstream on-ramps on multiple freeways was not plausible.
I-5 North Coast Corridor (Northbound and/or Southbound direction): This appeared to be an ideal site from the traffic demand, active bottleneck, variations in congestion patterns, and data availability criteria. However, scheduled construction projects would have very likely impacted traffic demands/patterns during the RM project Before/After data collection efforts, severely compromising the study’s findings.
District 3 Sacramento
SR-99 Northbound: Only nominal congestion was observed outside of the AM and PM peak periods and almost no congestion observed on weekends, otherwise good candidate site.
SR-51 Northbound (Business 80): The upstream demand at this site originates from upstream (south) of the Business 80/US-50/SR-99 interchange. Controlling the metering and monitoring (upstream) on-ramps from these three freeways (SR-99 south of the interchange; US-50 east of the interchange; and US-50 west of the interchange) would be difficult at best. Also, there is an ongoing safety project north of Arden Way to widen the inside shoulder and add a concrete barrier.
SR-51 Southbound (Business 80): The on-Ramps at two high volume locations (Arden Way and Marconi Avenue) do not contain ramp metering equipment. Without being able to meter the traffic at these two ramps, the benefits of the demonstration project would have been significantly restricted. Otherwise this would have been a good candidate site.
District 4 Bay Area
US-101 Southbound (San Mateo US-101 Smart Corridor): From a geometric perspective and when looking at the traffic demands, bottlenecks and congestion patterns, the US-101 Southbound corridor in San Mateo County was a very acceptable candidate. Ramp metering equipment was installed an operational at most on-ramp locations although not all on-ramps were metered. PeMS data availability and quality were acceptable, although not available at all on-ramps, and not available for the off-ramps. INRIX data were also available to UC Berkeley and Caltrans for project within the 9 county Bay Area.
US-101 Northbound (San Mateo US-101 Smart Corridor): From a geometric criteria, and from a data quality/availability perspective, the US-101 Northbound matched the US-101 Southbound and was a good candidate site. The US-101 Northbound traffic demands produced more congestion during the midday of an average workday and on weekends than was observed on US-101 in the southbound direction. As such, the US-101 Northbound was selected as the most promising candidate site for the ramp metering demonstration project.
7
At the completion of the site selection process, the US-101 Northbound (San Mateo US-101 Smart Corridor) prevailed as the most promising demonstration site.
Subsequently, meetings in San Mateo County were held with the research team, Caltrans HQ and District 4 engineers, and SMCCAG staff to discuss using the US-101 Smart Corridor as a test site for this freeway corridor ramp metering demonstration project. Follow up meetings were held with the research team, District 4 Caltrans, SMCCAG staff, and with the US-101 San Mateo Smart Corridor partner agencies to discuss stakeholder concerns regarding using the corridor for this ramp metering demonstration project. 2.2 The Selected Site – US-101 Northbound in San Mateo County
The demonstration site selected was roughly an 8.5 mile section of the US-101 (Northbound) corridor in San Mateo County, California. The US-101 demonstration site extended from just upstream (south of) the Woodside Road interchange in Redwood City to just downstream (north of) the East 3rd / 4th Avenue interchange in San Mateo. US-101 Northbound throughout the demonstration site has 4 continuous through lanes, with an occasional auxiliary lane. South of Whipple Avenue, one of the continuous through lanes is designated as an HOV only lane. The demonstration site contained two regularly active recurrent active bottlenecks and their associated queues. Weekday AM peak congestion is regularly observed between the SR-92 on-ramps and the 3rd/4th Avenue interchange, and between the E. Hillsdale Boulevard on-ramps and the SR-92 off-ramps.
The demonstration site contained two regularly active recurrent active bottlenecks and their associated queues. Weekday AM peak congestion is frequently observed between the SR-92 on-ramps and the 3rd/4th Avenue interchange. A second area of congestion is the weaving section between the E. Hillsdale on-ramps and the SR-92 off-ramps.
Figure 2.01: US-101 Corridor in San Mateo County

8
CHAPTER 3 EMPIRICAL STUDY AT SELECTED SITE
The second task (Empirical Study at Selected Site) entailed a large-scale data collection and analysis of the test site’s traffic data. For this task, data from loop detectors were augmented as needed with traffic measurements from other sources (Caltrans published traffic data, INRIX Analytics, Caltrans Ramp Metering plans, and unpublished traffic data from Caltrans District 4).
These data and time periods evaluated included time periods (i.e., the peak periods across several weekdays) with time-varying: arrival flows and demands at all on-ramps and the upstream-most freeway link; exit flows via all off-ramps and the freeway’s downstream-most bottleneck; and the flows, detector occupancies and average speeds all along the freeway stretch. The data were collected over multiple days during periods that span each rush to assure that the overall demand and performance characteristics of the selected site were appropriately measured and reported. 3.1 Ramp Metering Control Strategies on US-101
Caltrans and its project partners City County Association of Governments of San Mateo County (C/CAG), and Metropolitan Transportation Commission (MTC) are working together on improving operations on U.S. Route 101 in San Mateo County. In November of 2013, northbound ramp meters were turned on along Highway 101 from SR 92 to the San Francisco County Line. In May of 2014, southbound ramp meters were turned on from SR 92 to the San Francisco County Line. Currently, the ramp meters are operated during weekday peak hours:
Northbound Monday through Friday from 6:00am-10:00am and 3:00pm-8:00pm. Southbound Monday through Friday from 6:00am-10:00am and 2:30pm-8:00pm.
The US-101 on-ramp meters, on the following 7 Holidays (if these holidays fall on a weekday), are set to rest in green during normal weekday metering hours (New Year’s Day, Memorial Day, Independence Day (July 4th), Labor Day, Thanksgiving Day, Day After Thanksgiving, and Christmas Day).
A complete listing of the Caltrans District 4 active ramp meter locations for US-101 in San Mateo County has been included in Appendix A of this report. 3.2 Data Sources for the Empirical Evaluation
Caltrans PeMS and INRIX websites were fundamental data sources, providing corridor travel times, vehicular speeds, and other performance metrics (like vehicle miles of travel (VMT), vehicle hours of travel (VHT), and vehicular delays). Additional published Caltrans traffic data were obtained from the Caltrans Divisions of Traffic Operations website. Collision and freeway incident data were obtained from the Transportation Injury Mapping System (TIMS) website and from the Caltrans PeMS website.
Caltrans PeMS: PeMS collects data in real-time from over 39,000 individual detectors spanning the freeway system across all major metropolitan areas of the state of California. PeMS is also an Archived Data User Service (ADUS) that provides over ten years of data for historical analysis. It integrates a wide variety of information from Caltrans and other local agency systems including:
• Traffic Detectors • Census Traffic Counts • Incidents • Vehicle Classification • Lane Closures • Weight-In-Motion • Toll Tags • Roadway Inventory
9
The Caltrans PeMS website was used to provide stationary point traffic volume, average traffic speed and traffic delay data for the I-80 mainline facility. The Caltrans PeMS website also collects and makes available Caltrans Traffic Accident and Surveillance Analysis System (TASAS) data for users with a Caltrans account, and CHP reported freeway incident data.
INRIX Analytics: The INRIX website provides historical and real-time traffic information, travel times and travel time information to public agencies, businesses and individuals. To do this, INRIX collects trillions of bytes of information about roadway speeds from nearly 100 million anonymous mobile phones, trucks, delivery vans, and other fleet vehicles equipped with GPS locator devices. The data is processed in real-time, creating traffic speed information for major freeways, highways and arterials across North America, as well as much of Europe, South America, and Africa. INRIX “Analytics” and INRIX “User Delay Cost Analysis” modules were used to provide traffic delay (congestion) and corridor travel time measures for preselected segments of the I-80 freeway and San Pablo Avenue (arterial) corridors.
Transportation Injury Mapping System (TIMS): The TIMS website was developed by researchers at the Safe Transportation Research and Education Center (SafeTREC) at the University of California, Berkeley to provide data and mapping analysis tools and information for traffic safety related research, policy and planning. SafeTREC began assessing the usage of the California Statewide Integrated Traffic Records System (SWITRS) by state and local agencies in 2003 on a project funded by the California Office of Traffic Safety (OTS). Grants from OTS allowed SafeTREC to develop a geocoding methodology and apply it to SWITRS data statewide. In order to distribute the geocoded SWITRS data, a web-based data query and download application was developed with the ability to display pin maps in Google Maps. A second application was designed to provide a more map-centric experience with other types of data layers and spatial analysis capabilities typically seen in a Geographic Information System (GIS). The TIMS concept was subsequently formed to give these applications a common foundation and provide a framework for continued development in the future. 3.3 Traffic Demands – US-101 Northbound
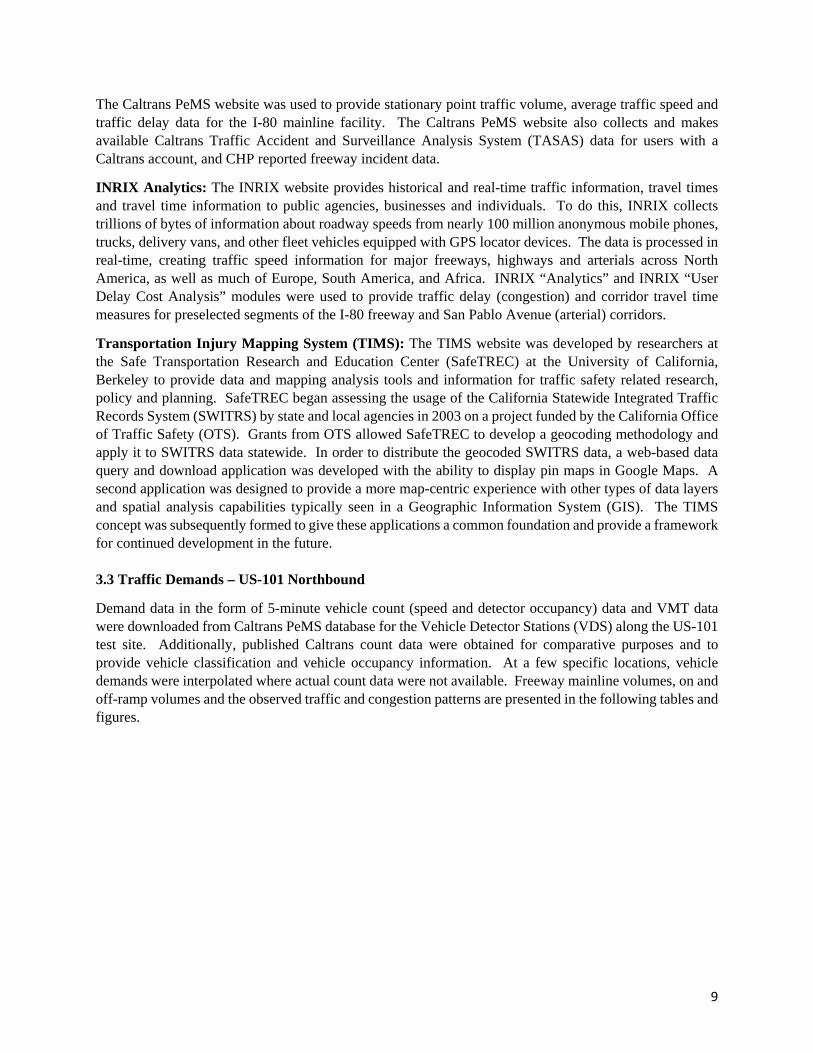
Demand data in the form of 5-minute vehicle count (speed and detector occupancy) data and VMT data were downloaded from Caltrans PeMS database for the Vehicle Detector Stations (VDS) along the US-101 test site. Additionally, published Caltrans count data were obtained for comparative purposes and to provide vehicle classification and vehicle occupancy information. At a few specific locations, vehicle demands were interpolated where actual count data were not available. Freeway mainline volumes, on and off-ramp volumes and the observed traffic and congestion patterns are presented in the following tables and figures.

10
Table 3.01: Average Daily Traffic (ADT) on US-101 Mainline Freeway Segments
Post Mile
US‐101 Location Description
Vehicle AADT Total
Truck AADT Total
Truck Pct. Total Veh.
Truck 2 Axle
Truck 3 Axle
Truck 4 Axle
Truck 5+ Axle
5.385 REDWOOD CITY, JCT. ROUTE. 84
217,000 9,765 4.50 % 5,654 999 311 2,801
5.385 REDWOOD CITY, JCT. ROUTE. 84
210,000 9,450 4.50 % 5,672 1,418 292 2,068
6.623 REDWOOD CITY, WHIPPLE
222,000 10,856 4.89 % 6,647 1,288 513 2,408
11.895 SAN MATEO, JCT. ROUTE. 92
231,000 7,462 3.23 % 4,386 728 287 2,061
11.895 SAN MATEO, JCT. ROUTE. 92
263,000 9,178 3.49 % 5,271 1,008 186 2,713
13.461 SAN MATEO, THIRD AVE
263,000 10,020 3.81 % 6,169 877 491 2,483
13.461 SAN MATEO, THIRD AVE
260,000 11,491 4.42 % 6,802 1,072 615 3,002
Average (Count) 238,000 9,746 5,800 1,056 385 2,505
Average (Percent) 4.09 % 2.44 % 0.44 % 0.16 % 1.05 %
Source: Caltrans (http://traffic‐counts.dot.ca.gov/rampvolumes2014.htm) “2014Truck.xlsx”

11
Table 3.02: Average Daily Traffic (ADT) on US-101 On-Ramps
Caltrans Post Mile
US‐101 On‐Ramp Description 2010 ADT
2013 ADT
13.624 101 NB ON FROM E.3RD\4TH AVE 5,100 11,900
13.565 SEG 101 NB ON FROM EB 3RD AVE 8,800 9,300
13.564 101 NB ON FROM WB E.3RD AVE 13,900 4,500
12.724 101 NB ON FROM KEHOE AVE 2,700 2,550
12.302 101 NB ON FROM WB 92 31,500 26,870*
12.175 101 NB ON FROM EB 92 10,200 8,700*
12.034 101 NB ON FROM FASHION ISLAND BLVD 4,550 3,880*
11.354 101 NB ON FROM WB HILLSDALE 9,030* 7,700
11.170 101 NB ON FROM EB HILLSDALE 9,600 9,100
9.694 101 NB ON FROM WB MARINE WR PK 8,500 6,500
9.693 101 NB ON FROM EB MARINE WR PK 9,400 9,500
8.619 101 NB ON FROM HOLLY ST 17,600 12,300
8.537 SEG 101 NB ON FROM WB HOLLY ST 4,300 3,000
8.536 SEG 101 NB ON FROM EB HOLLY ST 12,600 9,200
6.666 101 NB ON FROM WB WHIPPLE AVE 780 710
6.594 101 NB ON FROM EB WHIPPLE AVE 15,500 11,100
5.474 101 NB ON FROM SB 84\WOODSIDE 3,500 3,850
5.334 101 NB ON FROM 101 NB 84\WOODSIDE 13,400 13,700
Source: Caltrans (http://traffic‐counts.dot.ca.gov/rampvolumes2014.htm)
*Estimated UC Berkeley (not included in Caltrans publication)

12
Table 3.03: Average Daily Traffic (ADT) on US-101 Off-Ramps
Caltrans Post Mile
US‐101 Off‐Ramp Description 2010 ADT
2013 ADT
14.074 NB OFF TO DORE AVE 5,100 3,700
13.385 SEG NB OFF TO EB 3RD AVE 2,750 2,700
13.384 SEG NB OFF TO WB 3RD AVE 11,900 12,700
13.324 NB OFF TO E.3RD\4TH AVE 14,500 15,200
12.616 NB OFF TO KEHOE AVE 4,000 3,100
12.366 NB OFF TO EB 92 17,100 16,900*
12.090 NB OFF TO WB 92 15,200 15,020*
11.584 NB OFF TO ROUTE 92 32,000 31,630*
10.914 NB OFF TO HILLSDALE BL 18,200 17,990*
9.414 SEG NB OFF TO EB MARINE PKW 10,300 10,180*
9.294 NB OFF TO MARINE WORLD PKW 10,500 9,000
8.286 SEG NB OFF TO EB HOLLY 7,600 7,900
8.284 SEG NB OFF TO WB HOLLY 6,300 6,800
8.171 NB OFF TO HOLLY 14,900 14,500
6.475 NB OFF TO WHIPPLE AVE 11,200 9,200
5.244 SEG NB OFF TO SB 84 16,800 17,100
5.124 NB OFF TO 84\WOODSIDE 18,400 20,600
Source: Caltrans (http://traffic‐counts.dot.ca.gov/rampvolumes2014.htm)
*Estimated UC Berkeley (not included in Caltrans publication)
13
Figure 3.01: Mainline Hourly Traffic Volumes and Speeds (Average Weekday) PeMS Detector Station: 405827, “At Kehoe Ave Off-Ramp”

14
Figure 3.02: Mainline Hourly Traffic Volumes and Speeds (Average Weekday) PeMS Detector Station: 405859, “At WB 92/Fashion Island Blvd”

15
Figure 3.03: Mainline Hourly Traffic Volumes and Speeds (Average Weekday) PeMS Detector Station: 401832, “At Holly Street Diagonal On-Ramp”

16
Figure 3.04: Mainline Hourly Traffic Volumes and Speeds (Average Weekend) PeMS Detector Station: 405827, “At Kehoe Ave Off-Ramp”

17
Figure 3.05: Mainline Hourly Traffic Volumes and Speeds (Average Weekend) PeMS Detector Station: 405859, “At WB 92/Fashion Island Blvd”

18
Figure 3.06: Mainline Hourly Traffic Volumes and Speeds (Average Weekend) PeMS Detector Station: 401832, “At Holly Street Diagonal On-Ramp”
19
3.4 High Occupancy Vehicle Lanes and HOV Lane Utilization
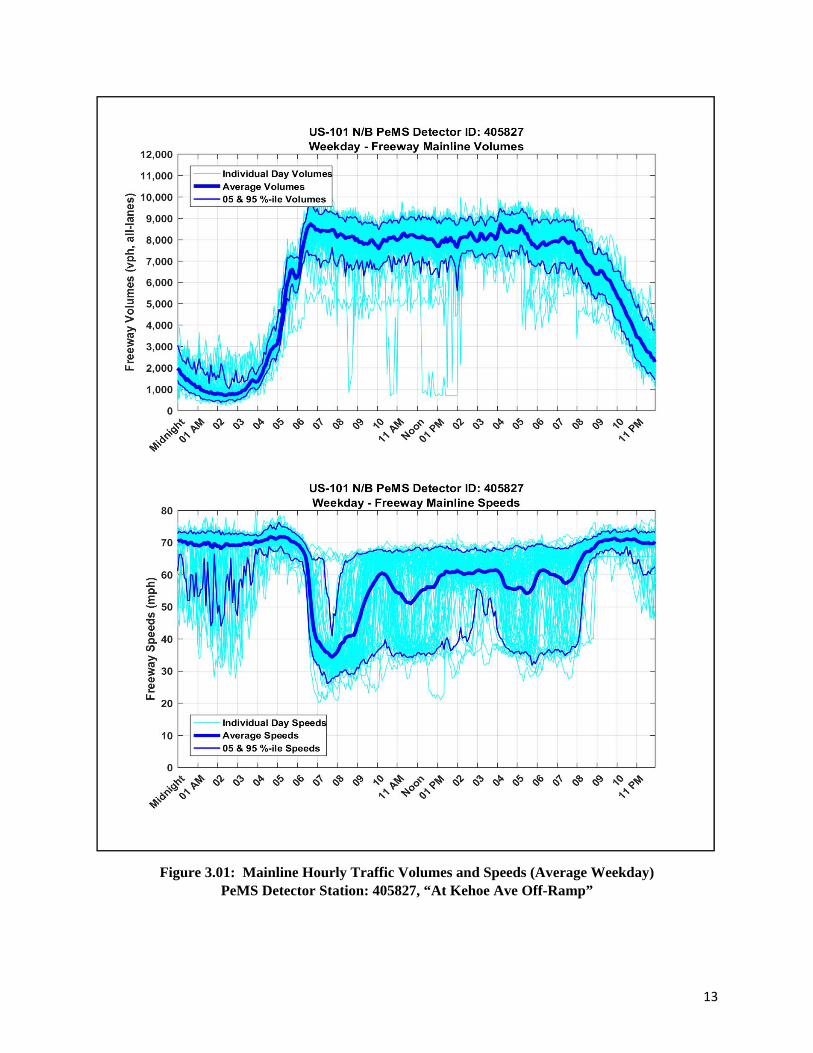
One of the continuous through lanes is designated as an HOV only lane for the portion of the US-101 northbound demonstration site that is south of Whipple Avenue interchange. This HOV only lane transitions to a mixed use lane roughly at Whipple Avenue. Otherwise, the mainline freeway lanes are all designated as mixed use lanes.
Additionally, a considerable number of the on-ramps contain HOV only designated lanes: Fashion Island Boulevard (diagonal) Woodside Road (diagonal) Holly (diagonal) Holly Street (collector) Ralston Ave / Marine Pkwy (loop) Ralston Ave / Marine Pkwy (diagonal) Hillsdale Blvd (loop)
The HOV lane utilization information was provided by Caltrans District 4 and PeMS for the US-101 demonstration corridor and is summarized in Tables 3.04 and 3.05.

20
Table 3.04: Average HOV Lane Volumes on US-101 Northbound On-Ramps
Time of Day
(Hour)
HOV Lane Volume (Veh/Hr)
Lane 2 Volume (Veh/Hr)
Lane 3 Volume (Veh/Hr)
Lane 4 Volume (Veh/Hr)
Lane 5 Volume (Veh/Hr)
Total Volume (Veh/Hr)
HOV Lane Utilization
(%)
Midnight 103 282 226 123 107 842 12.3%
1:00 AM 38 156 140 76 67 478 8.0%
2:00 23 124 123 78 60 408 5.5%
3:00 47 180 171 107 118 624 7.6%
4:00 214 418 333 223 296 1,483 14.4%
5:00 537 1,132 827 568 737 3,801 14.1%
6:00 995 1,925 1,444 1,030 1,332 6,727 14.8%
7:00 1,358 2,092 1,664 1,192 1,619 7,925 17.1%
8:00 1,380 1,974 1,632 1,226 1,604 7,816 17.7%
9:00 1,750 1,723 1,427 1,014 1,521 7,435 23.5%
10:00 1,718 1,645 1,333 970 1,455 7,121 24.1%
11:00 1,500 1,512 1,216 895 1,250 6,374 23.5%
Noon 1,416 1,477 1,188 884 1,215 6,180 22.9%
1:00 AM 1,451 1,492 1,206 893 1,207 6,248 23.2%
2:00 1,626 1,600 1,305 969 1,215 6,714 24.2%
3:00 996 1,763 1,401 1,053 1,182 6,395 15.6%
4:00 1,049 1,712 1,448 1,161 1,108 6,477 16.2%
5:00 1,062 1,500 1,354 1,097 1,056 6,069 17.5%
6:00 998 1,450 1,282 1,032 1,085 5,846 17.1%
7:00 1,428 1,417 1,211 933 983 5,973 23.9%
8:00 1,190 1,257 999 686 666 4,799 24.8%
9:00 992 1,130 873 580 533 4,109 24.1%
10:00 668 882 661 428 414 3,053 21.9%
11:00 338 577 440 262 243 1,859 18.2%
HOV‐Lane Average, During HOV‐Only Times (5:00‐9:00 AM & 3:00‐7:00 PM) 16.4%
Data Source: Caltrans PeMS (Station (VDS) 401874, September ‐ November 2015)
Table 3.05: Average HOV Lane Utilization on US-101 Northbound On-Ramps
Caltrans Post Mile
US‐101 Northbound On‐Ramp Location
AM PK %‐HOV
PM PK %‐HOV
AM & PM %‐HOV
12.034 Fashion Island Diagonal 8.7% 10.5% 9.8%
11.17 Hillsdale Blvd (EB) Loop 10.1% 15.0% 12.5%
9.694 Ralston Ave (WB) Diagonal 10.6% 14.4% 13.4%
9.693 Ralston Ave (EB) Loop 5.0% 14.7% 10.4%
8.537 Holly St (WB) Diagonal 4.8% 7.2% 6.3%
8.536 Holly St (EB) Collector 30.2% 33.2% 32.1%
Average: US‐101 Northbound 13.2% 18.2% 16.3%
Data Source: Caltrans District 4 Traffic Counts (October ‐ November 2015)

21
3.5 Corridor Bottlenecks and Congestion Patterns
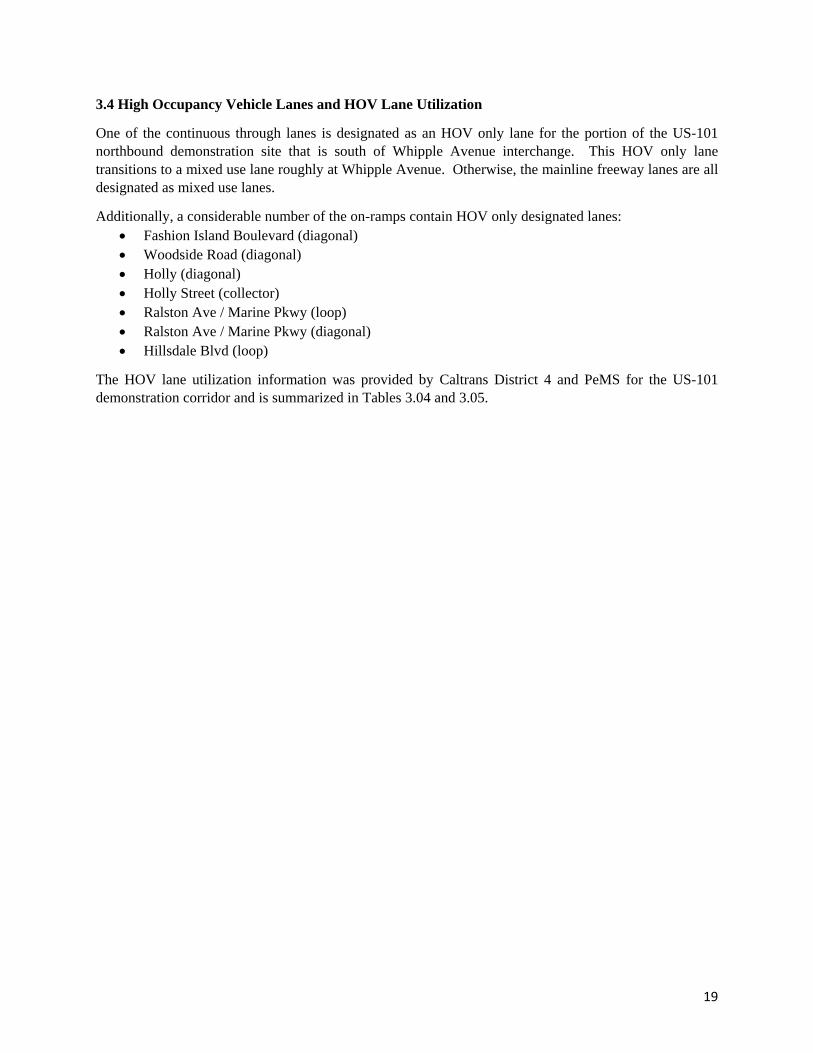
Vehicular travel times and speeds throughout the study corridor were obtained from Caltrans PeMS and from INRIX Analytics websites. Speed contour plots (sometimes called congestion scans) were created to enable a visual evaluation of the corridor’s congestion patterns. Figure 3.07 shows the congestion scans for a typical weekday, Tuesday - September 15, 2015. In Figure 3.07, the northbound US-101 traffic traverses the plots from bottom to top (south to north). It is clear from the congestion scan that a bottleneck located just downstream of the 3rd Street junction activated or stated to create congestion at about 6:30 AM. We can see that there is freely flowing traffic downstream (north) of Anza Boulevard for the majority of the day, and that bottlenecks in the Anza Avenue / 3rd Street area activated again after 10:00 AM and before 3:00 PM, that is during the midday between the AM and PM peak periods when ramp metering was enabled. We also see that a bottleneck down stream of the SR-92 / US-101 junction activated a little before 3:00 PM and remained active for the duration of the PM peak period. From the congestion scans we can also see that the congested traffic speeds (upstream of these bottlenecks) dropped to below 20 mph for a portion of the peak periods. The observed September 15th bottleneck activity and the associated levels of congestion shown here are typical for this US-101 NB corridor.
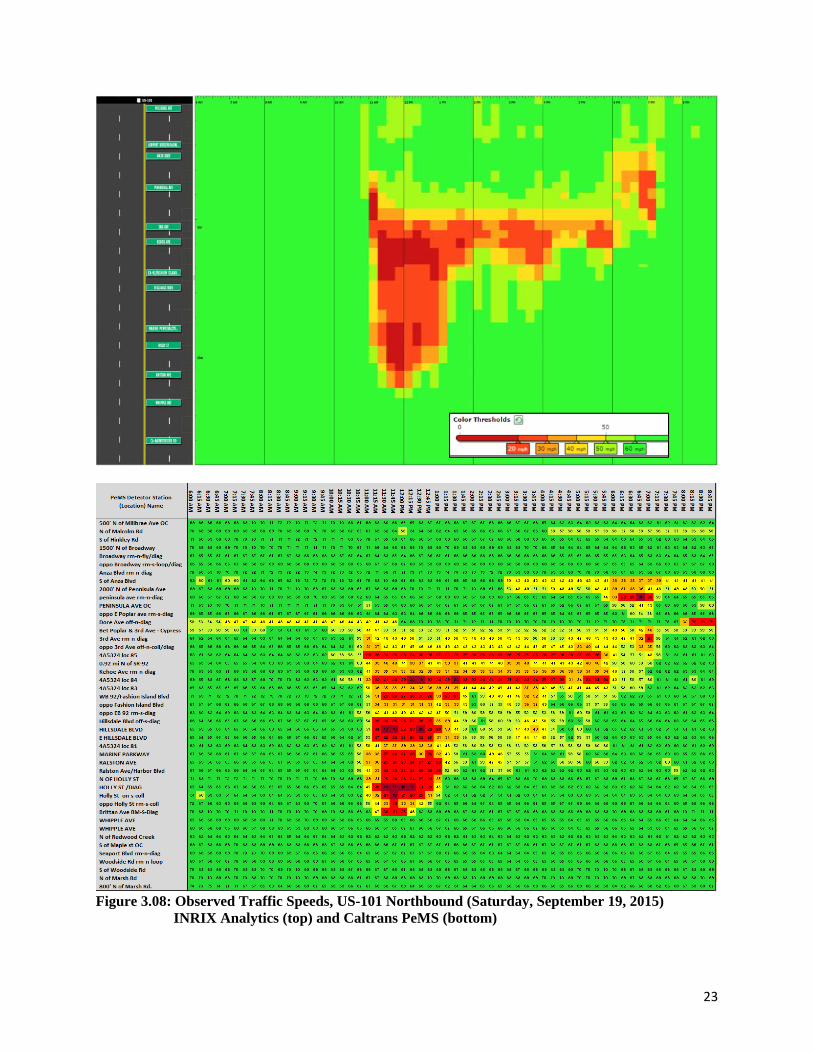
Figure 3.08 shows the congestion scan from a typical weekend day (Saturday – September 19, 2015) where traffic congestion was observed. Traffic congestion is not uncommon and becoming more typical during the middle part of the day on many of the weekend days and holiday days.
22
Figure 3.07: Observed Traffic Speeds, US-101 Northbound (Tuesday, September 15, 2015) INRIX Analytics (top) and Caltrans PeMS (bottom)
23
Figure 3.08: Observed Traffic Speeds, US-101 Northbound (Saturday, September 19, 2015)
INRIX Analytics (top) and Caltrans PeMS (bottom)

24
3.6 Corridor On-Ramp Metering & Mainline Detector Occupancies
Currently Caltrans meters the freeway on-ramps Monday through Friday from 6:00 to 10:00 AM and 3:00 to 8:00 PM for the US-101 corridor in San Mateo County. One of the primary selection criteria for this 24-7 demand responsive demonstration project was the presence of congestion outside the currently metered AM and PM weekday peaks. The US-101 Northbound demonstration corridor in San Mateo County regularly experiences freeway congestion during the midday (between the metered AM and PM peaks) and midday weekend congestion is not uncommon.
To gain insights into the need for demand responsive on-ramp metering outside the typical weekday AM and PM peaks, the PeMS (5-minute aggregated) data was analyzed for the 86 non-holiday weekday data in the July – November 2015 time period. For this analysis, an average mainline occupancy threshold of 20% was used as a proxy for the need for ramp metering.
A longer time period was evaluated to ascertain the need for holiday & weekend RM, simply because there are fewer weekend & holiday days in the week than workdays so more months of weekend data were included in the evaluation time period. The PeMS (5-minute aggregated) data were evaluated for the 71 holiday & weekend days in the March – November 2015 time period to gauge the need for holiday and weekend RM.
Figures 3.09 through 3.11 show the mainline detector occupancies three selected locations within the US-101 NB corridor to illustrate the level of demand or the expected weekday metering activation rates.
Figure 3.09 shows the detector occupancies for PeMS mainline freeway detector station 402389 which is located about 1500 feet Upstream of 3rd Avenue off-ramp. This PeMS station is basically just upstream of one of the corridor’s most active bottlenecks. As such, this location shows the need for ramp metering about 90% or more of the time on average weekdays. Another way of interpreting Figure 3.09 is to say that about 90% (or 9 out of 10) of the non-holiday weekdays have sufficient congestion to trigger demand responsive ramp metering during the AM Peak Period. With respect to midday ramp metering (after 10 AM and before 3 PM) between 20% and 60% of the non-holiday weekdays have sufficient congestion to trigger ramp metering depend on the time of day. The highest need for midday ramp metering seems to be centered on the noon (lunch) time period of the workday. Additionally, there is some need to extend the metering past the current 8:00 PM cut off; a little over 10% of the non-holiday weekdays have sufficient congestion to extend the metering past 8:00 PM with a detector occupancy threshold of 10%.
Figure 3.10 shows the mainline detector occupancies for the PeMS station 405859 which is located at WB 92/Fashion Island Boulevard. This mainline location is sufficiently far upstream of the 3rd Street bottleneck such that demand responsive (midday) ramp metering would only be expected to be triggered not much over 30% of the weekdays. The highest need for midday ramp metering at this location seems to be centered on the noon (lunch) time period of the workday.
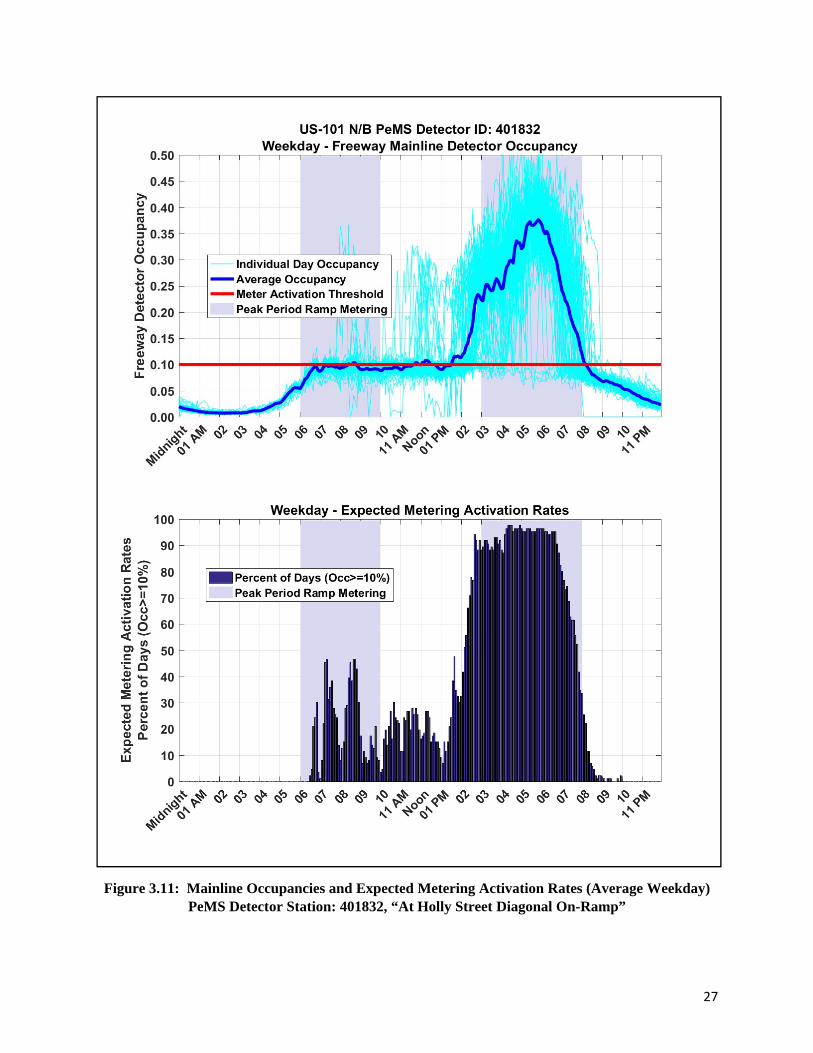
Figure 3.11 corresponds to PeMS station 401832, located near the Holly Street Diagonal On-Ramp. The levels of congestion at this on-ramp would trigger ramp meter activation about 90% of the weekdays prior to 3:00 PM, and the ramp metering about 30% of the weekdays. Notice how quickly the mainline detector occupancy rates increase between 2:00 and 3:00 PM and that these occupancy rates remain above the 10% threshold after 8:00 PM for about 30% of the weekdays.
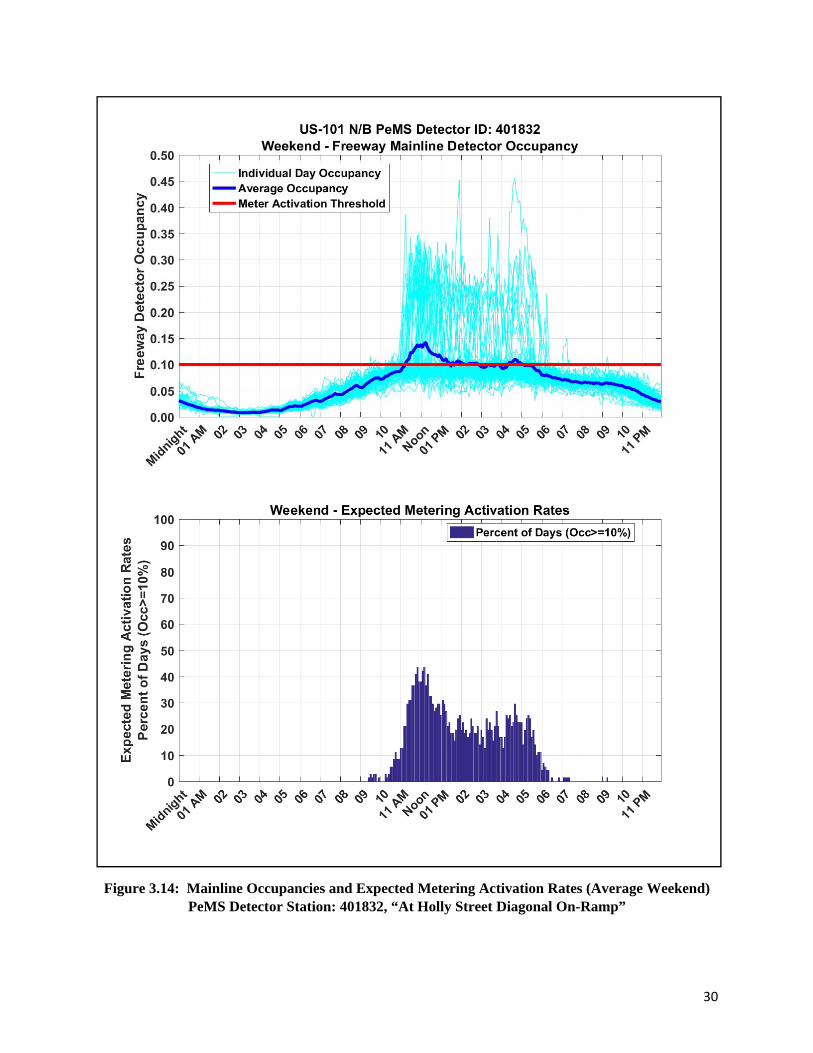
Figures 3.12 through 3.14 show the holiday & weekend detector occupancy rates for the same three PeMS mainline detectors. Notice that the occupancies are sufficiently high (above the 10% threshold) on over 70% of the holiday/weekend days at PeMS station 405827 which is near Kehoe Ave ramp junction.

25
Subsequent to performing this empirical evaluation of the US-101 site, the traffic count data were used as inputs to the US-101 VISSIM simulation model, and the simulated congestion patterns were compared to the observed congestion patterns.
Figure 3.09: Mainline Occupancies and Expected Metering Activation Rates (Average Weekday) PeMS Detector Station: 405827, “At Kehoe Ave Off-Ramp”

26
Figure 3.10: Mainline Occupancies and Expected Metering Activation Rates (Average Weekday) PeMS Detector Station: 405859, “At WB 92/Fashion Island Blvd”
27
Figure 3.11: Mainline Occupancies and Expected Metering Activation Rates (Average Weekday) PeMS Detector Station: 401832, “At Holly Street Diagonal On-Ramp”

28
Figure 3.12: Mainline Occupancies and Expected Metering Activation Rates (Average Weekend) PeMS Detector Station: 405827, “At Kehoe Ave Off-Ramp”

29
Figure 3.13: Mainline Occupancies and Expected Metering Activation Rates (Average Weekend) PeMS Detector Station: 405859, “At WB 92/Fashion Island Blvd”
30
Figure 3.14: Mainline Occupancies and Expected Metering Activation Rates (Average Weekend) PeMS Detector Station: 401832, “At Holly Street Diagonal On-Ramp”

31
CHAPTER 4 SIMULATION MODELING
4.1 Model Background
The US-101 and SR-92 test bed modeled in VISSIM platform was developed during an earlier project (2009-2013) funded by Metropolitan Transportation Commission (MTC), San Mateo County Transportation Authority and City and County Association of Governments of San Mateo County. The model year was 2010 and the simulation time period was from 2:30 PM to 7: 30 PM. The traffic modes modeled in this test bed consist of the passenger car and truck. This VISSIM test bed had been fully calibrated based on observed traffic conditions in the field, such as volumes, travel time, bottleneck location and duration of congestion. MTC approved the calibrated and validated VISSIM model for the study in 2010/2011. Using this VISSIM simulation model, a series of operational and traffic management improvements were analyzed including ramp metering, auxiliary lanes, lane expansions, ramp closures due to short weaving/diverging/merging, and multimodal travel information.
The original (and the updated) US-101/SR-92 test bed was located approximately 10 miles south of the San Francisco International Airport (SFO) in San Mateo County (see Figure 4.01).
Figure 4.01: San Mateo US-101 Test Site (Source: Kittelson & Associates/USDOT [4])
Because the US-101 and SR-92 network was modeled in the microscopic VISSIM simulator (version 5.40), the model was able to provide time-dependent performance measures, such as time-dependent volume, speed, travel time, delay, and queuing at different levels (individual vehicle, lane, link and subarea).

32
Additionally the built-in functions and Application Programming Interface (API) in VISSIM enabled various strategies to be modeled in the test bed, including but not limited to: ramp metering, speed harmonization, queue warning, HOV/HOT lanes, variable lane use, shoulder lanes/reversible lanes, adaptive signal control, connected vehicles, etc. Moreover, the travelers’ response can be modeled by adjusting their behavior based on user-defined threshold(s), decision rule(s), and dynamic network performance. 4.2 Updating the US-101 Simulation Model & Model Refinements
The original US-101/SR-92 model’s build files were imported and run using the current version of the PTV VISSIM simulator (version 8.00-08) to assure the model was compatible with the updated version of the VISSIM software – and to ready the model for the review and update process. The (original) US-101 and SR-92 test bed development, calibration and validation process was documented in Appendix A “Selection and Development of Simulation Test Bed” of the “Impacts Assessment of Dynamic Speed Harmonization with Queue Warning: Task 3, Impacts Assessment Report” report by Kittelson & Associates [4].
The first step, prior to using the US-101 & SR-92 simulation model was to review the model’s documentation and gauge the appropriateness and quality of the model for use in this demand responsive ramp metering evaluation. The model review process resulted in the finding that the US-101 and SR-92 model seemed well suited for Task 3: Simulation Modeling of this demand responsive ramp metering evaluation. However, it was noted that several of the model inputs (specifically the traffic demand inputs, static vehicle routing factors and vehicle fleet mix) would need to be updated to reflect current year traffic conditions. A review of the model’s network showed that a few other minor refinements were in order. For example, the on-ramp controllers that were coded as being Ring Barrier Controllers (RBC) were converted to Vehicle Actuated Program (VAP) signal controllers to better replicate current Caltrans ramp metering strategies throughout the US-101 corridor. Likewise, mainline freeway and on-ramp loops were added to the network and linked to the VAP signal controllers to enable demand responsive metering strategies.
A more complete narration of the US-101 VISSIM model updates is provided next.
First and foremost, the VISSIM simulation’s traffic “Volume Inputs” were revised or updated from their original 2010 values to better match the 2015 Caltrans counts. And, the model’s “Time Intervals” were refined; the model’s original 60-minute time intervals were replaced with 15- minute time intervals. This facilitated the ability to control or change the traffic demand (volume inputs) every 15 minutes during the simulated period, instead of using hourly averaged volumes and the original 60-minute periods. Using hourly (i.e., 60 minute) average traffic volumes did not adequately replicate the observed rapid growth in traffic volumes during the 5:30 to 6:00 AM time period. Additionally, there were some more subtle volume differences within the morning peak and afternoon that were lost when 60 minute average volume patterns were used.
The VISSIM simulation’s “Vehicle Composition” parameters was updated to match SOV-HOV vehicle fleet mix observed in the Caltrans 2015 on-ramp count data. Likewise, the Vehicle Composition parameters were updated to better reflect the percentage of trucks in published 2015 Caltrans counts for the US-101 corridor.
The original model was built and calibrated to simulate traffic during the hours of 2:30 PM to 7:30 PM. Under the current Caltrans ramp metering policies, the US-101 northbound on-ramps are metered from 6:00 to 10:00 AM on weekdays. For the US-101 northbound on-ramps for interchanges north of SR-92, the

33
weekday PM peak period is metered from 3:00 to 8:00 PM on non-holiday weekdays, for northbound on-ramps for interchanges south of SR-92, the PM peak period is metered from 3:00 to 7:00 PM.
The VISSIM simulation model’s capabilities were expanded to simulate weekday traffic from 5:00 AM to 9:00 PM. This extended modeling time periods was carefully chosen to meet the needs of this demand responsive ramp metering evaluation project.
The traffic demands and associated congestion patterns dictated that the weekday modeling period start around 5:00 AM to provide ample model “seed” period prior to the morning rush, the onset of congestion, and the need for ramp metering. US-101 Northbound mainline detector occupancy regularly exceed the mainline detector occupancy thresholds during major portions of the 10:00 AM to 3:00 PM midday period, which is currently not metered. Additionally, congestion sometimes extends beyond 8:00 PM, the current metered period.
The model’s ramp metering control methods were updated to facilitate demand responsive metering, and to be able to implement separate (and different) metering rates for adjacent HOV lane and SOV lanes (at the same on-ramp location, where both the HOV and SOV lane have a common controller and use data provided by a common set of mainline loop detectors). This was accomplished via VISSIM’s Vehicle Actuated Programming (VAP), an optional add-on module of VISSIM for the simulation of programmable, phase or stage based, traffic actuated signal controls. The Caltrans District 4 (Office of Traffic Systems, Ramp Metering Branch) provided the on-ramp metering tables for the San Mateo US-101 corridor. The VISSIM VAP metering rates were updated to match the current Caltrans metering rates.
Figure 4.02 VISSIM Network with Mainline & Ramp Detectors (loops)
Additionally, the model’s run-time data collection and diagnostics reporting capabilities were updated to be consistent with the corridor performance reporting for this demand responsive ramp metering evaluation.

34
4.3 Calibration & Validation of the Updated US-101 Simulation Model
The calibration efforts for this study were loosely based on the calibration procedures developed and used in a previous UCB-ITS-PATH research project (“Design, Field Implementation and Evaluation of Adaptive Ramp Metering Algorithms”, UCB-ITS-PRR-2005-2).
In the US-101 model development, the on-ramp and off-ramp volume inputs were assembled using data from several different days. With that, it was not immediately obvious how to evaluate the simulation calibration measures. The question arose, should a single typical day be used, or a composite (average) day. It was decided to use a single day (September 15, 2015) as it was a relatively heavy traffic day and the majority of the count data were available for this day. However a few major counts were not available for the September time period – namely the SR-92 to US-101 freeway to freeway connector volumes. With that some thought needed to be applied to calibrating the model in the segments downstream of the SR-92 & US-101 merge area. Likewise, limited count data were available for the 3rd / 4th Street (loop) on-ramp and not available for several of the corridor’s off-ramps.
With these limitations, the overall goal for the US-101 model calibration was to match qualitative aspects of the freeway operation, and to match the PeMS volume demand data (where PeMS September 15, 2015 data were available). Downstream of the US-101 & SR-92 merge where the lack of September 15th data mode it extremely difficult to match PeMS mainline volumes, the constraints on matching the PeMS volume data were lessened.
These overall (qualitative) US-101 model calibration goals were to match: location of the identified bottlenecks, initial and final times for each of the mainline queues, extent of the queues, and on-ramp performance.
For the on-ramps, the primary objective was to prevent large on-ramp queues that could obstruct the vehicle sources and bias the model output.
Figure 4.03 shows speed contour plots (congestion scans) for US-101 Northbound created using Caltrans PeMS data for three days in September 2016, and for three of the VISSIM simulation model runs. The VISSIM model generally replicates the real-world bottleneck activation times and locations, and the simulation model general matches the areas (extent and duration) of the corridor’s congestion.
To assure that the queueing at the on-ramps did not extend upstream and hinder vehicles at the gateways and cause excessive queueing on the upstream arterial streets, the on-ramp queues were regularly monitored visually during the model runs. Additionally, the on-ramp volumes, VMT and VHT was compared between model runs to assure that excessive queueing at the on-ramps was not present and biasing the model results.

35
PeMS Thursday, September 10, 2016 VISSIM Simulation Run #03
PeMS Tuesday, September 15, 2016 VISSIM Simulation Run #08
PeMS Wednesday, September 09, 2016 VISSIM Simulation Run #10 Figure 4.03: US-101 Northbound Congestion Scans (Caltrans PeMS & VISSIM Simulation Model)
36
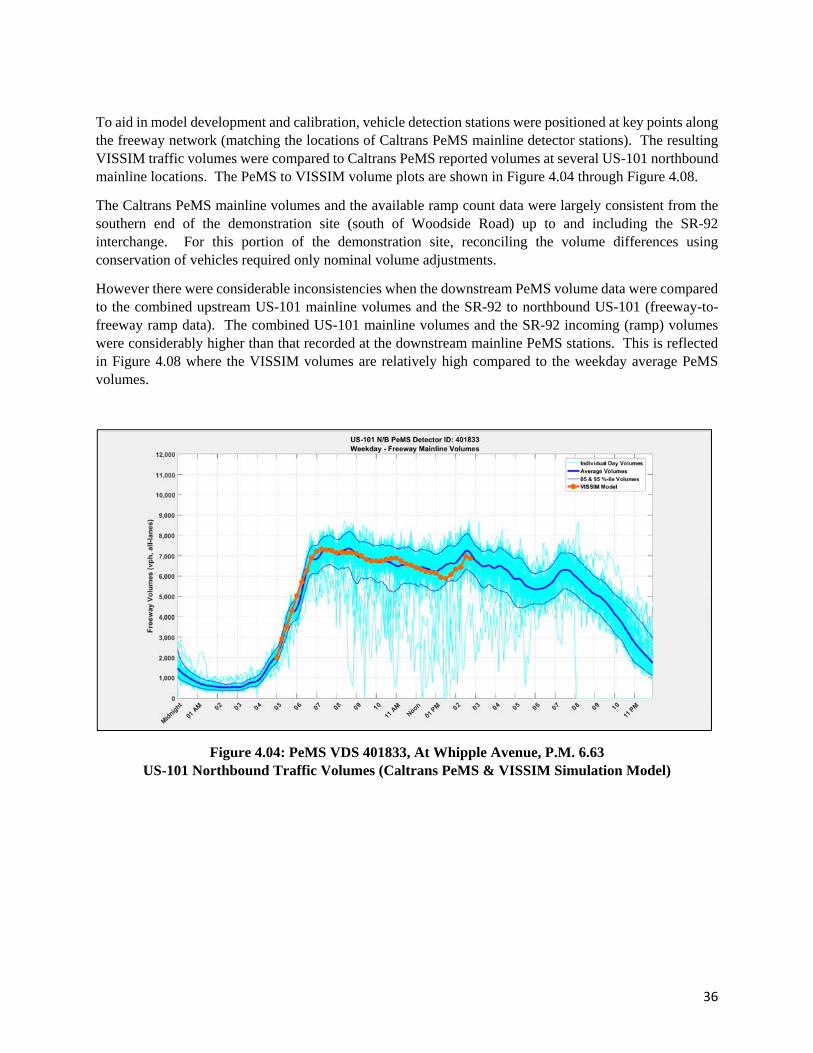
To aid in model development and calibration, vehicle detection stations were positioned at key points along the freeway network (matching the locations of Caltrans PeMS mainline detector stations). The resulting VISSIM traffic volumes were compared to Caltrans PeMS reported volumes at several US-101 northbound mainline locations. The PeMS to VISSIM volume plots are shown in Figure 4.04 through Figure 4.08.
The Caltrans PeMS mainline volumes and the available ramp count data were largely consistent from the southern end of the demonstration site (south of Woodside Road) up to and including the SR-92 interchange. For this portion of the demonstration site, reconciling the volume differences using conservation of vehicles required only nominal volume adjustments.
However there were considerable inconsistencies when the downstream PeMS volume data were compared to the combined upstream US-101 mainline volumes and the SR-92 to northbound US-101 (freeway-to-freeway ramp data). The combined US-101 mainline volumes and the SR-92 incoming (ramp) volumes were considerably higher than that recorded at the downstream mainline PeMS stations. This is reflected in Figure 4.08 where the VISSIM volumes are relatively high compared to the weekday average PeMS volumes.
Figure 4.04: PeMS VDS 401833, At Whipple Avenue, P.M. 6.63 US-101 Northbound Traffic Volumes (Caltrans PeMS & VISSIM Simulation Model)

37
Figure 4.05: PeMS VDS 401882, At Holly Street On-Ramp, P.M. 8.34 US-101 Northbound Traffic Volumes (Caltrans PeMS & VISSIM Simulation Model)
Figure 4.06: PeMS VDS 401914, At Hillsdale Blvd, P.M. 11.20 US-101 Northbound Traffic Volumes (Caltrans PeMS & VISSIM Simulation Model)

38
Figure 4.07: PeMS VDS 400107, Opposite EB 92 RM-S-Diag, P.M. 11.72 US-101 Northbound Traffic Volumes (Caltrans PeMS & VISSIM Simulation Model)
Figure 4.08: PeMS VDS 402389, South of the 3rd Avenue Interchange, P.M. 13.00 US-101 Northbound Traffic Volumes (Caltrans PeMS & VISSIM Simulation Model)
39
4.4 US-101 Ramp Metering Simulation Model Results – Performance Measures
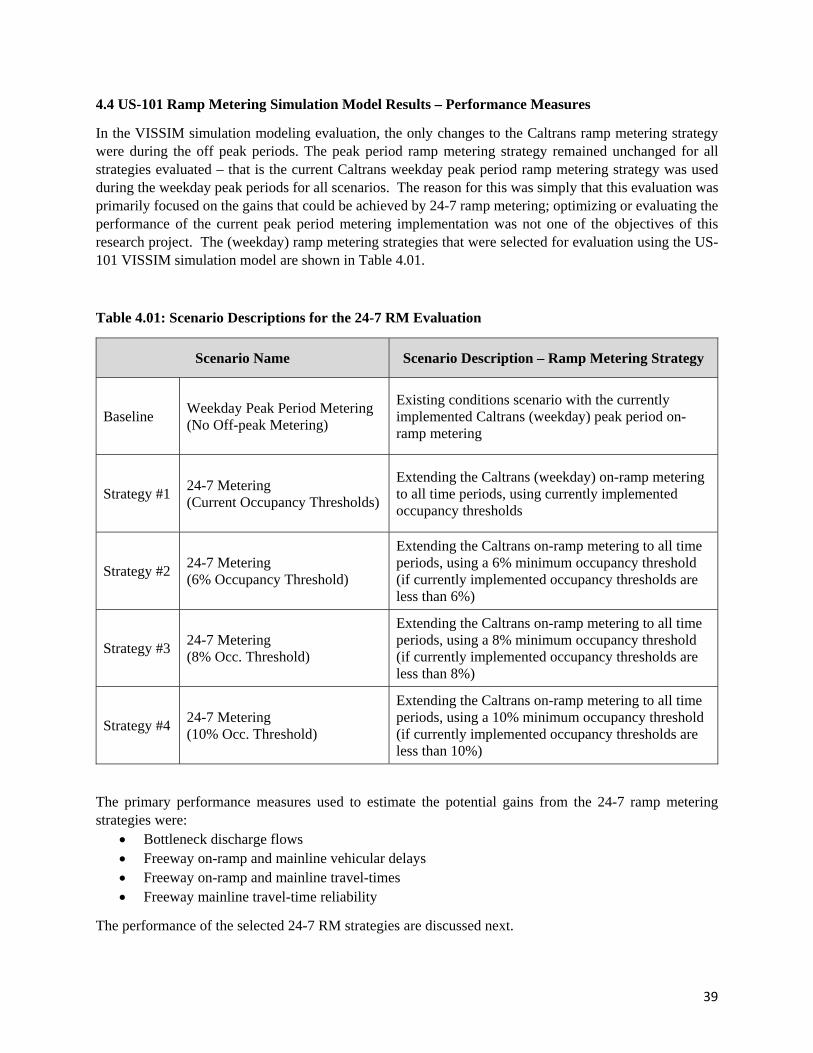
In the VISSIM simulation modeling evaluation, the only changes to the Caltrans ramp metering strategy were during the off peak periods. The peak period ramp metering strategy remained unchanged for all strategies evaluated – that is the current Caltrans weekday peak period ramp metering strategy was used during the weekday peak periods for all scenarios. The reason for this was simply that this evaluation was primarily focused on the gains that could be achieved by 24-7 ramp metering; optimizing or evaluating the performance of the current peak period metering implementation was not one of the objectives of this research project. The (weekday) ramp metering strategies that were selected for evaluation using the US-101 VISSIM simulation model are shown in Table 4.01.
Table 4.01: Scenario Descriptions for the 24-7 RM Evaluation
Scenario Name Scenario Description – Ramp Metering Strategy
Baseline Weekday Peak Period Metering (No Off-peak Metering)
Existing conditions scenario with the currently implemented Caltrans (weekday) peak period on-ramp metering
Strategy #1 24-7 Metering (Current Occupancy Thresholds)
Extending the Caltrans (weekday) on-ramp metering to all time periods, using currently implemented occupancy thresholds
Strategy #2 24-7 Metering (6% Occupancy Threshold)
Extending the Caltrans on-ramp metering to all time periods, using a 6% minimum occupancy threshold (if currently implemented occupancy thresholds are less than 6%)
Strategy #3 24-7 Metering (8% Occ. Threshold)
Extending the Caltrans on-ramp metering to all time periods, using a 8% minimum occupancy threshold (if currently implemented occupancy thresholds are less than 8%)
Strategy #4 24-7 Metering (10% Occ. Threshold)
Extending the Caltrans on-ramp metering to all time periods, using a 10% minimum occupancy threshold (if currently implemented occupancy thresholds are less than 10%)
The primary performance measures used to estimate the potential gains from the 24-7 ramp metering strategies were:
Bottleneck discharge flows Freeway on-ramp and mainline vehicular delays Freeway on-ramp and mainline travel-times Freeway mainline travel-time reliability
The performance of the selected 24-7 RM strategies are discussed next.

40
4.4.1 Bottleneck Discharge Flows
The potential increases or changes in mainline flows due to the 24-7 ramp metering were estimated from the VISSIM simulation model’s output at key locations along the US-101 Northbound corridor. The results presented here focus on the weekday 10:00 AM to 3:00 PM time period which is normally not metered, and directly follows the AM peak period metering period.
The mainline flows were measured upstream of the corridor’s bottlenecks were measured. Correspondingly, key locations that measure bottleneck discharge flows were identified from visual observations of the VISSIM model and from the site’s empirical congestion scans (created using PeMS and INRIX travel data):
Upstream of corridors mainline freeway bottlenecks Downstream of first bottleneck – the Hillsdale SR92 weave bottleneck Downstream of the second bottleneck – the SR92 merge bottleneck
Overall, minor fluctuations in mainline freeway flows (in vehicles per hour) were observed when comparing the measured flows for the 24-7 ramp metering strategies with the measured flows for the Baseline (peak period RM) strategy. These minor fluctuations were in the ±1% range. The US-101 VISSIM simulation model failed to forecast any consistent or measurable gains in bottleneck discharge flows during the 10:00 AM to 3:00 PM off peak period.
The VISSIM model’s maximum mainline flows (for any 15-minute period in the 10:00 AM to 3:00 PM time period) and the model’s average mainline flows are in Tables 4.02 through 4.04.
Figures 4.09 through 4.11 display the percentage change in mainline flow rates for the three 24-7 ramp metering when comparing their flow rates to the Baseline strategy’s flow rates.
Continuing the metering of the on-ramp traffic (past the 10 AM peak period cut-off) does appear to smooth the flows (i.e., reduce the variability) in the mainline flows that are passing through the bottlenecks and in the traffic queued upstream of the bottlenecks. This trend of more consistent mainline flows or volumes can be seen in Figures 4.09, Figure 4.10 and Figure 4.11. Metering the traffic at the on-ramps smooths out the platoons of traffic merging into the freeway’s mainline traffic stream.

41
Table 4.02: Mainline Flows – Between the Ralston & Hillsdale Interchanges (PeMS Station 402383)
VISSIM DCP #12 Baseline
Only Peak Metering
Strategy #1 24-7 RM
Strategy #2 24-7 RM (6% Occ.
Threshold)
Strategy #3 24-7 RM (8% Occ.
Threshold)
Strategy #4 24-7 RM
(10% Occ. Threshold)
Avg 15-min Flows (vph) 10:00 AM to 3:00 PM
6,118 6,122 6,122 6,122 6,124
Max 15-min Flows (vph) 10:00 AM to 3:00 PM
6,996 7,012 7,016 7,020 7,012
Figure 4.09: Change in Mainline Flows Between the Ralston & Hillsdale Interchanges (PeMS Station 402383)

42
Table 4.03: Mainline Flows – Just Downstream of SR92 Off-Ramp (PeMS Station 400645)
VISSIM DCP #16 Baseline
Only Peak Metering
Strategy #1 24-7 RM
Strategy #2 24-7 RM (6% Occ.
Threshold)
Strategy #3 24-7 RM (8% Occ.
Threshold)
Strategy #4 24-7 RM
(10% Occ. Threshold)
Avg 15-min Flows (vph) 10:00 AM to 3:00 PM
5,240 5,242 5,241 5,242 5,245
Max 15-min Flows (vph) 10:00 AM to 3:00 PM
5,808 5,784 5,768 5,784 5,796
Figure 4.10: Change in Mainline Flows Just Downstream of the SR92 Off-Ramp (PeMS Station 400645)

43
Table 4.04: Mainline Flows – Downstream of SR92 Merge Bottleneck (PeMS Station 402387)
VISSIM DCP #18 Baseline
Only Peak Metering
Strategy #1 24-7 RM
Strategy #2 24-7 RM (6% Occ.
Threshold)
Strategy #3 24-7 RM (8% Occ.
Threshold)
Strategy #4 24-7 RM
(10% Occ. Threshold)
Avg 15-min Flows (vph) 10:00 AM to 3:00 PM
7,986 7,982 7,985 7,983 7,988
Max 15-min Flows (vph) 10:00 AM to 3:00 PM
8,624 8,564 8,576 8,588 8,576
Figure 4.11 Change in Mainline Flows Downstream of the SR92 Merge Bottleneck (PeMS Station 402387)

44
4.4.2 Freeway On-ramp and Mainline Vehicular Delays
The mainline freeway vehicular delays (in terms of vehicle-hours of travel) were tallied for the Baseline Scenario and the proposed 24-7 RM strategies for a typical weekday between the hours of 10:00 AM and 3:00 PM. Likewise the vehicular delays were summarized for the US-101 Northbound on-ramps. Finally, the on-ramp and mainline delays were combined to gauge the overall effectiveness of the proposed ramp metering strategies.
Table 4.05 lists the RM strategies and the delay savings estimated by the VISSIM simulation model. Figure 4.12 graphically displays the performance of the selected RM strategies.
Overall, the US-101 Ramp Metering simulation model showed that moderate gains in delay reduction could be obtained from implementing a 24-7 ramp metering strategy on the US-101 corridor. It also revealed that some strategies perform better than others. Moderate metering (with a mainline occupancy threshold in the 8% to 10% range) seems to perform well during the off-peak periods, when looking at overall performance (i.e., combined freeway mainline & on-ramp delay savings).
Figure 4.12: Vehicle Hours of Delay US-101 Northbound, Weekday Off-Peak Period
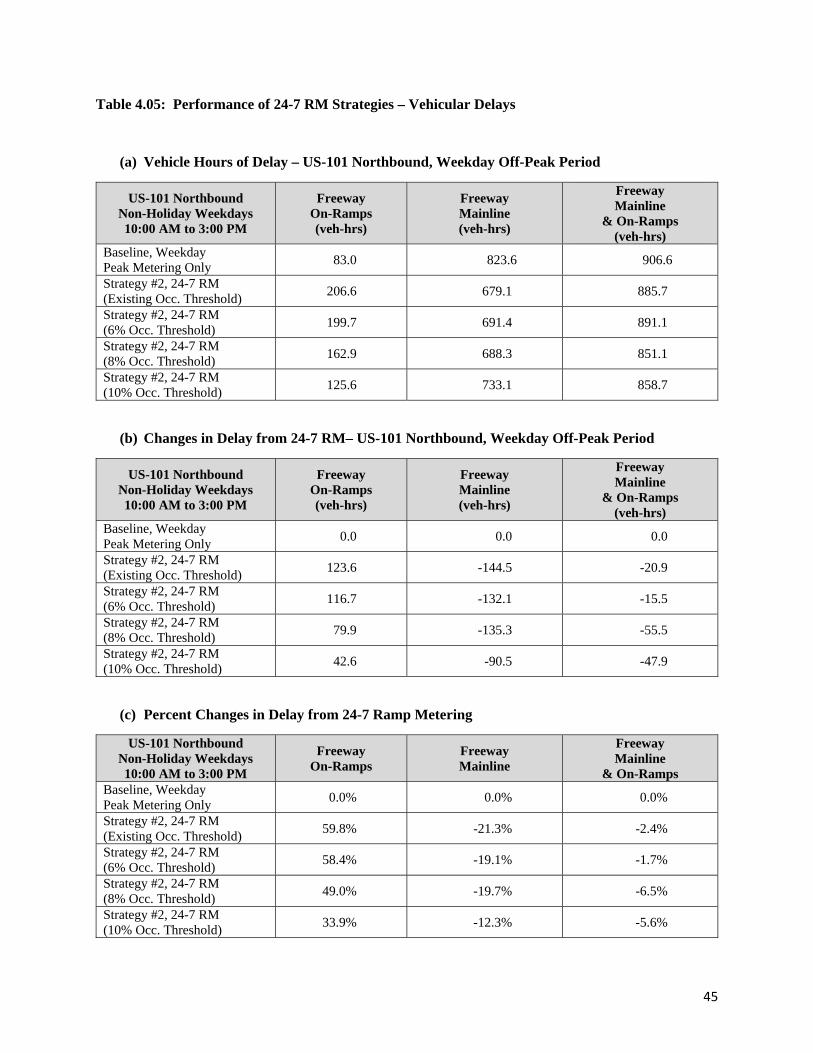
45
Table 4.05: Performance of 24-7 RM Strategies – Vehicular Delays
(a) Vehicle Hours of Delay – US-101 Northbound, Weekday Off-Peak Period
US-101 Northbound Non-Holiday Weekdays 10:00 AM to 3:00 PM
Freeway On-Ramps (veh-hrs)
Freeway Mainline (veh-hrs)
Freeway Mainline
& On-Ramps (veh-hrs)
Baseline, Weekday Peak Metering Only
83.0 823.6 906.6
Strategy #2, 24-7 RM (Existing Occ. Threshold)
206.6 679.1 885.7
Strategy #2, 24-7 RM (6% Occ. Threshold)
199.7 691.4 891.1
Strategy #2, 24-7 RM (8% Occ. Threshold)
162.9 688.3 851.1
Strategy #2, 24-7 RM (10% Occ. Threshold)
125.6 733.1 858.7
(b) Changes in Delay from 24-7 RM– US-101 Northbound, Weekday Off-Peak Period
US-101 Northbound Non-Holiday Weekdays 10:00 AM to 3:00 PM
Freeway On-Ramps (veh-hrs)
Freeway Mainline (veh-hrs)
Freeway Mainline
& On-Ramps (veh-hrs)
Baseline, Weekday Peak Metering Only
0.0 0.0 0.0
Strategy #2, 24-7 RM (Existing Occ. Threshold)
123.6 -144.5 -20.9
Strategy #2, 24-7 RM (6% Occ. Threshold)
116.7 -132.1 -15.5
Strategy #2, 24-7 RM (8% Occ. Threshold)
79.9 -135.3 -55.5
Strategy #2, 24-7 RM (10% Occ. Threshold)
42.6 -90.5 -47.9
(c) Percent Changes in Delay from 24-7 Ramp Metering
US-101 Northbound Non-Holiday Weekdays 10:00 AM to 3:00 PM
Freeway On-Ramps
Freeway Mainline
Freeway Mainline
& On-Ramps Baseline, Weekday Peak Metering Only
0.0% 0.0% 0.0%
Strategy #2, 24-7 RM (Existing Occ. Threshold)
59.8% -21.3% -2.4%
Strategy #2, 24-7 RM (6% Occ. Threshold)
58.4% -19.1% -1.7%
Strategy #2, 24-7 RM (8% Occ. Threshold)
49.0% -19.7% -6.5%
Strategy #2, 24-7 RM (10% Occ. Threshold)
33.9% -12.3% -5.6%

46
The US-101 Northbound demonstration site was roughly an 8.5 mile section California’s congested urban freeway. The 24-7 ramp metering strategy with an 8% mainline occupancy threshold saved motorist about 55 vehicle hours of delay (per average non-holiday weekday) along the San Mateo US-101 Northbound corridor. The 10 % mainline occupancy threshold strategy saved about 48 vehicle-hours of delay per average workday. This equates to about 12,500 vehicle hours of delay savings annually, assuming 50 vehicle hours of delay per average workday and about 250 workdays a year. This doubles to about 25,000 vehicle-hours of delay savings – if one includes the US-101 Southbound and assumes the US-101 Southbound 24-7 ramp metering provides an equivalent delay savings to the Northbound.
If the weekend and holiday delay savings from the 24-7 ramp metering is in the same range as the workday midday’s, about a 6% delay savings, then an additional 12,500 annual vehicle-hours of delay savings can be attributed to the 24-7 RM program. Caltrans PeMS reports about 1,590 vehicle-hours of delay per average Saturday for the US-101 Northbound corridor in San Mateo County, and another 475 vehicle-hours for the average Sunday, with an average 6% delay savings, this equates to over 12,500 vehicle hours annually for the US-101 corridor (Northbound + Southbound).
The monetized delay savings for the 8.5 mile stretch of the US-101 corridor (Northbound + Southbound) in San Mateo is over $650,000 per year, assuming a $17.35 vehicle-hour value of time used by Caltrans [5]. 4.4.3 Freeway On-ramp and Mainline Travel Times
Corridor travel-times was one of the key performance measures for this ramp metering research effort. Accordingly, average vehicle travel-times were accumulated and reported by the US-101 model.
Table 4.06 lists the VISSIM naming convention used for travel-time reporting and provides a general description of the mainline freeway reporting segments and the corresponding segment distances.
Table 4.07 lists the same for the on-ramp travel-time reporting segments. Segment descriptions have been omitted as the on-ramp reporting names are self-explanatory.
Table 4.08 and Table 4.09 list the travel-times and percent reductions in the US-101 NB on-ramp reporting segments.
Table 4.10 and Table 4.11 list the travel-times and percent reductions in the US-101 NB freeway (mainline) reporting segments.
The ramp metering strategy that provides the most mainline freeway travel-time benefit is Strategy #1 “24-7 Ramp Metering” where the peak period metering rates and peak period mainline occupancy thresholds were simply extended into the off-peak periods of the day. Note that under the current peak period metering plans some of the mainline occupancy thresholds for peak period metering are as low as 4%. As one would expect, raising the mainline occupancy threshold (to 6%, 8% or 10%) generally reduces the on-ramp travel-times and increases the mainline freeway travel-times.

47
Table 4.06: Freeway Mainline Travel-time Reporting Segments
VISSIM DCM Segment Name
VISSIM DCM Mainline Freeway Segment Description
VISSIM DCM Segment Distance
(ft.) US101-NB Seg 01 Woodside Diagonal On-Ramp to Woodside Off-Ramp 2,812
US101-NB Seg 02 Woodside Off-Ramp to Whipple Loop On-Ramp 5,056
US101-NB Seg 03 Whipple Loop On-Ramp to Whipple Diagonal On-Ramp 842
US101-NB Seg 04 Whipple Diagonal On-Ramp to Holly Diagonal On-Ramp 10,243
US101-NB Seg 05 Holly Diagonal On-Ramp to Ralston Loop On-Ramp 4,562
US101-NB Seg 06 Ralston Loop On-Ramp to Ralston Diagonal On-Ramp 935
US101-NB Seg 07 Ralston Diagonal On-Ramp to Hillsdale Diagonal On-Ramp 8,196
US101-NB Seg 08 Hillsdale Diagonal On-Ramp to SR-92 Diagonal On-Ramp 3,916
US101-NB Seg 09 SR-92 Diagonal On-Ramp to Kehoe Diagonal On-Ramp 4,098
US101-NB Seg 10 Kehoe Diagonal On-Ramp to North of 3rd Street On-Ramps 4,913
US101-NB Corridor 45,574
Table 4.07: Freeway On-Ramp Travel-time Reporting Segments
VISSIM DCM On-Ramp Segment Name
VISSIM DCM Segment Distance
(ft.) Woodside Diag On-Ramp 2,020
Woodside Loop On-Ramp 2,464
Whipple Diag On-Ramp 1,189
Whipple Loop On-Ramp 877
Holly Diag On-Ramp 2,089
Holly Loop On-Ramp 2,695
Ralston Diag On-Ramp 1,861
Ralston Loop On-Ramp 1,261
Hillsdale Diag On-Ramp 1,448
Hillsdale Loop On-Ramp 1,583
SR-92 Diag On-Ramp 3,304
SR-92 Loop On-Ramp 1,857
Fashion Island Diag On-Ramp 1,389
Kehoe Diag On-Ramp 1,300
3rd St Diag On-Ramp 977
3rd St Loop On-Ramp 1,550

48
Table 4.08: Freeway On-Ramps, Average Weekday Travel Times (in seconds)
US-101 Northbound Non-Holiday Weekdays 10:00 AM to 3:00 PM
Baseline Only Peak Metering
Strategy #1 24-7 RM
Strategy #2 24-7 RM (6% Occ.
Threshold)
Strategy #3 24-7 RM (8% Occ.
Threshold)
Strategy #4 24-7 RM
(10% Occ. Threshold)
Woodside Diag On-Ramp 20.5 32.3 30.6 27.5 24.6
Woodside Loop On-Ramp 25.4 54.2 52.7 47.7 38.3
Whipple Diag On-Ramp 12.0 22.3 19.6 15.1 12.8
Whipple Loop On-Ramp 11.0 29.3 28.7 25.8 18.5
Holly Diag On-Ramp 22.4 30.3 27.0 24.1 22.9
Holly Loop On-Ramp 30.3 39.9 37.8 34.4 31.9
Ralston Diag On-Ramp 20.4 25.4 24.1 22.4 21.3
Ralston Loop On-Ramp 15.9 15.9 15.9 15.9 15.9
Hillsdale Diag On-Ramp 46.3 55.2 54.5 51.9 49.3
Hillsdale Loop On-Ramp 32.5 57.7 53.7 43.7 36.7
SR-92 Diag On-Ramp 75.1 78.9 79.2 74.3 73.7
SR-92 Loop On-Ramp 25.5 25.0 25.2 25.1 25.2
Fashion Island Diag On-Ramp 49.9 50.1 50.2 49.2 49.7
Kehoe Diag On-Ramp 25.1 27.8 27.8 27.0 26.5
3rd St Diag On-Ramp 29.7 32.3 32.3 32.2 31.9
3rd St Loop On-Ramp 36.4 62.3 62.3 60.4 53.4
Table 4.09: Freeway On-Ramps, Changes in Average Weekday Travel Times (in percent)
US-101 Northbound Non-Holiday Weekdays 10:00 AM to 3:00 PM
Baseline Only Peak Metering
Strategy #1 24-7 RM
Strategy #2 24-7 RM (6% Occ.
Threshold)
Strategy #3 24-7 RM (8% Occ.
Threshold)
Strategy #4 24-7 RM
(10% Occ. Threshold)
Woodside Diag On-Ramp 0.0% 57.5% 49.1% 34.3% 20.0%
Woodside Loop On-Ramp 0.0% 113.6% 107.3% 87.6% 50.8%
Whipple Diag On-Ramp 0.0% 86.3% 63.9% 26.1% 7.3%
Whipple Loop On-Ramp 0.0% 167.4% 162.1% 135.0% 69.0%
Holly Diag On-Ramp 0.0% 35.6% 20.9% 7.9% 2.4%
Holly Loop On-Ramp 0.0% 31.7% 24.8% 13.6% 5.2%
Ralston Diag On-Ramp 0.0% 24.3% 18.1% 9.5% 4.2%
Ralston Loop On-Ramp 0.0% -0.2% -0.2% -0.2% -0.1%
Hillsdale Diag On-Ramp 0.0% 19.3% 17.9% 12.2% 6.6%
Hillsdale Loop On-Ramp 0.0% 77.3% 65.2% 34.3% 13.0%
SR-92 Diag On-Ramp 0.0% 5.1% 5.6% -1.0% -1.9%
SR-92 Loop On-Ramp 0.0% -1.6% -1.1% -1.5% -0.9%
Fashion Island Diag On-Ramp 0.0% 0.4% 0.5% -1.5% -0.5%
Kehoe Diag On-Ramp 0.0% 11.1% 11.2% 7.9% 5.8%
3rd St Diag On-Ramp 0.0% 8.9% 9.0% 8.6% 7.6%
3rd St Loop On-Ramp 0.0% 71.2% 71.3% 65.9% 46.7%
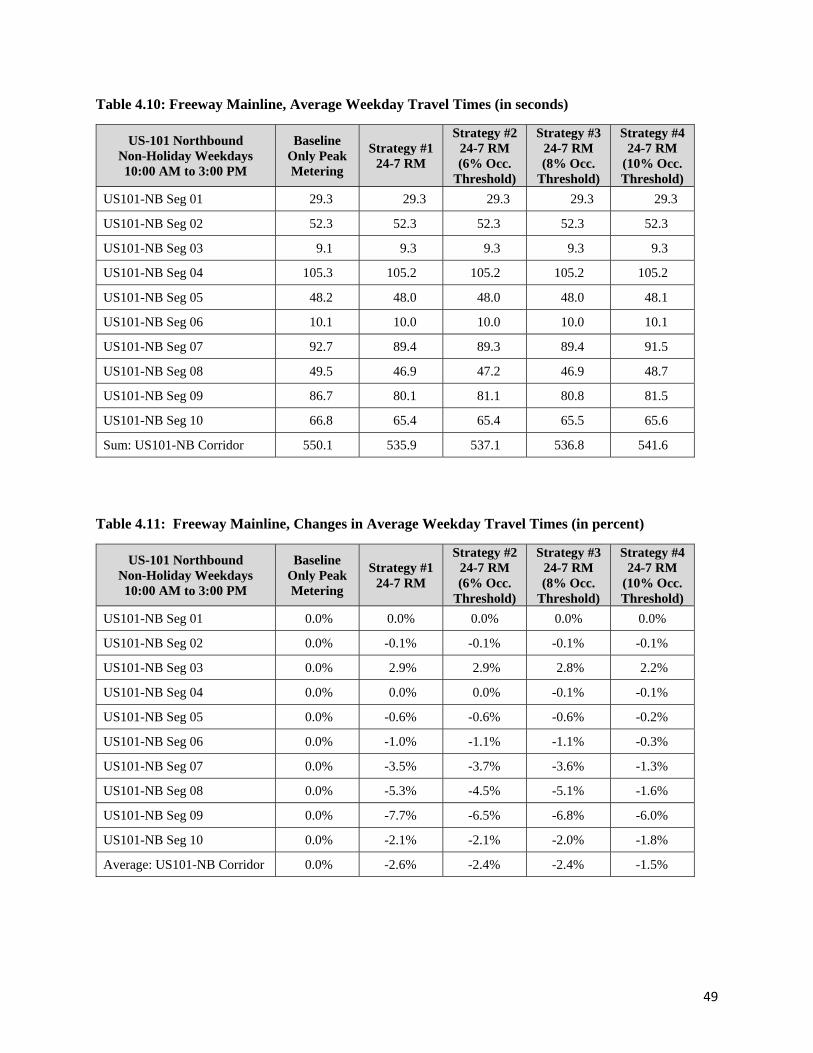
49
Table 4.10: Freeway Mainline, Average Weekday Travel Times (in seconds)
US-101 Northbound Non-Holiday Weekdays 10:00 AM to 3:00 PM
Baseline Only Peak Metering
Strategy #1 24-7 RM
Strategy #2 24-7 RM (6% Occ.
Threshold)
Strategy #3 24-7 RM (8% Occ.
Threshold)
Strategy #4 24-7 RM
(10% Occ. Threshold)
US101-NB Seg 01 29.3 29.3 29.3 29.3 29.3
US101-NB Seg 02 52.3 52.3 52.3 52.3 52.3
US101-NB Seg 03 9.1 9.3 9.3 9.3 9.3
US101-NB Seg 04 105.3 105.2 105.2 105.2 105.2
US101-NB Seg 05 48.2 48.0 48.0 48.0 48.1
US101-NB Seg 06 10.1 10.0 10.0 10.0 10.1
US101-NB Seg 07 92.7 89.4 89.3 89.4 91.5
US101-NB Seg 08 49.5 46.9 47.2 46.9 48.7
US101-NB Seg 09 86.7 80.1 81.1 80.8 81.5
US101-NB Seg 10 66.8 65.4 65.4 65.5 65.6
Sum: US101-NB Corridor 550.1 535.9 537.1 536.8 541.6
Table 4.11: Freeway Mainline, Changes in Average Weekday Travel Times (in percent)
US-101 Northbound Non-Holiday Weekdays 10:00 AM to 3:00 PM
Baseline Only Peak Metering
Strategy #1 24-7 RM
Strategy #2 24-7 RM (6% Occ.
Threshold)
Strategy #3 24-7 RM (8% Occ.
Threshold)
Strategy #4 24-7 RM
(10% Occ. Threshold)
US101-NB Seg 01 0.0% 0.0% 0.0% 0.0% 0.0%
US101-NB Seg 02 0.0% -0.1% -0.1% -0.1% -0.1%
US101-NB Seg 03 0.0% 2.9% 2.9% 2.8% 2.2%
US101-NB Seg 04 0.0% 0.0% 0.0% -0.1% -0.1%
US101-NB Seg 05 0.0% -0.6% -0.6% -0.6% -0.2%
US101-NB Seg 06 0.0% -1.0% -1.1% -1.1% -0.3%
US101-NB Seg 07 0.0% -3.5% -3.7% -3.6% -1.3%
US101-NB Seg 08 0.0% -5.3% -4.5% -5.1% -1.6%
US101-NB Seg 09 0.0% -7.7% -6.5% -6.8% -6.0%
US101-NB Seg 10 0.0% -2.1% -2.1% -2.0% -1.8%
Average: US101-NB Corridor 0.0% -2.6% -2.4% -2.4% -1.5%

50
4.4.4 Freeway Travel Time Reliability
Corridor travel-time reliability was one of the key performance measures for this ramp metering research effort. Accordingly, vehicle travel-times were accumulated. Subsequently, mean travel-times were estimated along with the standard deviations in the corridor’s travel-times and the 95th percentile of the corridor’s travel-times.
Next the corridor’s Buffer Index was estimated. The Buffer Index is a measure of the reliability of travel service. It is calculated as the ratio between the difference of the 95th percentile travel time and the average travel time divided by the average travel time and expressed in terms of a percentage.
The US-101 Northbound corridor’s travel-times and travel-time reliability performance measures are listed below in Table 4.12.
Table 4.12: Performance of 24-7 RM Strategies – Travel-Time Reliability
US-101 Northbound Non-Holiday Weekdays 10:00 AM to 3:00 PM
Average Travel-Times
(sec)
Travel-Time Standard Deviations
(sec)
Travel-Time 95th Percentiles
(sec)
Travel-Time Buffer Index
(percent)
Baseline, Weekday Peak Metering Only
550.1 91.0 713.6 29.7%
Strategy #2, 24-7 RM (Existing Occ. Threshold)
535.9 90.5 697.3 30.1%
Strategy #2, 24-7 RM (6% Occ. Threshold)
537.1 90.5 713.5 32.8%
Strategy #2, 24-7 RM (8% Occ. Threshold)
536.8 88.5 688.4 28.3%
Strategy #2, 24-7 RM (10% Occ. Threshold)
541.6 90.0 700.3 29.3%
The 24-7 ramp metering strategies had only no appreciable impact (i.e., systematic gain or loss) on the corridor’s travel-time reliability, with no clear pattern about reliability gains with respect to the level of metering.
51
CHAPTER 5 CONCLUSIONS
This project evaluated the effectiveness of congestion responsive ramp metering through simulation on a real-world freeway corridor. The US-101 northbound corridor in San Mateo County was well suited to serve as the demonstration site for this 24-7 ramp metering evaluation research effort. Caltrans currently operates a Local Mainline Responsive Ramp Metering (LMRRM) strategy in the US-101 corridor whereby metering rates are set based on the occupancy of the immediate upstream mainline detector(s).
The San Mateo NB 101 corridor has two regularly active (recurrent) bottlenecks. The upstream most bottleneck is a weave bottleneck bounded by the Hillsdale Blvd. on-ramps and the SR-92 off-ramps. The second bottleneck, a merge (and lane drop) bottleneck, is downstream of the SR-92 on-ramps. On typical weekdays, it is not uncommon for both the weave and merge bottlenecks to activate. The typical weekday congestion patterns and mainline detector occupancies show that the demand for on-ramp metering extends well beyond the normal 6:00 AM to 10:00 AM morning peak period. And the demand for on-ramp metering may very well start in the afternoon prior to the 3:00 PM beginning of the PM peak metering period.
5.1 Summary of the Findings
The analysis of the VISSIM simulation model results showed that 24-7 ramp metering could improve the mainline freeway’s performance by increasing the average travel speeds (or reducing the overall corridor travel-times), and stabilize flows through the corridor’s bottlenecks. The measured bottleneck discharge flows did not show improvements from the 24-7 metering strategies evaluated, and the travel-time reliability was largely unaffected by the implementation of the 24-7 metering strategies.
As expected, the VISSIM model showed that the 24-7 ramp metering increased the vehicular delays suffered by motorist at the on-ramps. The on-ramp delays generally increased with the level of metering, i.e., higher delays were incurred with 24-7 RM strategies with lower mainline occupancy thresholds. The corridor’s overall performance (combining the mainline delay reductions with the on-ramp’s increases in delays) could be improved through moderate 24-7 ramp metering, with a mainline detector occupancy threshold in the range of 8% – 10%. Using a lower mainline ramp metering threshold, e.g. in the range of 4%, may add enough additional delays to the on-ramps to offset the gains to the freeway’s mainline.
The US-101 VISSIM simulation modeling results focused on the 10:00 AM to 3:00 PM midday between the currently metered AM and PM peak periods for a typical non-holiday weekday. For the conditions modeled, there was insufficient congestion (in insufficient mainline occupancies) to trigger ramp metering before 6:00 AM. Likewise for the traffic conditions modeled, there was insufficient congestion to show gains from ramp metering after 9:00 PM when the current peak metering period ended. However, some level of potential performance gains could be reasonable expected on the occasion(s) where unusual congestion occurs (with higher than normal mainline occupancies) before 6:00 AM or after 9:00 PM.
5.2 Recommendations and Next Steps
The findings from this research effort were promising in that gains could be attained through 24-7 RM activation practices. This research evaluation was a simulation model based evaluation that focused on the potential performance gains for a single freeway corridor (the US-101 Northbound corridor in San Mateo County). Additional evidence and/or real-world evaluation efforts are recommended prior to 24-7 RM implementation. The most beneficial 24-7 RM strategy (mainline occupancy thresholds and accompanying metering rates) delivering the best corridor performance might vary by corridor and depend on the levels

52
of congestion, and possibly even be impacted by the corridor’s variability in congestion patterns along the corridor.
We additionally recommended that a set of data-driven quantitative evaluations be performed prior to revising Caltrans state-wide RM policies. Real-world traffic data, like that available from the Caltrans PeMS system, could be used to perform a set of “before” and “after” comparisons to facilitate an empirical evaluation (based on directly measured real-world data) where benefits from changes to ramp metering policies and strategies can be directly measured, and potential outcomes of proposed RM strategy/policy changes could be inferred. More specifically, these RM empirical evaluations should recognize and accommodate the differences between Districts and freeway corridors. The relevant factors under consideration should include:
Traffic volumes, capacities and level of congestion (v/c ratios) Current infrastructure status including traffic controllers (e.g. 2070 vs. 170), operating systems (e.g.
URMS, vs. TOS, SDRMS, SATMS etc.), centralized system for real-time control and data collection capability
Varying RM rates for different traffic demand levels for mainline and onramp, or for freeway-to-freeway connections
Traffic detector health and system data requirements; how to accommodate/incorporate connected vehicle information
Onramp storage capacity: Whether it is necessary or practical to extend or rebuild the onramp to increase the ramp’s storage capacity
Institutional issues: mainly public outreach and relationship with local jurisdictions
This research effort successfully showed that potential gains could be realized through the thoughtful implementation of a 24-7 RM strategy. Significant additional work efforts will be required to extend these findings and incorporate them into the state-wide RM policies.

53
References
1. Kristeleit, T.P., B. Bracher, K. Bogenberger, and R.L. Bertini, “Ramp Metering Algorithms and Implementations-A Worldwide overview,” Research Report No. 59, University of Munich, January 2016.
2. PeMS. Caltrans PeMS website, 2015. http://pems.eecs.berkeley.edu, accessed 03/16/2016.
3. PTV Group, PTV Vissim - http://vision-traffic.ptvgroup.com/en-us/products/ptv-vissim/, Accessed 03/16/2016.
4. Dowling, R., Skabardonis, A., et. al. “Impacts Assessment of Dynamic Speed Harmonization with Queue Warning, Task 3 Impacts Assessment Report”, Report FHWA-JPO-15-222, Washington DC, June 2015.
5. Caltrans, “Statewide Mobility Performance Report”, Sacramento, 2011 (http://www.dot.ca.gov/trafficops/mpr/docs/mpr2011.pdf).

54
Appendix A
Active Ramp Meter Locations
US-101 in San Mateo County

55
Caltrans District 4 Active Ramp Meter Locations (San Mateo County, US-101 Northbound)
Notes: * "No. of Lanes" includes SOV + HOV bypass lanes.
No Route Dir Post Mile
Interchange Ramp Type
No ofLanes*
HOV Bypass
Date Activated
Hours of Operation
Days
1 101 N 1.09 NB University Ave (Route 109) loop 1 No 2/27/2007 6-10 AM / 3-7 PM Mon-Fri 2 101 N 1.16 University Ave (Route 109)/ Donohoe St hook 1 No 2/27/2007 6-10 AM / 3-7 PM Mon-Fri 3 101 N 1.85 NB Willow Rd loop 1 No 4 101 N 1.96 SB Willow Rd diagonal 1 No 5 101 N 3.54 NB Marsh Rd loop 1 No 2/27/2007 6-10 AM / 3-7 PM Mon-Fri 6 101 N 3.70 SB Marsh Rd diagonal 3 Yes 2/27/2007 6-10 AM / 3-7 PM Mon-Fri 7 101 N 5.33 NB Route 84 / Seaport Blvd / Woodside Rd loop 2 No 2/27/2007 6-10 AM / 3-7 PM Mon-Fri 8 101 N 5.47 SB Seaport Blvd / Woodside Rd diagonal 2 Yes 2/27/2007 6-10 AM / 3-7 PM Mon-Fri 9 101 N 6.59 EB Whipple Ave loop 2 No 2/27/2007 6-10 AM / 3-7 PM Mon-Fri
10 101 N 6.67 WB Whipple Ave diagonal 1 No 2/27/2007 6-10 AM / 3-7 PM Mon-Fri 11 101 N 8.54 EB Holly St loop 2 Yes 2/27/2007 6-10 AM / 3-7 PM Mon-Fri 12 101 N 8.54 WB Holly St diagonal 2 Yes 2/27/2007 6-10 AM / 3-7 PM Mon-Fri 13 101 N 9.69 EB Ralston Ave / Marine Pkwy loop 2 Yes 2/27/2007 6-10 AM / 3-7 PM Mon-Fri 14 101 N 9.69 WB Marine Pkwy / Ralston Ave diagonal 3 Yes 2/27/2007 6-10 AM / 3-7 PM Mon-Fri 15 101 N 11.17 EB E Hillsdale Blvd loop 2 Yes 2/27/2007 6-10 AM / 3-7 PM Mon-Fri 16 101 N 11.35 WB E Hillsdale Blvd diagonal 1 No 2/27/2007 6-10 AM / 3-7 PM Mon-Fri 17 101 N 11.85 EB Route 92 connector 1 No 18 101 N 12.03 Fashion Island Blvd diagonal 2 Yes 11/12/2014 6-10 AM / 3-8 PM Mon-Fri 19 101 N 12.05 WB Route 92 connector 2 No 11/12/2014 6-10 AM / 3-8 PM Mon-Fri 20 101 N 12.72 Kehoe Ave / Norton St diagonal 1 No 11/12/2014 6-10 AM / 3-8 PM Mon-Fri 21 101 N 13.62 E 3rd Ave / E 4th Ave / J Hart Clinton Dr collector 2 No 11/12/2014 6-10 AM / 3-8 PM Mon-Fri 22 101 N 14.93 Airport Blvd / Peninsula Ave / Coyote Point Dr hook 2 No 11/12/2014 6-10 AM / 3-8 PM Mon-Fri 23 101 N 16.05 Anza Blvd / Airport Blvd hook 1 No 11/12/2014 6-10 AM / 3-8 PM Mon-Fri 24 101 N 16.79 Broadway/ Old Bayshore Hwy/ Airport Blvd collector 2 No 25 101 N 18.06 E Millbrae Ave / Bayshore Hwy / S McDonnell Rd collector 2 No 11/12/2014 6-10 AM / 3-8 PM Mon-Fri 26 101 N 19.29 SFO Domestic Terminal (lower level) diagonal 1 No 11/12/2014 6-10 AM / 3-8 PM Mon-Fri 27 101 N 20.78 San Bruno Ave / SFO Terminals collector 2 No 11/12/2014 6-10 AM / 3-8 PM Mon-Fri 28 101 N 20.91 N Access Rd (WB Route 380) diagonal 1 No 11/12/2014 6-10 AM / 3-8 PM Mon-Fri 29 101 N 20.94 S. Airport Blvd-WB 380 On-ramp diagonal 1 No 11/12/2014 6-10 AM / 3-8 PM Mon-Fri 30 101 N 20.98 EB Route 380 connector 2 No 11/12/2014 6-10 AM / 3-8 PM Mon-Fri 31 101 N 21.50 S Airport Blvd diagonal 1 No 11/12/2014 6-10 AM / 3-8 PM Mon-Fri 32 101 N 22.14 E Grand Ave / Airport Blvd diagonal 1 No 11/12/2014 6-10 AM / 3-8 PM Mon-Fri 33 101 N 22.92 Oyster Point Blvd diagonal 3 Yes 11/12/2014 6-10 AM / 3-8 PM Mon-Fri 34 101 N 23.91 Sierra Point Pkwy / Marina Blvd diagonal 1 No 11/12/2014 6-10 AM / 3-8 PM Mon-Fri 35 101 N 25.84 Harney Way / Alana Way diagonal 1 No 11/12/2014 6-10 AM / 3-8 PM Mon-Fri

56
Caltrans District 4 Active Ramp Meter Locations (San Mateo County, US-101 Southbound)
Notes: * "No. of Lanes" includes SOV + HOV bypass lanes.
No Route Dir Post Mile
Interchange Ramp Type
No ofLanes*
HOV Bypass
Date Activated
Hours of Operation
Days
36 101 S 0.70 University Ave diagonal 2 No 1/30/2007 6-10 AM / 3-7 PM Mon-Fri 37 101 S 1.75 NB Willow Rd diagonal 1 No 11/9/2009 3-7 PM Mon-Fri 38 101 S 1.89 SB Willow Rd loop 1 No 11/9/2009 3-7 PM Mon-Fri 39 101 S 3.48 NB Marsh Rd diagonal 2 Yes 1/30/2007 6-10 AM / 3-7 PM Mon-Fri 40 101 S 3.65 SB Marsh Rd loop 1 No 1/30/2007 6-10 AM / 3-7 PM Mon-Fri 41 101 S 5.17 Route 84 / Woodside Rd diagonal 3 Yes 1/30/2007 6-10 AM / 3-7 PM Mon-Fri 42 101 S 6.55 EB Whipple Ave diagonal 3 Yes 1/30/2007 6-10 AM / 3-7 PM Mon-Fri 43 101 S 6.67 WB Whipple Ave loop 1 No 1/30/2007 6-10 AM / 3-7 PM Mon-Fri 44 101 S 7.47 Brittan Ave hook 2 No 1/30/2007 6-10 AM / 3-7 PM Mon-Fri 45 101 S 7.79 Holly St collector 2 No 1/30/2007 6-10 AM / 3-7 PM Mon-Fri 46 101 S 9.11 Ralston Ave / Harbor Blvd collector 3 Yes 1/30/2007 6-10 AM / 3-7 PM Mon-Fri 47 101 S 10.88 EB E Hillsdale Blvd diagonal 1 No 2/2/2007 6-10 AM / 3-7 PM Mon-Fri 48 101 S 11.06 WB E Hillsdale Blvd loop 2 No 1/30/2007 6-10 AM / 3-7 PM Mon-Fri 49 101 S 11.69 EB Route 92 connector 1 No 5/5/2015 6-10 AM / 2:30-8 PM Mon-Fri 50 101 S 11.81 Fashion Island Blvd / 19th Ave diagonal 2 Yes 5/5/2015 6-10 AM / 2:30-8 PM Mon-Fri 51 101 S 11.92 WB Route 92 connector 1 No 52 101 S 13.36 EB E 4th Ave diagonal 2 No 5/5/2015 6-10 AM / 2:30-8 PM Mon-Fri 53 101 S 13.36 WB E 3rd Ave loop 1 No 5/5/2015 6-10 AM / 2:30-8 PM Mon-Fri 54 101 S 14.30 E Poplar Ave / N Amphlett Blvd hook 1 No 5/5/2015 6-10 AM / 2:30-8 PM Mon-Fri 55 101 S 16.46 Rollins Rd / Broadway / Cadillac Way collector 2 No 56 101 S 17.84 EB E Millbrae Ave diagonal 3 Yes 5/5/2015 6-10 AM / 2:30-8 PM Mon-Fri 57 101 S 17.94 WB E Millbrae Ave loop 1 No 5/5/2015 6-10 AM / 2:30-8 PM Mon-Fri 58 101 S 18.93 SFO Domestic Terminal (Lower Level) diagonal 2 No 5/5/2015 6-10 AM / 2:30-8 PM Mon-Fri 59 101 S 19.11 SFO International Terminal (Upper Level) diagonal 2 No 5/5/2015 6-10 AM / 2:30-8 PM Mon-Fri 60 101 S 19.45 EB Route 380 connector 2 No 5/5/2015 6-10 AM / 2:30-8 PM Mon-Fri 61 101 S 20.26 San Bruno Ave (On Route 101 Seg) diagonal 2 No 5/5/2015 6-10 AM / 2:30-8 PM Mon-Fri 62 101 S 20.48 WB Route 380 / N Access Rd collector 1 No 5/5/2015 6-10 AM / 2:30-8 PM Mon-Fri 63 101 S 21.36 Produce Ave / Terminal Ct / S Airport Blvd diagonal 3 No 5/5/2015 6-10 AM / 2:30-8 PM Mon-Fri 64 101 S 22.44 Oyster Point Blvd diagonal 2 No 5/5/2015 6-10 AM / 2:30-8 PM Mon-Fri 65 101 S 22.77 Bay Shore Blvd / Airport Blvd hook 2 Yes 5/5/2015 6-10 AM / 2:30-8 PM Mon-Fri 66 101 S 24.77 Sierra Point Pkwy / Lagoon Rd diagonal 1 No 5/5/2015 6-10 AM / 2:30-8 PM Mon-Fri 67 101 S 25.91 Harney Way / Candlestick Park diagonal 2 No 8/31/1978 6-10 AM / 2:30-8 PM Mon-Fri 36 101 S 0.70 University Ave diagonal 2 No 1/30/2007 6-10 AM / 3-7 PM Mon-Fri 37 101 S 1.75 NB Willow Rd diagonal 1 No 11/9/2009 3-7 PM Mon-Fri 38 101 S 1.89 SB Willow Rd loop 1 No 11/9/2009 3-7 PM Mon-Fri

57