Embed Size (px)
Citation preview
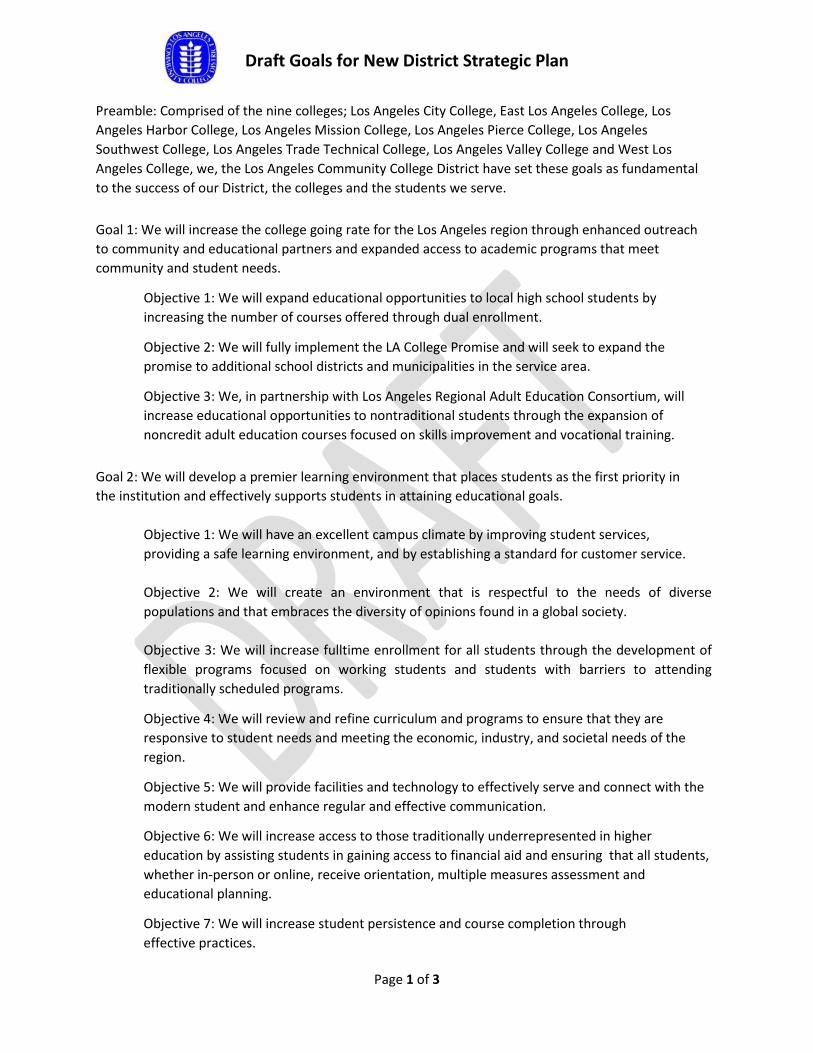
Draft Goals for New District Strategic Plan
Page 1 of 3
Preamble: Comprised of the nine colleges; Los Angeles City College, East Los Angeles College, Los Angeles Harbor College, Los Angeles Mission College, Los Angeles Pierce College, Los Angeles Southwest College, Los Angeles Trade Technical College, Los Angeles Valley College and West Los Angeles College, we, the Los Angeles Community College District have set these goals as fundamental to the success of our District, the colleges and the students we serve.
Goal 1: We will increase the college going rate for the Los Angeles region through enhanced outreach to community and educational partners and expanded access to academic programs that meet community and student needs.
Objective 1: We will expand educational opportunities to local high school students by increasing the number of courses offered through dual enrollment.
Objective 2: We will fully implement the LA College Promise and will seek to expand the promise to additional school districts and municipalities in the service area.
Objective 3: We, in partnership with Los Angeles Regional Adult Education Consortium, will increase educational opportunities to nontraditional students through the expansion of noncredit adult education courses focused on skills improvement and vocational training.
Goal 2: We will develop a premier learning environment that places students as the first priority in the institution and effectively supports students in attaining educational goals.
Objective 1: We will have an excellent campus climate by improving student services, providing a safe learning environment, and by establishing a standard for customer service. Objective 2: We will create an environment that is respectful to the needs of diverse populations and that embraces the diversity of opinions found in a global society. Objective 3: We will increase fulltime enrollment for all students through the development of flexible programs focused on working students and students with barriers to attending traditionally scheduled programs.
Objective 4: We will review and refine curriculum and programs to ensure that they are responsive to student needs and meeting the economic, industry, and societal needs of the region.
Objective 5: We will provide facilities and technology to effectively serve and connect with the modern student and enhance regular and effective communication.
Objective 6: We will increase access to those traditionally underrepresented in higher education by assisting students in gaining access to financial aid and ensuring that all students, whether in-person or online, receive orientation, multiple measures assessment and educational planning.
Objective 7: We will increase student persistence and course completion through effective practices.
Draft Goals for New District Strategic Plan
Page 2 of 3
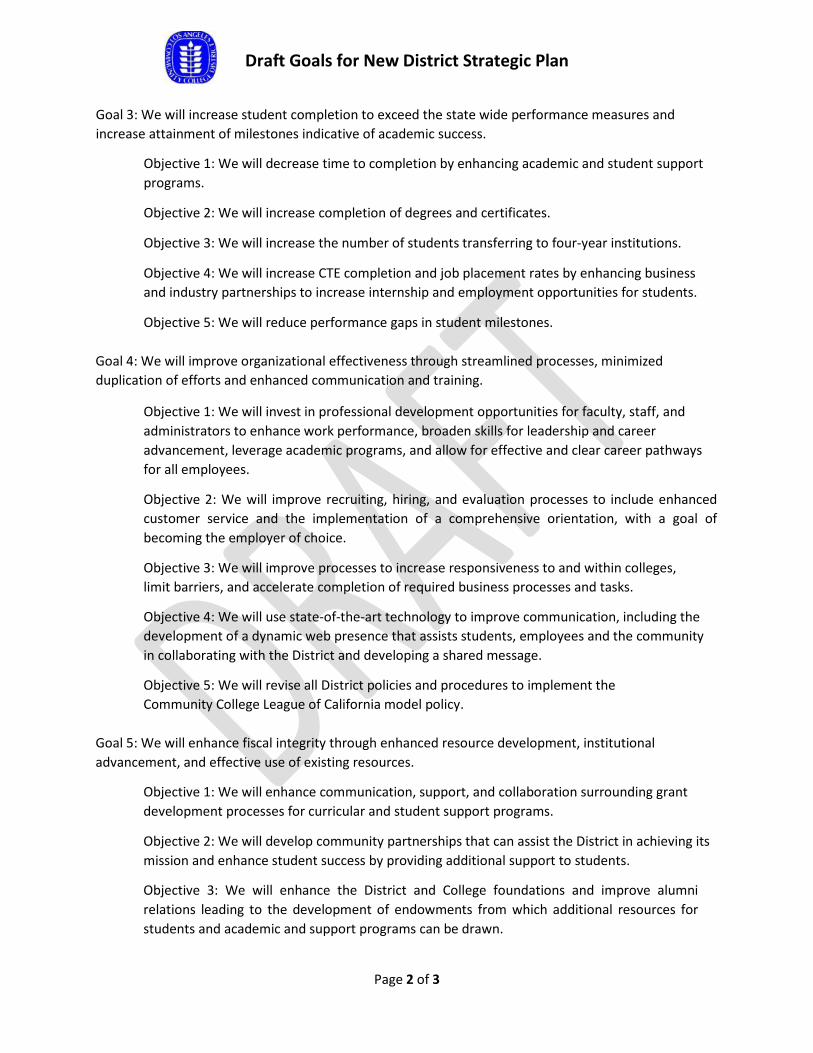
Goal 3: We will increase student completion to exceed the state wide performance measures and increase attainment of milestones indicative of academic success.
Objective 1: We will decrease time to completion by enhancing academic and student support programs.
Objective 2: We will increase completion of degrees and certificates.
Objective 3: We will increase the number of students transferring to four-year institutions.
Objective 4: We will increase CTE completion and job placement rates by enhancing business and industry partnerships to increase internship and employment opportunities for students.
Objective 5: We will reduce performance gaps in student milestones. Goal 4: We will improve organizational effectiveness through streamlined processes, minimized duplication of efforts and enhanced communication and training.
Objective 1: We will invest in professional development opportunities for faculty, staff, and administrators to enhance work performance, broaden skills for leadership and career advancement, leverage academic programs, and allow for effective and clear career pathways for all employees.
Objective 2: We will improve recruiting, hiring, and evaluation processes to include enhanced customer service and the implementation of a comprehensive orientation, with a goal of becoming the employer of choice.
Objective 3: We will improve processes to increase responsiveness to and within colleges, limit barriers, and accelerate completion of required business processes and tasks.
Objective 4: We will use state-of-the-art technology to improve communication, including the development of a dynamic web presence that assists students, employees and the community in collaborating with the District and developing a shared message.
Objective 5: We will revise all District policies and procedures to implement the Community College League of California model policy.
Goal 5: We will enhance fiscal integrity through enhanced resource development, institutional advancement, and effective use of existing resources.
Objective 1: We will enhance communication, support, and collaboration surrounding grant development processes for curricular and student support programs.
Objective 2: We will develop community partnerships that can assist the District in achieving its mission and enhance student success by providing additional support to students.
Objective 3: We will enhance the District and College foundations and improve alumni relations leading to the development of endowments from which additional resources for students and academic and support programs can be drawn.

Draft Goals for New District Strategic Plan
Page 3 of 3
Objective 4: We will effectively use District and College resources and implement position control to support the ongoing improvements of academic and student support programs.
Objective 5: We will improve the resource allocation processes to be integrated with District strategic plan. Objective 6: We will effectively plan and use resources to build and maintain District and College facilities and infrastructure in support of the academic and student support programs. Objective 7: We will develop and implement districtwide standards in information technology, facilities, and human resources that apply to all colleges.
1
Strategic Goals & Performance Measures Outcomes
GOAL 1: Access and Preparation for Success. Improve equitable access; help students attain important early educational momentum points.
Objective 1: Ensure equitable access to education. Measure 1: Participation rate in underserved areas Measure 2: Percentage of eligible students receiving financial aid
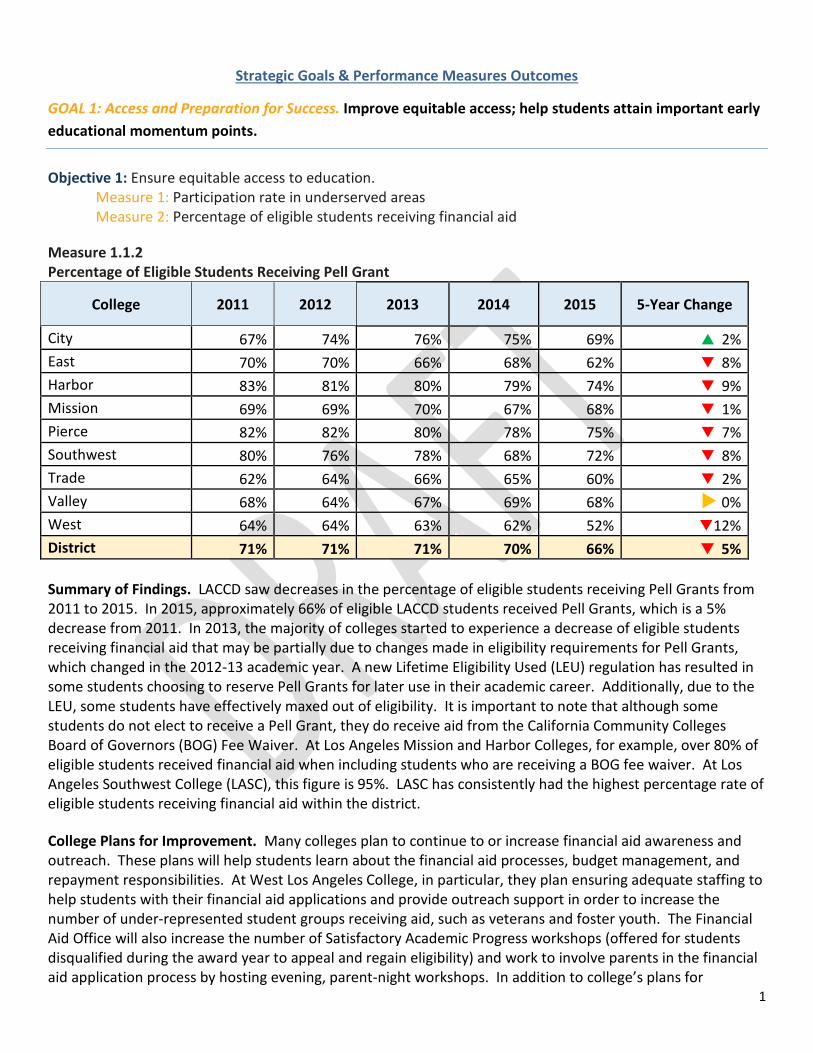
Measure 1.1.2 Percentage of Eligible Students Receiving Pell Grant
College 2011 2012 2013 2014 2015 5-Year Change
City 67% 74% 76% 75% 69% 2% East 70% 70% 66% 68% 62% 8% Harbor 83% 81% 80% 79% 74% 9% Mission 69% 69% 70% 67% 68% 1% Pierce 82% 82% 80% 78% 75% 7% Southwest 80% 76% 78% 68% 72% 8% Trade 62% 64% 66% 65% 60% 2% Valley 68% 64% 67% 69% 68% 0% West 64% 64% 63% 62% 52% 12% District 71% 71% 71% 70% 66% 5% Summary of Findings. LACCD saw decreases in the percentage of eligible students receiving Pell Grants from 2011 to 2015. In 2015, approximately 66% of eligible LACCD students received Pell Grants, which is a 5% decrease from 2011. In 2013, the majority of colleges started to experience a decrease of eligible students receiving financial aid that may be partially due to changes made in eligibility requirements for Pell Grants, which changed in the 2012-13 academic year. A new Lifetime Eligibility Used (LEU) regulation has resulted in some students choosing to reserve Pell Grants for later use in their academic career. Additionally, due to the LEU, some students have effectively maxed out of eligibility. It is important to note that although some students do not elect to receive a Pell Grant, they do receive aid from the California Community Colleges Board of Governors (BOG) Fee Waiver. At Los Angeles Mission and Harbor Colleges, for example, over 80% of eligible students received financial aid when including students who are receiving a BOG fee waiver. At Los Angeles Southwest College (LASC), this figure is 95%. LASC has consistently had the highest percentage rate of eligible students receiving financial aid within the district. College Plans for Improvement. Many colleges plan to continue to or increase financial aid awareness and outreach. These plans will help students learn about the financial aid processes, budget management, and repayment responsibilities. At West Los Angeles College, in particular, they plan ensuring adequate staffing to help students with their financial aid applications and provide outreach support in order to increase the number of under-represented student groups receiving aid, such as veterans and foster youth. The Financial Aid Office will also increase the number of Satisfactory Academic Progress workshops (offered for students disqualified during the award year to appeal and regain eligibility) and work to involve parents in the financial aid application process by hosting evening, parent-night workshops. In addition to college’s plans for
2
improvement, it may be sensible to consider reporting additional metrics in order to accurately capture the percentage of eligible students receiving financial aid. While reporting the percentage of eligible students receiving Pell Grants is a good foundation, the recent changes in LEU regulations may underestimate the number of students receiving aid from other sources, such as the BOG fee waiver presently and the LA Promise students in the future. Reporting percentages of eligible students receiving Pell Grants and the percentage of students receiving aid from other sources may help more accurately capture this metric. Goal 1, Objective 1 Conclusion. Although LACCD provides an affordable post-secondary education, a great deal of students could not afford college without federally-funded Pell Grants. In the 2011-12 academic year, less than half (43.6%) of all students at all 2-year public colleges received any type of federal aid, including a Pell Grant.1 In the same years, 71% of eligible LACCD students received Pell Grants. This means that LACCD is above the national average and doing well in making sure that students apply for aid. In addition, some colleges note that new and younger students do not use financial aid properly. Because of this, LACCD recognizes that ensuring that students are provided and actively use financial aid resources will be an integral part of increasing the percentage of eligible students receiving financial aid. For example, Los Angeles City College has been actively addressing the increase in demand for financial aid services by building new online resources to meet the demand. Employing these methods, in addition to continued outreach students, will help ensure that students eligible for aid will get the resources and aid needed in order to improve equitable access and help students attain important early educational momentum points. Objective 2: Increase the percentage of new students who complete the matriculation process by the end of their first semester.
Measure 1: Percentage of new students completing an English and math assessment before or in the first term Measure 2: Percentage of new students completing orientation Measure 3: Percentage of new students creating an educational plan
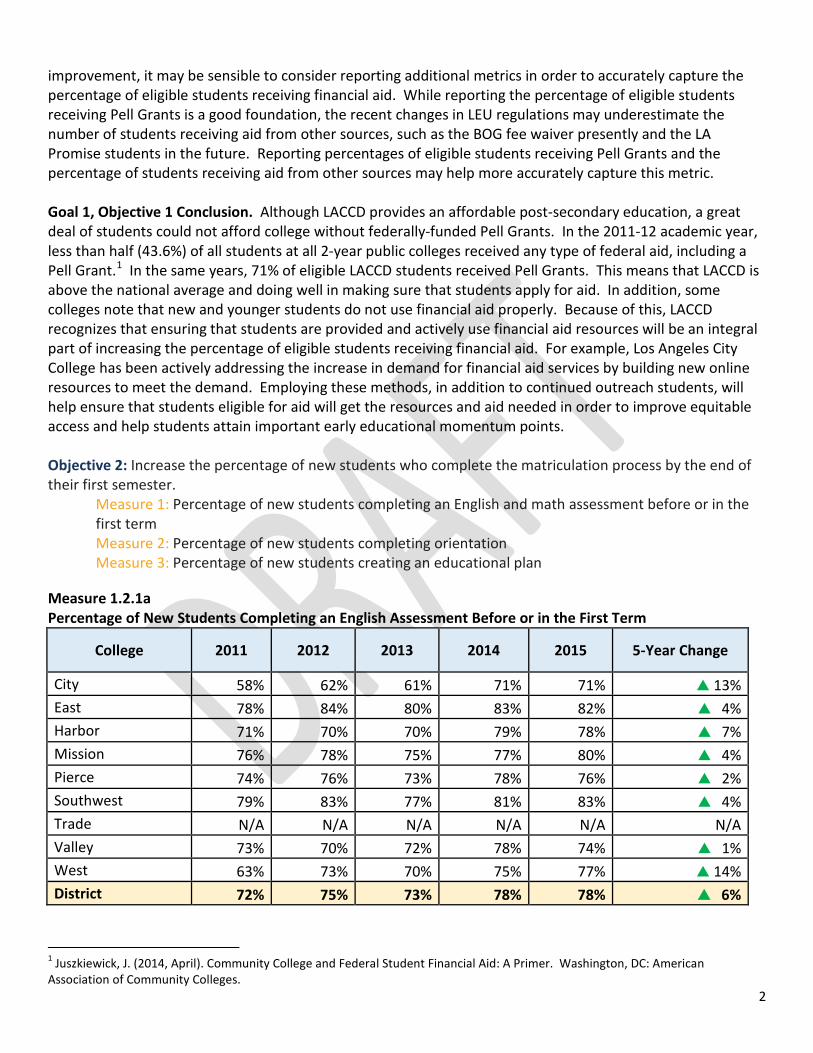
Measure 1.2.1a Percentage of New Students Completing an English Assessment Before or in the First Term
College 2011 2012 2013 2014 2015 5-Year Change
City 58% 62% 61% 71% 71% 13% East 78% 84% 80% 83% 82% 4% Harbor 71% 70% 70% 79% 78% 7% Mission 76% 78% 75% 77% 80% 4% Pierce 74% 76% 73% 78% 76% 2% Southwest 79% 83% 77% 81% 83% 4% Trade N/A N/A N/A N/A N/A N/A Valley 73% 70% 72% 78% 74% 1% West 63% 73% 70% 75% 77% 14% District 72% 75% 73% 78% 78% 6%
1 Juszkiewick, J. (2014, April). Community College and Federal Student Financial Aid: A Primer. Washington, DC: American Association of Community Colleges.
3
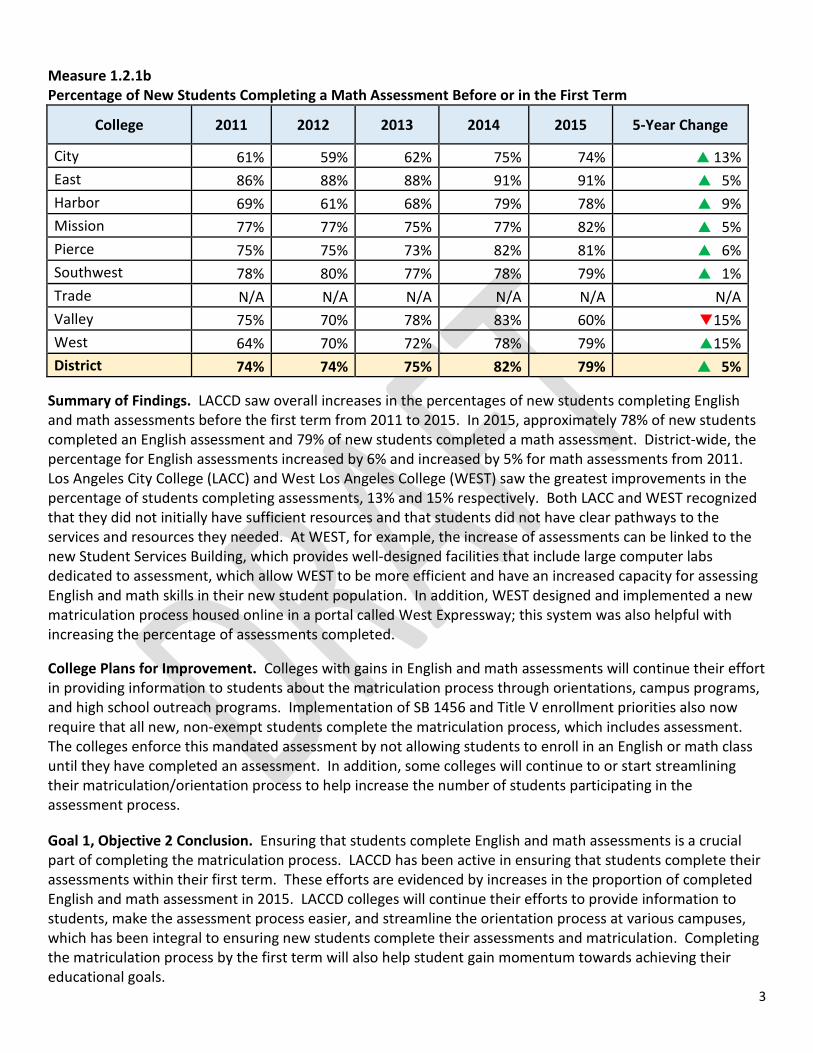
Measure 1.2.1b Percentage of New Students Completing a Math Assessment Before or in the First Term
College 2011 2012 2013 2014 2015 5-Year Change
City 61% 59% 62% 75% 74% 13% East 86% 88% 88% 91% 91% 5% Harbor 69% 61% 68% 79% 78% 9% Mission 77% 77% 75% 77% 82% 5% Pierce 75% 75% 73% 82% 81% 6% Southwest 78% 80% 77% 78% 79% 1% Trade N/A N/A N/A N/A N/A N/A Valley 75% 70% 78% 83% 60% 15% West 64% 70% 72% 78% 79% 15% District 74% 74% 75% 82% 79% 5%
Summary of Findings. LACCD saw overall increases in the percentages of new students completing English and math assessments before the first term from 2011 to 2015. In 2015, approximately 78% of new students completed an English assessment and 79% of new students completed a math assessment. District-wide, the percentage for English assessments increased by 6% and increased by 5% for math assessments from 2011. Los Angeles City College (LACC) and West Los Angeles College (WEST) saw the greatest improvements in the percentage of students completing assessments, 13% and 15% respectively. Both LACC and WEST recognized that they did not initially have sufficient resources and that students did not have clear pathways to the services and resources they needed. At WEST, for example, the increase of assessments can be linked to the new Student Services Building, which provides well-designed facilities that include large computer labs dedicated to assessment, which allow WEST to be more efficient and have an increased capacity for assessing English and math skills in their new student population. In addition, WEST designed and implemented a new matriculation process housed online in a portal called West Expressway; this system was also helpful with increasing the percentage of assessments completed. College Plans for Improvement. Colleges with gains in English and math assessments will continue their effort in providing information to students about the matriculation process through orientations, campus programs, and high school outreach programs. Implementation of SB 1456 and Title V enrollment priorities also now require that all new, non-exempt students complete the matriculation process, which includes assessment. The colleges enforce this mandated assessment by not allowing students to enroll in an English or math class until they have completed an assessment. In addition, some colleges will continue to or start streamlining their matriculation/orientation process to help increase the number of students participating in the assessment process. Goal 1, Objective 2 Conclusion. Ensuring that students complete English and math assessments is a crucial part of completing the matriculation process. LACCD has been active in ensuring that students complete their assessments within their first term. These efforts are evidenced by increases in the proportion of completed English and math assessment in 2015. LACCD colleges will continue their efforts to provide information to students, make the assessment process easier, and streamline the orientation process at various campuses, which has been integral to ensuring new students complete their assessments and matriculation. Completing the matriculation process by the first term will also help student gain momentum towards achieving their educational goals.
4
Objective 3: Increase the percentage of new students successfully completing at least one English and Math class in their first year and persisting to subsequent terms.
Measure 1: Percentage of new students successfully completing at least one English and math class in their first year Measure 2: Persistence (Fall to Spring and Fall to Fall)
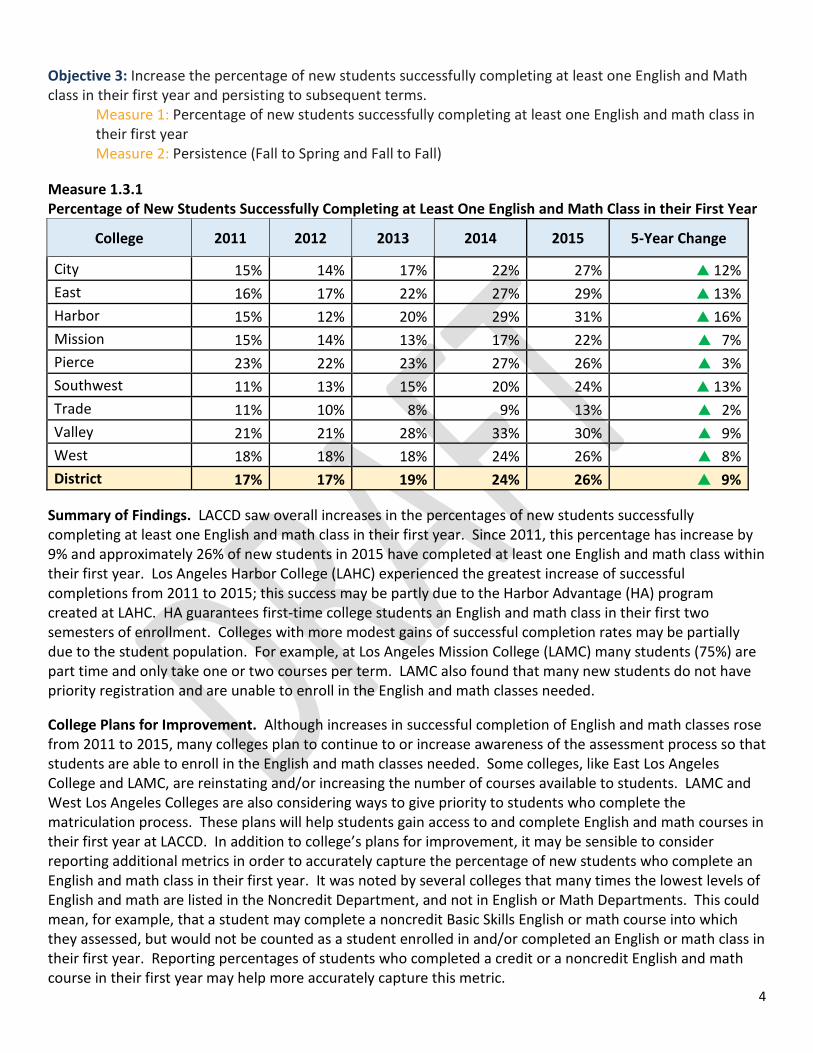
Measure 1.3.1 Percentage of New Students Successfully Completing at Least One English and Math Class in their First Year
College 2011 2012 2013 2014 2015 5-Year Change
City 15% 14% 17% 22% 27% 12% East 16% 17% 22% 27% 29% 13% Harbor 15% 12% 20% 29% 31% 16% Mission 15% 14% 13% 17% 22% 7% Pierce 23% 22% 23% 27% 26% 3% Southwest 11% 13% 15% 20% 24% 13% Trade 11% 10% 8% 9% 13% 2% Valley 21% 21% 28% 33% 30% 9% West 18% 18% 18% 24% 26% 8% District 17% 17% 19% 24% 26% 9%
Summary of Findings. LACCD saw overall increases in the percentages of new students successfully completing at least one English and math class in their first year. Since 2011, this percentage has increase by 9% and approximately 26% of new students in 2015 have completed at least one English and math class within their first year. Los Angeles Harbor College (LAHC) experienced the greatest increase of successful completions from 2011 to 2015; this success may be partly due to the Harbor Advantage (HA) program created at LAHC. HA guarantees first-time college students an English and math class in their first two semesters of enrollment. Colleges with more modest gains of successful completion rates may be partially due to the student population. For example, at Los Angeles Mission College (LAMC) many students (75%) are part time and only take one or two courses per term. LAMC also found that many new students do not have priority registration and are unable to enroll in the English and math classes needed. College Plans for Improvement. Although increases in successful completion of English and math classes rose from 2011 to 2015, many colleges plan to continue to or increase awareness of the assessment process so that students are able to enroll in the English and math classes needed. Some colleges, like East Los Angeles College and LAMC, are reinstating and/or increasing the number of courses available to students. LAMC and West Los Angeles Colleges are also considering ways to give priority to students who complete the matriculation process. These plans will help students gain access to and complete English and math courses in their first year at LACCD. In addition to college’s plans for improvement, it may be sensible to consider reporting additional metrics in order to accurately capture the percentage of new students who complete an English and math class in their first year. It was noted by several colleges that many times the lowest levels of English and math are listed in the Noncredit Department, and not in English or Math Departments. This could mean, for example, that a student may complete a noncredit Basic Skills English or math course into which they assessed, but would not be counted as a student enrolled in and/or completed an English or math class in their first year. Reporting percentages of students who completed a credit or a noncredit English and math course in their first year may help more accurately capture this metric.
5
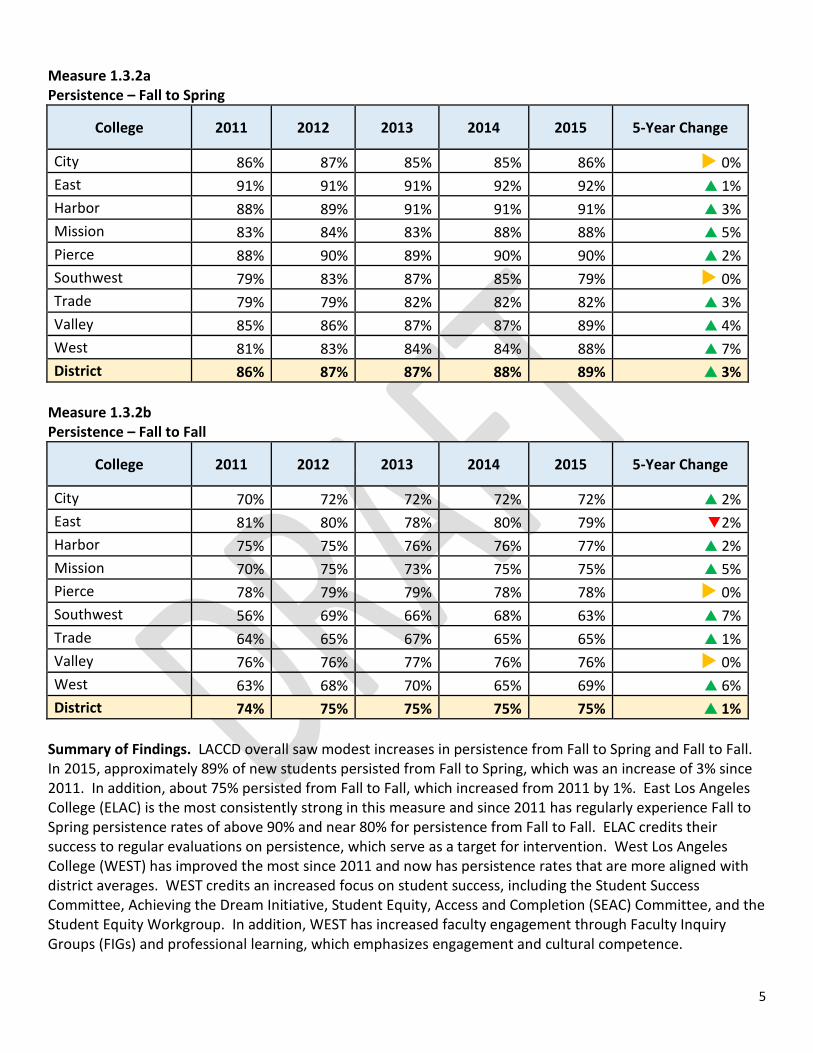
Measure 1.3.2a Persistence – Fall to Spring
College 2011 2012 2013 2014 2015 5-Year Change
City 86% 87% 85% 85% 86% 0% East 91% 91% 91% 92% 92% 1% Harbor 88% 89% 91% 91% 91% 3% Mission 83% 84% 83% 88% 88% 5% Pierce 88% 90% 89% 90% 90% 2% Southwest 79% 83% 87% 85% 79% 0% Trade 79% 79% 82% 82% 82% 3% Valley 85% 86% 87% 87% 89% 4% West 81% 83% 84% 84% 88% 7% District 86% 87% 87% 88% 89% 3%
Measure 1.3.2b Persistence – Fall to Fall
College 2011 2012 2013 2014 2015 5-Year Change
City 70% 72% 72% 72% 72% 2% East 81% 80% 78% 80% 79% 2% Harbor 75% 75% 76% 76% 77% 2% Mission 70% 75% 73% 75% 75% 5% Pierce 78% 79% 79% 78% 78% 0% Southwest 56% 69% 66% 68% 63% 7% Trade 64% 65% 67% 65% 65% 1% Valley 76% 76% 77% 76% 76% 0% West 63% 68% 70% 65% 69% 6% District 74% 75% 75% 75% 75% 1%
Summary of Findings. LACCD overall saw modest increases in persistence from Fall to Spring and Fall to Fall. In 2015, approximately 89% of new students persisted from Fall to Spring, which was an increase of 3% since 2011. In addition, about 75% persisted from Fall to Fall, which increased from 2011 by 1%. East Los Angeles College (ELAC) is the most consistently strong in this measure and since 2011 has regularly experience Fall to Spring persistence rates of above 90% and near 80% for persistence from Fall to Fall. ELAC credits their success to regular evaluations on persistence, which serve as a target for intervention. West Los Angeles College (WEST) has improved the most since 2011 and now has persistence rates that are more aligned with district averages. WEST credits an increased focus on student success, including the Student Success Committee, Achieving the Dream Initiative, Student Equity, Access and Completion (SEAC) Committee, and the Student Equity Workgroup. In addition, WEST has increased faculty engagement through Faculty Inquiry Groups (FIGs) and professional learning, which emphasizes engagement and cultural competence.
6
College Plans for Improvement. Although small increases in persistence were found from 2011 to 2015, many colleges plan to continue their efforts to ensure that new students have a clear path to completion that is inclusive of completing an English and math course in their first year. Some colleges, like Los Angeles Mission College, will also re-examine sequencing to ensure that there are enough sections offered to accommodate all students that are prepared to take the next course in the sequence. In addition, efforts will be made to guide students towards programs that support student success and persistence, such as Los Angeles Southwest College’s First Year Experience and Passage programs or Los Angeles Harbor College’s Harbor Advantage program. Goal 1, Objective 3 Conclusion. Ensuring that students complete an English and math course in their first year and persist to subsequent terms is essential to helping students attain early educational momentum and be successful in college. LACCD overall saw modest increases first-year English and math course completions and in persistence. Additional measures of persistence were also examined, including the California Community Colleges Chancellor's Office Data Mart2 that reports the percentage of degree, certificate and/or transfer-seeking students enrolled in the first three consecutive terms (for students starting first time in 2009-10). The statewide proportion of students was 73.4%, while the LACCD district average was 70.8%. This finding, coupled with internal measures of persistence, suggest that LACCD is doing about average when compared to statewide persistent rates and should remain active in ensuring that students have clear pathways to completion and that colleges have programs aimed directly at increasing persistence among first-year students. Increasing knowledge and availability of assessments, along with helping with registration priority for new students may help LACCD increase the percentage of English and math courses completed by students in their first year. Supporting student programs, along with continual monitoring of persistence will allow LACCD to maintain and/or increase already high rates of persistence. Both objectives help students attain early educational momentum and complete their educational goals efficiently.
2 http://scorecard.cccco.edu/scorecard.aspx
7
GOAL 2: Teaching and Learning for Success. Strengthen effective teaching and learning by providing a learner-centered educational environment; help students attain their goals of certificate and degree completion, transfer, and job training and career placement; increase equity in the achievement of these outcomes.
Objective 1: Provide a learner-centered learning environment that encourages active learning and student engagement.
Measure 1: Measure of active learning/project learning (from student survey). Measure of student engagement in and out of class (from student survey).
Measure of self-efficacy/self-directed learning (from student survey). Measure 2: Measure of whether/how technology is being used to improve student learning and engagement (from student survey and District Employee Survey, which is to be developed).
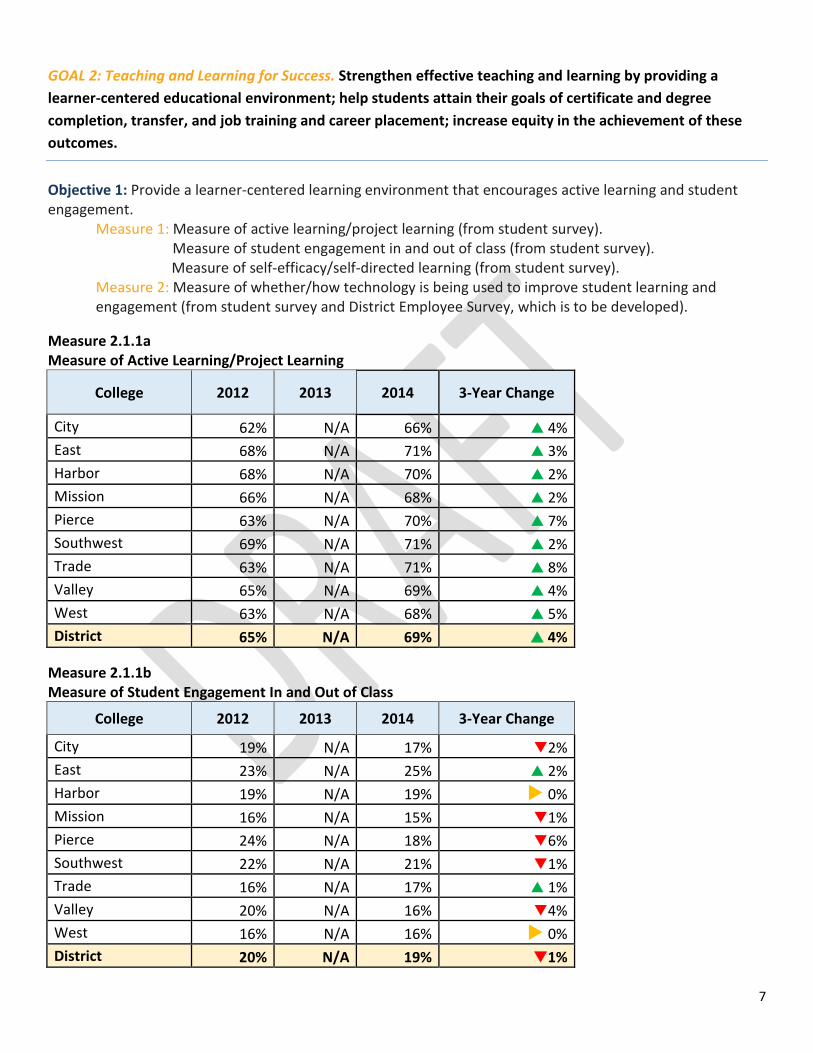
Measure 2.1.1a Measure of Active Learning/Project Learning
College 2012 2013 2014 3-Year Change
City 62% N/A 66% 4% East 68% N/A 71% 3% Harbor 68% N/A 70% 2% Mission 66% N/A 68% 2% Pierce 63% N/A 70% 7% Southwest 69% N/A 71% 2% Trade 63% N/A 71% 8% Valley 65% N/A 69% 4% West 63% N/A 68% 5% District 65% N/A 69% 4%
Measure 2.1.1b Measure of Student Engagement In and Out of Class
College 2012 2013 2014 3-Year Change
City 19% N/A 17% 2% East 23% N/A 25% 2% Harbor 19% N/A 19% 0% Mission 16% N/A 15% 1% Pierce 24% N/A 18% 6% Southwest 22% N/A 21% 1% Trade 16% N/A 17% 1% Valley 20% N/A 16% 4% West 16% N/A 16% 0% District 20% N/A 19% 1%
8
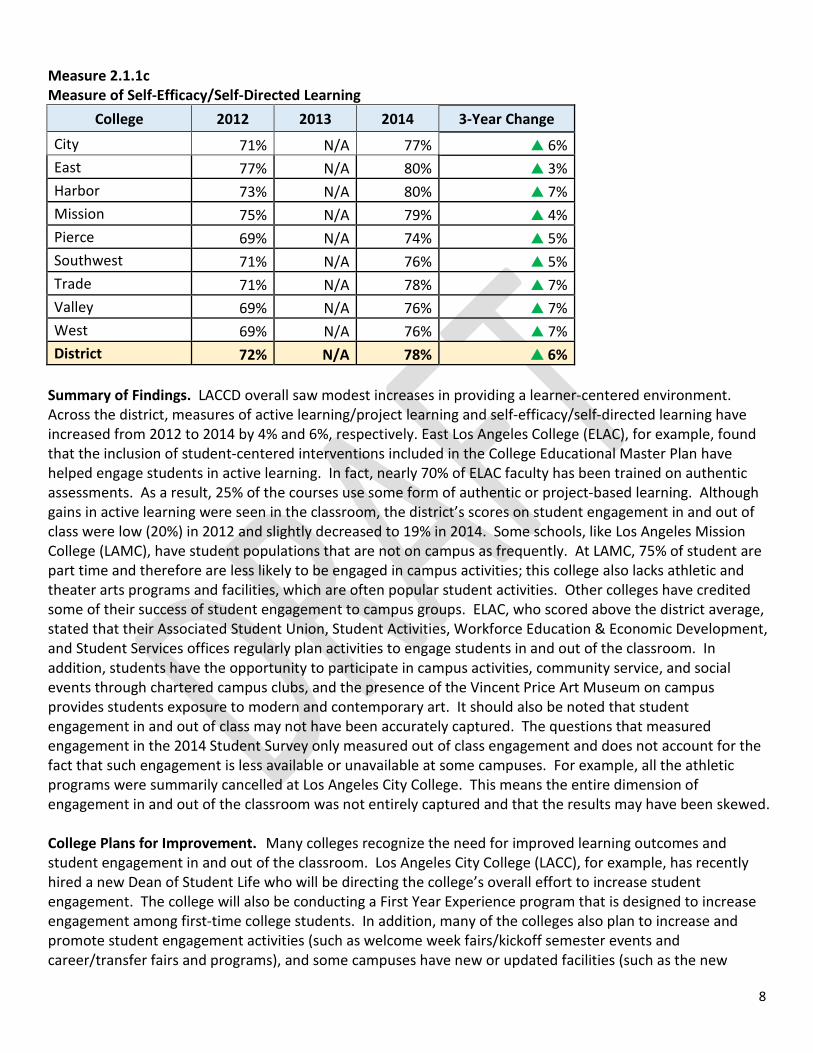
Measure 2.1.1c Measure of Self-Efficacy/Self-Directed Learning
College 2012 2013 2014 3-Year Change City 71% N/A 77% 6% East 77% N/A 80% 3% Harbor 73% N/A 80% 7% Mission 75% N/A 79% 4% Pierce 69% N/A 74% 5% Southwest 71% N/A 76% 5% Trade 71% N/A 78% 7% Valley 69% N/A 76% 7% West 69% N/A 76% 7% District 72% N/A 78% 6%
Summary of Findings. LACCD overall saw modest increases in providing a learner-centered environment. Across the district, measures of active learning/project learning and self-efficacy/self-directed learning have increased from 2012 to 2014 by 4% and 6%, respectively. East Los Angeles College (ELAC), for example, found that the inclusion of student-centered interventions included in the College Educational Master Plan have helped engage students in active learning. In fact, nearly 70% of ELAC faculty has been trained on authentic assessments. As a result, 25% of the courses use some form of authentic or project-based learning. Although gains in active learning were seen in the classroom, the district’s scores on student engagement in and out of class were low (20%) in 2012 and slightly decreased to 19% in 2014. Some schools, like Los Angeles Mission College (LAMC), have student populations that are not on campus as frequently. At LAMC, 75% of student are part time and therefore are less likely to be engaged in campus activities; this college also lacks athletic and theater arts programs and facilities, which are often popular student activities. Other colleges have credited some of their success of student engagement to campus groups. ELAC, who scored above the district average, stated that their Associated Student Union, Student Activities, Workforce Education & Economic Development, and Student Services offices regularly plan activities to engage students in and out of the classroom. In addition, students have the opportunity to participate in campus activities, community service, and social events through chartered campus clubs, and the presence of the Vincent Price Art Museum on campus provides students exposure to modern and contemporary art. It should also be noted that student engagement in and out of class may not have been accurately captured. The questions that measured engagement in the 2014 Student Survey only measured out of class engagement and does not account for the fact that such engagement is less available or unavailable at some campuses. For example, all the athletic programs were summarily cancelled at Los Angeles City College. This means the entire dimension of engagement in and out of the classroom was not entirely captured and that the results may have been skewed. College Plans for Improvement. Many colleges recognize the need for improved learning outcomes and student engagement in and out of the classroom. Los Angeles City College (LACC), for example, has recently hired a new Dean of Student Life who will be directing the college’s overall effort to increase student engagement. The college will also be conducting a First Year Experience program that is designed to increase engagement among first-time college students. In addition, many of the colleges also plan to increase and promote student engagement activities (such as welcome week fairs/kickoff semester events and career/transfer fairs and programs), and some campuses have new or updated facilities (such as the new
9
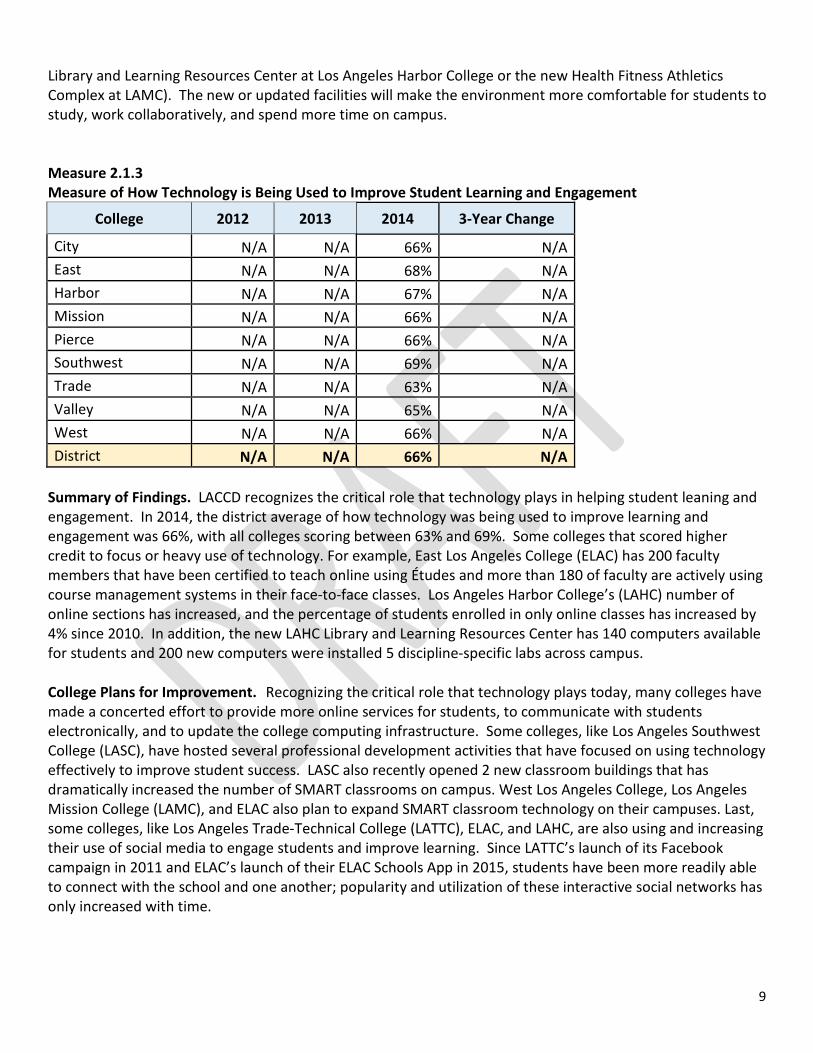
Library and Learning Resources Center at Los Angeles Harbor College or the new Health Fitness Athletics Complex at LAMC). The new or updated facilities will make the environment more comfortable for students to study, work collaboratively, and spend more time on campus. Measure 2.1.3 Measure of How Technology is Being Used to Improve Student Learning and Engagement
College 2012 2013 2014 3-Year Change
City N/A N/A 66% N/A East N/A N/A 68% N/A Harbor N/A N/A 67% N/A Mission N/A N/A 66% N/A Pierce N/A N/A 66% N/A Southwest N/A N/A 69% N/A Trade N/A N/A 63% N/A Valley N/A N/A 65% N/A West N/A N/A 66% N/A District N/A N/A 66% N/A
Summary of Findings. LACCD recognizes the critical role that technology plays in helping student leaning and engagement. In 2014, the district average of how technology was being used to improve learning and engagement was 66%, with all colleges scoring between 63% and 69%. Some colleges that scored higher credit to focus or heavy use of technology. For example, East Los Angeles College (ELAC) has 200 faculty members that have been certified to teach online using Études and more than 180 of faculty are actively using course management systems in their face-to-face classes. Los Angeles Harbor College’s (LAHC) number of online sections has increased, and the percentage of students enrolled in only online classes has increased by 4% since 2010. In addition, the new LAHC Library and Learning Resources Center has 140 computers available for students and 200 new computers were installed 5 discipline-specific labs across campus. College Plans for Improvement. Recognizing the critical role that technology plays today, many colleges have made a concerted effort to provide more online services for students, to communicate with students electronically, and to update the college computing infrastructure. Some colleges, like Los Angeles Southwest College (LASC), have hosted several professional development activities that have focused on using technology effectively to improve student success. LASC also recently opened 2 new classroom buildings that has dramatically increased the number of SMART classrooms on campus. West Los Angeles College, Los Angeles Mission College (LAMC), and ELAC also plan to expand SMART classroom technology on their campuses. Last, some colleges, like Los Angeles Trade-Technical College (LATTC), ELAC, and LAHC, are also using and increasing their use of social media to engage students and improve learning. Since LATTC’s launch of its Facebook campaign in 2011 and ELAC’s launch of their ELAC Schools App in 2015, students have been more readily able to connect with the school and one another; popularity and utilization of these interactive social networks has only increased with time.
10
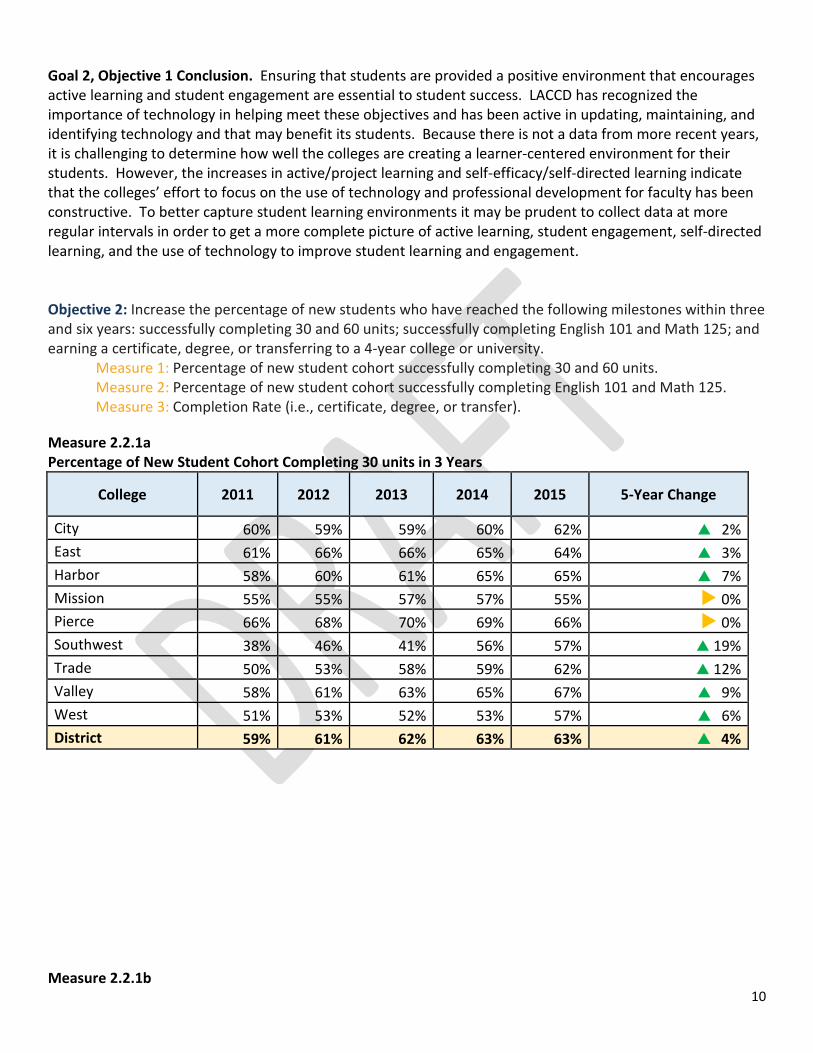
Goal 2, Objective 1 Conclusion. Ensuring that students are provided a positive environment that encourages active learning and student engagement are essential to student success. LACCD has recognized the importance of technology in helping meet these objectives and has been active in updating, maintaining, and identifying technology and that may benefit its students. Because there is not a data from more recent years, it is challenging to determine how well the colleges are creating a learner-centered environment for their students. However, the increases in active/project learning and self-efficacy/self-directed learning indicate that the colleges’ effort to focus on the use of technology and professional development for faculty has been constructive. To better capture student learning environments it may be prudent to collect data at more regular intervals in order to get a more complete picture of active learning, student engagement, self-directed learning, and the use of technology to improve student learning and engagement. Objective 2: Increase the percentage of new students who have reached the following milestones within three and six years: successfully completing 30 and 60 units; successfully completing English 101 and Math 125; and earning a certificate, degree, or transferring to a 4-year college or university.
Measure 1: Percentage of new student cohort successfully completing 30 and 60 units. Measure 2: Percentage of new student cohort successfully completing English 101 and Math 125. Measure 3: Completion Rate (i.e., certificate, degree, or transfer).
Measure 2.2.1a Percentage of New Student Cohort Completing 30 units in 3 Years
College 2011 2012 2013 2014 2015 5-Year Change
City 60% 59% 59% 60% 62% 2% East 61% 66% 66% 65% 64% 3% Harbor 58% 60% 61% 65% 65% 7% Mission 55% 55% 57% 57% 55% 0% Pierce 66% 68% 70% 69% 66% 0% Southwest 38% 46% 41% 56% 57% 19% Trade 50% 53% 58% 59% 62% 12% Valley 58% 61% 63% 65% 67% 9% West 51% 53% 52% 53% 57% 6% District 59% 61% 62% 63% 63% 4%
Measure 2.2.1b
11
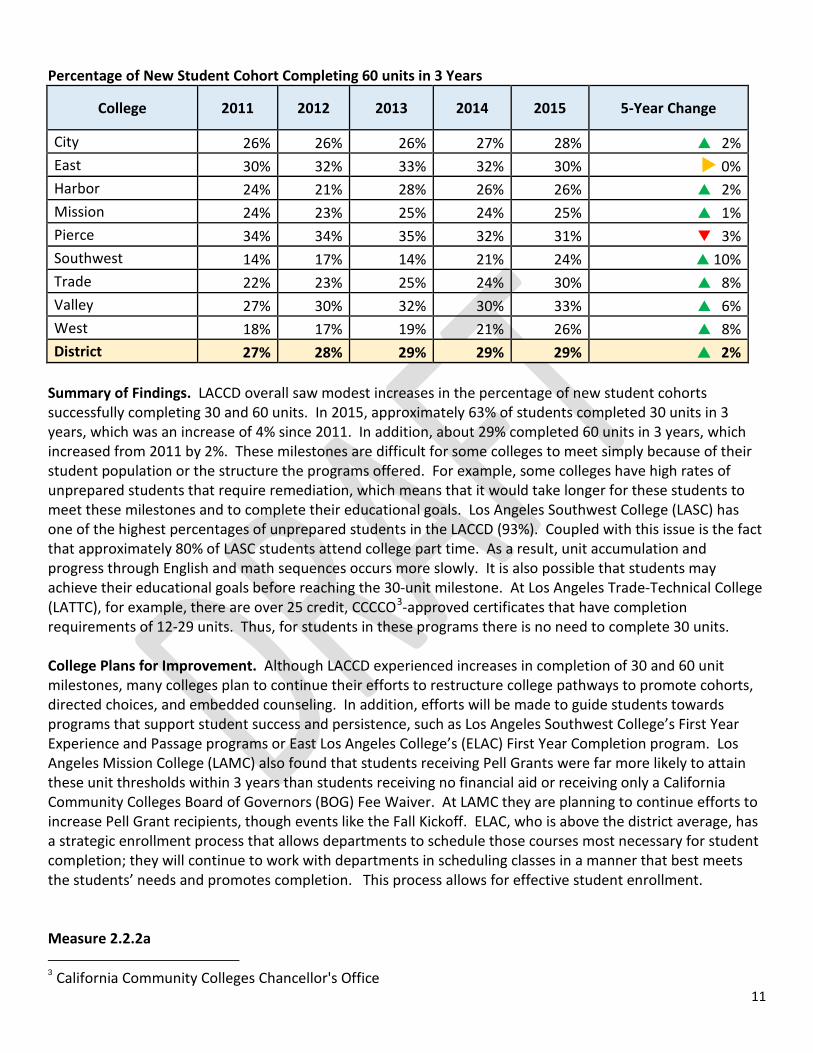
Percentage of New Student Cohort Completing 60 units in 3 Years
College 2011 2012 2013 2014 2015 5-Year Change
City 26% 26% 26% 27% 28% 2% East 30% 32% 33% 32% 30% 0% Harbor 24% 21% 28% 26% 26% 2% Mission 24% 23% 25% 24% 25% 1% Pierce 34% 34% 35% 32% 31% 3% Southwest 14% 17% 14% 21% 24% 10% Trade 22% 23% 25% 24% 30% 8% Valley 27% 30% 32% 30% 33% 6% West 18% 17% 19% 21% 26% 8% District 27% 28% 29% 29% 29% 2%
Summary of Findings. LACCD overall saw modest increases in the percentage of new student cohorts successfully completing 30 and 60 units. In 2015, approximately 63% of students completed 30 units in 3 years, which was an increase of 4% since 2011. In addition, about 29% completed 60 units in 3 years, which increased from 2011 by 2%. These milestones are difficult for some colleges to meet simply because of their student population or the structure the programs offered. For example, some colleges have high rates of unprepared students that require remediation, which means that it would take longer for these students to meet these milestones and to complete their educational goals. Los Angeles Southwest College (LASC) has one of the highest percentages of unprepared students in the LACCD (93%). Coupled with this issue is the fact that approximately 80% of LASC students attend college part time. As a result, unit accumulation and progress through English and math sequences occurs more slowly. It is also possible that students may achieve their educational goals before reaching the 30-unit milestone. At Los Angeles Trade-Technical College (LATTC), for example, there are over 25 credit, CCCCO3-approved certificates that have completion requirements of 12-29 units. Thus, for students in these programs there is no need to complete 30 units. College Plans for Improvement. Although LACCD experienced increases in completion of 30 and 60 unit milestones, many colleges plan to continue their efforts to restructure college pathways to promote cohorts, directed choices, and embedded counseling. In addition, efforts will be made to guide students towards programs that support student success and persistence, such as Los Angeles Southwest College’s First Year Experience and Passage programs or East Los Angeles College’s (ELAC) First Year Completion program. Los Angeles Mission College (LAMC) also found that students receiving Pell Grants were far more likely to attain these unit thresholds within 3 years than students receiving no financial aid or receiving only a California Community Colleges Board of Governors (BOG) Fee Waiver. At LAMC they are planning to continue efforts to increase Pell Grant recipients, though events like the Fall Kickoff. ELAC, who is above the district average, has a strategic enrollment process that allows departments to schedule those courses most necessary for student completion; they will continue to work with departments in scheduling classes in a manner that best meets the students’ needs and promotes completion. This process allows for effective student enrollment. Measure 2.2.2a 3 California Community Colleges Chancellor's Office
12
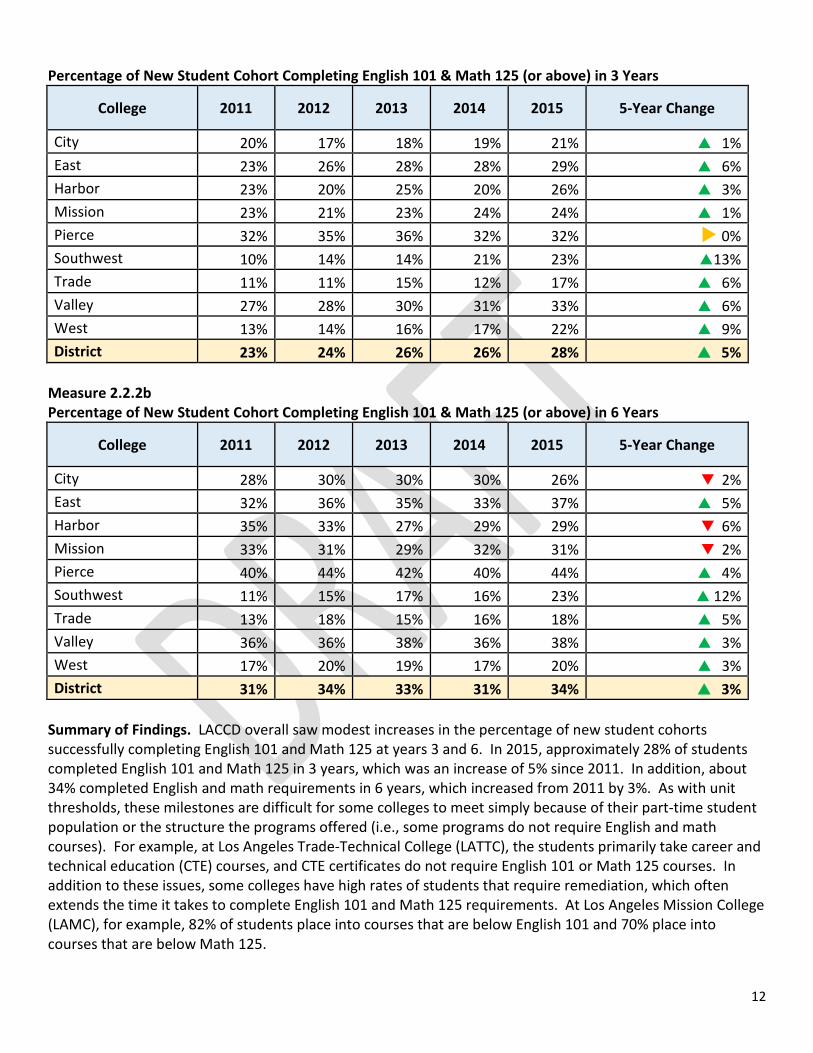
Percentage of New Student Cohort Completing English 101 & Math 125 (or above) in 3 Years
College 2011 2012 2013 2014 2015 5-Year Change
City 20% 17% 18% 19% 21% 1% East 23% 26% 28% 28% 29% 6% Harbor 23% 20% 25% 20% 26% 3% Mission 23% 21% 23% 24% 24% 1% Pierce 32% 35% 36% 32% 32% 0% Southwest 10% 14% 14% 21% 23% 13% Trade 11% 11% 15% 12% 17% 6% Valley 27% 28% 30% 31% 33% 6% West 13% 14% 16% 17% 22% 9% District 23% 24% 26% 26% 28% 5%
Measure 2.2.2b Percentage of New Student Cohort Completing English 101 & Math 125 (or above) in 6 Years
College 2011 2012 2013 2014 2015 5-Year Change
City 28% 30% 30% 30% 26% 2% East 32% 36% 35% 33% 37% 5% Harbor 35% 33% 27% 29% 29% 6% Mission 33% 31% 29% 32% 31% 2% Pierce 40% 44% 42% 40% 44% 4% Southwest 11% 15% 17% 16% 23% 12% Trade 13% 18% 15% 16% 18% 5% Valley 36% 36% 38% 36% 38% 3% West 17% 20% 19% 17% 20% 3% District 31% 34% 33% 31% 34% 3%
Summary of Findings. LACCD overall saw modest increases in the percentage of new student cohorts successfully completing English 101 and Math 125 at years 3 and 6. In 2015, approximately 28% of students completed English 101 and Math 125 in 3 years, which was an increase of 5% since 2011. In addition, about 34% completed English and math requirements in 6 years, which increased from 2011 by 3%. As with unit thresholds, these milestones are difficult for some colleges to meet simply because of their part-time student population or the structure the programs offered (i.e., some programs do not require English and math courses). For example, at Los Angeles Trade-Technical College (LATTC), the students primarily take career and technical education (CTE) courses, and CTE certificates do not require English 101 or Math 125 courses. In addition to these issues, some colleges have high rates of students that require remediation, which often extends the time it takes to complete English 101 and Math 125 requirements. At Los Angeles Mission College (LAMC), for example, 82% of students place into courses that are below English 101 and 70% place into courses that are below Math 125.
13
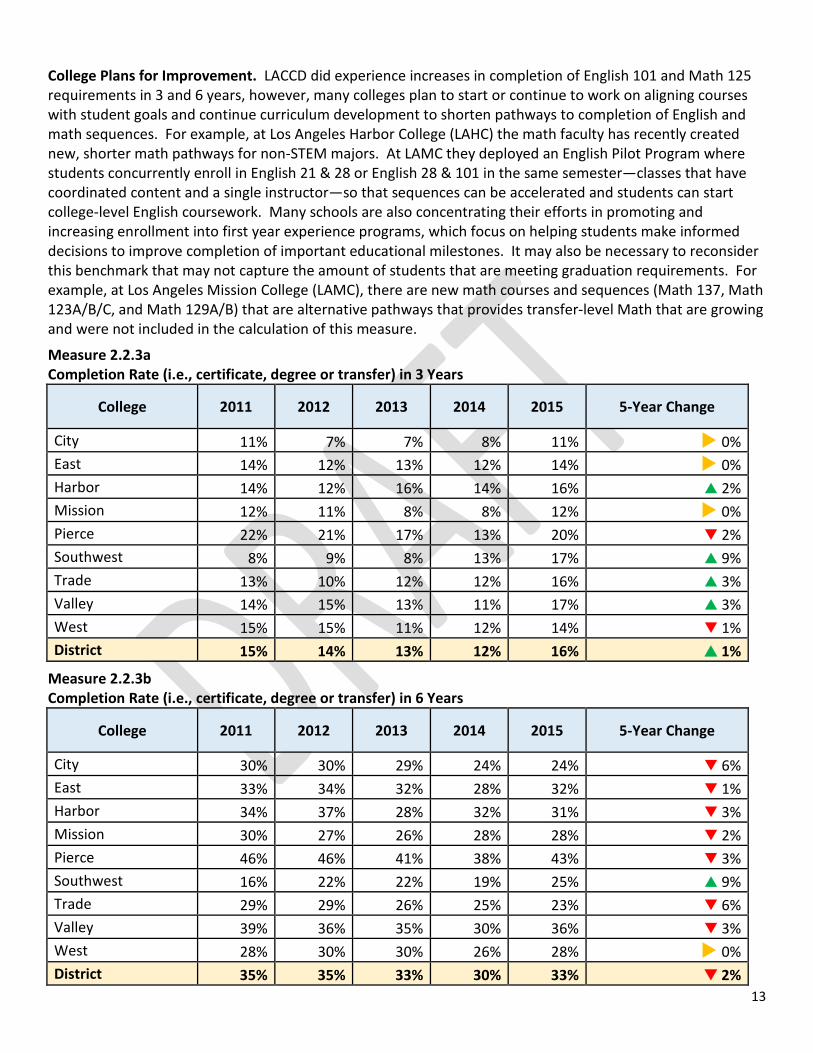
College Plans for Improvement. LACCD did experience increases in completion of English 101 and Math 125 requirements in 3 and 6 years, however, many colleges plan to start or continue to work on aligning courses with student goals and continue curriculum development to shorten pathways to completion of English and math sequences. For example, at Los Angeles Harbor College (LAHC) the math faculty has recently created new, shorter math pathways for non-STEM majors. At LAMC they deployed an English Pilot Program where students concurrently enroll in English 21 & 28 or English 28 & 101 in the same semester—classes that have coordinated content and a single instructor—so that sequences can be accelerated and students can start college-level English coursework. Many schools are also concentrating their efforts in promoting and increasing enrollment into first year experience programs, which focus on helping students make informed decisions to improve completion of important educational milestones. It may also be necessary to reconsider this benchmark that may not capture the amount of students that are meeting graduation requirements. For example, at Los Angeles Mission College (LAMC), there are new math courses and sequences (Math 137, Math 123A/B/C, and Math 129A/B) that are alternative pathways that provides transfer-level Math that are growing and were not included in the calculation of this measure.
Measure 2.2.3a Completion Rate (i.e., certificate, degree or transfer) in 3 Years
College 2011 2012 2013 2014 2015 5-Year Change
City 11% 7% 7% 8% 11% 0% East 14% 12% 13% 12% 14% 0% Harbor 14% 12% 16% 14% 16% 2% Mission 12% 11% 8% 8% 12% 0% Pierce 22% 21% 17% 13% 20% 2% Southwest 8% 9% 8% 13% 17% 9% Trade 13% 10% 12% 12% 16% 3% Valley 14% 15% 13% 11% 17% 3% West 15% 15% 11% 12% 14% 1% District 15% 14% 13% 12% 16% 1%
Measure 2.2.3b Completion Rate (i.e., certificate, degree or transfer) in 6 Years
College 2011 2012 2013 2014 2015 5-Year Change
City 30% 30% 29% 24% 24% 6% East 33% 34% 32% 28% 32% 1% Harbor 34% 37% 28% 32% 31% 3% Mission 30% 27% 26% 28% 28% 2% Pierce 46% 46% 41% 38% 43% 3% Southwest 16% 22% 22% 19% 25% 9% Trade 29% 29% 26% 25% 23% 6% Valley 39% 36% 35% 30% 36% 3% West 28% 30% 30% 26% 28% 0% District 35% 35% 33% 30% 33% 2%
14
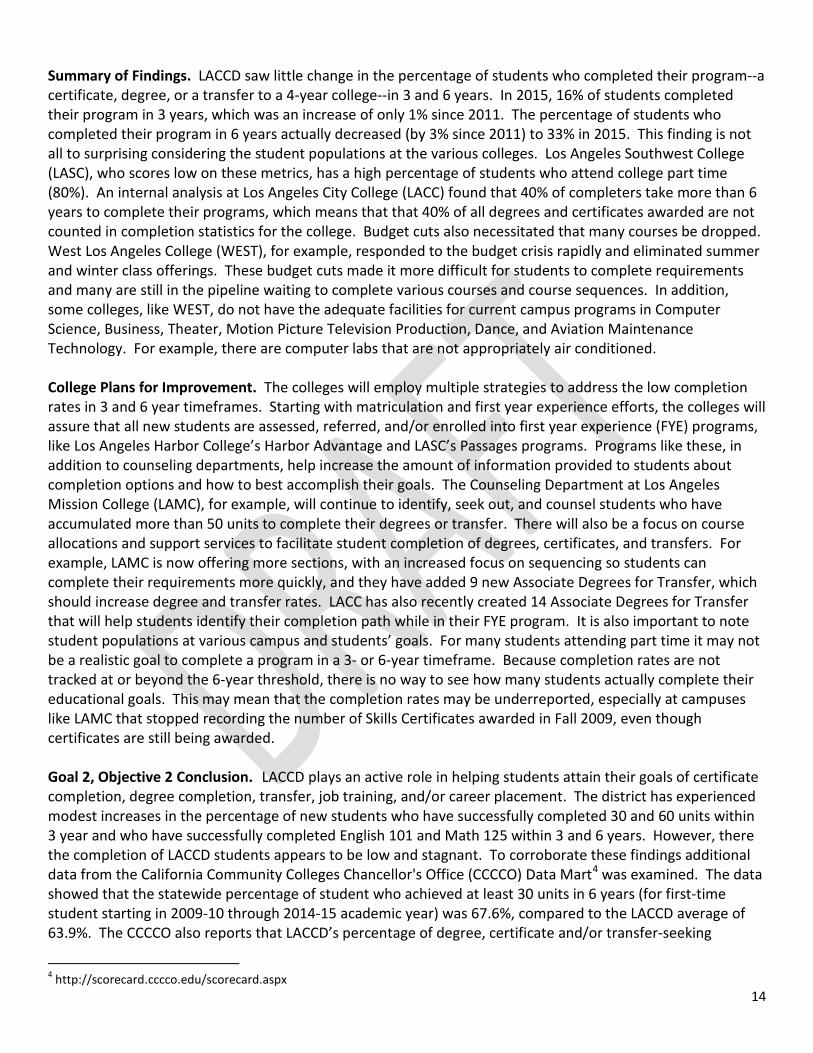
Summary of Findings. LACCD saw little change in the percentage of students who completed their program--a certificate, degree, or a transfer to a 4-year college--in 3 and 6 years. In 2015, 16% of students completed their program in 3 years, which was an increase of only 1% since 2011. The percentage of students who completed their program in 6 years actually decreased (by 3% since 2011) to 33% in 2015. This finding is not all to surprising considering the student populations at the various colleges. Los Angeles Southwest College (LASC), who scores low on these metrics, has a high percentage of students who attend college part time (80%). An internal analysis at Los Angeles City College (LACC) found that 40% of completers take more than 6 years to complete their programs, which means that that 40% of all degrees and certificates awarded are not counted in completion statistics for the college. Budget cuts also necessitated that many courses be dropped. West Los Angeles College (WEST), for example, responded to the budget crisis rapidly and eliminated summer and winter class offerings. These budget cuts made it more difficult for students to complete requirements and many are still in the pipeline waiting to complete various courses and course sequences. In addition, some colleges, like WEST, do not have the adequate facilities for current campus programs in Computer Science, Business, Theater, Motion Picture Television Production, Dance, and Aviation Maintenance Technology. For example, there are computer labs that are not appropriately air conditioned. College Plans for Improvement. The colleges will employ multiple strategies to address the low completion rates in 3 and 6 year timeframes. Starting with matriculation and first year experience efforts, the colleges will assure that all new students are assessed, referred, and/or enrolled into first year experience (FYE) programs, like Los Angeles Harbor College’s Harbor Advantage and LASC’s Passages programs. Programs like these, in addition to counseling departments, help increase the amount of information provided to students about completion options and how to best accomplish their goals. The Counseling Department at Los Angeles Mission College (LAMC), for example, will continue to identify, seek out, and counsel students who have accumulated more than 50 units to complete their degrees or transfer. There will also be a focus on course allocations and support services to facilitate student completion of degrees, certificates, and transfers. For example, LAMC is now offering more sections, with an increased focus on sequencing so students can complete their requirements more quickly, and they have added 9 new Associate Degrees for Transfer, which should increase degree and transfer rates. LACC has also recently created 14 Associate Degrees for Transfer that will help students identify their completion path while in their FYE program. It is also important to note student populations at various campus and students’ goals. For many students attending part time it may not be a realistic goal to complete a program in a 3- or 6-year timeframe. Because completion rates are not tracked at or beyond the 6-year threshold, there is no way to see how many students actually complete their educational goals. This may mean that the completion rates may be underreported, especially at campuses like LAMC that stopped recording the number of Skills Certificates awarded in Fall 2009, even though certificates are still being awarded. Goal 2, Objective 2 Conclusion. LACCD plays an active role in helping students attain their goals of certificate completion, degree completion, transfer, job training, and/or career placement. The district has experienced modest increases in the percentage of new students who have successfully completed 30 and 60 units within 3 year and who have successfully completed English 101 and Math 125 within 3 and 6 years. However, there the completion of LACCD students appears to be low and stagnant. To corroborate these findings additional data from the California Community Colleges Chancellor's Office (CCCCO) Data Mart4 was examined. The data showed that the statewide percentage of student who achieved at least 30 units in 6 years (for first-time student starting in 2009-10 through 2014-15 academic year) was 67.6%, compared to the LACCD average of 63.9%. The CCCCO also reports that LACCD’s percentage of degree, certificate and/or transfer-seeking
4 http://scorecard.cccco.edu/scorecard.aspx
15
students who completed their program in 6 years was 37.6% (for first-time student starting in 2009-10 through 2014-15 academic year), which was lower than the statewide average of 47.1%. These findings may be partially due to the LACCD student population that are mostly go to school part time, often require remediation, and many times enroll in programs that do not have English 101, Math 125, or 30-unit minimum requirements. This means that these metrics can be improves to better track students’ progress through their program. Baseline calculation methodology should be re-examined to account for program completers that did not take English 101 or Math 125, program completers who are enrolled in programs requiring less than 30 units, and completers who finish their program in more than 6 years. Objective 3: Increase the number of students who complete career-focused certificates in a timely manner, find employment in high growth/high earning occupations, or realize higher earnings as a result of their educational experience.
Measure 1: Number of certificates awarded Measure 2: On time completion rate Measure 2: Student success scorecard skill builder metric
Measure 2.3.1 Number of Certificates Awarded
College 2011 2012 2013 2014 2015 5-Year Change
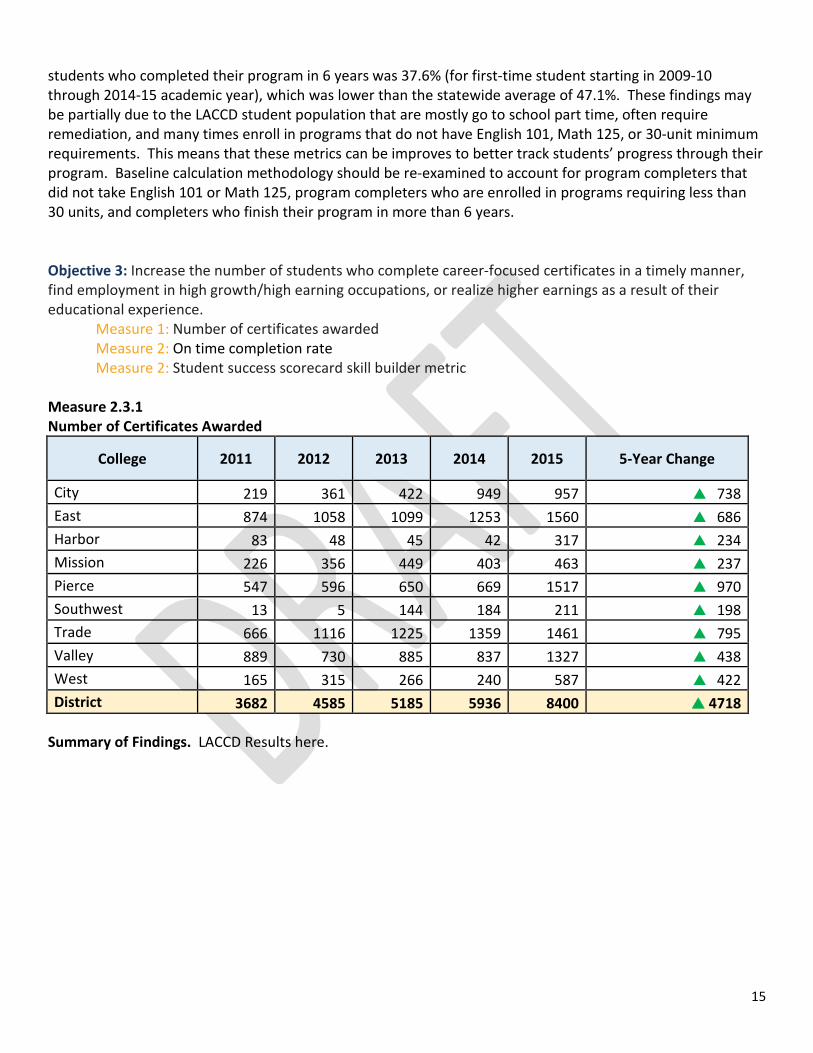
City 219 361 422 949 957 738 East 874 1058 1099 1253 1560 686 Harbor 83 48 45 42 317 234 Mission 226 356 449 403 463 237 Pierce 547 596 650 669 1517 970 Southwest 13 5 144 184 211 198 Trade 666 1116 1225 1359 1461 795 Valley 889 730 885 837 1327 438 West 165 315 266 240 587 422 District 3682 4585 5185 5936 8400 4718
Summary of Findings. LACCD Results here.
16
Measure 2.3.3 Student Success Scorecard Skill Builder Metric
College 2011 2012 2013 2014 2015 3-Year Change
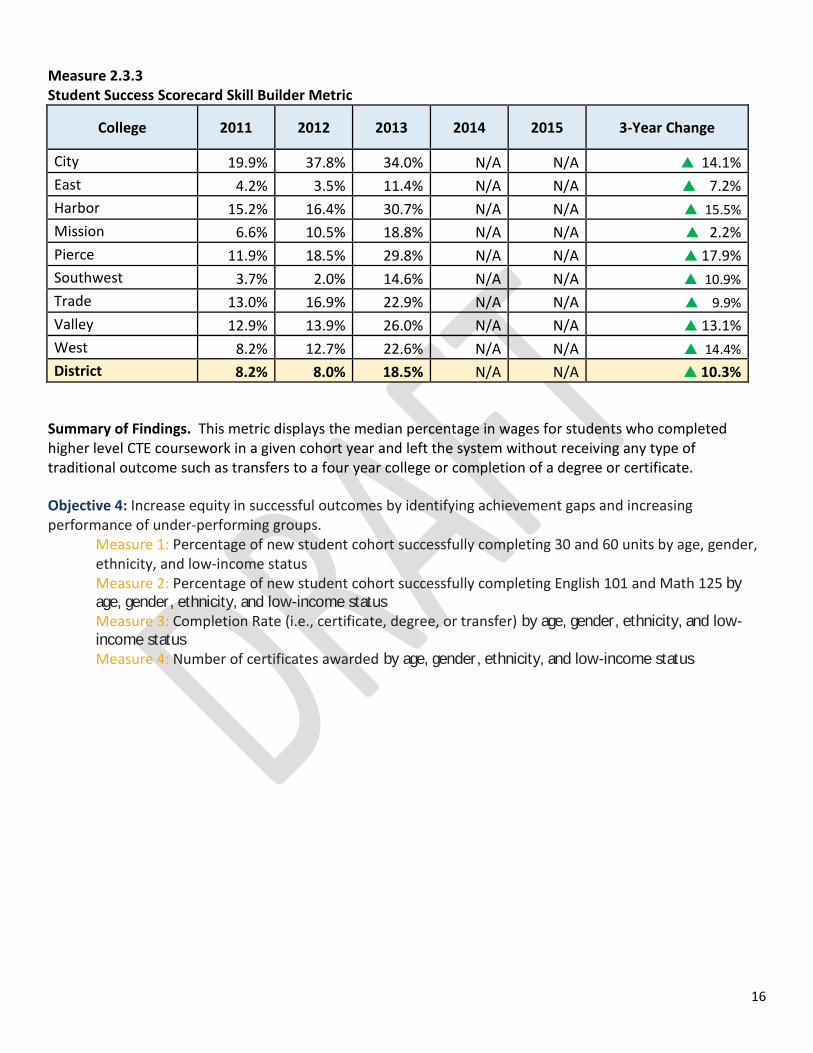
City 19.9% 37.8% 34.0% N/A N/A 14.1% East 4.2% 3.5% 11.4% N/A N/A 7.2% Harbor 15.2% 16.4% 30.7% N/A N/A 15.5% Mission 6.6% 10.5% 18.8% N/A N/A 2.2% Pierce 11.9% 18.5% 29.8% N/A N/A 17.9% Southwest 3.7% 2.0% 14.6% N/A N/A 10.9% Trade 13.0% 16.9% 22.9% N/A N/A 9.9% Valley 12.9% 13.9% 26.0% N/A N/A 13.1% West 8.2% 12.7% 22.6% N/A N/A 14.4% District 8.2% 8.0% 18.5% N/A N/A 10.3%
Summary of Findings. This metric displays the median percentage in wages for students who completed higher level CTE coursework in a given cohort year and left the system without receiving any type of traditional outcome such as transfers to a four year college or completion of a degree or certificate. Objective 4: Increase equity in successful outcomes by identifying achievement gaps and increasing performance of under-performing groups.
Measure 1: Percentage of new student cohort successfully completing 30 and 60 units by age, gender, ethnicity, and low-income status Measure 2: Percentage of new student cohort successfully completing English 101 and Math 125 by age, gender, ethnicity, and low-income status Measure 3: Completion Rate (i.e., certificate, degree, or transfer) by age, gender, ethnicity, and low- income status Measure 4: Number of certificates awarded by age, gender, ethnicity, and low-income status
17
GOAL 3: Organizational Effectiveness. Improve organizational effectiveness through data-informed planning and decision-making, process assessment, and professional development.
Objective 1: Assess and improve district processes and services. Measure 1: Student satisfaction with district services Measure 2: College accreditation status Measure 3: Total Full Time Equivalent Student (FTES) Measure 4: Expenditures per FTES Measure 5: Average class size Measure 6: Fund balance
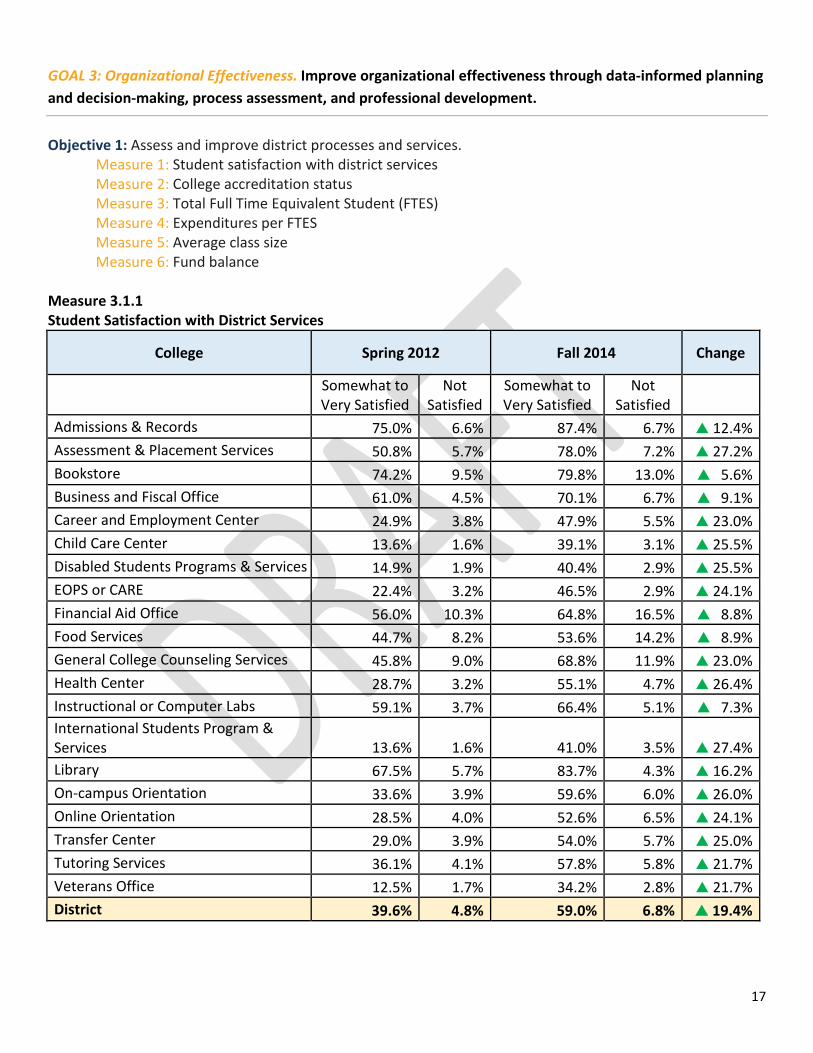
Measure 3.1.1 Student Satisfaction with District Services
College Spring 2012 Fall 2014 Change
Somewhat to Very Satisfied
Not Satisfied
Somewhat to Very Satisfied
Not Satisfied
Admissions & Records 75.0% 6.6% 87.4% 6.7% 12.4% Assessment & Placement Services 50.8% 5.7% 78.0% 7.2% 27.2% Bookstore 74.2% 9.5% 79.8% 13.0% 5.6% Business and Fiscal Office 61.0% 4.5% 70.1% 6.7% 9.1% Career and Employment Center 24.9% 3.8% 47.9% 5.5% 23.0% Child Care Center 13.6% 1.6% 39.1% 3.1% 25.5% Disabled Students Programs & Services 14.9% 1.9% 40.4% 2.9% 25.5% EOPS or CARE 22.4% 3.2% 46.5% 2.9% 24.1% Financial Aid Office 56.0% 10.3% 64.8% 16.5% 8.8% Food Services 44.7% 8.2% 53.6% 14.2% 8.9% General College Counseling Services 45.8% 9.0% 68.8% 11.9% 23.0% Health Center 28.7% 3.2% 55.1% 4.7% 26.4% Instructional or Computer Labs 59.1% 3.7% 66.4% 5.1% 7.3% International Students Program & Services 13.6% 1.6% 41.0% 3.5% 27.4% Library 67.5% 5.7% 83.7% 4.3% 16.2% On-campus Orientation 33.6% 3.9% 59.6% 6.0% 26.0% Online Orientation 28.5% 4.0% 52.6% 6.5% 24.1% Transfer Center 29.0% 3.9% 54.0% 5.7% 25.0% Tutoring Services 36.1% 4.1% 57.8% 5.8% 21.7% Veterans Office 12.5% 1.7% 34.2% 2.8% 21.7% District 39.6% 4.8% 59.0% 6.8% 19.4%
18
Summary of Findings. LACCD experienced increases in student satisfaction with services from 2012 to 2014. In the Student Survey, the percentage of students that say they were somewhat to very satisfied with various services increased by an average of 19.4%. The library and EOPS/CARE services, in addition to experiencing higher proportions of student satisfaction, also decreased in the portion of students not satisfied with their services. Not only are there general levels of increased satisfaction, the data also show that a higher proportion of students are accessing services. For example, only 40.2% of the student surveyed had used the tutoring services on their campus in 2012; two years later, in 2014, that percentage rose to 63.6%. The same trend is present with the percentage of students using the campus child care center. In 2012, 15.2% of students surveyed were using the child care center on campus and that proportion rose to 42.2% in 2014. College Plans for Improvement. The trend in the data suggest that not only are students more satisfied with campus services than in previous years, but that more students are accessing available services on campus. The colleges plan to continue their focus on customer service and ensuring that students are aware of campus services. In order to continue to increase the level of student satisfaction of services, the district plans to survey students on a more regular interval. Measure 3.1.2 College Accreditation Status
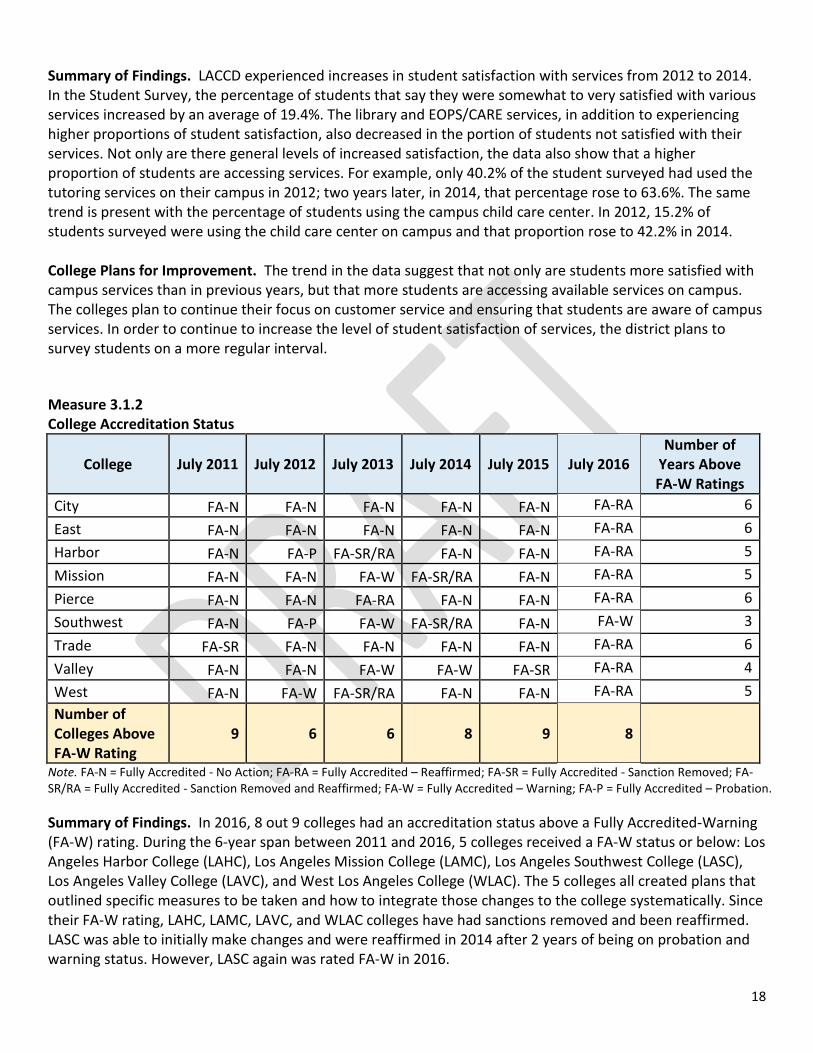
College July 2011 July 2012 July 2013 July 2014 July 2015 July 2016 Number of
Years Above FA-W Ratings
City FA-N FA-N FA-N FA-N FA-N FA-RA 6 East FA-N FA-N FA-N FA-N FA-N FA-RA 6 Harbor FA-N FA-P FA-SR/RA FA-N FA-N FA-RA 5 Mission FA-N FA-N FA-W FA-SR/RA FA-N FA-RA 5 Pierce FA-N FA-N FA-RA FA-N FA-N FA-RA 6 Southwest FA-N FA-P FA-W FA-SR/RA FA-N FA-W 3 Trade FA-SR FA-N FA-N FA-N FA-N FA-RA 6 Valley FA-N FA-N FA-W FA-W FA-SR FA-RA 4 West FA-N FA-W FA-SR/RA FA-N FA-N FA-RA 5 Number of Colleges Above FA-W Rating
9 6 6 8 9 8
Note. FA-N = Fully Accredited - No Action; FA-RA = Fully Accredited – Reaffirmed; FA-SR = Fully Accredited - Sanction Removed; FA-SR/RA = Fully Accredited - Sanction Removed and Reaffirmed; FA-W = Fully Accredited – Warning; FA-P = Fully Accredited – Probation. Summary of Findings. In 2016, 8 out 9 colleges had an accreditation status above a Fully Accredited-Warning (FA-W) rating. During the 6-year span between 2011 and 2016, 5 colleges received a FA-W status or below: Los Angeles Harbor College (LAHC), Los Angeles Mission College (LAMC), Los Angeles Southwest College (LASC), Los Angeles Valley College (LAVC), and West Los Angeles College (WLAC). The 5 colleges all created plans that outlined specific measures to be taken and how to integrate those changes to the college systematically. Since their FA-W rating, LAHC, LAMC, LAVC, and WLAC colleges have had sanctions removed and been reaffirmed. LASC was able to initially make changes and were reaffirmed in 2014 after 2 years of being on probation and warning status. However, LASC again was rated FA-W in 2016.
19
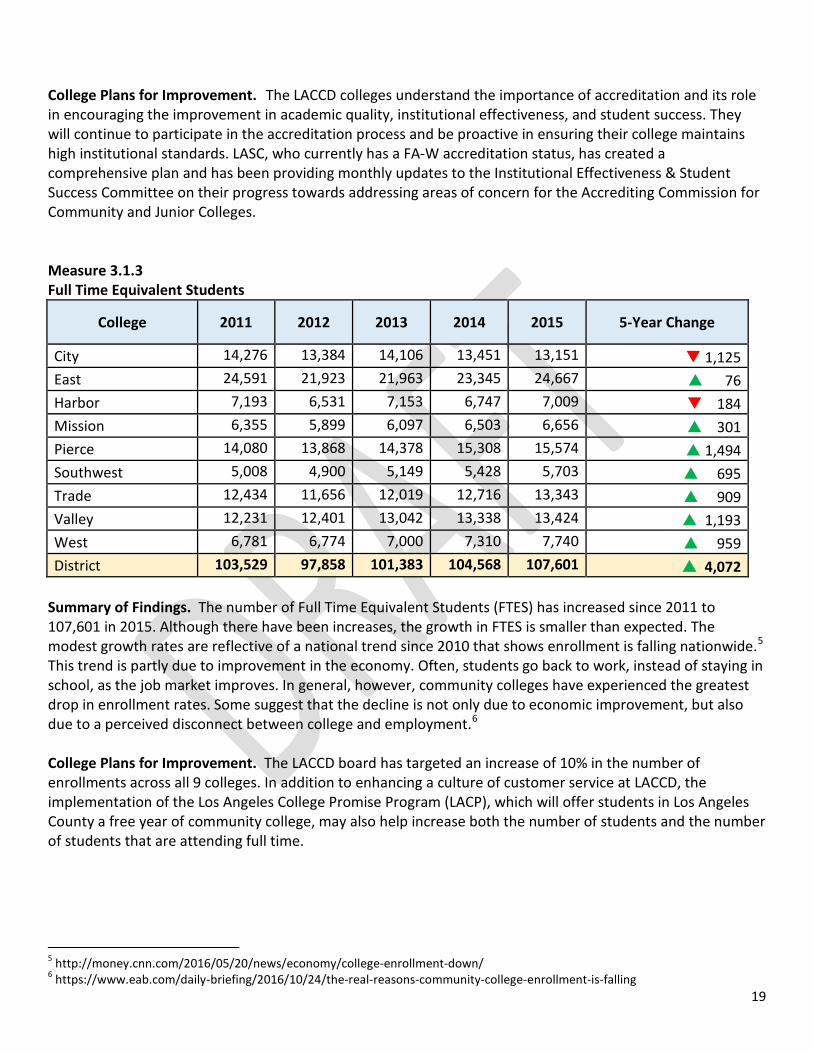
College Plans for Improvement. The LACCD colleges understand the importance of accreditation and its role in encouraging the improvement in academic quality, institutional effectiveness, and student success. They will continue to participate in the accreditation process and be proactive in ensuring their college maintains high institutional standards. LASC, who currently has a FA-W accreditation status, has created a comprehensive plan and has been providing monthly updates to the Institutional Effectiveness & Student Success Committee on their progress towards addressing areas of concern for the Accrediting Commission for Community and Junior Colleges. Measure 3.1.3 Full Time Equivalent Students
College 2011 2012 2013 2014 2015 5-Year Change
City 14,276 13,384 14,106 13,451 13,151 1,125 East 24,591 21,923 21,963 23,345 24,667 76 Harbor 7,193 6,531 7,153 6,747 7,009 184 Mission 6,355 5,899 6,097 6,503 6,656 301 Pierce 14,080 13,868 14,378 15,308 15,574 1,494 Southwest 5,008 4,900 5,149 5,428 5,703 695 Trade 12,434 11,656 12,019 12,716 13,343 909 Valley 12,231 12,401 13,042 13,338 13,424 1,193 West 6,781 6,774 7,000 7,310 7,740 959 District 103,529 97,858 101,383 104,568 107,601 4,072
Summary of Findings. The number of Full Time Equivalent Students (FTES) has increased since 2011 to 107,601 in 2015. Although there have been increases, the growth in FTES is smaller than expected. The modest growth rates are reflective of a national trend since 2010 that shows enrollment is falling nationwide.5 This trend is partly due to improvement in the economy. Often, students go back to work, instead of staying in school, as the job market improves. In general, however, community colleges have experienced the greatest drop in enrollment rates. Some suggest that the decline is not only due to economic improvement, but also due to a perceived disconnect between college and employment.6 College Plans for Improvement. The LACCD board has targeted an increase of 10% in the number of enrollments across all 9 colleges. In addition to enhancing a culture of customer service at LACCD, the implementation of the Los Angeles College Promise Program (LACP), which will offer students in Los Angeles County a free year of community college, may also help increase both the number of students and the number of students that are attending full time.
5 http://money.cnn.com/2016/05/20/news/economy/college-enrollment-down/ 6 https://www.eab.com/daily-briefing/2016/10/24/the-real-reasons-community-college-enrollment-is-falling
20
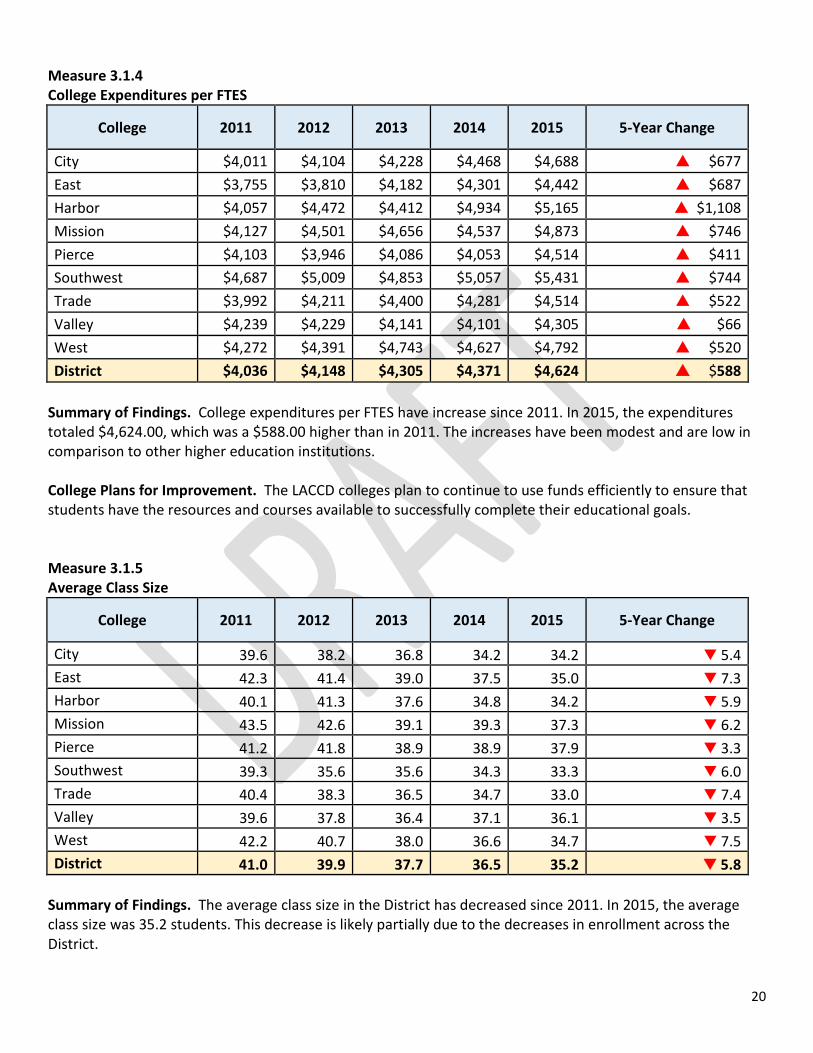
Measure 3.1.4 College Expenditures per FTES
College 2011 2012 2013 2014 2015 5-Year Change
City $4,011 $4,104 $4,228 $4,468 $4,688 $677 East $3,755 $3,810 $4,182 $4,301 $4,442 $687 Harbor $4,057 $4,472 $4,412 $4,934 $5,165 $1,108 Mission $4,127 $4,501 $4,656 $4,537 $4,873 $746 Pierce $4,103 $3,946 $4,086 $4,053 $4,514 $411 Southwest $4,687 $5,009 $4,853 $5,057 $5,431 $744 Trade $3,992 $4,211 $4,400 $4,281 $4,514 $522 Valley $4,239 $4,229 $4,141 $4,101 $4,305 $66 West $4,272 $4,391 $4,743 $4,627 $4,792 $520 District $4,036 $4,148 $4,305 $4,371 $4,624 $588
Summary of Findings. College expenditures per FTES have increase since 2011. In 2015, the expenditures totaled $4,624.00, which was a $588.00 higher than in 2011. The increases have been modest and are low in comparison to other higher education institutions. College Plans for Improvement. The LACCD colleges plan to continue to use funds efficiently to ensure that students have the resources and courses available to successfully complete their educational goals. Measure 3.1.5 Average Class Size
College 2011 2012 2013 2014 2015 5-Year Change
City 39.6 38.2 36.8 34.2 34.2 5.4 East 42.3 41.4 39.0 37.5 35.0 7.3 Harbor 40.1 41.3 37.6 34.8 34.2 5.9 Mission 43.5 42.6 39.1 39.3 37.3 6.2 Pierce 41.2 41.8 38.9 38.9 37.9 3.3 Southwest 39.3 35.6 35.6 34.3 33.3 6.0 Trade 40.4 38.3 36.5 34.7 33.0 7.4 Valley 39.6 37.8 36.4 37.1 36.1 3.5 West 42.2 40.7 38.0 36.6 34.7 7.5 District 41.0 39.9 37.7 36.5 35.2 5.8
Summary of Findings. The average class size in the District has decreased since 2011. In 2015, the average class size was 35.2 students. This decrease is likely partially due to the decreases in enrollment across the District.
21
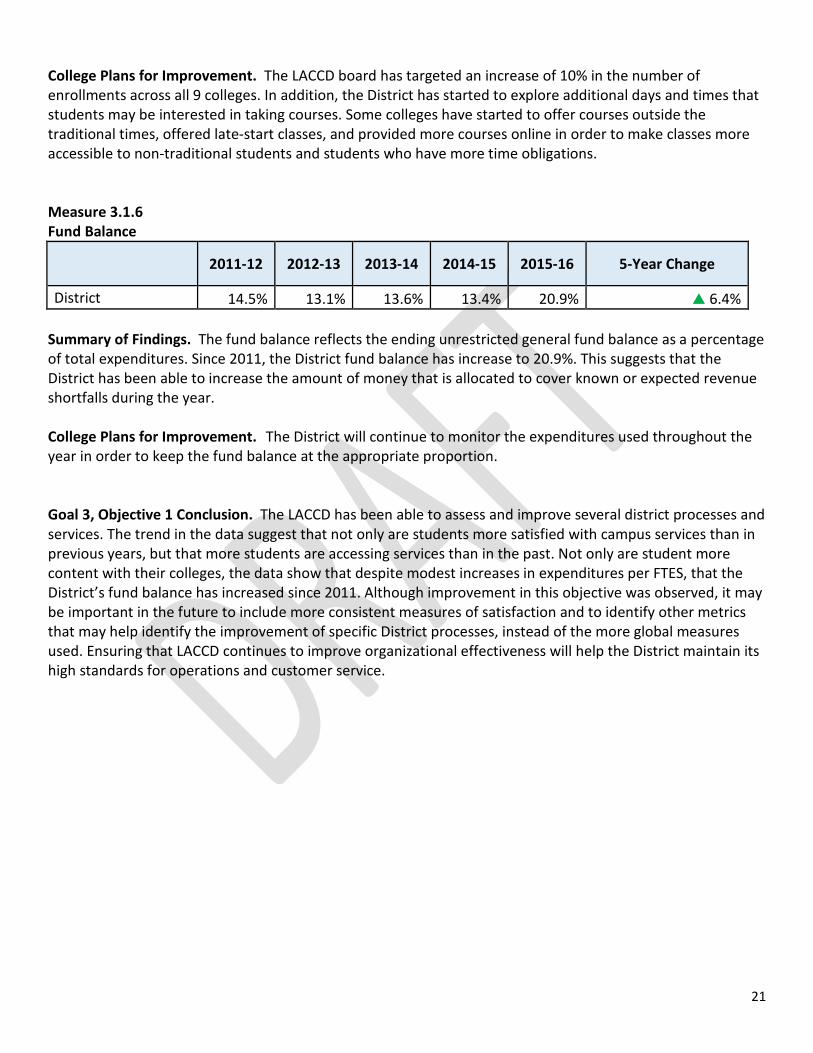
College Plans for Improvement. The LACCD board has targeted an increase of 10% in the number of enrollments across all 9 colleges. In addition, the District has started to explore additional days and times that students may be interested in taking courses. Some colleges have started to offer courses outside the traditional times, offered late-start classes, and provided more courses online in order to make classes more accessible to non-traditional students and students who have more time obligations. Measure 3.1.6 Fund Balance
2011-12 2012-13 2013-14 2014-15 2015-16 5-Year Change
District 14.5% 13.1% 13.6% 13.4% 20.9% 6.4% Summary of Findings. The fund balance reflects the ending unrestricted general fund balance as a percentage of total expenditures. Since 2011, the District fund balance has increase to 20.9%. This suggests that the District has been able to increase the amount of money that is allocated to cover known or expected revenue shortfalls during the year. College Plans for Improvement. The District will continue to monitor the expenditures used throughout the year in order to keep the fund balance at the appropriate proportion. Goal 3, Objective 1 Conclusion. The LACCD has been able to assess and improve several district processes and services. The trend in the data suggest that not only are students more satisfied with campus services than in previous years, but that more students are accessing services than in the past. Not only are student more content with their colleges, the data show that despite modest increases in expenditures per FTES, that the District’s fund balance has increased since 2011. Although improvement in this objective was observed, it may be important in the future to include more consistent measures of satisfaction and to identify other metrics that may help identify the improvement of specific District processes, instead of the more global measures used. Ensuring that LACCD continues to improve organizational effectiveness will help the District maintain its high standards for operations and customer service.
22
Objective 2: Improve communications and governance throughout the district. Measure 1: Effective decision-making Measure 2: Participatory governance Measure 3: Overall rating of district-level governance
Measure 3.2.1 Effective Decision Making
College 2010-11 2012-13 2014-15 5-Year Change
Agree Disagree Agree Disagree Agree Disagree
District-level decision making is effective in relation to budget development and resource allocation 38.6% 42.9% 30.2% 55.1% 39.4% 51.1% 0.8% District-level decision making is effective in relation to enrollment management and FTES target setting 49.5% 31.2% 29.8% 47.0% 53.0% 36.0% 3.5% District-level decision making is effective in relation to strategic planning and strategic goal setting 51.3% 26.4% 41.8% 40.8% 46.3% 38.1% 5.0% District-level decision making is effective in relation to Bond Program planning and oversight 44.7% 39.0% 25.4% 60.5% 28.7% 55.8% 16.0% District-level decision making is effective in relation to employee benefits (JLMBC) 66.3% 20.7% 56.7% 29.2% 68.9% 19.3% 2.6% Effective decision making 50.1% 32.0% 36.8% 46.5% 47.3% 40.1% 2.8%
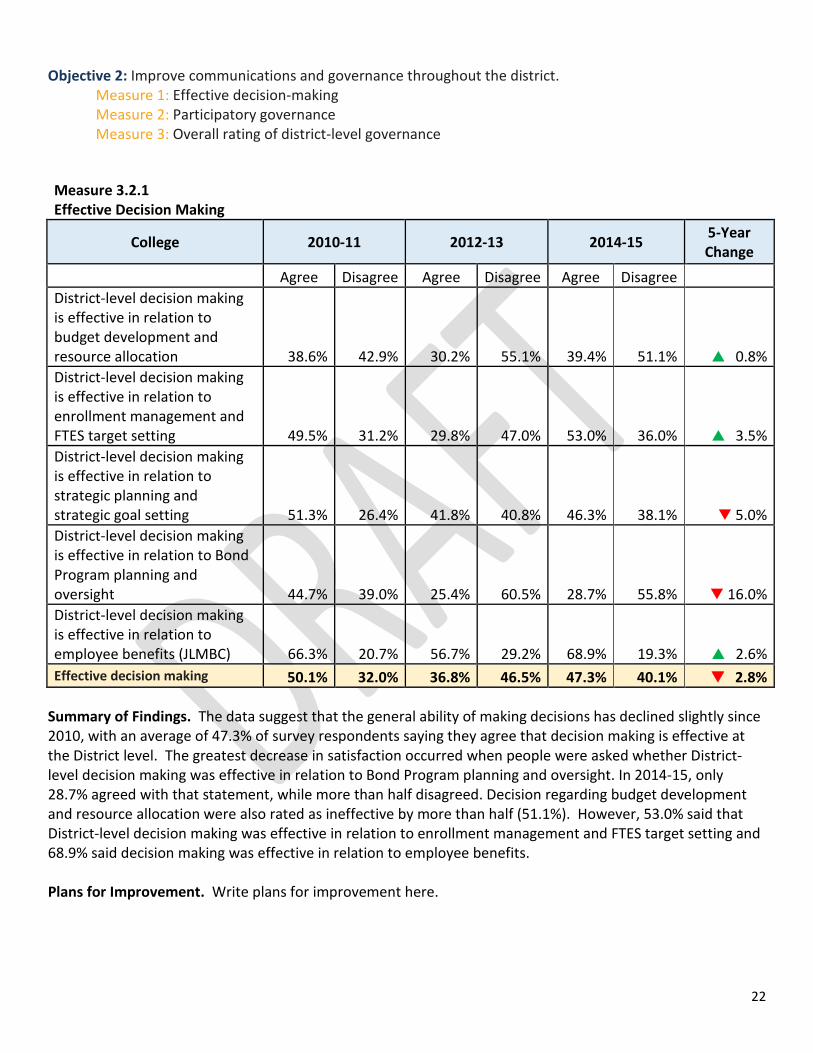
Summary of Findings. The data suggest that the general ability of making decisions has declined slightly since 2010, with an average of 47.3% of survey respondents saying they agree that decision making is effective at the District level. The greatest decrease in satisfaction occurred when people were asked whether District-level decision making was effective in relation to Bond Program planning and oversight. In 2014-15, only 28.7% agreed with that statement, while more than half disagreed. Decision regarding budget development and resource allocation were also rated as ineffective by more than half (51.1%). However, 53.0% said that District-level decision making was effective in relation to enrollment management and FTES target setting and 68.9% said decision making was effective in relation to employee benefits. Plans for Improvement. Write plans for improvement here.
23
Measure 3.1.2 Participatory Governance
College 2010-11 2012-13 2014-15 5-Year Change
Agree Disagree Agree Disagree Agree Disagree Decisions made through participatory governance at the district level are based on research and data 42.6% 25.8% 26.2% 37.2% 50.4% 28.1% 7.8% Decisions made through participatory governance at the district level are communicated effectively to all affected stakeholders 38.7% 47.6% 23.5% 58.5% 32.5% 57.7% 6.2% Decisions made through participatory governance at the district level are followed though on effectively 39.5% 33.3% 25.7% 41.0% 30.3% 51.5% 9.2% Decisions made through participatory governance 40.3% 35.6% 25.1% 45.6% 37.7% 45.8% 2.6%
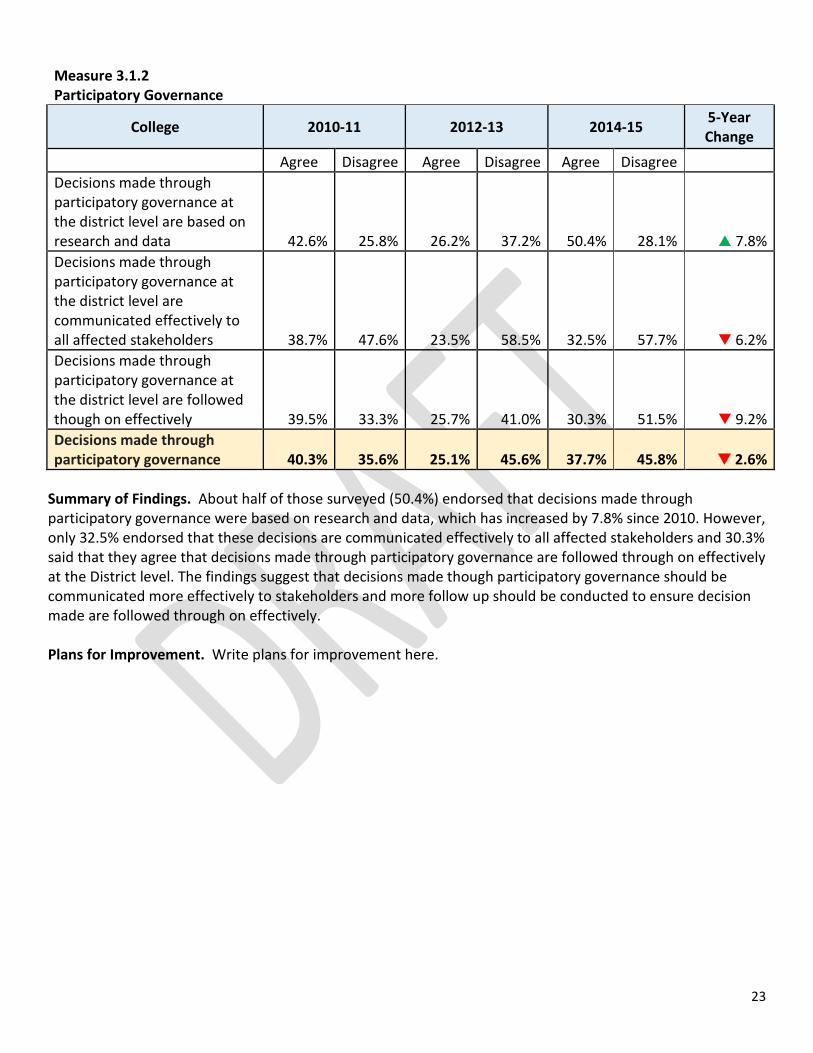
Summary of Findings. About half of those surveyed (50.4%) endorsed that decisions made through participatory governance were based on research and data, which has increased by 7.8% since 2010. However, only 32.5% endorsed that these decisions are communicated effectively to all affected stakeholders and 30.3% said that they agree that decisions made through participatory governance are followed through on effectively at the District level. The findings suggest that decisions made though participatory governance should be communicated more effectively to stakeholders and more follow up should be conducted to ensure decision made are followed through on effectively. Plans for Improvement. Write plans for improvement here.
24
Measure 3.1.3 Overall Rating of District-Level Governance
College 2010-11 2012-13 2014-15 5-Year Change
Agree Disagree Agree Disagree Agree Disagree The LACCD Board of Trustees supports participatory governance 68.3% 15.1% 39.2% 39.2% 46.4% 39.1% 21.9% The district/college administration support participatory governance at the district level 64.2% 16.7% 46.9% 31.5% 58.1% 30.2% 6.1% Overall, I feel that district-wide decision making is effective in supporting the district’s mission and goals 56.2% 27.2% 34.8% 46.9% 40.9% 45.3% 15.3% Overall rating of District-level governance 62.9% 19.7% 40.3% 39.2% 48.5% 38.2% 14.4%
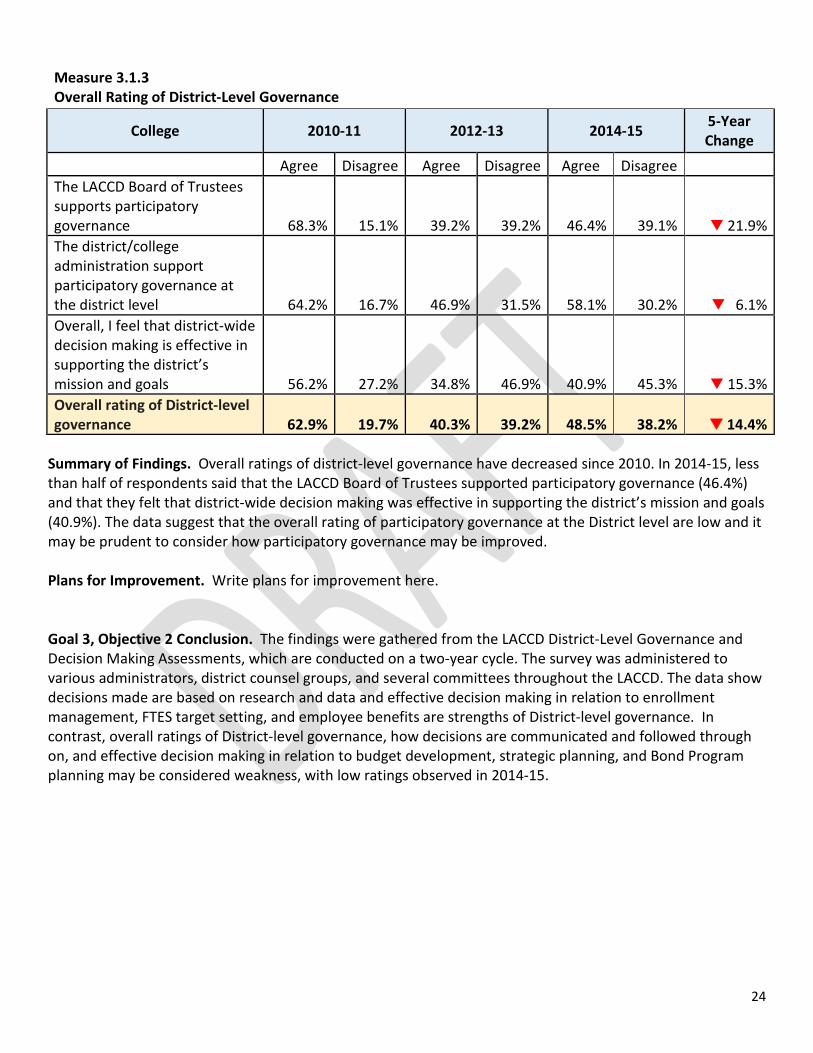
Summary of Findings. Overall ratings of district-level governance have decreased since 2010. In 2014-15, less than half of respondents said that the LACCD Board of Trustees supported participatory governance (46.4%) and that they felt that district-wide decision making was effective in supporting the district’s mission and goals (40.9%). The data suggest that the overall rating of participatory governance at the District level are low and it may be prudent to consider how participatory governance may be improved. Plans for Improvement. Write plans for improvement here. Goal 3, Objective 2 Conclusion. The findings were gathered from the LACCD District-Level Governance and Decision Making Assessments, which are conducted on a two-year cycle. The survey was administered to various administrators, district counsel groups, and several committees throughout the LACCD. The data show decisions made are based on research and data and effective decision making in relation to enrollment management, FTES target setting, and employee benefits are strengths of District-level governance. In contrast, overall ratings of District-level governance, how decisions are communicated and followed through on, and effective decision making in relation to budget development, strategic planning, and Bond Program planning may be considered weakness, with low ratings observed in 2014-15.
25
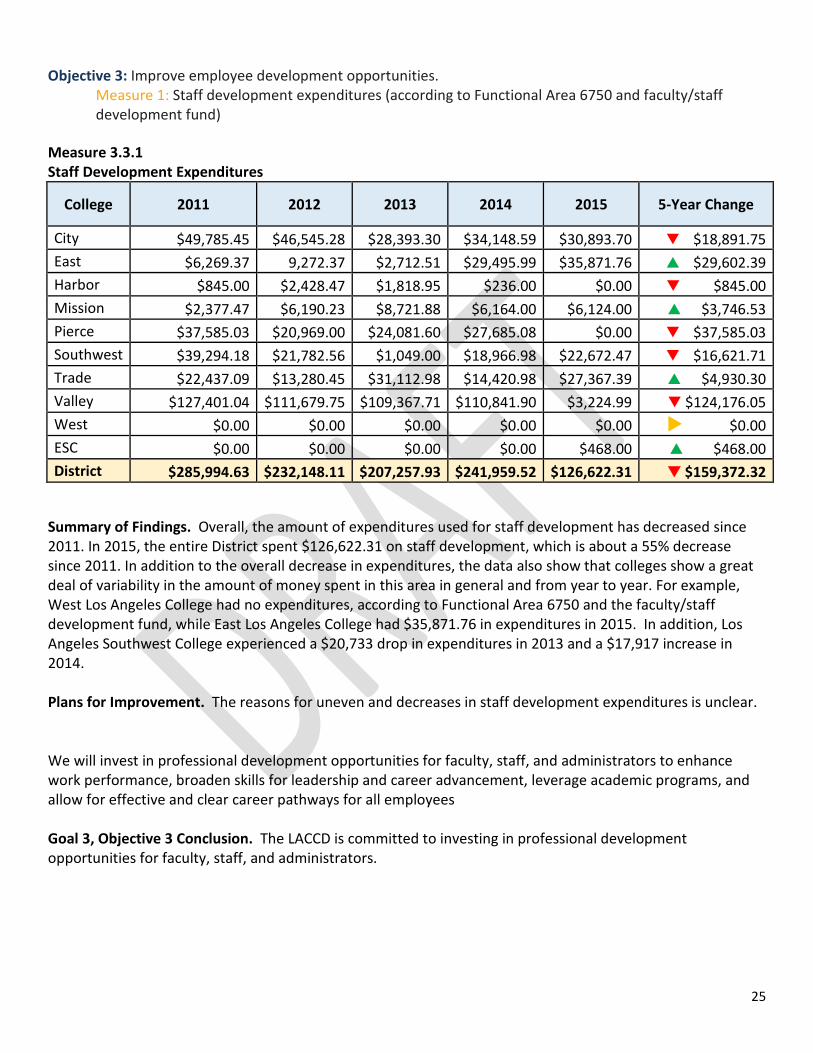
Objective 3: Improve employee development opportunities. Measure 1: Staff development expenditures (according to Functional Area 6750 and faculty/staff development fund)
Measure 3.3.1 Staff Development Expenditures
College 2011 2012 2013 2014 2015 5-Year Change
City $49,785.45 $46,545.28 $28,393.30 $34,148.59 $30,893.70 $18,891.75 East $6,269.37 9,272.37 $2,712.51 $29,495.99 $35,871.76 $29,602.39 Harbor $845.00 $2,428.47 $1,818.95 $236.00 $0.00 $845.00 Mission $2,377.47 $6,190.23 $8,721.88 $6,164.00 $6,124.00 $3,746.53 Pierce $37,585.03 $20,969.00 $24,081.60 $27,685.08 $0.00 $37,585.03 Southwest $39,294.18 $21,782.56 $1,049.00 $18,966.98 $22,672.47 $16,621.71 Trade $22,437.09 $13,280.45 $31,112.98 $14,420.98 $27,367.39 $4,930.30 Valley $127,401.04 $111,679.75 $109,367.71 $110,841.90 $3,224.99 $124,176.05 West $0.00 $0.00 $0.00 $0.00 $0.00 $0.00 ESC $0.00 $0.00 $0.00 $0.00 $468.00 $468.00 District $285,994.63 $232,148.11 $207,257.93 $241,959.52 $126,622.31 $159,372.32
Summary of Findings. Overall, the amount of expenditures used for staff development has decreased since 2011. In 2015, the entire District spent $126,622.31 on staff development, which is about a 55% decrease since 2011. In addition to the overall decrease in expenditures, the data also show that colleges show a great deal of variability in the amount of money spent in this area in general and from year to year. For example, West Los Angeles College had no expenditures, according to Functional Area 6750 and the faculty/staff development fund, while East Los Angeles College had $35,871.76 in expenditures in 2015. In addition, Los Angeles Southwest College experienced a $20,733 drop in expenditures in 2013 and a $17,917 increase in 2014. Plans for Improvement. The reasons for uneven and decreases in staff development expenditures is unclear. We will invest in professional development opportunities for faculty, staff, and administrators to enhance work performance, broaden skills for leadership and career advancement, leverage academic programs, and allow for effective and clear career pathways for all employees Goal 3, Objective 3 Conclusion. The LACCD is committed to investing in professional development opportunities for faculty, staff, and administrators.
26
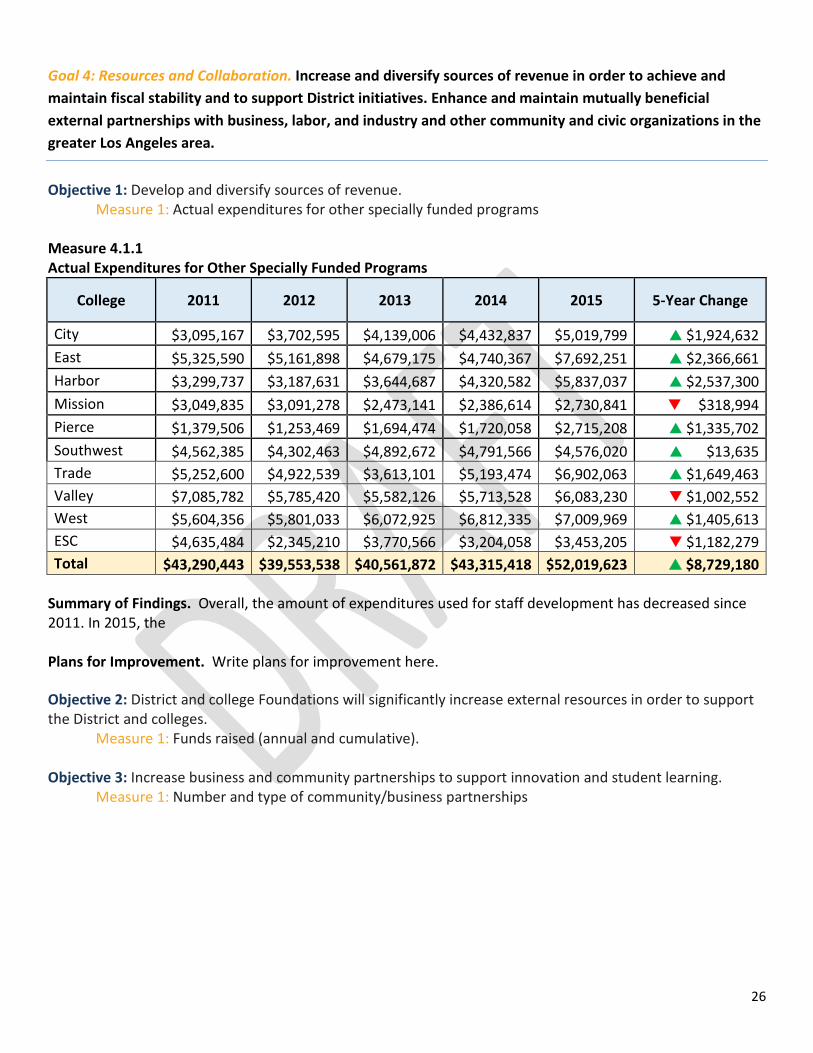
Goal 4: Resources and Collaboration. Increase and diversify sources of revenue in order to achieve and maintain fiscal stability and to support District initiatives. Enhance and maintain mutually beneficial external partnerships with business, labor, and industry and other community and civic organizations in the greater Los Angeles area.
Objective 1: Develop and diversify sources of revenue. Measure 1: Actual expenditures for other specially funded programs
Measure 4.1.1 Actual Expenditures for Other Specially Funded Programs
College 2011 2012 2013 2014 2015 5-Year Change
City $3,095,167 $3,702,595 $4,139,006 $4,432,837 $5,019,799 $1,924,632 East $5,325,590 $5,161,898 $4,679,175 $4,740,367 $7,692,251 $2,366,661 Harbor $3,299,737 $3,187,631 $3,644,687 $4,320,582 $5,837,037 $2,537,300 Mission $3,049,835 $3,091,278 $2,473,141 $2,386,614 $2,730,841 $318,994 Pierce $1,379,506 $1,253,469 $1,694,474 $1,720,058 $2,715,208 $1,335,702 Southwest $4,562,385 $4,302,463 $4,892,672 $4,791,566 $4,576,020 $13,635 Trade $5,252,600 $4,922,539 $3,613,101 $5,193,474 $6,902,063 $1,649,463 Valley $7,085,782 $5,785,420 $5,582,126 $5,713,528 $6,083,230 $1,002,552 West $5,604,356 $5,801,033 $6,072,925 $6,812,335 $7,009,969 $1,405,613 ESC $4,635,484 $2,345,210 $3,770,566 $3,204,058 $3,453,205 $1,182,279 Total $43,290,443 $39,553,538 $40,561,872 $43,315,418 $52,019,623 $8,729,180
Summary of Findings. Overall, the amount of expenditures used for staff development has decreased since 2011. In 2015, the Plans for Improvement. Write plans for improvement here. Objective 2: District and college Foundations will significantly increase external resources in order to support the District and colleges.
Measure 1: Funds raised (annual and cumulative). Objective 3: Increase business and community partnerships to support innovation and student learning.
Measure 1: Number and type of community/business partnerships
Page 1 of 12
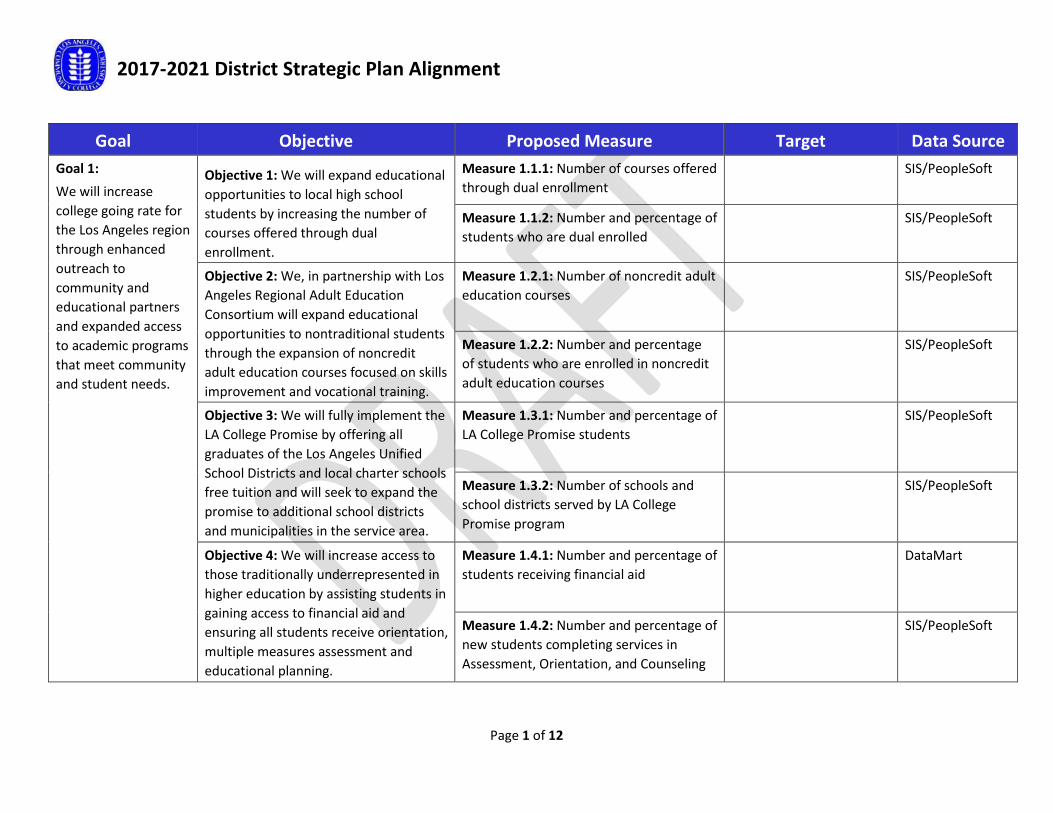
2017-2021 District Strategic Plan Alignment
Goal Objective Proposed Measure Target Data Source Goal 1: We will increase college going rate for the Los Angeles region through enhanced outreach to community and educational partners and expanded access to academic programs that meet community and student needs.
Objective 1: We will expand educational opportunities to local high school students by increasing the number of courses offered through dual enrollment.
Measure 1.1.1: Number of courses offered through dual enrollment
SIS/PeopleSoft
Measure 1.1.2: Number and percentage of students who are dual enrolled
SIS/PeopleSoft
Objective 2: We, in partnership with Los Angeles Regional Adult Education Consortium will expand educational opportunities to nontraditional students through the expansion of noncredit adult education courses focused on skills improvement and vocational training.
Measure 1.2.1: Number of noncredit adult education courses
SIS/PeopleSoft
Measure 1.2.2: Number and percentage of students who are enrolled in noncredit adult education courses
SIS/PeopleSoft
Objective 3: We will fully implement the LA College Promise by offering all graduates of the Los Angeles Unified School Districts and local charter schools free tuition and will seek to expand the promise to additional school districts and municipalities in the service area.
Measure 1.3.1: Number and percentage of LA College Promise students
SIS/PeopleSoft
Measure 1.3.2: Number of schools and school districts served by LA College Promise program
SIS/PeopleSoft
Objective 4: We will increase access to those traditionally underrepresented in higher education by assisting students in gaining access to financial aid and ensuring all students receive orientation, multiple measures assessment and educational planning.
Measure 1.4.1: Number and percentage of students receiving financial aid
DataMart
Measure 1.4.2: Number and percentage of new students completing services in Assessment, Orientation, and Counseling
SIS/PeopleSoft
Page 2 of 12
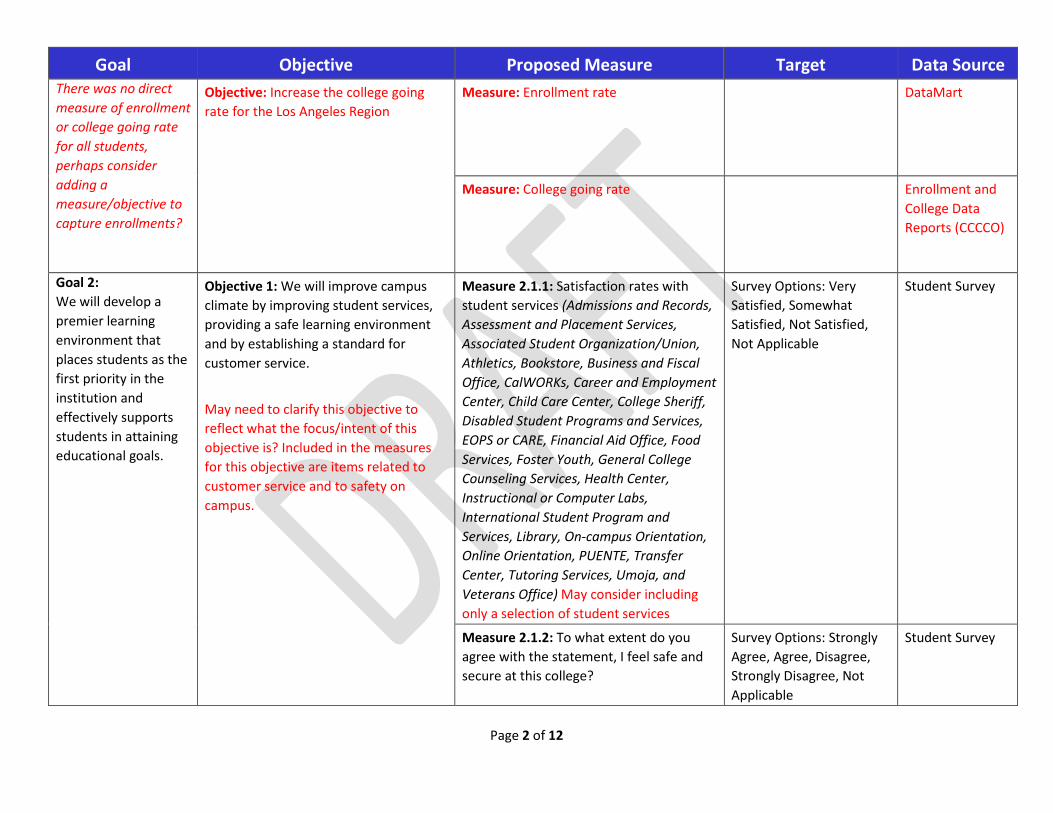
Goal Objective Proposed Measure Target Data Source There was no direct measure of enrollment or college going rate for all students, perhaps consider adding a measure/objective to capture enrollments?
Objective: Increase the college going rate for the Los Angeles Region
Measure: Enrollment rate DataMart
Measure: College going rate Enrollment and College Data Reports (CCCCO)
Goal 2: We will develop a premier learning environment that places students as the first priority in the institution and effectively supports students in attaining educational goals.
Objective 1: We will improve campus climate by improving student services, providing a safe learning environment and by establishing a standard for customer service. May need to clarify this objective to reflect what the focus/intent of this objective is? Included in the measures for this objective are items related to customer service and to safety on campus.
Measure 2.1.1: Satisfaction rates with student services (Admissions and Records, Assessment and Placement Services, Associated Student Organization/Union, Athletics, Bookstore, Business and Fiscal Office, CalWORKs, Career and Employment Center, Child Care Center, College Sheriff, Disabled Student Programs and Services, EOPS or CARE, Financial Aid Office, Food Services, Foster Youth, General College Counseling Services, Health Center, Instructional or Computer Labs, International Student Program and Services, Library, On-campus Orientation, Online Orientation, PUENTE, Transfer Center, Tutoring Services, Umoja, and Veterans Office) May consider including only a selection of student services
Survey Options: Very Satisfied, Somewhat Satisfied, Not Satisfied, Not Applicable
Student Survey
Measure 2.1.2: To what extent do you agree with the statement, I feel safe and secure at this college?
Survey Options: Strongly Agree, Agree, Disagree, Strongly Disagree, Not Applicable
Student Survey
Page 3 of 12
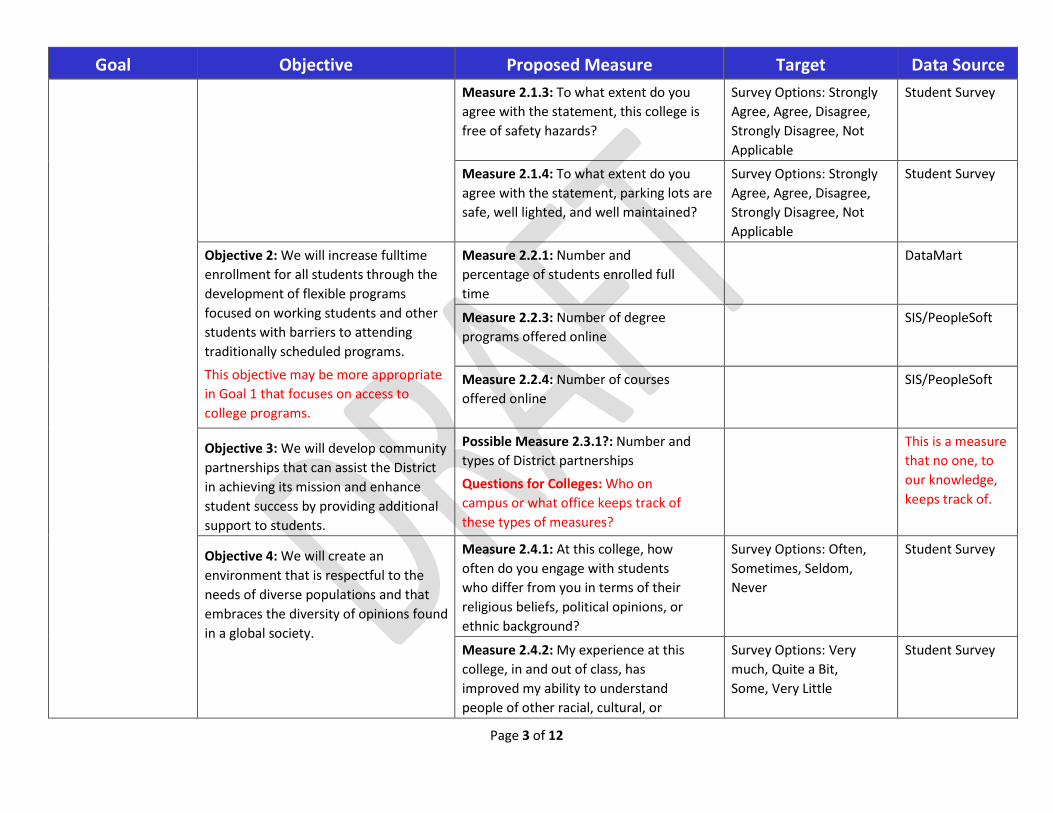
Goal Objective Proposed Measure Target Data Source Measure 2.1.3: To what extent do you agree with the statement, this college is free of safety hazards?
Survey Options: Strongly Agree, Agree, Disagree, Strongly Disagree, Not Applicable
Student Survey
Measure 2.1.4: To what extent do you agree with the statement, parking lots are safe, well lighted, and well maintained?
Survey Options: Strongly Agree, Agree, Disagree, Strongly Disagree, Not Applicable
Student Survey
Objective 2: We will increase fulltime enrollment for all students through the development of flexible programs focused on working students and other students with barriers to attending traditionally scheduled programs. This objective may be more appropriate in Goal 1 that focuses on access to college programs.
Measure 2.2.1: Number and percentage of students enrolled full time
DataMart
Measure 2.2.3: Number of degree programs offered online
SIS/PeopleSoft
Measure 2.2.4: Number of courses offered online
SIS/PeopleSoft
Objective 3: We will develop community partnerships that can assist the District in achieving its mission and enhance student success by providing additional support to students.
Possible Measure 2.3.1?: Number and types of District partnerships Questions for Colleges: Who on campus or what office keeps track of these types of measures?
This is a measure that no one, to our knowledge, keeps track of.
Objective 4: We will create an environment that is respectful to the needs of diverse populations and that embraces the diversity of opinions found in a global society.
Measure 2.4.1: At this college, how often do you engage with students who differ from you in terms of their religious beliefs, political opinions, or ethnic background?
Survey Options: Often, Sometimes, Seldom, Never
Student Survey
Measure 2.4.2: My experience at this college, in and out of class, has improved my ability to understand people of other racial, cultural, or
Survey Options: Very much, Quite a Bit, Some, Very Little
Student Survey
Page 4 of 12
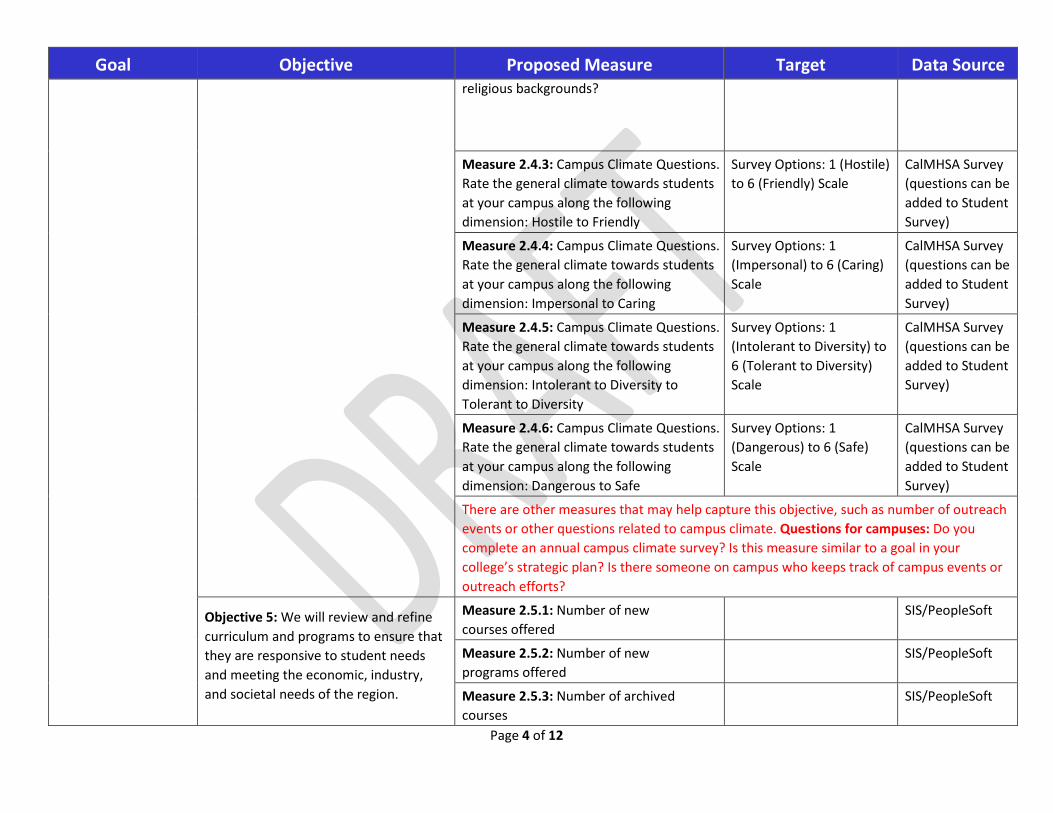
Goal Objective Proposed Measure Target Data Source religious backgrounds?
Measure 2.4.3: Campus Climate Questions. Rate the general climate towards students at your campus along the following dimension: Hostile to Friendly
Survey Options: 1 (Hostile) to 6 (Friendly) Scale
CalMHSA Survey (questions can be added to Student Survey)
Measure 2.4.4: Campus Climate Questions. Rate the general climate towards students at your campus along the following dimension: Impersonal to Caring
Survey Options: 1 (Impersonal) to 6 (Caring) Scale
CalMHSA Survey (questions can be added to Student Survey)
Measure 2.4.5: Campus Climate Questions. Rate the general climate towards students at your campus along the following dimension: Intolerant to Diversity to Tolerant to Diversity
Survey Options: 1 (Intolerant to Diversity) to 6 (Tolerant to Diversity) Scale
CalMHSA Survey (questions can be added to Student Survey)
Measure 2.4.6: Campus Climate Questions. Rate the general climate towards students at your campus along the following dimension: Dangerous to Safe
Survey Options: 1 (Dangerous) to 6 (Safe) Scale
CalMHSA Survey (questions can be added to Student Survey)
There are other measures that may help capture this objective, such as number of outreach events or other questions related to campus climate. Questions for campuses: Do you complete an annual campus climate survey? Is this measure similar to a goal in your college’s strategic plan? Is there someone on campus who keeps track of campus events or outreach efforts?
Objective 5: We will review and refine curriculum and programs to ensure that they are responsive to student needs and meeting the economic, industry, and societal needs of the region.
Measure 2.5.1: Number of new courses offered
SIS/PeopleSoft
Measure 2.5.2: Number of new programs offered
SIS/PeopleSoft
Measure 2.5.3: Number of archived courses
SIS/PeopleSoft
Page 5 of 12
Goal Objective Proposed Measure Target Data Source
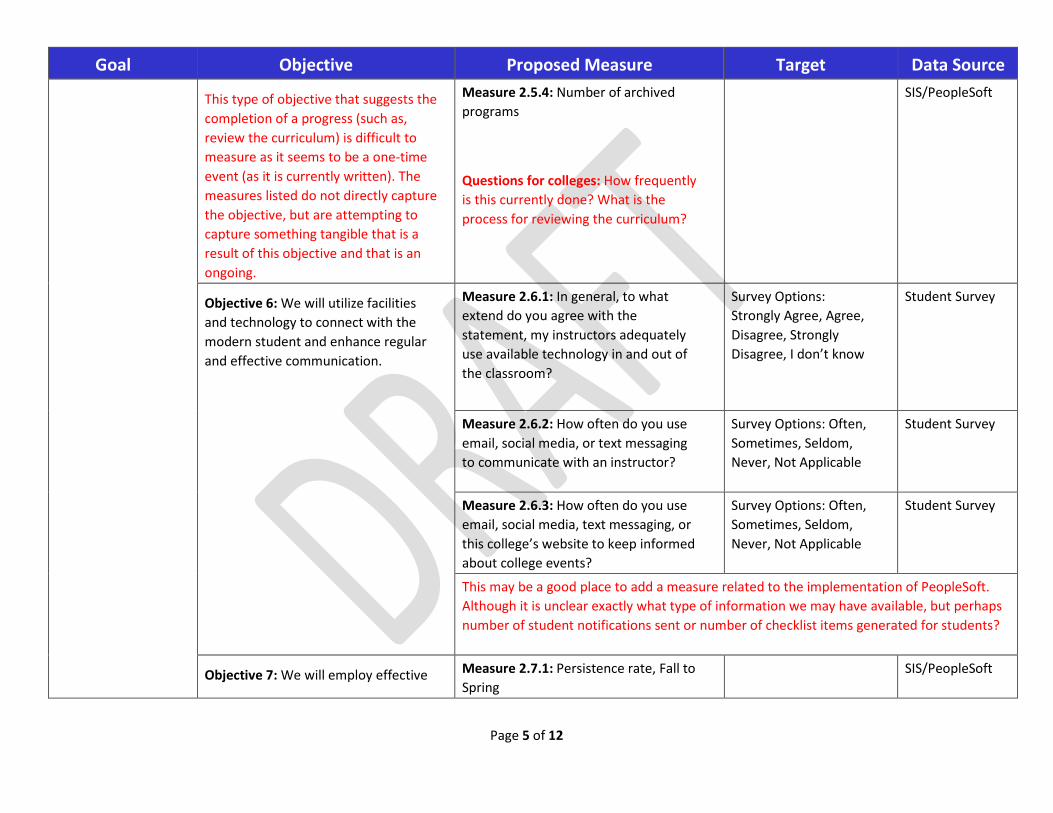
This type of objective that suggests the completion of a progress (such as, review the curriculum) is difficult to measure as it seems to be a one-time event (as it is currently written). The measures listed do not directly capture the objective, but are attempting to capture something tangible that is a result of this objective and that is an ongoing.
Measure 2.5.4: Number of archived programs Questions for colleges: How frequently is this currently done? What is the process for reviewing the curriculum?
SIS/PeopleSoft
Objective 6: We will utilize facilities and technology to connect with the modern student and enhance regular and effective communication.
Measure 2.6.1: In general, to what extend do you agree with the statement, my instructors adequately use available technology in and out of the classroom?
Survey Options: Strongly Agree, Agree, Disagree, Strongly Disagree, I don’t know
Student Survey
Measure 2.6.2: How often do you use email, social media, or text messaging to communicate with an instructor?
Survey Options: Often, Sometimes, Seldom, Never, Not Applicable
Student Survey
Measure 2.6.3: How often do you use email, social media, text messaging, or this college’s website to keep informed about college events?
Survey Options: Often, Sometimes, Seldom, Never, Not Applicable
Student Survey
This may be a good place to add a measure related to the implementation of PeopleSoft. Although it is unclear exactly what type of information we may have available, but perhaps number of student notifications sent or number of checklist items generated for students?
Objective 7: We will employ effective Measure 2.7.1: Persistence rate, Fall to Spring
SIS/PeopleSoft
Page 6 of 12
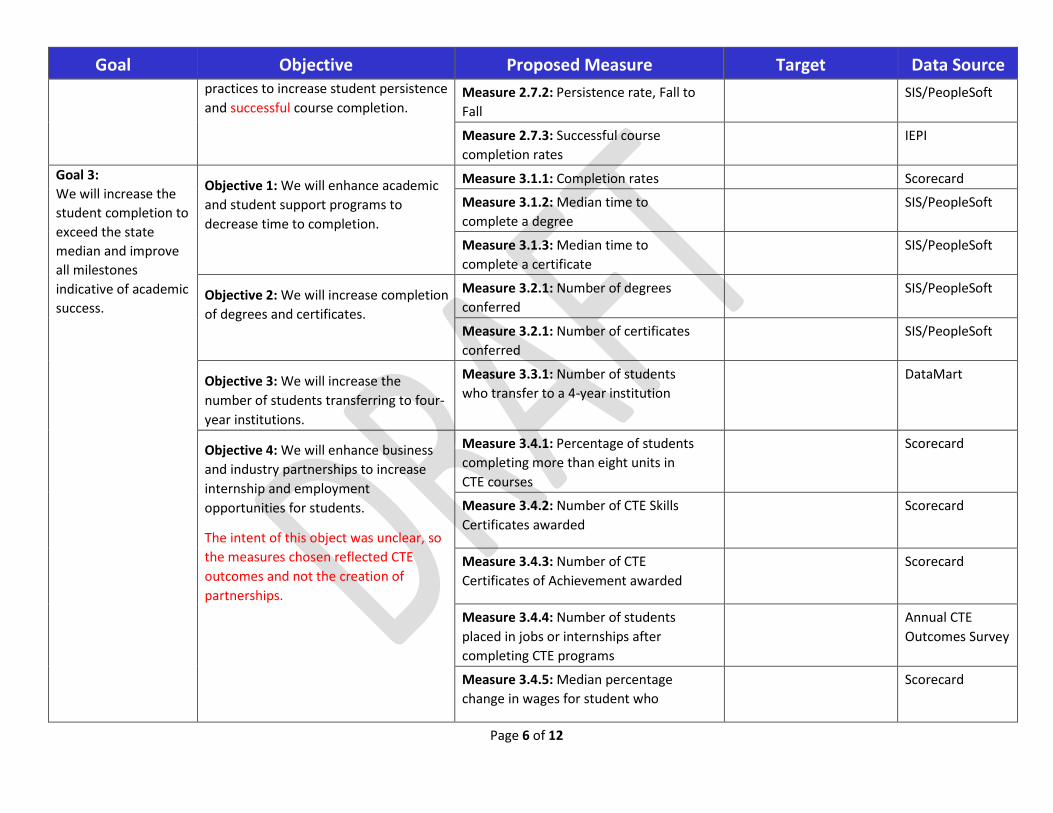
Goal Objective Proposed Measure Target Data Source practices to increase student persistence and successful course completion.
Measure 2.7.2: Persistence rate, Fall to Fall
SIS/PeopleSoft
Measure 2.7.3: Successful course completion rates
IEPI
Goal 3: We will increase the student completion to exceed the state median and improve all milestones indicative of academic success.
Objective 1: We will enhance academic and student support programs to decrease time to completion.
Measure 3.1.1: Completion rates Scorecard
Measure 3.1.2: Median time to complete a degree
SIS/PeopleSoft
Measure 3.1.3: Median time to complete a certificate
SIS/PeopleSoft
Objective 2: We will increase completion of degrees and certificates.
Measure 3.2.1: Number of degrees conferred
SIS/PeopleSoft
Measure 3.2.1: Number of certificates conferred
SIS/PeopleSoft
Objective 3: We will increase the number of students transferring to four-year institutions.
Measure 3.3.1: Number of students who transfer to a 4-year institution
DataMart
Objective 4: We will enhance business and industry partnerships to increase internship and employment opportunities for students.
The intent of this object was unclear, so the measures chosen reflected CTE outcomes and not the creation of partnerships.
Measure 3.4.1: Percentage of students completing more than eight units in CTE courses
Scorecard
Measure 3.4.2: Number of CTE Skills Certificates awarded
Scorecard
Measure 3.4.3: Number of CTE Certificates of Achievement awarded
Scorecard
Measure 3.4.4: Number of students placed in jobs or internships after completing CTE programs
Annual CTE Outcomes Survey
Measure 3.4.5: Median percentage change in wages for student who
Scorecard
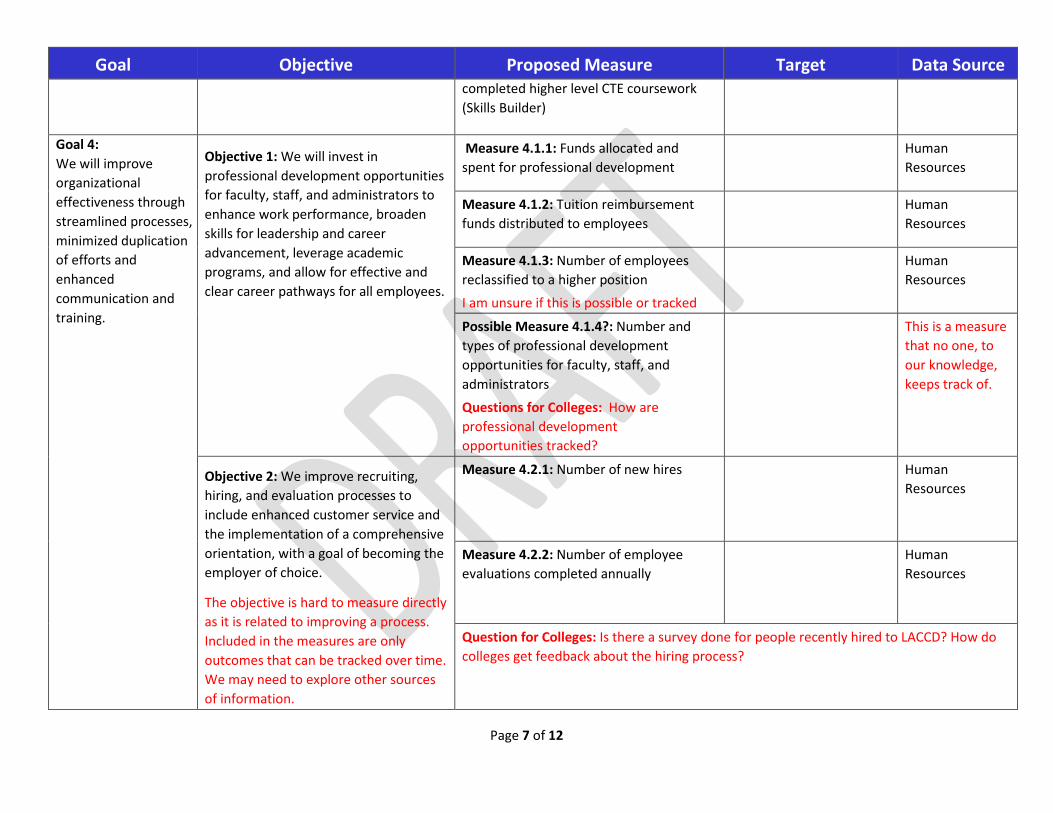
Page 7 of 12
Goal Objective Proposed Measure Target Data Source completed higher level CTE coursework (Skills Builder)
Goal 4: We will improve organizational effectiveness through streamlined processes, minimized duplication of efforts and enhanced communication and training.
Objective 1: We will invest in professional development opportunities for faculty, staff, and administrators to enhance work performance, broaden skills for leadership and career advancement, leverage academic programs, and allow for effective and clear career pathways for all employees.
Measure 4.1.1: Funds allocated and spent for professional development
Human Resources
Measure 4.1.2: Tuition reimbursement funds distributed to employees
Human Resources
Measure 4.1.3: Number of employees reclassified to a higher position I am unsure if this is possible or tracked
Human Resources
Possible Measure 4.1.4?: Number and types of professional development opportunities for faculty, staff, and administrators Questions for Colleges: How are professional development opportunities tracked?
This is a measure that no one, to our knowledge, keeps track of.
Objective 2: We improve recruiting, hiring, and evaluation processes to include enhanced customer service and the implementation of a comprehensive orientation, with a goal of becoming the employer of choice.
The objective is hard to measure directly as it is related to improving a process. Included in the measures are only outcomes that can be tracked over time. We may need to explore other sources of information.
Measure 4.2.1: Number of new hires
Human Resources
Measure 4.2.2: Number of employee evaluations completed annually
Human Resources
Question for Colleges: Is there a survey done for people recently hired to LACCD? How do colleges get feedback about the hiring process?
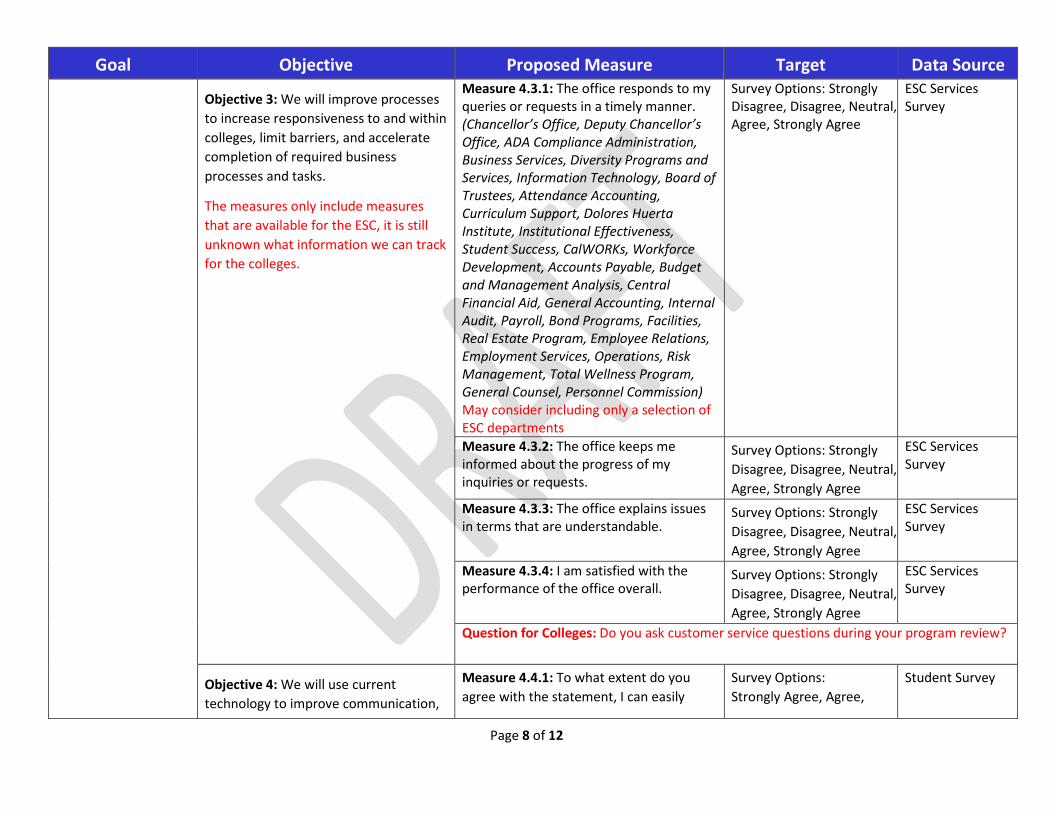
Page 8 of 12
Goal Objective Proposed Measure Target Data Source
Objective 3: We will improve processes to increase responsiveness to and within colleges, limit barriers, and accelerate completion of required business processes and tasks.
The measures only include measures that are available for the ESC, it is still unknown what information we can track for the colleges.
Measure 4.3.1: The office responds to my queries or requests in a timely manner. (Chancellor’s Office, Deputy Chancellor’s Office, ADA Compliance Administration, Business Services, Diversity Programs and Services, Information Technology, Board of Trustees, Attendance Accounting, Curriculum Support, Dolores Huerta Institute, Institutional Effectiveness, Student Success, CalWORKs, Workforce Development, Accounts Payable, Budget and Management Analysis, Central Financial Aid, General Accounting, Internal Audit, Payroll, Bond Programs, Facilities, Real Estate Program, Employee Relations, Employment Services, Operations, Risk Management, Total Wellness Program, General Counsel, Personnel Commission) May consider including only a selection of ESC departments
Survey Options: Strongly Disagree, Disagree, Neutral, Agree, Strongly Agree
ESC Services Survey
Measure 4.3.2: The office keeps me informed about the progress of my inquiries or requests.
Survey Options: Strongly Disagree, Disagree, Neutral, Agree, Strongly Agree
ESC Services Survey
Measure 4.3.3: The office explains issues in terms that are understandable.
Survey Options: Strongly Disagree, Disagree, Neutral, Agree, Strongly Agree
ESC Services Survey
Measure 4.3.4: I am satisfied with the performance of the office overall.
Survey Options: Strongly Disagree, Disagree, Neutral, Agree, Strongly Agree
ESC Services Survey
Question for Colleges: Do you ask customer service questions during your program review?
Objective 4: We will use current technology to improve communication,
Measure 4.4.1: To what extent do you agree with the statement, I can easily
Survey Options: Strongly Agree, Agree,
Student Survey
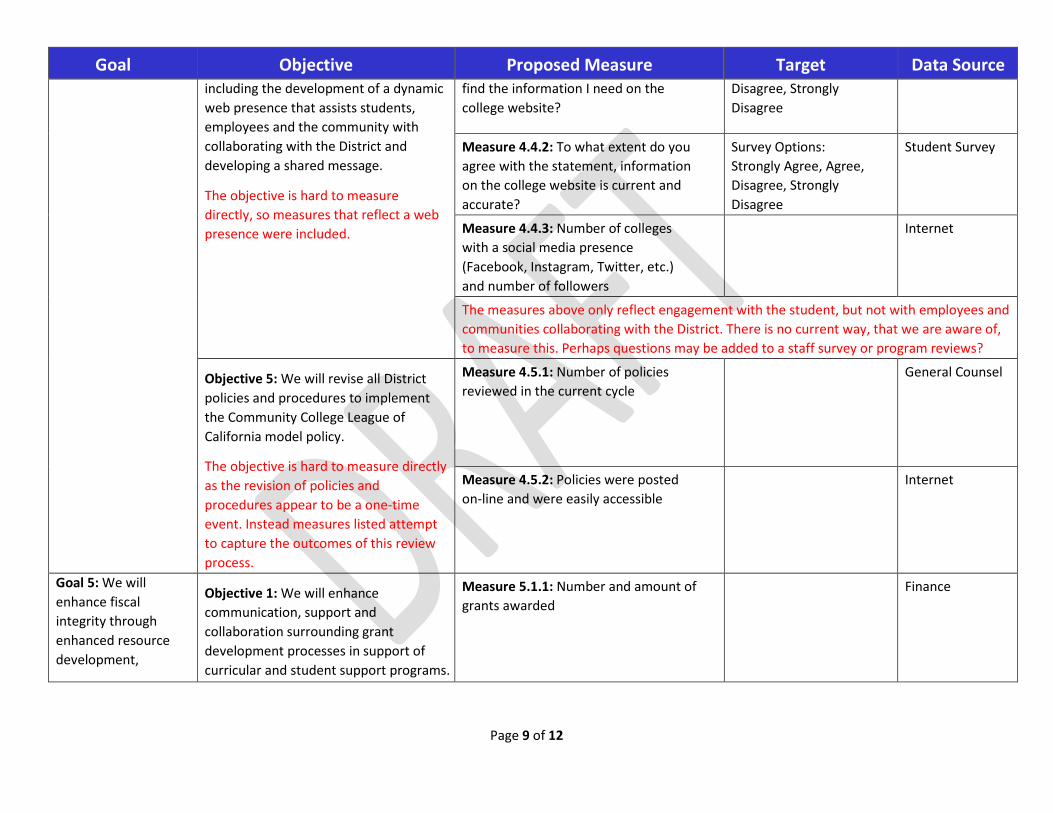
Page 9 of 12
Goal Objective Proposed Measure Target Data Source including the development of a dynamic web presence that assists students, employees and the community with collaborating with the District and developing a shared message.
The objective is hard to measure directly, so measures that reflect a web presence were included.
find the information I need on the college website?
Disagree, Strongly Disagree
Measure 4.4.2: To what extent do you agree with the statement, information on the college website is current and accurate?
Survey Options: Strongly Agree, Agree, Disagree, Strongly Disagree
Student Survey
Measure 4.4.3: Number of colleges with a social media presence (Facebook, Instagram, Twitter, etc.) and number of followers
Internet
The measures above only reflect engagement with the student, but not with employees and communities collaborating with the District. There is no current way, that we are aware of, to measure this. Perhaps questions may be added to a staff survey or program reviews?
Objective 5: We will revise all District policies and procedures to implement the Community College League of California model policy.
The objective is hard to measure directly as the revision of policies and procedures appear to be a one-time event. Instead measures listed attempt to capture the outcomes of this review process.
Measure 4.5.1: Number of policies reviewed in the current cycle
General Counsel
Measure 4.5.2: Policies were posted on-line and were easily accessible
Internet
Goal 5: We will enhance fiscal integrity through enhanced resource development,
Objective 1: We will enhance communication, support and collaboration surrounding grant development processes in support of curricular and student support programs.
Measure 5.1.1: Number and amount of grants awarded
Finance
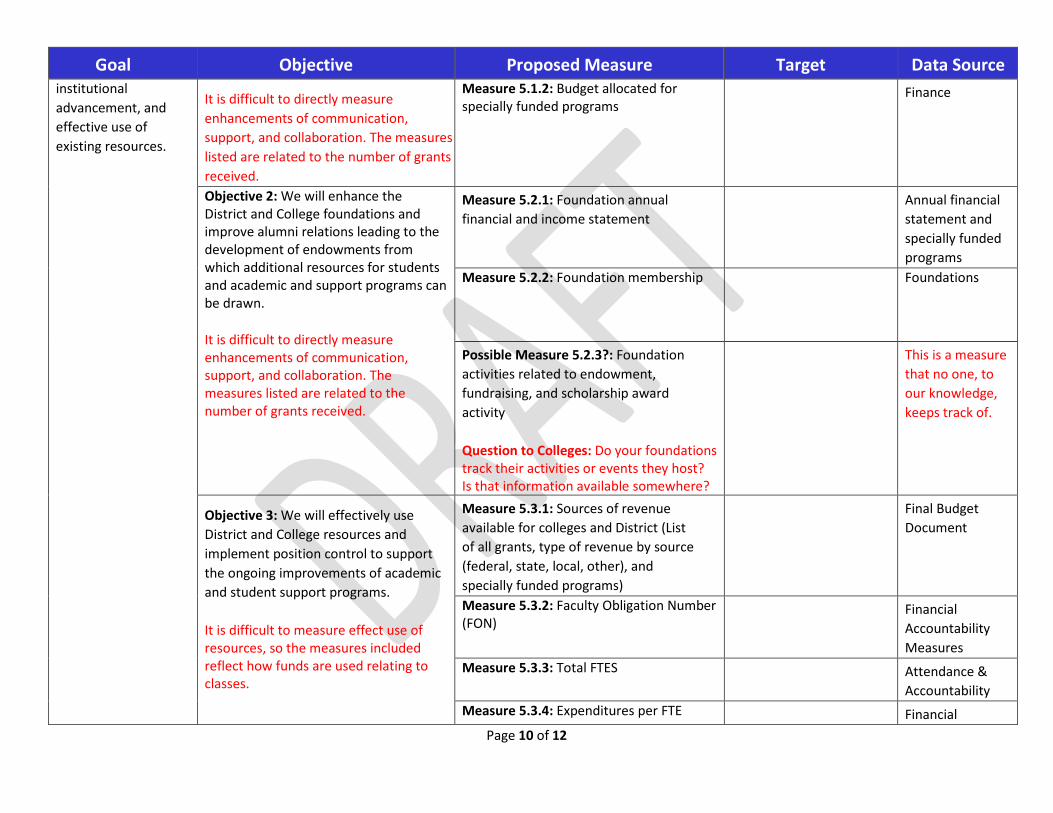
Page 10 of 12
Goal Objective Proposed Measure Target Data Source institutional advancement, and effective use of existing resources.
It is difficult to directly measure enhancements of communication, support, and collaboration. The measures listed are related to the number of grants received.
Measure 5.1.2: Budget allocated for specially funded programs
Finance
Objective 2: We will enhance the District and College foundations and improve alumni relations leading to the development of endowments from which additional resources for students and academic and support programs can be drawn.
It is difficult to directly measure enhancements of communication, support, and collaboration. The measures listed are related to the number of grants received.
Measure 5.2.1: Foundation annual financial and income statement
Annual financial statement and specially funded programs
Measure 5.2.2: Foundation membership Foundations
Possible Measure 5.2.3?: Foundation activities related to endowment, fundraising, and scholarship award activity
Question to Colleges: Do your foundations track their activities or events they host? Is that information available somewhere?
This is a measure that no one, to our knowledge, keeps track of.
Objective 3: We will effectively use District and College resources and implement position control to support the ongoing improvements of academic and student support programs.
It is difficult to measure effect use of resources, so the measures included reflect how funds are used relating to classes.
Measure 5.3.1: Sources of revenue available for colleges and District (List of all grants, type of revenue by source (federal, state, local, other), and specially funded programs)
Final Budget Document
Measure 5.3.2: Faculty Obligation Number (FON)
Financial Accountability Measures
Measure 5.3.3: Total FTES Attendance & Accountability
Measure 5.3.4: Expenditures per FTE Financial
Page 11 of 12
Goal Objective Proposed Measure Target Data Source Accountability Measures
Measure 5.3.5: Average class size Databook-Accountability
Measure 5.3.6: Fund balance Final Budget Document
Objective 4: We will improve the resource allocation processes to be integrated with District strategic plan.
Perhaps this objective is better placed in Goal 4, which focuses on organizational effectiveness. It is also difficult to measure a one-time event on an ongoing basis. What will the integrated strategic plan yield? This information may provide some insight on which measures to choose, unless the desired measure is simply the completion of the integrated District Strategic Plan.
Objective 5: We will effectively plan and use resources to build and maintain District and College facilities and infrastructure in support of the academic and student support programs.
It is difficult to measure effect use of resources, so the measures included will reflect the condition of facilities and a measure of facility utilization.
Measure 5.5.1: To what extent do you agree with the statement, buildings are clean and well maintained?
Survey Options: Strongly Agree, Agree, Disagree, Strongly Disagree, Not Applicable
Student Survey
Measure 5.5.2: To what extent do you agree with the statement, restrooms are clean and well maintained?
Survey Options: Strongly Agree, Agree, Disagree, Strongly Disagree, Not Applicable
Student Survey
Measure 5.5.3: To what extent do you agree with the statement, the grounds and public areas are clean and well maintained?
Survey Options: Strongly Agree, Agree, Disagree, Strongly Disagree, Not Applicable
Student Survey
Page 12 of 12
Goal Objective Proposed Measure Target Data Source Measure 5.5.4: To what extent do you agree with the statement, learning facilities (equipment, classrooms, and labs) are adequate and up-to-date?
Survey Options: Strongly Agree, Agree, Disagree, Strongly Disagree, Not Applicable
Student Survey
Measure 5.5.5: To what extent do you agree with the statement, there are enough labs and study spaces to meet my needs?
Survey Options: Strongly Agree, Agree, Disagree, Strongly Disagree, Not Applicable
Student Survey
Measure 5.5.6: The capitalization (cap) rate (the ratio of Net Operating Income to property asset value)
Facilities
Objective 6: We will develop and implement districtwide standards in information technology, facilities, and human resources that apply to all colleges.
This comment is similar to one for Objective 4. Perhaps this objective is better placed in Goal 4, which focuses on organizational effectiveness. It is also difficult to measure a one-time event on an ongoing basis. What results will the new standards yield? This information may provide some insight on which measures to choose, unless the desired measure is simply the completion of the new, districtwide standards.
Possible Measure 5.6.1?: Accreditation status
IEPI Website
Possible Measure 5.6.2?: Overall audit status
IEPI Website