Embed Size (px)
Citation preview
Draft Green Book – May 2018 i
Draft Green Book – May 2018 ii
Principal Authors
Michael Colvin, Policy & Planning Division Diane I. Fellman, Policy & Planning Division
Raisa Ledesma Rodriguez, Executive Division
Contributing Author
Alison LaBonte, Energy Division
Principal Editor
Rohimah Moly, Office of President Michael Picker
Disclaimer
This draft paper was prepared by California Public Utilities Commission (CPUC) staff. It does not necessarily represent the views of the CPUC, its Commissioners, or the State of California. The CPUC, the State of California,
its employees, contractors, and subcontractors make no warrants expressed or implied and assume no legal liability for the information in this paper. This paper will not be approved or disapproved by the CPUC, nor has the
CPUC passed upon the accuracy or adequacy of the information in this paper.
More information on the California Customer Choice Project and a digital copy of this paper can be found at: http://www.cpuc.ca.gov/customerchoice/
Draft Green Book – May 2018 iii
In the late 1990s, California deregulated the electric industry, allowing customers to choose their power supplier. But in 2000 and 2001, the new electric system collapsed, saddling customers with high costs and rolling outages. The California Legislature reset the large regulated utilities as the dominant providers of electric service, although the utilities no longer owned most power generators.
Customers are once again departing from the utilities as providers of their electricity. They are getting power from rooftop solar panels, from local agencies called Community Choice Aggregators or from private electric re-sellers called Direct Access providers. Large industrial customers are buying power directly from renewable generators, sometimes serving several locations from a distant wind farm or solar plant. Fewer and fewer customers are getting power from the traditional large regional utilities and the central decision making that we use for keeping the grid reliable, safe and affordable is splintering, becoming the task of dozens of decision-makers.
In the last deregulation, we had a plan, however flawed. Now, we are deregulating electric markets through dozens of different decisions and legislative actions, but we do not have a plan. If we are not careful, we can drift into another crisis.
This paper is produced by the California Public Utilities Commission’s Policy and Planning Division. While much of our work here is focused on current activities and implementing various laws, the Policy and Planning Division looks forward and conducts policy research on new and emerging trends. It researched the experience of other states and governments to see what has worked to give customers more control over how they get their electricity, and to evaluate what might be best for California.
The paper asks us to consider such question as:
How do we protect safe delivery of electricity to meet customer demand in an increasingly fragmented market?
How will we ensure that increasing fragmentation of suppliers and buyers will add up to meet our ambitious clean energy goals?
How will we make sure that different players are meeting their responsibilities to provide all the energy resources we need to make the grid work?
How will we protect customers from the unfair behavior like “slamming” and “cramming” that we saw during deregulation of telecommunications?
What preparations should we make for customers who might become stranded without service if their electric provider fails, as many did in the previous California deregulation?
What is the best way for a fair, affordable and durable transition?
Some of these decisions will require leadership from the Legislature, although others must be solved by the California Public Utilities Commission, with the help of our partners at the California Energy Commission and the California Independent System Operator. We plan to follow the publication of this white paper with a public workshop to hear comments and responses from the players who are driving this transformation of our electricity supply. And then we will dig deeper into solving the questions that the issues raised in this white paper demand that we answer.
Sincerely,
Michael Picker, President California Public Utilities Commission
Draft Green Book – May 2018 iv
Abstract
External changes driven by an uptake of distributed energy resources, the growth of non-utility load serving entities, and policy measures taken to mitigate climate change have provided customers more options to choose how and from whom they obtain electric services. While these changes create greater choices for customers, they also pose regulatory challenges.
Following a May 19, 2017 en banc hearing with the California Energy Commission on customer choice, the CPUC formed the California Customer Choice Project. Its mission is to aid the CPUC in making strategic, timely and informed decisions regarding California’s current electricity market transformation. Specifically, the California Customer Choice Project has been charged with analyzing a fundamental question:
How does the increased customer choice occurring in the electric sector impact California’s ability to achieve its policy objectives of affordability, decarbonization, and reliability?
Recognizing that these policy objectives are interwoven with one another and that there is no simple answer or obvious path, the Project approached the question by:
1. Reviewing California’s history with customer choice; 2. Identifying California’s energy policy goals through Core Principles and Key Questions; 3. Defining customer choice;
4. Evaluating representative national and global regulatory models that enable high penetration of customer choice: New York, Illinois, Texas and Great Britain; and
5. Leveraging lessons learned from California’s history and other markets to make observations and findings on what is necessary to achieve the state’s energy policy goals.
This draft paper sets the stage for a conversation among California energy policy decision-makers and stakeholders about the need to develop a plan to address the current shift in the evolving electricity market and the next steps in managing this transition. The paper provides a holistic and strategically agnostic view of the interdependent attributes related to customer choice.
Part I is an Introduction containing the problem statement and an overview of the key issues. Part II discusses the current status of California. Part III presents the Core Principles of affordability, decarbonization and reliability along with the Key Questions for considering customer choice. This section defines what is choice and what it is not. Part IV evaluates New York, Illinois, Texas and Great Britain’s regulatory frameworks and identifies findings for further consideration. Part V draws from the analysis of California’s history and other markets to make observations and identify considerations for California decision-makers. The appendices following the paper provide more detailed background information and analysis.
Notably, Appendix I provides a detailed history of competition and customer choice in California. The state was the first electricity market in the nation to consider full retail choice as well as the first to abandon the effort. California’s flawed plan offered lessons for other jurisdictions contemplating retail competition and market-based approaches to deliver energy services. Today, this history and these other markets provide insights based on two decades of experience to inform the assessment of California’s current electricity market and to develop a pathway forward. The paper presents findings from the different electricity markets to draw upon when deliberating policy and regulatory changes.
Draft Green Book – May 2018 v
Contents
Letter from President Michael Picker…………………………………………………………………………………………………….iii
Abstract ............................................................................................................................................iv
Contents ........................................................................................................................................... v
Tables and Figures ........................................................................................................................... viii
List of Acronyms and Units………………………………………………………………………………………………………………….ix
Key Terms and Definitions ................................................................................................................. x
PART I: Introduction – The Rapidly Evolving California Electricity Market Again Poses Major Challenges to
Reliability and Prosperity .................................................................................................................. 1
The California Energy Crisis of the Early 21st Century.............................................................................. 1
Rebuilding a Reliable Electric Industry...................................................................................................... 1
Overview of California’s Grid History: 1976-2003 .................................................................................... 3
New Policies and Technologies are Continuing to Change the Electric System ....................................... 4
California Needs a Clear Long-Term Vision for its Regulatory Framework .............................................. 4
California Customer Choice Project .......................................................................................................... 5
Fundamental Questions for Policy Makers and Stakeholders to Inform Future Action........................... 5
PART II: Today’s Energy Policies – A Grid that Works .......................................................................... 8
Ensuring Affordability ............................................................................................................................... 8
Achieving Decarbonization ....................................................................................................................... 9
California Renewables Portfolio Standard .......................................................................................... 10
Rooftop Solar ...................................................................................................................................... 11
Distributed Energy Resources and Supporting Programs ................................................................... 11
Electrification of the Transportation Sector ....................................................................................... 15
Guaranteeing Grid Reliability .................................................................................................................. 16
Resource Adequacy ............................................................................................................................ 16
Long-Term Procurement ..................................................................................................................... 16
Integrated Resource Plan .................................................................................................................... 17
Electricity Business Models: Beyond IOUs………………………………………………………………………………………18
Current Shifts Are Rapidly Reshaping California’s Electricity Markets ................................................... 19
Role of IOUs ........................................................................................................................................ 19
Customer Choice: Retail Supply and Self-Generation ........................................................................ 20
Draft Green Book – May 2018 vi
Reliability ............................................................................................................................................ 22
PART III: Evaluating Customer Choice ............................................................................................... 23
Core Principles of Affordability, Decarbonization and Reliability ........................................................... 23
Key Questions in Considering Customer Choice ..................................................................................... 23
What is Customer Choice? ...................................................................................................................... 25
Poles and Wires Are Not Customer Choices ....................................................................................... 25
Customer Profiles: Who are the customers? ...................................................................................... 25
Customer Segmentation ..................................................................................................................... 26
Part IV: Market Assessments ........................................................................................................... 28
New York Market Profile ........................................................................................................................ 29
Brief History ........................................................................................................................................ 29
Current State of Affairs: Reforming the Energy Vision (REV) ............................................................. 30
Customer Choice ................................................................................................................................. 31
Considering Core Principles and Key Questions: New York ................................................................ 32
Illinois Market Profile .............................................................................................................................. 35
Brief History ........................................................................................................................................ 35
Current State of Affairs: Municipal Energy Aggregators .................................................................... 36
Customer Choice ................................................................................................................................. 37
Considering Core Principles and Key Questions: Illinois ..................................................................... 38
Texas Market Profile ............................................................................................................................... 40
Brief History ........................................................................................................................................ 40
Current State of Affairs: Deregulated Market and Regulatory Structure ........................................... 41
Customer Choice ................................................................................................................................. 44
Considering Core Principles and Key Questions: Texas ...................................................................... 46
Great Britain Market Profile ................................................................................................................... 48
Brief History ........................................................................................................................................ 48
Current State of Affairs: Revenue = Innovation + Inputs + Outputs (RIIO) ......................................... 49
Customer Choice ................................................................................................................................. 50
Considering Core Principles and Key Questions: Great Britain .......................................................... 50
PART V: Observations & Future Considerations ................................................................................ 55
Affordability: Customers Need information, Protection and Guaranteed Service ................................ 55
Decarbonization: Statewide Mandates and Programs Drive Carbon Emissions Reductions ................. 56

Draft Green Book – May 2018 vii
Reliability: Operating the Grid Safely while Ensuring Reliable and Resilient Service Requires Oversight56
PART VI: Conclusion ........................................................................................................................ 61
APPENDIX I: History of Deregulation in California ............................................................................. 62
Competition in the Wholesale Market ................................................................................................... 62
The Yellow and Blue Books ..................................................................................................................... 63
The CPUC’s Restructuring Proceedings: R. 94-04-031 & I. 94-04-032 .................................................... 65
Assembly Bill (AB) 1890 – The Electric Utility Industry Restructuring Act .............................................. 67
The California Energy Crisis .................................................................................................................... 68
California’s Response to the Energy Crisis .............................................................................................. 69
Key Bills Passed in the 2001-2002 Session in Response to the Energy Crisis………………………………………70
APPENDIX II: Market Tables ............................................................................................................. 71
New York Electricity Market Profile ........................................................................................................ 71
Illinois Electricity Market Profile ............................................................................................................. 74
Texas Electricity Market Profile .............................................................................................................. 77
Great Britain Electricity Market Profile .................................................................................................. 80
California Electricity Market Profile ........................................................................................................ 83
APPENDIX III: Relevant Statutes and Proceedings ............................................................................. 86
APPENDIX IV: CCC Stakeholder Process Chronology .......................................................................... 87
Acknowledgements ......................................................................................................................... 89
Draft Green Book – May 2018 viii
Tables and Figures
Table 1: RPS Procurement Percentages in 2016 ......................................................................................... 10 Table 2: Annual RPS Position of CCAs (%) ................................................................................................... 11 Table 3: DER in California 2013 Compared to 2017 .................................................................................... 12 Table 4: Core Principles and Attributes…………………………………………………………………………………………………..23 Table 5: Key Questions and Attributes ....................................................................................................... 24 Table 6: Side-by-Side Bill Comparison…………………………………………………………………………………………………....27 Table 7: Affordability, Decarbonization and Reliability Features across Selected Markets…………………….28 Table 8: Considering New York's Regulatory Structure for Core Principles ............................................... 32 Table 9: Considering Illinois' Regulatory Structure for Core Principles ...................................................... 38 Table 10: Considering Texas' Regulatory Structure for Core Principles ..................................................... 46 Table 11: Considering Great Britain's Regulatory Structure for Core Principles ........................................ 51
Figure 1: California's Energy Policy Timeline ................................................................................................ 2 Figure 2: Direct Access Load Served by the State's Investor-Owned Utilities .............................................. 9 Figure 3: The "Rosenfeld Effect": California Energy Usage Per Capita vs. the Rest of the United States .. 14 Figure 4: California's Community Choice Aggregator Expansion (2010-2017) ........................................... 20 Figure 5: Map of CCAs in California ............................................................................................................ 21 Figure 6: Sample SCE Bundled Customer Electricity Bill ............................................................................. 27 Figure 7: Sample CCA Customer Electricity Bill in SCE Territorty ............................................................... 27 Figure 8: Historical Rise in Texas Market Wholesale Price Cap, 2012-2015 ............................................... 42 Figure 9: Annul ERCOT Reserve Margin Projections ................................................................................... 43
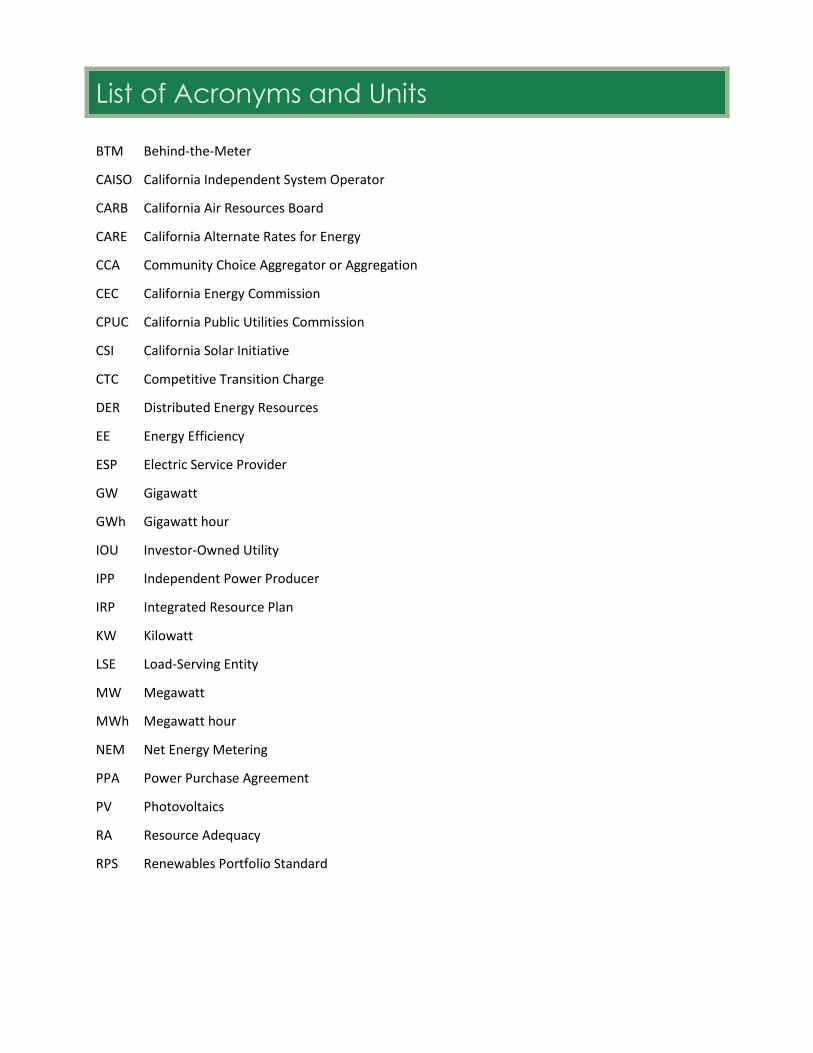
List of Acronyms and Units
BTM Behind-the-Meter
CAISO California Independent System Operator
CARB California Air Resources Board
CARE California Alternate Rates for Energy
CCA Community Choice Aggregator or Aggregation
CEC California Energy Commission
CPUC California Public Utilities Commission
CSI California Solar Initiative
CTC Competitive Transition Charge
DER Distributed Energy Resources
EE Energy Efficiency
ESP Electric Service Provider
GW Gigawatt
GWh Gigawatt hour
IOU Investor-Owned Utility
IPP Independent Power Producer
IRP Integrated Resource Plan
KW Kilowatt
LSE Load-Serving Entity
MW Megawatt
MWh Megawatt hour
NEM Net Energy Metering
PPA Power Purchase Agreement
PV Photovoltaics
RA Resource Adequacy
RPS Renewables Portfolio Standard

Key Terms and Definitions
Community choice aggregator (CCA): a term used across markets to describe an aggregator formed by local communities under state law aiming to negotiate lower energy prices for constituents as well as committing to clean energy generation sources. In California, CCAs are a load serving entity, entering into contracts directly with wholesale generators. In other markets, like New York, Illinois and Texas, CCAs purchase their energy through a retail service provider.
Cost of service regulation: a traditional electric utility regulation under which a utility can set rates based on the cost of providing service to customers and the right to earn a limited profit.1
Distributed energy resources (DER): an umbrella term to capture distributed renewable generation resources, energy efficiency, energy storage, electric vehicles, and demand response technologies.2
Distribution network: low-voltage grid infrastructure that carries power to and from individual customers.
Distribution system operator (DSO): the entity that assures reliability on the distribution network and manages a market-based distribution system platform. The DSO also facilitates participation on the market platform among retail service providers, DER market participants and other third-parties. DSOs may also own and maintain the distribution system.
Distribution system platform: a market-based platform established and maintained by the distributions system operator that optimizes resources on the distribution network, both in-front-of-the-meter and behind-the-meter. The platform communicates price signals for DER valuation and enables market participants to make transactions on the distribution network.
Independent power producer (IPP): owns and operates generation assets. Term is relevant in jurisdictions that have restructured.
Load: Aggregated electricity demand.
Load serving entity (LSE): entity purchasing electricity from wholesale market and supplying retail service to customer. Market jurisdictions and frameworks have differences in the entities allowed to serve as the load serving entity. Retail service providers and community choice aggregators are possible load serving entities.
Low-income customers: segment of electric customers eligible for low-income programs in that state. Eligibility criteria different for each state and are specified in the Appendix.
Network service: the service utilities provide in delivering power to, and carrying power from, customers via transmission and distribution infrastructure; and in maintaining the infrastructure, personnel, and data systems necessary to do so.
Performance-based regulation: a regulatory approach that focuses on desired, measurable outcomes, rather than prescriptive processes, techniques, or procedures. Performance-based regulation leads to defined results without specific direction regarding how those results are to be obtained.3
1 https://www.eia.gov/tools/glossary/?id=electricity
2 PUC Code Section 769
3 https://www.nrc.gov/reading-rm/basic-ref/glossary/performance-based-regulation.html

Provider of last resort: a back-up load serving entity that is available to offer retail service as a safety net for customers whose chosen load serving entity is unable to continue service. Term is relevant in states that have restructured where customers have a choice of load serving entity.
Retail service provider: a for-profit load serving entity providing customers retail service. The term only applies in jurisdictions that have restructured (i.e. separated retail service out of vertically-integrated utility role). Jurisdictions use different terms for their retail service provider, for example, electric service provider in California.
Retail service: the service that load-serving entities provide in purchasing energy to serve customers’ load.
Self-generation: refers to distributed generation technologies installed on the customer's side of the utility meter, or behind-the-meter. The electricity generated by the installed technology provides a portion or all of the customer's electric load.
Standby service: a service that a self-generating customer’s load-serving entity offers to provide back-up electric service when the customer’s generator(s) is not operating as intended.
Vertically-integrated utilities: A regulatory model where the electric utility owns and operates all
aspects of electric generation, transmission, distribution and other associated electric services.
Draft Green Book – May 2018 1
PART I: Introduction – The Rapidly Evolving
California Electricity Market Again Poses Major
Challenges to Reliability and Prosperity4
The California Energy Crisis of the Early 21st Century
California began in the 1990s to explore a shift away from the traditional vertically-integrated utility model where monopoly utilities owned electricity generating facilities, high voltage transmission lines, and the local distribution network, and provided electricity service to all customers in their service territory. This shift was to take advantage of an emerging trend of independent companies building power plants that initially started under a federal statute called the Public Utilities Regulatory Policy Act of 1978 (PURPA), which was framed during the OPEC oil boycotts of the late 1970s and forced utility purchases of energy from independent power providers.
The electric industry redesign of the 1990s (often referred to as deregulation) was developed to create a competing retail electric market where the incumbent utilities would become a “wires company” to provide the transmission and distribution services but would compete with third party providers to provide the electrical generation service to both residential and commercial customers. The requirements of this redesign were initially developed in a series of policy papers and regulatory orders from the California Public Utilities Commission (CPUC or Commission) and ultimately advanced by the Legislature in 1996 in AB 1890 (Brulte). As part of this redesign, the Commission created conditions prior to opening up competition that resulted in the monopoly utilities selling most of their fossil-fueled electric generating facilities.5
Flaws in the market design, weak market monitoring programs and gaming by large out of state arbitrageurs resulted in skyrocketing prices in the new market, collapse of some of the competitive providers, and shortages in energy supply that resulted in rolling outages to customers. The crisis was also a huge blow to California’s image and prestige, as the state’s electricity market was portrayed around the nation as being mired in chaos and, according to some, fundamentally broken.
Rebuilding a Reliable Electric Industry
After the California Energy Crisis, the Legislature and the CPUC developed a regulatory construct that has kept the lights on, ensured that electric bills remained affordable, and progressed to deep decarbonization of the electric industry and its fuel supply.6 With direction from the Legislature the CPUC developed resource adequacy requirements for electricity providers (who are called “load serving entities”) to prove to the CPUC on an annual basis that they have an adequate supply of electricity generation under contract to meet their customers’ needs. The CPUC worked to stabilize
4 Appendix I contains a comprehensive survey of California’s history of electricity market competition, the factors leading to a deregulated and restructured electricity market design, the causes of the Energy Crisis and the legislative actions taken to mitigate against the fatal flaws in that market design. 5The IOUs retained ownership of the nuclear power plants and hydroelectric dams. 6 These are the three pillars of California’s energy policy. See e.g. An Evaluation of Regulatory Framework Options for an Evolving Electric Market, Staff White Paper, May, 2017
Draft Green Book – May 2018 2
the finances of the incumbent electric monopolies, and successfully intervened in PG&E’s federal bankruptcy.
Under this new policy regime, the investor-owned utilities maintained responsibility subject to CPUC jurisdiction for the complex grid of poles, wires, substations and transformers that deliver power to every home, business and community in California.7 The incumbent utilities provided service to most customers. The ability of third-party companies to provide electrical service to customers was suspended for new customers, limited to the nonresidential sector and capped at the pre-crisis level. The Legislature instituted a rate freeze to protect customers from future price increases. While the new regime largely returned California to a monopoly retail market, it left the competitive wholesale market largely in place but imposed a number of new rules to reduce future risks of manipulation. The incumbent utilities still did not directly own most of the electric generation needed to meet their customers’ demand, but instead purchased long-term contracts from independent power providers who competed to meet the state’s overall needs.
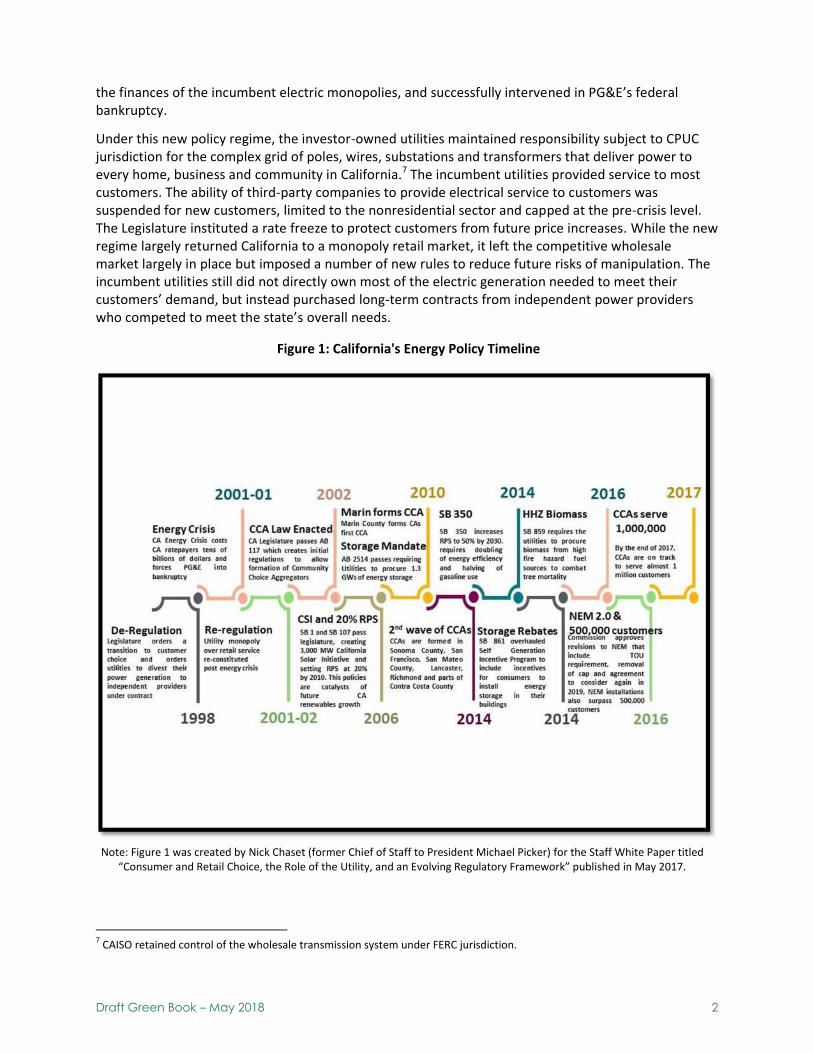
Figure 1: California's Energy Policy Timeline
7 CAISO retained control of the wholesale transmission system under FERC jurisdiction.
Note: Figure 1 was created by Nick Chaset (former Chief of Staff to President Michael Picker) for the Staff White Paper titled “Consumer and Retail Choice, the Role of the Utility, and an Evolving Regulatory Framework” published in May 2017.
Draft Green Book – May 2018 3
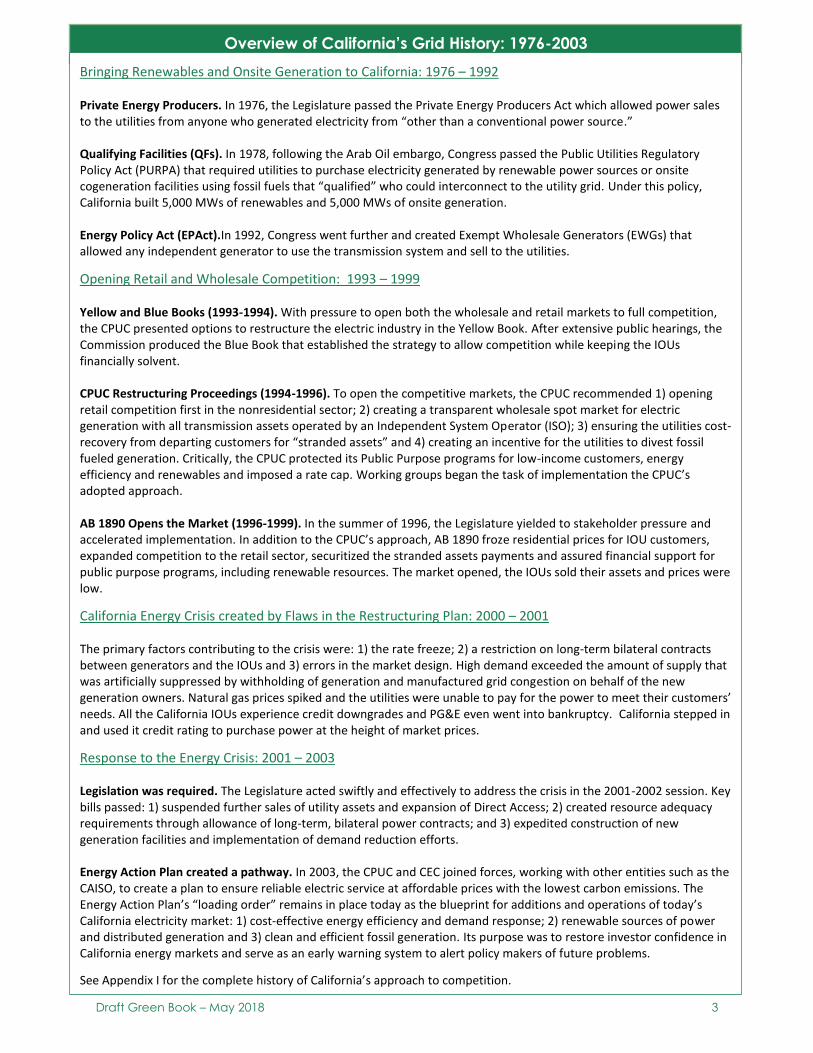
Overview of California’s Grid History: 1976-2003
Bringing Renewables and Onsite Generation to California: 1976 – 1992 Private Energy Producers. In 1976, the Legislature passed the Private Energy Producers Act which allowed power sales to the utilities from anyone who generated electricity from “other than a conventional power source.” Qualifying Facilities (QFs). In 1978, following the Arab Oil embargo, Congress passed the Public Utilities Regulatory Policy Act (PURPA) that required utilities to purchase electricity generated by renewable power sources or onsite cogeneration facilities using fossil fuels that “qualified” who could interconnect to the utility grid. Under this policy, California built 5,000 MWs of renewables and 5,000 MWs of onsite generation. Energy Policy Act (EPAct).In 1992, Congress went further and created Exempt Wholesale Generators (EWGs) that allowed any independent generator to use the transmission system and sell to the utilities.
Opening Retail and Wholesale Competition: 1993 – 1999 Yellow and Blue Books (1993-1994). With pressure to open both the wholesale and retail markets to full competition, the CPUC presented options to restructure the electric industry in the Yellow Book. After extensive public hearings, the Commission produced the Blue Book that established the strategy to allow competition while keeping the IOUs financially solvent. CPUC Restructuring Proceedings (1994-1996). To open the competitive markets, the CPUC recommended 1) opening retail competition first in the nonresidential sector; 2) creating a transparent wholesale spot market for electric generation with all transmission assets operated by an Independent System Operator (ISO); 3) ensuring the utilities cost-recovery from departing customers for “stranded assets” and 4) creating an incentive for the utilities to divest fossil fueled generation. Critically, the CPUC protected its Public Purpose programs for low-income customers, energy efficiency and renewables and imposed a rate cap. Working groups began the task of implementation the CPUC’s adopted approach. AB 1890 Opens the Market (1996-1999). In the summer of 1996, the Legislature yielded to stakeholder pressure and accelerated implementation. In addition to the CPUC’s approach, AB 1890 froze residential prices for IOU customers, expanded competition to the retail sector, securitized the stranded assets payments and assured financial support for public purpose programs, including renewable resources. The market opened, the IOUs sold their assets and prices were low.
California Energy Crisis created by Flaws in the Restructuring Plan: 2000 – 2001
The primary factors contributing to the crisis were: 1) the rate freeze; 2) a restriction on long-term bilateral contracts between generators and the IOUs and 3) errors in the market design. High demand exceeded the amount of supply that was artificially suppressed by withholding of generation and manufactured grid congestion on behalf of the new generation owners. Natural gas prices spiked and the utilities were unable to pay for the power to meet their customers’ needs. All the California IOUs experience credit downgrades and PG&E even went into bankruptcy. California stepped in and used it credit rating to purchase power at the height of market prices.
Response to the Energy Crisis: 2001 – 2003
Legislation was required. The Legislature acted swiftly and effectively to address the crisis in the 2001-2002 session. Key bills passed: 1) suspended further sales of utility assets and expansion of Direct Access; 2) created resource adequacy requirements through allowance of long-term, bilateral power contracts; and 3) expedited construction of new generation facilities and implementation of demand reduction efforts. Energy Action Plan created a pathway. In 2003, the CPUC and CEC joined forces, working with other entities such as the CAISO, to create a plan to ensure reliable electric service at affordable prices with the lowest carbon emissions. The Energy Action Plan’s “loading order” remains in place today as the blueprint for additions and operations of today’s California electricity market: 1) cost-effective energy efficiency and demand response; 2) renewable sources of power and distributed generation and 3) clean and efficient fossil generation. Its purpose was to restore investor confidence in California energy markets and serve as an early warning system to alert policy makers of future problems.
See Appendix I for the complete history of California’s approach to competition.

Draft Green Book – May 2018 4
New Policies and Technologies are Continuing to Change the Electric
System
Along with establishing a new regulatory regime to ensure resource adequacy after the Energy Crisis, California aggressively moved to make electric generation and consumption greener with an initial focus on fuel diversity, reducing local air pollution and other environmental impacts while ultimately moving to efforts to decarbonize electric generation. California’s efforts to reduce greenhouse gas (GHG) emissions have led to significant innovation in technologies and in business models. Large and small renewable power plant developers now produce more than 20,000 megawatts (MW) of renewable generation in the state. This new generation and projects that are under development mean that large incumbent utilities will all meet and exceed the requirements to meet at least 33% of their electricity demand with renewable generation by 2020.
California was able to achieve rapid transformation in renewable technologies because of the requirements for utility contracting and incentives, which leveraged the incumbent utilities’ ability to conduct competitive procurements for resources and their ability to borrow large sums of money cheaply from lenders. Investors were assured repayment over time by the CPUC’s authority to grant cost recovery through transparent rate-setting procedures and a large universe of customers. Beyond renewable procurement, the Legislature and the CPUC have relied on the incumbent utilities’ economies of scale as a finance model to underwrite energy efficiency investments, market transformation programs for technologies such as rooftop solar and battery storage, demand response programs, and low-income programs. The utilities are paid in these instances, not for selling electricity, but for costs incurred by being the platform to provide other services that help meet customer needs.
As many of these programs mature, they empower customers to choose from new distributed energy options or to procure electricity from companies and agencies deploying new business models. These options all use the utility’s grid to deliver that power and include, rooftop solar companies that lease or sell solar panel arrays to homeowners, behind-the-meter (BTM) customers who want to control their own supplies with preferred resources and storage, Direct Access customers and CCAs.
With the growth of these choice options, the role of investor-owned and state-regulated electric utilities in meeting customer load (aggregated demand for electricity) has decreased and is changing from the utility business model that has served California customers for the past 100 years. Between
rooftop solar, CCAs and DA providers, as much as 25%8 of IOU retail electric load will be effectively
unbundled and served by a non-IOU source or provider sometime later this year. This share is expected to grow quickly over the coming decade. Whatever the next evolution in the regulatory framework, the IOUs will retain responsibility for essential safe and reliable grid operations.
California Needs a Clear Long-Term Vision for its Regulatory Framework
The community choice aggregation movement, proliferation of rooftop solar along with other customer installed resources, and the continued digitization of the electric grid have transformed a once vertically-integrated industry into one with increasing fragmented responsibility for resource procurement and resource adequacy. And this new disaggregated system must, of course, continue
8 See Figure 4 below.
Draft Green Book – May 2018 5
providing Californians with reliable service at affordable rates while achieving deep decarbonization goals.
Increased competition and energy choices for customers have largely been viewed as positive. But as the status quo retail electric service model is being up-ended, the CPUC must now review long-held assumptions in its regulatory framework. The Commission must examine the role of the IOU at the center of this system, as well as new market entrants such as CCAs, and technological developments that allow users to have more individual control of their energy supply. To determine a pathway that accounts for more alternative providers and choices for customers, the CPUC needs to identify and assess the underlying threats and opportunities in relation to California’s policy goals. Essentially, we must ask and answer how these changes in the electric sector influence California’s ability to achieve its policy objectives of affordability, decarbonization, and reliability.
Without a coherent and comprehensive plan, the current policies in place may drift California to an unintended outcome and breakdown in services like the Energy Crisis.
California Customer Choice Project
In 2017, the CPUC and the California Energy Commission (CEC) commenced an inquiry into the many changes occurring in California’s electricity sector. The May 19 en banc hearing identified risks and opportunities for California moving toward policies allowing more choices for customers. Recognizing the regulatory challenges posed by transitions taking place, the Commission formed the California Customer Choice Project (Project) to assist with the appropriate next steps. A key component was researching how the Legislature and CPUC, in partnership, developed policies that opened wholesale market competition, established the basis for restructuring the electricity market to allow retail competition and then acted to correct the market flaws that caused the California Energy Crisis. Appendix I contains a history of the California Energy Market from the creation of private energy producers, through qualifying facilities to the Yellow & Blue Books and the CPUC’s idea of a meaningful and comprehensive plan to approach deregulation and, then, AB 1890’s market acceleration. This appendix discusses the aspects of and flaws in the market design that led to the California Energy Crisis and lays out the corrective measures including key legislative actions and the state’s Energy Action Plan. To gather input from market participants and other jurisdictions, the Project held an informal public workshop on October 31, 2017, conducted stakeholder outreach, performed research on other markets comparable to California and assembled lessons learned. The experiences of these other markets combined with extensive stakeholder input can help to inform decision-makers on a path forward.
Fundamental Questions for Policy Makers and Stakeholders to Inform
Future Action
Creation of wider choices and broader alternatives for electric service require a pathway to accomplishing California’s energy policy objectives as defined by the Core Principles and Key Questions set forth in this paper. We are seeking stakeholder engagement to further explore these fundamental questions which include the following:
How does California continue its course as a global leader in achieving deep decarbonization as regulated utilities provide electricity to fewer Californians?
Draft Green Book – May 2018 6
o Does there need to be a single entity for policy target setting, implementation, oversight and enforcement?
o How can California continue to support innovation and provide financing for scaling up new technologies?
o What is needed reduce the use of fossil fuels such as natural gas, which is used not just for electric power, but also for industry and in homes and buildings?
o How are the utilities compensated for providing the essential infrastructure to achieve these policies?
What are the essential grid operations to make sure California’s lights stay on? o Who has the requirement to perform the necessary functions? o Who establishes the rules and has enforcement authority? o What does it cost and who pays?
Can California provide investment and operational certainty to address reliability and resiliency, especially in the face of catastrophic events that impact the electric sector, such as the 2017 wildfires?
o With so many decision-makers entering into the market to provide electrical supply, how do we ensure coordination to provide all the energy needs for reliability purposes?
o Who will provide backstop procurement for resource adequacy if there are shortages of power needs identified in planning and a disaggregated set of electricity purchasers cannot fill the need?
o Who will coordinate supply and operations during local events where resources must come from outside the region? What is the responsibility of non-utility electricity suppliers to help meet unexpected contingencies?
o What role do non-utility providers play to ensure adequate responses to catastrophic and emergency events?
Are there adequate protections for all customers with the wider choices created by Direct Access, CCAs and behind-the-meter installations?
o Should there be a state entity that provides basic customer protections to customers of services that are either behind the meter or served by entities not historically under the jurisdiction of the CPUC?
o Who will ensure that customers have access to power service if a lightly or unregulated electric power provider fails?
o What protects customers who are not interested in choice, elect not to engage or unwittingly make the wrong decision or might otherwise be left behind?
What is the role of the investor-owned utilities in the new regulatory construct?
o Under all visions of the future, the IOUs continue to provide transmission, distribution and other grid services, what are the requirements to maintain these systems?
o How will these utilities be compensated for building the necessary infrastructure and operating the grid?
Regulated utilities were required by laws, like the Renewables Portfolio Standard, to enter into long-term contracts. If customers increasingly buy electricity from non-utility sources, what happens to the contracts that the regulated entities executed?
o Who will execute the long-term contracts that can be used to finance construction of new facilities going forward?

Draft Green Book – May 2018 7
o Should the incumbent electric utilities be allowed to compete with other market participants, or should they be limited to offering a platform for other electricity suppliers?

Draft Green Book – May 2018 8
PART II: Today’s Energy Policies – A Grid that
Works
Following is an overview of California’s Core Principles: affordability, decarbonization and reliability, including safety. These three elements have been central to California’s energy policy since the 1970s.
Ensuring Affordability
From the beginning, the CPUC’s charter requires that “All charges made by public utilities must be just and reasonable…Preferences and discriminations are made unlawful.”9 Through rate cases and its review of tariffs, the CPUC rigorously analyzes the utilities’ investment proposals and utilizes a transparent, public process to determine the ratepayer impacts before imposing new charges on customers. The key determinants are that one ratepayer group cannot be harmed for the benefit of another ratepayer class. Historically, the CPUC’s work centered on vertically-integrated, bundled service. Today, it extends to determining cost-shifts due to specialized programs as well as safeguarding the ability of all customers to receive electric service that they can afford.
California IOUs’ rates have also been tied to regional usage so customers in high demand/warmer regions of the state have a higher “baseline,” and usage below that baseline costs far less. As part of the energy crisis legislation (AB 1x Keely, Migden 2001) rates were frozen for usage below the baseline. The freeze had the impact of imposing any new increase in costs solely on higher usage customers. The Legislature recognized the imbalance in this system and in 2013 enacted AB 327 to lift the freeze on rates. The CPUC began implementing10 a series of rate reforms that included varying rates based on time-of-use.
California has a program to reduce electricity costs for low-income residents.11 The California Alternate Rates for Energy (CARE) program provides customers who earn less than 200% of the federal poverty level a discount of up to 35% on their bill.12 The CARE program is used by approximately one-third of all residential customers. Other programs include Energy Savings Assistance, The Family Electric Rate Assistance (FERA), Medical Baseline13 and Federal Low-Income. The Legislature also created14 a Low-Income Oversight Board to help advise the Commission on matters of affordability, particularly those impacting low-income customers.
Direct Access was originally viewed as providing lower cost supplies to customers who could choose among competitors. AB 1890 allowed customers to directly access an energy service provider to save costs. Immediately after the Energy Crisis, in AB 1x, the program was capped and all new Direct Access
9The Public Utilities Act and Its Relation to the Public, Max Thelen from Public Utilities Act of California, compiled by Eugene R.
Hallett (1912) , p.19. 10
See Rulemaking (R.) 12-06-013 and Decision (D.)15-07-001 for additional information on rate reform activities. 11
The Legislature declared in Public Utilities Code §391 that “electricity is essential to the health, safety, and economic well-being of all California consumers.” 12
See Public Utilities Code §739.1 for additional details about the CARE program 13
See California Public Utilities Code §739 c(6) 14
Public Utilities Code §382.1(a) defines the scope of the Low-Income Oversight Board, and additional information can be found on its dedicated website, http://www.liob.org
Draft Green Book – May 2018 9
0.0%
2.0%
4.0%
6.0%
8.0%
10.0%
12.0%
14.0%
16.0%
18.0%
DA Suspension: September 20, 2001
DA Reopened: April 16, 2010
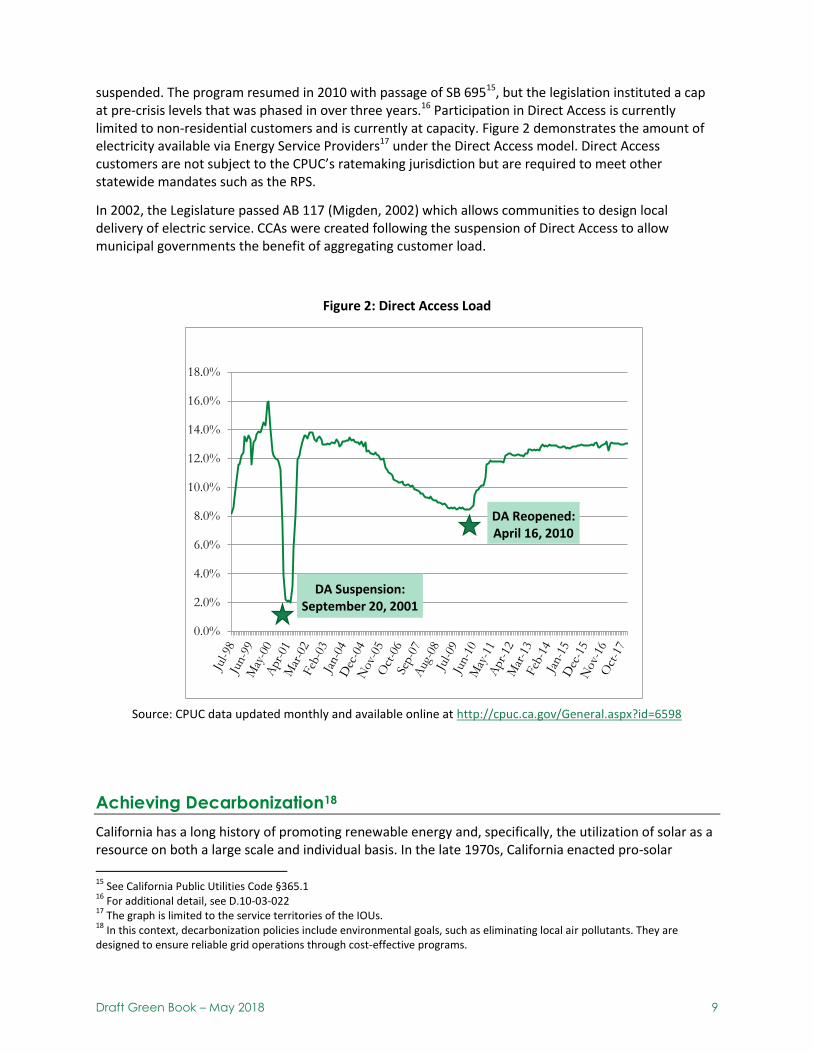
suspended. The program resumed in 2010 with passage of SB 69515, but the legislation instituted a cap at pre-crisis levels that was phased in over three years.16 Participation in Direct Access is currently limited to non-residential customers and is currently at capacity. Figure 2 demonstrates the amount of electricity available via Energy Service Providers17 under the Direct Access model. Direct Access customers are not subject to the CPUC’s ratemaking jurisdiction but are required to meet other statewide mandates such as the RPS.
In 2002, the Legislature passed AB 117 (Migden, 2002) which allows communities to design local delivery of electric service. CCAs were created following the suspension of Direct Access to allow municipal governments the benefit of aggregating customer load.
Figure 2: Direct Access Load
Source: CPUC data updated monthly and available online at http://cpuc.ca.gov/General.aspx?id=6598
Achieving Decarbonization18
California has a long history of promoting renewable energy and, specifically, the utilization of solar as a resource on both a large scale and individual basis. In the late 1970s, California enacted pro-solar
15
See California Public Utilities Code §365.1 16
For additional detail, see D.10-03-022 17
The graph is limited to the service territories of the IOUs. 18
In this context, decarbonization policies include environmental goals, such as eliminating local air pollutants. They are designed to ensure reliable grid operations through cost-effective programs.
Draft Green Book – May 2018 10
legislation authorizing incentives such as a tax credit and protections for smaller scale, customer installations BTM typically referred to as “rooftop” solar. This commitment continued through the passage of AB 1890, which created the Public Goods Charge (PGC) for IOUs to fund research and renewable programs at the California Energy Commission and efficiency programs at the CPUC. The CEC allocated these funds to new and existing larger renewable facilities and to emerging, smaller scale technologies.
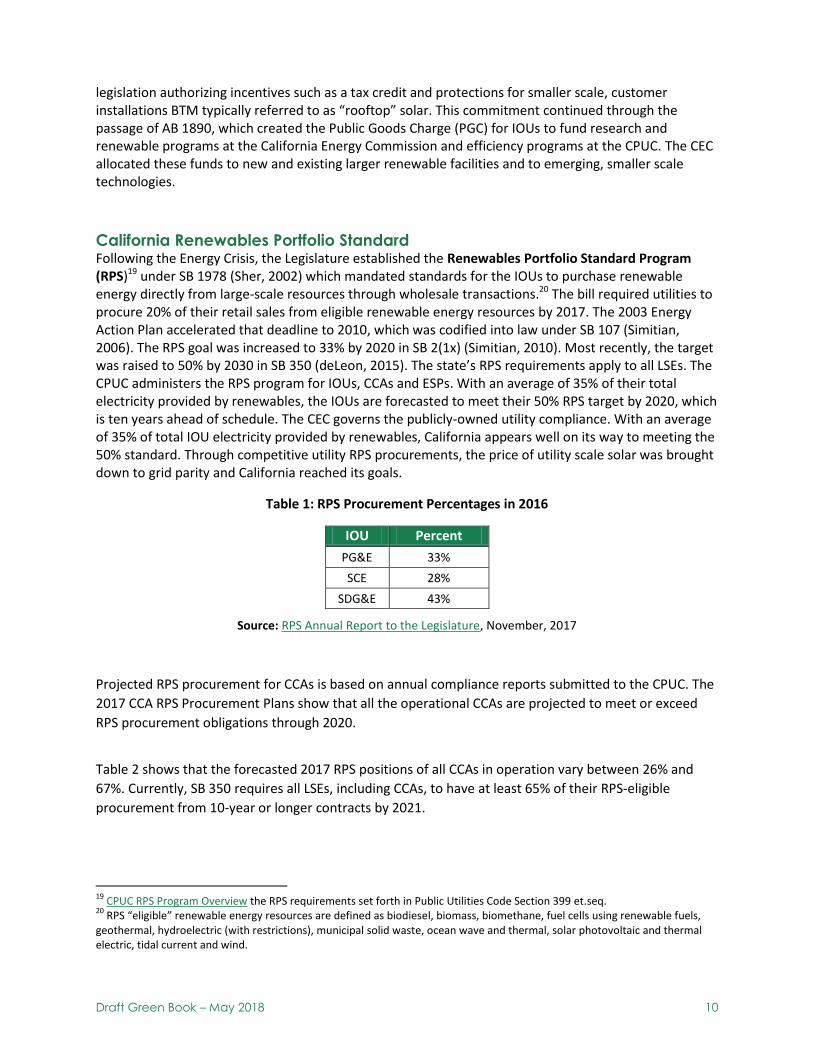
California Renewables Portfolio Standard Following the Energy Crisis, the Legislature established the Renewables Portfolio Standard Program (RPS)19 under SB 1978 (Sher, 2002) which mandated standards for the IOUs to purchase renewable energy directly from large-scale resources through wholesale transactions.20 The bill required utilities to procure 20% of their retail sales from eligible renewable energy resources by 2017. The 2003 Energy Action Plan accelerated that deadline to 2010, which was codified into law under SB 107 (Simitian, 2006). The RPS goal was increased to 33% by 2020 in SB 2(1x) (Simitian, 2010). Most recently, the target was raised to 50% by 2030 in SB 350 (deLeon, 2015). The state’s RPS requirements apply to all LSEs. The CPUC administers the RPS program for IOUs, CCAs and ESPs. With an average of 35% of their total electricity provided by renewables, the IOUs are forecasted to meet their 50% RPS target by 2020, which is ten years ahead of schedule. The CEC governs the publicly-owned utility compliance. With an average of 35% of total IOU electricity provided by renewables, California appears well on its way to meeting the 50% standard. Through competitive utility RPS procurements, the price of utility scale solar was brought down to grid parity and California reached its goals.
Table 1: RPS Procurement Percentages in 2016
IOU Percent
PG&E 33%
SCE 28%
SDG&E 43%
Source: RPS Annual Report to the Legislature, November, 2017
Projected RPS procurement for CCAs is based on annual compliance reports submitted to the CPUC. The
2017 CCA RPS Procurement Plans show that all the operational CCAs are projected to meet or exceed
RPS procurement obligations through 2020.
Table 2 shows that the forecasted 2017 RPS positions of all CCAs in operation vary between 26% and
67%. Currently, SB 350 requires all LSEs, including CCAs, to have at least 65% of their RPS-eligible
procurement from 10-year or longer contracts by 2021.
19
CPUC RPS Program Overview the RPS requirements set forth in Public Utilities Code Section 399 et.seq. 20
RPS “eligible” renewable energy resources are defined as biodiesel, biomass, biomethane, fuel cells using renewable fuels, geothermal, hydroelectric (with restrictions), municipal solid waste, ocean wave and thermal, solar photovoltaic and thermal electric, tidal current and wind.

Draft Green Book – May 2018 11
Table 2: Annual RPS Position of CCAs (%)
Online Date CCA Actual Forecasted
Year 2016
Year 2017
Year 2018
2010 Marin Clean Energy 55% 67% 54%
2014 Sonoma Clean Power 36% 43% 46%
2015 Lancaster Choice 39% 26% 26%
2016 Peninsula Clean Energy 59% 51% 29%
2016 CleanPowerSF 45% 44% 32%
2017 Apple Valley Choice No Data 32% 30%
2017 Pico Rivera No Data 50% 25%
2017 Redwood Coast No Data 33% 16%
2017 Silicon Valley No Data 50% 42%
Source: RPS Annual Report to the Legislature, November, 2017
Rooftop Solar In 2006, with the passage of SB 1, the CPUC implemented the California Solar Initiative (CSI) and allocated $2.167 billion of IOU ratepayer funds to be spent between 2007 and 2016 with the goal of installing 1,940 MWs of new solar generation capacity on homes and commercial buildings. In total, more than $3.5 billion was dedicated to solar electric installations and $250 million to solar thermal. The programs accomplished their objectives, as evidenced by more than 6,500 MWs installed.21
Distributed Energy Resources and Supporting Programs For the last 40 years, California has supported utilization of distributed energy resources. In addition to utility scale procurement, the 2005 Energy Action Plan prescribed distributed resources as part of the 2003 Energy Action Plan loading order to meet energy needs, which is referred to as Preferred Resources. Energy efficiency and demand response are first, followed by renewable sources and clean distributed generation such as storage. AB 327 (Perera, 2013) created Public Utilities Code Section 769 that also required the Commission to oversee the creation of utility Distribution Resources Plans (DRP).22
21
https://www.californiadgstats.ca.gov/ 22
Distributed Resources Plan information is located here.
Draft Green Book – May 2018 12
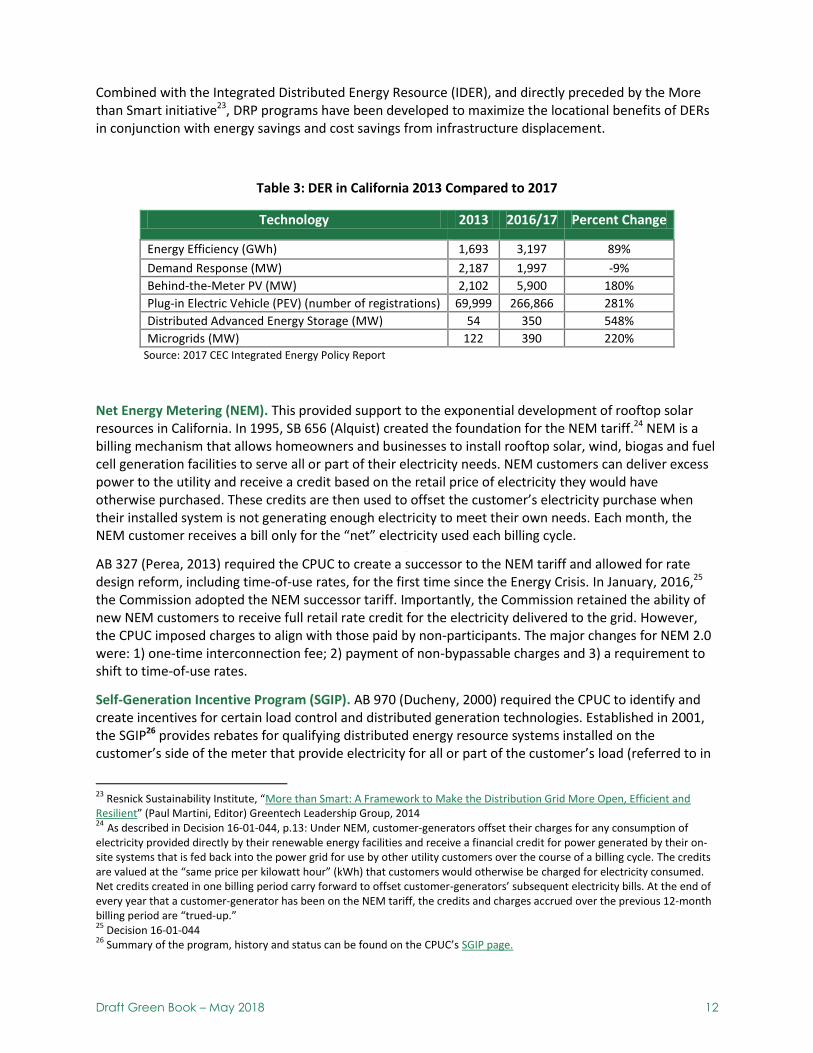
Combined with the Integrated Distributed Energy Resource (IDER), and directly preceded by the More than Smart initiative23, DRP programs have been developed to maximize the locational benefits of DERs in conjunction with energy savings and cost savings from infrastructure displacement.
Table 3: DER in California 2013 Compared to 2017
Technology 2013 2016/17 Percent Change
Energy Efficiency (GWh) 1,693 3,197 89%
Demand Response (MW) 2,187 1,997 -9%
Behind-the-Meter PV (MW) 2,102 5,900 180%
Plug-in Electric Vehicle (PEV) (number of registrations) 69,999 266,866 281%
Distributed Advanced Energy Storage (MW) 54 350 548%
Microgrids (MW) 122 390 220% Source: 2017 CEC Integrated Energy Policy Report
Net Energy Metering (NEM). This provided support to the exponential development of rooftop solar resources in California. In 1995, SB 656 (Alquist) created the foundation for the NEM tariff.24 NEM is a billing mechanism that allows homeowners and businesses to install rooftop solar, wind, biogas and fuel cell generation facilities to serve all or part of their electricity needs. NEM customers can deliver excess power to the utility and receive a credit based on the retail price of electricity they would have otherwise purchased. These credits are then used to offset the customer’s electricity purchase when their installed system is not generating enough electricity to meet their own needs. Each month, the NEM customer receives a bill only for the “net” electricity used each billing cycle.
AB 327 (Perea, 2013) required the CPUC to create a successor to the NEM tariff and allowed for rate design reform, including time-of-use rates, for the first time since the Energy Crisis. In January, 2016,25 the Commission adopted the NEM successor tariff. Importantly, the Commission retained the ability of new NEM customers to receive full retail rate credit for the electricity delivered to the grid. However, the CPUC imposed charges to align with those paid by non-participants. The major changes for NEM 2.0 were: 1) one-time interconnection fee; 2) payment of non-bypassable charges and 3) a requirement to shift to time-of-use rates.
Self-Generation Incentive Program (SGIP). AB 970 (Ducheny, 2000) required the CPUC to identify and create incentives for certain load control and distributed generation technologies. Established in 2001, the SGIP26 provides rebates for qualifying distributed energy resource systems installed on the customer’s side of the meter that provide electricity for all or part of the customer’s load (referred to in
23
Resnick Sustainability Institute, “More than Smart: A Framework to Make the Distribution Grid More Open, Efficient and Resilient” (Paul Martini, Editor) Greentech Leadership Group, 2014 24 As described in Decision 16-01-044, p.13: Under NEM, customer-generators offset their charges for any consumption of electricity provided directly by their renewable energy facilities and receive a financial credit for power generated by their on-site systems that is fed back into the power grid for use by other utility customers over the course of a billing cycle. The credits are valued at the “same price per kilowatt hour” (kWh) that customers would otherwise be charged for electricity consumed. Net credits created in one billing period carry forward to offset customer-generators’ subsequent electricity bills. At the end of every year that a customer-generator has been on the NEM tariff, the credits and charges accrued over the previous 12-month billing period are “trued-up.” 25
Decision 16-01-044 26
Summary of the program, history and status can be found on the CPUC’s SGIP page.
Draft Green Book – May 2018 13
this paper as behind-the-meter or BTM). Qualifying technologies can be existing or new and emerging facilities that are wind, waste heat to power, small gas turbines, fuel cells and storage systems.27 Projects installed on the utility side of the meter were ineligible.
IOUs administer the SGIP program and funding is collected through a non-bypassable charge allocated to all IOU ratepayers, similar to the public goods charge and included in the distribution system revenue requirements.
SGIP serves as the cornerstone of distributed technology advancement. The program eliminated solar PV in 2007 as the California Solar Initiative started but added storage28 and other eligible technologies that reduce GHG emissions.29 Storage is the primary technology utilizing SGIP today. By the end of 2016, there were 716 BTM storage projects installed for all IOU customers representing approximately 49 MW with most projects in the non-residential sector.30
Storage. AB 2514 (Skinner, 2010) required the CPUC to set storage procurement targets for all LSEs to optimize grid operations, facilitate the integration of renewable resources, and support GHG reduction to achieve the state’s decarbonization goals. The CPUC adopted the Energy Storage Procurement Framework in 2013 and set a storage procurement target of 1,325 MW for PG&E, SCE, and SDG&E by 2020, with installations required no later than the end of 2024. The Commission further established a target for CCAs and ESPs to procure energy storage equal to 1% of their annual peak load by 2020 with installations no later than 2024, consistent with the requirements for the IOUs.31 Additional storage capacity was authorized by AB 2868 (Gatto, 2016).
Since 2013 the CPUC has looked at storage as a viable alternative to generation in constrained areas. The Commission required SCE and SDG&E to procure storage to address reliability concerns created by the shutdown of the Aliso Canyon natural gas storage facility and has directed PG&E and SCE to consider preferred resources and storage, as a means of replacing specific natural gas plants in their service territories. The impact of storage legislation and mandates can be measured by the exponential growth in DER installations shown in Table 3 above.
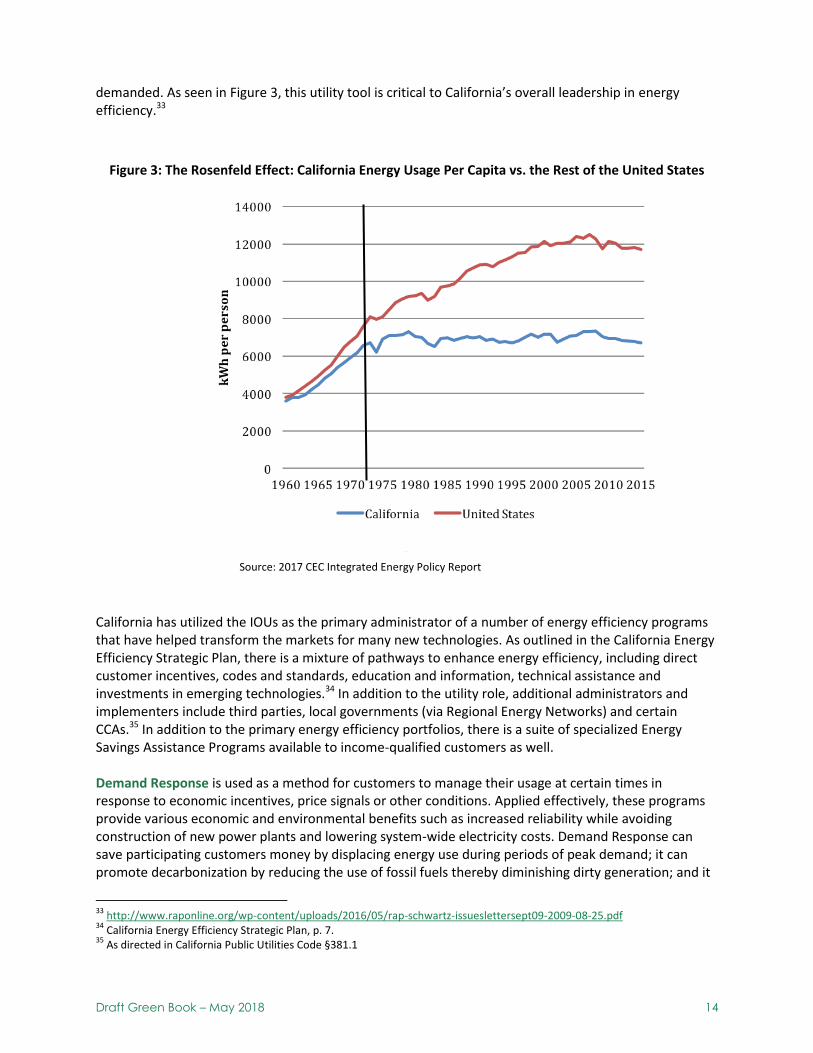
Energy Efficiency. California has a longstanding history of policies that advance energy efficiency. Individual energy use has remained relatively flat since 197532compared to the rest of the United States. Named after Art Rosenfeld, Figure 3 demonstrates the “Rosenfeld Effect” which states that cost-effective investments in energy efficiency can conserve energy resources and lower customer bills. Energy efficiency is a key strategy for achieving all of California’s primary policy objectives of affordability, decarbonization and reliability. When compared to other states, California has relatively high electricity rates but relatively moderate electricity bills. Targeted energy efficiency deployment can displace the need for new generation assets and enhance grid reliability.
In order to promote customer conservation and energy efficiency, California decoupled utility sales from revenue earned. This regulatory model allows the utility to recover its fixed costs even if less energy is
27
The Commission has created an SGIP Equity budget in Decision 17-10-004 where 25% of SGIP funds already allocated for energy storage projects will provide incentives for customer-sited energy storage projects in disadvantaged and lo-income communities in California. 28
Decision 08-040-049 29
Decision 11-09-015 30
Itron and e3, 2016 SGIP Advanced Energy Storage Evaluation 31
CPUC D.10-03-040. Decision Adopting Energy Storage Procurement Framework and Design Program 32
1975 is when the legislature adopted the Warren-Alquist Act and also created the California Energy Commission. Its mission is to reduce energy costs and environmental impacts of energy use- such as GHG emissions-while ensuring a safe, resilient and reliable supply of energy. It has statewide responsibility for adopting building and appliance standards and power plant siting among its planning and policy responsibilities.
Draft Green Book – May 2018 14
demanded. As seen in Figure 3, this utility tool is critical to California’s overall leadership in energy efficiency.33
Figure 3: The Rosenfeld Effect: California Energy Usage Per Capita vs. the Rest of the United States
Source: 2017 CEC Integrated Energy Policy Report
California has utilized the IOUs as the primary administrator of a number of energy efficiency programs that have helped transform the markets for many new technologies. As outlined in the California Energy Efficiency Strategic Plan, there is a mixture of pathways to enhance energy efficiency, including direct customer incentives, codes and standards, education and information, technical assistance and investments in emerging technologies.34 In addition to the utility role, additional administrators and implementers include third parties, local governments (via Regional Energy Networks) and certain CCAs.35 In addition to the primary energy efficiency portfolios, there is a suite of specialized Energy Savings Assistance Programs available to income-qualified customers as well. Demand Response is used as a method for customers to manage their usage at certain times in response to economic incentives, price signals or other conditions. Applied effectively, these programs provide various economic and environmental benefits such as increased reliability while avoiding construction of new power plants and lowering system-wide electricity costs. Demand Response can save participating customers money by displacing energy use during periods of peak demand; it can promote decarbonization by reducing the use of fossil fuels thereby diminishing dirty generation; and it
33
http://www.raponline.org/wp-content/uploads/2016/05/rap-schwartz-issueslettersept09-2009-08-25.pdf 34
California Energy Efficiency Strategic Plan, p. 7. 35
As directed in California Public Utilities Code §381.1

Draft Green Book – May 2018 15
can enhance reliability because customers can shift their load when there is a system need, e.g. over-generation of renewable assets. A demand response program contains some form of incentive for the customer to reduce his or her electricity consumption during certain hours, called “events.” During these events customers are asked, or are remotely signaled, to reduce their electricity consumption for reasons such as high energy prices and/or when system reliability is threatened. Customers are beginning to leverage BTM energy storage systems to help them participate in demand response; this is likely to become more common over time.
Electrification of the Transportation Sector Transportation electrification helps California meet its decarbonization and air quality goals by replacing carbon-emitting cars and integrating generation from renewable resources through electric vehicles (EV). Transportation electrification is crucial, since transportation emissions make up 39% of statewide GHG emissions and 44% of statewide CO2 emissions.36 The Commission collaborates with the California Air Resources Board and the CEC to implement SB 350 (deLeon, 2015). This bill includes a provision to accelerate widespread transportation electrification. The CPUC’s activities to support transportation electrification are broadly categorized by: charging infrastructure deployment, rates, vehicle-grid integration37, and rebates and incentives.38 The CPUC supports EV deployment through IOUs’ demonstration pilots to deploy electric vehicle charging infrastructure throughout the state, test time-of-use pricing, and assess programs and technologies that enable EVs to provide grid resources. Time-of-use rates encourage customers to charge during off-peak hours to minimize bills. This helps reduce energy demand on the electric grid during peak periods. In January 2018, Governor Brown set a goal of having five million zero-emission vehicles by 2030 and 250,000 zero-emission vehicle charging stations by 2025.39 To date, about half of all U.S. electric vehicles are purchased in California. There are more than 380,000 electric vehicles40 and 14,000 light-duty electric vehicle charging stations publicly-available throughout the state.41 The IOUs are currently implementing pilot programs to install additional infrastructure to support electric vehicle charging at multi-unit dwellings, workplaces, and public destinations. These pilots will install the infrastructure to support up to 12,500 charging stations with total budgets up to $197 million. In January 2018, the Commission further approved 15 IOU pilots in this area for $42.8 million.42 There are ongoing Commission proceedings for transportation electrification projects pursuant to SB 350.
36
“California Greenhouse Gas Emission Inventory - 2017 Edition,” California Air Resources Board, June 2017, https://www.arb.ca.gov/cc/inventory/data/data.htm 37
Refers to the concept of using EVs to provide grid services, such as storage. In order to do this, two-way interaction between vehicles and the grid must be in place. 38
CPUC. California Smart Grid: Annual Report to the Governor and Legislature. February 2018, 15. 39
Executive Order B-48-18 40
“Sales Dashboard,” VELOZ, April 5, 2018, http://www.veloz.org/sales-dashboard/. 41
“Zero-Emission Vehicles,” Infrastructure, California Public Utilities Commission, http://www.cpuc.ca.gov/zev/. 42
A.17-01-020, et al.
Draft Green Book – May 2018 16
Guaranteeing Grid Reliability
Resource Adequacy
In the aftermath of the Energy Crisis, California policy makers wanted to ensure that there would never again be a shortage of energy to meet demand. AB 380 (Nunez, 2005) required the CPUC to establish the Resource Adequacy (RA) program for all LSEs, in consultation with the California Independent System Operator (CAISO), to maintain an adequate level of reserves. Under the program, all LSEs (IOUs, ESPs and CCAs) must commit their own generators – or contract with generators owned by other entities – to meet reserve requirements set by the CPUC. The CPUC adopted the current RA framework in a series of decisions over the past 14 years (D. 04-10-035, D. 05-10-042, D. 06-06-064, and D.14-06-050). The RA program currently requires all LSE’s to procure set amounts of capacity to help support the state’s system needs, local area needs and flexible needs to ingrate renewable resources and show that they have adequate resources under contract both a year ahead and a month ahead of the forecasted demand. 43 To meet RA obligations, LSEs must show that they have procured most of their capacity well before the compliance year. In October, LSEs must show 90% of their system RA obligation for the following year’s summer months, May through September, in addition to 100% of their local RA and 90% of flexible RA requirements for each month in the following year. During the compliance year, LSEs must show they have met 100% of their system and flexible RA obligation a month ahead of time. Over the last 10 years, the RA program has maintained adequate reserves to meet peak demand and ensure a reliable grid. The program relies on sufficient and predictable supply, all LSEs’ ability to plan for and purchase capacity for their customers, and contracts between generators and LSEs. Today, significant structural changes are challenging the program’s ability to meet adequate reserve margins under the current market and program design. These changes include increasing intermittent renewable resources, the upcoming retirement of natural gas power plants due to once through cooling requirements and lack of revenue, and the rapid expansion of CCAs resulting in customer migration. These changes create uncertainties for market participants, such as IOUs who must procure capacity for an unknown amount of load and generators who must sell capacity to new market entrants. The Commission is actively addressing whether multi-year reliability is required.
Long-Term Procurement After the Energy Crisis, AB 57 (Wright 2001) changed the planning and cost recovery paradigm for the IOUs procurement of new generation facilities from an after-the-fact review process to an upfront process. This new process was designed to remove the risk of after-the-fact prudence review which may have created reluctance for IOUs to support construction of new generation in California. The process was developed to ensure that IOU procurement plans meet load requirements with safe and reliable capacity that complies with state energy policies at the least cost to ratepayers. Today, procurement plans must account for the state’s decarbonization requirements through increasing renewables, distributed generation from preferred resources and storage, such as fuel cells or energy efficiency and demand response. For long-term planning to date, the CPUC has looked at the 10-year forecast for
43
System requirements are determined based on each LSEs’ CEC adjusted forecast plus a 15% planning reserve margin.
Draft Green Book – May 2018 17
system, local and flexible needs. The assumptions have been developed in conjunction with the CEC and CAISO and address transmission limitations and system flexibility needs such as resources required for reliability to incorporate renewables and to provide sufficient generation during high ramping periods such as when the sun sets and demand increases.44 Today, long-term procurement considers all resources to meet the capacity requirements with carbon free resources preferred and fossil fuel resources as the lowest priority. Presently, the IOUs own hydroelectric, nuclear and limited fossil generating facilities. Almost all the thermal and renewable generation is built, developed and operated by third-party generators. These generating assets are procured by the IOUs with a power purchase agreement via a competitive solicitation process. The long-term procurement planning process is used to indicate resource needs in advance and acts as a signal to the investment community to develop plans for efficient and clean generation to be built in California.
Integrated Resource Plan SB 350 (deLeon, 2015) requires the CPUC to establish a process for integrated resource planning (IRP) that will ensure LSEs meet targets that allow the electricity sector to contribute to California’s goal of reducing economy-wide GHG emissions 40% from 1990 levels by 2030. In the ongoing proceeding R.16-02-007, the Commission has defined how all LSEs should create long-term procurement plans to meet reliability and GHG reduction goals at least cost.
44
The famous California Duck Curve was the impetus for this analysis.
Draft Green Book – May 2018 18
Electricity Business Models: Beyond IOUs
Californians can get their electricity needs met through many options. The business models range from the traditional utility model to the aggregators for retail service to installing their own generation or utilizing ways to reduce usage.
Load Serving Entities: Any retail provider of electricity
Investor-Owned Utilities (IOUs) provide transmission and distribution services to all electric customers in their service territory and for all other providers and behind-the meter customers. For the customers who also receive generation service from the utility, the customer is deemed to be “bundled.” If the customer does not receive electric generation service from the utility but from an alternate provider, the customer is “unbundled.” The IOUs serve approximately 84% of the statewide electricity load.
Electric Service Provider (ESP) or Direct Access, as defined in Public Utilities Code §394, is a non-utility entity that markets electric service directly to customers. “Direct Access” providers can offer service to anyone within the service territory of an electric utility. Following the Energy Crisis, the amount of customer load service by ESPs is capped by law. Today, many businesses seek direct access customer status to procure cost-effective utility scale renewables directly from the source to meet corporate sustainability goals rather than purchasing utility bundled power.
A Community Choice Aggregator (CCA), as defined in Public Utilities Code §331.1(a), is any city, county, or combination who have elected to join together to buy electricity on behalf of its residents, businesses, and municipal facilities. Governance is through a Joint Powers Authority creating a new public agency to operate on behalf of its member municipalities or a single jurisdiction. Certification of certain functions and compliance requirements remain with the CPUC. However, the CCA can establish its own rates, programs and procurement protocols. Unlike a municipal utility, delivery of the electricity over the transmission and distribution system and the billing services remain with the incumbent IOU (see sample bill comparison below. Certain fixed charges, including grid operations that are established for the IOUs must be paid by the CCA customer. CCAs are growing rapidly and service about 12% of statewide electricity needs.
A Publicly Owned Utility or a municipal utility is controlled by a citizen-elected governing board and utilizes public financing. These municipal utilities own generation, transmission and distribution assets, perform billing and are owned and controlled by the utility and financed through public dollars. In contrast to the CCAs, all utility functions are handled by these utilities. Examples include the Los Angeles Department of Water & Power and Sacramento Municipal Utility District. Municipal utilities serve about 16% of California’s total electricity requirements.
Behind-the-meter (BTM): Customer option to reduce consumption and carbon emissions
BTM customers choose the type of resources and controls that either produce or reduce their electricity consumption. Distributed Energy Resources (DER) include customer-owned renewable generation, such as rooftop solar, energy storage, demand response that provides customer incentives to shift electricity use when it has the highest value to the grid and energy efficiency which are strategies to reduce energy use, including efficient light, HVAC controls, appliances and building standards. Electric vehicles have an increasingly important role as a BTM resource with the electrification of the grid to reduce the use of fossil fuels in the transportation sector. Both business and residential customers have incentive programs. Behind the meter resources and programs rely on the IOU transmission and distribution system for delivery of power and back-up. Public Goods Charges imposed by legislation and financed through IOU rates have provided the financing for DER incentives and growth.
Off the grid: pull the plug
Micro-grids were until recently viewed as the future by some. A community of work and living spaces would form with distributed, local generation providing all the energy needs without the necessity for any interconnection to the grid. Today, micro-grids are developing on corporate campuses with the emergence of vibrant BTM market and the availability of low-cost utility scale renewables. However, these micro-grids remain connected to the utility distribution network
Draft Green Book – May 2018 19
Current Shifts Are Rapidly Reshaping California’s Electricity Markets
California has been able to meet its Core Principles and offer a platform for innovation and investment as part of its overall policy objectives. Quantifiable emissions reductions have been achieved. Reliability has been maintained. Customer bills have remained affordable. However, in 2018, some of the same drivers from the mid-1990s that led to restructuring are reappearing. These underlying shifts may fracture the current policy structure in the absence of a thoughtful and meaningful plan. New challenges have emerged that prompt a reexamination of the role of the IOUs, customer choices and the evolution of the grid to ensure California’s affordability, decarbonization and reliability goals.
Role of IOUs A significant challenge for California as customer choice expands is addressing the evolving role of the investor-owned utilities. Even with demands for more competition, the IOUs are presumed to be the default providers of last resort, are expected to administer most of the public purpose programs, and are often pressured to procure resources that no other provider wants to buy.45 If the state continues the traditional cost-of-service model for the IOUs under current market conditions, it is possible that as the IOUs make more investments to help achieve California’s policy goals they will collect less revenue for these roles as customers shift to other options for electricity.46
Provider of Last Resort. IOUs and publicly-owned utilities have historically been the default providers of electric service under the Public Utilities Code’s obligation to serve. When the electric industry restructuring occurred in the late 1990s, the obligation to serve remained unchanged. During the Energy Crisis, the IOUs were the default providers of last resort. Direct Access customers could return to utility bundled service at any time without notice and without cost.47 As customer load becomes increasingly disaggregated, designated entities must be ready to provide electricity as a last resort if the market does not meet customer demand. These entities must have the administrative capacity and financial standing to absorb an uncertain number of customers and uncertain electric load. Current law does not define a provider or supplier of last resort for the energy sector.48 Utility Creditworthiness. The CPUC implements decarbonization and environmental policies through IOU programs. These programs have taken the form of DER procurement, electric vehicles, energy efficiency, rooftop solar, storage mandates and other mechanisms. The current utility financing model for these investments may destabilize as there are fewer customers to absorb costs.
Grid Investment and Reliability. The IOUs are also responsible for grid safety and resilience, during normal operations and catastrophic events. As operators of the transmission and distribution grid, the IOUs will retain this obligation and liability. With greater choices (CCAS, NEM, Direct Access, and rooftop solar) and disaggregation of supply, current safety controls and protocols become more difficult to fund and to coordinate in times of crisis.
45
Kristin Ralff-Douglas, Electric Utility Business and Regulatory Models, CPUC Policy & Planning Division (June 2015) p.4 46
Ibid. p. 8 47
Peter W. Hanschen and Gordon P. Erspamer, “A Public Utility’s Obligation to Serve: Saber or Double-Edged Sword?” The Electricity Journal 17, no. 10 (2004): 37. 48
California Public Utilities Code §625 refers to Provider of Last Resort in the context of eminent domain, but it is undefined in the statute.
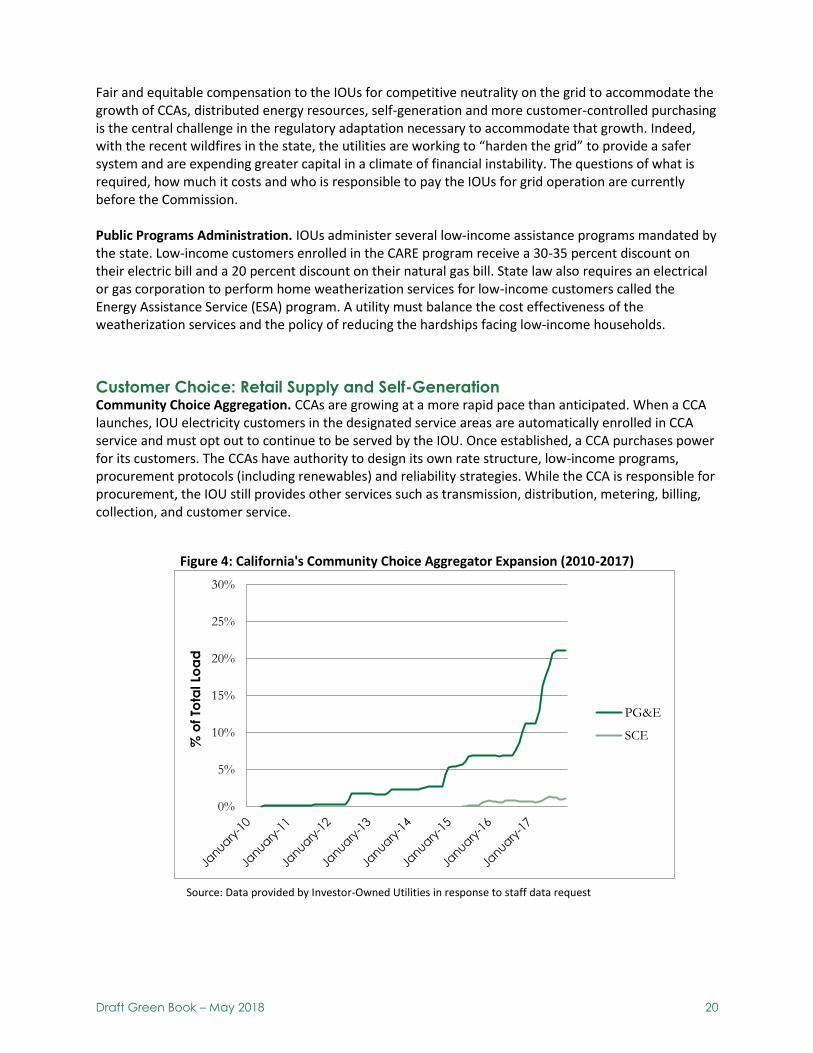
Draft Green Book – May 2018 20
0%
5%
10%
15%
20%
25%
30%
% o
f To
tal Lo
ad
PG&E
SCE
Fair and equitable compensation to the IOUs for competitive neutrality on the grid to accommodate the growth of CCAs, distributed energy resources, self-generation and more customer-controlled purchasing is the central challenge in the regulatory adaptation necessary to accommodate that growth. Indeed, with the recent wildfires in the state, the utilities are working to “harden the grid” to provide a safer system and are expending greater capital in a climate of financial instability. The questions of what is required, how much it costs and who is responsible to pay the IOUs for grid operation are currently before the Commission. Public Programs Administration. IOUs administer several low-income assistance programs mandated by the state. Low-income customers enrolled in the CARE program receive a 30-35 percent discount on their electric bill and a 20 percent discount on their natural gas bill. State law also requires an electrical or gas corporation to perform home weatherization services for low-income customers called the Energy Assistance Service (ESA) program. A utility must balance the cost effectiveness of the weatherization services and the policy of reducing the hardships facing low-income households.
Customer Choice: Retail Supply and Self-Generation Community Choice Aggregation. CCAs are growing at a more rapid pace than anticipated. When a CCA launches, IOU electricity customers in the designated service areas are automatically enrolled in CCA service and must opt out to continue to be served by the IOU. Once established, a CCA purchases power for its customers. The CCAs have authority to design its own rate structure, low-income programs, procurement protocols (including renewables) and reliability strategies. While the CCA is responsible for procurement, the IOU still provides other services such as transmission, distribution, metering, billing, collection, and customer service.
Figure 4: California's Community Choice Aggregator Expansion (2010-2017)
Source: Data provided by Investor-Owned Utilities in response to staff data request
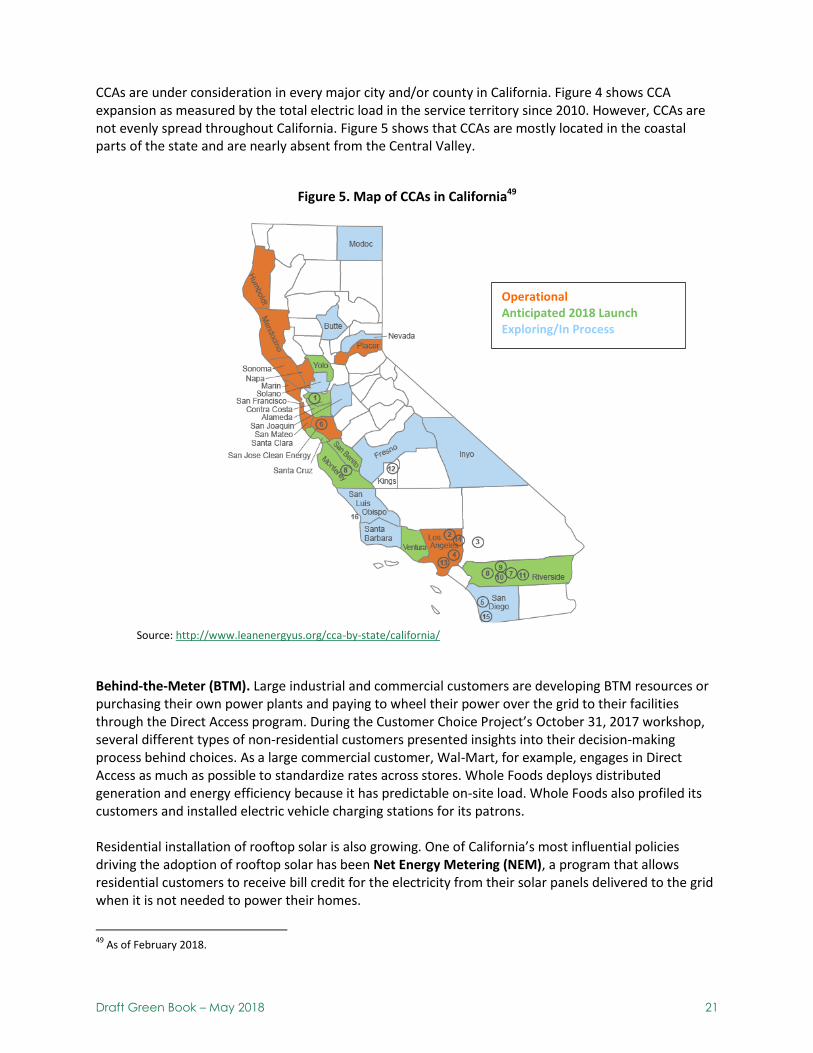
Draft Green Book – May 2018 21
CCAs are under consideration in every major city and/or county in California. Figure 4 shows CCA expansion as measured by the total electric load in the service territory since 2010. However, CCAs are not evenly spread throughout California. Figure 5 shows that CCAs are mostly located in the coastal parts of the state and are nearly absent from the Central Valley.
Figure 5. Map of CCAs in California49
Behind-the-Meter (BTM). Large industrial and commercial customers are developing BTM resources or purchasing their own power plants and paying to wheel their power over the grid to their facilities through the Direct Access program. During the Customer Choice Project’s October 31, 2017 workshop, several different types of non-residential customers presented insights into their decision-making process behind choices. As a large commercial customer, Wal-Mart, for example, engages in Direct Access as much as possible to standardize rates across stores. Whole Foods deploys distributed generation and energy efficiency because it has predictable on-site load. Whole Foods also profiled its customers and installed electric vehicle charging stations for its patrons. Residential installation of rooftop solar is also growing. One of California’s most influential policies driving the adoption of rooftop solar has been Net Energy Metering (NEM), a program that allows residential customers to receive bill credit for the electricity from their solar panels delivered to the grid when it is not needed to power their homes.
49
As of February 2018.
Operational Anticipated 2018 Launch Exploring/In Process
Source: http://www.leanenergyus.org/cca-by-state/california/

Draft Green Book – May 2018 22
As solar adoption and investment have increased throughout the state, low-income and disadvantaged communities (DACs) have lagged behind. Structural barriers include insufficient access to capital, low home ownership rates and remote localities.
Reliability The CPUC, CEC and CAISO coordinate and implement resource adequacy and procurement protocols to provide long-term incentives for market participants to invest in generation to meet system and local requirements. California policy has shifted to place top priority on carbon-free, such as utility scale renewables, all-source procurements and transmission solutions as the best way to meet demand growth. The IRP discussed above is exploring the optimal blend of resources Importantly, California may experience generation shortages if the expected preferred resources do not deliver on schedule or the resource adequacy measures do not account for unanticipated fluctuations in load. Current and pending retirements of once-through-cooling gas-fired generation impact the fleet. Additional, modern combined cycle plants are closing due to lack of a market mechanism that allows continued operation. Flexible, fast-ramping natural gas units can bridge this reliability gap during the technology transition, but proposals for this type of new natural gas facilities have met strong opposition and either been suspended or withdrawn.
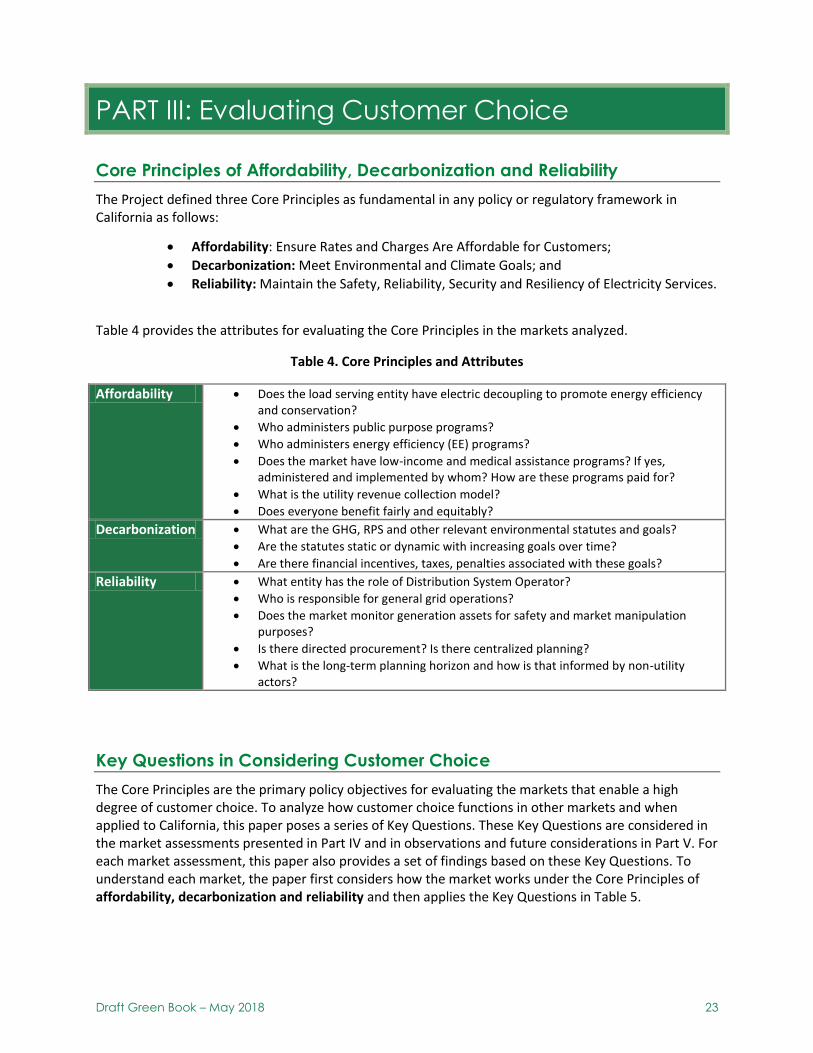
Draft Green Book – May 2018 23
PART III: Evaluating Customer Choice
Core Principles of Affordability, Decarbonization and Reliability
The Project defined three Core Principles as fundamental in any policy or regulatory framework in California as follows:
Affordability: Ensure Rates and Charges Are Affordable for Customers;
Decarbonization: Meet Environmental and Climate Goals; and
Reliability: Maintain the Safety, Reliability, Security and Resiliency of Electricity Services.
Table 4 provides the attributes for evaluating the Core Principles in the markets analyzed.
Table 4. Core Principles and Attributes
Affordability Does the load serving entity have electric decoupling to promote energy efficiency and conservation?
Who administers public purpose programs?
Who administers energy efficiency (EE) programs?
Does the market have low-income and medical assistance programs? If yes, administered and implemented by whom? How are these programs paid for?
What is the utility revenue collection model?
Does everyone benefit fairly and equitably?
Decarbonization What are the GHG, RPS and other relevant environmental statutes and goals?
Are the statutes static or dynamic with increasing goals over time?
Are there financial incentives, taxes, penalties associated with these goals?
Reliability What entity has the role of Distribution System Operator?
Who is responsible for general grid operations?
Does the market monitor generation assets for safety and market manipulation purposes?
Is there directed procurement? Is there centralized planning?
What is the long-term planning horizon and how is that informed by non-utility actors?
Key Questions in Considering Customer Choice
The Core Principles are the primary policy objectives for evaluating the markets that enable a high degree of customer choice. To analyze how customer choice functions in other markets and when applied to California, this paper poses a series of Key Questions. These Key Questions are considered in the market assessments presented in Part IV and in observations and future considerations in Part V. For each market assessment, this paper also provides a set of findings based on these Key Questions. To understand each market, the paper first considers how the market works under the Core Principles of affordability, decarbonization and reliability and then applies the Key Questions in Table 5.
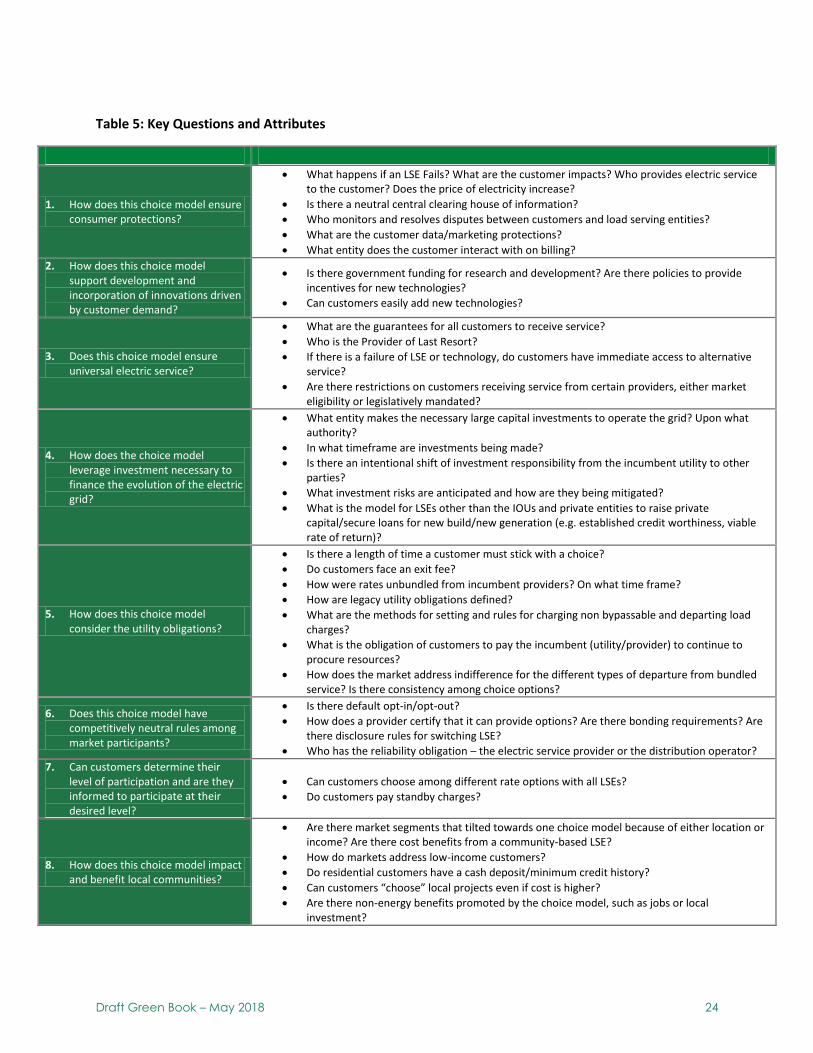
Draft Green Book – May 2018 24
Table 5: Key Questions and Attributes
1. How does this choice model ensure consumer protections?
What happens if an LSE Fails? What are the customer impacts? Who provides electric service to the customer? Does the price of electricity increase?
Is there a neutral central clearing house of information?
Who monitors and resolves disputes between customers and load serving entities?
What are the customer data/marketing protections?
What entity does the customer interact with on billing?
2. How does this choice model support development and incorporation of innovations driven by customer demand?
Is there government funding for research and development? Are there policies to provide incentives for new technologies?
Can customers easily add new technologies?
3. Does this choice model ensure universal electric service?
What are the guarantees for all customers to receive service?
Who is the Provider of Last Resort?
If there is a failure of LSE or technology, do customers have immediate access to alternative service?
Are there restrictions on customers receiving service from certain providers, either market eligibility or legislatively mandated?
4. How does the choice model leverage investment necessary to finance the evolution of the electric grid?
What entity makes the necessary large capital investments to operate the grid? Upon what authority?
In what timeframe are investments being made?
Is there an intentional shift of investment responsibility from the incumbent utility to other parties?
What investment risks are anticipated and how are they being mitigated?
What is the model for LSEs other than the IOUs and private entities to raise private capital/secure loans for new build/new generation (e.g. established credit worthiness, viable rate of return)?
5. How does this choice model consider the utility obligations?
Is there a length of time a customer must stick with a choice?
Do customers face an exit fee?
How were rates unbundled from incumbent providers? On what time frame?
How are legacy utility obligations defined?
What are the methods for setting and rules for charging non bypassable and departing load charges?
What is the obligation of customers to pay the incumbent (utility/provider) to continue to procure resources?
How does the market address indifference for the different types of departure from bundled service? Is there consistency among choice options?
6. Does this choice model have competitively neutral rules among market participants?
Is there default opt-in/opt-out?
How does a provider certify that it can provide options? Are there bonding requirements? Are there disclosure rules for switching LSE?
Who has the reliability obligation – the electric service provider or the distribution operator?
7. Can customers determine their level of participation and are they informed to participate at their desired level?
Can customers choose among different rate options with all LSEs?
Do customers pay standby charges?
8. How does this choice model impact and benefit local communities?
Are there market segments that tilted towards one choice model because of either location or income? Are there cost benefits from a community-based LSE?
How do markets address low-income customers?
Do residential customers have a cash deposit/minimum credit history?
Can customers “choose” local projects even if cost is higher?
Are there non-energy benefits promoted by the choice model, such as jobs or local investment?
Draft Green Book – May 2018 25
What is Customer Choice?
The scope of this paper focuses on choices available to electric customers in California. Choices for both individuals and businesses include a range of options in electric markets. Customers can choose the following:
Generation services: The type of generation procured by electric service provider to serve load including BTM grid assets to self-generate. Customers may obtain electric services from non-utility LSEs that provide generation capacity and services in the retail electricity market. Non-utility LSEs may be government-run CCAs that buy electricity for both residential and non-residential customers within their jurisdiction or ESPs who buy electricity for non-residential customers across the state. Electric customers may also elect to enroll in the Direct Access program where they can purchase electricity directly from an energy service provider rather than the utility as discussed above.
Rates and tariffs: A tariff is a pricing schedule or rate plan that utilities offer to customers. Some customers can choose from among an array of tariffs to suit their needs; but other times tariffs apply to customers based on their business activities or the amount of energy they consume. Along with the pricing plan, there may be certain rules for each tariff a utility offers such as the times or seasons when prices will vary, eligibility for a tariff, when/how a customer can join or leave the tariff, what type of meter must be installed and more. Examples of rate options include the ability of some customer to choose green tariff that provide that a greater portion of a customer’s demand will be meet with carbon free resources and options to move to time-of-use tariff.
Energy Services: Customer participation in energy efficiency programs that offer benefits for reducing load, shifting load, and other accommodations supporting grid reliability. This includes service like demand response. Customers can engage with their LSEs to better manage energy usage by lowering the amount required.
Poles and Wires Are Not Customer Choices For the purposes of this paper, customer choice does not include the choice of poles and wires distributing electricity. Every outcome contemplated and analyzed by this assessment relies on the basic proposition that the utilities will continue to provide the fundamental backbone services of electric delivery to customers along with ensuring the safety and reliability of that delivery. CCAs and BTM customers are interconnected to the grid for some or all of their supply. As discussed above, the role of the IOU is changing but remains essential.
Customer Profiles: Who are the customers? The utilities divide their customers into two classifications:
Residential (both single-family and multi-family residences); and
Non-Residential (further divided into): o Agricultural (electricity demands for food production including water pumping);

Draft Green Book – May 2018 26
o Commercial (small business, office buildings and non-energy intensive uses); o Industrial (includes energy-intensive applications, such as manufacturing); o Street lighting (electricity usage that promotes public safety and always on low-energy);
and o Other.
There is a wide spectrum of differences among the customers within the classifications identified above. In the context of customer choice, grouping like-minded customers may be a more useful tool to understanding the reasons behind customer participation in various options available to them. Considering customers both demographically and psychographically will yield different results. Using data analytics, energy providers can apply the information gathered to deliver timely and interactive communications and drive desired outcomes.
Customer Segmentation The IOUs and other research organizations have conducted customer segmentation studies to better understand engagement levels by residential consumers. Customer segmentation is defined as “the effort of assembling customers into distinct groups with similar characteristics, behaviors, or attitudes.” Historically, this focused on the demographics of the customer (age, race, gender). New segmentation work focuses on psychographics to understand how “lifestyle” informs decisions and actions. This approach provides richer information not only on what a customer did, but more importantly, why.50
It may be difficult to undertake a segmentation study of commercial and industrial customers. Their needs differ from one company to another. While cost may be a factor behind an energy choice, the energy expenditures of a company may have very little impact on its overall business costs.
Utilization of data analytics to understand choices and motivations is gaining momentum. So far, some studies have shown that customers make choices for the following reasons:
Cost predictability (both bills and rates);
Saving money by lowering usage;
Interest in energy technology;
Increasing reliability of electric service to meet operational needs;
Environmental benefits; and
Supporting the local community.
50
Policy and Planning Staff White Paper, Customers as Grid Participants: A Fundamentally New Role for Customers, 2013, page 8. Available Online at http://www.cpuc.ca.gov/uploadedFiles/CPUC_Public_Website/Content/About_Us/Organization/Divisions/Policy_and_Planning/PPD_Work/Pre_2013_PPD_Work/PPDCustomerRoleMay15th.pdf

Draft Green Book – May 2018 27
Figure 6: Sample SCE Bundled Customer Electricity Bill
BUNDLED CCA
CHARGE
Amount % of Total Bill
Amount % of Total Bill
Total Bill $70.03 $69.15
Delivery Charges
Transmission Charge $5.68 5.68
Distribution Charge $31.34 31.34
Nuclear Decommissioning $0.01
Conservation Incentive Adjustment -9.46 -9.46
Public Purpose Programs 5.48 5.48
New System Generation Charge 3.8 3.8
DWR Bond 2.05 2.05
Franchise Fee 0.61 0.38
Delivery Charges Subtotal $39.51 56% $39.27 57%
Generation Charges $30.52 44% $29.88 43%
Figure 7. Sample CCA Customer Electricity Bill in SCE Territory
As shown in Table 6,
delivery charges take up
more than 50% of the
total bill for both
customers. Additionally,
there is only about 1%
difference between the
generation charges.
Table 6: Side-by-Side Bill Comparison

Draft Green Book – May 2018 28
Part IV: Market Assessments
The Project investigated national and global markets to understand the range of regulatory options supporting customer choice. The market assessments provide insights into the experiences of other jurisdictions’ design and implementation of their regulatory frameworks that enable high penetration of customer choice in electricity services. Each market was analyzed on the Core Principles and Key Questions described in Part III of this paper. The Project conducted independent literature research for each market examining legislative, regulatory and academic documents. The team also consulted with market experts to understand how each jurisdiction addressed the Core Principles and Key Questions. From this research, the Project presents findings for California to consider as the state moves forward in addressing the various issues raised in this paper.
Four markets were selected for the study: New York, Illinois, Texas, and Great Britain. Each of the markets chosen for this assessment is distinguished by enabling high penetration of customer choice in varying dimensions. For example, New York’s regulatory model supports the development of local, clean energy through customer choice in DER. Illinois’ market is characterized by a large degree of community aggregators; and in both Great Britain and Texas, customers choose retail service providers, albeit with significantly different options and policy drivers. Other markets were recommended for this study through the stakeholder engagement process. The Project considered all options and decided that certain factors, such as market size, were sufficiently different from California that an in-depth analysis would yield limited benefit for our purposes.
Additional information about the markets is included in the Appendix.
Table 7: Affordability, Decarbonization and Reliability Features across Selected Market
California New York Illinois Texas Great Britain
Average Monthly Residential
Consumption
547 kWh 595 kWh 733 kwh 1,156 kWh 316.67 kWh
Average Electricity Rates
17.39 cents/kWh 17.58 cents/kWh 12.54 cents/kWh 10.99 cents/kWh 22.17 cents/kWh
Average Monthly Residential Bill
$95.20 $104.58 $91.83 $127.10 $70.01
Decarbonization Goals
2030 GHG reduction target 40% below 1990 levels, renewable electricity procurement goal 50% by 2030, doubling energy efficiency savings from electricity end uses by 2030
2030 GHG emissions reduction 40% below 1990 levels, 50% renewable energy target by 2030, and 600 trillion Btu increase in statewide energy efficiency
Renewable Portfolio Standard goal of 25% by 2025-2026 compliance year
Renewable Portfolio goal of 10,000MW by 2025 (was met in 2009), energy efficiency resource standard: reduce energy use by 0.4% of peak demand, or by the prior year’s goals, whichever is greater
2050 GHG reduction 80% below 1990 levels, 15% renewable energy target by 2020, coal phase out by 2025
Target Reserve Margins
15% 18.20% ~16% 13.75% 10.30%
Draft Green Book – May 2018 29
New York Market Profile
Brief History The New York Public Service Commission (PSC) launched deregulation of the state’s wholesale and retail markets in 1996.51 Market competition was expected to promote reliability and a cleaner environment, provide downward pressure on prices, and bring new value-added services to customers.52 The PSC directed the IOUs to divest their generation assets to new owners53, which competed in the newly created wholesale market. The IOUs retained ownership and operating responsibilities for their transmission and distribution networks and remained as the provider of last resort. They also continued to serve as LSEs - competing with the new energy service companies (ESCOs)54 in the retail market. By mid-2000s, all customers were able to choose their own suppliers, including remaining with incumbent utilities or transitioning to an ESCO. In 2003, the PSC created the Office of Retail Market Development to address gas and electricity retail issues and ensure customers were well informed to make energy choices.55 56
The transition to competitive wholesale and retail markets was marked by a few challenges. Customers saw higher prices immediately after the transition: in 2000, the average price for all customers was more than 62% higher than in 1997 and about 70% higher than the national average.57 Limited supply, high oil and gas prices, and new generation owners with incentives to recover investments quickly provided upward pressure on prices in the wholesale market. Siting challenges for new power plants, which were needed for New York’s growing economy, led to supply constraints and instability in the wholesale market that were passed down to customers.58 In the last several years, investigations into the retail market have indicated a failure to bring value-added services to consumers and meet affordability and consumer protection standards.59
During the restructuring, the New York Independent System Operator (NYISO) replaced the New York Power Pool and took over grid operations and ensuring reliability. Today, the NYISO manages wholesale energy and capacity markets.60 Utilities and ESCOs procure energy on the NYISO market. The PSC does not direct resource procurement (though it does indirectly through setting renewable energy and nuclear energy standards) and it does not have a formal integrated resource planning process. Every two years, the NYISO conducts a reliability needs assessment over a 10-year period and develops a plan to address resource needs as much as possible through market-based solutions.61
51
The PSC, rather than the state legislature, established competitive wholesale and retail energy markets, CCA formation, and regulatory authority over ESCO rates. 52
93-M-0229, Proceeding on Competitive Opportunities Order Instituting Proceeding (issued March 19, 1993). 53
In terms of generation divestiture, the utilities got a good deal. There were some stranded costs as incumbent utilities serving generation load held long-term contracts with PURPA plants. Every utility set up their own deferred accounts to address this issue; there was no one model used. 54
ESCOs are New York’s retail service providers. 55
This office no longer exists in the PSC. During a reorganization of the Department, the Office of Markets & Innovation was created advance REV goals. 56
New York State Department of Public Service. Staff Report on the State of Competitive Energy Markets: Progress To Date and Future Opportunities. 2006, 31. 57
New York State Comptroller. Electric Deregulation in New York State. 2001, 8. 58
Ibid., 2. 59
New York Public Service Commission, Case 12-M-0476, et al. Order Taking Actions to Improve the Residential and Small Non-Residential Retail Access Markets, February 2014 at 1-4. 60
New York State Department of Public Service. Staff Report on the State of Competitive Energy Markets: Progress To Date and Future Opportunities. 2006, 5. 61
New York Independent System Operator. 2016 Reliability Needs Assessment. 2016, 1-2.
Draft Green Book – May 2018 30
Current State of Affairs: Reforming the Energy Vision (REV) Emerging risks and opportunities in the New York energy sector led to fundamental conversations about the future structure of the electricity sector and the roles and responsibilities of market participants. Aging infrastructure, increased frequency of severe weather events like Superstorm Sandy, climate change, declining utility revenues, the electrification of the economy, and technological advances, were a few of the drivers behind the need for change.62
In 2015, the PSC adopted Reforming the Energy Vision (REV) - a new policy framework to reform retail markets with broad consensus.63 REV relies on customers to leverage markets and technology through private investment and responses to economic signals. REV places DER at the center of the evolution of the electric grid. REV has six goals for utilities, regulators, DER providers64 and customers:
o Enhanced customer knowledge and tools to support bill management; o Market animation and leverage customer contributions; o System wide efficiency; o Fuel and resource diversity; o System reliability and resiliency; and o Reduction of carbon emissions.65
Under REV, utilities would serve as distributed system platform providers, enabling competition among ESCOs, DER providers and other third parties. The utilities would be responsible for the reliability of the grid (planning and operations), the functions needed to enable distributed markets such as data access and transparent price signals, and for interfacing between aggregated customers and NYISO. The PSC would shift to performance-based regulation, which includes setting targets and metrics for utilities that encourage providing value for customers beyond delivering energy commodities, building new capital projects or cutting operating expenses. Non-utility providers and customers would drive the proliferation of these value-added services, innovation and clean energy deployment.66
In 2016, the PSC directed utilities to submit distribution system implementation plans for the design of their future systems with DER to improve the quality of information available to market participants. 67 These plans have become the planning vehicle for the distribution system and the interface for transmission and distribution systems. In August 2017, New York State Energy Research and Development Authority (NYSERDA)68 launched the REV Connect Portal, an online platform and forum where DER providers can connect with IOUs to launch new projects.69 Seventeen demonstration
62
New York State Department of Public Service. Reforming the Energy Vision Staff Report and Proposal. 2014, 9-10. 63
New York Public Service Commission. Case 14-M-0101. Order Adopting Regulatory Policy Framework and Implementation Plan. February 26, 2015. 64
DER providers are New York’s DER market participants 65
New York Public Service Commission. Case 14-M-0101. Order Instituting Proceeding. April 25, 2014, 4. 66
New York Public Service Commission. Case 14-M-0101. Order Adopting Regulatory Policy Framework and Implementation Plan. February 26, 2015, 12. 67
New York Public Service Commission. Case 14-M-0101. Order Adopting Distributed System Implementation Plan Guidance. April 20, 2016, 2-3. 68
NYSERDA is a New York state agency separate from the PSC. 69
“New York State Launches REV Connect Portal to Support Creation of Innovative Utility Business Models,” 2017 Announcements, NYSERDA, August 10, 2017, https://www.nyserda.ny.gov/About/Newsroom/2017-Announcements/2017-08-10-NYS-Launches-REV-Connect-Portal-to-Support-Creation-of-Innovative-Utility-Business-Models
Draft Green Book – May 2018 31
projects are in the works testing advanced marketplace platforms, virtual power plants, demand response, and storage solutions.70
There are currently several open REV proceedings including on: utility ratemaking,71 valuation of distributed energy resources,72 interconnection standards,73 community net metering,74 dynamic load management,75 and data access.
Customer Choice Most customers can enter into arrangements with ESCOs to procure their supply and they can elect tariff and payment options, as well as any additional services that may be offered.76 In some areas, customers can also choose to receive their supply through a local, distributed generation facility, such as a community solar project.
Self-generation options are also available to individuals, organizations, groups and communities who choose to install or participate in renewable energy projects. NYSERDA administers several programs through a public-private partnership (NY-Sun) to provide incentives for solar PV throughout the state.77 Net energy metering supports self-generation options for New York customers, though an implementation plan to move toward a market valuation for DER is underway.78
In April 2016, the PSC voted to allow CCA formation. To form a CCA, each municipality must enact a local law, after a public hearing, that gives itself the authority to act as an aggregator and energy broker. Then, the CCA may procure energy and energy services on behalf of its customers from an ESCO.
Customers in CCA regions are automatically enrolled in their respective program, unless they opt-out.79 CCAs are expected to lower prices for customers by having greater bargaining power with aggregated demand, driving renewable procurement, and deploying additional DER assets aligned with REV goals. CCAs must obtain PSC approval for their plans before providing service. As of March 2018, the PSC has
70
“REV Demonstration Projects,” DPS- Reforming the Energy Vision, New York State Department of Public Service, November 8, 2017, http://www3.dps.ny.gov/W/PSCWeb.nsf/All/B2D9D834B0D307C685257F3F006FF1D9 71
New York Public Service Commission. Case 14-M-0101. Order Adopting a Ratemaking and Utility Revenue Model Policy Framework. May 19, 2016. 72
New York Public Service Commission. Case 15-E-0751. Order on Net Energy Metering Transition, Phase One of Value of Distributed Energy Resources, And Related Matters. March 9, 2017. 73
New York Public Service Commission. Case 15-E-0557. Order Modifying Standardized Interconnection Requirements. March 18, 2016. 74
New York Public Service Commission. Case 15-E-0082. Proceeding on Motion of the Commission as to the Policies, Requirements and Conditions for Implementing a Community Net Metering Program. 75
New York Public Service Commission. Case 09-E-0115. Proceeding on Motion of the Commission to Consider Demand Response Initiatives. 76
An ESCO may not receive customer information without customer consent. 77
“NY-Sun,” NYSERDA, https://www.nyserda.ny.gov/All-Programs/Programs/NY-Sun 78
In March 2017, the PSC discontinued Net Energy Metering for new DER and began the transition to a Value of Distributed Energy Resources tariff through a phased approach. DER projects interconnecting to the grid after March 9 are compensated in one of two ways: 1) Phase One Net Energy Metering, where previous net energy metering rules apply with a contract limit of 20 years, or 2) Phase One Value Stack Tariff, where DER is compensated through monetary credits rather than volumetric credits. The Value Stack Tariff allows compensation for each kWh to include the value of when and where it was generated (temporal and locational value). New York Public Service Commission. Case 15-E-0751. Order on Net Energy Metering Transition, Phase One of Value of Distributed Energy Resources, And Related Matters. March 9, 2017. 79
New York Public Service Commission. Case 14-M-0224. Order Authorizing Framework For Community Choice Aggregation Opt-Out Program. April 21, 2016.
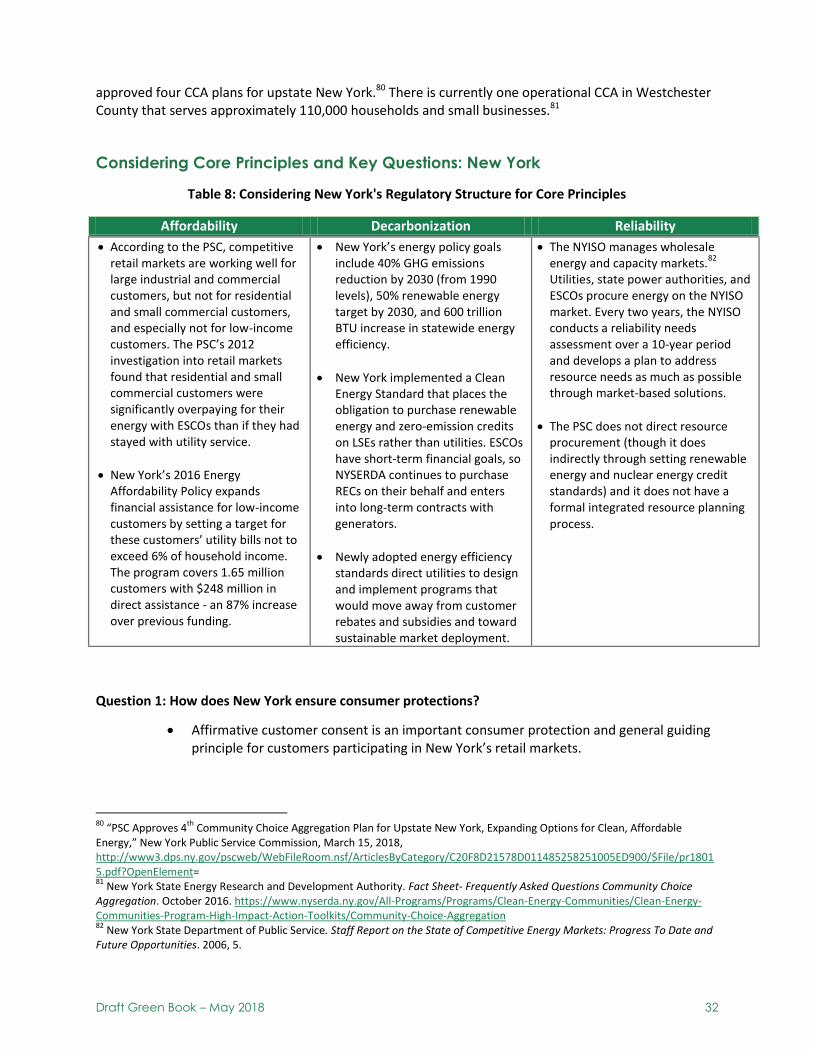
Draft Green Book – May 2018 32
approved four CCA plans for upstate New York.80 There is currently one operational CCA in Westchester County that serves approximately 110,000 households and small businesses.81
Considering Core Principles and Key Questions: New York
Table 8: Considering New York's Regulatory Structure for Core Principles
Question 1: How does New York ensure consumer protections?
Affirmative customer consent is an important consumer protection and general guiding principle for customers participating in New York’s retail markets.
80
“PSC Approves 4th
Community Choice Aggregation Plan for Upstate New York, Expanding Options for Clean, Affordable Energy,” New York Public Service Commission, March 15, 2018, http://www3.dps.ny.gov/pscweb/WebFileRoom.nsf/ArticlesByCategory/C20F8D21578D011485258251005ED900/$File/pr18015.pdf?OpenElement= 81
New York State Energy Research and Development Authority. Fact Sheet- Frequently Asked Questions Community Choice Aggregation. October 2016. https://www.nyserda.ny.gov/All-Programs/Programs/Clean-Energy-Communities/Clean-Energy-Communities-Program-High-Impact-Action-Toolkits/Community-Choice-Aggregation 82
New York State Department of Public Service. Staff Report on the State of Competitive Energy Markets: Progress To Date and Future Opportunities. 2006, 5.
Affordability Decarbonization Reliability
According to the PSC, competitive retail markets are working well for large industrial and commercial customers, but not for residential and small commercial customers, and especially not for low-income customers. The PSC’s 2012 investigation into retail markets found that residential and small commercial customers were significantly overpaying for their energy with ESCOs than if they had stayed with utility service.
New York’s 2016 Energy Affordability Policy expands financial assistance for low-income customers by setting a target for these customers’ utility bills not to exceed 6% of household income. The program covers 1.65 million customers with $248 million in direct assistance - an 87% increase over previous funding.
New York’s energy policy goals include 40% GHG emissions reduction by 2030 (from 1990 levels), 50% renewable energy target by 2030, and 600 trillion BTU increase in statewide energy efficiency.
New York implemented a Clean Energy Standard that places the obligation to purchase renewable energy and zero-emission credits on LSEs rather than utilities. ESCOs have short-term financial goals, so NYSERDA continues to purchase RECs on their behalf and enters into long-term contracts with generators.
Newly adopted energy efficiency standards direct utilities to design and implement programs that would move away from customer rebates and subsidies and toward sustainable market deployment.
The NYISO manages wholesale energy and capacity markets.
82
Utilities, state power authorities, and ESCOs procure energy on the NYISO market. Every two years, the NYISO conducts a reliability needs assessment over a 10-year period and develops a plan to address resource needs as much as possible through market-based solutions.
The PSC does not direct resource procurement (though it does indirectly through setting renewable energy and nuclear energy credit standards) and it does not have a formal integrated resource planning process.
Draft Green Book – May 2018 33
Rules governing consumer protections for energy customers serviced by utilities and ESCOs are stipulated in the Home Energy Fair Practices Act (HEFPA) and the General Business Law, as well as through PSC regulations. The PSC developed the ESCO Consumer Bill of Rights, which sets forth requirements for ESCO marketing to consumers through door-to-door sales.83
To participate in the market, an ESCO must file a retail access application package with the PSC. The application includes information on meeting electronic data, environmental disclosure and consumer protection requirements.84 Once the PSC determines ESCO eligibility, the ESCO then enters into a utility’s retail access program where it must pass certain market entry requirements, including financial creditworthiness review and billing arrangements.85
Question 2: How does New York support development and incorporation of innovations driven by customer demand?
As CCAs emerge and DER providers expand their offerings, market entrants are asking for customer data to identify potential customers, tailor products and services, or plan supply procurement.86 The PSC has adopted standards for utilities to disclose and protect aggregated customer data. Aggregated customer usage information is expected to facilitate innovative energy efficiency approaches, DER development, and community planning.87
New York supports demonstration projects between utilities and DER providers that are focused not only on technology deployment but also on developing customer engagement and new utility revenue opportunities.88
Question 3: Does New York ensure universal electric service?
New York’s Public Service Law codifies utilities’ obligation to serve, and the PSC has confirmed that the utilities’ consumer protection requirements define the utilities’ role as provider of last resort.89
If an ESCO exits the market, the utility continues to serve customers’ energy needs.90
Question 4: How does New York leverage investment necessary to finance the evolution of the electric grid?
83
“ESCO Consumers Bill of Rights,” New York Department of Public Service, October 26, 2015, http://www3.dps.ny.gov/W/PSCWeb.nsf/0/6D91ABF6159B4C148525781800571A4E 84
The PSC does not require ESCOs to demonstrate risk management expertise or to show bonds for financial viability 85
“Retail Access Application - General Information,” New York Department of Public Service, June 29, 2017, http://www3.dps.ny.gov/W/PSCWeb.nsf/All/753D3D35C877963485257687006F39DB 86
New York Public Service Commission. Case 14-M-0101. Order Adopting a Ratemaking and Utility Revenue Model Policy Framework. May 19, 2016, 147-148 87
New York Department of Public Service. Annual Report Fiscal Year 2016-2017. 2017, 10. 88
New York Public Service Commission. Case 14-M-0101. Order Adopting Regulatory Policy Framework and Implementation Plan. February 26, 2015; New York Public Service Commission. Case 14-M-0101. Order Adopting a Ratemaking and Utility Revenue Model Policy Framework. May 19, 2016. 89
New York Public Service Law § 31. 90
“Energy Choices - The Facts from the PSC,” New York Department of Public Service, May 24, 2017, http://www3.dps.ny.gov/W/PSCWeb.nsf/All/52770E53410005A185257687006F39D2?OpenDocument
Draft Green Book – May 2018 34
New York’s Clean Energy Fund provides long-term funding certainty to clean energy and innovation investments with a total commitment of $5 billion from 2016-2025. These programs support large-scale renewable build and distribution level generation projects at the individual consumer, group, and community levels. The Clean Energy Fund is currently financed by all ratepayers, with a planned declining collections structure as private market investment is expected to take over ratepayer funding.91
The Clean Energy Standard provides long-term funding certainty for renewable and zero-emissions generators.
Question 5: How does New York consider the transition of utility obligations?
REV defines the utility role as a Distribution System Platform Provider. Utilities are expected to update their technical capabilities in managing a dynamic distribution grid and to facilitate DER deployment. Under this framework, the PSC now requires utilities to submit Distribution System Implementation Plans that provide detailed information about how the utilities will plan for and manage a grid with increasing DER.
Utility revenue collections continue to be cost-of-service with added performance-based incentives. Under REV, utilities will continue to recover costs for grid investments through cost of service regulation. However, utilities are expected to gain additional revenue from platform services, and earnings tied to capital deferments and transitional outcomes-based incentives.92
Question 6: Does New York have competitively neutral rules among market participants?
New York requires utilities and ESCOs to comply with Uniform Business Practices and the Home Energy Fair Practices Act. These rules govern the interactions between utilities, ESCOs, and customers ensuring a level playing field for suppliers and consumer protections for those they serve.93 In December 2017, the PSC adopted aspects of the Uniform Business Practices to DER oversight to clarify roles and responsibilities between DER providers and customers, as well as DER providers and utilities.94
Affirmative customer choice applies to ESCOs, but not to CCAs. Customers in CCA regions are automatically enrolled in their respective program unless they opt-out.95
Question 7: Can customers determine their level of participation and are they informed to participate at their desired level?
Most customers can enter into arrangements with ESCOs to procure their supply and they can elect tariff and payment options, as well as any additional services that may be
91
New York State Energy Research and Development Authority. Reforming the Energy Vision Clean Energy Fund Frequently Asked Questions. January 2016. https://www.nyserda.ny.gov/About/Clean-Energy-Fund 92
New York Public Service Commission. Case 14-M-0101. Order Adopting a Ratemaking and Utility Revenue Model Policy Framework. May 19, 2016. 93
New York Public Service Commission. Case 98-M-1343. In the Matter of Retail Access Business Rules, Order Adopting Uniform Business Practices and Requiring Tariff Amendments. January 22, 1999. 94
New York Public Service Commission. Case 15-M-0180. Order Establishing Oversight Framework and Uniform Business Practices for Distributed Energy Resource Suppliers. October 2017, 5-7 and 49. 95
New York Public Service Commission. Case 14-M-0224. Order Authorizing Framework for Community Choice Aggregation Opt-Out Program. April 21, 2016.

Draft Green Book – May 2018 35
MISO is a regional transmission
organization (RTO). Similar to the CAISO,
MISO provides an independent platform
for efficient regional energy markets.
RTOs coordinates, controls and monitors
a multi-state electric transmission
system.
offered.96 In some areas, customers can also choose to receive their supply through a local, distributed generation facility, such as a community solar project.
One new dimension of customer choice in New York is community choice aggregation (CCA). New York CCAs procure energy and energy services on behalf of its customers from an ESCO. 97
For customers that generate most of their power, standby tariffs include a combination of customer, fixed and variable demand charges.98
Question 8: How does the New York model impact and benefit local communities?
REV has numerous goals, including: creating new jobs and business opportunities, supporting cleaner transportation, improving resiliency, and protecting New York’s natural resources.99 REV’s focus on local, clean energy supports community choice.
Illinois Market Profile
Brief History In December 1997, Illinois enacted the Electric Service Customer Choice and Rate Relief Law, which deregulated the wholesale and retail electricity markets. Illinois first deregulated its wholesale operations, and then transitioned to deregulating its retail market shortly thereafter. As part of the restructuring, Illinois joined the Midcontinent Independent System Operator (MISO) when it was established in 1998.
Prior to restructuring, the customers in Illinois’ electricity market were primarily served by two incumbent utilities: Ameren Illinois and Commonwealth Edison. These two utilities still are the primary distribution operator. A large number of residential customers have remained with the two incumbent utilities as their energy service providers.
The Illinois Commerce Commission (ICC) regulates the incumbent utilities as well as the retail energy suppliers. Each retail supplier must be certified by the ICC before it can
serve customers. Presently, more than 70% of the electric usage in Illinois comes from retail electric suppliers, which includes electric load served by a Municipal Energy Aggregator (MEA) brokering power on behalf of a jurisdiction. Currently, there are 71 retail energy suppliers serving residential customers and 86 suppliers serving non-residential electric customers. Retail energy suppliers are what Illinois terms retail service provider100. The retail energy suppliers are an opt-in; there was no forced migration away from the incumbent utility.
96
An ESCO may not receive customer information without customer consent. 97
98
99
“Reforming the Energy Vision,” New York Department of Public Service, August 10, 2017, http://www3.dps.ny.gov/W/PSCWeb.nsf/All/CC4F2EFA3A23551585257DEA007DCFE2 100
Alternate energy retail suppliers must report to the Illinois Commerce Commission on a number of points, including certification requirements, compliance with the renewable portfolio standard, bonding requirements, call center response time, etc. Full information available online at https://www.icc.illinois.gov/Electricity/authorities/ARES.aspx
Draft Green Book – May 2018 36
Illinois requires the incumbent utilities to offer a baseline electric retail rate, also known as a “price to beat.” This rate is available to the public and is the target price for retail energy providers to “beat” to compete for customers. When it was introduced, the ICC maintained the price to beat for a longer period than normal to give time for the new retail energy providers to enter the market. Since the incumbent utilities also still serve load, they remain as the provider of last resort for their service territory. To maintain price and planning stability, a customer must remain with his or her elected energy provider for at least 12 months. If the customer chooses to go back to the utility, the customer must remain with the utility for 12 months before electing a new retail energy provider.
Monitoring of the retail electric market is a core aspect of the state’s deregulation activities. The Illinois General Assembly created the Office of Retail Market Development (ORMD) within the ICC to monitor and further the state’s goal to develop an effective retail electric market. ORMD is statutorily required to submit an annual report to the ICC, the General Assembly, and the Governor on specific accomplishments achieved in promoting retail competition and make recommendations for further improvements in the market, including administrative and legislative actions. Additionally, the ORMD publicly lists all consumer complaints and resolution status for customers. This information acts as a scorecard for each retail energy supplier, which assists customers in comparing information about a retail energy supplier before enrollment.
Created in 2007, the Illinois Power Agency (IPA) coordinates the planning and procurement for the state’s electricity market. IPA develops electricity procurement plans to ensure adequate, reliable, affordable, efficient and environmentally sustainable electric service at the lowest rate over time. IPA ensures that electricity can be provided at cost to MEAs, municipal electric systems, or rural electric cooperatives.
As part of its centralized planning efforts, IPA also implements the state’s renewable portfolio standard (the current standard was set at 10% by 2015 and 25% by 2025).101 The RPS has certain technology minimums for each energy service supplier. The technology carve-out prefers wind and solar (75% of the RPS must be a combination of wind and photovoltaic solar for the IOUs, 60% for retail suppliers). As part of the law, by 2016 at least 1% of the generation must be distributed generation. The General Assembly authorized a $30 million Renewable Energy Resources Fund to supplement procurement of photovoltaics. Illinois also provides state production tax credits and other incentives that support renewable procurement. IPA also implements net energy metering, rebates for smart inverters, and has a modest target for new distributed generation assets.
Current State of Affairs: Municipal Energy Aggregators Illinois has its own version of community choice aggregation, under the label of Municipal Energy Aggregators. The MEAs will select a retail energy supplier as its municipality’s primary energy service provider. Similar to the CCAs in California, MEAs are a “default” option for all customers in its jurisdiction, and individual customers must “opt out” if they wish for an alternative electric service provider. Of the 5 million residential customers in Illinois, approximately 1.8 million customers are currently served by MEAs. The retail energy providers that serve MEA customers utilize the state for its centralized planning and procurement.
ICC sponsors a centralized website for all retail energy suppliers, including MEA customers, as a resource. This website, http://www.pluginillinois.org, in an easy to compare manner, contains the price to
101
The RPS was lasted updated in June 2017 through the Public Act 99-0906 via Senate Bill 2814, the Future Energy and Jobs Act.
Draft Green Book – May 2018 37
beat, a directory of offerings, and providers. The website also lists when the municipality executed its contract, the current provider, the current price, and the term of the contract length. It also notably lists whether the MEA municipality has renewed its contract or let it lapse. At first, the differential in the price to beat and was substantial and several municipalities formed an MEA to take advantage of these cost savings. Over time, however, the price differential became marginal and several MEAs elected to cease offering services because it was no longer beneficial to the community. Examples include the city of Chicago, which was a major load shift away from MEA when it was no longer considered to be economically prudent by the city to remain with the MEA.
Illinois was able to successfully transition customers from an MEA that was no longer going to operate back to the incumbent utility. This transition occurred without creating huge disruptions to the wholesale market since the state has centralized control over procurement planning. Since most of the MEA contracts were short term, the centralized planning was not disrupted.
The formation and cessation of MEAs continue to be driven by price. Other factors, such as local jobs, local procurement and cleaner power content are not factors because the state does its own centralized procurement planning. This differs from California and its CCAs.
Customer Choice Illinois has a deregulated retail electricity market in which a customer can select a retail electric supplier to provide electricity. Approximately 1.8 million residential customers have switched to a retail electric supplier. Utilities provide a “price to beat,” which customers use to select an energy supplier.
While individual customers can affirmatively switch retail electric suppliers, Illinois also allows for bulk municipal enrollment of a retail electric supplier through MEAs.
Self-generation is changing in Illinois. As part of the Future Energy and Jobs Act,102 the ICC is requiring utilities to file tariffs to provide rebates to retail customers who own distributed generation. The ICC will then determine a formula for calculating the value of rebates for retail customers, which would reflect the value of the distributed generation and take into consideration geographic, time-based, and performance-based benefits for present and future grid needs.103
Illinois requires IOUs and retail energy suppliers to offer a net energy metering to its customers. Systems up to two MW in size are eligible; there is a 5% aggregate cap until this new compensation structure is met. Municipal utilities are not required to offer net energy metering.
In the Illinois Power Agency Act of 2007104, Illinois established an energy efficiency and demand response standard. Starting in 2015, electric utilities are required to demonstrate a 2% efficiency savings per year relative to the prior year’s consumption. The utilities are required to file energy efficiency plans to the ICC every three years. The utilities are responsible for 75% of the savings, and the Department of Commerce and Economic Opportunities is allocated 25% of the funding available in the Energy Efficiency Portfolio Standard.
102
Illinois Public Act 99-0906 103
“Distributed Generation Valuation and Compensation Workshops,” Workshops, Illinois Commerce Commission, https://www.icc.illinois.gov/Electricity/workshops/DistributedGenerationValuation.aspx 104
220 ILCS 5/8-103
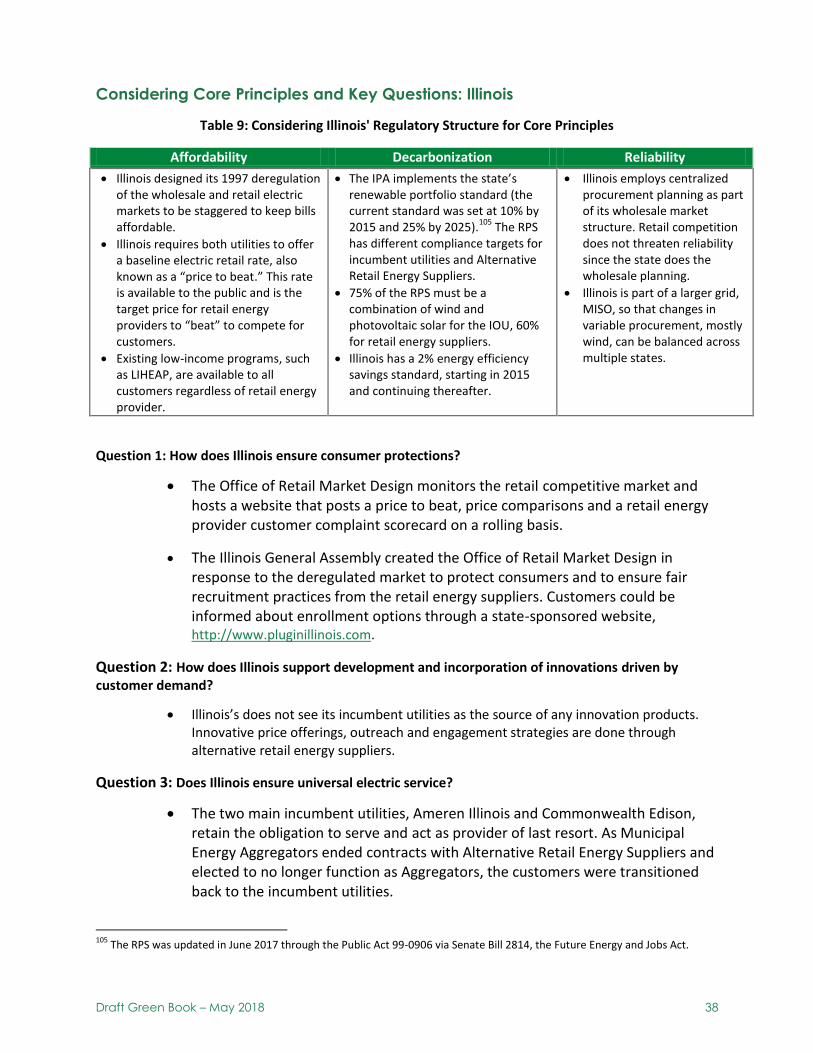
Draft Green Book – May 2018 38
Considering Core Principles and Key Questions: Illinois
Table 9: Considering Illinois' Regulatory Structure for Core Principles
Affordability Decarbonization Reliability
Illinois designed its 1997 deregulation of the wholesale and retail electric markets to be staggered to keep bills affordable.
Illinois requires both utilities to offer a baseline electric retail rate, also known as a “price to beat.” This rate is available to the public and is the target price for retail energy providers to “beat” to compete for customers.
Existing low-income programs, such as LIHEAP, are available to all customers regardless of retail energy provider.
The IPA implements the state’s renewable portfolio standard (the current standard was set at 10% by 2015 and 25% by 2025).
105 The RPS
has different compliance targets for incumbent utilities and Alternative Retail Energy Suppliers.
75% of the RPS must be a combination of wind and photovoltaic solar for the IOU, 60% for retail energy suppliers.
Illinois has a 2% energy efficiency savings standard, starting in 2015 and continuing thereafter.
Illinois employs centralized procurement planning as part of its wholesale market structure. Retail competition does not threaten reliability since the state does the wholesale planning.
Illinois is part of a larger grid, MISO, so that changes in variable procurement, mostly wind, can be balanced across multiple states.
Question 1: How does Illinois ensure consumer protections?
The Office of Retail Market Design monitors the retail competitive market and hosts a website that posts a price to beat, price comparisons and a retail energy provider customer complaint scorecard on a rolling basis.
The Illinois General Assembly created the Office of Retail Market Design in response to the deregulated market to protect consumers and to ensure fair recruitment practices from the retail energy suppliers. Customers could be informed about enrollment options through a state-sponsored website, http://www.pluginillinois.com.
Question 2: How does Illinois support development and incorporation of innovations driven by customer demand?
Illinois’s does not see its incumbent utilities as the source of any innovation products. Innovative price offerings, outreach and engagement strategies are done through alternative retail energy suppliers.
Question 3: Does Illinois ensure universal electric service?
The two main incumbent utilities, Ameren Illinois and Commonwealth Edison, retain the obligation to serve and act as provider of last resort. As Municipal Energy Aggregators ended contracts with Alternative Retail Energy Suppliers and elected to no longer function as Aggregators, the customers were transitioned back to the incumbent utilities.
105
The RPS was updated in June 2017 through the Public Act 99-0906 via Senate Bill 2814, the Future Energy and Jobs Act.

Draft Green Book – May 2018 39
If an individual customer goes from an Alternative Retail Energy Supplier back to the incumbent utility, the customer must remain with the utility for at least 12 months before switching to a new provider.
Question 4: How does Illinois leverage investment necessary to finance the evolution of the electric grid?
The Illinois Power Authority does centralized procurement and allocates costs to all market participants.
The ICC has removed the profit motive from the IOUs on the sale of electricity, so they are indifferent for retail switching. However, there is not an equivalent mechanism for the retail electric suppliers, so the Illinois Power Authority is the appropriate entity for this procurement.
Question 5: How does Illinois consider the transition of utility obligations?
Municipal Energy Aggregators were primarily price driven in selecting a retail energy provider for bulk enrollment. As price differential decreased, so did the number of Aggregators.
The coordination of utility obligations and transfers to and from Alternative Retail Energy Suppliers is coordinated with the Illinois Commerce Commission.
Question 6: Does Illinois have competitively neutral rules among market participants?
The Illinois Commerce Commission implements public purpose programs, implemented as surcharges on distribution rates through the incumbent utilities.
Customers electing an Alternative Energy Retail Supplier cannot escape charges; customers are left indifferent between providers.
Question 7: Can Illinois’ customers determine their level of participation and are they informed to participate at their desired level?
Municipal Energy Aggregators enrolled customers on a bulk basis with a retail energy provider, but individual customers may “opt out” and enroll in a different alternative supplier.
Individual customers can elect to enroll with an Alternative Energy Retail Supplier, and are informed of their participation rights, pricing, and consumer protections via a neutral website.
Question 8: How does the Illinois model impact and benefit local communities?
Illinois does not prioritize job creation, localized procurement or community benefits as part of its procurement planning process.
Municipal Energy Aggregators are primarily focused on pricing; local community benefits are secondary.
Draft Green Book – May 2018 40
Texas Market Profile
Brief History Texas is unique from the rest of the U.S. electrical system. The state’s electric grid interconnection is wholly within state and is therefore exempt from much of FERC’s regulatory authority, allowing the state regulatory authority to set its own wholesale price caps. The state’s grid interconnection and associated competitive wholesale market is managed by the Electric Reliability Council of Texas (ERCOT), the state’s independent system operator. The Texas Legislature assigned ERCOT with four primary responsibilities:
1. system reliability – planning and operations; 2. wholesale market settlement for electricity production and delivery; 3. retail switching process for customer choice; and 4. open access to transmission.
The Public Utility Commission of Texas (PUCT) has jurisdiction over activities conducted by ERCOT and the legislative authority 106 to make and enforce rules necessary to protect customers of telecommunications and electric services consistent with the public interest.
In March 1999, the Texas Senate adopted Senate Bill (SB) 7, enabling the Texas electricity market to open for retail competition and customer choice on January 1, 2002.107 It took about 10 years for Texas to work out most of the kinks following 1999 legislative action. Customers faced a decade of higher prices in restructured parts of the state compared to customers served by vertically-integrated utilities.108 While Texas leveraged some lessons learned from the deregulation of California markets, ratepayers suffered some of the same burdensome costs of transition as in California. Each utility in the restructured market split into a transmission and distribution utility (TDU) and separate affiliate business that serves as retail provider. Generation assets were sold off in a period of low wholesale prices (low fuel prices), and ratepayers in the restructured regions were left with a $9.5B price tag to cover the stranded assets (through revenue collection from ratepayers to recapture utilities’ financial outlay for initial build of these generation facilities). Had the stranded assets been sold in later years when market conditions were more favorable, transition costs would have been less burdensome to ratepayers.109
To allow new market entrants to succeed, Retail Energy Providers110 (REPs) affiliated with the incumbent utility, or affiliated REPs, were only permitted to offer a regulated price to beat (PTB) rate. Having learned from California to avoid a price shock to customers at the end of the planned five-year transition period to full open retail competition, affiliated REPs had the opportunity twice per year to adjust the PTB rate when natural gas prices changed significantly.111 Funds were appropriated with SB7 for the state to run an education campaign notifying customers of their choices.
As part of the restructuring, PUCT could move customers of a failed REP to another REP that bid to be a provider of last resort. However, there was an insufficient number of REPs that bid, so most customers
106
Public Utility Code Title II: Public Utility Regulatory Act, 2011. 107
Tom Hunter, “History of Deregulation in ERCOT” (presentation, Electric and Gas Reliability Workshop, Public Utility Commission of Texas, April 17, 2012). https://www.puc.texas.gov/agency/topic_files/101/PUC-History_Dereg_ERCOT.pdf 108
American Public Power Association. Retail Electric Rates in Regulated and Deregulated States: 2016 Update. 5; Public Sector Consultants. Electric Industry Deregulation: A Look at the Experiences of Three States. 2013, 18. 109
Texas Coalition for Affordable Power. Deregulated Electricity in Texas: A Market Annual 2017 Edition. https://tcaptx.com/wp-content/uploads/2017/02/TCAP-HistoryofDeregulation-2016-1.3.pdf 110
Retail Energy Provider is the term for retail service providers in Texas. 111
Public Utility Commission of Texas. Report to the 80th
Texas Legislature: Scope of Competition in Electric Markets in Texas. January 2007. https://www.puc.texas.gov/industry/electric/reports/scope/2007/2007scope_elec.pdf

Draft Green Book – May 2018 41
from a failing REP became the responsibility of the affiliated REP as Provider of Last Resort, causing significant burden for this single affiliated REP. In 2006, PUCT changed the rules to distribute the customers of a failed REP to multiple Large Service Providers (LSPs) designated as Provider of Last Resort for each customer class: residential, and small, mid, and large non-residential. REPs may still volunteer to provide Provider of Last Resort service, but PUCT distributes any customers not picked up by volunteer REPs among this larger set of designated LSPs.
In May and June of 2008, ERCOT experienced very high prices in the wholesale electricity market caused by a multitude of factors: unusually warm temperatures during a time when a number of power plants and power lines were out of service for maintenance, high natural gas prices, and severe transmission congestion. Five REPs went bankrupt during this period, leaving many customers to fall to a Provider of Last Resort with no recourse to recover their deposits from the failed REPs112. In response, the PUCT amended the Texas rules to strengthen financial, technical, and administrative requirements for REPs to receive certification from the PUCT113. Prior to the amendment, the REPs weak credit collateral wasn’t enough to cover purchases from the wholesale market for their customer load during price spikes. When PUCT strengthened the REPs financial requirements, the collateral amounts required accounted for the percentage of load they have hedged via long-term contracts. REPs are also required to annually report to the PUCT, which provides early identification of problems such as pending financial failure. Additionally, PUCT amended its rules to better protect customers from loss of deposits and inability to pay deposits with new Providers of Last Resort, along with other added protections.
In December 2010, Texas PUCT redesigned the ERCOT wholesale market to become a nodal market to improve the efficiency and management and congestion within the ERCOT region. This redesign to a nodal market would provide better information about where it would be desirable to build new generation facilities, resulting in more efficient operation of generation facilities, more reliable grid operations, and better investment decisions by power generation companies114.
Regulators, grid owners and operators, legislators, and customers were all faced with a steep learning curve associated with transition to a competitive retail market with customer choice. Regulators had to develop new oversight capabilities and processes to protect consumers, monitor markets and market players, and ensure competitive neutrality. In addition to putting in place strong monitoring safeguards against retailer failures and a well-defined Provider of Last Resort transition process, regulators ensured customer awareness, enabled data access, and facilitated new entrants to participate in the market. The PUCT established rules requiring REPs to provide customers a consistent and comprehensive set of information so customers can be fully aware of the terms of their service, have clear and comparable information among product options, and know their rights as a customer in selecting a product.
Additionally, PUCT requires the TDUs to offer pro-forma tariffs across all IOU regions with the intention of helping market participants access a larger customer base to benefit from economies of scale. The rates can be different to reflect the various costs, but tariff structures are consistent. This helps market participants reduce the number of products they need to design for different regions.
Current State of Affairs: Deregulated Market and Regulatory Structure There are six investor-owned TDUs in the ERCOT region that PUCT regulates. The predominant provider of electricity in Texas is served by non-utility third party providers, or REPs. There are some exceptions,
112
Public Utility Commission of Texas. Scope of Competition in Electric Markets in Texas. 2009. 113
Public Utility Commission of Texas. Scope of Competition in Electric Markets in Texas. 2011. 114
Ibid.
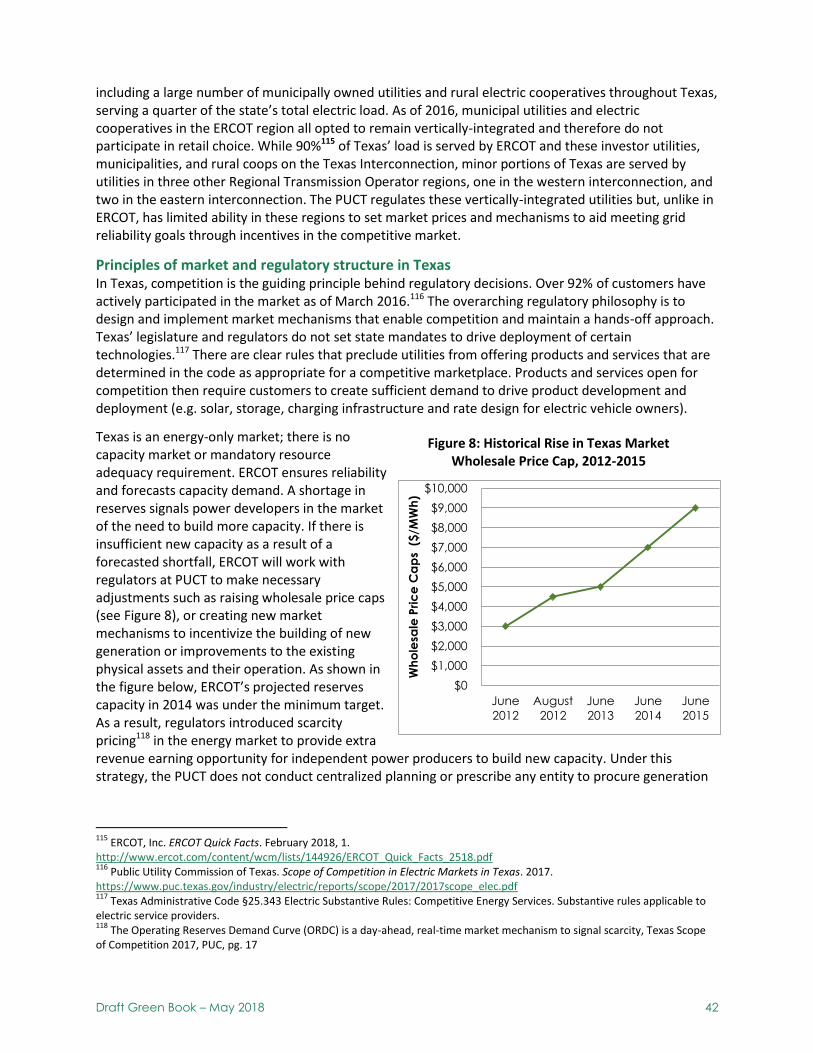
Draft Green Book – May 2018 42
$0
$1,000
$2,000
$3,000
$4,000
$5,000
$6,000
$7,000
$8,000
$9,000
$10,000
June
2012
August
2012
June
2013
June
2014
June
2015
Wh
ole
sale
Pri
ce
Ca
ps
($
/MW
h)
Figure 8: Historical Rise in Texas Market Wholesale Price Cap, 2012-2015
including a large number of municipally owned utilities and rural electric cooperatives throughout Texas, serving a quarter of the state’s total electric load. As of 2016, municipal utilities and electric cooperatives in the ERCOT region all opted to remain vertically-integrated and therefore do not participate in retail choice. While 90%115 of Texas’ load is served by ERCOT and these investor utilities, municipalities, and rural coops on the Texas Interconnection, minor portions of Texas are served by utilities in three other Regional Transmission Operator regions, one in the western interconnection, and two in the eastern interconnection. The PUCT regulates these vertically-integrated utilities but, unlike in ERCOT, has limited ability in these regions to set market prices and mechanisms to aid meeting grid reliability goals through incentives in the competitive market.
Principles of market and regulatory structure in Texas In Texas, competition is the guiding principle behind regulatory decisions. Over 92% of customers have actively participated in the market as of March 2016.116 The overarching regulatory philosophy is to design and implement market mechanisms that enable competition and maintain a hands-off approach. Texas’ legislature and regulators do not set state mandates to drive deployment of certain technologies.117 There are clear rules that preclude utilities from offering products and services that are determined in the code as appropriate for a competitive marketplace. Products and services open for competition then require customers to create sufficient demand to drive product development and deployment (e.g. solar, storage, charging infrastructure and rate design for electric vehicle owners).
Texas is an energy-only market; there is no capacity market or mandatory resource adequacy requirement. ERCOT ensures reliability and forecasts capacity demand. A shortage in reserves signals power developers in the market of the need to build more capacity. If there is insufficient new capacity as a result of a forecasted shortfall, ERCOT will work with regulators at PUCT to make necessary adjustments such as raising wholesale price caps (see Figure 8), or creating new market mechanisms to incentivize the building of new generation or improvements to the existing physical assets and their operation. As shown in the figure below, ERCOT’s projected reserves capacity in 2014 was under the minimum target. As a result, regulators introduced scarcity pricing118 in the energy market to provide extra revenue earning opportunity for independent power producers to build new capacity. Under this strategy, the PUCT does not conduct centralized planning or prescribe any entity to procure generation
115
ERCOT, Inc. ERCOT Quick Facts. February 2018, 1. http://www.ercot.com/content/wcm/lists/144926/ERCOT_Quick_Facts_2518.pdf 116
Public Utility Commission of Texas. Scope of Competition in Electric Markets in Texas. 2017. https://www.puc.texas.gov/industry/electric/reports/scope/2017/2017scope_elec.pdf 117
Texas Administrative Code §25.343 Electric Substantive Rules: Competitive Energy Services. Substantive rules applicable to electric service providers. 118
The Operating Reserves Demand Curve (ORDC) is a day-ahead, real-time market mechanism to signal scarcity, Texas Scope of Competition 2017, PUC, pg. 17
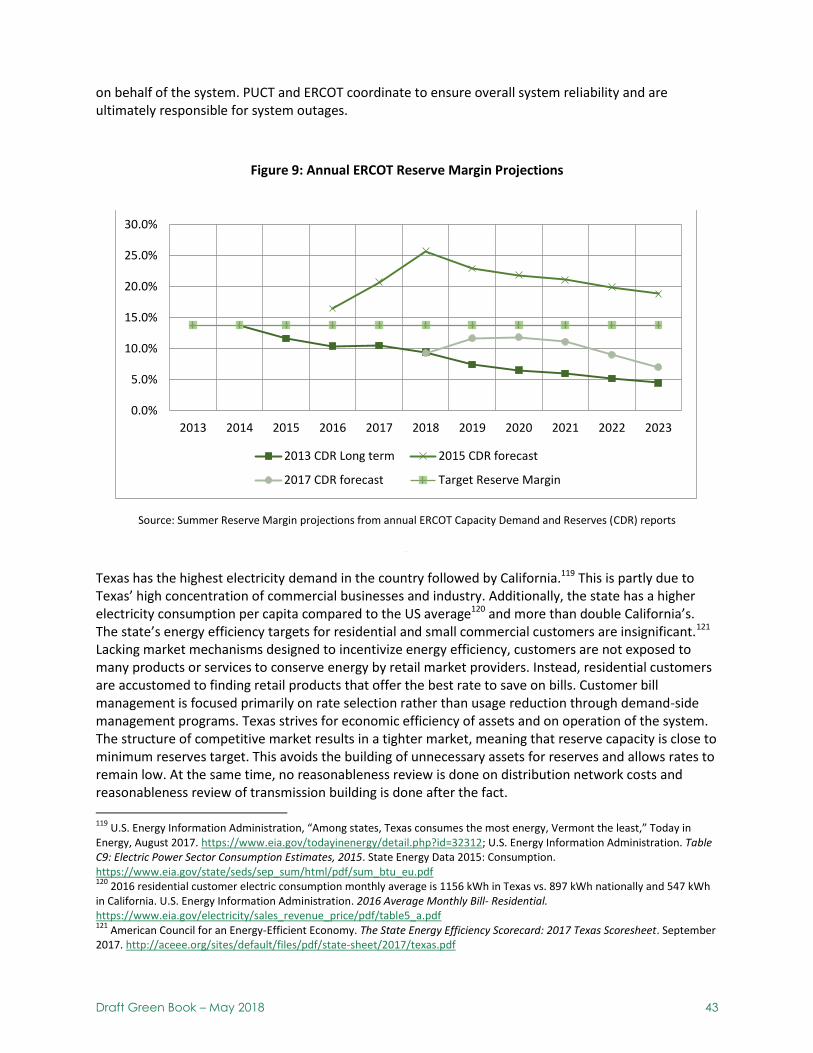
Draft Green Book – May 2018 43
on behalf of the system. PUCT and ERCOT coordinate to ensure overall system reliability and are ultimately responsible for system outages.
Figure 9: Annual ERCOT Reserve Margin Projections
Source: Summer Reserve Margin projections from annual ERCOT Capacity Demand and Reserves (CDR) reports
Texas has the highest electricity demand in the country followed by California.119 This is partly due to Texas’ high concentration of commercial businesses and industry. Additionally, the state has a higher electricity consumption per capita compared to the US average120 and more than double California’s. The state’s energy efficiency targets for residential and small commercial customers are insignificant.121 Lacking market mechanisms designed to incentivize energy efficiency, customers are not exposed to many products or services to conserve energy by retail market providers. Instead, residential customers are accustomed to finding retail products that offer the best rate to save on bills. Customer bill management is focused primarily on rate selection rather than usage reduction through demand-side management programs. Texas strives for economic efficiency of assets and on operation of the system. The structure of competitive market results in a tighter market, meaning that reserve capacity is close to minimum reserves target. This avoids the building of unnecessary assets for reserves and allows rates to remain low. At the same time, no reasonableness review is done on distribution network costs and reasonableness review of transmission building is done after the fact.
119
U.S. Energy Information Administration, “Among states, Texas consumes the most energy, Vermont the least,” Today in Energy, August 2017. https://www.eia.gov/todayinenergy/detail.php?id=32312; U.S. Energy Information Administration. Table C9: Electric Power Sector Consumption Estimates, 2015. State Energy Data 2015: Consumption. https://www.eia.gov/state/seds/sep_sum/html/pdf/sum_btu_eu.pdf 120
2016 residential customer electric consumption monthly average is 1156 kWh in Texas vs. 897 kWh nationally and 547 kWh in California. U.S. Energy Information Administration. 2016 Average Monthly Bill- Residential. https://www.eia.gov/electricity/sales_revenue_price/pdf/table5_a.pdf 121
American Council for an Energy-Efficient Economy. The State Energy Efficiency Scorecard: 2017 Texas Scoresheet. September 2017. http://aceee.org/sites/default/files/pdf/state-sheet/2017/texas.pdf
0.0%
5.0%
10.0%
15.0%
20.0%
25.0%
30.0%
2013 2014 2015 2016 2017 2018 2019 2020 2021 2022 2023
2013 CDR Long term 2015 CDR forecast
2017 CDR forecast Target Reserve Margin
Draft Green Book – May 2018 44
Although the market incentives created in 2014 to address forecasted shortfalls in system capacity buoyed the reserves forecast in the 2015 Capacity Demand and Research Report, the capacity reserve forecast has been declining steadily since. Due in large part to the approved closure of over 4GW of coal-fired power plants by Vistra in late 2016, the 2017 report projects the 2018 reserves will fall four points below the minimum margin of 13.75%122, conditions which may lead to spikes in wholesale market prices and challenges for REPs and their customers that have low percentage of hedged or long-term contracts in place to serve customer load. In recent years, ERCOT has seen an increase in Reliability Unit Commitments and Reliability Must-Run agreements to address local reliability issues, such as high congestion in Houston.123 The PUCT and ERCOT are considering market changes that could reduce these actions without threatening system reliability such as adding locational scarcity pricing in the market which would require Real-Time Co-optimization to set pricing in accordance with local reserve requirements.124
Texas has a renewable portfolio standard and the state reached its most aggressive target of 10,000MW by 2025 in 2009. However, Texas is still experiencing continued growth in renewable technology beyond the targets established in its RPS. Because of the high resource potential, Texas leads the nation in wind-powered generation capacity with more than 22,000 MW at the end of 2017.125 Even without a forward-looking RPS target, the state’s low cost of renewables with its strong wind resource potential and streamlined interconnection and permit processes is attractive to a number of companies that want low rates while still honoring their commitment to shareholders/customers to “go green.”
Texas was a leader in the use of smart meters and data to provide transparency among participants in the competitive market. Texas TDUs have benefitted from smart devices and telemetry to assess grid function at more granular distribution levels without having to physically inspect the lines. This has substantially improved the resilience of TDUs operating and maintaining the grid network to restore electric service to customers in the wake of hurricanes. Due to the criticality of data access to ensure neutrality between market participants for healthy competition, both the legislature and TDUs supported PUCT’s creation of the Smart Meter Texas portal. Texans can authorize access to their non-identifying customer usage data in the portal.
Customer Choice In the restructured market (ERCOT), customers can choose their REP. Customers with BTM technologies are also able to shop for REP products that specifically accommodate or compensate their distributed self-generation.
Customers in a political district or city may opt in as a group and contract with a REP through an aggregator such as the Texas Coalition for Affordable Power (TCAP). Customers can choose from a variety of rate pricing options, such as:
green, renewable-sourced power;
dynamic pricing (time-of-use, “free nights and weekends”);
122
ERCOT. Report on the Capacity, Demand and Reserves (CDR) in the ERCOT Region, 2018-2027. December 2017. 123
With the completion of additional transmission in April 2018, the Houston congestion issues no longer exist and the Reliability Must-Run contracts are set to expire. 124
ERCOT. Proposed market design changes in ERCOT. August 2017. http://www.ercot.com/content/wcm/lists/121384/ERCOT_Market_Design_OnePager_FINAL.pdf 125
U.S. Energy Information Administration. Table 6.2.B. Net Summer Capacity Using Primarily Renewable Energy Sources and by State, January 2018 and 2017 (Megawatts); Table 6.5. Planned U.S. Electric Generating Unit Additions. Electric Power Monthly. 2018. https://www.eia.gov/electricity/monthly/epm_table_grapher.php?t=epmt_6_02_b; https://www.eia.gov/electricity/monthly/epm_table_grapher.php?t=epmt_6_05
Draft Green Book – May 2018 45
Aggregators in Texas, unlike
California’s community choice
aggregators, do not procure energy
on behalf of customers through
directly contracting with
generators and participating in the
wholesale market. Rather, they are
an entity that helps groups of
customers negotiate for better
rates with REPs (who contract with
generators and purchase energy
from wholesale market).
flat billing options (like cell phone service plans – where a customer pays a flat $120/month for 1200 kwh, and then a premium for any overconsumption); and
prepaid options (where service is shut off after depletion of the prepaid account). Commercial and industrial customers have a wide range of choices. They have options in who they can contract with, the type of technology used, and other demand response or valued services the business can offer in return for a lower rate from provider In both ERCOT and non-ERCOT, energy efficiency programs exist from IOUs for residential and small commercial customer types and are offered through the TDU and recovered via distribution charges.
In the Texas market, the shift of customers as they select different REPs has little to no impact on system resource adequacy and reliability. Customers are already unbundled and disaggregated among many retail service providers. As of September 2017, 69.2% of all customers were with a non-affiliate REP126. Customer switching from one REP to another has not caused significant disturbances to the procurement for REPs on behalf of their customer loads. Even if an REP fails, its customer load from a failed REP is dispersed among multiple retailers designated as providers of last resort. While the independent power producer bears the risk, the costs of a failed REP’s long-term contracts may be mitigated by selling the excess power on the wholesale market.
Customers are not demanding storage and electric vehicle infrastructure. Regulatory code determining which market players are allowed to build and offer new emerging technology assets and services such as storage and electric vehicle infrastructure is still underway and new precedents are being established.127 In Texas, storage is seen as a generation asset and the competition rules preclude TDUs from owning, operating, and locating storage assets on their network.
Texas customers have a strong voice to promote solar PV as DER and market participants have heard their demand for BTM solar systems. Some REPs have built out their customer base through being willing to buy the homeowner’s generation of solar electricity. Still, customers must shop for these REPs if they want compensation for their solar PV installation. Regardless of who the customer’s REP is, there is no net energy metering of electricity when the TDU calculates transmission and distribution charges to the customer. Self-generating customers are charged for all energy delivered to them. Despite this, TDUs are still earning less revenue due to these customers drawing less load, and TDUs have been advocating for a minimum fixed charge for customers.
126
“Summary of Performance Measure Data,” Report Cards on Retail Competition and Summary of Market Share Data, Reports, Public Utility Commission of Texas. https://www.puc.texas.gov/industry/electric/reports/RptCard/Default.aspx 127
2013 Oncor large storage project to manage reliability denied by PUCT. Storage is seen as a generation technology and left
for market players to develop/install in a competitive market. In early 2018, AEP’s “innovative” solution to install two battery
storage systems as an alternative to a traditional distribution system expansion was dismissed by PUCT. Gavin Bade. “Whatever
happened to Oncor's big energy storage plans?” Utility Dive, September 1, 2015, https://www.utilitydive.com/news/whatever-
happened-to-oncors-big-energy-storage-plans/404949/; Peter Maloney, “Texas PUC to take a closer look at energy storage
issues,“ Article, American Public Power Association, January 29, 2018, https://www.publicpower.org/periodical/article/texas-
puc-take-closer-look-energy-storage-issues.
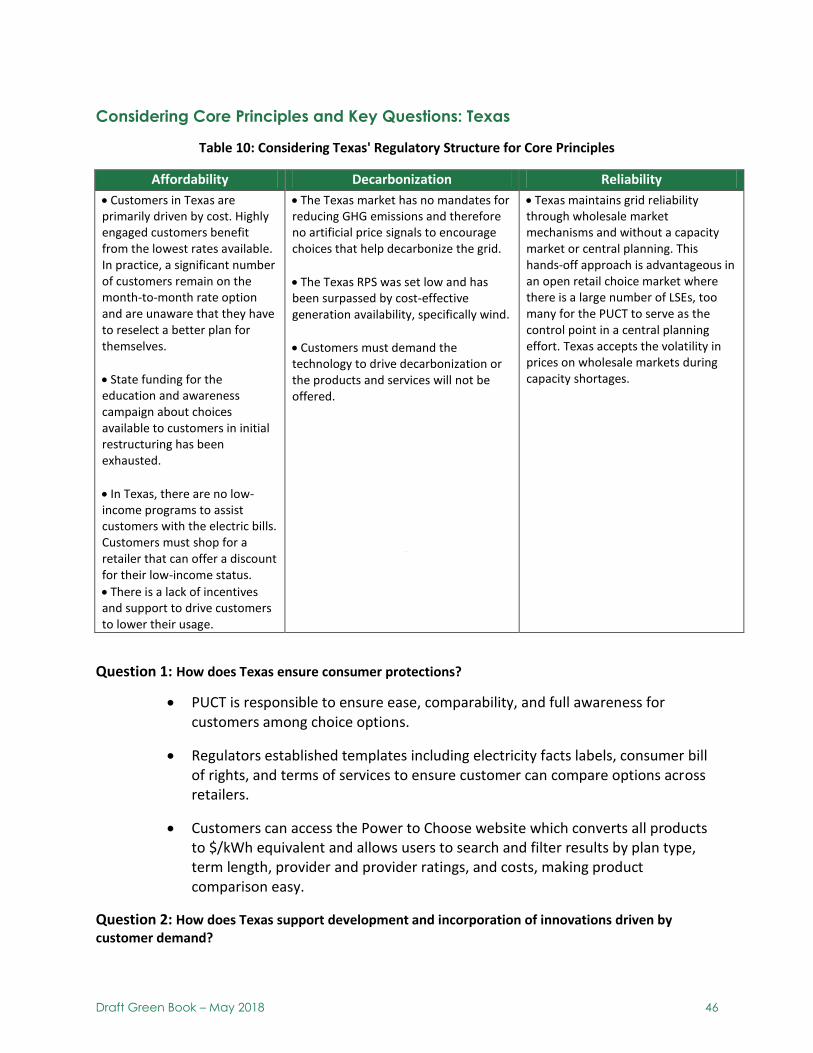
Draft Green Book – May 2018 46
Considering Core Principles and Key Questions: Texas
Table 10: Considering Texas' Regulatory Structure for Core Principles
Affordability Decarbonization Reliability
Customers in Texas are primarily driven by cost. Highly engaged customers benefit from the lowest rates available. In practice, a significant number of customers remain on the month-to-month rate option and are unaware that they have to reselect a better plan for themselves.
State funding for the education and awareness campaign about choices available to customers in initial restructuring has been exhausted.
In Texas, there are no low-income programs to assist customers with the electric bills. Customers must shop for a retailer that can offer a discount for their low-income status.
There is a lack of incentives and support to drive customers to lower their usage.
The Texas market has no mandates for reducing GHG emissions and therefore no artificial price signals to encourage choices that help decarbonize the grid.
The Texas RPS was set low and has been surpassed by cost-effective generation availability, specifically wind.
Customers must demand the technology to drive decarbonization or the products and services will not be offered.
Texas maintains grid reliability through wholesale market mechanisms and without a capacity market or central planning. This hands-off approach is advantageous in an open retail choice market where there is a large number of LSEs, too many for the PUCT to serve as the control point in a central planning effort. Texas accepts the volatility in prices on wholesale markets during capacity shortages.
Question 1: How does Texas ensure consumer protections?
PUCT is responsible to ensure ease, comparability, and full awareness for customers among choice options.
Regulators established templates including electricity facts labels, consumer bill of rights, and terms of services to ensure customer can compare options across retailers.
Customers can access the Power to Choose website which converts all products to $/kWh equivalent and allows users to search and filter results by plan type, term length, provider and provider ratings, and costs, making product comparison easy.
Question 2: How does Texas support development and incorporation of innovations driven by customer demand?
Draft Green Book – May 2018 47
The PUCT seeks to clearly define the appropriate role for utilities and market participants in offering emerging technologies products and services.
Customer demand drives new technology offerings.
Question 3: Does Texas ensure universal electric service?
Regulators have strict financial, technical, and administrative requirements for retailers. As a result, retailer bankruptcies are rare.
Regulators also have a well-defined plan and protections in place to mass transition customers in case a retailer suddenly fails.
Question 4: How does Texas leverage investment necessary to finance the evolution of the electric grid?
Market signals are used to spur new investment.
Texas relies on competitively neutral rules, a relative ease and predictability in its regulatory framework for market participants to create contracts to sell a wide variety of types of electric products and services designed to meet buyers’ needs and attract investors.
Question 5: How does Texas consider the transition of utility obligations?
PUCT establishes the role of the TDU vs. retail providers or other market participants.
PUCT also monitors the market to enhance consumer protections (for example watching for trends in consumer complaints to identify bad actors). In consultation with ERCOT, it also monitors the market to ensure reliability through transitions in market structure.
Question 6: Does Texas have competitively neutral rules among market participants?
Because the TDUs are prohibited from competing as market participants, the TDUs have no advantage over other market participants. The market participants that are competing are on equal footing with each other (e.g. in interconnecting with the TDU).
The Smart Meter Texas Portal was created for retail service providers to access data (should customers authorize access to their non-identifying customer usage data in the portal to market participants.
Pro-forma tariffs enable market participants to easily access a large market share.
Question 7: Can customers determine their level of participation and are they informed to participate at their desired level?
Customers can enter a contract to lock in a low price. Once the contract lapses, they are enrolled in a default “month-to-month” price which is typically higher. Texas relies on price signals to provide incentives for market participation.
Draft Green Book – May 2018 48
Question 8: How does Texas impact and benefit local communities?
Retail Energy Providers target specific local communities and compete (using gift cards, other inducements) that benefit customers in a community or neighborhood.128
Retail Energy Providers anticipate the needs of local communities, and build their name brand targeting local needs. For example, in extremely hot days, REPs will set up cooling tents in local communities.
Texas does not promote generation-specific jobs programs.
Great Britain Market Profile
Brief History The Electricity Act of 1989 launched the restructuring of Great Britain’s electricity industry. Prior to the Act, in England and Wales, the state operated a centralized planning and operations board and 12 regional electricity area boards, responsible for generation and transmission, and distribution and supply, respectively. The reorganization and privatization of the industry resulted in three generation companies, a single transmission system operator, and regional electricity companies with distribution and supply businesses. The transmission system operator and electricity companies were regulated under the newly established Office of Electricity Regulation (now known as the Office of gas and electricity markets or Ofgem). In Scotland, restructuring resulted in two vertically-integrated utilities.129
The period following privatization was characterized by the consolidation of suppliers130 into six large suppliers, known as the “big six.” Customers received lower prices and companies reduced operating costs, but there were few incentives to innovate and the distribution companies reaped substantial profits despite price controls in place from 1990 to 1995.131 In response, regulators set additional price controls for the electricity companies. Customer classes were gradually able to choose their own suppliers starting with large customers (over 1 MW demand) being able to do so in 1990, medium sized customers (over 100 KW demand) in 1994, and remaining customers from 1998.132 Only a few new companies entered the market during this time, creating minimal competition. The Utilities Act 2000 directed regulators to protect consumers “wherever appropriate by promoting effective competition” in the electricity sector.133 In 2001, price controls on the residential energy sector were lifted, signaling the end of the restructuring process.
Today, National Grid Electricity Transmission (National Grid) is the System Operator for bulk power transmission, coordinating across three transmission owners, and administering the wholesale energy and capacity auctions. (Great Britain established a capacity market in 2013 to encourage investment in conventional generation and address future security of supply concerns.134) National Grid publishes four main documents every year forecasting load and generation investments and closures, as well as recommending future capacity margins: Electricity Ten Year Statement, Future Energy Scenarios, Winter
128
Darrin Pfannenstiel, “Texas” (presentation, California Public Utilities Commission Informal Workshop, Sacramento, CA, October 31, 2017), http://www.cpuc.ca.gov/choiceworkshop/ 129
International Energy Agency and Organisation for Economic Co-operation and Development. Lessons from Liberalised Electricity Markets. 2005, 171. 130
Suppliers are Great Britain’s retail service providers 131
British Embassy Tokyo. UK Energy Innovation: The history and current status of the UK’s electricity and gas markets. 2016, 6. 132
Department for Business, Energy & Industrial Strategy. Digest of United Kingdom Energy Statistics. 2017, 126-127. 133
Utilities Act 2000. 134
Competition & Markets Authority. Energy market investigation. June 24, 2016, 109-110.
Draft Green Book – May 2018 49
Outlook Report, and an Electricity Capacity Report.135 The target level of capacity is set by the Department of Business, Energy and Industrial Strategy in consultation with independent experts and National Grid.136
Current State of Affairs: Revenue = Innovation + Inputs + Outputs (RIIO) In 2008, Ofgem launched a review of energy network regulation to assess the regulatory framework needed to address future challenges of electricity and gas systems. Aging assets, security of supply, and affordability issues were all drivers behind the review, with the need to decarbonize electricity systems a paramount concern.137 In 2010, Ofgem established the RIIO model, which stands for “Revenue set to deliver strong Incentives, Inputs and Outputs.”
RIIO is a performance-based framework designed to encourage network companies to contribute to the delivery of a sustainable energy sector and to deliver long-term value for current and future customers.138 The focus on outputs with incentives centered on performance is expected to make network companies more responsive to customers in setting their direction, rather than looking toward regulators. Furthermore, network companies earn revenue based on total expenditures that include both capital and operating expenses.
Eight-year price controls and an innovation stimulus package were main components of the new framework. Price controls were extended from 5-year to 8-year periods to encourage utilities to plan for longer-term investments and to have sufficient time to measure performance and accrue rewards. The first price controls under RIIO went into effect in 2013 for transmission owners and in 2015 for distribution network operators.139
The innovation stimulus package is an added incentive for transmission and distribution network companies and builds off previous innovation programs. Programs such as the Network Innovation Competition, Network Innovation Allowance and Innovation Roll-out Mechanism give companies funding to run large and small-scale demonstration projects or otherwise implement a proven innovation.140 In 2017, Ofgem funded five projects through the annual competition giving awardees a total of £42.4 million.141 The projects in development are testing new technologies and equipment on parts of the distribution grid to address constraints on local distribution networks, predict network capacity, facilitate trading of flexible network services, and save money.142In addition to the RIIO model for network regulation, Ofgem has undertaken broader efforts to manage the evolving energy system through a more resilient, flexible and agile regulatory framework. The principles highlighted in Ofgem’s strategy are:
1. Aligning the System Operator’s and network companies’ interests with those of consumers, through clear obligations and well-designed incentives.
2. Ensuring that charging for monopoly services reflects incremental costs and benefits and recovers other revenue requirements in ways that are fair and reduce distortions.
135
Ofgem. Great Britain and Northern Ireland Regulatory Authorities Reports 2017. July 31, 2017, 56-58. 136
Competition & Markets Authority. Energy market investigation. June 24, 2016, 234. 137
Ofgem. RIIO: A new way to regulate energy networks Final Decision. October 2010, 9. 138
Ibid., 10. 139
Ofgem. Fact Sheet 117: Price controls explained. March 2013, 1. 140
Ibid., 4. 141
“Electricity Network Innovation Competition,” Network Innovation, Ofgem, https://www.ofgem.gov.uk/network-regulation-riio-model/network-innovation/electricity-network-innovation-competition 142
Ofgem. Making Britain’s energy networks better. 2017. https://www.ofgem.gov.uk/system/files/docs/2017/11/ofg1031_innovation_competitions_brochure_web.pdf
Draft Green Book – May 2018 50
3. Ensuring that regulation is neutral between different technologies, systems and business models, while encouraging new entry and innovation by, for example, promoting a level playing field between entrants and existing companies, and between network reinforcement and alternative solutions.
4. Providing a predictable regulatory regime which supports efficient investment and allocates risks efficiently.
5. Promoting competition and harnessing market-based mechanisms where it is in consumers’ interests to do so.143
Ofgem has started to clarify roles and responsibilities for market participants, change rules to align incentives with consumer interests, and implement cross-cutting platforms to facilitate the energy transition. For example, in examining the System Operator role, Ofgem has proposed a new framework to support forward-looking actions and encourage network coordination across transmission and distribution systems rather than focus on short-term savings and transmission operations. It puts forth roles and principles underpinned by license obligations to allow the System Operator to act in the best interest of its customers and the whole system instead of focusing on the tradeoffs of incentives set forth by the previous framework.144 In retail markets, Ofgem has also committed to a principles-based approach to encourage innovation. It began by revising the supply license to remove prescriptive conditions.145
Ofgem has also established a service for business to receive timely feedback and support on innovative proposals for the energy sector. Innovation Link allows regulators to stay up to date on emerging trends, while supporting the deployment of new products, services, and business models in the energy sector.146 As part of this program, Ofgem also grants a select number of applicants the opportunity to trial their business model in the “regulatory sandbox.” Innovators who would not have been able to launch their ideas under the current regulatory framework can do so with a limited number of customers and within a certain timeframe. In 2017, Ofgem’s first sandboxes were granted to three projects exploring peer-to-peer energy exchanges and an innovative tariff.147
Customer Choice Customers in Great Britain can choose among retail suppliers, tariff structures, payment methods and self-generation options. More than 80% of residential customers are served by one of the big six suppliers, but there has been an increase in new, smaller suppliers over the last year, bringing the total to 40 active competitors. Tariff options are generally along the lines of fixed or variable rates. Some suppliers provide more niche offerings such as local tariffs, renewable energy and smart technology.148 Customers can elect to pay their bills through standard credit, debit deductions, or prepayment meters. Customers with prepayment meters generally do not have the choice to pay through other means or to select an alternate tariff. These customers have either had problems paying their bills or live in rental housing. They are typically on a standard variable tariff and have less access to information and switching, paying higher switching prices than customers in other segments.149
143
Ofgem. Our strategy for regulating the future energy system. 2017, 8. 144
Ofgem, Future Arrangements for the Electricity System Operator: Working Paper on the Future Regulatory Framework, 11 July 2017 at p. 9. 145
Ofgem. Great Britain and Northern Ireland Regulatory Authorities Reports 2017. July 31, 2017, 12. 146
Ofgem. Our strategy for regulating the future energy system. 2017, 4-5. 147
“The Innovation Link,” How we engage, Ofgem, https://www.ofgem.gov.uk/about-us/how-we-engage/innovation-link. 148
Ofgem. Great Britain and Northern Ireland Regulatory Authorities Reports 2017. July 31, 2017, 43. 149
Competition & Markets Authority. Energy market investigation. June 24, 2016.
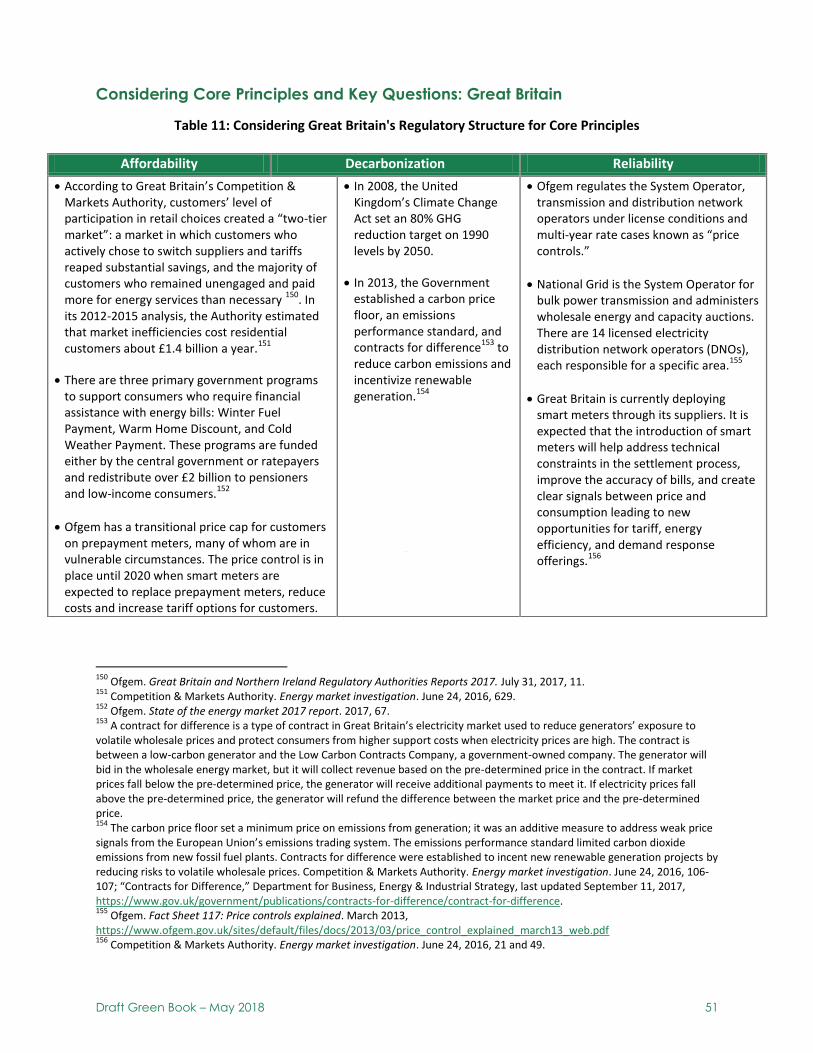
Draft Green Book – May 2018 51
Considering Core Principles and Key Questions: Great Britain
Table 11: Considering Great Britain's Regulatory Structure for Core Principles
150
Ofgem. Great Britain and Northern Ireland Regulatory Authorities Reports 2017. July 31, 2017, 11. 151
Competition & Markets Authority. Energy market investigation. June 24, 2016, 629. 152
Ofgem. State of the energy market 2017 report. 2017, 67. 153
A contract for difference is a type of contract in Great Britain’s electricity market used to reduce generators’ exposure to volatile wholesale prices and protect consumers from higher support costs when electricity prices are high. The contract is between a low-carbon generator and the Low Carbon Contracts Company, a government-owned company. The generator will bid in the wholesale energy market, but it will collect revenue based on the pre-determined price in the contract. If market prices fall below the pre-determined price, the generator will receive additional payments to meet it. If electricity prices fall above the pre-determined price, the generator will refund the difference between the market price and the pre-determined price. 154
The carbon price floor set a minimum price on emissions from generation; it was an additive measure to address weak price signals from the European Union’s emissions trading system. The emissions performance standard limited carbon dioxide emissions from new fossil fuel plants. Contracts for difference were established to incent new renewable generation projects by reducing risks to volatile wholesale prices. Competition & Markets Authority. Energy market investigation. June 24, 2016, 106-107; “Contracts for Difference,” Department for Business, Energy & Industrial Strategy, last updated September 11, 2017, https://www.gov.uk/government/publications/contracts-for-difference/contract-for-difference. 155
Ofgem. Fact Sheet 117: Price controls explained. March 2013, https://www.ofgem.gov.uk/sites/default/files/docs/2013/03/price_control_explained_march13_web.pdf 156
Competition & Markets Authority. Energy market investigation. June 24, 2016, 21 and 49.
Affordability Decarbonization Reliability
According to Great Britain’s Competition & Markets Authority, customers’ level of participation in retail choices created a “two-tier market”: a market in which customers who actively chose to switch suppliers and tariffs reaped substantial savings, and the majority of customers who remained unengaged and paid more for energy services than necessary
150. In
its 2012-2015 analysis, the Authority estimated that market inefficiencies cost residential customers about £1.4 billion a year.
151
There are three primary government programs to support consumers who require financial assistance with energy bills: Winter Fuel Payment, Warm Home Discount, and Cold Weather Payment. These programs are funded either by the central government or ratepayers and redistribute over £2 billion to pensioners and low-income consumers.
152
Ofgem has a transitional price cap for customers on prepayment meters, many of whom are in vulnerable circumstances. The price control is in place until 2020 when smart meters are expected to replace prepayment meters, reduce costs and increase tariff options for customers.
In 2008, the United Kingdom’s Climate Change Act set an 80% GHG reduction target on 1990 levels by 2050.
In 2013, the Government established a carbon price floor, an emissions performance standard, and contracts for difference
153 to
reduce carbon emissions and incentivize renewable generation.
154
Ofgem regulates the System Operator, transmission and distribution network operators under license conditions and multi-year rate cases known as “price controls.”
National Grid is the System Operator for bulk power transmission and administers wholesale energy and capacity auctions. There are 14 licensed electricity distribution network operators (DNOs), each responsible for a specific area.
155
Great Britain is currently deploying smart meters through its suppliers. It is expected that the introduction of smart meters will help address technical constraints in the settlement process, improve the accuracy of bills, and create clear signals between price and consumption leading to new opportunities for tariff, energy efficiency, and demand response offerings.
156
Draft Green Book – May 2018 52
Customers use price comparison websites that show suppliers and corresponding options available in their region. Ofgem currently administers a code of practice that helps ensure that consumers can use a site they trust to provide accurate and reliable pricing information. In July 2017, Ofgem announced it will be launching its own price comparison website.157
Community-based energy including aggregators, local projects, and other models, are an emerging trend in Great Britain.158
Question 1: How does Great Britain ensure consumer protections?
To participate in the market, suppliers must obtain a license from Ofgem. Entry testing arrangements, which include credit checks and interoperability tests, are conducted through market channels.159
In the residential retail market, the 2016 CMA investigation found that low customer engagement gives suppliers’ more market power over inactive customers and leads to price discrimination.160
Consumers can compare suppliers’ gas and electricity prices using a wide range of online energy price comparison websites. Ofgem currently administers a code of practice, the ‘Confidence Code’, which helps ensure that consumers can use a site they trust to provide accurate and reliable pricing information. In July 2017, Ofgem announced it will be launching its own price comparison website.161
Ofgem has started a database of disengaged customers that would be available for suppliers to target their marketing efforts. The database would include information on residential customers who have not switched suppliers in three years. Customers would automatically be enrolled in the database and they may opt out.162
Question 2: How does Great Britain support development and incorporation of innovations driven by customer demand?
Ofgem has also established a service for businesses to receive timely feedback and support on innovative proposals for the energy sector. Innovation Link allows regulators to stay up to date on emerging trends, while supporting the deployment of new products, services, and business models in the energy sector.163
157
“UK’s Ofgem launches energy price comparison site,” Engerati, July 07, 2017, https://www.engerati.com/article/uk-ofgem-energy-price-comparison-site-switching. 158
Ofgem. Our strategy for regulating the future energy system. 2017, 6. 159
Ofgem, Guidance for gas and electricity licence applications, updated 28 January 2013 at p. 26 160
Competition & Markets Authority. Energy market investigation. June 24, 2016, 37-39. 161
“UK’s Ofgem launches energy price comparison site,” Engerati, July 07, 2017, https://www.engerati.com/article/uk-ofgem-energy-price-comparison-site-switching. 162
“Ofgem disengaged customer database,” How to switch energy supplier and shop for a better deal, Ofgem, 2018, https://www.ofgem.gov.uk/consumers/household-gas-and-electricity-guide/how-switch-energy-supplier-and-shop-better-deal/ofgem-energy-customer-database-service. 163
As part of this program, Ofgem also grants a select number of applicants the opportunity to trial their business model in the “regulatory sandbox.” Innovators who would not have been able to launch their ideas under the current regulatory framework can do so with a limited number of customers and within a certain timeframe. In 2017, Ofgem’s first sandboxes were granted to three projects exploring peer-to-peer energy exchanges and an innovative tariff. Ofgem. Our strategy for regulating the future energy system. 2017, 4-5; “The Innovation Link,” How we engage, Ofgem, https://www.ofgem.gov.uk/about-us/how-we-engage/innovation-link.
Draft Green Book – May 2018 53
Under RIIO, the innovation stimulus package gives companies funding to run large and small-scale demonstration projects or otherwise implement a proven innovation.164 In 2017, Ofgem funded five projects through the annual competition giving awardees a total of £42.4 million.165
Question 3: Does Great Britain ensure universal electric service?
Provider of Last Resort responsibilities are not pre-determined, instead, Ofgem conducts a “Supplier of Last Resort” process where suppliers bid to take over stranded customers. Ofgem reviews the bids considering the bidders’ financial viability for the transition, customer satisfaction ratings, and product offerings. During the process, customers continue to receive power from the distribution network operators and payments are worked out after the selection of the new supplier.166
Question 4: How does Great Britain leverage investment necessary to finance the evolution of the electric grid?
Great Britain established a capacity market in 2013 to support investment in baseload generation and address future security of supply concerns.167 The cost of the capacity market is met through a levy on suppliers that is passed down to consumers. These costs are minimized through the competitive auction process.
Decarbonization in the electricity sector has been driven by carbon prices and subsidies. In 2016, the policy costs for decarbonization totaled £7.4 billion, an average of about £90 on customer bills per year.168 While these costs have been offset by energy efficiency gains, which lowered the customers’ charges, the rate impact of legacy programs and new renewable generation is expected to increase over time.
Question 5: How does Great Britain consider the transition of utility obligations?
Customers were gradually able to choose energy suppliers, starting with the largest customers with more than 1 MW demand and ending with residential classes. During the transition, Regional Electricity Companies had monopolies in their respective areas until 1999 when their franchises ended. By this time, all customers could choose their own suppliers.169
There is a minimum legal separation between the network businesses and retail suppliers. However, most of the network businesses and retail suppliers are fully independent.
Network companies own and operate the physical infrastructure required for energy delivery to customers. Retail suppliers provide financial and commercial services, including energy procurement, securing network access, metering, billing and customer
164
Ofgem. Fact Sheet 117: Price controls explained. March 2013, 4. 165
“Electricity Network Innovation Competition,” Network Innovation, Ofgem, 2018, https://www.ofgem.gov.uk/network-regulation-riio-model/network-innovation/electricity-network-innovation-competition. 166
Ofgem. Great Britain and Northern Ireland Regulatory Authorities Reports 2017. July 31, 2017. 167
Competition & Markets Authority. Energy market investigation. June 24, 2016, 109-110. 168
Ofgem. State of the energy market 2017 report. 2017, 84. 169
Department for Business, Energy & Industrial Strategy. Digest of United Kingdom Energy Statistics. 2017, 126-127.

Draft Green Book – May 2018 54
service, collecting environmental and social obligations, and in some cases, selling bundled services.170
Question 6: Does Great Britain have competitively neutral rules among market participants?
Ofgem oversees network operators171 in the electricity system mainly through price regulation and setting the rules for competition in wholesale and retail markets.
Ofgem administers licenses for participants in generation, transmission, interconnection, distribution and supply markets and determine the Standard License Conditions.172
Question 7: Can customers determine their level of participation and are they informed to participate at their desired level?
Customers in Great Britain can choose among retail suppliers, tariff structures, payment methods and self-generation options.173
Customers who have low incomes, low qualifications, live in rented housing and/or are 65 years of age and older are less likely to make active choices174. Customers with prepayment meters generally do not have the choice to pay through other means or to select an alternate tariff. These customers either have had problems paying their bills or live in rental housing. They are typically on a standard variable tariff and have less access to information and switching, paying higher switching prices than customers in other segments.175
There are no stand-by charges. Most domestic tariffs include a unit rate per kWh of consumption and a fixed standing charge regardless of consumption. Some suppliers set their standing charges to zero.
Question 8: How does the Great Britain model impact and benefit local communities?
Community-based energy including aggregators, local projects, and other models, are an emerging trend in Great Britain.176
170
Competition & Markets Authority. Energy market investigation. June 24, 2016, 171
Great Britain’s successors to the distribution arm of the electricity companies. They distribute electricity, but cannot supply it. 172
Competition & Markets Authority. Energy market investigation. June 24, 2016, 101-102. 173
Ofgem. Great Britain and Northern Ireland Regulatory Authorities Reports 2017. July 31, 2017, 43. 174
Competition & Markets Authority. Energy market investigation. June 24, 2016, 33. 175
Ibid. 176
Ofgem. Our strategy for regulating the future energy system. 2017, 6.
Draft Green Book – May 2018 55
PART V: Observations & Future Considerations
California needs a clear long-term vision for its regulatory framework to address the state’s system requirements and policy goals beyond short-term fixes to stabilize immediate issues. The purpose of the paper is to serve as a catalyst to acknowledge vulnerabilities and to address them thoughtfully and strategically. New rules will need to be formulated by the CPUC under current law and--in certain instances—legislative guidance may be necessary. This paper serves as a call to action for the Legislature, our agency partners, the CAISO, stakeholders and communities to join in the conversation and develop a plan to protect against another crisis.
Affordability: Customers Need Information, Protection and Guaranteed
Service
Customer engagement and price transparency are critical to keep rates low in competitive markets. In New York and Great Britain, low customer engagement in switching retail suppliers has led to significant market inefficiencies and higher costs for inactive consumers.
Educational campaigns for consumers and regularly updated data on prices are needed to support customer engagement and market transparency. California’s IOUs have a statewide energy education platform focused on customer engagement with demand-side management programs and bill reduction opportunities, and it has other resources to help customers understand the cost of rooftop solar energy. The state provides cost calculators on websites for rooftop solar, including GoSolarCalifornia.com.
New York, Texas, and Great Britain, like California, rely on a state-focused independent system operator. However, Illinois benefits from its participation in MISO, a multi-state power market. Illinois attributes the broader grid and being part of MISO to its ability to balance its goals to increase renewable penetration and keep rates affordable.
It is unclear if California could have similar wholesale price benefits like Illinois because it utilizes a state system operator rather than a regional transmission operator. As part of implementing SB 350, California is considering how its electric grid operations could be expanded on a regional basis across the western states. The benefits and implications of regionalization on California bill affordability are still under consideration.
Texas does not have a uniform subsidy for low-income customers. The other markets examined in this paper administer low-income programs either through retail suppliers (Great Britain), utility programs (New York), or discounted distribution rates (Illinois).
It is critical that low-income programs continue with expanded customer choice offerings. California offers up to 35% discount on rates to residential customers through the CARE program, and other discounts such as the FERA program. California also offers unique programs for low-income customers such as the Energy Savings Assistance Program. Recently, California has included more efforts specifically toward “disadvantaged communities”, to ensure that the benefits of transportation electrification and distributed energy resources also reach those communities.
Draft Green Book – May 2018 56
Decarbonization: Statewide Mandates and Programs Drive Carbon
Emissions Reductions
Climate and environmental policies are significant elements of the energy sector transformation across all markets, except Texas. There is some form of renewable portfolio standard in New York and Illinois (and formerly in Great Britain) to support renewable generation, as well as net energy metering or feed-in-tariffs to incentivize solar PV. These mechanisms were tailored to meet the needs of current market designs.
Re-examining current programs to align with changing market structures is critical. There may be an expectation that mandates and incentives advancing technologies in the electric sector will continue indefinitely. With California’s success to date, scrutiny needs to occur regarding whether to continue the programs once cost parity is achieved with conventional forms of service. Greater choice options based on statewide programs create unnecessary costs and, in some cases, stifle innovation by rewarding technologies that have become commercially viable and blocking new market entrants. Decarbonization efforts have been less targeted to disadvantaged communities in California, which have fewer CCAs, Direct Access options and distributed energy resources. Whether these benefits are provided by utilities or other entities, California does not intend to allow its more vulnerable populations to be left behind.
Reliability: Operating the Grid Safely while Ensuring Reliable and Resilient
Service Requires Oversight
Approaches to providing reliable service vary by state. New York, Texas and Great Britain rely on wholesale energy markets and bilateral contracts to meet demand. Independent system operators meet reliability requirements set by the state and regional transmission organizations. New York and Great Britain also run capacity markets, and Texas adds incentives on energy prices to meet target reserve margins. In each of these markets, retail service providers compete for individual or aggregated customers with regulatory oversight.
Statewide oversight can guarantee that reliability and safety requirements are rigorously met. Regardless of who serves as the primary LSE, the lights must stay on while adhering to high safety standards. As CCAs or other competitive providers become a larger portion of the electricity market, the quandary becomes who is responsible to ensure that these requirements are met for all of California’s citizens.
If a central buyer has the responsibility to maintain reserves for reliability and the liability for the safe delivery of electric service, there must be adequate compensation. This is not to suggest that the utilities are to be given unfettered ability to invest and recover costs. Rather, this precept is based on the state’s need to balance citizen interest in selecting alternate sources of electric service with its responsibility make sure the lights are kept on. If each LSE holds a fragmented responsibility, then sufficient enforcement tools must be in place to ensure everyone complies with the standards.

Draft Green Book – May 2018 57
Illinois has centralized, state procurement and planning in a multi-state grid that facilitates meeting energy demand and reliability. California has historically had centralized state procurement planning for IOUs, but not on a statewide basis.
As LSEs become more diverse, a centralized procurement process may help ensure that reliability requirements are met since all LSEs have the same legal obligations to comply with many of California’s energy policy mandates, including resource adequacy and the RPS.
Question 1: How do these choice models ensure consumer protections?
All markets ensure consumer protections through laws and/or regulations that apply to all LSEs marketing to customers.
Standardized consumer protection materials for market participants interacting with energy customers is necessary for consumers to be well-informed about the options they have available and for market participants to compete on a level playing field. The CPUC currently plays a role in adjudicating customer complaints when IOUs and customers cannot resolve billing disputes; however we do not currently have similar authority over other LSEs. Question 2: How do these choice models support development and incorporation of innovations driven by customer demand?
All markets rely on customer demand to drive innovation. In New York and Great Britain, utilities and DER market participants, or utilities alone, support innovation through ratepayer funded stipends and competitions. In Texas and Illinois, utilities are not viewed as a source for innovation; instead retail service providers are expected to develop and implement new technologies and services.
California prides itself on its advanced technologies. Over the past two decades, the Commission has established programs to encourage the growth of utility scale renewables, rooftop solar, storage and distributed generation. Going forward, California may consider whether market forces should take the place of mandates and how innovation programs should be funded. Question 3: Do these choice models ensure universal electric service?
All markets have a designated Provider of Last Resort or a process to assign a supplier of last resort. Utilities serve as providers of last resort in New York and Illinois. In Texas and Great Britain, there is a process to assign customers to a retail service provider or multiple suppliers.
Defining and designating Provider of Last Resort responsibilities is critical if a mass transition of customers becomes necessary. Electricity is a fundamental service and everyone in California should have the right to receive it. In California, the responsibility for the obligation to serve falls on the incumbent utility. In other jurisdictions that have expanded choice, the Provider of Last Resort is an essential function and providers are fully compensated.
The uncertainties of today’s market will need to be ameliorated by establishing an approach that keeps ratepayers on IOU default service indifferent to load migration while avoiding unfairly imposed costs. What if the CCAs failed to meet their requirements and the IOUs had to quickly fill the gap as the provider of last resort? Are there adequate customers remaining on IOU retail service for fair and equitable allocation of costs? Other jurisdictions have implemented different plans and structures to address this issue, which California decision-makers may wish to explore as more LSEs enter the market and customers leave their incumbent utility.
Draft Green Book – May 2018 58
Question 4: How do these choice models leverage investment necessary to finance the evolution of the electric grid?
All markets rely on a mix of ratepayer funding and private investment to finance the evolution of the grid. New York, Texas and Great Britain use market-based approaches to incentivize new generation and energy procurement (as these markets do not have centralized procurement). The Illinois model, which buys down investment risk through centralized energy procurement, is significantly different from all the other states studied.
Over time California energy policy will require significant new investment in generation. The success of the California RPS program relied largely on the larger utilities to invest in projects by raising low-cost capital in financial markets, and then recovering costs through sales of electricity. This method of financing capital projects may be in jeopardy as more and more customers leave the IOUs. There is a question whether the necessary capital investment needed to decarbonize the electric sector to meet the state’s 2030 goals and beyond can be financed and, if so, delivered on time if the state transitions away from a few larger buyers to many small buyers. Question 5: How do these choice models consider the transition of utility obligations?
Every market has a different approach to the transition of utility obligations. In some markets, utilities are system operators and do not participate in retail financial and commercial activities (reserved for retail service providers). In others, they continue to provide bundled service.
It is important to provide certainty by clearly defining roles and responsibilities for IOUs and other market participants. While the traditional vertically-integrated utility model no longer exists in California, the IOUs have made strides in transforming themselves to accommodate greater customer choice. California has opened certain portions of the utility business to competition to lower prices and to benefit ratepayers. Going forward, there are essential services that remain properly with the IOUs. Every option for expansion of choice, in California and in other jurisdictions, relies on statewide, regulated utilities to provide the backbone delivery service.
Illinois and Texas have clearly designated which aspects of the electric bill are generation and transmission and distribution. Re-examining existing cost allocation methodologies for generation and distribution rates may help the state with the transition of utility obligations.
As part of the implementation of AB 1890, the CPUC separated out the major aspects of the utility electric bill, including generation, transmission and distribution, and public purpose programs as major categories. These general categories are still in place today. It may be appropriate to re-examine if bill-related elements are in the correct category to ensure bill integrity and to promote the level of transparency achieved in other markets. Question 6: Do these choice models have competitively neutral rules among market participants?
In all markets except Texas, some form of community choice aggregation exists, and customers must opt-out from these services. Unlike California, CCAs in New York and Illinois do not compete with utility service because they procure energy through alternative retail energy suppliers.
Since the CCA procurement model in California is different than the other markets, California may need to develop its own rules to ensure competitive neutrality. The CPUC certifies CCAs plans, and there may be a need for additional monitoring to ensure continued compliance with the certification plans. Since California CCAs are different than in other markets examined, best practices may not directly transfer. It

Draft Green Book – May 2018 59
may be appropriate to “stress test” the existing rules to promote competitive neutrality under a high penetration CCA scenario to understand the impacts to both participating and non-participating customers.
In New York, Texas and Great Britain’s retail markets, regulators have promulgated a standard set of business practices to apply to retail service providers. New York has also set forth business practices for utilities and DER market participants. In Texas, pro forma tariffs ensure that all market participants can access a large market share. Standard tariffs can help ensure competitive neutral rules to access the grid.
Creating standards and/or guidelines that apply to all market participants selling energy to consumers ensures consistent application of consumer protection rules and business practices. California has established standards and processes for third parties to interconnect to the grid at the transmission and distribution level, as appropriate. There may need to be new standards and guidelines created for the new market participants to ensure a competitively neutral market landscape. Question 7: Can customers determine their level of participation and are they informed to participate at their desired level?
For the most part, customers in all markets can determine their level of participation.177 Individual customers who enroll in a retail service plan may default into standard rates when the initial contract expires. In CCA regions in New York and Illinois, customers are automatically enrolled in their CCA and the chosen retail plan, but customers may opt out and select their own retail service provider.
Choice policies can cause customers to be unwitting participants. By either creating default enrollment in new programs or designing rate structures that result in cross-subsidization among rate classes, customers who are not realizing the benefits of a particular choice can be subject to its impacts without actually making a choice.
Currently in California, CCA customers can “opt-out” from becoming a customer during the formation. Since the IOUs typically provide the billing services, the role of the CCA as service provider may be cloaked to the ratepayer. The other markets with community choice aggregation have utilized a similar structure. While there are mandatory customer contacts prior to the transfer from the IOU, many customers may not understand the ramifications.
All markets have some sort of price comparison website where customers can look at different retail service options available to them.
A state-administered neutral website, or certification of third-party websites, for customers to compare energy service options builds price transparency and facilitates customer engagement. For California, this information may be based on the Power Content Label178. As described above, there may be additional opportunities to leverage ongoing customer engagement efforts with this type of information. Question 8: How do these choice models impact and benefit local communities?
177
There are some restrictions. Depending on a few factors, such as customer location and credit status, some customers may not have certain options. In Great Britain, for example, customers on prepayment meters usually cannot choose another payment method because they live in rental housing. 178
As required by Assembly Bill 162 (2009). Additional information available online at http://www.energy.ca.gov/pcl/power_content_label.html

Draft Green Book – May 2018 60
Community energy models are emerging trends in New York and Great Britain. New York promotes REV as a source of job creation unlike other market models. Meanwhile, Illinois and Texas focus on price benefits for their customers.
CCAs have argued that having local control will yield lower rates, a greener grid, better service, more technological innovation, greater distributed resources such as BTM and more rapid response to customers’ needs. Metrics need to be established to ensure that the statewide goals are met as well.
Another key element is how the disadvantaged communities will be serviced in the absence of mandated programs with costs allocated across a broad band of customers.

Draft Green Book – May 2018 61
PART VI: Conclusion
California’s status as the 6th179 largest global economy is directly linked to its ability to embrace advanced energy technologies, maintain safe grid operations, and keep prices relatively stable, while allowing new market entrants to flourish and protecting ratepayer interests. The Commission has played a vital role in this equation by helping to advance California’s overarching policy goals with the most cost-effective energy possible. Now, as the state adapts to an electricity market transformation driven by more retail service providers and resource choices, this paper offers lessons learned from California’s own history and the experience of other markets as a way to help California policy makers address the state’s electricity future.
179
Ranking as of February 12, 2018
Draft Green Book – May 2018 62
APPENDIX I: History of Deregulation in California
Those who cannot remember the past are condemned to repeat it.180
To better understand the electricity market of today, it is necessary to briefly examine181 California’s experience with the restructuring of the market, the California Energy Crisis and its aftermath. For more than 40 years, California has firmly asserted its commitment to policies that endorse the Core Principles of affordability, decarbonization and reliability while expanding the options for customers to choose market-driven resources and competitive suppliers.
Competition in the Wholesale Market
In 1976, the California Legislature embraced the concept of opening wholesale electric competition and passed legislation allowing the IOUs to purchase electricity from “any private energy producer182 employing other than a conventional power source” which included cogeneration and renewable technologies.183 This statute opened the door to competition in the wholesale market and allowed entities other than the IOUs to provide electricity to the grid.
Two years later, following the Arab oil embargo, policy makers decided that the country needed a more diverse fuel supply for both transportation and electricity generation. Congress passed the Public Utilities Regulatory Policy Act of 1978 (PURPA)184 that required utilities to buy electricity at wholesale prices from independent generators who utilized efficient cogeneration185 or renewable186 technologies that qualified under certain eligibility rules. These independent energy producers were known as “qualifying facilities” or “QFs.” In implementing PURPA, California was able to expand on its requirement that the utilities purchase electricity from private energy producers. PURPA revolutionized the electric sector by mandating that these purchases had to be at the utility’s “avoided cost” and that the generators were guaranteed access to the transmission grid to deliver power. “Avoided cost” was defined as the price that the utilities would pay for power “but, for” the QF 187 (in an effort to keep ratepayers indifferent). Congress also recognized that the states had the expertise and knowledge to establish the utilities’ avoided cost.
Equally important, the CPUC formulated and adopted long-term power purchase agreements (PPAs), known as “standard offers”, that the vertically-integrated IOUs could enter into with third party QFs. The key element of a standard offer included long-term capacity payments with 10-year fixed energy prices, which permitted private capital investment to be secured by the guarantee of a revenue stream and
180
George Santayana, Reason in Common Sense, p. 284 181
As there have been many treatises and books discussing this, the paper will only present the highlights 182
A “private energy producer” was an entity other than the investor-owned utility. 183
“Conventional power source” means power derived from nuclear energy or the operation of a hydropower facility greater than 30 megawatts or the combustion of fossil fuel, unless cogeneration technology, as defined in Section 25134 of the Public Resources Codes, is employed in the production of such power. Public Utilities Code Section 2805. 184
16 U.S. Code Chapter 46, Section 2601 et.seq. implanted by regulations in 18 CFR Part 292 et. seq 185
Cogeneration uses a single fuel source to either sequentially or simultaneously produce electric energy as well as another
form of energy, such as heat or steam. Background on Electricity Policy – California Senate Energy, Utilities and Communication
Committee 186
Renewable technologies were solar, wind, biomass, geothermal and small hydroelectric power. Ibid. 187
18 CFR 292.601(b)(6)

Draft Green Book – May 2018 63
backed by the creditworthiness of the IOU balance sheet. Under this regulatory approach, QFs built 10,000 MWs of competitive supply, one-half of which was renewable188 and the other half was cogeneration. 189
Implementation of PURPA demonstrated that privately-owned generation could be built and financed in the state. California established itself as a leader in electric sector innovation and its regulatory framework became a model.
By the early 1990’s, pressure increased to open up the electric sector to allow for competition in both purchase and supply, which advocates argued would drive down rates, help stimulate investment and spur economic growth. Momentum grew for the proposition that the electric power industry was no longer a natural monopoly and should be deregulated. This would allow competitive markets to determine prices as in the telecommunications, transportation and natural gas industries. In 1992, Congress passed the Energy Policy Act (EPAct)190 which opened access of the transmission networks to independent energy producers and allowed them to enter into bilateral transactions with third parties. EPAct further facilitated the development of the competitive market by creating another category of generators known as exempt wholesale generators (EWGs)191 who were not subject to public utility regulation.
During an economic recession, customers, particularly the large industrials through their trade groups, California Large Energy Consumers Association (CLECA) and California Manufacturing and Technology Association (CMTA), began complaining about the increased cost of electricity and its adverse impact on California’s business climate. Pressure mounted to allow customers to bypass the IOUs bundled service and purchase electricity directly from suppliers. There was opposition to opening the market from consumer groups who feared that there would be less protection for customers, environmental organizations who felt it could diminish the possibility for energy efficiency and renewables and labor unions that had a stake in continuing the vertically-integrated utility model.192 The utilities saw their monopoly threatened and blamed the high rates on the first competitive market participants, the QF contracts, over-generation and debt equivalency.193
The Yellow and Blue Books
In February 1993, the CPUC’s Division of Strategic Planning194 issued California’s Electric Services Industry: Perspectives on the Past, Strategies for the Future known as the “Yellow Book.” The impetus was to assess the state of electric sector regulation along with growing demand for a fully competitive market for generation and retail services. The study provided the Commission and interested parties with an examination of a range of regulatory strategies designed to better align the state's regulatory program with California's dynamic and increasingly competitive electric services industry. The Yellow Book reached two conclusions: 195
188
At the time, California was the world leader for installed renewable capacity. 189
To meet the PURPA requirements, cogenerators deployed new fossil generating technology that increased efficiencies over the simple cycle utility-owned generating stations. 190
The Energy Policy Act, effective October 24, 1992 (102nd
Congress. H.R. 776, ENR) 191
Public Utilities Code 216(g) and (h) 192
M. Peevey and D.Wittenberg, California Goes Green (2017), p. 58 193
“Debt equivalency” is a term used by credit analysts to describe the debt-like financial obligations resulting from signing long-term contracts. An Introduction to Debt Equivalency, Maryam Ghadessi, CPUC Policy & Planning Division, August 4, 2017 194
The predecessor to the Policy and Planning Division 195
Yellow Book, p.140

Draft Green Book – May 2018 64
1. California’s regulatory framework, significant portions of which were developed under circumstances that no longer existed, was ill suited to govern the electric services industry at that time.
2. The state’s existing regulatory approach was incompatible with the industry structure likely to emerge in the coming decades.
The report identified the following flaws in the regulatory program at that time, stating that it:196
a. Blunted incentives for efficient utility operations; b. Increased the potential for inefficient investment due to unbalanced incentives when
choosing among resource options; c. Required many complex proceedings, which increase administrative costs and threaten
the quality of public participation and Commission decisions; d. Offered utility management limited incentives and flexibility to respond to competitive
pressures; and e. Conflicted with the Commission’s policy of encouraging competition in the electric
services industry.
Because of the findings in the Yellow Book, the CPUC undertook formal proceedings to restructure and reform the regulation of the electric services industry for both retail customers and wholesale generation sales by third parties and issued the “Blue Book”197 in 1994. After extensive public hearings and workshops, the CPUC proposed a two-track program that would 1) replace traditional cost-of-service regulation with performance-based regulation and 2) implement customer choice through Direct Access.198 The underlying objective was to lower the cost of electric service to California’s residential and business consumers without sacrificing the utilities’ financial integrity.199 The Commission proposed to have Direct Access start with nonresidential retail customers and to open the competitive market for generation services by January 1, 1996 followed by all consumers before January 1, 2002. The intention was to put forward the Commission’s views for further public review and comment prior to adoption to mitigate adverse consequences such as compromising universal service.
The Blue Book established a strategy for restructuring California’s electric industry by opening up Direct Access for customers to voluntarily obtain generation services from non-utility providers while ensuring that the utility 1) was kept financially solvent; 2) could serve as the provider of last resort for all consumers and 3) provided distribution, system control and coordination and other ancillary services.200 At the same time, customers could procure electricity from non-utility service providers who were given access to the grid on a nondiscriminatory basis.201 With the Blue Book, the CPUC recommended a far-reaching restructuring of the electric sector and ushered in retail and wholesale competition to the California electricity market. This was a direct hit on the concept of vertically-integrated utilities and cost-of-service rate regulation, while opening the door to implementation of forward-looking policies. To implement this groundbreaking concept, the CPUC initiated proceedings with extensive stakeholder meetings and processes to gather widespread input.
196
Yellow Book, p. 141 197
R.94-04-031 and I. 94-04-032 198
Blue Book, p. 57 199
Blue Book, p. 1 200
Blue Book, pp. 29-40 201
Blue Boo, p. 31
Draft Green Book – May 2018 65
The CPUC’s Restructuring Proceedings: R. 94-04-031 & I. 94-04-032
The Commission issued several key decisions in its proceedings that address myriad aspects about how to evolve California’s electric sector from one dominated by the utilities to a fully competitive open market. In revisiting these decisions, the essential elements of today’s market are revealed. However, as discussed below, certain actions led to catastrophic consequences during the California Energy Crisis.
Decision 95-12-063: Preferred Policy Decision.202 The decision issued in December 1995 envisioned a future in which customers would have choice among competing generation providers, and where traditional cost-of-service regulation would be replaced by performance-based ratemaking (PBR). The implementation date was set for January 1, 1998.
The highlights of this proceeding were:
Customer choice: On a phased-in basis beginning simultaneously with the creation of a wholesale spot market, customers would be offered a broad array of service choices including Direct Access to competitive generation and bilateral contracts. Customers could remain as full-service customers of the IOUs with a choice of rate plans. Further, it allowed for aggregation of small commercial and residential customers.
Market Structure: The CPUC reaffirmed its conviction that the vertically-integrated electric utility is not compatible with a competitive market for electricity. Essential to this market was the creation of a transparent, visible spot market for electric generation with operating control over all transmission assets divested from the IOUs and placed in the hands of an Independent System Operator (ISO) 203. The ISO would operate the combined transmission assets as a single statewide grid. It would coordinate the daily scheduling and dispatch activities of all market participants to meet open nondiscriminatory access to the grid while preserving reliability and achieving the lowest total cost for all users of the transmission system. The ISO would take no market position nor have an economic interest in any load or generation. Its coordination functions would focus on the short-term, including the facilitation of day-ahead scheduling and hourly dispatch in order to balance the system with respect to transmission constraints. The Commission adopted the creation of a spot market pool that would be operated by the Power Exchange (PX). IOUs would be required to bid for all of their generation with the PX for five years and could seek recovery of stranded generation assets and power purchase liabilities during that time. All other buyers and sellers could participate voluntarily.
Regulation: The decision established an objective of replacing cost-of-service regulation with performance-based ratemaking (PBR)204 that would allow the IOUs flexibility while encouraging reduction in operational costs, increased service quality and improved productivity. Under the new market structure utilizing PBR, the Commission retained oversight of the utility distribution system and utility-owned generation during the transition period.
202
64 CPUC 2d p. 1 (1995) 203
Now known as the California Independent System Operator (CAISO) 204
Performance-based ratemaking measures utility performance against established benchmarks. Superior performance above the benchmark receives financial rewards while poor performance results in financial penalties to shareholders.
Draft Green Book – May 2018 66
Market Power: To avoid impeding the development of a competitive market, the Preferred Policy Decision adopted features to mitigate against vertical and horizontal market power. Besides establishing the ISO and PX, the Commission found that an incentive for voluntary divestiture of utility generation assets, particularly fossil fuel plants, should be included as part of any transition cost collection mechanism.
Transition costs & Utility Asset Divestiture: The CPUC acknowledged that opening the competitive market could result in the utility being unable to completely recover the costs of its facilities and power purchases in the restructured market. Therefore, the Commission established the Competition Transition Charge (CTC) to collect those costs in a competitively neutral manner that was fair to the various ratepayer classes without increasing rates. The CTC would be applied to all retail customers, whether they continued to take bundled utility service or pursue Direct Access options. Customers would be protected against rate increases through the imposition of a rate cap. To create a competitive wholesale market, the CPUC incentivized the divestiture of utility-owned assets by imposing a 10% reduction on IOU recovery rates if they retained more than 50% of their fossil generation plants.
Public Purpose Programs: The decision recognized that utility involvement in programs designed to achieve social goals was essential in a restructured market. At the same time, the CPUC understood that requiring the IOUs to continue to shoulder the costs could put them at a competitive disadvantage in a market-based, customer-oriented electric service industry and might not be sustainable. As many of these programs were legislatively mandated, the Commission maintained the status quo pending direction from the legislature and input from stakeholders. Public purpose programs included: low-income ratepayer assistance, economic development initiatives, diversity in IOU procurement, demand-side management, resource diversity and renewable resource programs, low-emissions vehicles and other research, development and demonstration efforts.205
Decision 96-03-032: Roadmap.206 Three months later, the Commission adopted an “interim order” for the restructuring policies and designated a “roadmap” to implement the Decision 95-12-063 by January 1, 1998. Laying out a procedural plan, the Commission focused on the tasks that were necessary to implement the transition. The Commission stated,
“We must ensure that all vital issues are addressed in a logical fashion and in a way that maximizes the efficient use of both our staff and stakeholders’ resources.”207
Working groups were established that consisted of staff from the Commission and other agencies to coordinate stakeholder engagement. All of the elements listed above from the Preferred Policy Decision were addressed methodically to develop a comprehensive plan that would address all facets of the electric industry restructure and with due process.
205
Many of these programs still exist and have been expanded. 206
65 CPUC 2d 228 207
Ibid., p. 232
Draft Green Book – May 2018 67
Assembly Bill (AB) 1890 – The Electric Utility Industry Restructuring Act
As the CPUC proceeded to develop a restructuring plan in a comprehensive and methodical way, business customers – commercial and industrial, wholesale generators and prospective retail marketers – clamored for a quicker pace than the incremental implementation plan proposed by the Commission.
In 1995, Assemblymember Jim Brulte introduced AB 1890 (Chapter 854, 1996) to restructure the California electricity market and open it to competition at a faster pace. Consumer advocates, environmentalists and labor groups opposed the bill because of the lack of customer protections, energy efficiency and renewable goals. The IOUs expressed concern about their inability to recover already incurred costs. As chair of the Senate Utilities and Commerce Committee at the time, Senator Steve Peace led the effort to move the bill the forward. After two unexpected blackouts and extensive negotiations, the provisions needed to pass the bill were ironed out in lengthy negotiating sessions. In September 1996, Governor Pete Wilson signed AB 1890 into law. 208 Many of the CPUC’s ideas and decisions for the restructured market were included in the bill along with new concepts designed to accelerate the process and, in some instances, circumvent the CPUC. 209
The fundamental elements of AB 1890 were:
Transition Cost Recovery: IOUs were granted the ability to recover costs for prior investments that might not otherwise be paid in a restructured electricity market. Known as “stranded assets”, the costs incurred based on the utilities’ obligation to serve on an exclusive basis would be recovered on an accelerated basis through a non-bypassable Competition Transition Charge (CTC) paid by all consumers based on the amount of electricity consumed. Furthermore, the utilities were permitted to securitize a portion of the CTC over 10 years which allowed customer savings without creating debt or liability for the state.210
The bill also included an immediate 10% rate reduction for IOU residential and small commercial customers with savings of no less than 20% by Spring 2002.
Market Structure: To facilitate a competitive market “free of monopoly power with transparent market prices, where customers could choose competing providers while continuing to receive reliable power,” the bill created the California Independent System Operator (CAISO) and Power Exchange along with an Energy Oversight Board.211
208
In D. 96-12-088, the Commission examined the impact of AB 1890 on its Preferred Policy Decision and determined its impact on key elements: 1) Market power mitigation required a careful scrutiny of the IOU FERC filings and a finding that 50% voluntary divestiture of PG&E’s and Edison’s fossil fuel generation with the associated financial incentive is an adequate starting point; 2) Direct Access is the foundation of competition including registration of energy service providers; 3) Consumer protection and education including low-income customers remained critical prior to the transition; 4) Public purpose programs funding must be incorporated into the ratesetting/unbundling proceeding to have those costs identified on all customer bills; 5) Rate freeze caps cannot be exceeded by the sum of all rate components such as generation, transmission, distribution, CTC and public purpose programs; and 6) Reliability remains essential as a Commission function even with establishment of the CAISO. Additionally, the mandatory buy-sell requirement was not inconsistent with AB 1890 but given an end date. The Commission would continue to ensure that utility rates are just and reasonable. 209
In Decision 96-12-087 (70 CPUC 2d 497, 1996), the Commission found that “its policy decision was largely replicated in AB 1890, by which the state legislature codified the restructuring plan. Because AB 1890 provides for a somewhat quicker transition to retail competition, the commission finds that certain new procedures are necessary.” 210
The bill also allowed recovery of utility employee costs incurred because of restructuring. Ibid. 3 211
The CAISO is the sole survivor of these entities.

Draft Green Book – May 2018 68
The CAISO was given authority to provide centralized control of the statewide transmission grid and charged with ensuring the efficient use and reliable operation of the transmission system. Significantly, all electric utilities (IOUs and municipals) were to commit control of their transmission facilities to the CAISO rather than have independent control.
The Power Exchange was charged with providing an open and nondiscriminatory electric energy auction. The Energy Oversight Board was established to oversee the two boards and to “broadly represent” California electric users and providers.212 The CAISO and Power Exchange started operating on March 31, 1998.
System Reliability: Most importantly, the lights needed to be kept on. The CAISO, supported by the CPUC and with FERC authorization, was charged with maintaining system reliability by obtaining sufficient generation and transmission resources.
To reduce the potential for system-wide outages,213 the CAISO and CPUC were instructed to adopt inspection, maintenance, repair and replacement standards for the grid.214
Public Goods Programs: AB 1890 preserved California’s efforts to develop diverse, environmentally sound resources that enhanced system reliability. The bill also included support for research development for technology innovation and to protect low-income consumers, including:
$1 billion for CPUC-program funding for energy efficiency, energy conservation and demand-side management and for continued investment in technologies that create environmental benefits;
Continued low-income customer financial assistance administered by the CPUC; and
$540 million annually devoted to renewable resources.
Consumer Protection: The bill required all sellers, marketers and aggregators of electricity to residential and small commercial customers to register and be subject to CPUC regulatory and enforcement authority.215 Additionally, California residential and small commercial electricity consumers were to be provided with:
o Sufficient and reliable information to be able to compare offerings; and o Mechanisms, such as public disclosure and complaint procedures, to protect
themselves against unfair or abusive marketing practices including “anti-slamming” rules.
The California Energy Crisis
In the beginning, California’s market design yielded an active market for both wholesale and retail transactions, with low prices and a variety of customer choices for all consumers. Implementation of AB
212
Both the Power Exchange and Energy Oversight Board are no longer in existence. 213
Such as those that occurred on July 2, 1996 and August 10, 1996. 214
General Order 167 215
Ibid. p. 6
Draft Green Book – May 2018 69
1890 by the CPUC allowed direct-access transactions to occur between customers and electricity service providers. By the end of the first year of Direct Access, the IOUs saw retail sales losses of nearly 13%. The rest of the customers remained bundled with the utility.
The CAISO and Power Exchange became the main vehicle for wholesale transactions rather than the IOUs. Divestiture of the IOUs’ gas-generating facilities opened the power supply to competition.216 Providers from across the nation entered the now open customer-wide competitive retail market with a variety of products such as Green Mountain Energy with an emphasis on renewable generation.217 The lights stayed on and prices declined at the beginning.
In the summer of 2000, however, a perfect storm of events occurred which precipitated the California Energy Crisis. As prices skyrocketed on the newly formed competitive market, electricity supply shortages occurred which led to unexpected blackouts and mandated rolling brownouts.
The primary factors contributing to the crisis were considered to be: 1) freeze on retail prices; 2) restriction on long-term contracts; and 3) a flawed original market design of the CAISO and Power Exchange in the enabling authority. 218
Other contributing factors included, but were not limited to:
Historically high temperatures combined with low hydro availability;
Demand for energy exceeded generation capacity;
Aging fleet of generators that needed modernization;
Sale of natural gas utility assets to third parties;
Market manipulation by retail and wholesale providers: o Purchasers of IOU-divested fossil generation intentionally withheld supply o Marketer-created grid congestion on major inter/intrastate transmission lines
Price caps in the wholesale market prevented energy prices to fluctuate with market; and
Rapidly increasing natural gas prices quickly erased savings. o Prices rose from $40/MWh in Spring 1998 to $250/MWh by the end of 2000. There
are estimates that the utilities lost between $12 and $14 billion.
These conditions caused significant financial harm to the three IOUs and brought them to the brink of bankruptcy. While PG&E declared bankruptcy, the CPUC worked with Southern California Edison and San Diego Gas & Electric to avoid doing so but both utilities paid a high price. Investor confidence eroded and California was viewed as a risky place to do business. The utilities suffered a credit downgrade, which made capital even more expensive and harder to obtain.
California’s Response to the Energy Crisis
By January 2001, Governor Gray Davis declared a State of Emergency. The Governor, Legislature and CPUC acted quickly to empower the California Department of Water Resources (CDWR) as the central electricity procurement entity. CDWR entered into long-term power purchase contracts that were backed by the state’s credit for the IOUs. Unfortunately, for the state’s consumers, these contracts were
216
The utilities’ retained ownership of nuclear and hydro assets. Purchasers included newly form entities that were primarily subsidiaries of utilities in other states: Mirant, Duke, NRG Energy and Dynegy 217
Energy marketers and service providers, such as Enron and Dynegy, headquartered mainly in Houston entered the California wholesale and retail energy markets. 218
CBO: Causes and Lessons of the California Energy Crisis
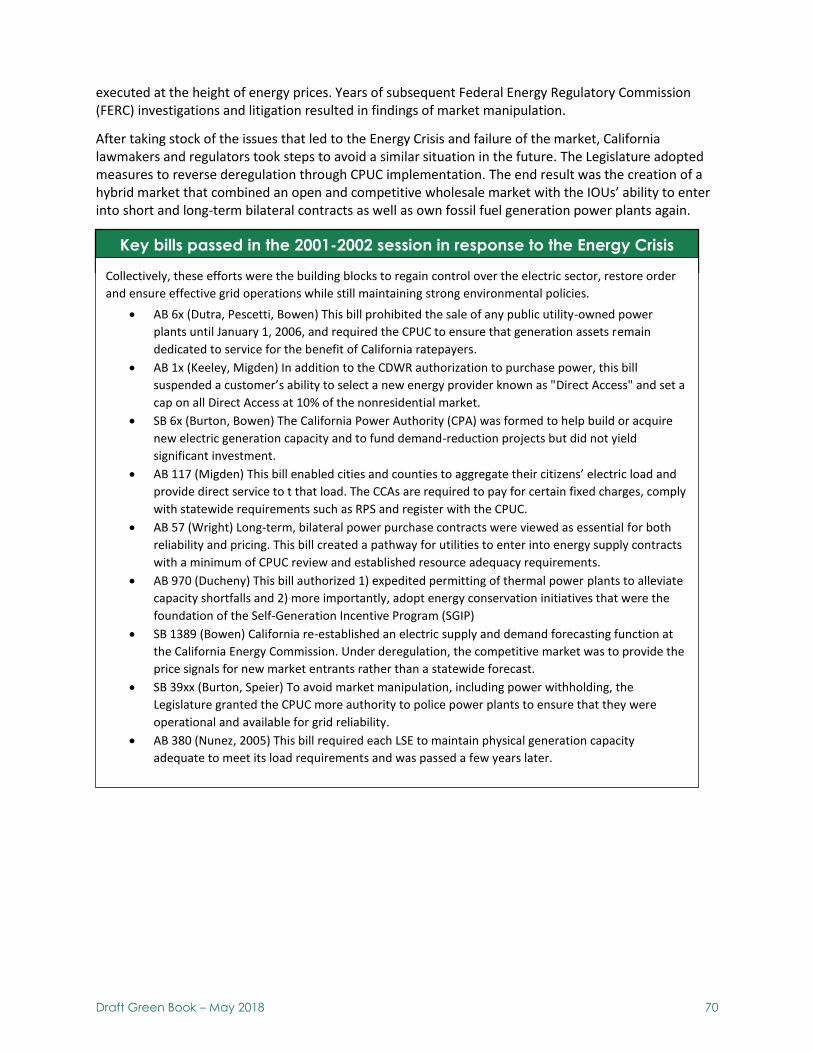
Draft Green Book – May 2018 70
executed at the height of energy prices. Years of subsequent Federal Energy Regulatory Commission (FERC) investigations and litigation resulted in findings of market manipulation.
After taking stock of the issues that led to the Energy Crisis and failure of the market, California lawmakers and regulators took steps to avoid a similar situation in the future. The Legislature adopted measures to reverse deregulation through CPUC implementation. The end result was the creation of a hybrid market that combined an open and competitive wholesale market with the IOUs’ ability to enter into short and long-term bilateral contracts as well as own fossil fuel generation power plants again.
Key bills passed in the 2001-2002 session in response to the Energy Crisis
Collectively, these efforts were the building blocks to regain control over the electric sector, restore order
and ensure effective grid operations while still maintaining strong environmental policies.
AB 6x (Dutra, Pescetti, Bowen) This bill prohibited the sale of any public utility-owned power
plants until January 1, 2006, and required the CPUC to ensure that generation assets remain
dedicated to service for the benefit of California ratepayers.
AB 1x (Keeley, Migden) In addition to the CDWR authorization to purchase power, this bill
suspended a customer’s ability to select a new energy provider known as "Direct Access" and set a
cap on all Direct Access at 10% of the nonresidential market.
SB 6x (Burton, Bowen) The California Power Authority (CPA) was formed to help build or acquire
new electric generation capacity and to fund demand-reduction projects but did not yield
significant investment.
AB 117 (Migden) This bill enabled cities and counties to aggregate their citizens’ electric load and
provide direct service to t that load. The CCAs are required to pay for certain fixed charges, comply
with statewide requirements such as RPS and register with the CPUC.
AB 57 (Wright) Long-term, bilateral power purchase contracts were viewed as essential for both
reliability and pricing. This bill created a pathway for utilities to enter into energy supply contracts
with a minimum of CPUC review and established resource adequacy requirements.
AB 970 (Ducheny) This bill authorized 1) expedited permitting of thermal power plants to alleviate
capacity shortfalls and 2) more importantly, adopt energy conservation initiatives that were the
foundation of the Self-Generation Incentive Program (SGIP)
SB 1389 (Bowen) California re-established an electric supply and demand forecasting function at
the California Energy Commission. Under deregulation, the competitive market was to provide the
price signals for new market entrants rather than a statewide forecast.
SB 39xx (Burton, Speier) To avoid market manipulation, including power withholding, the
Legislature granted the CPUC more authority to police power plants to ensure that they were
operational and available for grid reliability.
AB 380 (Nunez, 2005) This bill required each LSE to maintain physical generation capacity
adequate to meet its load requirements and was passed a few years later.
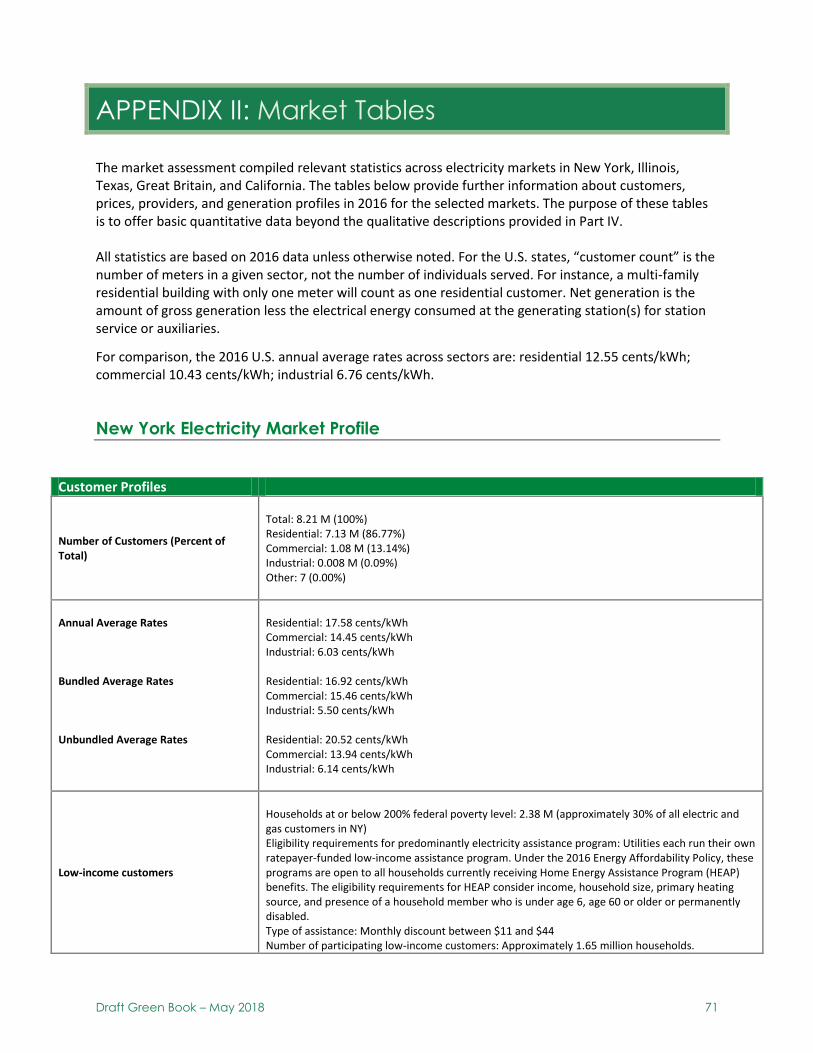
Draft Green Book – May 2018 71
APPENDIX II: Market Tables
The market assessment compiled relevant statistics across electricity markets in New York, Illinois, Texas, Great Britain, and California. The tables below provide further information about customers, prices, providers, and generation profiles in 2016 for the selected markets. The purpose of these tables is to offer basic quantitative data beyond the qualitative descriptions provided in Part IV. All statistics are based on 2016 data unless otherwise noted. For the U.S. states, “customer count” is the number of meters in a given sector, not the number of individuals served. For instance, a multi-family residential building with only one meter will count as one residential customer. Net generation is the amount of gross generation less the electrical energy consumed at the generating station(s) for station service or auxiliaries.
For comparison, the 2016 U.S. annual average rates across sectors are: residential 12.55 cents/kWh; commercial 10.43 cents/kWh; industrial 6.76 cents/kWh.
New York Electricity Market Profile
Customer Profiles
Number of Customers (Percent of Total)
Total: 8.21 M (100%) Residential: 7.13 M (86.77%) Commercial: 1.08 M (13.14%) Industrial: 0.008 M (0.09%) Other: 7 (0.00%)
Annual Average Rates Bundled Average Rates Unbundled Average Rates
Residential: 17.58 cents/kWh Commercial: 14.45 cents/kWh Industrial: 6.03 cents/kWh Residential: 16.92 cents/kWh Commercial: 15.46 cents/kWh Industrial: 5.50 cents/kWh Residential: 20.52 cents/kWh Commercial: 13.94 cents/kWh Industrial: 6.14 cents/kWh
Low-income customers
Households at or below 200% federal poverty level: 2.38 M (approximately 30% of all electric and gas customers in NY) Eligibility requirements for predominantly electricity assistance program: Utilities each run their own ratepayer-funded low-income assistance program. Under the 2016 Energy Affordability Policy, these programs are open to all households currently receiving Home Energy Assistance Program (HEAP) benefits. The eligibility requirements for HEAP consider income, household size, primary heating source, and presence of a household member who is under age 6, age 60 or older or permanently disabled. Type of assistance: Monthly discount between $11 and $44 Number of participating low-income customers: Approximately 1.65 million households.
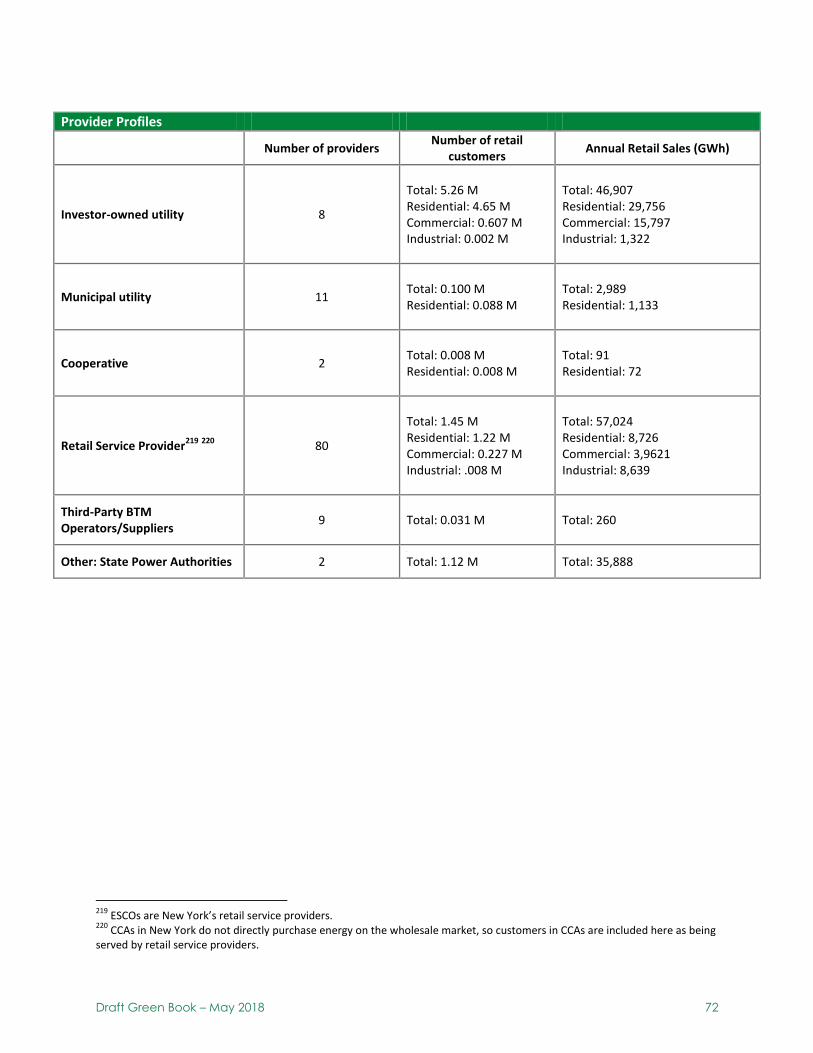
Draft Green Book – May 2018 72
Provider Profiles
Number of providers Number of retail
customers Annual Retail Sales (GWh)
Investor-owned utility 8
Total: 5.26 M Residential: 4.65 M Commercial: 0.607 M Industrial: 0.002 M
Total: 46,907 Residential: 29,756 Commercial: 15,797 Industrial: 1,322
Municipal utility 11
Total: 0.100 M Residential: 0.088 M
Total: 2,989 Residential: 1,133
Cooperative 2
Total: 0.008 M Residential: 0.008 M
Total: 91 Residential: 72
Retail Service Provider219
220
80
Total: 1.45 M Residential: 1.22 M Commercial: 0.227 M Industrial: .008 M
Total: 57,024 Residential: 8,726 Commercial: 3,9621 Industrial: 8,639
Third-Party BTM Operators/Suppliers
9 Total: 0.031 M Total: 260
Other: State Power Authorities 2 Total: 1.12 M Total: 35,888
219
ESCOs are New York’s retail service providers. 220
CCAs in New York do not directly purchase energy on the wholesale market, so customers in CCAs are included here as being served by retail service providers.
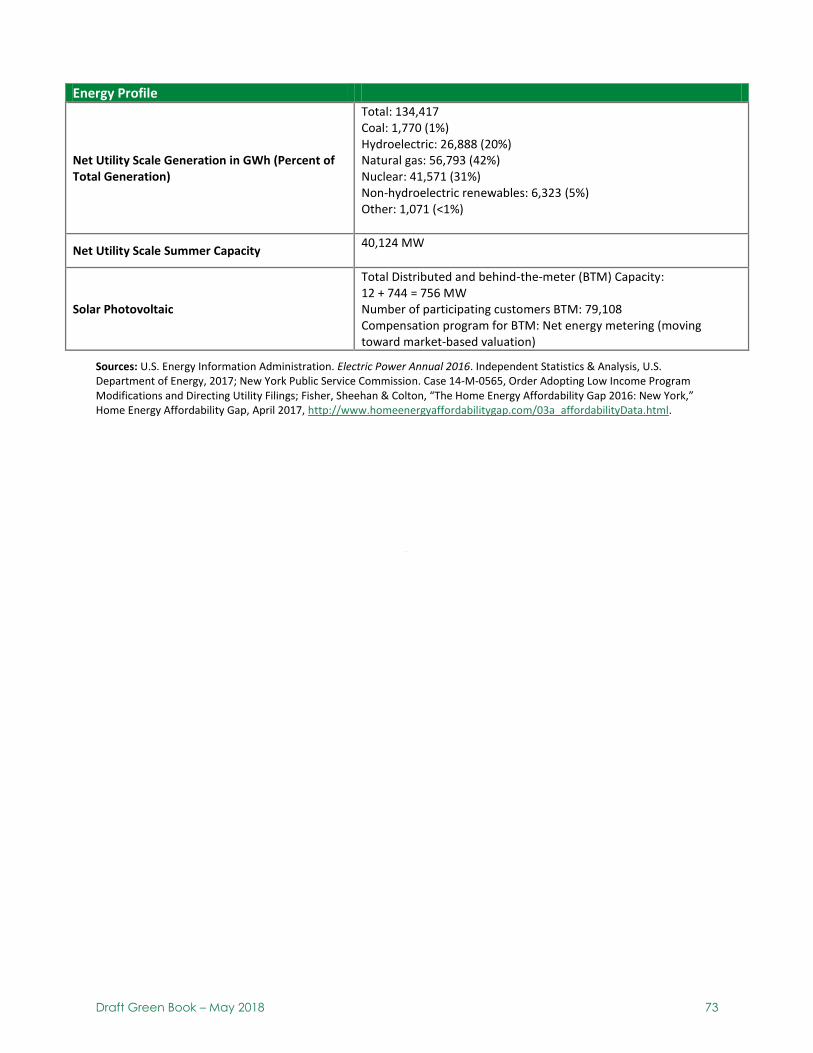
Draft Green Book – May 2018 73
Energy Profile
Net Utility Scale Generation in GWh (Percent of Total Generation)
Total: 134,417 Coal: 1,770 (1%) Hydroelectric: 26,888 (20%) Natural gas: 56,793 (42%) Nuclear: 41,571 (31%) Non-hydroelectric renewables: 6,323 (5%) Other: 1,071 (<1%)
Net Utility Scale Summer Capacity 40,124 MW
Solar Photovoltaic
Total Distributed and behind-the-meter (BTM) Capacity: 12 + 744 = 756 MW Number of participating customers BTM: 79,108 Compensation program for BTM: Net energy metering (moving toward market-based valuation)
Sources: U.S. Energy Information Administration. Electric Power Annual 2016. Independent Statistics & Analysis, U.S. Department of Energy, 2017; New York Public Service Commission. Case 14-M-0565, Order Adopting Low Income Program Modifications and Directing Utility Filings; Fisher, Sheehan & Colton, “The Home Energy Affordability Gap 2016: New York,” Home Energy Affordability Gap, April 2017, http://www.homeenergyaffordabilitygap.com/03a_affordabilityData.html.
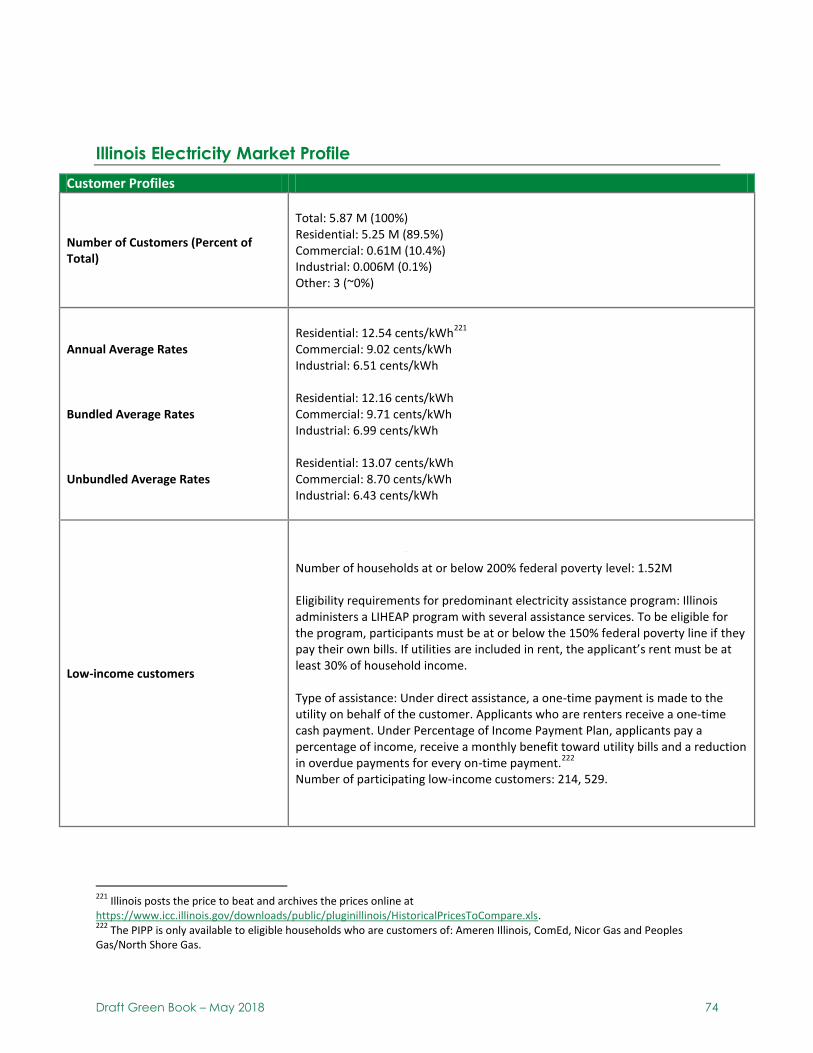
Draft Green Book – May 2018 74
Illinois Electricity Market Profile
Customer Profiles
Number of Customers (Percent of Total)
Total: 5.87 M (100%) Residential: 5.25 M (89.5%) Commercial: 0.61M (10.4%) Industrial: 0.006M (0.1%) Other: 3 (~0%)
Annual Average Rates Bundled Average Rates Unbundled Average Rates
Residential: 12.54 cents/kWh
221
Commercial: 9.02 cents/kWh Industrial: 6.51 cents/kWh Residential: 12.16 cents/kWh Commercial: 9.71 cents/kWh Industrial: 6.99 cents/kWh Residential: 13.07 cents/kWh Commercial: 8.70 cents/kWh Industrial: 6.43 cents/kWh
Low-income customers
Number of households at or below 200% federal poverty level: 1.52M Eligibility requirements for predominant electricity assistance program: Illinois administers a LIHEAP program with several assistance services. To be eligible for the program, participants must be at or below the 150% federal poverty line if they pay their own bills. If utilities are included in rent, the applicant’s rent must be at least 30% of household income. Type of assistance: Under direct assistance, a one-time payment is made to the utility on behalf of the customer. Applicants who are renters receive a one-time cash payment. Under Percentage of Income Payment Plan, applicants pay a percentage of income, receive a monthly benefit toward utility bills and a reduction in overdue payments for every on-time payment.
222
Number of participating low-income customers: 214, 529.
221
Illinois posts the price to beat and archives the prices online at https://www.icc.illinois.gov/downloads/public/pluginillinois/HistoricalPricesToCompare.xls. 222
The PIPP is only available to eligible households who are customers of: Ameren Illinois, ComEd, Nicor Gas and Peoples Gas/North Shore Gas.

Draft Green Book – May 2018 75
Provider Profiles
Number of providers Number of retail customers Annual Retail Sales (GWh)
Investor-owned utility 4
Total: 2.96 M Residential: 2.69 M Commercial: 0.268 M Industrial: <0.001 M
Total: 35,536 Residential: 21,116 Commercial: 11,810 Industrial: 2,609
Municipal utility 12
Total: 0.206 M Residential: 0.178 M
Total: 5,613 Residential: 1,778
Cooperative 21
Total: 0.280 M Residential: 0.258 M
Total: 6,195 Residential: 3,397
Municipal Energy Aggregator
571 communities are MEAs, and receive their retail service from 9 Retail Service Providers
included in Retail Service Provider total below
included in Retail Service Provider total below
Retail Service Provider 67
Total: 2.27 M Residential: 2.12 M Commercial: 0.151 M Industrial: 0.001 M
Total: 89,165 Residential: 19,176 Commercial: 54,216 Industrial: 15,087
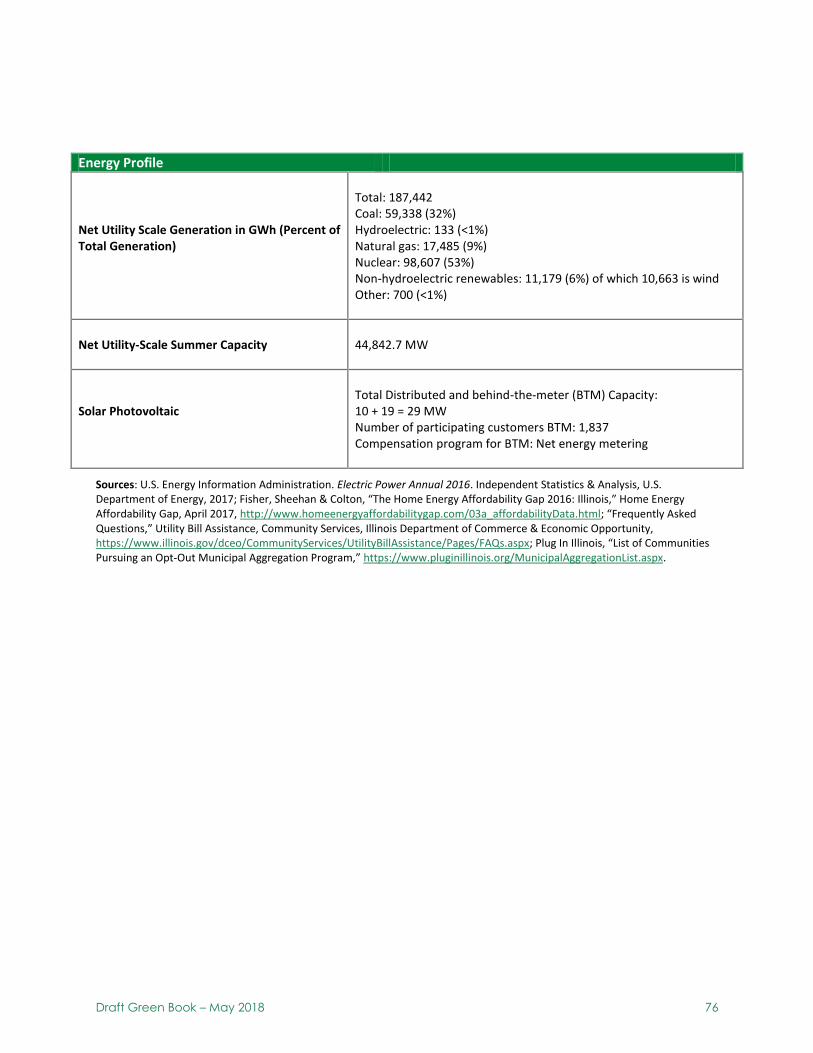
Draft Green Book – May 2018 76
Energy Profile
Net Utility Scale Generation in GWh (Percent of Total Generation)
Total: 187,442 Coal: 59,338 (32%) Hydroelectric: 133 (<1%) Natural gas: 17,485 (9%) Nuclear: 98,607 (53%) Non-hydroelectric renewables: 11,179 (6%) of which 10,663 is wind Other: 700 (<1%)
Net Utility-Scale Summer Capacity 44,842.7 MW
Solar Photovoltaic
Total Distributed and behind-the-meter (BTM) Capacity: 10 + 19 = 29 MW Number of participating customers BTM: 1,837 Compensation program for BTM: Net energy metering
Sources: U.S. Energy Information Administration. Electric Power Annual 2016. Independent Statistics & Analysis, U.S. Department of Energy, 2017; Fisher, Sheehan & Colton, “The Home Energy Affordability Gap 2016: Illinois,” Home Energy Affordability Gap, April 2017, http://www.homeenergyaffordabilitygap.com/03a_affordabilityData.html; “Frequently Asked Questions,” Utility Bill Assistance, Community Services, Illinois Department of Commerce & Economic Opportunity, https://www.illinois.gov/dceo/CommunityServices/UtilityBillAssistance/Pages/FAQs.aspx; Plug In Illinois, “List of Communities Pursuing an Opt-Out Municipal Aggregation Program,” https://www.pluginillinois.org/MunicipalAggregationList.aspx.

Draft Green Book – May 2018 77
Texas Electricity Market Profile
Customer Profiles
Number of Customers (Percent of Total)
Total: 12.1 M (100%) Residential: 10.6 M (87.2%) Commercial: 1.45 M (11.9%) Industrial: 0.103 M (0.85%) Other: 3 (~0%)
Annual Average Rates (w/o munis and coops) Average Rates in ERCOT (w/o munis and coops) Average Rates in non-ERCOT (w/o munis and coops)
Residential: 10.99 (11.19) cents/kWh Commercial: 8.26 (7.97) cents/kWh Industrial: 5.33 (5.01) cents/kWh Residential: 11.05 (11.34) cents/kWh Commercial: 8.30 (8.00) cents/kWh Industrial: 5.33 (5.05) cents/kWh Residential: 10.55 (10.22) cents/kWh Commercial: 7.99 (7.79) cents/kWh Industrial: 5.33 (4.88) cents/kWh
Low-income customers
Number of households at or below 200% federal poverty level: 3.45 M Eligibility requirements for predominantly electricity assistance program: Low-income programs offered by Retail Electric Providers
223 on a voluntary
basis. REPs partner with organizations listed with 2-1-1 Texas offering Electric Service Payment Assistance (~500 entities across the state) to disburse the collected funds. Customers who are enrolled in SNAP or Medicaid are eligible to receive Electric Service Payment Assistance. Type of assistance: As of August 31 2016, Texas no longer offers rate reduction program (LITE-UP) to low-income customers.
224 As of August 31,
2017, Texas also no longer offers low-income customers to receive other protections such as late fee waivers and ability to pay deposits in installments. Number of participating low-income customers: About 700,000
households
relied on the LITE-UP program in 2015.
223
Retail Electric Providers (REPs) are Texas’ retail service providers. 224
In the 2016 fiscal year, $325.5M of appropriated funds reduced customer bills by 25-31%.

Draft Green Book – May 2018 78
Provider Profiles
Number of providers
Number of retail customers
Annual Retail Sales (GWh)
Investor-owned utility (non-ERCOT)
4 IOUs in non-ERCOT region still provide retail service.
Total: (1.21 M) Residential: (1.02 M) Commercial: (0.174 M) Industrial: (0.099 M)
Total: (45,329) Residential: (12,449) Commercial: (13,773) Industrial: (19,106)
Municipal utility ERCOT (non-ERCOT)
21 (3) Total: 1.71 M (0.112 M) Residential: 1.52 M (0.096 M)
Total: 47,128 (2,794) Residential: 19,008 (1,072)
Cooperative ERCOT (non-ERCOT)
46 (20) Total:1.81 M (0.377 M) Residential: 1.56 M (0.290 M)
Total: 40,477 (8,683) Residential: 23,002 (3,888)
Retail Service Provider, all in ERCOT
86225
Total: 6.75 M Residential: 5.95 M Commercial: 0.774 M Industrial: 0.029 M
Total: 244,242 Residential: 85,143 Commercial: 90,730 Industrial: 68,187
Third-Party BTM Operators/Suppliers
3 Total: 4,894 Total: 61
225
While 2016 EIA Form EIA-861 data only lists 86 REPs, Report to the 85th Texas Legislature on the Scope of Competition in Electric Markets in Texas states as of Sept 2016, 109 REPs were operating in ERCOT.
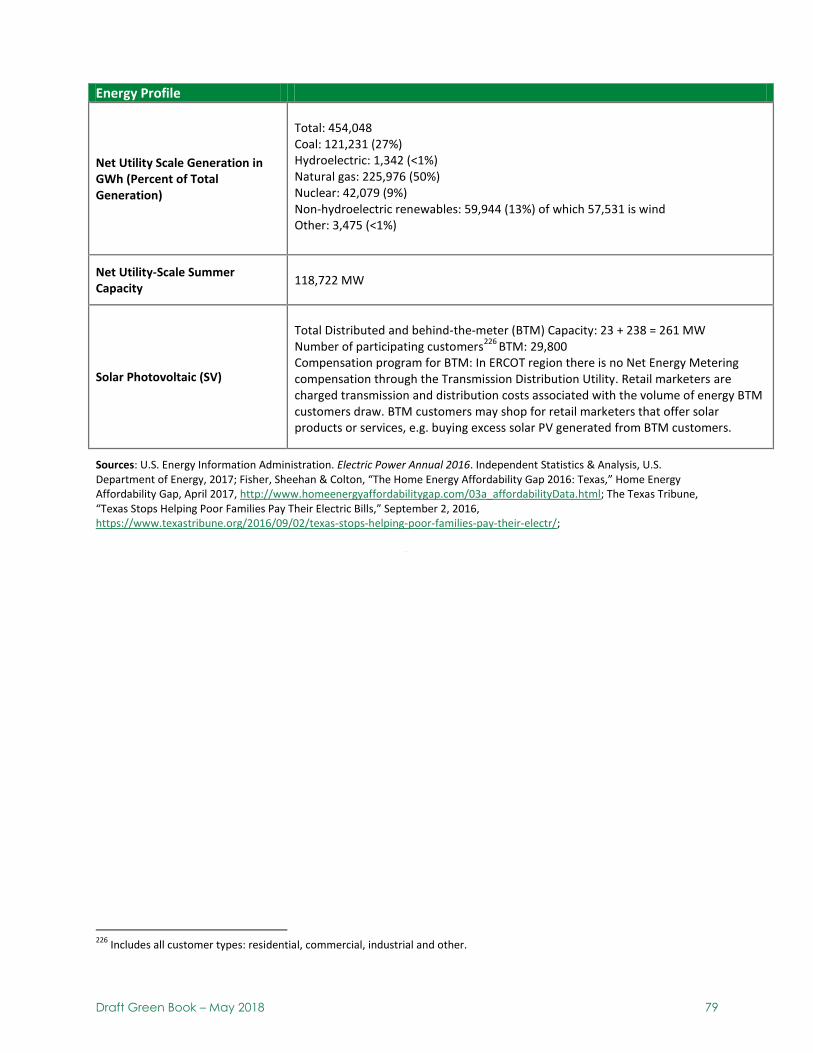
Draft Green Book – May 2018 79
Energy Profile
Net Utility Scale Generation in GWh (Percent of Total Generation)
Total: 454,048 Coal: 121,231 (27%) Hydroelectric: 1,342 (<1%) Natural gas: 225,976 (50%) Nuclear: 42,079 (9%) Non-hydroelectric renewables: 59,944 (13%) of which 57,531 is wind Other: 3,475 (<1%)
Net Utility-Scale Summer Capacity
118,722 MW
Solar Photovoltaic (SV)
Total Distributed and behind-the-meter (BTM) Capacity: 23 + 238 = 261 MW Number of participating customers
226 BTM: 29,800
Compensation program for BTM: In ERCOT region there is no Net Energy Metering compensation through the Transmission Distribution Utility. Retail marketers are charged transmission and distribution costs associated with the volume of energy BTM customers draw. BTM customers may shop for retail marketers that offer solar products or services, e.g. buying excess solar PV generated from BTM customers.
Sources: U.S. Energy Information Administration. Electric Power Annual 2016. Independent Statistics & Analysis, U.S. Department of Energy, 2017; Fisher, Sheehan & Colton, “The Home Energy Affordability Gap 2016: Texas,” Home Energy Affordability Gap, April 2017, http://www.homeenergyaffordabilitygap.com/03a_affordabilityData.html; The Texas Tribune, “Texas Stops Helping Poor Families Pay Their Electric Bills,” September 2, 2016, https://www.texastribune.org/2016/09/02/texas-stops-helping-poor-families-pay-their-electr/;
226
Includes all customer types: residential, commercial, industrial and other.
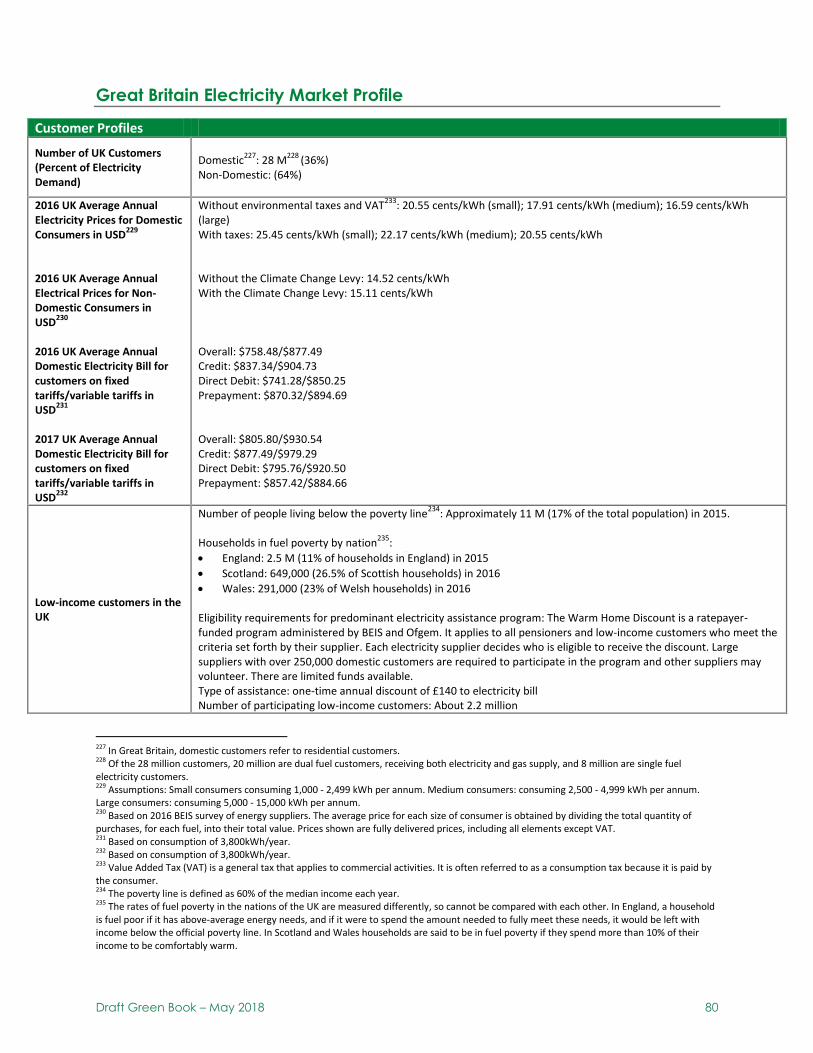
Draft Green Book – May 2018 80
Great Britain Electricity Market Profile
227 In Great Britain, domestic customers refer to residential customers. 228 Of the 28 million customers, 20 million are dual fuel customers, receiving both electricity and gas supply, and 8 million are single fuel electricity customers. 229 Assumptions: Small consumers consuming 1,000 - 2,499 kWh per annum. Medium consumers: consuming 2,500 - 4,999 kWh per annum. Large consumers: consuming 5,000 - 15,000 kWh per annum. 230 Based on 2016 BEIS survey of energy suppliers. The average price for each size of consumer is obtained by dividing the total quantity of purchases, for each fuel, into their total value. Prices shown are fully delivered prices, including all elements except VAT. 231 Based on consumption of 3,800kWh/year. 232 Based on consumption of 3,800kWh/year. 233 Value Added Tax (VAT) is a general tax that applies to commercial activities. It is often referred to as a consumption tax because it is paid by the consumer. 234 The poverty line is defined as 60% of the median income each year. 235 The rates of fuel poverty in the nations of the UK are measured differently, so cannot be compared with each other. In England, a household is fuel poor if it has above-average energy needs, and if it were to spend the amount needed to fully meet these needs, it would be left with income below the official poverty line. In Scotland and Wales households are said to be in fuel poverty if they spend more than 10% of their income to be comfortably warm.
Customer Profiles
Number of UK Customers (Percent of Electricity Demand)
Domestic
227: 28 M
228 (36%)
Non-Domestic: (64%)
2016 UK Average Annual Electricity Prices for Domestic Consumers in USD
229
2016 UK Average Annual Electrical Prices for Non-Domestic Consumers in USD
230
2016 UK Average Annual Domestic Electricity Bill for customers on fixed tariffs/variable tariffs in USD
231
2017 UK Average Annual Domestic Electricity Bill for customers on fixed tariffs/variable tariffs in USD
232
Without environmental taxes and VAT233
: 20.55 cents/kWh (small); 17.91 cents/kWh (medium); 16.59 cents/kWh (large) With taxes: 25.45 cents/kWh (small); 22.17 cents/kWh (medium); 20.55 cents/kWh Without the Climate Change Levy: 14.52 cents/kWh With the Climate Change Levy: 15.11 cents/kWh Overall: $758.48/$877.49 Credit: $837.34/$904.73 Direct Debit: $741.28/$850.25 Prepayment: $870.32/$894.69 Overall: $805.80/$930.54 Credit: $877.49/$979.29 Direct Debit: $795.76/$920.50 Prepayment: $857.42/$884.66
Low-income customers in the UK
Number of people living below the poverty line234
: Approximately 11 M (17% of the total population) in 2015. Households in fuel poverty by nation
235:
England: 2.5 M (11% of households in England) in 2015
Scotland: 649,000 (26.5% of Scottish households) in 2016
Wales: 291,000 (23% of Welsh households) in 2016 Eligibility requirements for predominant electricity assistance program: The Warm Home Discount is a ratepayer-funded program administered by BEIS and Ofgem. It applies to all pensioners and low-income customers who meet the criteria set forth by their supplier. Each electricity supplier decides who is eligible to receive the discount. Large suppliers with over 250,000 domestic customers are required to participate in the program and other suppliers may volunteer. There are limited funds available. Type of assistance: one-time annual discount of £140 to electricity bill Number of participating low-income customers: About 2.2 million
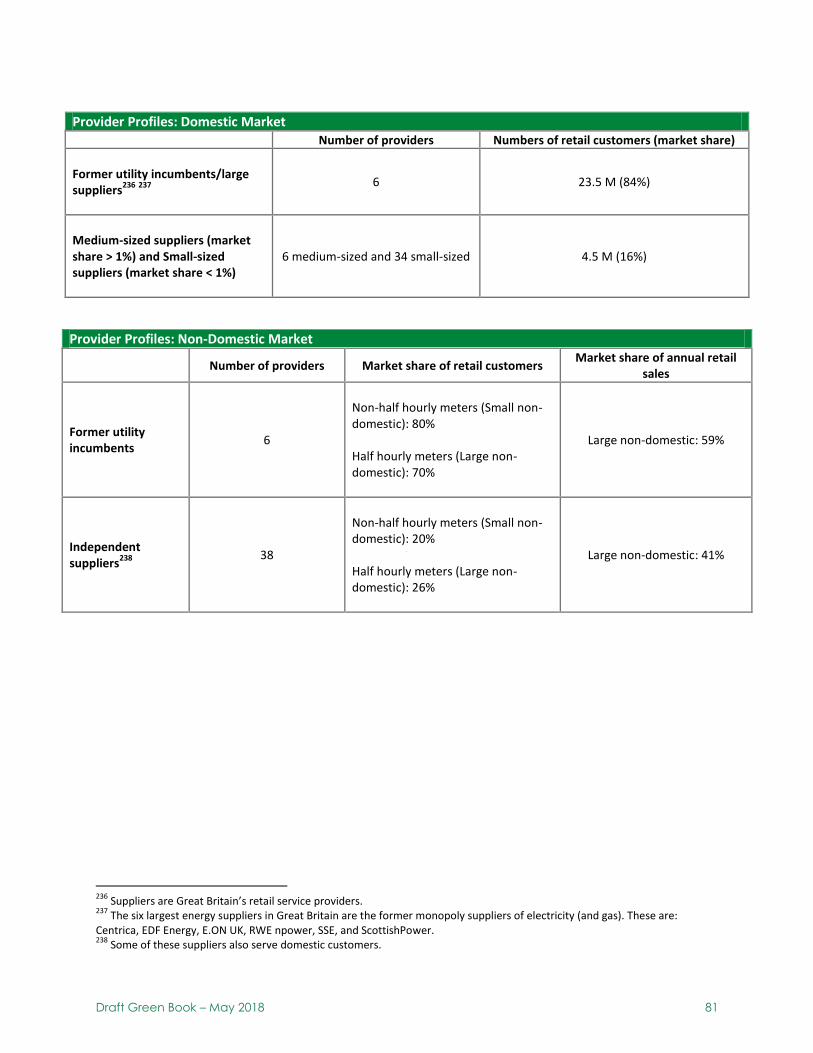
Draft Green Book – May 2018 81
Provider Profiles: Domestic Market Number of providers Numbers of retail customers (market share)
Former utility incumbents/large suppliers
236 237
6 23.5 M (84%)
Medium-sized suppliers (market share > 1%) and Small-sized suppliers (market share < 1%)
6 medium-sized and 34 small-sized 4.5 M (16%)
Provider Profiles: Non-Domestic Market
Number of providers Market share of retail customers Market share of annual retail
sales
Former utility incumbents
6
Non-half hourly meters (Small non-domestic): 80% Half hourly meters (Large non-domestic): 70%
Large non-domestic: 59%
Independent suppliers
238
38
Non-half hourly meters (Small non-domestic): 20% Half hourly meters (Large non-domestic): 26%
Large non-domestic: 41%
236
Suppliers are Great Britain’s retail service providers. 237
The six largest energy suppliers in Great Britain are the former monopoly suppliers of electricity (and gas). These are: Centrica, EDF Energy, E.ON UK, RWE npower, SSE, and ScottishPower. 238
Some of these suppliers also serve domestic customers.
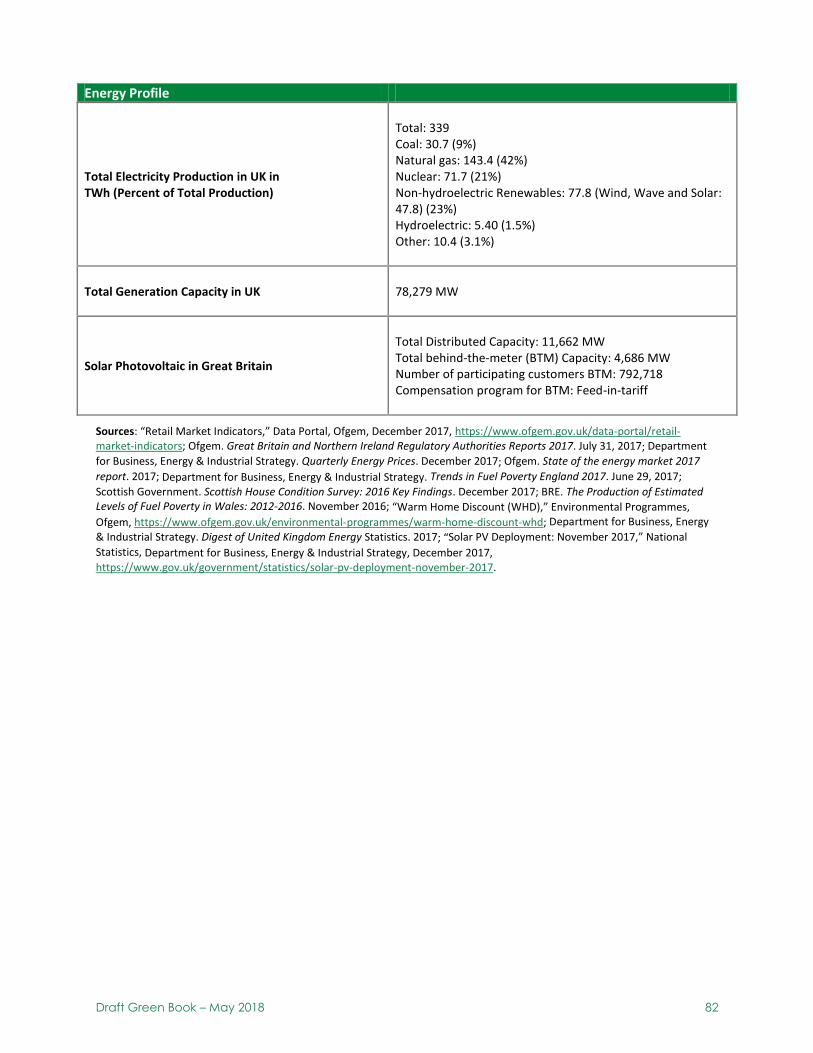
Draft Green Book – May 2018 82
Energy Profile
Total Electricity Production in UK in TWh (Percent of Total Production)
Total: 339 Coal: 30.7 (9%) Natural gas: 143.4 (42%) Nuclear: 71.7 (21%) Non-hydroelectric Renewables: 77.8 (Wind, Wave and Solar: 47.8) (23%) Hydroelectric: 5.40 (1.5%) Other: 10.4 (3.1%)
Total Generation Capacity in UK 78,279 MW
Solar Photovoltaic in Great Britain
Total Distributed Capacity: 11,662 MW Total behind-the-meter (BTM) Capacity: 4,686 MW Number of participating customers BTM: 792,718 Compensation program for BTM: Feed-in-tariff
Sources: “Retail Market Indicators,” Data Portal, Ofgem, December 2017, https://www.ofgem.gov.uk/data-portal/retail-market-indicators; Ofgem. Great Britain and Northern Ireland Regulatory Authorities Reports 2017. July 31, 2017; Department
for Business, Energy & Industrial Strategy. Quarterly Energy Prices. December 2017; Ofgem. State of the energy market 2017
report. 2017; Department for Business, Energy & Industrial Strategy. Trends in Fuel Poverty England 2017. June 29, 2017;
Scottish Government. Scottish House Condition Survey: 2016 Key Findings. December 2017; BRE. The Production of Estimated Levels of Fuel Poverty in Wales: 2012-2016. November 2016; “Warm Home Discount (WHD),” Environmental Programmes,
Ofgem, https://www.ofgem.gov.uk/environmental-programmes/warm-home-discount-whd; Department for Business, Energy
& Industrial Strategy. Digest of United Kingdom Energy Statistics. 2017; “Solar PV Deployment: November 2017,” National
Statistics, Department for Business, Energy & Industrial Strategy, December 2017, https://www.gov.uk/government/statistics/solar-pv-deployment-november-2017.
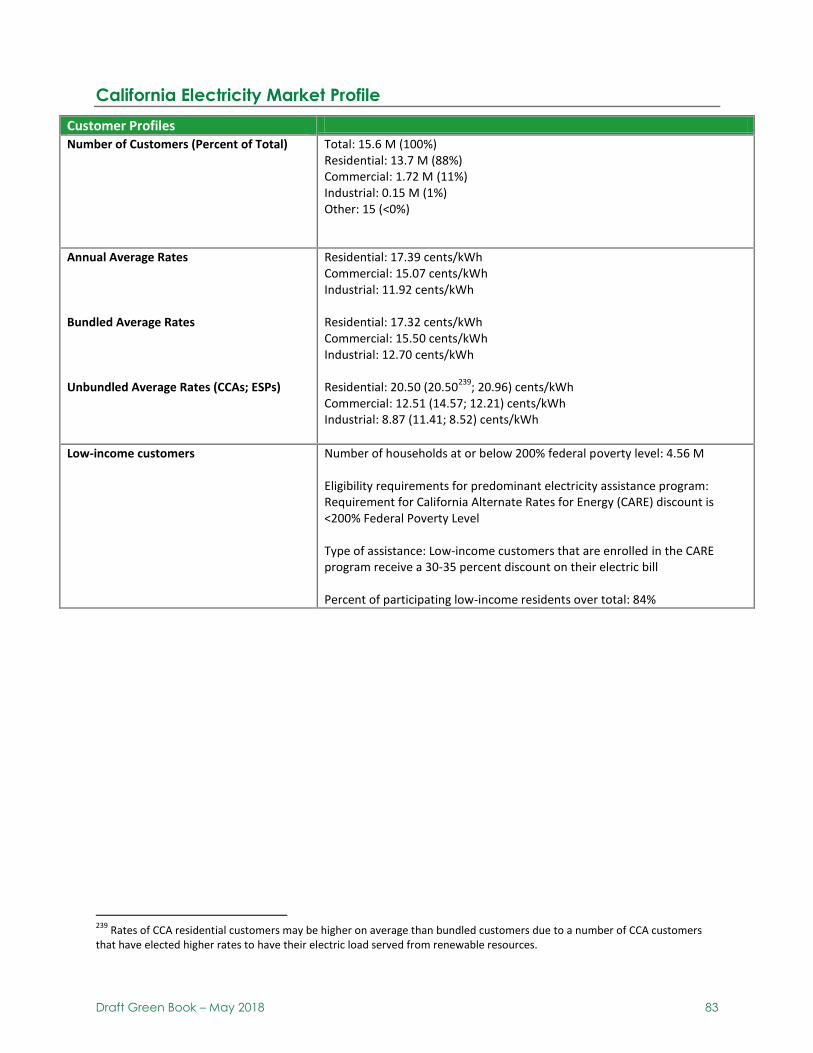
Draft Green Book – May 2018 83
California Electricity Market Profile
Customer Profiles
Number of Customers (Percent of Total) Total: 15.6 M (100%) Residential: 13.7 M (88%) Commercial: 1.72 M (11%) Industrial: 0.15 M (1%) Other: 15 (<0%)
Annual Average Rates Bundled Average Rates Unbundled Average Rates (CCAs; ESPs)
Residential: 17.39 cents/kWh Commercial: 15.07 cents/kWh Industrial: 11.92 cents/kWh Residential: 17.32 cents/kWh Commercial: 15.50 cents/kWh Industrial: 12.70 cents/kWh Residential: 20.50 (20.50
239; 20.96) cents/kWh
Commercial: 12.51 (14.57; 12.21) cents/kWh Industrial: 8.87 (11.41; 8.52) cents/kWh
Low-income customers Number of households at or below 200% federal poverty level: 4.56 M Eligibility requirements for predominant electricity assistance program: Requirement for California Alternate Rates for Energy (CARE) discount is <200% Federal Poverty Level Type of assistance: Low-income customers that are enrolled in the CARE program receive a 30-35 percent discount on their electric bill Percent of participating low-income residents over total: 84%
239
Rates of CCA residential customers may be higher on average than bundled customers due to a number of CCA customers that have elected higher rates to have their electric load served from renewable resources.
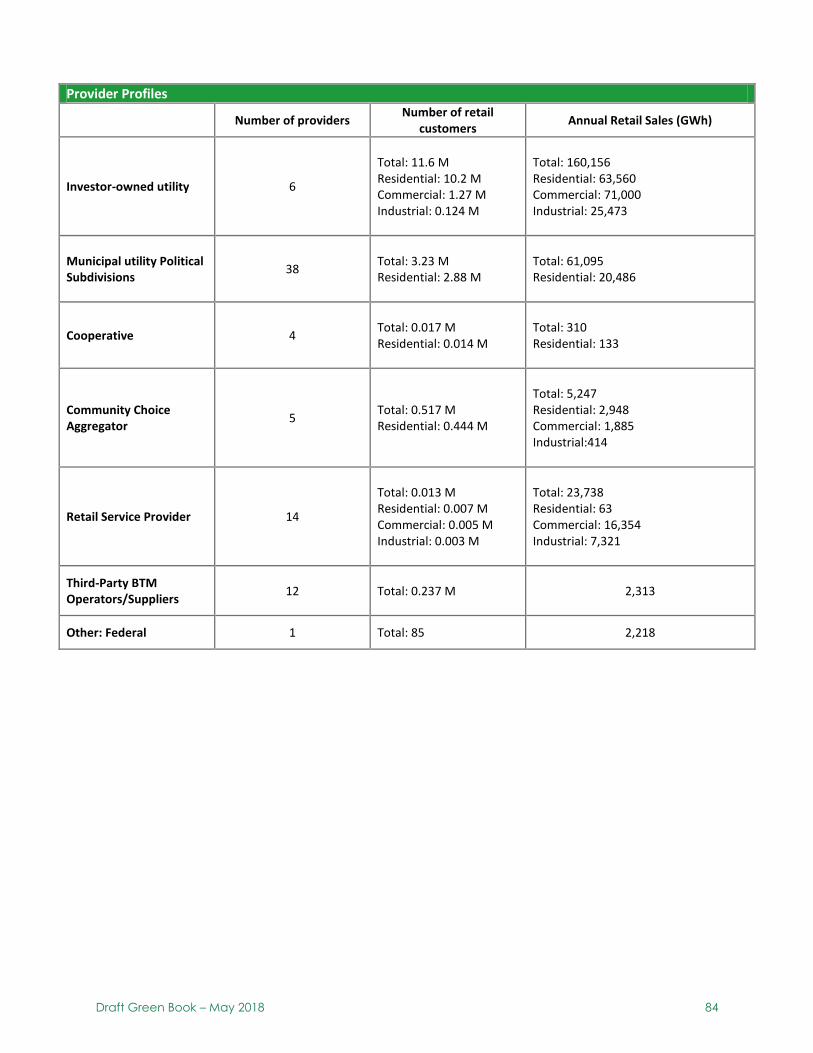
Draft Green Book – May 2018 84
Provider Profiles
Number of providers Number of retail
customers Annual Retail Sales (GWh)
Investor-owned utility 6
Total: 11.6 M Residential: 10.2 M Commercial: 1.27 M Industrial: 0.124 M
Total: 160,156 Residential: 63,560 Commercial: 71,000 Industrial: 25,473
Municipal utility Political Subdivisions
38
Total: 3.23 M Residential: 2.88 M
Total: 61,095 Residential: 20,486
Cooperative 4
Total: 0.017 M Residential: 0.014 M
Total: 310 Residential: 133
Community Choice Aggregator
5 Total: 0.517 M Residential: 0.444 M
Total: 5,247 Residential: 2,948 Commercial: 1,885 Industrial:414
Retail Service Provider 14
Total: 0.013 M Residential: 0.007 M Commercial: 0.005 M Industrial: 0.003 M
Total: 23,738 Residential: 63 Commercial: 16,354 Industrial: 7,321
Third-Party BTM Operators/Suppliers
12 Total: 0.237 M 2,313
Other: Federal 1 Total: 85 2,218
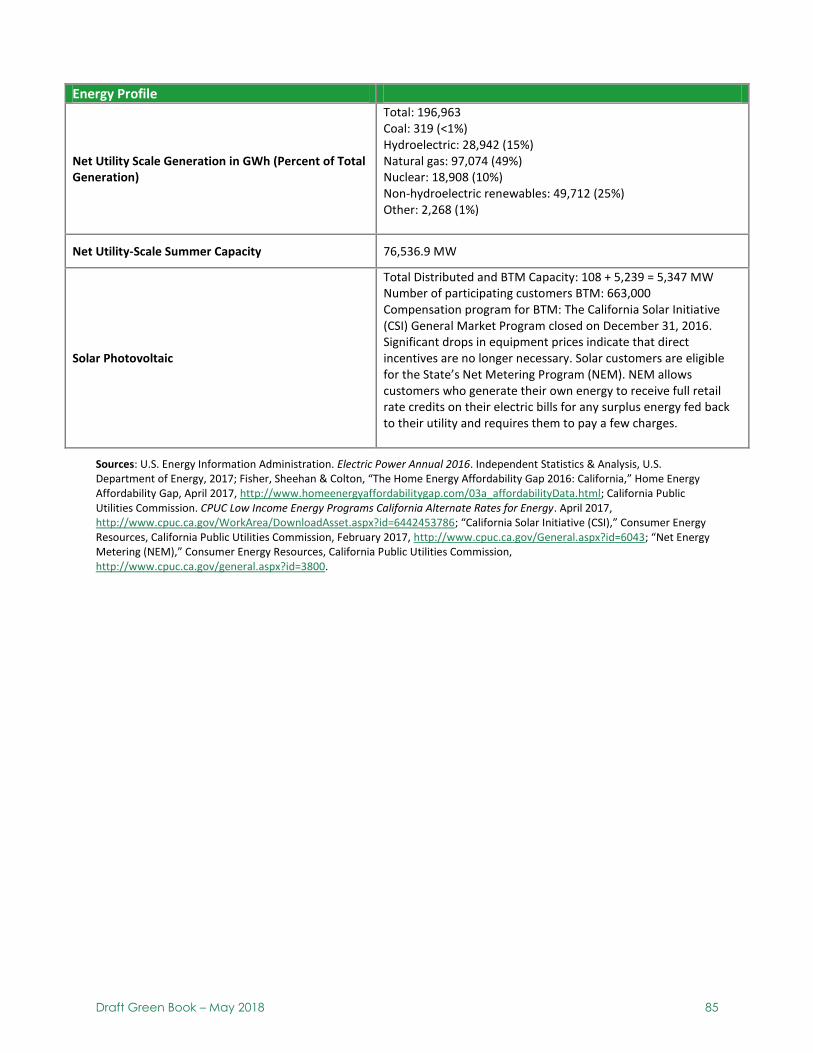
Draft Green Book – May 2018 85
Energy Profile
Net Utility Scale Generation in GWh (Percent of Total Generation)
Total: 196,963 Coal: 319 (<1%) Hydroelectric: 28,942 (15%) Natural gas: 97,074 (49%) Nuclear: 18,908 (10%) Non-hydroelectric renewables: 49,712 (25%) Other: 2,268 (1%)
Net Utility-Scale Summer Capacity 76,536.9 MW
Solar Photovoltaic
Total Distributed and BTM Capacity: 108 + 5,239 = 5,347 MW Number of participating customers BTM: 663,000 Compensation program for BTM: The California Solar Initiative (CSI) General Market Program closed on December 31, 2016. Significant drops in equipment prices indicate that direct incentives are no longer necessary. Solar customers are eligible for the State’s Net Metering Program (NEM). NEM allows customers who generate their own energy to receive full retail rate credits on their electric bills for any surplus energy fed back to their utility and requires them to pay a few charges.
Sources: U.S. Energy Information Administration. Electric Power Annual 2016. Independent Statistics & Analysis, U.S. Department of Energy, 2017; Fisher, Sheehan & Colton, “The Home Energy Affordability Gap 2016: California,” Home Energy Affordability Gap, April 2017, http://www.homeenergyaffordabilitygap.com/03a_affordabilityData.html; California Public Utilities Commission. CPUC Low Income Energy Programs California Alternate Rates for Energy. April 2017, http://www.cpuc.ca.gov/WorkArea/DownloadAsset.aspx?id=6442453786; “California Solar Initiative (CSI),” Consumer Energy Resources, California Public Utilities Commission, February 2017, http://www.cpuc.ca.gov/General.aspx?id=6043; “Net Energy Metering (NEM),” Consumer Energy Resources, California Public Utilities Commission, http://www.cpuc.ca.gov/general.aspx?id=3800.
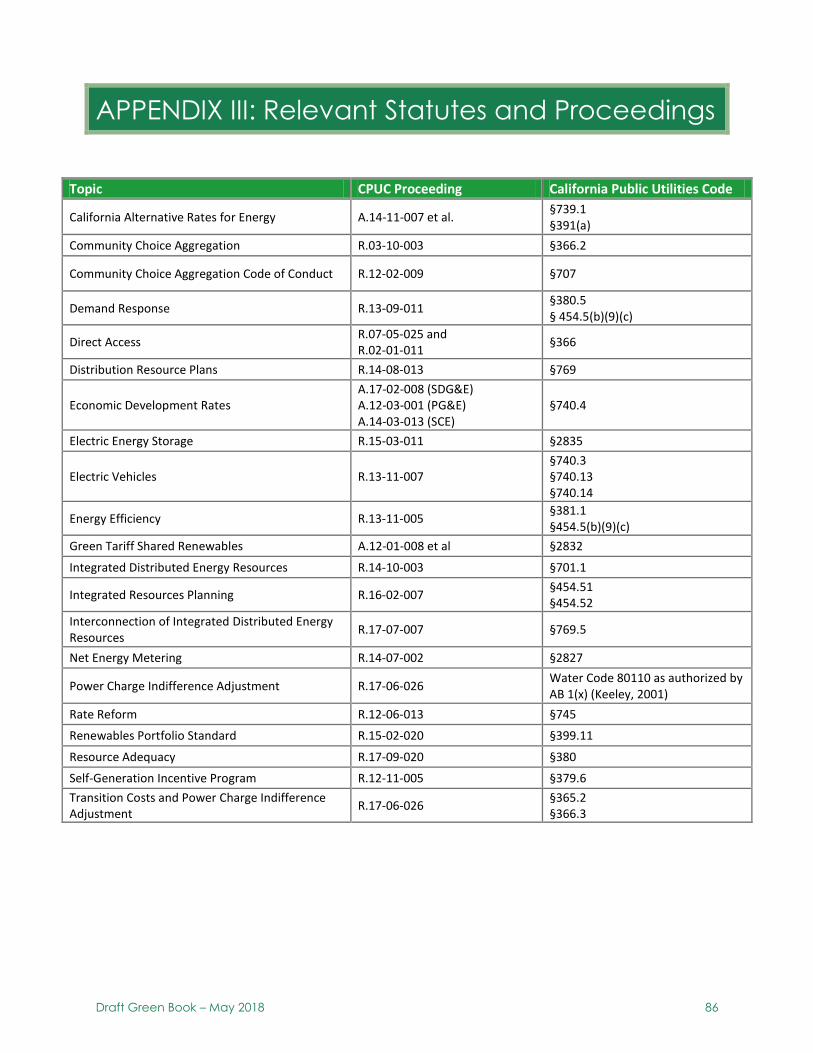
Draft Green Book – May 2018 86
APPENDIX III: Relevant Statutes and Proceedings
Topic CPUC Proceeding California Public Utilities Code
California Alternative Rates for Energy A.14-11-007 et al. §739.1 §391(a)
Community Choice Aggregation R.03-10-003 §366.2
Community Choice Aggregation Code of Conduct R.12-02-009 §707
Demand Response R.13-09-011 §380.5 § 454.5(b)(9)(c)
Direct Access R.07-05-025 and R.02-01-011
§366
Distribution Resource Plans R.14-08-013 §769
Economic Development Rates A.17-02-008 (SDG&E) A.12-03-001 (PG&E) A.14-03-013 (SCE)
§740.4
Electric Energy Storage R.15-03-011 §2835
Electric Vehicles R.13-11-007 §740.3 §740.13 §740.14
Energy Efficiency R.13-11-005 §381.1 §454.5(b)(9)(c)
Green Tariff Shared Renewables A.12-01-008 et al §2832
Integrated Distributed Energy Resources R.14-10-003 §701.1
Integrated Resources Planning R.16-02-007 §454.51 §454.52
Interconnection of Integrated Distributed Energy Resources
R.17-07-007 §769.5
Net Energy Metering R.14-07-002 §2827
Power Charge Indifference Adjustment R.17-06-026 Water Code 80110 as authorized by AB 1(x) (Keeley, 2001)
Rate Reform R.12-06-013 §745
Renewables Portfolio Standard R.15-02-020 §399.11
Resource Adequacy R.17-09-020 §380
Self-Generation Incentive Program R.12-11-005 §379.6
Transition Costs and Power Charge Indifference Adjustment
R.17-06-026 §365.2 §366.3
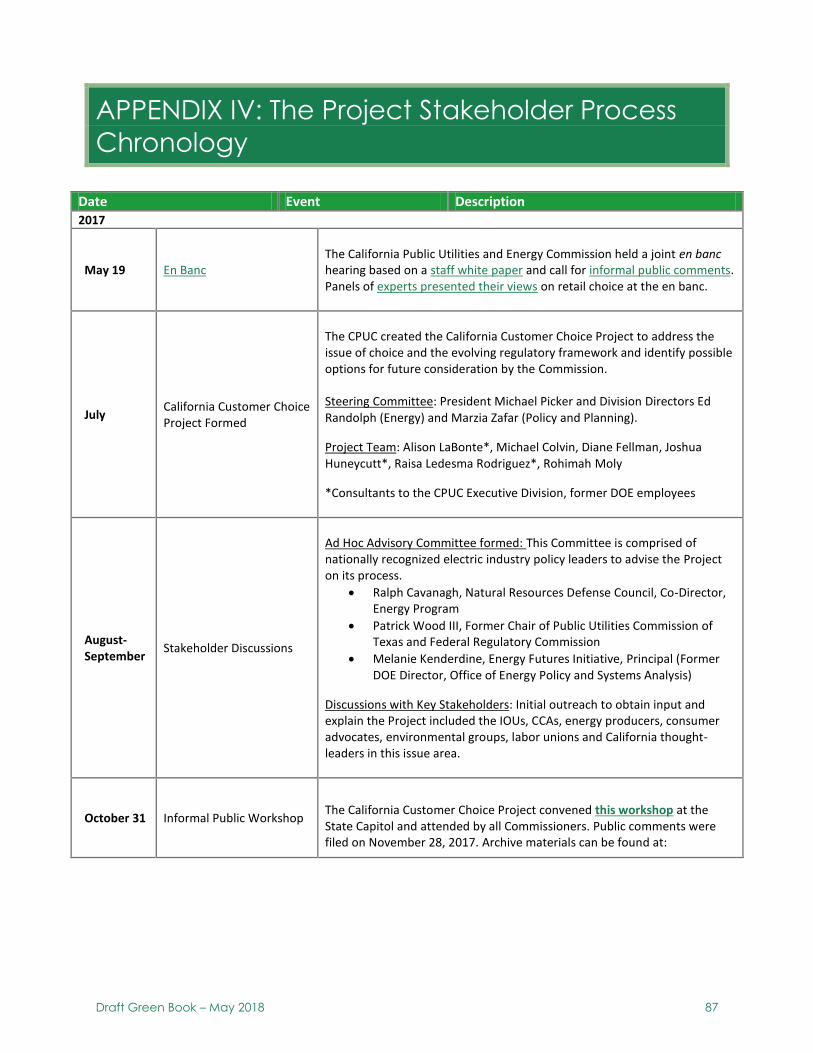
Draft Green Book – May 2018 87
APPENDIX IV: The Project Stakeholder Process
Chronology
Date Event Description 2017
May 19 En Banc
The California Public Utilities and Energy Commission held a joint en banc hearing based on a staff white paper and call for informal public comments. Panels of experts presented their views on retail choice at the en banc.
July California Customer Choice Project Formed
The CPUC created the California Customer Choice Project to address the issue of choice and the evolving regulatory framework and identify possible options for future consideration by the Commission. Steering Committee: President Michael Picker and Division Directors Ed Randolph (Energy) and Marzia Zafar (Policy and Planning).
Project Team: Alison LaBonte*, Michael Colvin, Diane Fellman, Joshua Huneycutt*, Raisa Ledesma Rodriguez*, Rohimah Moly
*Consultants to the CPUC Executive Division, former DOE employees
August-September
Stakeholder Discussions
Ad Hoc Advisory Committee formed: This Committee is comprised of nationally recognized electric industry policy leaders to advise the Project on its process.
Ralph Cavanagh, Natural Resources Defense Council, Co-Director, Energy Program
Patrick Wood III, Former Chair of Public Utilities Commission of Texas and Federal Regulatory Commission
Melanie Kenderdine, Energy Futures Initiative, Principal (Former DOE Director, Office of Energy Policy and Systems Analysis)
Discussions with Key Stakeholders: Initial outreach to obtain input and explain the Project included the IOUs, CCAs, energy producers, consumer advocates, environmental groups, labor unions and California thought-leaders in this issue area.
October 31 Informal Public Workshop
The California Customer Choice Project convened this workshop at the State Capitol and attended by all Commissioners. Public comments were filed on November 28, 2017. Archive materials can be found at:
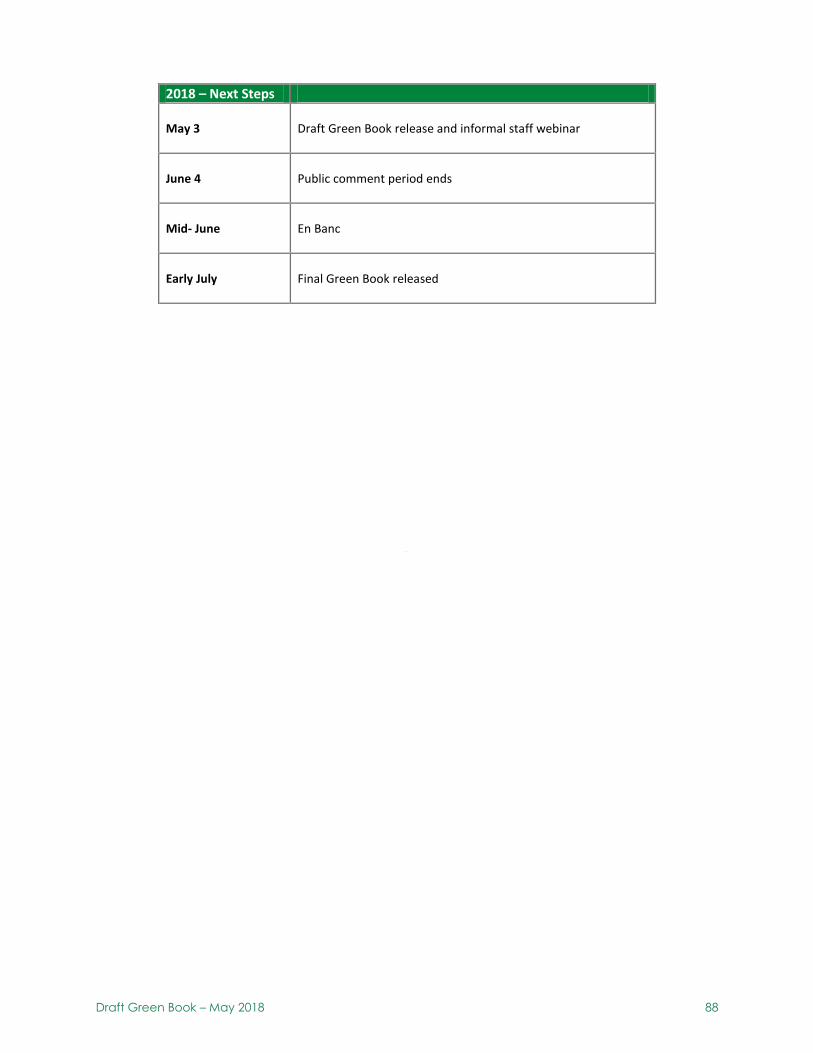
Draft Green Book – May 2018 88
2018 – Next Steps
May 3 Draft Green Book release and informal staff webinar
June 4 Public comment period ends
Mid- June En Banc
Early July Final Green Book released
Draft Green Book – May 2018 89
Acknowledgements
In preparing this draft white paper, the California Customer Choice Project authors wish to thank the following individuals and organizations for their contributions.
Members of the CPUC’s Steering Committee provided input on the scope and structure of this project: President Michael Picker and Co-Chiefs of Staff: James Ralph and Nidhi Thakar; Edward Randolph, Director, Energy Division and Marzia Zafar; Former Director, Policy and Planning Division.
Members of the Ad Hoc Advisory Committee who guided the authors in the formulation and execution of this Project: Ralph Cavanagh, Co-director, Energy Program, Natural Resources Defense Council; Melanie Kenderdine, Principal, Energy Futures Initiative; and Pat Wood III, Principal, Wood3 Resources. Sue Tierney, Senior Advisor, Analysis Group participated during the initial stages of the project.
We appreciate the engagement of the current Commissioners and their advisors for helping establish the scope of the project and then in reviewing this draft: Martha Aceves Guzman and David Gamson, Carla Peterman and Jennifer Kalafut, Ehren Seybert and Shannon O’Rourke, Liane Randolph and Jason Houck, Cliff Rechtschaffen and Yuliya Schmidt.
Special appreciation goes to Alison LaBonte, Ph.D. who served as the Project team lead through completion of the market assessments. Joshua Huneycutt also provided valuable insight and organizations at the outset of the Project. Both came from the U.S. Department of Energy to help forward California’s energy policies and will accomplish that goal through their work in the CPUC’s Energy Division.
We thank Director Randolph for offering the services of Energy Division staff experts who provided guidance and input on the state of the California electricity sector and how their particular programs were functioning: Suzanne Casazza (CCA); Scarlett Liang-Uejio ( PCIA ); Jonathan Tom (Market Structure); Kathleen Blake (Direct Access) Whitney Richardson ( Rates); Neha Bazaj ( Rates); Paul Philips (Rates); Marc Mongouquette ( DER); Amy Mesrobian (Electric Vehicles); Aloke Gupta (Demand Response); Rachel McMahon (Energy Storage); Sara Kamins (Customer Generation); Michele Kito (RA); Cheryl Lee and Cheryl Cox (RPS). Further internal overall review was greatly appreciated from Arthur O’Donnell, Supervisor – Risk Assessment, Office of Utility Safety and Reliability (who really wrote the book); Administrative Law Judges Jeanne McKinney and Julie Fitch.
The Project team thanks the presenters of the California Customer Choice Workshop on October 31, 2017, including Chris King, Global Chief Policy Officer, Siemens Digital Grid; Chris Hendrix, Director of Markets & Compliance, Wal-Mart, Inc.; Colin Cushnie, Vice President, Southern California Edison; Jan Pepper, CEO, Peninsula Clean Energy; Matt Duesterberg, CEO, Ohm Connect; Aaron Daly, Global Energy Coordinator, Whole Foods market; Janice Lin, Executive Director, California Energy Storage Alliance; Lisa Hagerman, Director of Programs, DBL Partners; Sean Gallagher, Vice President, State Affairs, Solar Energy Industries Association; Jan Smutny Jones, CEO, Independent Energy Producers; Laura Wisland, Senior Energy Analyst, Union of Concerned Scientists; Parin Shah, Senior Strategist; CEJA & Asian Pacific Environmental Network; Marc Joseph, Adams, Broadwell, Joseph & Cardozo on behalf of CUE; Matt Freedman, Staff Attorney; The Utility Reform Network. We also wish to express our appreciation for those who preceded us in raising the issues and establishing the platform for the Project: Nick Chaset, former Chief of Staff to President Picker; Timothy Sullivan, former CPUC Executive Director and Narayan Subramanian, Fellow, Governor’s Office.
The Market Assessments relied on the input of subject matter experts from each jurisdiction. The Project team thanks these experts for sharing their knowledge and resources through phone interviews and e-mail:
New York: Rudy Stegemoeller (Special Assistant for Energy Policy), LuAnn Scherer (Director, Office of Consumer Services), Bruce Alch (Chief, Office of Consumer Services), and Christine Bosy (Manager, Office of Consumer Services) from the New York Department of Public Service; Justin M. Gundlach, (Staff

Draft Green Book – May 2018 90
Attorney) and Romany M. Webb (Associate Research Scholar and Climate Law Fellow) from Sabin Center for Climate Change Law, Columbia Law School.
Texas: Amanda Levin (Energy and Climate Advocate, NRDC), Darrin Pfannenstiel (Senior Vice President, Stream Energy), Sheri Givens (President, Givens Consulting LLC), Catherine J. Webking (Partner, Scott Douglass & McConnico LLP), Nat Treadway (Managing Partner, DEFG), Judith Schwartz (President and Founder, To the Point), and several subject matter experts at the Public Utility Commission of Texas and the Electric Reliability Council of Texas.
Illinois: Mark Pruitt (Community Choice Aggregator Program Director) from the IL CCA Network and Jean Gibson, Director of Office Retail Market Development at the Illinois Commerce Commission.
Great Britain: Philip Baker (Senior Advisor), Michael Hogan (Senior Advisor), and Richard Sedano (President and CEO) from The Regulatory Assistance Project, Nigel Cornwall (Chairman, Cornwall Insight), Jeffrey Hardy (Academic Consultant, Imperial College London), Maryam Khan (Economist) and Kristian Marr (Senior Economist) from the Office of gas and electricity markets, and Christopher Watts (Regulatory Affairs Director, S&C Electric Company).
Finally, Lisa Cabral, Survey Statistician with the U.S. Energy Information Agency enabled the Project’s compilation of comparable statistics across state jurisdictions.