Embed Size (px)
Citation preview
FEASIBILITY OF USl UT 0 T
I-2 FUEL ASS Ll ES (DRAFT)
v d • Tow n 0. Carlson
RAPIIY TO EXAHI E
Idaho National Engineering Laboratory 0 us n.,,.,, .. ,"'""'"
Pr par d for th U.S. DEPART E T OF EN RGY Under DOE Contract o. DE-AC07-76I001570
EGG-TMI-6617-(Draft)
Jun 1984
(
n �· EG�:..G ld h

DISCLAIMER
Th1s book was prepared as an account of work sponsored by an agency of the United
States Government Ne1ther the Un1ted States Government nor any agency thereof,
nor any of the�r employees. makes any warranty, express or implied, or assumes any
legal hab1hty or respons1b1hty lor the accuracy, completeness, or usefulness of any
1nlorma11on, apparatus, product or process disclosed, or represents that 11s use would not 1nlnnge pnvately owned nghts References here1n to any spec1f1C commercial
product. process, or serv1ce by trade name. trademark, manufacturer, or othefwlse,
does not necessanly constitute or 1mply 1ts endorsement, recommendation, or favoring
by the Umted States Government or any agency thereof. The vMtWS and opin•ons of
authors eKpressed here1n do not necessanly state or reflect those of the United States
Government or any agency thereof.
FEAS IBILITY OF USING f£UTRON T(M)GRAPHY TO EXAMif£ TMI-2 Fl£L ASSEMBLIES
(Draft)
David M. Tow Johan 0. Carlson
Published June 1984
E G&G Idaho, Inc. Idaho Falls, ID 83415
Prepared for the U.S. Department of Energy
Idaho Operations Office Under OUt Contract No. OE-AC07-761001570
EGG-TMJ-6617
(Draft)

ABSTRACT
This report presents results of a feasibility study for using neutron
tomography ( NT ) to examine TMI-2 fuel assemblies. A fuel assembly mockup was
constructed to simulate many of the conditions that may exist in actual TMI-2
fuel assemblies and was examined with NT techniques. This study demonstrated
that useful and reliable information could be obtained regarding fuel assembly
configuration, particularly the location and condition of the fuel and control
materials within the assembly.
i i
ACK�OWLEDGIE�TS
Many people and organizations contributed to this task. Special thanks and recognition are extended to the following: K. G. Therp and staff at the
Thermal Fuels Test Tra1n Design and Assembly Section for fabrication of the
fuel assembly �ckup; M. L. Russell and T. E. Howel l of the LOFT program for
supplying many of the fuel assembly mockup components. A special thanks goes
to the staff (especially G. McClell an) of the Argonne National Laboratory-West
Neutron Kad1ography tacility for assisting in the total project from
conceptual destgn through analysis of the final neutrographs. M. R. Martin
and H. w. Keno assisted in analyzing the data and reviewing the manuscript.
i 1 i
CONTENTS
ASS TRACT • • • • • • • • • • • • • • • • • • • • • • • • • • • • • • • • • • • • • • • • • • • • • • • • • • • • • • • • • • • • • •
ACKNOWLEDGMENTS • • • • • • • • • • • • • • • • • • • • • • • • • • • • • • • • • • • • • • • • • • • • • • • • • • • • • • •
INTRODUCTION • • • • • • • • • • • • • • • • • • • • • • • • • • • • • • • • • • • • • • • • • • • • • • • • • • • • • • • • • •
UESCRIPTION OF TMI-2 FUEL ASSEMBLY MOCKUP • • • • • • • • • • • • • • • • • • • • • • • • • • • • •
EXAMINATION AND ANALYTICAL TECHNIQUES • • • • • • • • • • • • • • • • • • • • • • • • • • • • • • • • •
EXAMINATION RESULTS • • • • • • • • • • • • • • • • • • • • • • • • • • • • • • • • • • • • • • • • • • • • • • • • • • •
Examination Using 90 Views • • • • • • • • • • • • • • • • • • • • • • • • • • • • • • • • • • • • • •
Cladding and Guide Tubes • • • • • • • • • • • • • • • • • • • • • • • • • • • • • • • • • • •
Spacer Grid Regions • • • • . • • . . . . • • • • • • • • • . . • • • • • • • • • • • • • • • • • •
Missing Fuel Rods • • • • • • • • • • • • • • • • • • • • • • • • • • • • • • • • • • • • • • • • • •
Fuel Rod Condition (Fuel Geometry) • • • • • • • • • • • • • • • • • • • • • • • • •
Water-Filled Rods • • • • • • • • . • • • • • . . • • • • • • • • • • • • • • • • • • • • • • • • • •
Irregularly Shaped Chunks • • • • • • • • • • • • • • • • • • • • • • • • • • • • • • • • • •
Control Rods • • • • • • • • • • • • • • • • • • • • • • • • • • • • • • • • • • • • • • • • • • • • • • •
i i
iii
1
2
6
11
11
11 11 21 22 23 23 23
Examinations Using Fewer Views • • • • • • • • • • • • • • • • • • • • • • • • • • • • • • • • • • 24
CONCLUSIONS/RECOMMENDATIONS .. .. . . . . . . . . . . ..... . . . . . . . .. . . . . . . . . ... . . . . 30
1.
2.
3.
4.
5. through 13.
14. through 18.
FIGURES
EG&G Drawing 418532, TMI-2 damaged fuel assembly mockup assembly • . • • • • • • • • • . • • • • • • • • • • • • • • . • • • • • • • • • • • • • • • • • • • • • • • • • 3
Photographs of mockup of the TMI-2 fuel assembly • • • • • • • • • • • •
Schematic depicting the neutron radiography process
Schematic depicting the tomographic reconstruction
. . . . . . . . .
4
7
process . . . . . . . . . . . . . . . . . . . . . . . . . . . . . . . . . . . . . . . . . . . . . . . . . . . . . 8
Transverse reconstructions using 90 views • • • • • • • • • • • • • • • • • • • 12
Reconstructions using 90, 75, 60, 45 and 30 views . .. . . . . . . . . 25
iv
•
FEASlBILlTY OF US ING NEUTRON TOMOGRAPHY
TO E XAMlt€ TM I -2 Fll L ASSEMBL IES
(Draft)
l�TROOUCT ION
heutron ta.ogr4phy (�T) is a nondestructive examination technique
d�veloped 4t the ld4ho N4tional Engineering laboratory for examining
irr4di4ted fuel assemblies. �T provides a unique and powerful capability to
eA�ine an interior region of a specimen nondestructively without interference from surrounoing regions. Adjacent regions may be excised mathematically so
that the region of interest may be viewed separately, without having to • 1u�k through• other regions. �T has been used successfully to examine the fuel
assemblies irradiated in the severe fuel damage tests. Other applications are
planned for the near future.
This study was conducted to determine the feasibility of using NT to
examine damaged TMI-2 fuel assemblies. Significant differences exist between
TMI-2 fuel assemblies and fuel assemblies previously examined using NT. TMI-2
fuel assemblies have more than triple the cross-sectional mass of fuel than
the assemblies examineo in the past. The possible presence of control rods
and water-saturated rods in TM I-2 assemblies would present conditions not
encountered in previous examinations. Those differences would result in decreased neutron penetration of the TM I-2 fuel assembly and increased
scattering of the neutron beam. This study was also designed to determine the
effects of decreased neutron penetration and increased neutron scattering and
to answer questions regarding opt1mal examination procedures. Of primary
importance was the minimum number of angular views necessary to achieve
acceptable exam1nation results. As the number of views increases, image
quality increases; but so does the cost of the examination. The study was to
provide informdtion concerning the suitability of existing radiography,
digitization and data processtng equipment, and procedures for use on TMI-2
•ssellb I ies •
DESCRIPTION OF TMI-2 FUEL ASSEMBLY MOCKUP
An important part of the feasibility study included the need to provide a
fuel assembly mockup which would reasonably simulate some of the conditions
that may exist fn an actual TMI-2 fuel assembly. A fuel assembly mockup was
designed and fabricated which provided many expected conditions. It is 9 in.
high and consists of a standard 15 x 15 fuel rod array with guide tubes,
control rods, and spacer grids. It is encased inside a ll�in. -high by
14-in. -diameter stainless steel housing which simulates the shipping/storage
canister. Some simulated conditions of the individual components include:
Intact fuel rods (cladding with depleted uo2 pellets)
2. Missing fuel rods
3. Offset and leaning fuel rod stubs
4. Empty cladding--no fuel pellets
5. Cladding containing borated water
6. Ruptured and/or ballooned cladding
7. Chunks of previously molten core material (stainless steel,
zircaloy-4, depleted U02
, and Ag-ln-Cd)
8. Zircaloy-4 guide tubes with Ag -In-Cd control rods
9. Zircaloy-4 guide tubes without control rods.
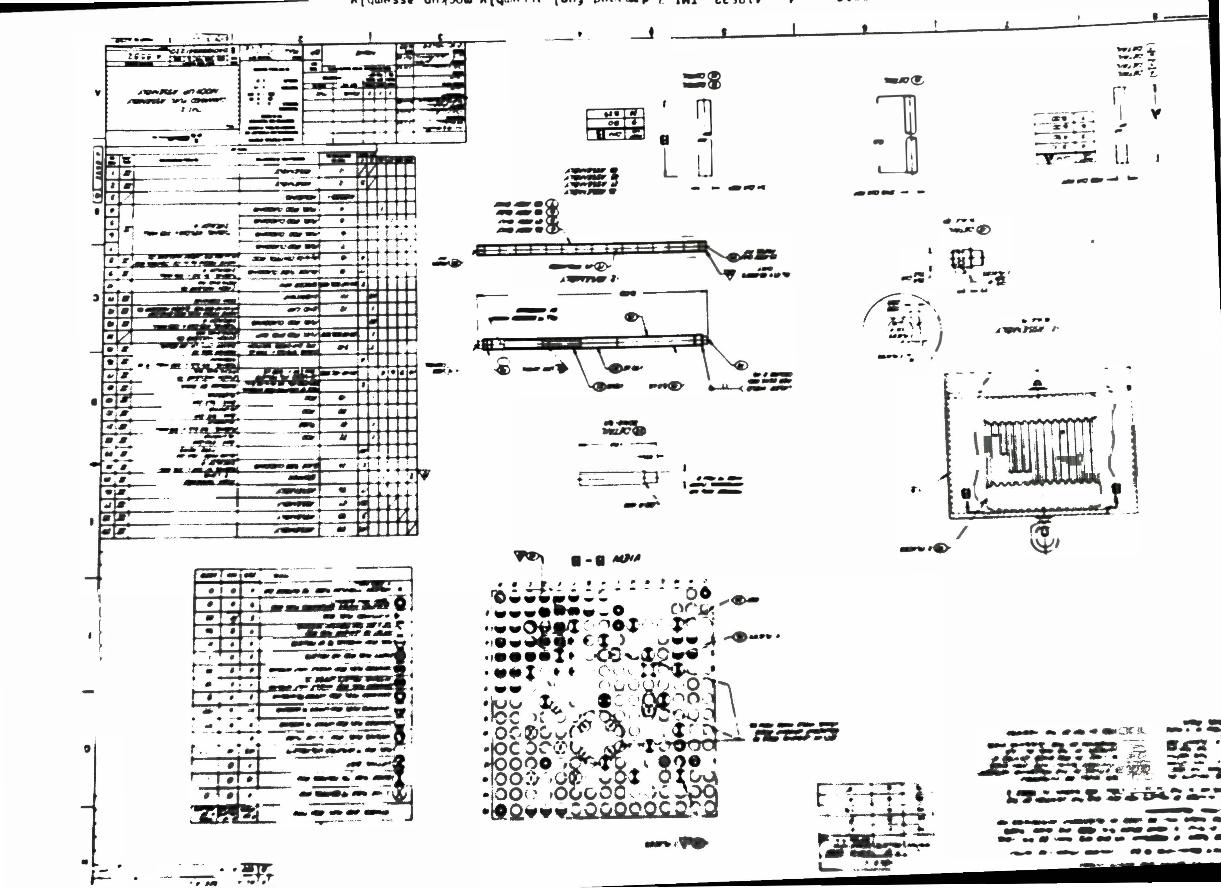
Figure l (EG&G Urawing 418532) shows the detailed configuration of the
fuel assembly mockup. Figure 2a shows the mockup after fabrication.
Figure 2b shows a closeup of the simulated damage zone. Figure 2c shows the
simulated shipping/storage canister. The mockup is located inside the
canister.
2

"lqu•.-.>>111' UII"'JVW "l't"'''..,'' l"'"l v .. .. , . ._., l-1,..1. Gl..,OlV .... , . · - J• ·' -'
,...._ ---�, 1 I r --::: . . .. - I TT . , - .. , - I"'C ., -� W:• -....:.. -�
• L_ ___ • 1,;.."7 --� -� .;.;.. •
:: = �- � -� : r t----;;;--r� -��-t� .,� �'j' ��·! ��· t:��r::_:_�_! .. !i•l ... l ,,.._ . • .:= J... ...,.
1------------s.o, -==- _. -� -----· --��J �-1"�=···��-;·_-__ ,_._ -....J -
� �r:---. -. -
--- --� -= - _ -zr...;."�.ft.ll/�H-f
' r-. --=-� --�- _
- I .. -==:...=-.= --·,__...;'";._�·�v4-H� I / _ ,_.
� .. . --· -•• • ill!!': _,_ . . -· � -----
�.:·�[7�-- ....:-�.·�...1:'---:l ---- • - . ._ ... -=-:!-. ="· --- - ---
-
-
�� ··- --- ----=-., • • -� .eti .zzt: .:�-•·-. ,,
• • [l'f .,,
�-••• �- .. , . �---·
-·-- "'!""'--�
------ ------- -
•· '
.. '
1-I
� I :•
, . ,. •f• '
·I-
--� .. ...
----- � . __.t
.:::= t � .....,., ::; ........ �.
--·l --· --o#
--· . \ 4+ &H· ···i ·FE£
-I
I .....
.1111 (',
-4">
- er<i>' �. ....... ,.
-· -- -
--·
-
...--- -· --�
8
L
t_-_-- __ --p --
� • -· Mit�
=I � LJ
.. � ... .. ...
. ...
. ........ , __ ---
YJalll(!,
] tl/8.., .. - -
�---� . ! :v,� � :.� ; 1 ,.
··-r
-·· •
- ....,-..... · r ... --+-.;;,..·-=- --- I I
0
•
1 (
l • I •
·.!!J�
... -�
� - -,
r� �-----�- I ' ---�t• + � - .-� ....... •·· ----::;-� ..... .
• yA� :&f. u - - ---
1 I
v
L : ___ _. ................. � ... '
-- ---· ....
s. 7.: :.-:. � .:-·.riM.-: -...=-.-: ----· --
-- •. . .. .... . - - --- ----··--· -·� ... -·- - -- ,..._ .....
----- -·---·-
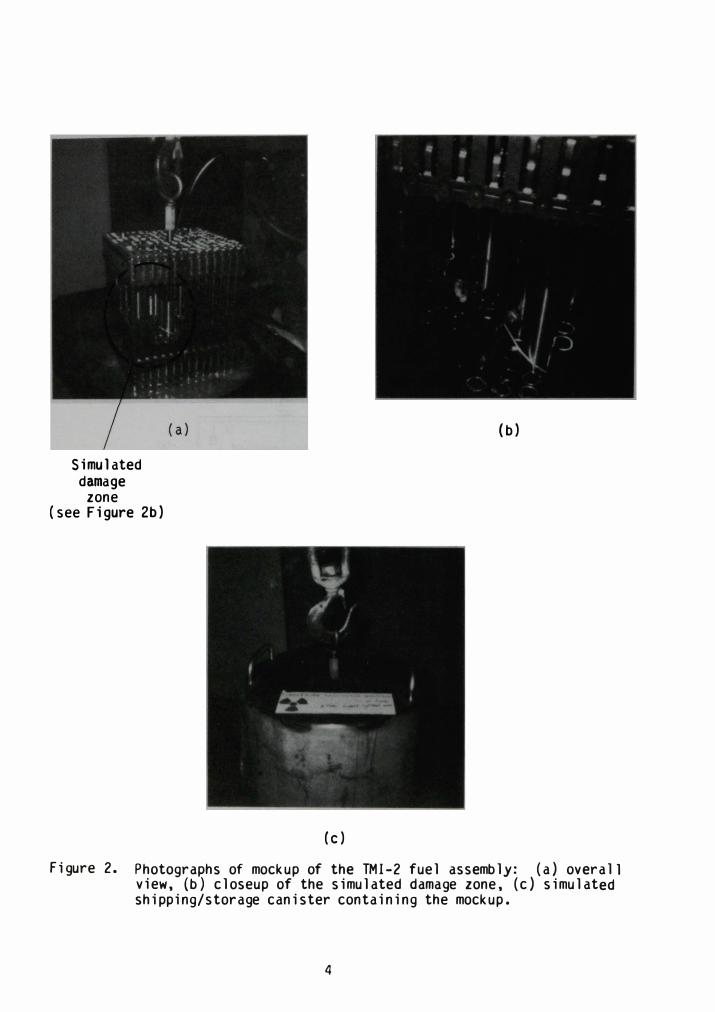
Simulated damage
zone (see Figure 2b)
(b)
(c) Figure 2. Photographs of mockup of the TMI-2 fuel assembly: {a) overall
view, {b) closeup of the simulated damage zone, {c) simulated shipping/storage canister containing the mockup.
4
Kods saturated with borated water and the control rods were of
particular interest. W4ter, boron, and control rod materials are strong
neutron attenuators. It was unknown whether the neutron beam could
adequately penetrate these materials. lnsuft1cient neutron penetration
aoversely could effect results of the examination.
The randomness that probably exists in TMI-2 assemblies would be very a1fficult to accurately simulate in a mockup. It would be necessary to
d.-age much of the cladding, fuel, and spacer grids to achieve such
4Ccuracy. This was not done in the TMI-2 assembly mockup. The majority of
tne rods in the mockup are positioned 1n a regular array. There was no
cr�ling or breakage of fuel pellets; only intact fuel pellets were used.
These si�lat1on inaccuracies might have cast doubt on the validity of this
stuay had past experience 1n these matters been lacking. Experience has
been acquired concerning the examination of simplified assembly mockups and
how the examination results extend to actual test assemblies. For this
reason, it was decided that thiS study would validly assess the suitability
of �T for the ex .. ination of actual TMI-2 assemblies.
5
EXAMINATION AND ANALYTICAL TECHNIQUES
txamination of a specimen by NT yields cross-sectional images of the specimen. These are generated nondestructively from numerous views of the
specimen in the form of neutron radiographs. In each of the radiographs, the
specimen is rotated to present a unique angular view. The data contained in
these radiographs are digitized for entry into a computer. Computer
processing of the data yields the cross-sectional images. The examination
technique can be viewed as a two-step process. The first step is the
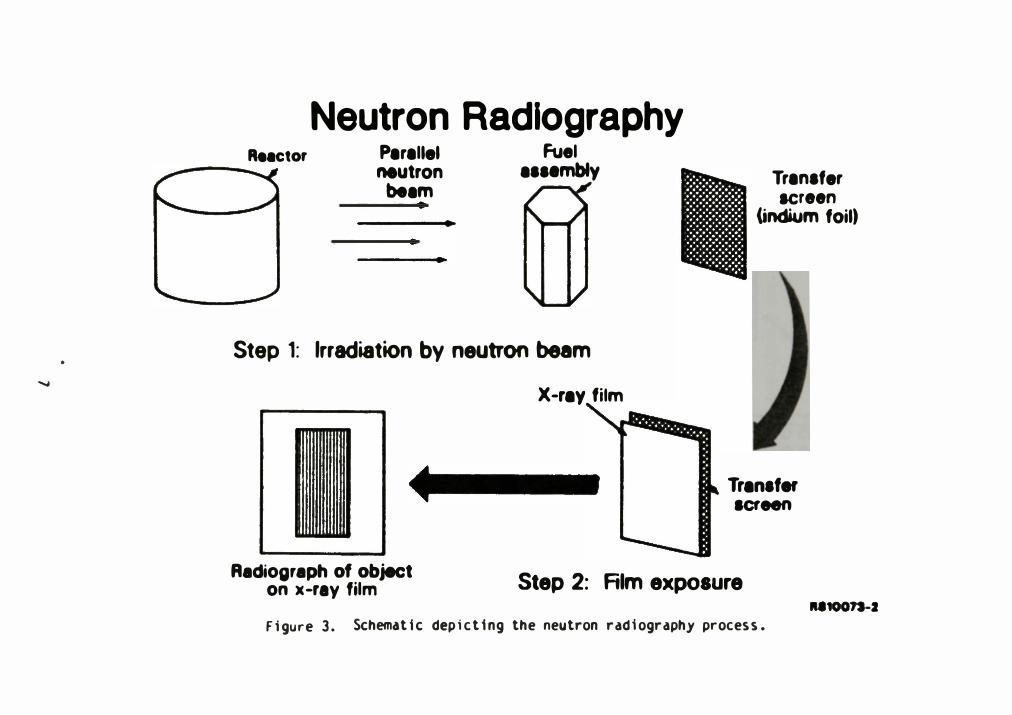
acquisition of the neutron radiographs. The process is depicted in Figure 3.
The specimen is illuminated with a parallel beam of neutrons. Neutrons that
penetrate the specimen impinge on a thin indium foil, creating a radioactive
image of the specimen on the foil. The activated foil is removed from the
beam and allowed to decay while in close contact with photographic film. This
results in the transfer of the specimen image onto photographic film. The
specimen is rotated radially to another preset angular position and the
radiography process repeated. The angular rotation between each radiograph is
called an increment. For purposes of NT, the process is repeated numerous
times at equal increments until the specimen has been rotated through
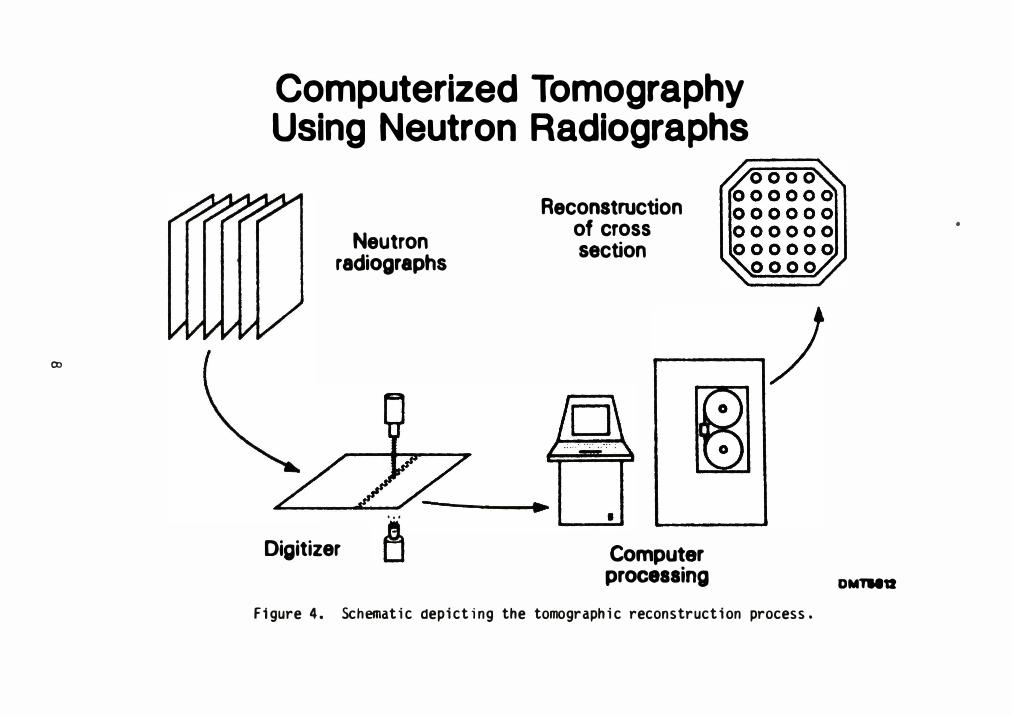
180 degrees. The second step in NT, illustrated in Figure 4, is computer
processing of the d ata contained in the neutron radiographs. The data
( variations in the film density ) are digitized by scanning each radiograph
using a high resolution microdensitometer or similar digitizing device. The
data are entered into a computer which manipulates the data using a
mathematical reconstruction algorithm. The end result is a series of
computer-generated reconstructions of cross-sectional images of the specimen.
Cross-section images can be generated through the specimen at almost any angle
and view. In addition, by using various filtering and color schemes in the
computer, it is possible to accentuate or highlight different specimen
materials by their unique neutron absorption characteristics, making
identification of materials such as control rods, stainless steel, uo2, and
water much easier.
6
Neutron Radiography Reactor Perellel
neutron be em
Fuel eaaembly
Step 1: Irradiation by neutron beam
X-rey film
•
Trenafer screen
(indium foil)
Trenaf• acreen
Radiograph of object on x-ray film Step 2: Aim exposure Figure 3. Schematic depicting the neutron radiography process.
co
I
Computerized Tomography Using Neutron Radiographs
Neutron radiographs
Digitizer
Reconstruction of cross section
I
Computer processing
figure 4. Schematic depicting the tomographic reconstruction process.
•
DMTMU
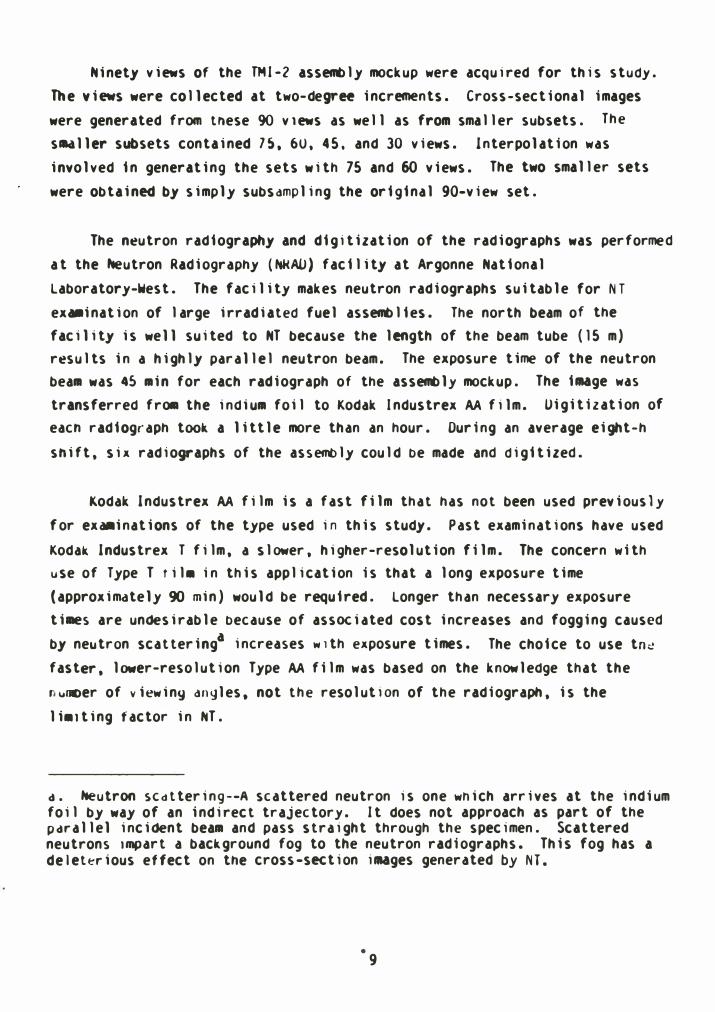
�inety views of the TMI-2 assembl y mockup were acquired for this study.
The views were col lected at two-degree increments. Cross-sectional images
were generated from tnese 90 vtews as wel l as from smal l er subsets. The
s-.ller subsets contained 7), 60, 4S. and 30 views. Interpolation was
involved in generating the sets with 7S and 60 views. The two small er sets
were obtained by simply subsampling the original 90-view set.
The neutron radiography and digitization of the radiographs was performed
at the heutron Radiography (�AU) facil ity at Argonne National
Laboratory-West. The facility makes neutron radiographs suitable for NT
ex .. ination of l arge irradiated fuel assembl ies. The north beam of the
facility is well suited to NT because the length of the beam tube (lS m) resul ts in a highl y parall el neutron beam. The exposure time of the neutron
beam was 4S min for each radiograph of the assembly mockup. The image was
transferred from the indium foil to Kodak lndustrex AA film. Oigitization of
eacn radiograph took a little more than an hour. During an average eight-h
snift, six radiographs of the assembl y coul d be made and digitized.
Kodak lndustrex AA fil m is a fast film that has not been used previously
for exa.inations of the type used in this study. Past examinations have used
Kodak lndustrex T fil m, a sl ower, higher-resolution film. The concern with use of Type T til • in this appl ication is that a long exposure time
(approximately 90 min) would be required. Longer than necessary exposure
ti�s are undesirable because of associated cost increases and fogging caused
by neutron scattering4 increases w1th exposure times. The choice to use tn�
faster, lower-resolution Type AA fil m was based on the knowledge that the
nuooer of viewing angles, not the resolutwn of the radiograph, is the
li•tting factor in NT.
a. heutron SCdttering--A scattered neutron is one which arrives at the indium foil by way of an indirect trajectory. It does not approach as part of the parall el incident beam and pass straight through the specimen. Scattered neutrons tmpart a background fog to the neutron radiographs. This fog has a delet�rious effect on tne cross-section images generated by NT •
• 9

Considering the reduction in neutron scattering, it appears Type AA film
resulted in negligible image degradation and substantially reduced costs.
10
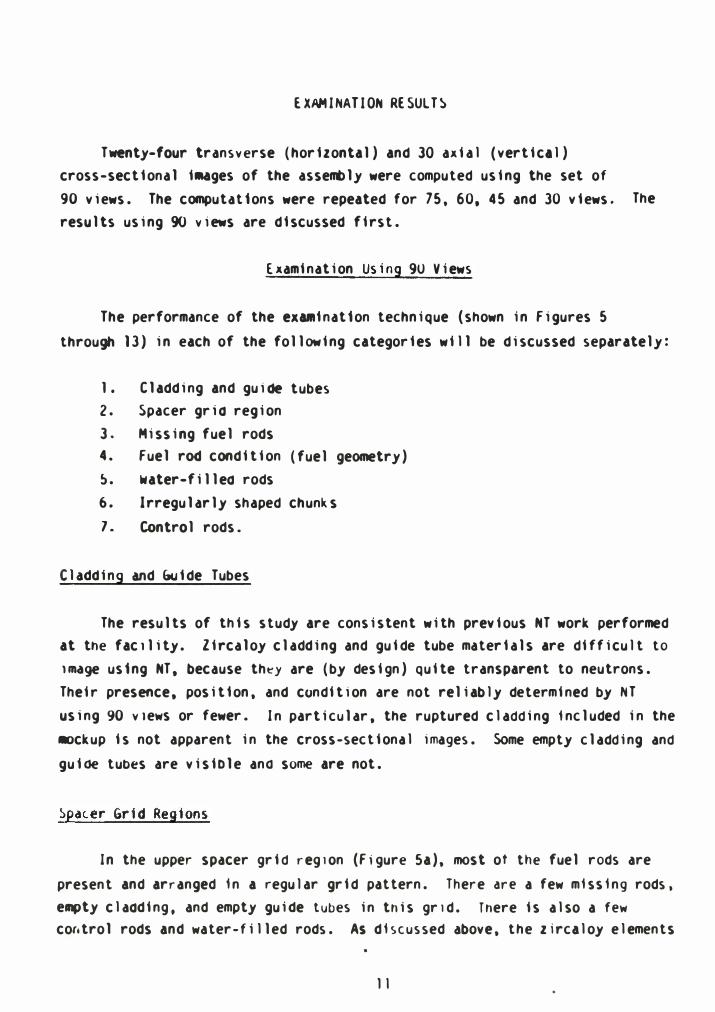
EXAM INATION RESULT�
Twenty-four transverse (horizontal) and 30 axial (vertical) cross-sectional i-.ges of the assembly were computed using the set of
90 views. The computations were repeated for 75, 60, 45 and 30 views. The
results using 90 views are discussed first.
Examination Using 90 Views
The performance of the examination technique (shown in Figures 5
through 13) in each of the following categories will be discussed separately:
1 • Cladding and guide tubes 2. Spacer gria region
3. Missing fuel rods 4. Fuel rod condition (fuel geometry)
). water-fillea rods
6. Irregularly shaped chunks
7. Control rods.
Cladding and Guide Tubes
The results of this study are consistent with previous NT work performed at the facility. Zircaloy cladding and guide tube materials are difficult to
1mage using NT, because th�y are (by design) quite transparent to neutrons.
Their presence, position, and condition are not reliably determined by NT
using 90 views or fewer. In particular, the ruptured cladding included in the
.ackup is not apparent in the cross-sectional images. Some empty cladding and
guioe tubes are visiole ana some are not.
�pacer Grid Regions
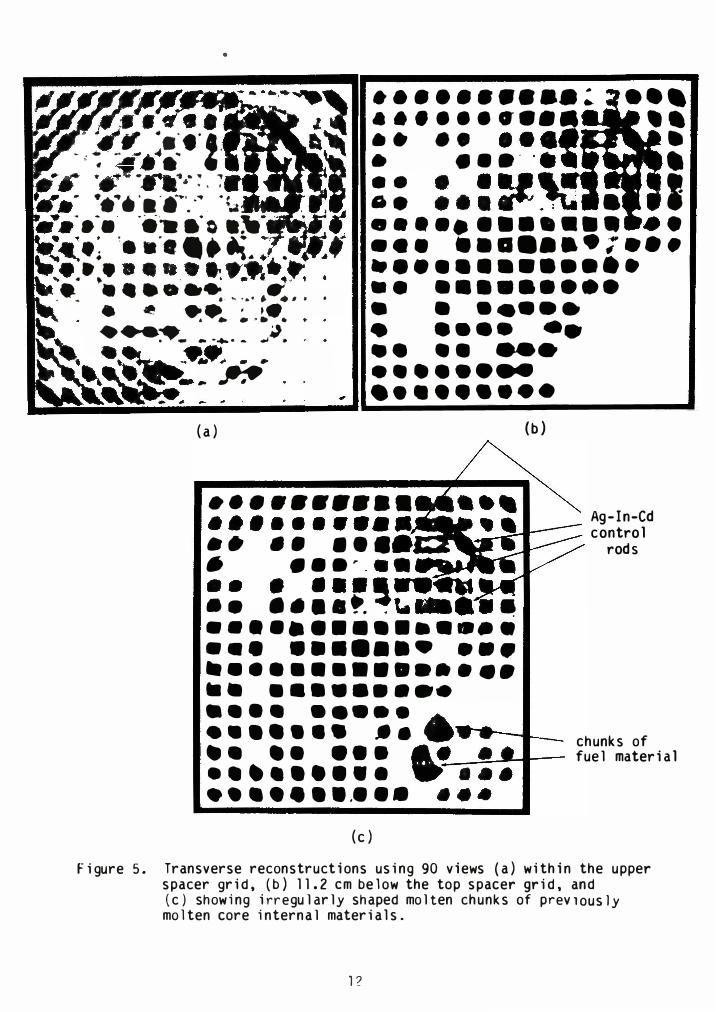
In the upper spacer grid reg1on (Figure Sa), most ot the fuel rods are
present and arranged in a regular grid pattern. There are a few missing rods, empty claading, and empty guide tubes in this gr1d. There is also a few
cor.trol rods and water-filled rods. As discussed above, the zircaloy elements
1 I
•
•• ··········� ••• •••••••••• • • •• •• •••• • • •••• • •• • � ' . - ........ •.. '
II . ···! ' # ... . . .
:: :.::l� • I "JI!It!ti.TT • ...._ .. ., ,. �
.... �- · ... � f
. .................. . ,_ -.�. ·ell •·o ·� ·� � ••.• -· 'l.. . .•.• ·······�·�� • •••••• •
•••••••••••• • .•• ······•:••• ..............
..,. ·- ..., �--• t • I • • •• •••••••••
. � .. , , . .. .. • 1' • • • • •••••
... �_ .. ..... . - ,)J. • • ••• •• ·�-.. �· .. . ..
. . .. .. . ·�- .. � . ..... ..
- � •.••••••• .---------------------�
(a)
• ••••••••• ......... ........ _ •• •• ••• . . .... ··· �.....-'� •• • •••• .. .... �. �l.- • ••••••••••••••• ••• ••••••• ••• ................ •• •••••••••
(b)
Ag-ln-Cd control
rods
•••• ••••• ••••••• •• •• •• ••• ••••••••• •••••••••••
chunks of ...�__.!!��- fuel material
(c)
Figure 5. Transverse reconstructions using 90 views (a) within the upper spacer grid, (b) 11. 2 em below the top spacer grid, and (c) showing irregularly shaped molten chunks of prev1ously molten core internal materials.
12
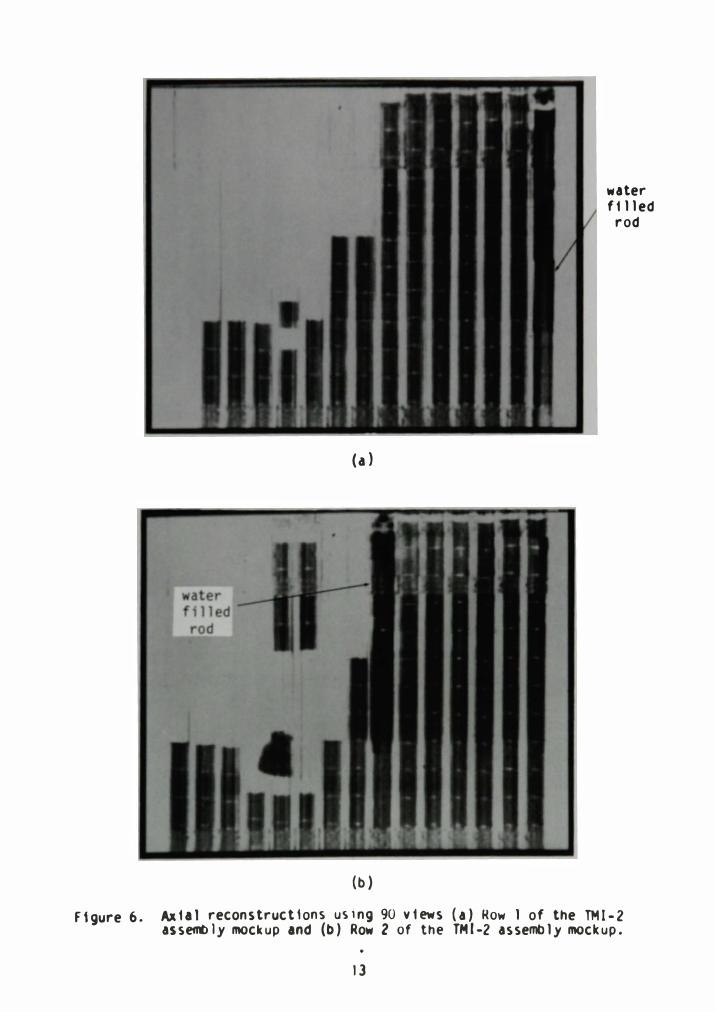
Figure 6.
(a)
(b)
water filled
rod
Axial reconstructions us1ng 90 views (a) �ow l of the TMl-2 assembly mockup and (b) Row 2 of the TMl-2 assembly mockup.
13
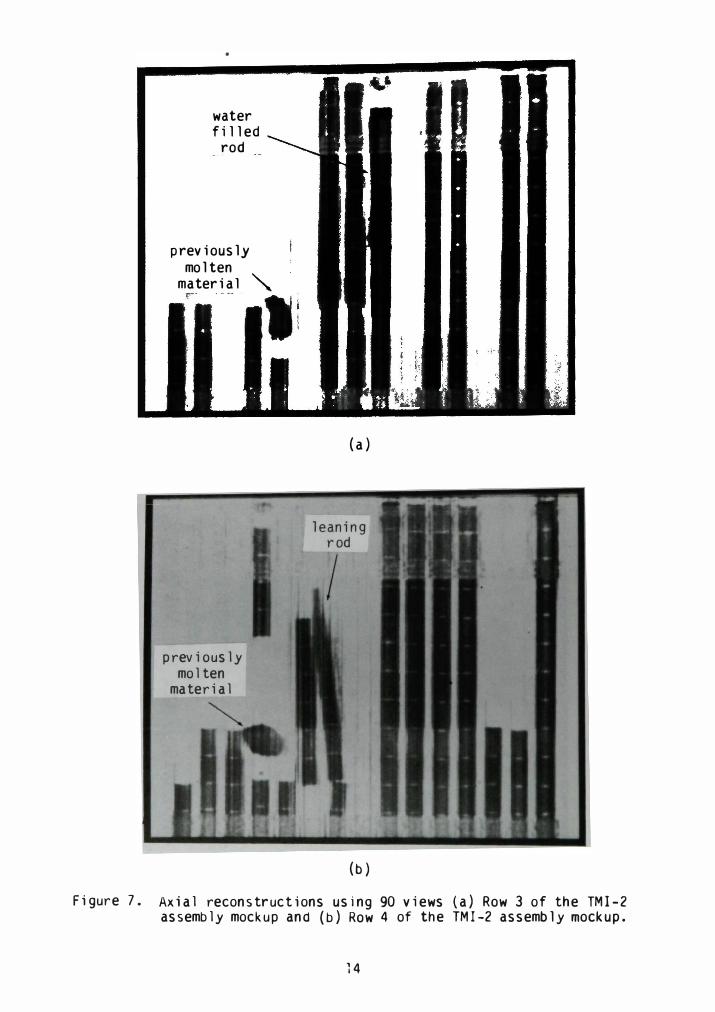
Figure 7.
water filled
rod
previously molten
material
previously molten
material
(a)
(b)
Axial reconstructions using 90 views (a) Row 3 of the TMI-2 assembly mockup and (b) Row 4 of the TMI-2 assembly mockup.
14
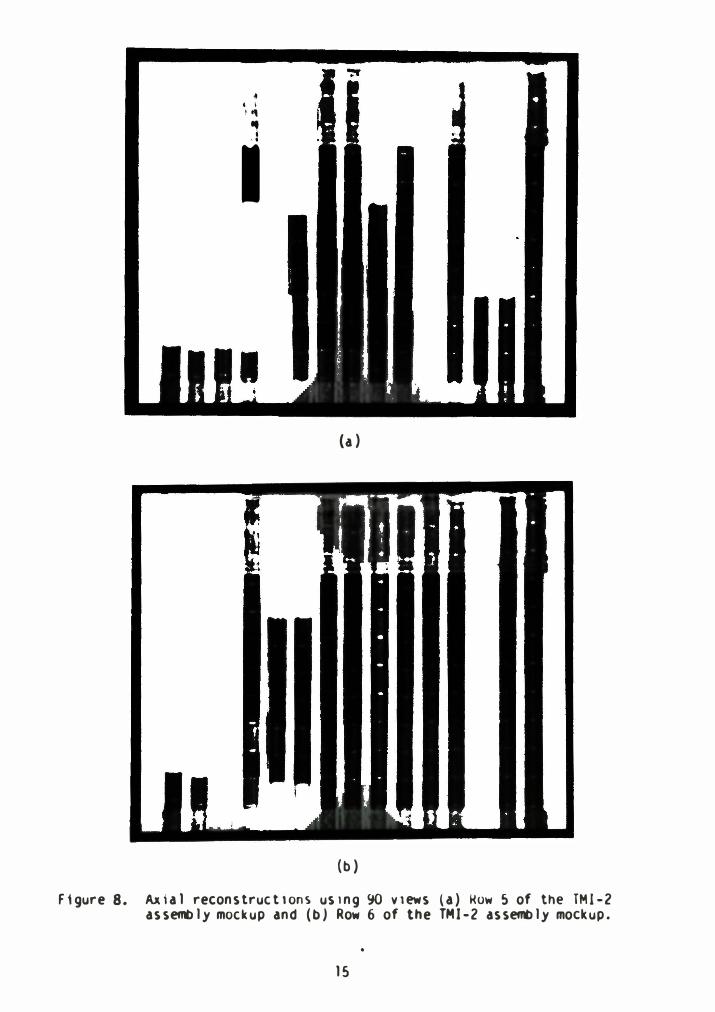
4 l I , .,
.. ,j
I
(a)
(b)
ftgure 8. Ax1a1 reconstructions us1ng 90 v1ews {a) �ow 5 of the TMI-2 assembly mockup and (b) Row 6 of the TMI-2 assembly mockup.
15
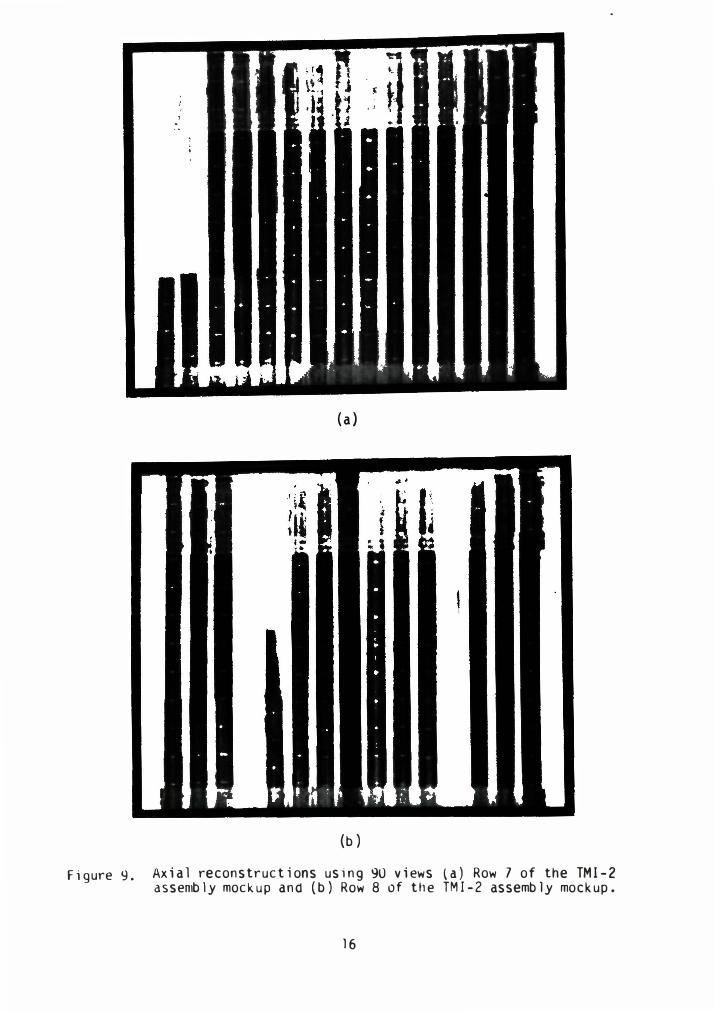
Figure 9.
(a)
(b)
Axial reconstructions us1ng 90 views (a) Row 7 of the TMI-2 assembly mockup and (b) Row 8 of the TMI-2 assembly mockup.
16
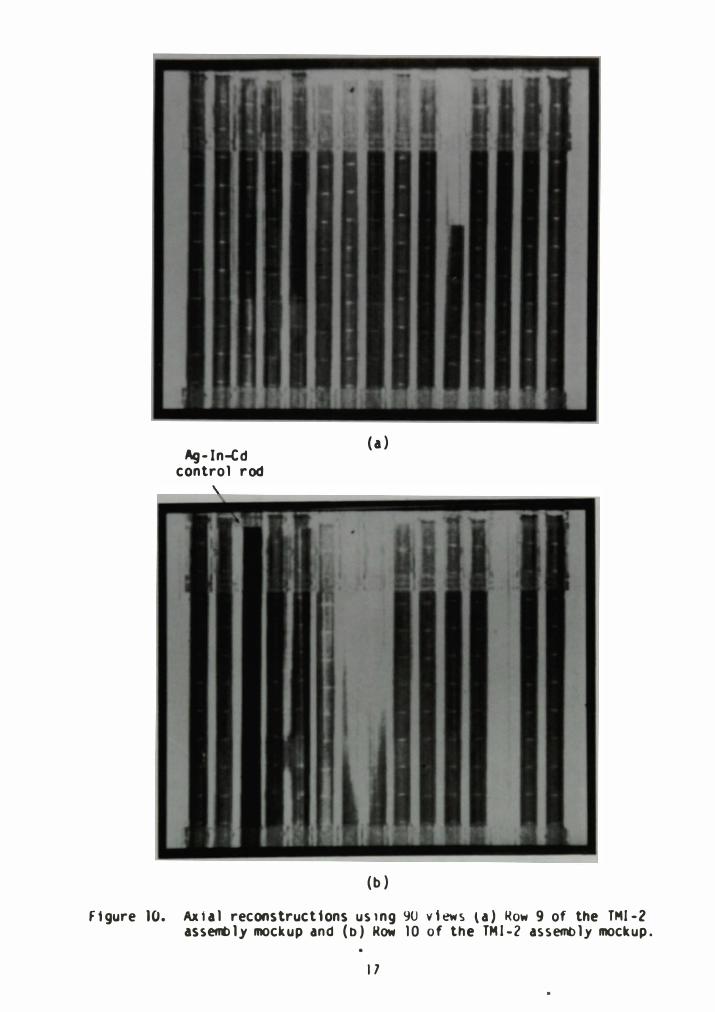
Ag-ln-Cd control rod
(a)
(b)
f1gure 10. Ax1al reconstructions us1ng 90 views \a) �ow 9 of the TMI-2 assembly mockup and (b) Mow 10 of the TMI-2 assembly mockup.
17
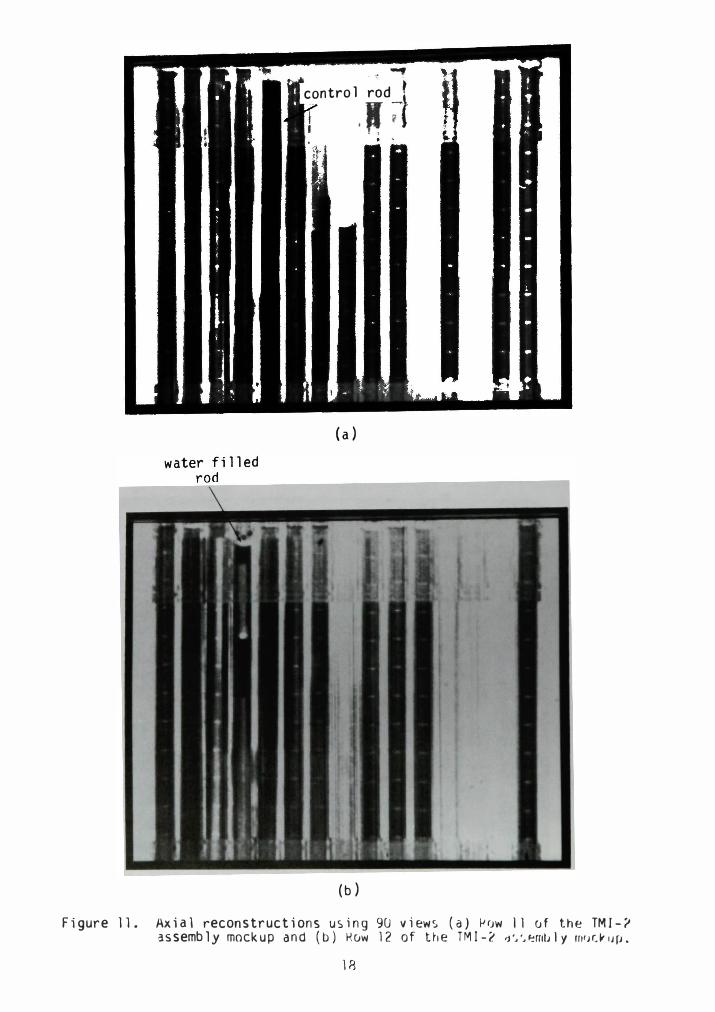
. ' _, contro 1 r�d tt
' : ( . .
(a)
(b)
Figure 11. Axial reconstructions using 9U views (a) �ow 11 0f the TMI-? assembly mockup and (b) Huw 12 of the TMI-2 -:�·,·,�rnb1y rrt'JCitiJp.
•
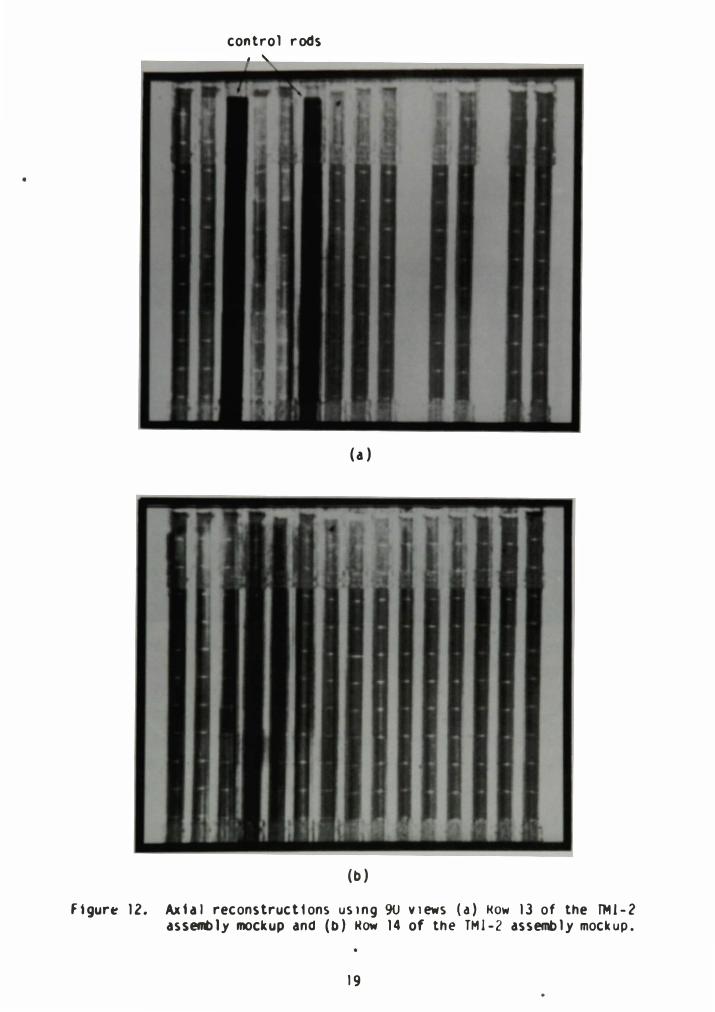
control rods
(a)
(b)
ftgur� 12. Axial reconstructions us,ng 90 vtews (a) �ow 13 of the TMl-2 assembly mockup and (b) �ow 14 of the TMl-2 assembly mockup.
19
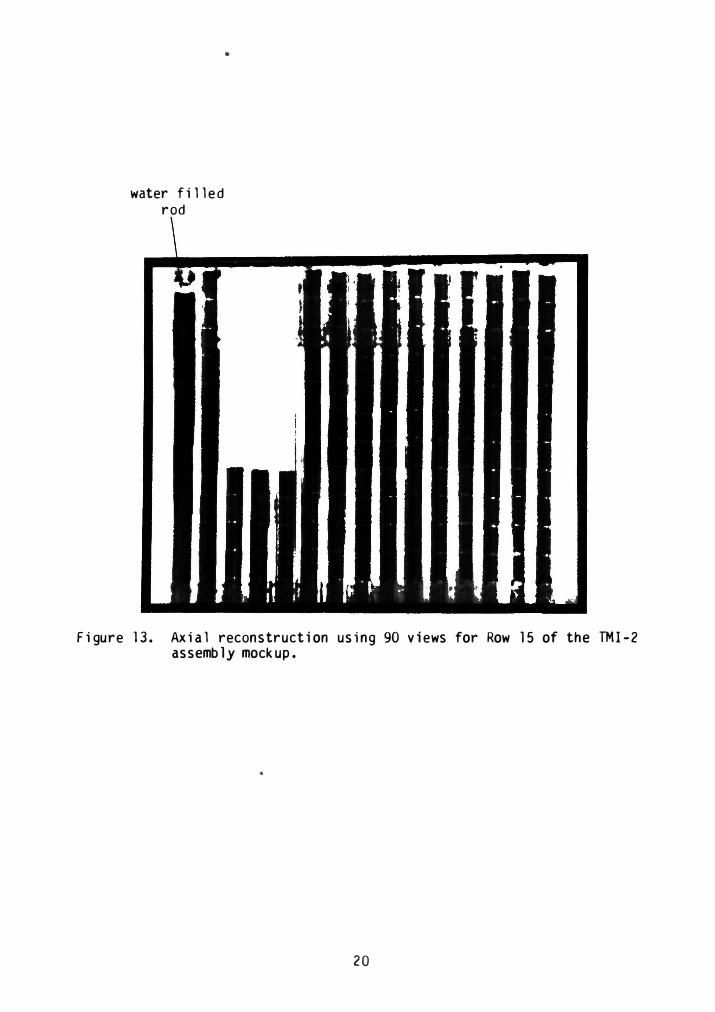
water filled rod
•
Figure 13. Axial reconstruction using 90 views for Row 15 of the TMI-2 assembly mockup.
20
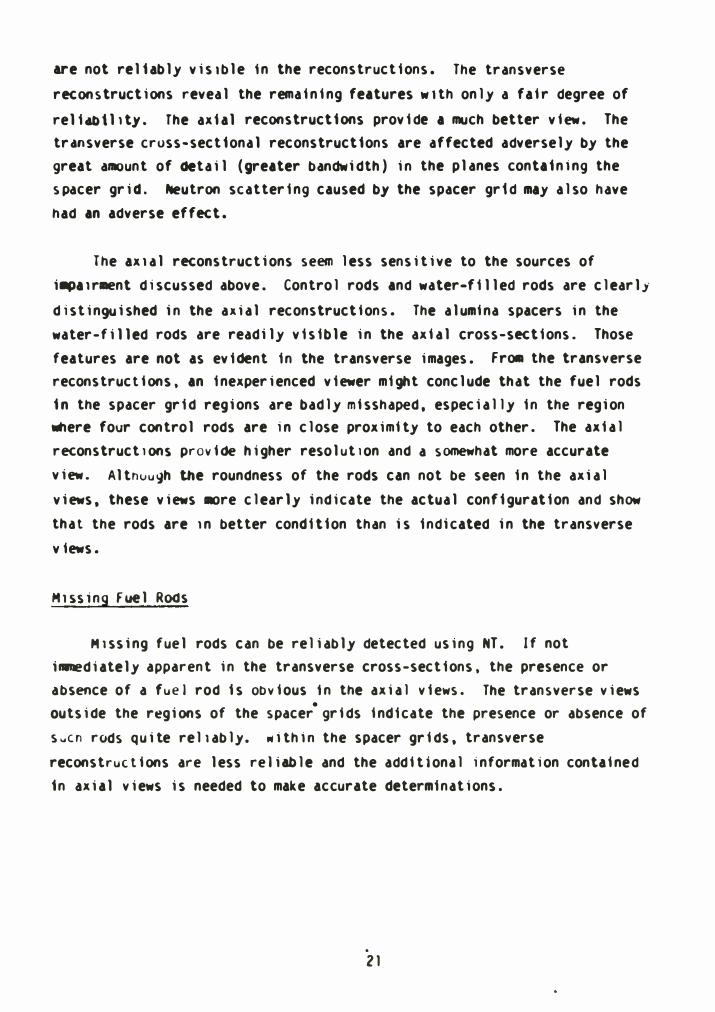
are not reliably vistble tn the reconstructions. The transverse
reconstructions reveal the remaining features w1th only a fair degree of
reli4biltty. The axial reconstructions provide a much better view. The
tr4nsverse cross-sectional reconstructions are affected adversely by the
great amount of detail (greater bandwidth) in the planes containing the
spacer grid. �utron scattering caused by the spacer grtd may also have
had an adverse effect.
The ax1al reconstructions seem less sensitive to the sources of
i�atr�nt discussed above. Control rods and water-filled rods are clearli
distinguished in the axial reconstructions. The alumina spacers in the
water-filled rods are readily visible in the axial cross-sections. Those
features are not as evident in the transverse images. From the transverse
reconstructions. an inexperienced viewer might conclude that the fuel rods
in the spacer grid regions are badly misshaped, especially in the region where four control rods are in close proximity to each other. The axial
reconstructionS provide higher resolut1on and a somewhat more accurate
view. Altnuugh the roundness of the rods can not be seen in the axial
views, these views .ore clearly indicate the actual configuration and show
that the rods are tn better condition than is indicated in the transverse
views.
HlSSing fuel ROds
H1ssing fuel rods can be reliably detected using NT. If not
i.mediately apparent in the transverse cross-sections. the presence or
absence of a fuel rod is obvious 1n the axial views. The transverse views •
outside the regions of the spacer grids indicate the presence or absence of
sucn rods quite rel1ably. within the spacer grids, transverse
reconstructions are less reliable and the additional information contained
in axial views is needed to make accurate determinations •
.
21
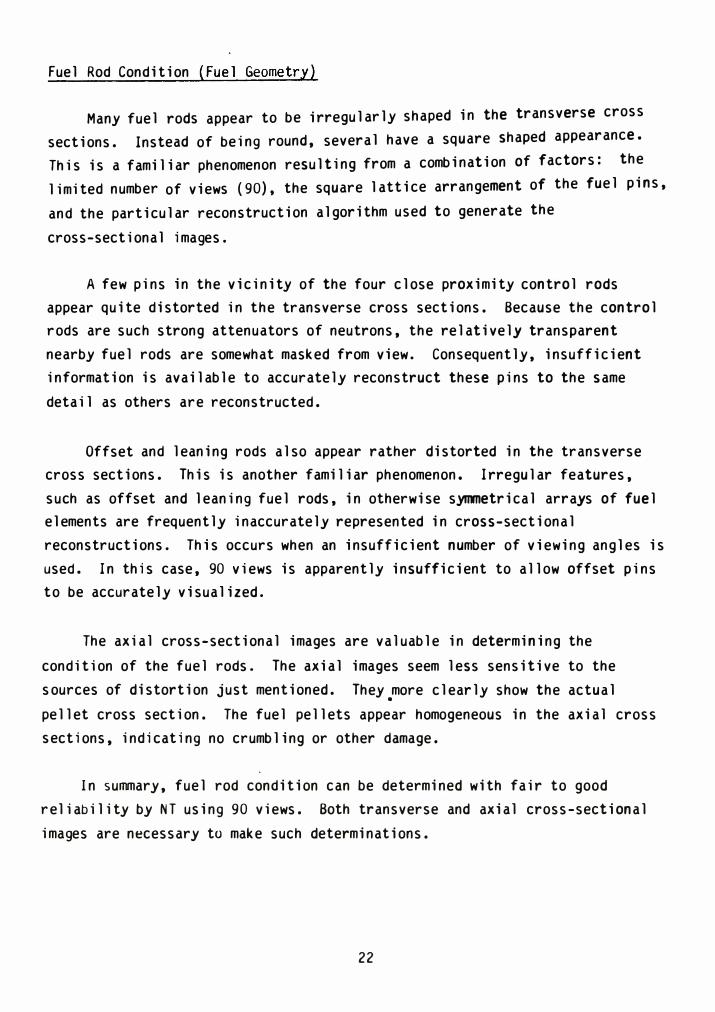
Fuel Rod Condition (Fuel Geometry)
Many fuel rods appear to be irregularly shaped in the transverse cross
sections. Instead of being round, several have a square shaped appearance.
This is a familiar phenomenon resulting from a combination of factors: the
limited number of views {90), the square lattice arrangement of the fuel pins,
and the particular reconstruction algorithm used to generate the
cross-sectional images.
A few pins in the vicinity of the four close proximity control rods
appear quite distorted in the transverse cross sections. Because the control
rods are such strong attenuators of neutrons, the relatively transparent
nearby fuel rods are somewhat masked from view. Consequently, insufficient
information is available to accurately reconstruct these pins to the same
detail as others are reconstructed.
Offset and leaning rods also appear rather distorted in the transverse
cross sections. This is another familiar phenomenon. Irregular features,
such as offset and leaning fuel rods, in otherwise symmetrical arrays of fuel
elements are frequently inaccurately represented in cross-sectional
reconstructions. This occurs when an insufficient number of viewing angles is
used. In this case, 90 views is apparently insufficient to allow offset pins
to be accurately visualized.
The axial cross-sectional images are valuable in determining the
condition of the fuel rods. The axial images seem less sensitive to the
sources of distortion just mentioned. They more clearly show the actual •
pellet cross section. The fuel pellets appear homogeneous in the axial cross
sections, indicating no crumbling or other damage.
In summary, fuel rod condition can be determined with fair to good
reliability by NT using 90 views. Both transverse and axial cross-sectional
images are necessary to make such determinations.
22
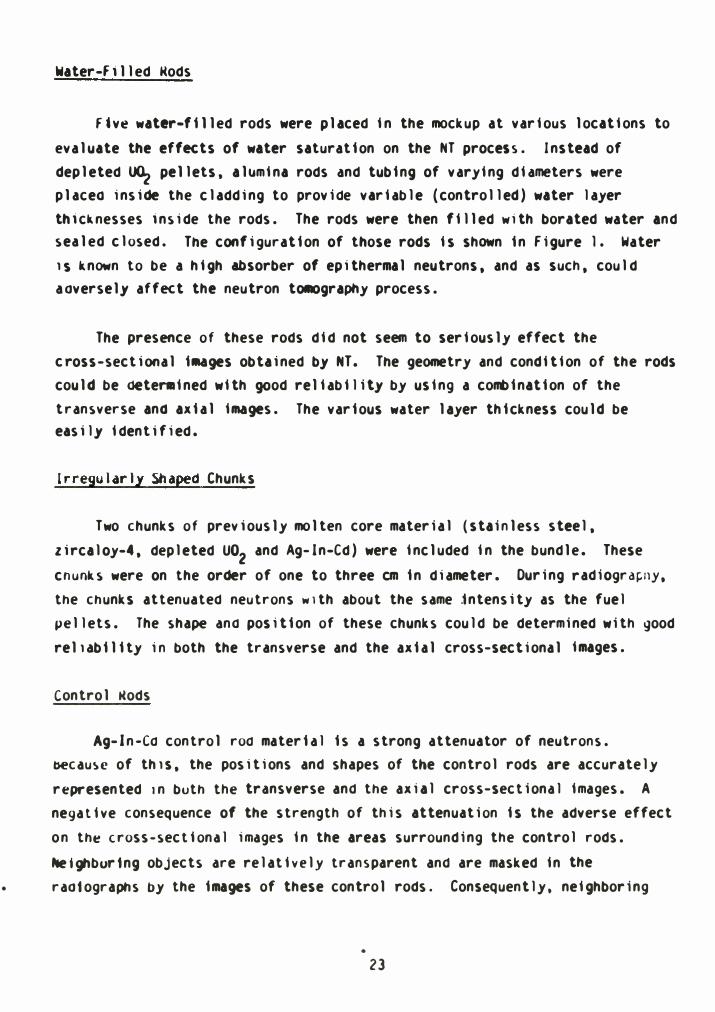
Water-filled Kods
fjve water-filled rods were placed in the mockup at various locations to
evaluate the effects of water saturation on the NT process. Instead of
depleted � pellets, alumina rods and tubing of varying diameters were
placeo inside the cl adding to provide variable (control led) water layer
thicknesses inside the rods. The rods were then filled with borated water and sealed cl osed. The configuration of those rods is shown in Figure 1. Water
15 known to be a high absorber of epithermal neutrons, and as such, coul d
aaversely affect the neutron tOMOgraphy process.
The presence of these rods did not seem to seriously effect the
cross-sectional i-.ges obtained by NT. The geometry and condition of the rods
could be oeten.ined with good reliability by using a combination of the
transverse ana axial images. The various water layer thickness could be easily identified.
Irregul arly Shaped Chunks
Two chunks of previously molten core material (stainless steel,
zircaloy-4, depl eted U02 and Ag-ln-Cd) were included in the bundle. These
cnunks were on the order of one to three em in diameter. During radiogra�ny,
the chunks attenuated neutrons w1th about the same Jntensity as the fuel
pel lets. The shape ana position of these chunks could be determined with good
rel1ability in both the transverse and the axial cross-sectional images.
Control Mods
Ag-ln-Co control roo material is a strong attenuator of neutrons.
becau�e of th1s, the positions and shapes of the control rods are accurately
represented 1n buth the transverse and the axial cross-sectional images. A
negative consequence of the strength of this attenuation is the adverse effect
on the cross-sectional images in the areas surrounding the control rods.
�ighburtng objects are relatively transparent and are masked in the
• raa1ographs by the images of these control rods. Consequently. neighboring
•
23
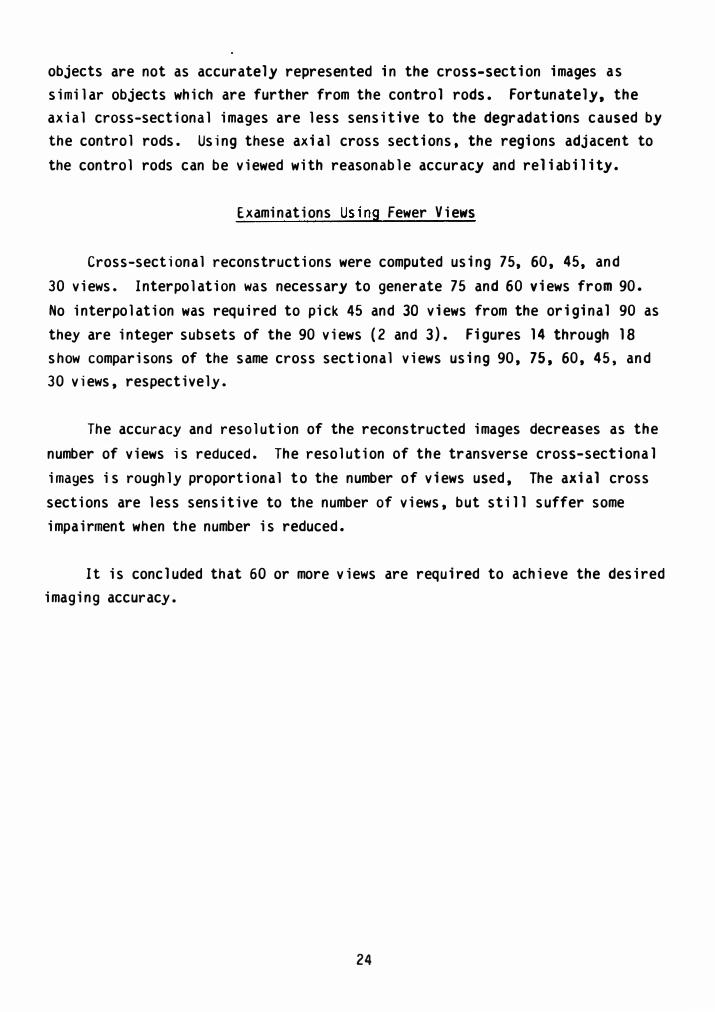
objects are not as accurately represented in the cross-section images as
similar objects which are further from the control rods. Fortunately, the
axial cross-sectional images are less sensitive to the degradations caused by
the control rods. Using these axial cross sections, the regions adjacent to
the control rods can be viewed with reasonable accuracy and reliability.
Examinations Using Fewer Views
Cross-sectional reconstructions were computed using 75, 60, 45, and
30 views. Interpolation was necessary to generate 75 and 60 views from 90. No interpolation was required to pick 45 and 30 views from the original 90 as
they are integer subsets of the 90 views (2 and 3). Figures 14 through 18
show comparisons of the same cross sectional views using 90, 75, 60, 45, and
30 views, respectively.
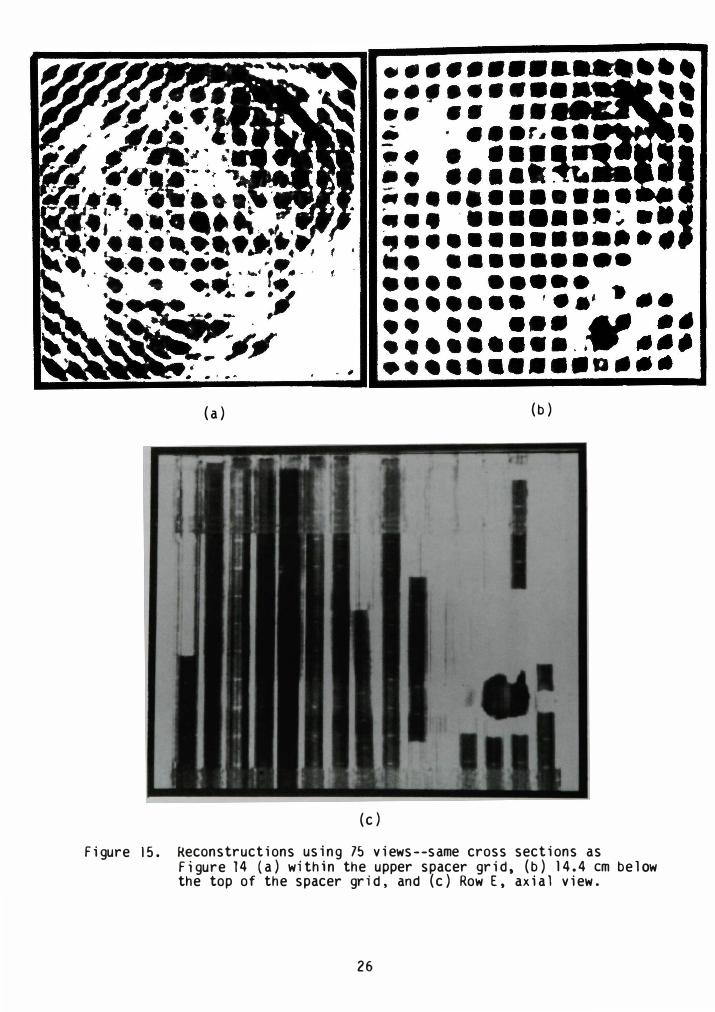
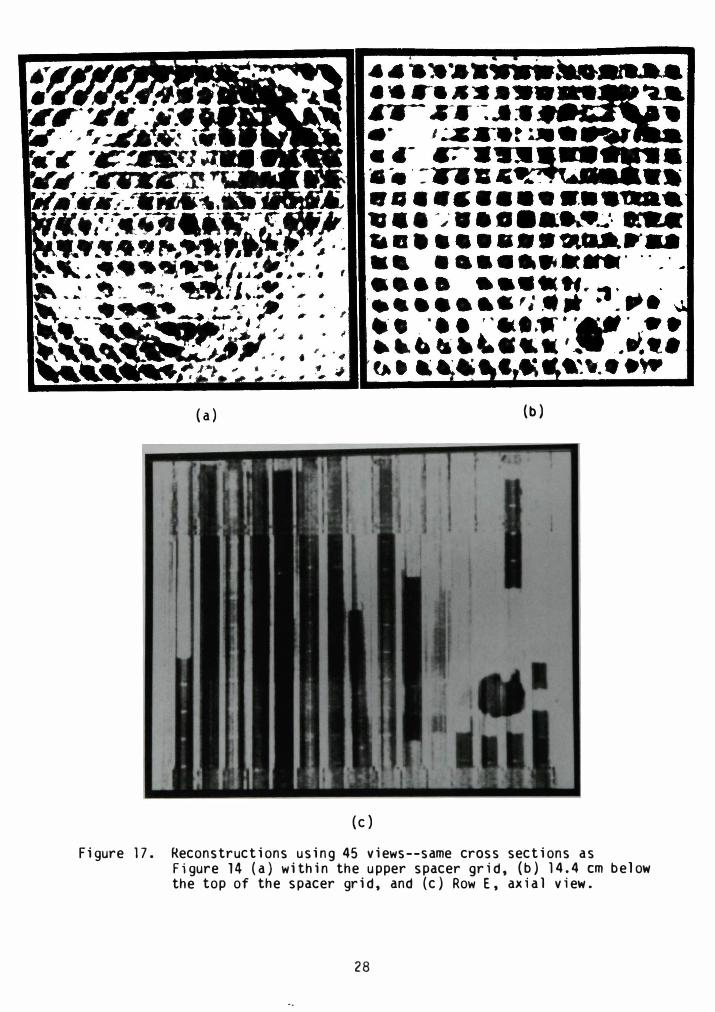
The accuracy and resolution of the reconstructed images decreases as the
number of views is reduced. The resolution of the transverse cross-sectional
images is roughly proportional to the number of views used, The axial cross
sections are less sensitive to the number of views, but still suffer some
impairment when the number is reduced.
It is concluded that 60 or more views are required to achieve the desired
imaging accuracy.
24
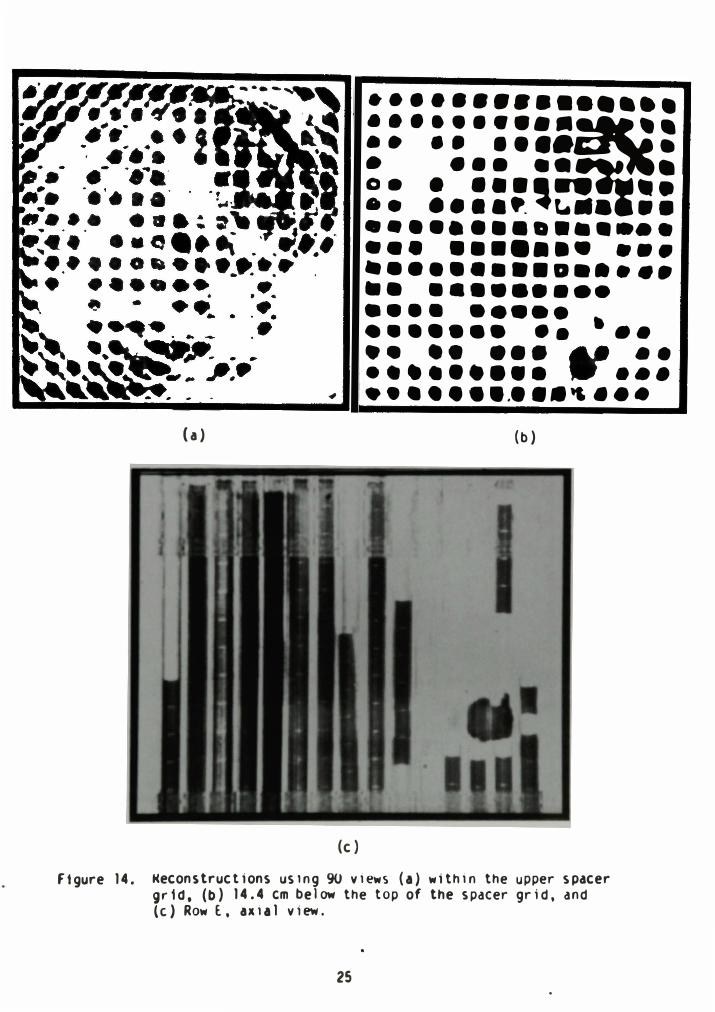
ftgure 14.
(a)
•••••••••••••••
. . . . . . . . . . !5. •• •• •••• •
. . .. ··= . o• • ••• .. •• .. ······'t.•• . . ••••••••••••••• ••• • •••••• ••• •••••••••a•••••
(c )
•• ••••••••• • ••• ••••• ....... .. - . . •• •• ••• &II •• ••••••••• • ••• .. . . . ••.• ··" ...
(b)
Keconstructions us1ng 90 views (a) within the upper spacer gr1d, (b) 14. 4 em below the top of the spacer grid, and (c) Row l, axial view.
25
(a) (b)
(c)
Figure 15. R�constructions .us�ng 75 views--same cross sections as
F1gure 14 (a) w1th1n the.
upper spacer grid, (b) 14. 4 em below the top of the spacer gr1d, and (c) RowE, axial view.
26
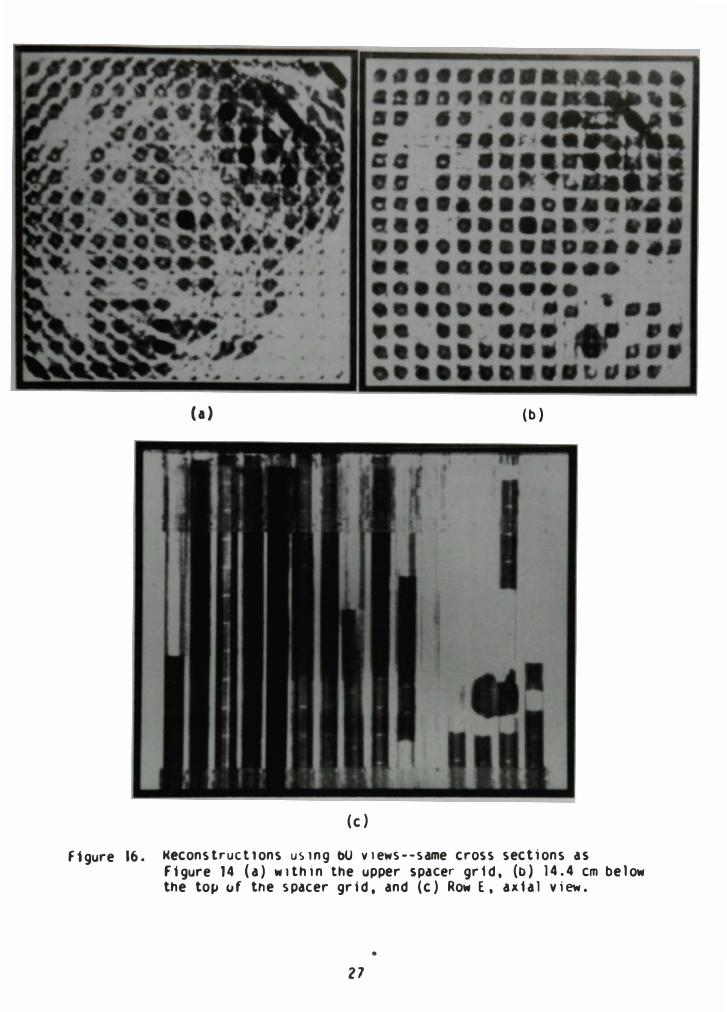
f1gure 16.
(a) (b)
(c)
Keconstructlons u�1ng bU v1ews--same cross sections as figure 14 (a) w1th1n the upper spacer grid, (b) 14.4 em below the to� uf the spacer gr1d, and (c) RowE, axial view •
•
27
(a) (b)
(c)
Figure 17. Reconstructions using 45 views--same cross sections as Figure 14 (a} within the upper spacer grid, (b) 14. 4 em below the top of the spacer grid, and (c) RowE, axial view.
28
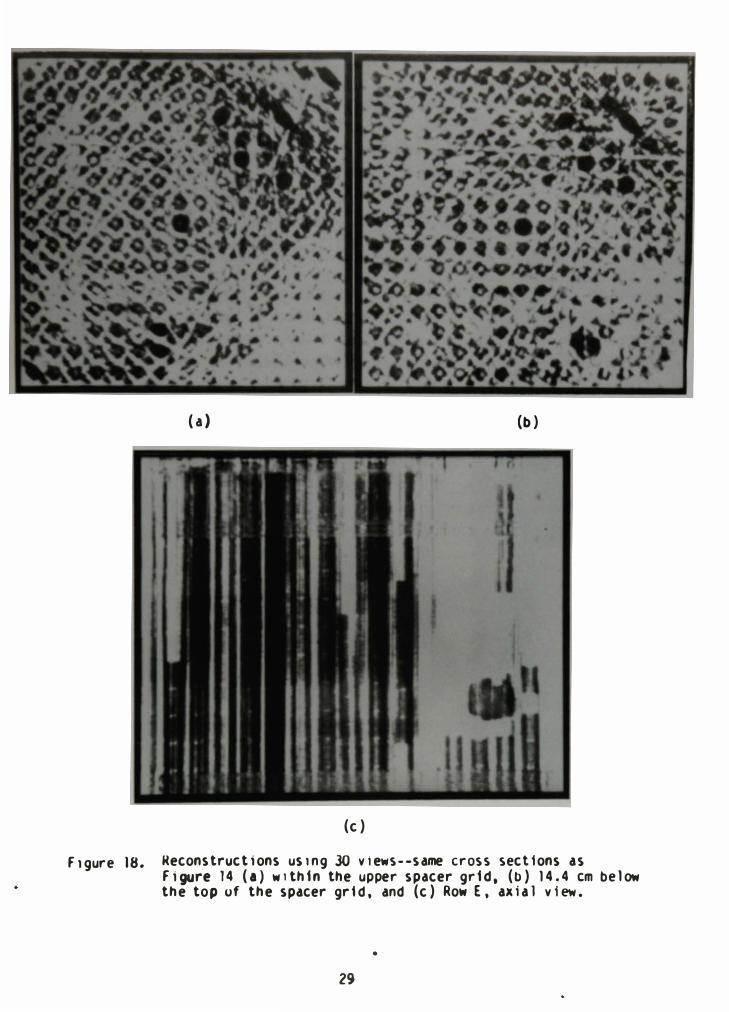
F1gure 18.
(a) (b)
(c)
Meconstruct1ons us1ng 30 views--same cross sections as Figure 14 (a) w1thin the upper spacer grid, (b) 14.4 em below the top uf the spacer grid, and (c) RowE, axial view •
•
29
CONCLUSIONS/RECOMMENDATIONS
This study demonstrated the feasibility of using NT to
nonaestructively examine a fuel assembly with mass and cross section
similar to a TMI-2 fuel assembly. Useful and reliable information can be
obtained regarding fuel assembly configuration, particularly the location
and condition of fuel and control materials within the assembly.
One condition that was not adequately studied, and which could
seriously affect the data results, is the effect of varying degrees of
water saturation in the fuel rods. This study used five water saturated
fuel rods only. If the quantity of water-saturated rods were increased to
become a significant percentage (25 or more) of the total, NT may not be
feasible due to total neutron absorption by the water. If NT becomes a
serious consideration for use on TMI-2 fuel assemblies, this study should
be expanded, varying the percentage of water-saturated rods within the fuel
assembly. Additionally. if a neutron poisoning material is used inside the
canister, the poisoning material likely will be detrimental to NT and
should be included in additional studies.
30