Embed Size (px)
Citation preview
DR
AF
T F
OR
CO
NS
ULT
AT
ION
ON
LY
NO
T T
O B
E C
ITE
D
1
DRAFT
CoolingACTION PLAN
INDIA
MINISTRY OF ENVIRONMENT, FOREST & CLIMATE CHANGEGOVERNMENT OF INDIA

DRAFT FOR CONSULTATION ONLY NOT TO BE CITED
September 2018

IND
IA C
OO
LIN
G A
CT
ION
PL
AN
ii
DR
AF
T F
OR
CO
NS
ULT
AT
ION
ON
LY
NO
T T
O B
E C
ITE
D
iii
Context Cooling is linked with economic growth and is recognised as key for the health and well-being of people in hot climates. India is a growing economy characterized by low penetration of air-conditioning, rising per capita income, rapid urbanization and a largely tropical climate, which would lead to rise in the requirement for cooling. Addressing the rising cooling requirement provides a challenge as well as a unique opportunity, by allowing synergies in policies and actions to address the cooling requirement across sectors, while making it sustainable and accessible to all.
Increasingly, cooling is recognized as a developmental need that is linked with achieving many Sustainable Development Goals. A large part of the cooling demand is catered through refrigerant-based cooling globally across sectors such as buildings, cold-chain, refrigeration and transport. Refrigerants used in cooling equipment are regulated under the Montreal Protocol regime.
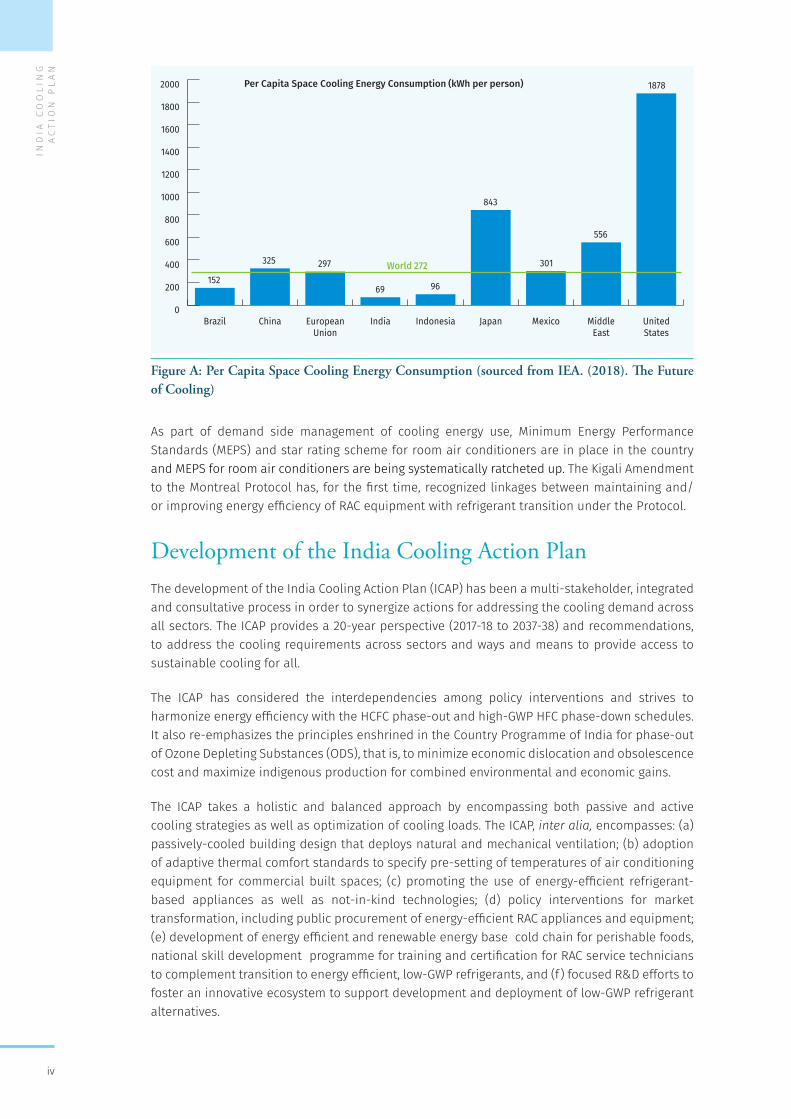
Another important aspect related to refrigerant-based cooling is energy use. According to the International Energy Agency (IEA), refrigeration and air conditioning (RAC) causes 10% of the global CO2 emissions. That being said, India has one of the lowest access to cooling across the world, which is reflected in its low per-capita levels of energy consumption for space cooling, at 69 kWh, as compared to the world-average of 272 kWh (Figure A).
Executive Summary
IND
IA C
OO
LIN
G A
CT
ION
PL
AN
iv
Figure A: Per Capita Space Cooling Energy Consumption (sourced from IEA. (2018). The Future of Cooling)
As part of demand side management of cooling energy use, Minimum Energy Performance Standards (MEPS) and star rating scheme for room air conditioners are in place in the country and MEPS for room air conditioners are being systematically ratcheted up. The Kigali Amendment to the Montreal Protocol has, for the first time, recognized linkages between maintaining and/or improving energy efficiency of RAC equipment with refrigerant transition under the Protocol.
Development of the India Cooling Action PlanThe development of the India Cooling Action Plan (ICAP) has been a multi-stakeholder, integrated and consultative process in order to synergize actions for addressing the cooling demand across all sectors. The ICAP provides a 20-year perspective (2017-18 to 2037-38) and recommendations, to address the cooling requirements across sectors and ways and means to provide access to sustainable cooling for all.
The ICAP has considered the interdependencies among policy interventions and strives to harmonize energy efficiency with the HCFC phase-out and high-GWP HFC phase-down schedules. It also re-emphasizes the principles enshrined in the Country Programme of India for phase-out of Ozone Depleting Substances (ODS), that is, to minimize economic dislocation and obsolescence cost and maximize indigenous production for combined environmental and economic gains.
The ICAP takes a holistic and balanced approach by encompassing both passive and active cooling strategies as well as optimization of cooling loads. The ICAP, inter alia, encompasses: (a) passively-cooled building design that deploys natural and mechanical ventilation; (b) adoption of adaptive thermal comfort standards to specify pre-setting of temperatures of air conditioning equipment for commercial built spaces; (c) promoting the use of energy-efficient refrigerant-based appliances as well as not-in-kind technologies; (d) policy interventions for market transformation, including public procurement of energy-efficient RAC appliances and equipment; (e) development of energy efficient and renewable energy base cold chain for perishable foods, national skill development programme for training and certification for RAC service technicians to complement transition to energy efficient, low-GWP refrigerants, and (f) focused R&D efforts to foster an innovative ecosystem to support development and deployment of low-GWP refrigerant alternatives.
0
200
400
600
800
1000
1200
1400
1600
1800
2000
UnitedStates
MiddleEast
MexicoJapanIndonesiaIndiaEuropeanUnion
ChinaBrazil
World 272152
325 297
69 96
843
301
556
1878Per Capita Space Cooling Energy Consumption (kWh per person)
DR
AF
T F
OR
CO
NS
ULT
AT
ION
ON
LY
NO
T T
O B
E C
ITE
D
v
The ICAP underscores the importance of the development and use of a robust mix of cooling technologies, including the use of energy-efficient appliances with appropriate environment-friendly refrigerants, for meeting the growing cooling requirement of the country.
India’s Cooling Growth Trajectory: Key FindingsThe ICAP explores two scenarios of cooling growth for various sectors: The Reference Scenario which assumes that the current policies and level of effort will move forward per established revision cycles (or historical trends, as applicable); and, the Intervention Scenario which factors in the positive impacts of accelerated and new interventions driven by policy, technology and market-drivers. The following key findings and highlights emerge from the research and analysis undertaken:
A. Cooling Demand
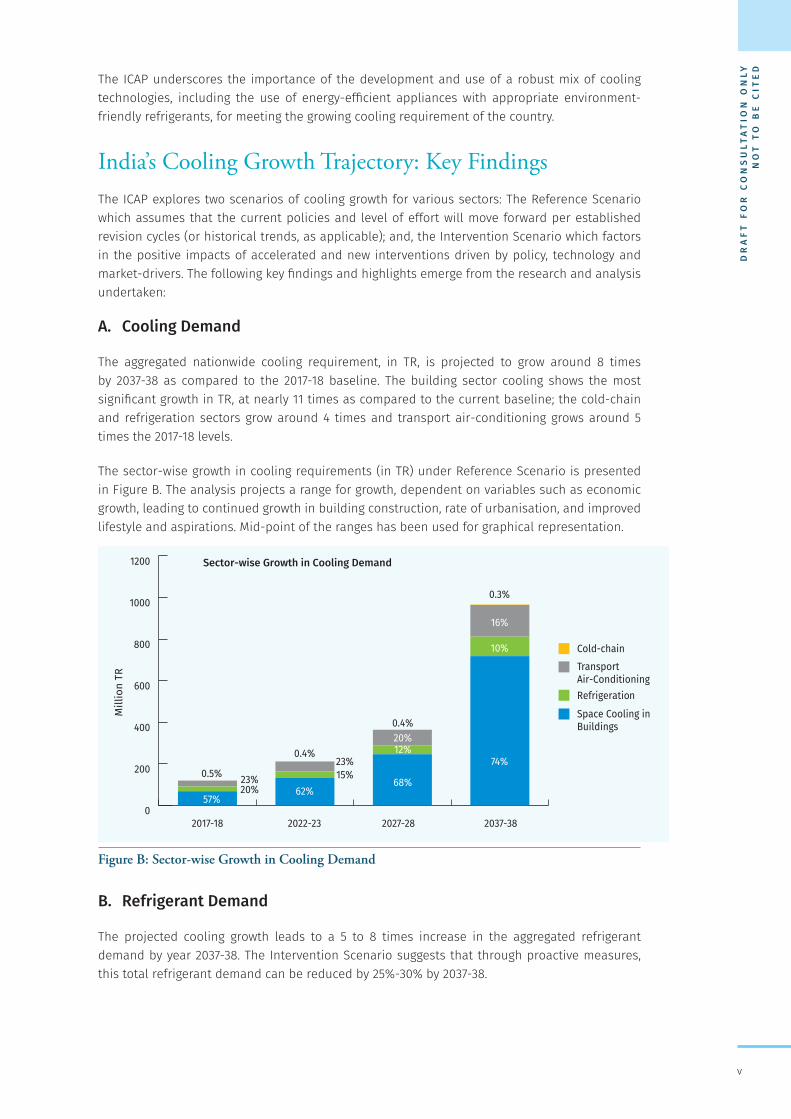
The aggregated nationwide cooling requirement, in TR, is projected to grow around 8 times by 2037-38 as compared to the 2017-18 baseline. The building sector cooling shows the most significant growth in TR, at nearly 11 times as compared to the current baseline; the cold-chain and refrigeration sectors grow around 4 times and transport air-conditioning grows around 5 times the 2017-18 levels.
The sector-wise growth in cooling requirements (in TR) under Reference Scenario is presented in Figure B. The analysis projects a range for growth, dependent on variables such as economic growth, leading to continued growth in building construction, rate of urbanisation, and improved lifestyle and aspirations. Mid-point of the ranges has been used for graphical representation.
Figure B: Sector-wise Growth in Cooling Demand
B. Refrigerant Demand
The projected cooling growth leads to a 5 to 8 times increase in the aggregated refrigerant demand by year 2037-38. The Intervention Scenario suggests that through proactive measures, this total refrigerant demand can be reduced by 25%-30% by 2037-38.
0
200
400
600
800
1000
1200
Cold-chainTransport Air-ConditioningRefrigerationSpace Cooling in Buildings
2037-382027-282022-232017-18
74%
10%
16%
0.3%
68%
12%20%0.4%
62%15%23%
0.4%
57%20%23%0.5%
Sector-wise Growth in Cooling Demand
Mill
ion
TR
IND
IA C
OO
LIN
G A
CT
ION
PL
AN
vi
C. Primary Energy Supply for Cooling
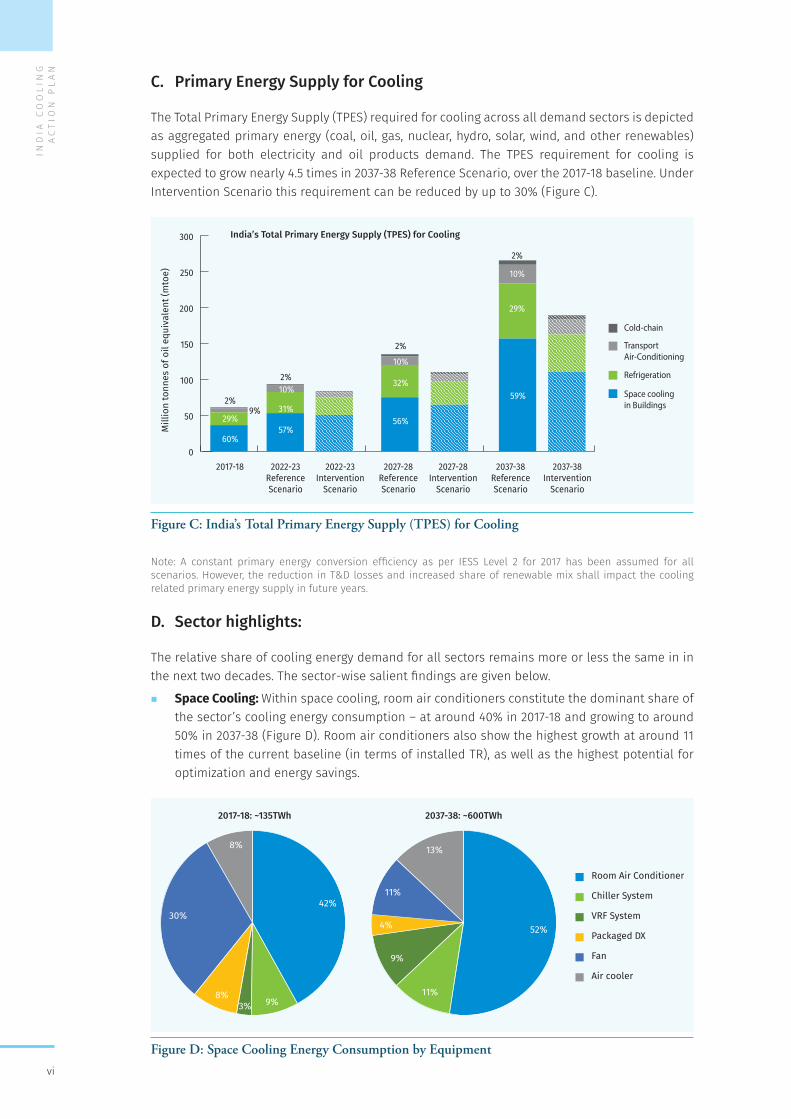
The Total Primary Energy Supply (TPES) required for cooling across all demand sectors is depicted as aggregated primary energy (coal, oil, gas, nuclear, hydro, solar, wind, and other renewables) supplied for both electricity and oil products demand. The TPES requirement for cooling is expected to grow nearly 4.5 times in 2037-38 Reference Scenario, over the 2017-18 baseline. Under Intervention Scenario this requirement can be reduced by up to 30% (Figure C).
Figure C: India’s Total Primary Energy Supply (TPES) for Cooling
Note: A constant primary energy conversion efficiency as per IESS Level 2 for 2017 has been assumed for all scenarios. However, the reduction in T&D losses and increased share of renewable mix shall impact the cooling related primary energy supply in future years.
D. Sector highlights:
The relative share of cooling energy demand for all sectors remains more or less the same in in the next two decades. The sector-wise salient findings are given below.
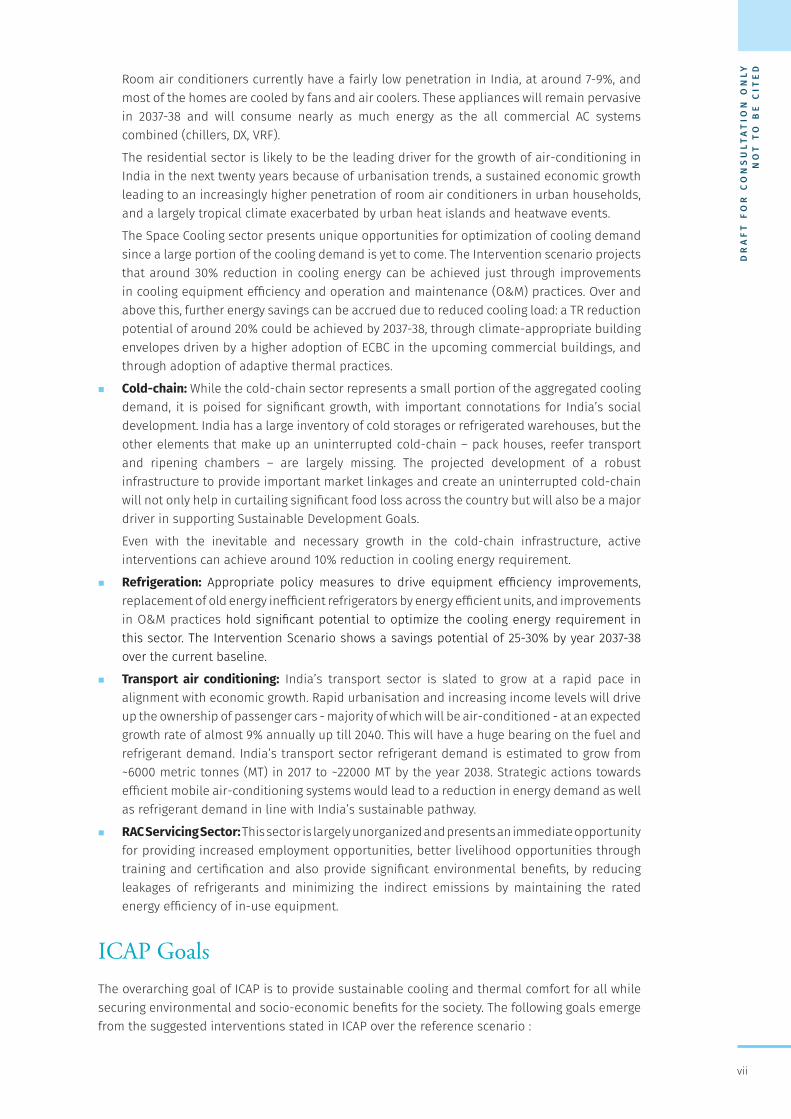
� Space Cooling: Within space cooling, room air conditioners constitute the dominant share of the sector’s cooling energy consumption – at around 40% in 2017-18 and growing to around 50% in 2037-38 (Figure D). Room air conditioners also show the highest growth at around 11 times of the current baseline (in terms of installed TR), as well as the highest potential for optimization and energy savings.
Figure D: Space Cooling Energy Consumption by Equipment
0
50
100
150
200
250
300
Cold-chain
TransportAir-Conditioning
Refrigeration
Space coolingin Buildings
2037-38Intervention
Scenario
2037-38ReferenceScenario
2027-28Intervention
Scenario
2027-28ReferenceScenario
2022-23Intervention
Scenario
2022-23ReferenceScenario
2017-18
60%57%
56%29%
10%32%
31%
10%
2%9%
2%
2%
59%
29%
10%
2%
India’s Total Primary Energy Supply (TPES) for Cooling
Mill
ion
tonn
es o
f oil
equi
vale
nt (m
toe)
Air cooler
Fan
Packaged DX
VRF System
Chiller System
Room Air Conditioner
42%
9%3%8%
30%
8%
52%
11%
9%
4%
11%
13%
2017-18: ~135TWh 2037-38: ~600TWh
DR
AF
T F
OR
CO
NS
ULT
AT
ION
ON
LY
NO
T T
O B
E C
ITE
D
vii
Room air conditioners currently have a fairly low penetration in India, at around 7-9%, and most of the homes are cooled by fans and air coolers. These appliances will remain pervasive in 2037-38 and will consume nearly as much energy as the all commercial AC systems combined (chillers, DX, VRF).
The residential sector is likely to be the leading driver for the growth of air-conditioning in India in the next twenty years because of urbanisation trends, a sustained economic growth leading to an increasingly higher penetration of room air conditioners in urban households, and a largely tropical climate exacerbated by urban heat islands and heatwave events.
The Space Cooling sector presents unique opportunities for optimization of cooling demand since a large portion of the cooling demand is yet to come. The Intervention scenario projects that around 30% reduction in cooling energy can be achieved just through improvements in cooling equipment efficiency and operation and maintenance (O&M) practices. Over and above this, further energy savings can be accrued due to reduced cooling load: a TR reduction potential of around 20% could be achieved by 2037-38, through climate-appropriate building envelopes driven by a higher adoption of ECBC in the upcoming commercial buildings, and through adoption of adaptive thermal practices.
� Cold-chain: While the cold-chain sector represents a small portion of the aggregated cooling demand, it is poised for significant growth, with important connotations for India’s social development. India has a large inventory of cold storages or refrigerated warehouses, but the other elements that make up an uninterrupted cold-chain – pack houses, reefer transport and ripening chambers – are largely missing. The projected development of a robust infrastructure to provide important market linkages and create an uninterrupted cold-chain will not only help in curtailing significant food loss across the country but will also be a major driver in supporting Sustainable Development Goals.
Even with the inevitable and necessary growth in the cold-chain infrastructure, active interventions can achieve around 10% reduction in cooling energy requirement.
� Refrigeration: Appropriate policy measures to drive equipment efficiency improvements, replacement of old energy inefficient refrigerators by energy efficient units, and improvements in O&M practices hold significant potential to optimize the cooling energy requirement in this sector. The Intervention Scenario shows a savings potential of 25-30% by year 2037-38 over the current baseline.
� Transport air conditioning: India’s transport sector is slated to grow at a rapid pace in alignment with economic growth. Rapid urbanisation and increasing income levels will drive up the ownership of passenger cars - majority of which will be air-conditioned - at an expected growth rate of almost 9% annually up till 2040. This will have a huge bearing on the fuel and refrigerant demand. India’s transport sector refrigerant demand is estimated to grow from ~6000 metric tonnes (MT) in 2017 to ~22000 MT by the year 2038. Strategic actions towards efficient mobile air-conditioning systems would lead to a reduction in energy demand as well as refrigerant demand in line with India’s sustainable pathway.
� RAC Servicing Sector: This sector is largely unorganized and presents an immediate opportunity for providing increased employment opportunities, better livelihood opportunities through training and certification and also provide significant environmental benefits, by reducing leakages of refrigerants and minimizing the indirect emissions by maintaining the rated energy efficiency of in-use equipment.
ICAP GoalsThe overarching goal of ICAP is to provide sustainable cooling and thermal comfort for all while securing environmental and socio-economic benefits for the society. The following goals emerge from the suggested interventions stated in ICAP over the reference scenario :
IND
IA C
OO
LIN
G A
CT
ION
PL
AN
viii
1. Recognition of “cooling and related areas” as a thrust area of research under national science and technology programme to support development of technological solutions and encourage innovation challenges.
2. Reduction of cooling demand across sectors by 20% to 25 % by year 2037-38
3. Reduction of refrigerant demand by 25% to 30% by year 2037-38
4. Reduction of cooling energy requirements by 25% to 40% by year 2037-38
5. Training and certification of 100,000 servicing sector technicians by year 2022-23, synergizing with Skill India Mission
Priority Areas Identified by the ICAP1. Promote development and commercialization of technology pathways, especially low-
energy cooling technologies, which would reduce the energy footprint of active cooling: Through the right combination of policy and market drivers, the private sector must be enabled to lead the technology development through innovation and R&D. The technology pathways must include, inter alia, the evolution of not-in-kind technologies for scaled-up adoption.
2. Accelerate (i) reduction of the cooling load of the building sector through fast-tracked implementation of building energy codes, (ii) adoption of adaptive thermal comfort standards, (iii) ratcheting-up energy efficiency of room air-conditioners and fans, and (iv) enhancing consumer awareness through eco-labelling of cooling products: In the light of significant increase (~3x) in building area by 2037-38 (over 2017-18 baseline), the role of building energy efficiency will become increasingly important in terms of reducing the cooling load requirements.
3. Public Procurement of (i) energy efficient cooling equipment and (ii) trained and certified RAC service technicians for public buildings.
4. Allocate government funding and support towards targeted programmes to enable cooling for the economically weaker segment: 20 years from now, there will still be a significant proportion of the population without access to air-conditioning or without any reliable mechanical means for cooling. Government support for the vulnerable communities should include strategies such as: enforcing efficient building envelope guidelines from ECBC-R in the design and construction of housing for EWS and LIG to enable thermal comfort for all; funding and support for initiatives led by local municipalities and NGOs, such as cool-roof programs, off-grid micro-systems for cooling, and localized heat-action plans.
5. Drive skill-building of the service sector through training and certification: With major portion of RACHP service technicians working in the informal sector, there is a need to bring the service technicians into the formal sector through training and certification programme. MoEF&CC should work together with other concerned ministries for up-skilling and certification of RACHP service technicians under Pradhan Mantri Kaushal Vikas Yojana.
6. Ensure harmonization of policies: ICAP builds on the efforts of HCFC Phase-out Management Plan. There should be synergy between the existing plans to phase-out HCFCs and the new plans to phase-down the use of high GWP HFCs. ICAP is starting the new planning process to do an assessment of the timing of HCFC phase-out initiatives to ensure that costs are minimised and that the environmental benefits of both policies are maximised. Furthermore, the ICAP recommendations bring in synergies with ongoing government programmes and schemes in order to maximize the social and economic co-benefits.
7. Create an ecosystem for promoting robust and collaborative R&D: A robust, comprehensive and R&D innovation ecosystem will be critically important for effectively addressing India’s cooling requirement. In this context, the role of public-private-partnerships will become important.
DR
AF
T F
OR
CO
NS
ULT
AT
ION
ON
LY
NO
T T
O B
E C
ITE
D
ix
Implementation FrameworkThe ICAP serves to underscore the urgency of proactively and collaboratively addressing India’s projected cooling growth and lays out sector-wide priorities and pathways for interventions. Given the cross-cutting nature of cooling demand, the ICAP implementation will be best served by active collaboration among the relevant ministries as well as the private sector entities. For effective implementation, the ICAP must be monitored and executed under the governance of a high level multi-ministerial framework.

IND
IA C
OO
LIN
G A
CT
ION
PL
AN
x
DR
AF
T F
OR
CO
NS
ULT
AT
ION
ON
LY
NO
T T
O B
E C
ITE
D
xi
Contents
Chapter 1: Introduction – A Synergistic Approach to Cooling 1
1.1 Background 1
1.2 Cooling is a Developmental Need 2
1.3 Synergistic Actions for Securing Environmental and Socio-economic Benefits 3
1.4 Development of India Cooling Action Plan (ICAP) 4
1.5 Unique Features of ICAP 7
1.6 Organization of the ICAP document 7
1.7 Broad Objectives of ICAP 7
Chapter 2 : Space Cooling In Buildings 2.1 Introduction 92.2 Building Stock and its Cooling Demand 10
2.2.1 Residential Sector 112.2.2 Commercial building Sector 13
2.3 Space Cooling Technologies 142.3.1 Overview of Refrigerant-based Cooling Technologies 142.3.2 Overview of Non-refrigerant-based Cooling Technologies 162.3.3 Overview of Not-in-Kind Technologies 172.3.4 Passive Cooling using Energy-efficient Building Envelope 19
2.4 Analysis 202.4.1 Methodology 202.4.2 Inputs and Assumptions 202.4.3 Stock & Growth of Space Cooling Technologies 222.4.4 Suggested Interventions 242.4.5 Impact of Suggested Interventions 25
2.5 Recommendations 26
Chapter 3 : Cold-Chain & Refrigeration3.1 Introduction 29
3.1.1 Overview of Cold-chain Infrastructure 303.1.2 Growth Drivers 31
3.2 Cold-chain & Refrigeration Components 323.2.1 Pack-house 323.2.2 Reefer Transport 323.2.3 Cold Storage 323.2.4 Ripening Chamber 333.2.5 Milk Chillers 333.2.6 Domestic Refrigeration 343.2.7 Commercial Refrigeration 34
3.3 Analysis and Results 343.4 The Future of Cold-chain & Refrigeration 373.5 Recommendations 38
Chapter 4 : Transport Air-Conditioning4.1 Overview 414.2 Analysis 42
IND
IA C
OO
LIN
G A
CT
ION
PL
AN
xii
4.2.1 Methodology 424.2.2 Passenger Car segment 434.2.3 Passenger Bus Segment 444.2.4 Trucks 454.2.5 Railway 45
4.3 Refrigerant Demand 474.3.1 Road Transport 47
4.4 The Future of Transport Air-conditioning 494.4.1 MAC System Technologies and Future Trends 50
4.5 Policy Mapping 514.6 Recommendations 52
Chapter 5 : Refrigeration & Air-Conditioning Servicing Sector5.1 Introduction 555.2 RAC Servicing Sector 56
5.2.1 Use of Refrigerants in RAC Servicing Sector 565.2.2 Energy Efficiency of Air-conditioning Equipment and Servicing Sector 565.2.3 Servicing Practices 575.2.4 Market growth: An Immediate Need to Plug the Data Gap 585.2.5 Training and Certification 58
5.3 Enterprise Characteristics 615.3.1 Manufacturing Companies 625.3.2 Third Party Servicing Companies 625.3.3 Freelance Technicians 625.3.4 Challenge of asymmetric information 62
5.4 Livelihoods and Social Security 635.5 Recommendations 64
Chapter 6 : Refrigerant Demand and Indigenous Production6.1 Background 676.2 Overview of Production Sector 686.3 Refrigerant Production 686.4 Proposed Refrigerant Pathways 686.5 Recommendations 69
Chapter 7 : Research & Development7.1 Background 717.2 Development of Refrigerants 72
7.2.1 Government Initiative for R&D for Low-GWP Alternatives to HFCs 737.3 Development of HVAC&R Technology 737.4 Scope of R&D and Potential Areas of Technological Interventions 747.5 Recommendations 75
Chapter 8 : Recommendations and Way Forward8.1 Background 778.2 Short, Medium and Long-term Recommendations 788.3 Implementation Framework 83
AppedixAppendix A (Space Cooling in Buildings) 85Appendix B (Cold-Chain & Refrigeration) 86
References 87
DR
AF
T F
OR
CO
NS
ULT
AT
ION
ON
LY
NO
T T
O B
E C
ITE
D
xiii
List of Figures
Figure 1.1: HFC Phase-down Schedule for Article 5 Countries 4
Figure 1.2: ICAP Multi-stakeholder Development Framework 5
Figure 2.1: Climate Zone Map of India 9
Figure 2.2: Number of Households with Room Air Conditioners 12
Figure 2.3: Room Air Conditioner Stock in Urban and Rural Households 12
Figure 2.4: Total & Air-conditioned Area in Commercial Buildings 13
Figure 2.5: AC Demand in the Commercial Building Stock 13
Figure 2.6: Room Air Conditioner Stock Projections Under Low and High Growth Scenarios 23
Figure 2.7: 2017-18 Refrigerant-based Equipment Stock 23
Figure 2.8: 2022-23 Refrigerant-based Equipment Stock 23
Figure 2.9: 2027-28 Refrigerant-based Equipment Stock 23
Figure 2.10: 2037-38 Refrigerant-based Equipment Stock 23
Figure 2.11: Non-refrigerant-based Equipment Stock 24
Figure 2.12: Annual Refrigerant Demand (incl. Servicing) in Space Cooling in Buildings 26
Figure 2.13: Annual Energy Consumption from Space Cooling in Buildings 26
Figure 3.1: Schematic Depiction of the Flow of Produce in a Typical Cold-chain 29
Figure 3.2: Current and Future Trends in Pack-houses 35
Figure 3.3: Current and Future Trends in Reefer Vehicles 35
Figure 3.4: Current and Future Trends in Cold Storages 35
Figure 3.5: Current and Future Trends in Ripening Chambers 36
Figure 3.6: Current and Future Trends in Domestic Refrigeration 36
Figure 3.7: Current and Future Trends in Commercial Refrigeration 36
Figure 3.8: Refrigerant Demand in Cold-chain & Refrigeration 37
Figure 4.1: Transport Sector Overview 42
Figure 4.2: Schematic of the Assessment Model 43
Figure 4.3: Estimated Passenger Car Stock 44
Figure 4.4: Energy Demand Projection due to MAC in Passenger Car segment 44
Figure 4.5: Estimated Passenger Bus Stock 45
Figure 4.6: Energy Demand Projection due to MAC in Bus segment 45
Figure 4.7: Estimated railway traffic (BPKM) 46
Figure 4.8: Energy Demand Projection in Railway Sector due to Air conditioning 46
Figure 4.9: Refrigerant Demand in Passenger Cars Segment 47
Figure 4.10: Refrigerant Demand in Bus segment 48
Figure 4.11: Refrigerant Demand Projection in Railway Sector 49
Figure 5.1: Framework of RAC servicing sector 56
Figure 5.2: Pattern of GSPs Followed by RAC servicing Technicians 57
Figure 5.3: Percentage of Trained Technicians in Formal and Informal Sectors 59
Figure 5.4: Service Sector Training Landscape 60
Figure 7.1: R&D Innovation Ecosystem 72
IND
IA C
OO
LIN
G A
CT
ION
PL
AN
xiv
List of Tables
Table 2.1: Temperature and RH Characteristics of India’s Climate Types 10
Table 2.2: Component Efficiency Improvement 15
Table 2.3: Assessment of Not-in-kind Cooling Technologies 18
Table 2.4: Building Envelope Options to Reduce Cooling Load 19
Table 3.1: Temperature Requirements of Different Kinds of Produce (NCCD, 2015) 30
Table 3.2: Cold-chain – Current Infrastructure & Gap (NCCD, 2015) 31
Table 4.1: Assumptions for GDP and population growth rates in India 43
Table 4.2: Summary of Projected Vehicle Stocks & Railway Traffic 46
Table 4.3: Assumptions for Road Transport 47
Table 4.4: Assumptions for railway sector 49
Table 4.5: Short-term, medium-term, and long-term refrigerant demand 49
Table 6.1: Refrigerant Production 68
Table 8.1: Short, Medium and Long-term Recommendations 79
Table 8.2: Socio-economic Co-benefits Proposed by ICAP 83
DR
AF
T F
OR
CO
NS
ULT
AT
ION
ON
LY
NO
T T
O B
E C
ITE
D
1
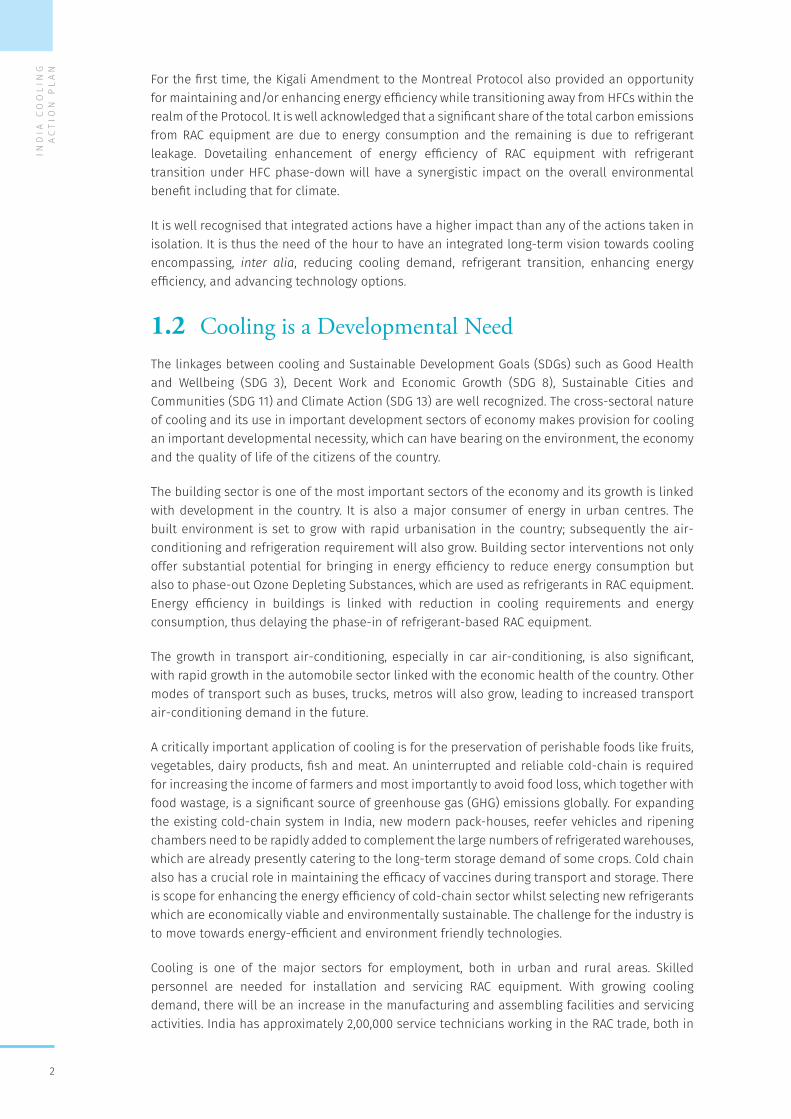
1.1 BackgroundCooling is a cross-sectoral requirement and an essential element for economic growth. There is significant use of cooling in different sectors of the economy such as residential and commercial buildings, cold-chain, refrigeration, transport and industries. The cooling demand in these and other sectors will grow in the future due to the expected economic growth of the country, increasing per capita income, population growth, urbanisation as well as existing low penetration of air-conditioning.
Cooling is also intimately associated with human health, well-being and productivity. The need to ensure thermal comfort for all and access to cooling across the populace is even more important considering the tropical climate of India.
A large part of the country’s cooling requirements across sectors is met using active refrigeration and air-conditioning (RAC) technologies, which are based on the use of either synthetic refrigerants or natural refrigerants. Most synthetic refrigerants either have an Ozone Depleting Potential (ODP) and/or a Global Warming Potential (GWP) and are regulated for phase-out/phase-down as per agreed schedules under the Montreal Protocol on Substances that Deplete the Ozone Layer, to which India is a party.
The Montreal Protocol has been a driver for the adoption of environmentally friendly and energy-efficient technologies by the industry. In the past, while transitioning away from controlled refrigerants under the Montreal Protocol, many new technologies have been adopted by the industry. The Kigali Amendment to the Montreal Protocol was adopted by the Parties to the Montreal Protocol in October 2016 for phase-down of Hydrofluorocarbons (HFCs). These chemicals are not ozone depleting but have a high GWP values.
Introduction – A Synergistic Approach to Cooling
1
IND
IA C
OO
LIN
G A
CT
ION
PL
AN
2
For the first time, the Kigali Amendment to the Montreal Protocol also provided an opportunity for maintaining and/or enhancing energy efficiency while transitioning away from HFCs within the realm of the Protocol. It is well acknowledged that a significant share of the total carbon emissions from RAC equipment are due to energy consumption and the remaining is due to refrigerant leakage. Dovetailing enhancement of energy efficiency of RAC equipment with refrigerant transition under HFC phase-down will have a synergistic impact on the overall environmental benefit including that for climate.
It is well recognised that integrated actions have a higher impact than any of the actions taken in isolation. It is thus the need of the hour to have an integrated long-term vision towards cooling encompassing, inter alia, reducing cooling demand, refrigerant transition, enhancing energy efficiency, and advancing technology options.
1.2 Cooling is a Developmental NeedThe linkages between cooling and Sustainable Development Goals (SDGs) such as Good Health and Wellbeing (SDG 3), Decent Work and Economic Growth (SDG 8), Sustainable Cities and Communities (SDG 11) and Climate Action (SDG 13) are well recognized. The cross-sectoral nature of cooling and its use in important development sectors of economy makes provision for cooling an important developmental necessity, which can have bearing on the environment, the economy and the quality of life of the citizens of the country.
The building sector is one of the most important sectors of the economy and its growth is linked with development in the country. It is also a major consumer of energy in urban centres. The built environment is set to grow with rapid urbanisation in the country; subsequently the air-conditioning and refrigeration requirement will also grow. Building sector interventions not only offer substantial potential for bringing in energy efficiency to reduce energy consumption but also to phase-out Ozone Depleting Substances, which are used as refrigerants in RAC equipment. Energy efficiency in buildings is linked with reduction in cooling requirements and energy consumption, thus delaying the phase-in of refrigerant-based RAC equipment.
The growth in transport air-conditioning, especially in car air-conditioning, is also significant, with rapid growth in the automobile sector linked with the economic health of the country. Other modes of transport such as buses, trucks, metros will also grow, leading to increased transport air-conditioning demand in the future.
A critically important application of cooling is for the preservation of perishable foods like fruits, vegetables, dairy products, fish and meat. An uninterrupted and reliable cold-chain is required for increasing the income of farmers and most importantly to avoid food loss, which together with food wastage, is a significant source of greenhouse gas (GHG) emissions globally. For expanding the existing cold-chain system in India, new modern pack-houses, reefer vehicles and ripening chambers need to be rapidly added to complement the large numbers of refrigerated warehouses, which are already presently catering to the long-term storage demand of some crops. Cold chain also has a crucial role in maintaining the efficacy of vaccines during transport and storage. There is scope for enhancing the energy efficiency of cold-chain sector whilst selecting new refrigerants which are economically viable and environmentally sustainable. The challenge for the industry is to move towards energy-efficient and environment friendly technologies.
Cooling is one of the major sectors for employment, both in urban and rural areas. Skilled personnel are needed for installation and servicing RAC equipment. With growing cooling demand, there will be an increase in the manufacturing and assembling facilities and servicing activities. India has approximately 2,00,000 service technicians working in the RAC trade, both in
DR
AF
T F
OR
CO
NS
ULT
AT
ION
ON
LY
NO
T T
O B
E C
ITE
D
3
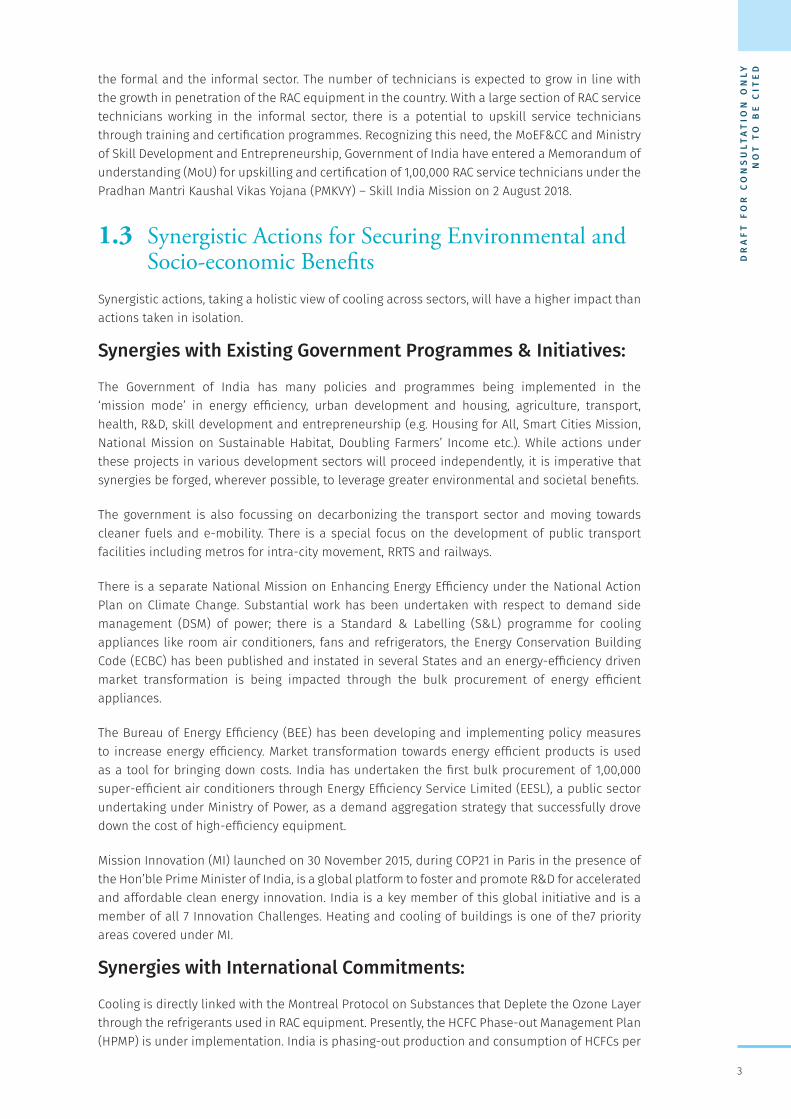
the formal and the informal sector. The number of technicians is expected to grow in line with the growth in penetration of the RAC equipment in the country. With a large section of RAC service technicians working in the informal sector, there is a potential to upskill service technicians through training and certification programmes. Recognizing this need, the MoEF&CC and Ministry of Skill Development and Entrepreneurship, Government of India have entered a Memorandum of understanding (MoU) for upskilling and certification of 1,00,000 RAC service technicians under the Pradhan Mantri Kaushal Vikas Yojana (PMKVY) – Skill India Mission on 2 August 2018.
1.3 Synergistic Actions for Securing Environmental and Socio-economic Benefits
Synergistic actions, taking a holistic view of cooling across sectors, will have a higher impact than actions taken in isolation.
Synergies with Existing Government Programmes & Initiatives:
The Government of India has many policies and programmes being implemented in the ‘mission mode’ in energy efficiency, urban development and housing, agriculture, transport, health, R&D, skill development and entrepreneurship (e.g. Housing for All, Smart Cities Mission, National Mission on Sustainable Habitat, Doubling Farmers’ Income etc.). While actions under these projects in various development sectors will proceed independently, it is imperative that synergies be forged, wherever possible, to leverage greater environmental and societal benefits.
The government is also focussing on decarbonizing the transport sector and moving towards cleaner fuels and e-mobility. There is a special focus on the development of public transport facilities including metros for intra-city movement, RRTS and railways.
There is a separate National Mission on Enhancing Energy Efficiency under the National Action Plan on Climate Change. Substantial work has been undertaken with respect to demand side management (DSM) of power; there is a Standard & Labelling (S&L) programme for cooling appliances like room air conditioners, fans and refrigerators, the Energy Conservation Building Code (ECBC) has been published and instated in several States and an energy-efficiency driven market transformation is being impacted through the bulk procurement of energy efficient appliances.
The Bureau of Energy Efficiency (BEE) has been developing and implementing policy measures to increase energy efficiency. Market transformation towards energy efficient products is used as a tool for bringing down costs. India has undertaken the first bulk procurement of 1,00,000 super-efficient air conditioners through Energy Efficiency Service Limited (EESL), a public sector undertaking under Ministry of Power, as a demand aggregation strategy that successfully drove down the cost of high-efficiency equipment.
Mission Innovation (MI) launched on 30 November 2015, during COP21 in Paris in the presence of the Hon’ble Prime Minister of India, is a global platform to foster and promote R&D for accelerated and affordable clean energy innovation. India is a key member of this global initiative and is a member of all 7 Innovation Challenges. Heating and cooling of buildings is one of the7 priority areas covered under MI.
Synergies with International Commitments:
Cooling is directly linked with the Montreal Protocol on Substances that Deplete the Ozone Layer through the refrigerants used in RAC equipment. Presently, the HCFC Phase-out Management Plan (HPMP) is under implementation. India is phasing-out production and consumption of HCFCs per
IND
IA C
OO
LIN
G A
CT
ION
PL
AN
4
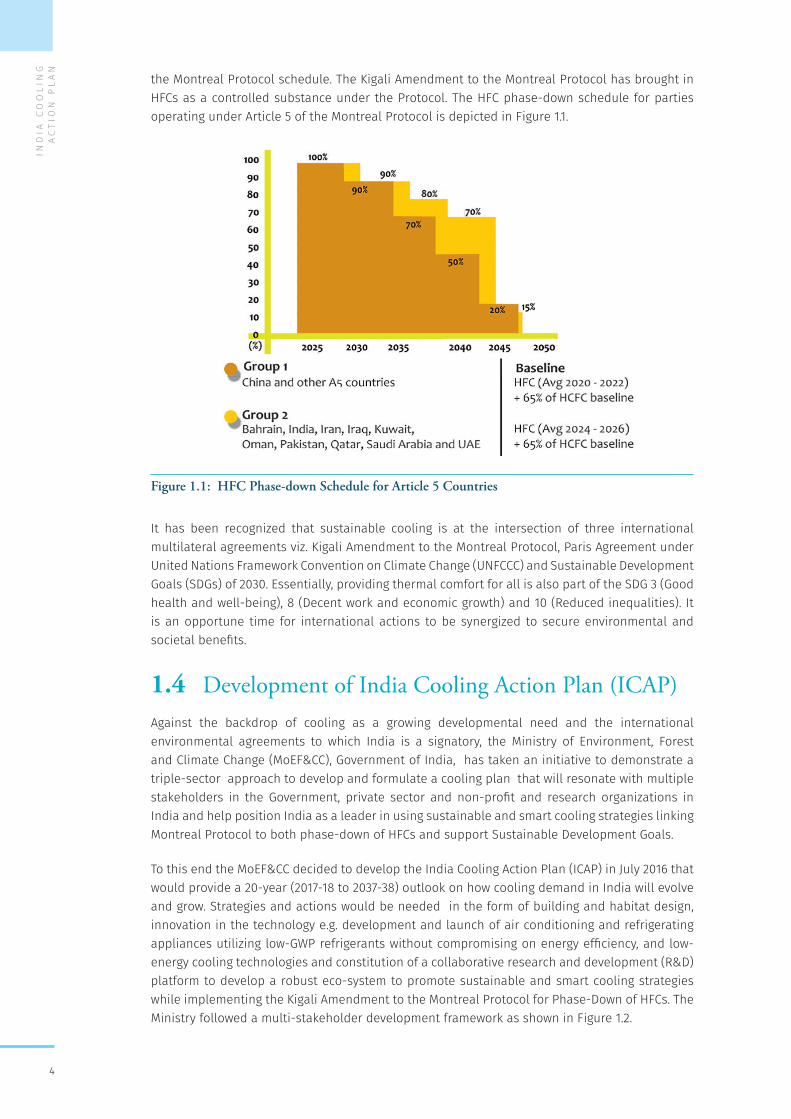
the Montreal Protocol schedule. The Kigali Amendment to the Montreal Protocol has brought in HFCs as a controlled substance under the Protocol. The HFC phase-down schedule for parties operating under Article 5 of the Montreal Protocol is depicted in Figure 1.1.
Figure 1.1: HFC Phase-down Schedule for Article 5 Countries
It has been recognized that sustainable cooling is at the intersection of three international multilateral agreements viz. Kigali Amendment to the Montreal Protocol, Paris Agreement under United Nations Framework Convention on Climate Change (UNFCCC) and Sustainable Development Goals (SDGs) of 2030. Essentially, providing thermal comfort for all is also part of the SDG 3 (Good health and well-being), 8 (Decent work and economic growth) and 10 (Reduced inequalities). It is an opportune time for international actions to be synergized to secure environmental and societal benefits.
1.4 Development of India Cooling Action Plan (ICAP)Against the backdrop of cooling as a growing developmental need and the international environmental agreements to which India is a signatory, the Ministry of Environment, Forest and Climate Change (MoEF&CC), Government of India, has taken an initiative to demonstrate a triple-sector approach to develop and formulate a cooling plan that will resonate with multiple stakeholders in the Government, private sector and non-profit and research organizations in India and help position India as a leader in using sustainable and smart cooling strategies linking Montreal Protocol to both phase-down of HFCs and support Sustainable Development Goals.
To this end the MoEF&CC decided to develop the India Cooling Action Plan (ICAP) in July 2016 that would provide a 20-year (2017-18 to 2037-38) outlook on how cooling demand in India will evolve and grow. Strategies and actions would be needed in the form of building and habitat design, innovation in the technology e.g. development and launch of air conditioning and refrigerating appliances utilizing low-GWP refrigerants without compromising on energy efficiency, and low-energy cooling technologies and constitution of a collaborative research and development (R&D) platform to develop a robust eco-system to promote sustainable and smart cooling strategies while implementing the Kigali Amendment to the Montreal Protocol for Phase-Down of HFCs. The Ministry followed a multi-stakeholder development framework as shown in Figure 1.2.
DR
AF
T F
OR
CO
NS
ULT
AT
ION
ON
LY
NO
T T
O B
E C
ITE
D
5
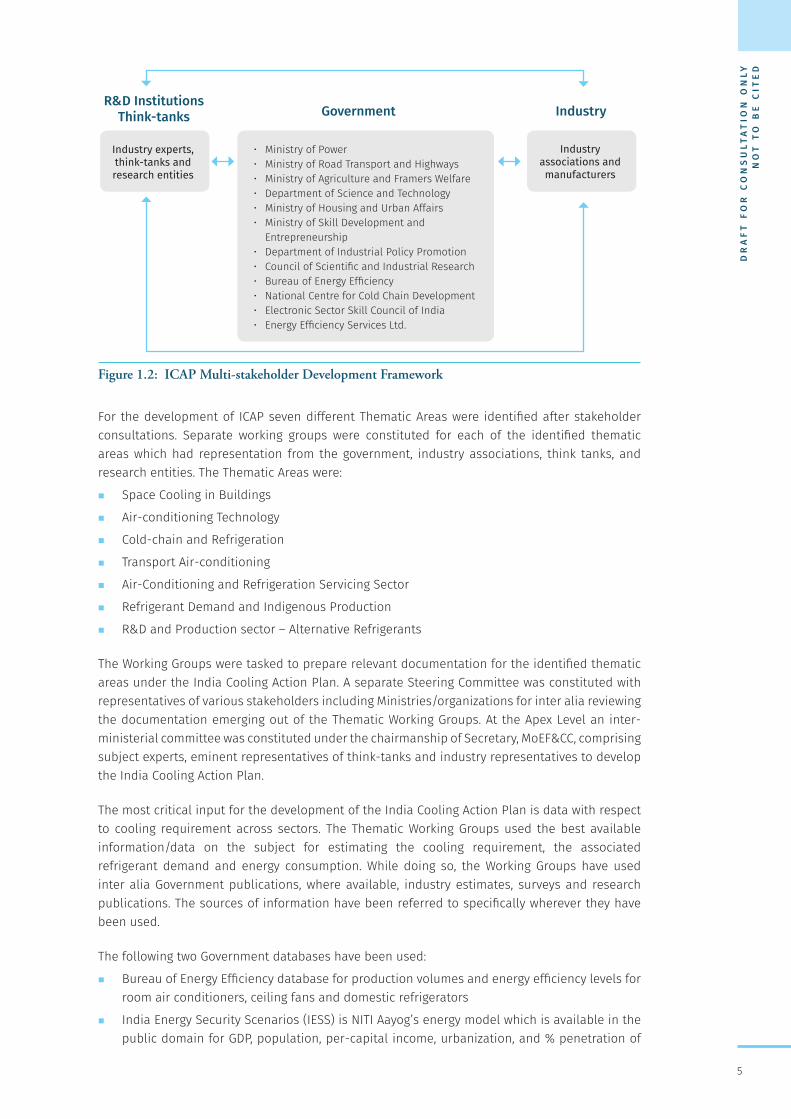
Figure 1.2: ICAP Multi-stakeholder Development Framework
For the development of ICAP seven different Thematic Areas were identified after stakeholder consultations. Separate working groups were constituted for each of the identified thematic areas which had representation from the government, industry associations, think tanks, and research entities. The Thematic Areas were:
� Space Cooling in Buildings
� Air-conditioning Technology
� Cold-chain and Refrigeration
� Transport Air-conditioning
� Air-Conditioning and Refrigeration Servicing Sector
� Refrigerant Demand and Indigenous Production
� R&D and Production sector – Alternative Refrigerants
The Working Groups were tasked to prepare relevant documentation for the identified thematic areas under the India Cooling Action Plan. A separate Steering Committee was constituted with representatives of various stakeholders including Ministries/organizations for inter alia reviewing the documentation emerging out of the Thematic Working Groups. At the Apex Level an inter-ministerial committee was constituted under the chairmanship of Secretary, MoEF&CC, comprising subject experts, eminent representatives of think-tanks and industry representatives to develop the India Cooling Action Plan.
The most critical input for the development of the India Cooling Action Plan is data with respect to cooling requirement across sectors. The Thematic Working Groups used the best available information/data on the subject for estimating the cooling requirement, the associated refrigerant demand and energy consumption. While doing so, the Working Groups have used inter alia Government publications, where available, industry estimates, surveys and research publications. The sources of information have been referred to specifically wherever they have been used.
The following two Government databases have been used:
� Bureau of Energy Efficiency database for production volumes and energy efficiency levels for room air conditioners, ceiling fans and domestic refrigerators
� India Energy Security Scenarios (IESS) is NITI Aayog’s energy model which is available in the public domain for GDP, population, per-capital income, urbanization, and % penetration of
Industry experts,think-tanks andresearch entities
Industryassociations andmanufacturers
• Ministry of Power• Ministry of Road Transport and Highways• Ministry of Agriculture and Framers Welfare• Department of Science and Technology• Ministry of Housing and Urban Affairs• Ministry of Skill Development and
Entrepreneurship• Department of Industrial Policy Promotion• Council of Scientific and Industrial Research• Bureau of Energy Efficiency• National Centre for Cold Chain Development• Electronic Sector Skill Council of India• Energy Efficiency Services Ltd.
Government IndustryR&D Institutions
Think-tanks
IND
IA C
OO
LIN
G A
CT
ION
PL
AN
6
cooling appliances. The assumptions used in the ICAP analysis draw from this government model, except where new information is available that warrants updating the IESS numbers since the model was prepared three years ago
The Working Groups have used the following two scenarios while projecting the cooling requirement in future:
� Reference Scenario which assumes that the current policies and level of effort will move forward per established revision cycles (or historical trends, as applicable)
� Intervention Scenario which factors in the positive impacts of new interventions driven by policy drivers, technology and market-drivers as identified in this ICAP
For better clarity, the terms cooling capacity/requirement, refrigerant use and energy use/ consumption have been explained below:
Cooling capacity: The cooling growth is expressed in terms of installed TR for space cooling (refrigerant-based air-conditioning), cold chain and refrigeration and transport air-conditioning sectors. Where applicable, the cooling growth is also expressed in terms of million units of stock (such as for room air conditioners). Installed TR is defined as the cooling TR capacity in the market at any given point, after factoring in existing equipment, new equipment sales and retirement of old equipment. For the transport air-conditioning sector, the growth is also expressed in terms of the growth of stock for road-transport and the growth in passenger kilometres travelled for railway. The transport cooling growth is a seen as a derivative of the two.
Refrigerant use: The refrigerant utilised towards cooling (including servicing) has been shown for each of the cooling sectors (in metric tonnes).
Energy consumption: The cooling energy consumption for space cooling, cold-chain and refrigeration sectors is expressed in terms of units (TWh) of final energy, that is, the total energy consumed by the end users, excluding T&D and production losses. The cooling energy consumption for transport air-conditioning has been expressed in terms of oil equivalents or joules of energy utilised towards cooling.
For an overarching and relative view of nationwide cooling needs across all sectors, the cooling energy consumption for all sectors is presented in terms of units of primary energy (tonnes of oil equivalent), in the Executive Summary, and it includes consumption by the energy sector, all types of losses and, all final energy consumed.
The data with respect to cooling requirement generated by the various thematic working groups provide a trend rather than definitive estimates. This is because data used from various sources may have many underlying assumptions. In view of the limited availability of data on cooling and related aspects, which has also been acknowledged by various international publications on cooling, the numbers generated by the Working Groups are best estimates arrived at in the limited time available for setting out a plan of action.
ICAP delineates future cooling scenarios; therefore, it cannot be a static document and should respond to the evolving knowledge and technology landscape, and social and economic development in the country. To that extent ICAP is open-ended. It can identify unknowns, develop empirical evidences as it proceeds in implementation, and evolve accordingly.
DR
AF
T F
OR
CO
NS
ULT
AT
ION
ON
LY
NO
T T
O B
E C
ITE
D
7
1.5 Unique Features of ICAP � A synergistic approach to holistically address cooling requirement
� Multiple stakeholder involvement across sectors (Figure 1.2)
• Synergize energy efficiency and the transition to low GWP refrigerants
• Takes a holistic view of policy interventions and their interdependencies
� A balanced perspective recognising that India’s cooling growth is in alignment with its developmental needs
� Identifies the scale and impact of the growth of cooling
� Collects and collates best available nationwide data and inputs from domain experts on various thematic areas of cooling.
1.6 Organization of the ICAP documentThe ICAP has covered various sectors where cooling is required in separate chapters; each chapter provides (i) snapshot of the present cooling requirement, (ii) technologies available to cater to cooling requirement including both refrigerant-based technologies and alternative technologies, where available, (iii) project the future cooling requirement, the associated refrigerant demand and energy use under two alternative scenarios – reference scenario and intervention scenario as explained above, (iv) assumptions for the projections and source of data used for the projections are mentioned at appropriate places and (v) suggested interventions.
The chapter on production sector of refrigerants, RAC servicing sector and R&D have specifically dealt with the issues for bringing out the actions which would be required in the 20-year time horizon in line with the cooling requirement projections and the suggested intervention scenario. The way forward and recommendations chapter provides the linkages and synergies of actions suggested under the ICAP with various ongoing Government programmes and also summarizes the socio-economic benefits over and above the environmental benefits which shall accrue from the actions.
1.7 Broad Objectives of ICAP � Assessment of cooling requirements across sectors in next 20 years and the associated
refrigerant demand and energy use
� Map the technologies available to cater the cooling requirement including passive interventions, refrigerant-based technologies, and alternative technologies such as not-in-kind technologies
� Suggest interventions in each sector to provide for sustainable cooling and thermal comfort for all
� Focus on skilling of RAC service technicians
� Develop an R&D innovation ecosystem for indigenous development of alternative technologies

IND
IA C
OO
LIN
G A
CT
ION
PL
AN
8
DR
AF
T F
OR
CO
NS
ULT
AT
ION
ON
LY
NO
T T
O B
E C
ITE
D
9
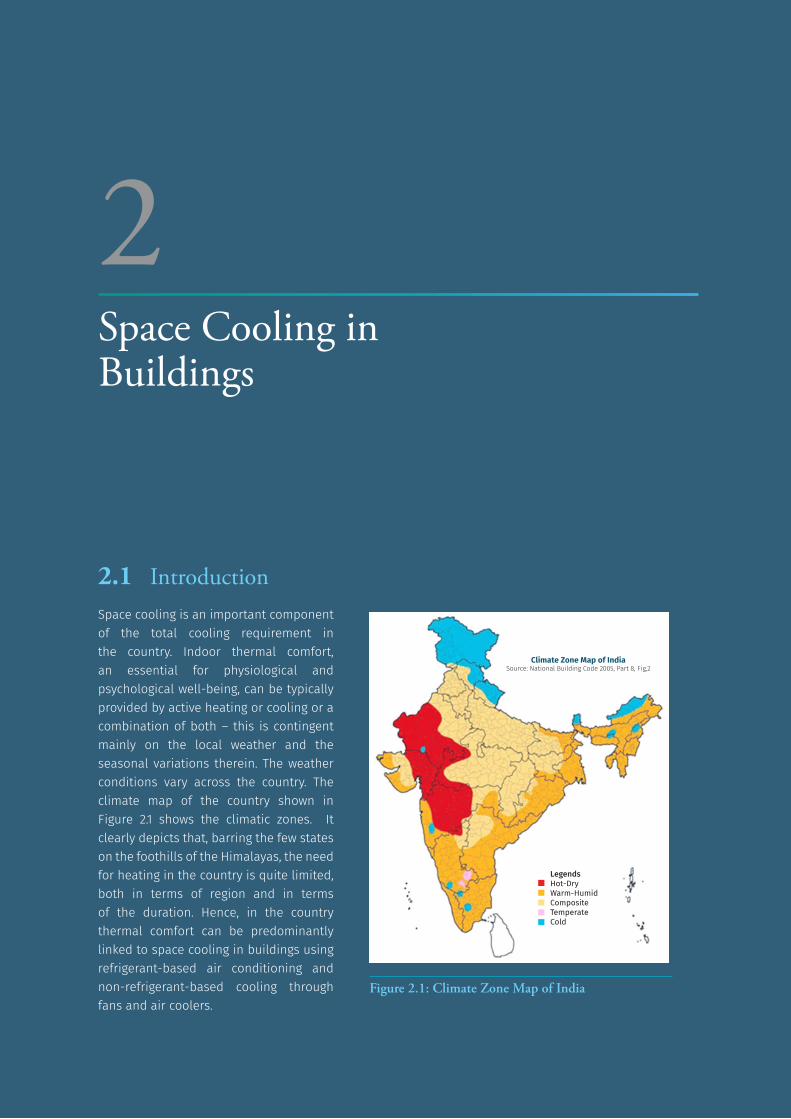
2.1 Introduction Space cooling is an important component of the total cooling requirement in the country. Indoor thermal comfort, an essential for physiological and psychological well-being, can be typically provided by active heating or cooling or a combination of both – this is contingent mainly on the local weather and the seasonal variations therein. The weather conditions vary across the country. The climate map of the country shown in Figure 2.1 shows the climatic zones. It clearly depicts that, barring the few states on the foothills of the Himalayas, the need for heating in the country is quite limited, both in terms of region and in terms of the duration. Hence, in the country thermal comfort can be predominantly linked to space cooling in buildings using refrigerant-based air conditioning and non-refrigerant-based cooling through fans and air coolers.
Space Cooling in Buildings
2
Figure 2.1: Climate Zone Map of India
LegendsHot-DryWarm-HumidCompositeTemperateCold
Climate Zone Map of IndiaSource: National Building Code 2005, Part 8, Fig,2
IND
IA C
OO
LIN
G A
CT
ION
PL
AN
10
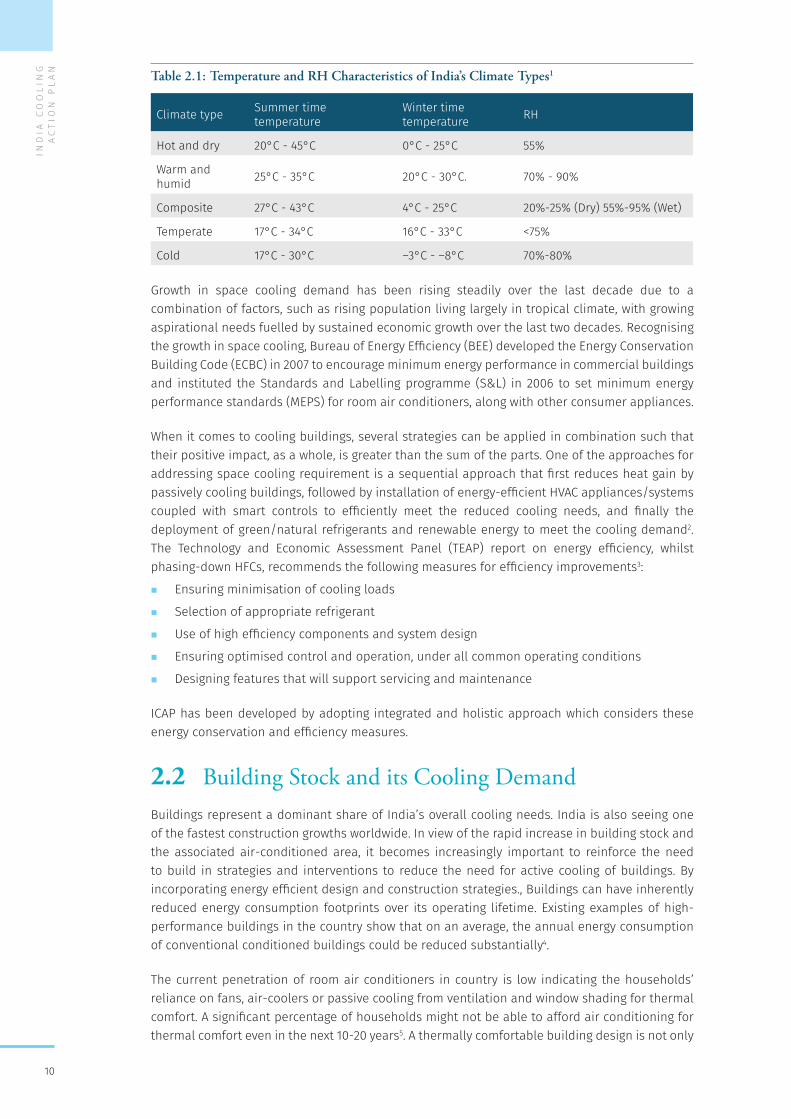
Table 2.1: Temperature and RH Characteristics of India’s Climate Types1
Climate type Summer time temperature
Winter time temperature RH
Hot and dry 20°C - 45°C 0°C - 25°C 55%
Warm and humid 25°C - 35°C 20°C - 30°C. 70% - 90%
Composite 27°C - 43°C 4°C - 25°C 20%-25% (Dry) 55%-95% (Wet)
Temperate 17°C - 34°C 16°C - 33°C <75%
Cold 17°C - 30°C –3°C - –8°C 70%-80%
Growth in space cooling demand has been rising steadily over the last decade due to a combination of factors, such as rising population living largely in tropical climate, with growing aspirational needs fuelled by sustained economic growth over the last two decades. Recognising the growth in space cooling, Bureau of Energy Efficiency (BEE) developed the Energy Conservation Building Code (ECBC) in 2007 to encourage minimum energy performance in commercial buildings and instituted the Standards and Labelling programme (S&L) in 2006 to set minimum energy performance standards (MEPS) for room air conditioners, along with other consumer appliances.
When it comes to cooling buildings, several strategies can be applied in combination such that their positive impact, as a whole, is greater than the sum of the parts. One of the approaches for addressing space cooling requirement is a sequential approach that first reduces heat gain by passively cooling buildings, followed by installation of energy-efficient HVAC appliances/systems coupled with smart controls to efficiently meet the reduced cooling needs, and finally the deployment of green/natural refrigerants and renewable energy to meet the cooling demand2. The Technology and Economic Assessment Panel (TEAP) report on energy efficiency, whilst phasing-down HFCs, recommends the following measures for efficiency improvements3:
� Ensuring minimisation of cooling loads
� Selection of appropriate refrigerant
� Use of high efficiency components and system design
� Ensuring optimised control and operation, under all common operating conditions
� Designing features that will support servicing and maintenance
ICAP has been developed by adopting integrated and holistic approach which considers these energy conservation and efficiency measures.
2.2 Building Stock and its Cooling Demand Buildings represent a dominant share of India’s overall cooling needs. India is also seeing one of the fastest construction growths worldwide. In view of the rapid increase in building stock and the associated air-conditioned area, it becomes increasingly important to reinforce the need to build in strategies and interventions to reduce the need for active cooling of buildings. By incorporating energy efficient design and construction strategies., Buildings can have inherently reduced energy consumption footprints over its operating lifetime. Existing examples of high-performance buildings in the country show that on an average, the annual energy consumption of conventional conditioned buildings could be reduced substantially4.
The current penetration of room air conditioners in country is low indicating the households’ reliance on fans, air-coolers or passive cooling from ventilation and window shading for thermal comfort. A significant percentage of households might not be able to afford air conditioning for thermal comfort even in the next 10-20 years5. A thermally comfortable building design is not only
DR
AF
T F
OR
CO
NS
ULT
AT
ION
ON
LY
NO
T T
O B
E C
ITE
D
11
important to achieve reduced cooling requirement, but also from a climate resilience perspective. Urban areas are most vulnerable to climate change impacts such as increased temperature and urban heat island effects due to their lack of access to passive cooling, thermally comfortable housing and common cooling services. Building climate-resilient housing and providing affordable and efficient cooling appliances, especially fans and air coolers, will reduce these vulnerabilities6.
Under national missions like Housing for All, Smart Cities and Solar Cities, country is witnessing significant increases in commercial and residential building stocks and with expected lock-in period of several decades., It is imperative to design and construct for thermal comfort using affordable and sustainable building design principles. National Mission on Sustainable Habitat (NMSH), National Mission on Enhanced Energy Efficiency (NMEEE) now renamed ROSHANEE, Energy Conservation Building Code (ECBC – both for commercial and residential) focus on building design and construction practices but require widespread and rigorous implementation to fully realise their potential.
This section maps commercial and residential building sectors’ current stock7, and its growth trajectory over the next 20 years, to comprehend the upcoming cooling demand from these sectors. The cooling demand numbers have been presented here to provide trends and are based upon industry information, surveys and research conducted by various organizations earlier except where specifically stated. It also presents a view of how this cooling demand might change with urbanisation, rising income and an increasing shift towards energy efficient building design and construction practices and technological interventions that will lead to more efficient appliances and air conditioning equipment required to provide thermal comfort.
2.2.1 Residential Sector
In 2017, approximately 272 million households were estimated in India which will increase to 328 and 386 million in 2027 and 2037 respectively8. Census 20119 of the country breaks down the number of households in the following segments: non-exclusive room, one room, two rooms, three rooms, four rooms and five rooms and above. Approximately 60%-70% of all the households fall in one room and two room categories. National Building Code (2016)10 and various housing policies/ missions/ reports11,12,13 provide a range of floor area for each category of households. Built in floor area for each household segment is estimated based on the aforementioned data and extensive discussions with experts and in the working group. The available data was extrapolated to arrive at the current and future built-up stock within each category of households. One room, two rooms, three rooms and more than 3 rooms segments cover 31%, 23%, 38% and 8% respectively in 2017 and it is assumed that similar trends would be followed for next ten years. Residential floor area CAGR from IESS was also referred to align the medium and long-term floor area for the residential sector.
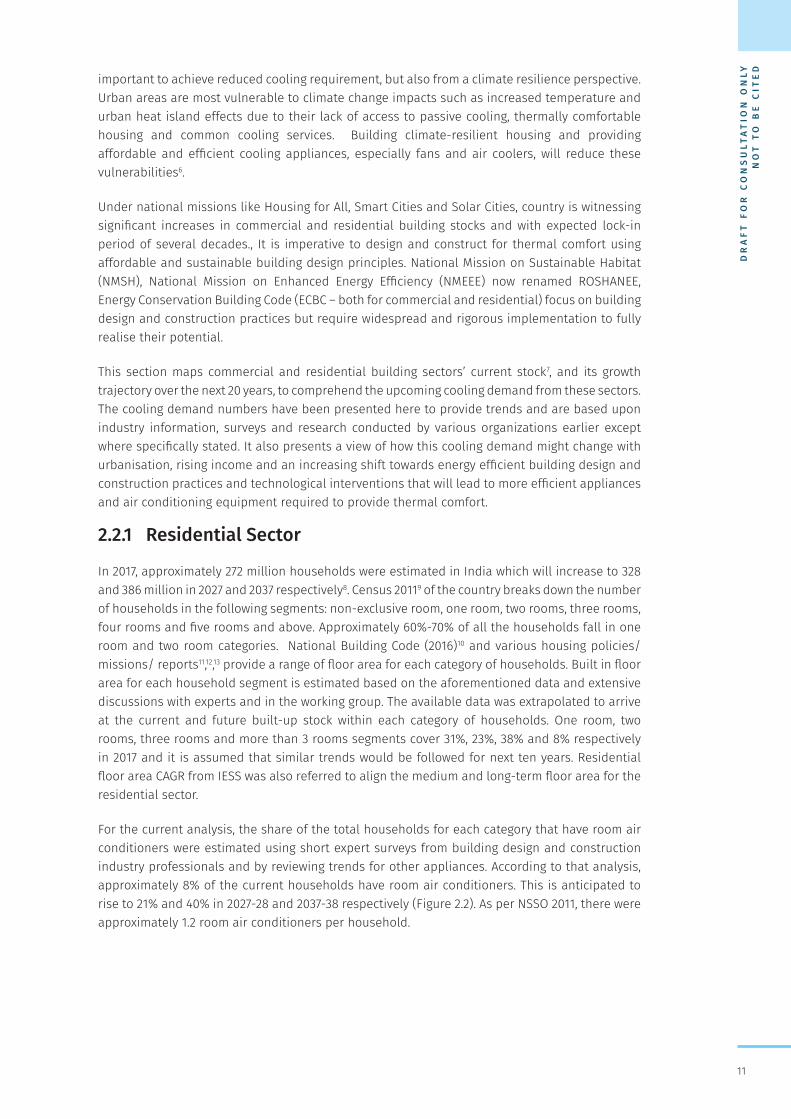
For the current analysis, the share of the total households for each category that have room air conditioners were estimated using short expert surveys from building design and construction industry professionals and by reviewing trends for other appliances. According to that analysis, approximately 8% of the current households have room air conditioners. This is anticipated to rise to 21% and 40% in 2027-28 and 2037-38 respectively (Figure 2.2). As per NSSO 2011, there were approximately 1.2 room air conditioners per household.
IND
IA C
OO
LIN
G A
CT
ION
PL
AN
12
Figure 2.2: Number of Households with Room Air Conditioners
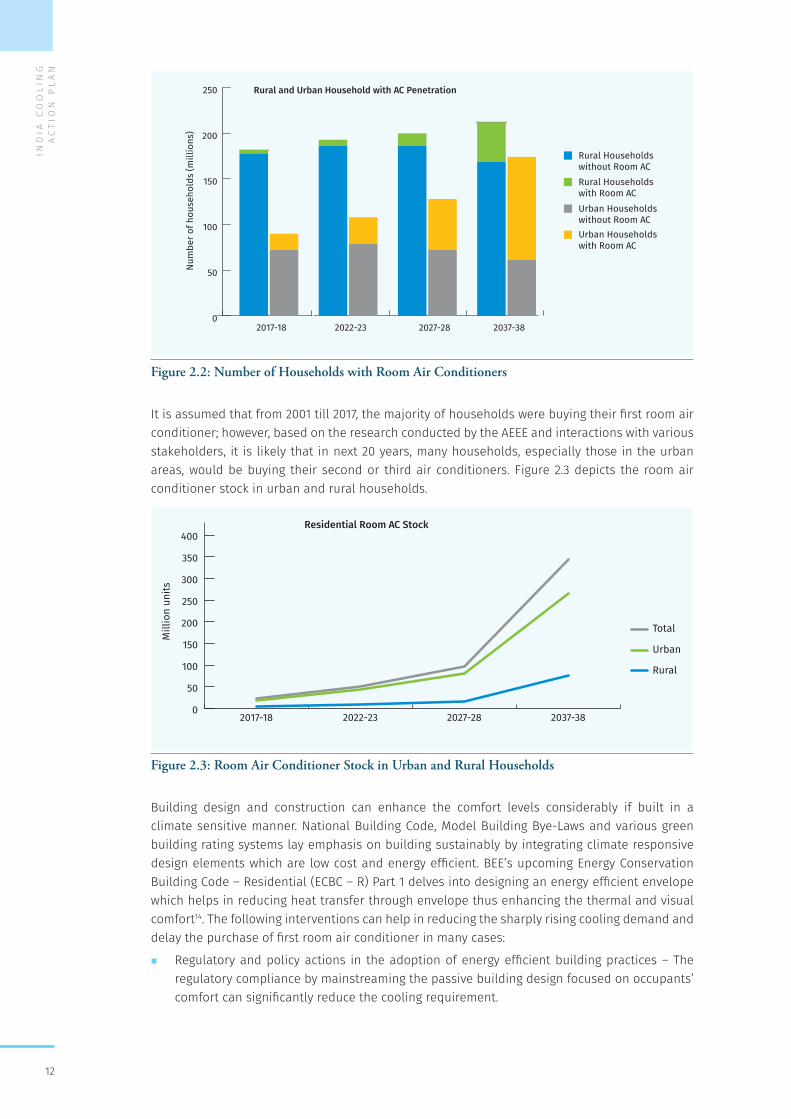
It is assumed that from 2001 till 2017, the majority of households were buying their first room air conditioner; however, based on the research conducted by the AEEE and interactions with various stakeholders, it is likely that in next 20 years, many households, especially those in the urban areas, would be buying their second or third air conditioners. Figure 2.3 depicts the room air conditioner stock in urban and rural households.
Figure 2.3: Room Air Conditioner Stock in Urban and Rural Households
Building design and construction can enhance the comfort levels considerably if built in a climate sensitive manner. National Building Code, Model Building Bye-Laws and various green building rating systems lay emphasis on building sustainably by integrating climate responsive design elements which are low cost and energy efficient. BEE’s upcoming Energy Conservation Building Code – Residential (ECBC – R) Part 1 delves into designing an energy efficient envelope which helps in reducing heat transfer through envelope thus enhancing the thermal and visual comfort14. The following interventions can help in reducing the sharply rising cooling demand and delay the purchase of first room air conditioner in many cases:
� Regulatory and policy actions in the adoption of energy efficient building practices – The regulatory compliance by mainstreaming the passive building design focused on occupants’ comfort can significantly reduce the cooling requirement.
0
50
100
150
200
250
Urban Households with Room AC
Urban Households without Room AC
Rural Households with Room AC
Rural Households without Room AC
2037-382027-282022-232017-18
Rural and Urban Household with AC Penetration
Num
ber o
f hou
seho
lds
(mill
ions
)
0
50
100
150
200
250
300
350
400
Total
Urban
Rural
2037-382027-282022-232017-18
Residential Room AC Stock
Mill
ion
units
DR
AF
T F
OR
CO
NS
ULT
AT
ION
ON
LY
NO
T T
O B
E C
ITE
D
13
� Promoting capacity building and fostering market awareness towards the need for efficient built environment and thermally comfortable habitat that would spur the demand for sustainably designed buildings from all strata of the society.
2.2.2 Commercial Sector
The intensity for air conditioning demand and corresponding electricity consumption intensity in the commercial building sector is significantly higher as compared to the residential sector, although the overall national electricity consumption is one third of the latter. The commercial sector has been classified under 8 major segments: hospital, hotels & restaurants, retail, office buildings, educational institutions, assembly places, transit buildings & warehouses. A bottom-up commercial building stock modelling exercise, conducted by AEEE, analysed the various commercial segments to understand the current and upcoming commercial stock15. The current and future floor area for the commercial building sector has been estimated based on this recently published study 16.
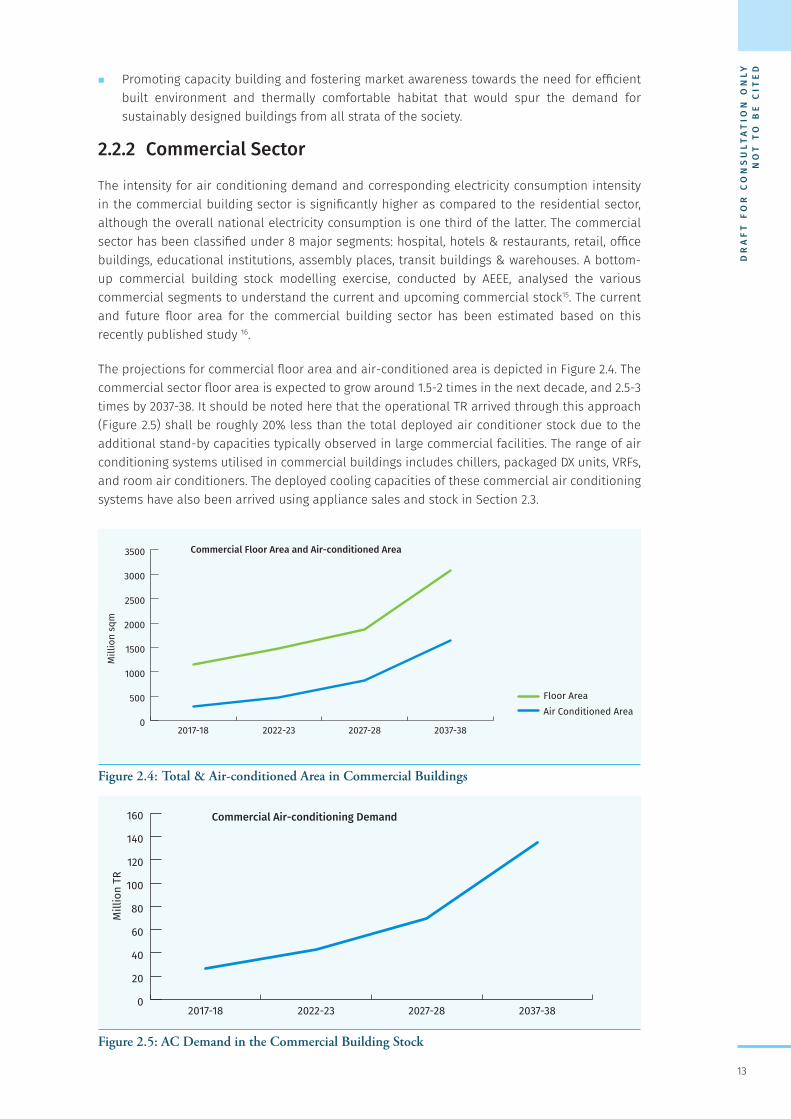
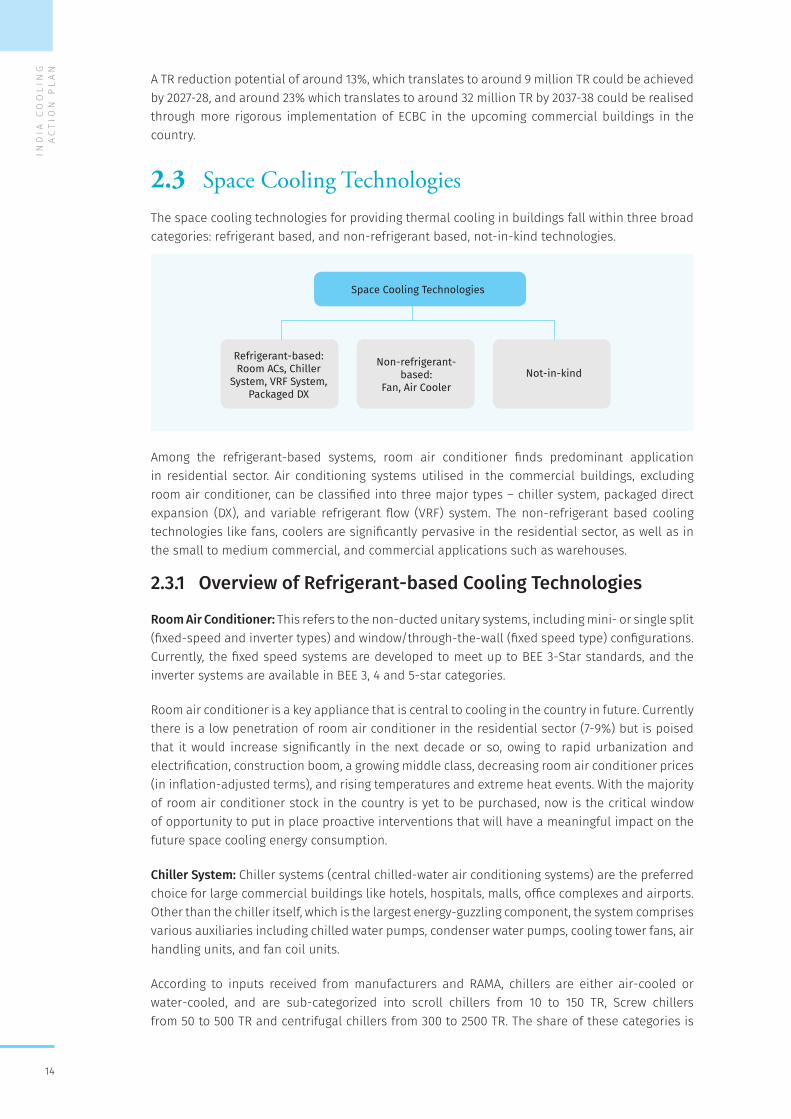
The projections for commercial floor area and air-conditioned area is depicted in Figure 2.4. The commercial sector floor area is expected to grow around 1.5-2 times in the next decade, and 2.5-3 times by 2037-38. It should be noted here that the operational TR arrived through this approach (Figure 2.5) shall be roughly 20% less than the total deployed air conditioner stock due to the additional stand-by capacities typically observed in large commercial facilities. The range of air conditioning systems utilised in commercial buildings includes chillers, packaged DX units, VRFs, and room air conditioners. The deployed cooling capacities of these commercial air conditioning systems have also been arrived using appliance sales and stock in Section 2.3.
Figure 2.4: Total & Air-conditioned Area in Commercial Buildings
Figure 2.5: AC Demand in the Commercial Building Stock
0
500
1000
1500
2000
2500
3000
3500
Air Conditioned AreaFloor Area
2037-382027-282022-232017-18
Mill
ion
sqm
Commercial Floor Area and Air-conditioned Area
0
20
40
60
80
100
120
140
160
2037-382027-282022-232017-18
Mill
ion
TR
Commercial Air-conditioning Demand
IND
IA C
OO
LIN
G A
CT
ION
PL
AN
14
A TR reduction potential of around 13%, which translates to around 9 million TR could be achieved by 2027-28, and around 23% which translates to around 32 million TR by 2037-38 could be realised through more rigorous implementation of ECBC in the upcoming commercial buildings in the country.
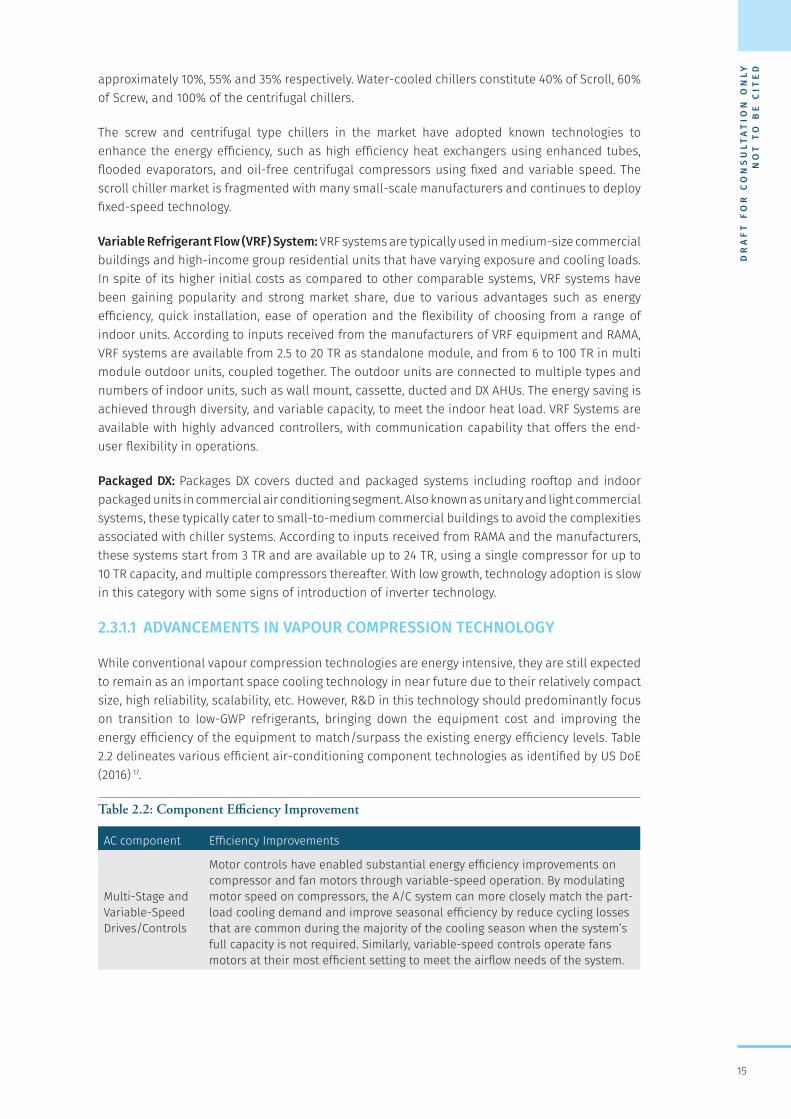
2.3 Space Cooling Technologies The space cooling technologies for providing thermal cooling in buildings fall within three broad categories: refrigerant based, and non-refrigerant based, not-in-kind technologies.
Among the refrigerant-based systems, room air conditioner finds predominant application in residential sector. Air conditioning systems utilised in the commercial buildings, excluding room air conditioner, can be classified into three major types – chiller system, packaged direct expansion (DX), and variable refrigerant flow (VRF) system. The non-refrigerant based cooling technologies like fans, coolers are significantly pervasive in the residential sector, as well as in the small to medium commercial, and commercial applications such as warehouses.
2.3.1 Overview of Refrigerant-based Cooling Technologies
Room Air Conditioner: This refers to the non-ducted unitary systems, including mini- or single split (fixed-speed and inverter types) and window/through-the-wall (fixed speed type) configurations. Currently, the fixed speed systems are developed to meet up to BEE 3-Star standards, and the inverter systems are available in BEE 3, 4 and 5-star categories.
Room air conditioner is a key appliance that is central to cooling in the country in future. Currently there is a low penetration of room air conditioner in the residential sector (7-9%) but is poised that it would increase significantly in the next decade or so, owing to rapid urbanization and electrification, construction boom, a growing middle class, decreasing room air conditioner prices (in inflation-adjusted terms), and rising temperatures and extreme heat events. With the majority of room air conditioner stock in the country is yet to be purchased, now is the critical window of opportunity to put in place proactive interventions that will have a meaningful impact on the future space cooling energy consumption.
Chiller System: Chiller systems (central chilled-water air conditioning systems) are the preferred choice for large commercial buildings like hotels, hospitals, malls, office complexes and airports. Other than the chiller itself, which is the largest energy-guzzling component, the system comprises various auxiliaries including chilled water pumps, condenser water pumps, cooling tower fans, air handling units, and fan coil units.
According to inputs received from manufacturers and RAMA, chillers are either air-cooled or water-cooled, and are sub-categorized into scroll chillers from 10 to 150 TR, Screw chillers from 50 to 500 TR and centrifugal chillers from 300 to 2500 TR. The share of these categories is
Space Cooling Technologies
Refrigerant-based: Room ACs, Chiller
System, VRF System, Packaged DX
Non-refrigerant-based:
Fan, Air CoolerNot-in-kind
DR
AF
T F
OR
CO
NS
ULT
AT
ION
ON
LY
NO
T T
O B
E C
ITE
D
15
approximately 10%, 55% and 35% respectively. Water-cooled chillers constitute 40% of Scroll, 60% of Screw, and 100% of the centrifugal chillers.
The screw and centrifugal type chillers in the market have adopted known technologies to enhance the energy efficiency, such as high efficiency heat exchangers using enhanced tubes, flooded evaporators, and oil-free centrifugal compressors using fixed and variable speed. The scroll chiller market is fragmented with many small-scale manufacturers and continues to deploy fixed-speed technology.
Variable Refrigerant Flow (VRF) System: VRF systems are typically used in medium-size commercial buildings and high-income group residential units that have varying exposure and cooling loads. In spite of its higher initial costs as compared to other comparable systems, VRF systems have been gaining popularity and strong market share, due to various advantages such as energy efficiency, quick installation, ease of operation and the flexibility of choosing from a range of indoor units. According to inputs received from the manufacturers of VRF equipment and RAMA, VRF systems are available from 2.5 to 20 TR as standalone module, and from 6 to 100 TR in multi module outdoor units, coupled together. The outdoor units are connected to multiple types and numbers of indoor units, such as wall mount, cassette, ducted and DX AHUs. The energy saving is achieved through diversity, and variable capacity, to meet the indoor heat load. VRF Systems are available with highly advanced controllers, with communication capability that offers the end-user flexibility in operations.
Packaged DX: Packages DX covers ducted and packaged systems including rooftop and indoor packaged units in commercial air conditioning segment. Also known as unitary and light commercial systems, these typically cater to small-to-medium commercial buildings to avoid the complexities associated with chiller systems. According to inputs received from RAMA and the manufacturers, these systems start from 3 TR and are available up to 24 TR, using a single compressor for up to 10 TR capacity, and multiple compressors thereafter. With low growth, technology adoption is slow in this category with some signs of introduction of inverter technology.
2.3.1.1 ADVANCEMENTS IN VAPOUR COMPRESSION TECHNOLOGY
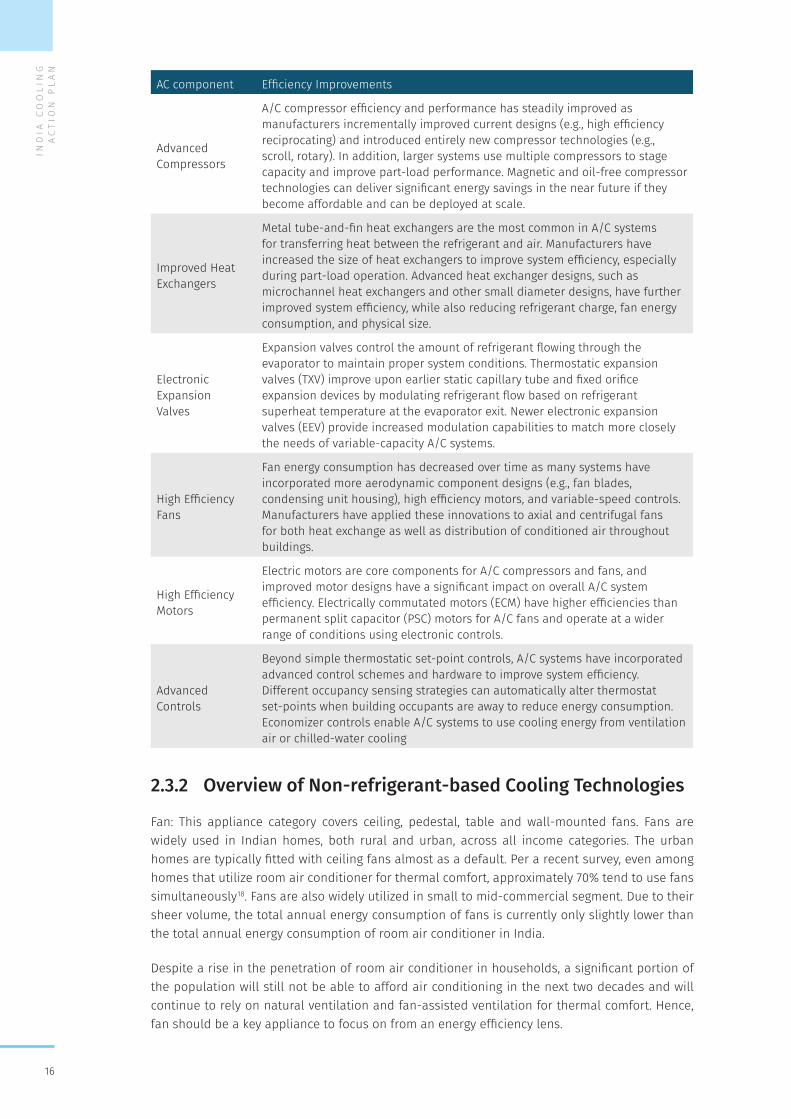
While conventional vapour compression technologies are energy intensive, they are still expected to remain as an important space cooling technology in near future due to their relatively compact size, high reliability, scalability, etc. However, R&D in this technology should predominantly focus on transition to low-GWP refrigerants, bringing down the equipment cost and improving the energy efficiency of the equipment to match/surpass the existing energy efficiency levels. Table 2.2 delineates various efficient air-conditioning component technologies as identified by US DoE (2016) 17.
Table 2.2: Component Efficiency Improvement
AC component Efficiency Improvements
Multi-Stage and Variable-Speed Drives/Controls
Motor controls have enabled substantial energy efficiency improvements on compressor and fan motors through variable-speed operation. By modulating motor speed on compressors, the A/C system can more closely match the part-load cooling demand and improve seasonal efficiency by reduce cycling losses that are common during the majority of the cooling season when the system’s full capacity is not required. Similarly, variable-speed controls operate fans motors at their most efficient setting to meet the airflow needs of the system.
IND
IA C
OO
LIN
G A
CT
ION
PL
AN
16
AC component Efficiency Improvements
Advanced Compressors
A/C compressor efficiency and performance has steadily improved as manufacturers incrementally improved current designs (e.g., high efficiency reciprocating) and introduced entirely new compressor technologies (e.g., scroll, rotary). In addition, larger systems use multiple compressors to stage capacity and improve part-load performance. Magnetic and oil-free compressor technologies can deliver significant energy savings in the near future if they become affordable and can be deployed at scale.
Improved Heat Exchangers
Metal tube-and-fin heat exchangers are the most common in A/C systems for transferring heat between the refrigerant and air. Manufacturers have increased the size of heat exchangers to improve system efficiency, especially during part-load operation. Advanced heat exchanger designs, such as microchannel heat exchangers and other small diameter designs, have further improved system efficiency, while also reducing refrigerant charge, fan energy consumption, and physical size.
Electronic Expansion Valves
Expansion valves control the amount of refrigerant flowing through the evaporator to maintain proper system conditions. Thermostatic expansion valves (TXV) improve upon earlier static capillary tube and fixed orifice expansion devices by modulating refrigerant flow based on refrigerant superheat temperature at the evaporator exit. Newer electronic expansion valves (EEV) provide increased modulation capabilities to match more closely the needs of variable-capacity A/C systems.
High Efficiency Fans
Fan energy consumption has decreased over time as many systems have incorporated more aerodynamic component designs (e.g., fan blades, condensing unit housing), high efficiency motors, and variable-speed controls. Manufacturers have applied these innovations to axial and centrifugal fans for both heat exchange as well as distribution of conditioned air throughout buildings.
High Efficiency Motors
Electric motors are core components for A/C compressors and fans, and improved motor designs have a significant impact on overall A/C system efficiency. Electrically commutated motors (ECM) have higher efficiencies than permanent split capacitor (PSC) motors for A/C fans and operate at a wider range of conditions using electronic controls.
Advanced Controls
Beyond simple thermostatic set-point controls, A/C systems have incorporated advanced control schemes and hardware to improve system efficiency. Different occupancy sensing strategies can automatically alter thermostat set-points when building occupants are away to reduce energy consumption. Economizer controls enable A/C systems to use cooling energy from ventilation air or chilled-water cooling
2.3.2 Overview of Non-refrigerant-based Cooling Technologies
Fan: This appliance category covers ceiling, pedestal, table and wall-mounted fans. Fans are widely used in Indian homes, both rural and urban, across all income categories. The urban homes are typically fitted with ceiling fans almost as a default. Per a recent survey, even among homes that utilize room air conditioner for thermal comfort, approximately 70% tend to use fans simultaneously18. Fans are also widely utilized in small to mid-commercial segment. Due to their sheer volume, the total annual energy consumption of fans is currently only slightly lower than the total annual energy consumption of room air conditioner in India.
Despite a rise in the penetration of room air conditioner in households, a significant portion of the population will still not be able to afford air conditioning in the next two decades and will continue to rely on natural ventilation and fan-assisted ventilation for thermal comfort. Hence, fan should be a key appliance to focus on from an energy efficiency lens.
DR
AF
T F
OR
CO
NS
ULT
AT
ION
ON
LY
NO
T T
O B
E C
ITE
D
17
Air coolers: Air coolers are an important cooling appliance for users, especially across category of households and medium size commercial buildings in hot and dry and composite climates. Based on inputs received from air cooler manufacturers, air coolers of 500-1000 CFM are most widely used in residential and small commercial applications.
The cooling effectiveness of air coolers is constrained by the humidity content of the ambient air; as such the performance of air coolers will vary significantly between climate zones (hot and dry, and composite versus warm and humid) and seasons (low, medium and high relative humidity). Air coolers need adequate ventilation to function well in humid conditions.
A common argument around air-coolers is that these are water-intensive, and this can pose a limitation in water-stressed regions of India. In response, the industry has come up with technology that utilizes one-thirds of the water consumption compared to air-coolers of the past.
Market forces will need to influence consumer choice towards well-engineered and better-quality air coolers manufactured by the organised sector, rather than indigenously manufactured ones. However, price-sensitivity will continue to play a key role at least in the foreseeable future, the cost-benefit equation will remain the key driver for the consumers while purchasing air coolers. Government policy, like developing voluntary MEPS and incentivise this segment can help in the transformation of the air cooler industry towards an organized market of energy- and water-efficient air coolers.
2.3.3 Overview of Not-in-Kind Technologies
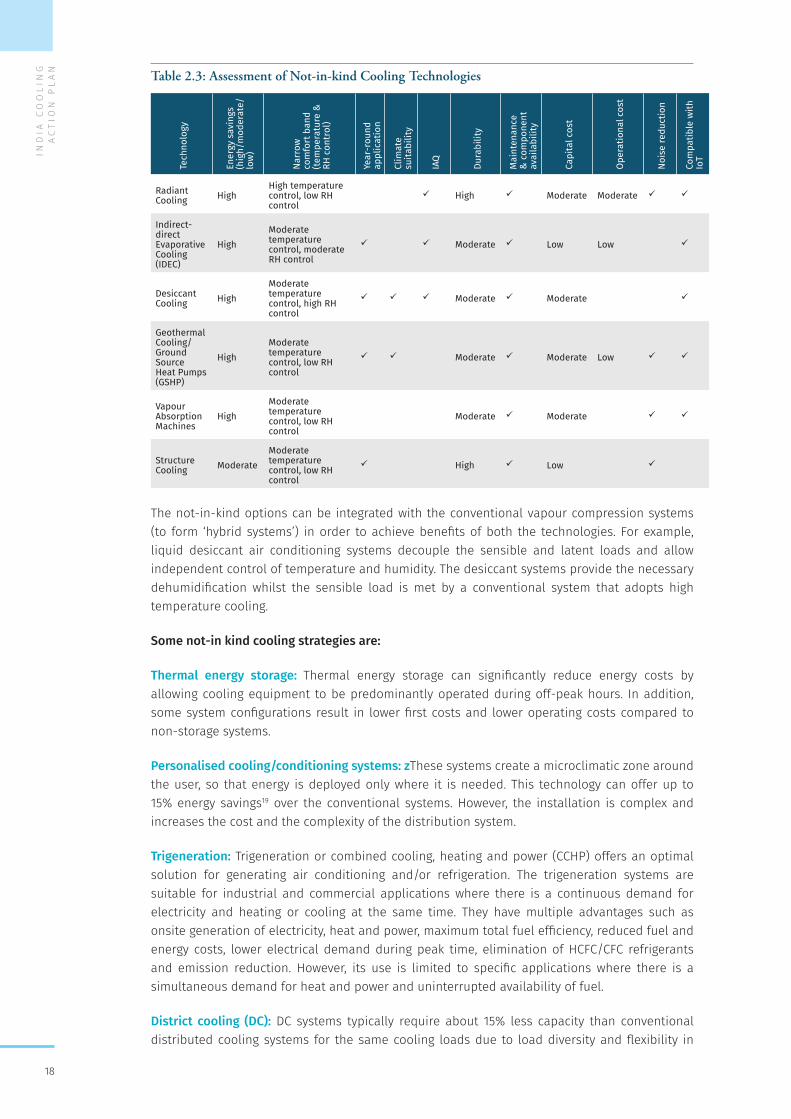
The potential of low energy cooling technologies as identified by ECBC, and their feasibility in terms of energy savings and climate applicability are presented in the table below. These technologies offer advantages of reduced cost or complexity, increased reliability, peak demand reduction, energy savings and GHG reduction. These technologies have been applied at sizeable scales in commercial buildings in India and are known to provide other non-energy benefits, which include improved indoor air quality, noise reduction and integration with Internet of Things (IoT) (for better control and monitoring). Table 2.3 summarises the benefits of these technologies, as indicated by manufacturer inputs.
Indirect Direct Evaporative Cooling System: As per data received from four manufacturers of IDEC systems from 2008 till March 2015 and projections until March 2017, an aggregate capacity of approximately 43 million cubic feet per minute (air flow) has been installed in India. This equates to replacement of approximately 0.1 million TR or conventional air conditioning in more than 800 buildings.
Structure Cooling System: As per data shared by manufacturers from 2005 till March 2014 and projections up to March 2017, an aggregate of approximately 0.6 million sq. ft. built-up area in India uses structure cooling technology, replacing approximately 4,600 TR or conventional air conditioning in 28 large commercial buildings.
Radiant Cooling System: As per data received by four manufacturers of Radiant Cooling systems from 2008 till March 2016 and projections till March 2017, an aggregate of approximately 4 million sq. ft. built-up area in India is cooled using radiant cooling, replacing approximately 18,000 TR of conventional air conditioning in 73 large commercial buildings.
Solar VAM System: As per data received by manufacturers from 2007 till March 2015 and projections till March 2017, an aggregate of 0.7 million TR of Solar VAM air conditioning (replacing an equivalent amount of conventional air conditioning) is installed in India.
IND
IA C
OO
LIN
G A
CT
ION
PL
AN
18
Table 2.3: Assessment of Not-in-kind Cooling Technologies
Tech
nolo
gy
Ener
gy s
avin
gs
(hig
h/m
oder
ate/
low
)
Narr
ow
com
fort
ban
d (te
mpe
ratu
re &
RH
con
trol
)
Year
-rou
nd
appl
icat
ion
Clim
ate
suita
bilit
y
IAQ
Dura
bilit
y
Mai
nten
ance
&
com
pone
nt
avai
labi
lity
Capi
tal c
ost
Ope
ratio
nal c
ost
Nois
e re
duct
ion
Com
patib
le w
ith
IoT
Radiant Cooling High
High temperature control, low RH control
ü High ü Moderate Moderate ü ü
Indirect-direct Evaporative Cooling (IDEC)
HighModerate temperature control, moderate RH control
ü ü Moderate ü Low Low ü
Desiccant Cooling High
Moderate temperature control, high RH control
ü ü ü Moderate ü Moderate ü
Geothermal Cooling/ Ground Source Heat Pumps (GSHP)
HighModerate temperature control, low RH control
ü ü Moderate ü Moderate Low ü ü
Vapour Absorption Machines
HighModerate temperature control, low RH control
Moderate ü Moderate ü ü
Structure Cooling Moderate
Moderate temperature control, low RH control
ü High ü Low ü
The not-in-kind options can be integrated with the conventional vapour compression systems (to form ‘hybrid systems’) in order to achieve benefits of both the technologies. For example, liquid desiccant air conditioning systems decouple the sensible and latent loads and allow independent control of temperature and humidity. The desiccant systems provide the necessary dehumidification whilst the sensible load is met by a conventional system that adopts high temperature cooling.
Some not-in kind cooling strategies are:
Thermal energy storage: Thermal energy storage can significantly reduce energy costs by allowing cooling equipment to be predominantly operated during off-peak hours. In addition, some system configurations result in lower first costs and lower operating costs compared to non-storage systems.
Personalised cooling/conditioning systems: zThese systems create a microclimatic zone around the user, so that energy is deployed only where it is needed. This technology can offer up to 15% energy savings19 over the conventional systems. However, the installation is complex and increases the cost and the complexity of the distribution system.
Trigeneration: Trigeneration or combined cooling, heating and power (CCHP) offers an optimal solution for generating air conditioning and/or refrigeration. The trigeneration systems are suitable for industrial and commercial applications where there is a continuous demand for electricity and heating or cooling at the same time. They have multiple advantages such as onsite generation of electricity, heat and power, maximum total fuel efficiency, reduced fuel and energy costs, lower electrical demand during peak time, elimination of HCFC/CFC refrigerants and emission reduction. However, its use is limited to specific applications where there is a simultaneous demand for heat and power and uninterrupted availability of fuel.
District cooling (DC): DC systems typically require about 15% less capacity than conventional distributed cooling systems for the same cooling loads due to load diversity and flexibility in
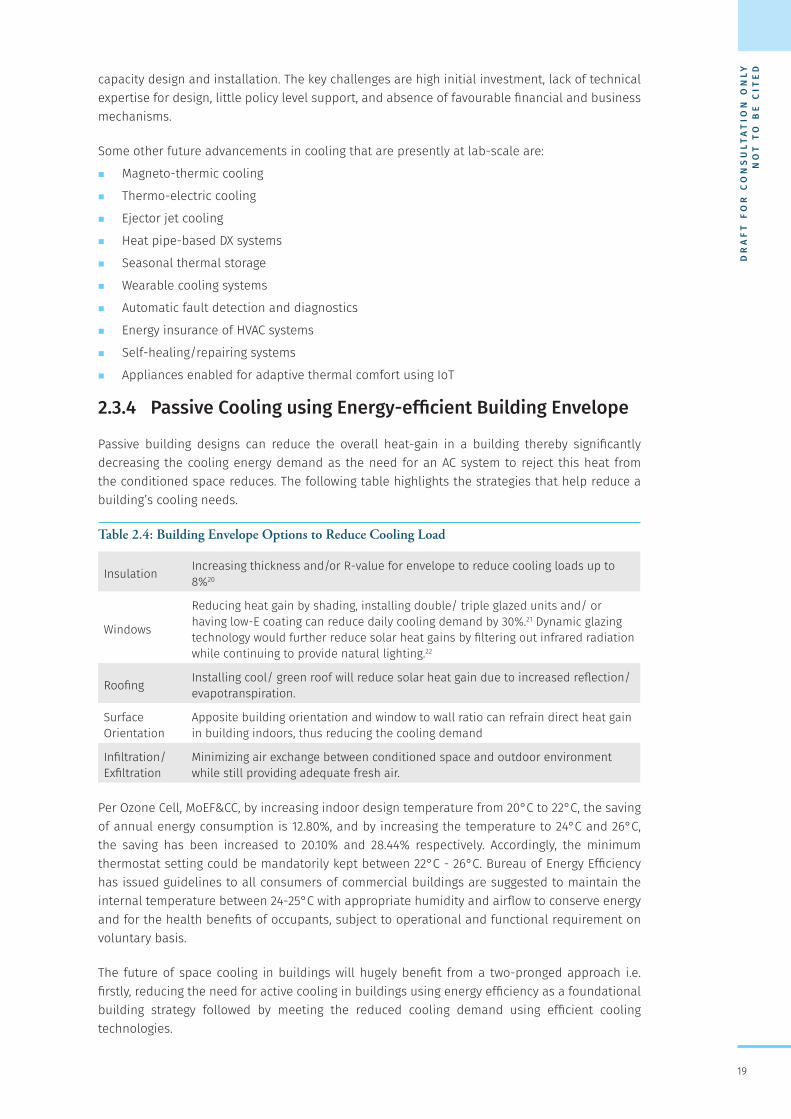
DR
AF
T F
OR
CO
NS
ULT
AT
ION
ON
LY
NO
T T
O B
E C
ITE
D
19
capacity design and installation. The key challenges are high initial investment, lack of technical expertise for design, little policy level support, and absence of favourable financial and business mechanisms.
Some other future advancements in cooling that are presently at lab-scale are:
� Magneto-thermic cooling
� Thermo-electric cooling
� Ejector jet cooling
� Heat pipe-based DX systems
� Seasonal thermal storage
� Wearable cooling systems
� Automatic fault detection and diagnostics
� Energy insurance of HVAC systems
� Self-healing/repairing systems
� Appliances enabled for adaptive thermal comfort using IoT
2.3.4 Passive Cooling using Energy-efficient Building Envelope
Passive building designs can reduce the overall heat-gain in a building thereby significantly decreasing the cooling energy demand as the need for an AC system to reject this heat from the conditioned space reduces. The following table highlights the strategies that help reduce a building’s cooling needs.
Table 2.4: Building Envelope Options to Reduce Cooling Load
Insulation Increasing thickness and/or R-value for envelope to reduce cooling loads up to 8%20
Windows
Reducing heat gain by shading, installing double/ triple glazed units and/ or having low-E coating can reduce daily cooling demand by 30%.21 Dynamic glazing technology would further reduce solar heat gains by filtering out infrared radiation while continuing to provide natural lighting.22
Roofing Installing cool/ green roof will reduce solar heat gain due to increased reflection/ evapotranspiration.
Surface Orientation
Apposite building orientation and window to wall ratio can refrain direct heat gain in building indoors, thus reducing the cooling demand
Infiltration/ Exfiltration
Minimizing air exchange between conditioned space and outdoor environment while still providing adequate fresh air.
Per Ozone Cell, MoEF&CC, by increasing indoor design temperature from 20°C to 22°C, the saving of annual energy consumption is 12.80%, and by increasing the temperature to 24°C and 26°C, the saving has been increased to 20.10% and 28.44% respectively. Accordingly, the minimum thermostat setting could be mandatorily kept between 22°C - 26°C. Bureau of Energy Efficiency has issued guidelines to all consumers of commercial buildings are suggested to maintain the internal temperature between 24-25°C with appropriate humidity and airflow to conserve energy and for the health benefits of occupants, subject to operational and functional requirement on voluntary basis.
The future of space cooling in buildings will hugely benefit from a two-pronged approach i.e. firstly, reducing the need for active cooling in buildings using energy efficiency as a foundational building strategy followed by meeting the reduced cooling demand using efficient cooling technologies.
IND
IA C
OO
LIN
G A
CT
ION
PL
AN
20
2.4 Analysis2.4.1 Methodology
The methodology is kept flexible in order to adapt to the unique aspects and data availability for the different technologies for space cooling. However, the underlying approach remains consistent and is essentially a synthesis exercise, drawing information from government publications and model23,24, reliable research conducted nationally and globally25, significant and detailed inputs from industry experts and manufacturers, and utilizing the latest data available from the government (where available), to derive our best estimate of future projections. Much of the effort has been directed at doing a “bottom up check” to complement numbers derived from models and studies done in the recent past and can further complement any top down econometric analysis that may be carried out in the future.
2.4.2 Inputs and Assumptions
Overarching growth drivers: The following growth drivers will have a significant bearing on the sales of new comfort cooling equipment, especially room air conditioners, in the following decades:
� Growth in per-capita income: Per IESS, per capita income is like to double between 2017 (INR 90,922) and 2027 (INR 178,634) (over the 2017 baseline) and then again double between 2027 and 2037 (INR 361,195) (over the 2027 baseline).
� Purchasing power of urban and rural population: There is a considerable gap in the per capita income or rural and urban population; the per capita income in 2011-12 was INR 1,01,313 and INR 40,772 respectively for urban and rural population.26
� Rate of Urbanisation: Per IESS, India is presently 33% urbanised and will be 39% and 45% urbanised in 2027 and 2037, respectively.
Room Air conditioners: According to the manufacturing data of star labelled appliances published by BEE27, three important trends have been observed:
� Since 2010, manufacturing of room air conditioners has grown at a CAGR of 13%.
� There has been a sharp rise in the adoption of inverter room air conditioners since 2015 alongside a significant decline in the uptake of fixed-speed room air conditioners. Considering the trends in the uptake of fixed-speed and inverter room air conditioners observed in the past few years, it is anticipated that the share of fixed-speed room air conditioners in the future room air conditioners stock will decline rapidly.
� Growth in room air conditioner manufacturing tends to show a sharp rise every alternate year followed by almost constant or very small rise in subsequent year. Room air conditioner production peaked in 2012-13, 2014-15 and 2016-17 showing around 20-30% growth over the preceding year; the alternate years saw only 1-7% growth.
The current and future room air conditioner stock were estimated using BEE data described above along with the following underlying assumptions:
� BEE data can be used as a proxy for room air conditioner sales
� Room air conditioner life = 10 years28
� Room air conditioner sales will grow at a CAGR of 11% in the next 10 years and 8% in the following 10 years in a low growth scenario; and at a CAGR of 15% in the next 10 years and 12% in the following 10 years in a high growth scenario.
� A non-trivial share of room air conditioners is used in commercial spaces; it is possible that such commercial spaces and apartment complexes might transition to central air-
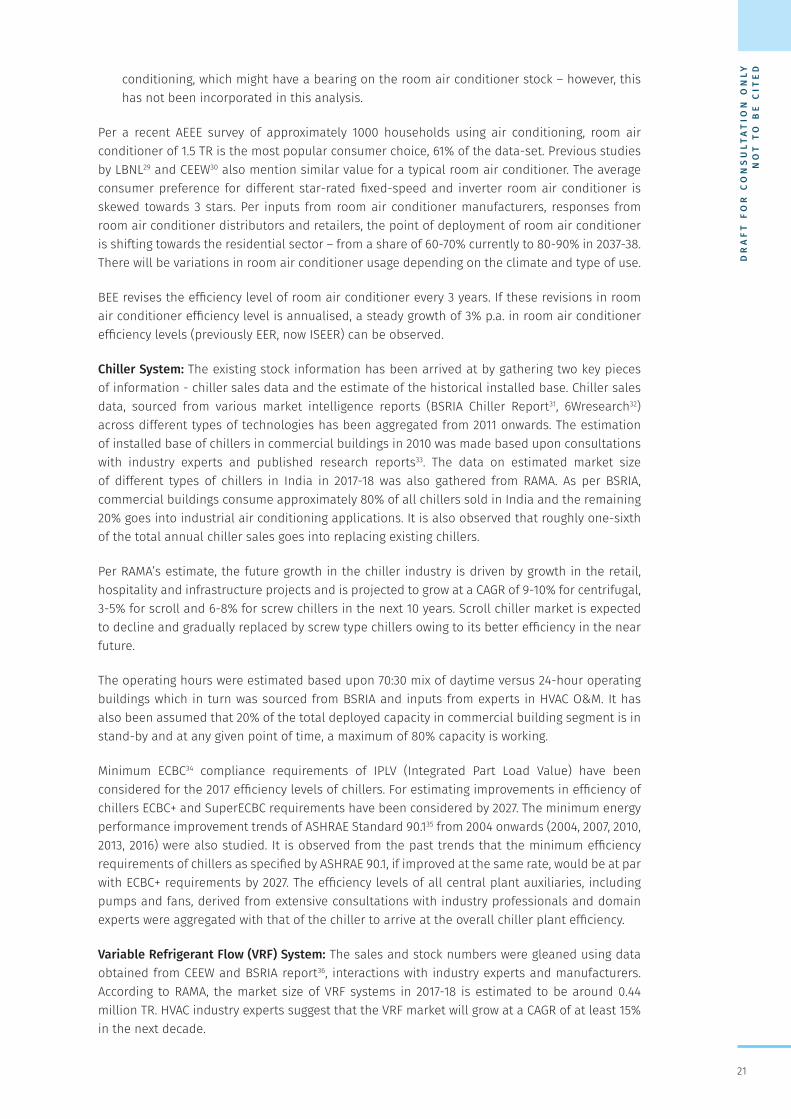
DR
AF
T F
OR
CO
NS
ULT
AT
ION
ON
LY
NO
T T
O B
E C
ITE
D
21
conditioning, which might have a bearing on the room air conditioner stock – however, this has not been incorporated in this analysis.
Per a recent AEEE survey of approximately 1000 households using air conditioning, room air conditioner of 1.5 TR is the most popular consumer choice, 61% of the data-set. Previous studies by LBNL29 and CEEW30 also mention similar value for a typical room air conditioner. The average consumer preference for different star-rated fixed-speed and inverter room air conditioner is skewed towards 3 stars. Per inputs from room air conditioner manufacturers, responses from room air conditioner distributors and retailers, the point of deployment of room air conditioner is shifting towards the residential sector – from a share of 60-70% currently to 80-90% in 2037-38. There will be variations in room air conditioner usage depending on the climate and type of use.
BEE revises the efficiency level of room air conditioner every 3 years. If these revisions in room air conditioner efficiency level is annualised, a steady growth of 3% p.a. in room air conditioner efficiency levels (previously EER, now ISEER) can be observed.
Chiller System: The existing stock information has been arrived at by gathering two key pieces of information - chiller sales data and the estimate of the historical installed base. Chiller sales data, sourced from various market intelligence reports (BSRIA Chiller Report31, 6Wresearch32) across different types of technologies has been aggregated from 2011 onwards. The estimation of installed base of chillers in commercial buildings in 2010 was made based upon consultations with industry experts and published research reports33. The data on estimated market size of different types of chillers in India in 2017-18 was also gathered from RAMA. As per BSRIA, commercial buildings consume approximately 80% of all chillers sold in India and the remaining 20% goes into industrial air conditioning applications. It is also observed that roughly one-sixth of the total annual chiller sales goes into replacing existing chillers.
Per RAMA’s estimate, the future growth in the chiller industry is driven by growth in the retail, hospitality and infrastructure projects and is projected to grow at a CAGR of 9-10% for centrifugal, 3-5% for scroll and 6-8% for screw chillers in the next 10 years. Scroll chiller market is expected to decline and gradually replaced by screw type chillers owing to its better efficiency in the near future.
The operating hours were estimated based upon 70:30 mix of daytime versus 24-hour operating buildings which in turn was sourced from BSRIA and inputs from experts in HVAC O&M. It has also been assumed that 20% of the total deployed capacity in commercial building segment is in stand-by and at any given point of time, a maximum of 80% capacity is working.
Minimum ECBC34 compliance requirements of IPLV (Integrated Part Load Value) have been considered for the 2017 efficiency levels of chillers. For estimating improvements in efficiency of chillers ECBC+ and SuperECBC requirements have been considered by 2027. The minimum energy performance improvement trends of ASHRAE Standard 90.135 from 2004 onwards (2004, 2007, 2010, 2013, 2016) were also studied. It is observed from the past trends that the minimum efficiency requirements of chillers as specified by ASHRAE 90.1, if improved at the same rate, would be at par with ECBC+ requirements by 2027. The efficiency levels of all central plant auxiliaries, including pumps and fans, derived from extensive consultations with industry professionals and domain experts were aggregated with that of the chiller to arrive at the overall chiller plant efficiency.
Variable Refrigerant Flow (VRF) System: The sales and stock numbers were gleaned using data obtained from CEEW and BSRIA report36, interactions with industry experts and manufacturers. According to RAMA, the market size of VRF systems in 2017-18 is estimated to be around 0.44 million TR. HVAC industry experts suggest that the VRF market will grow at a CAGR of at least 15% in the next decade.
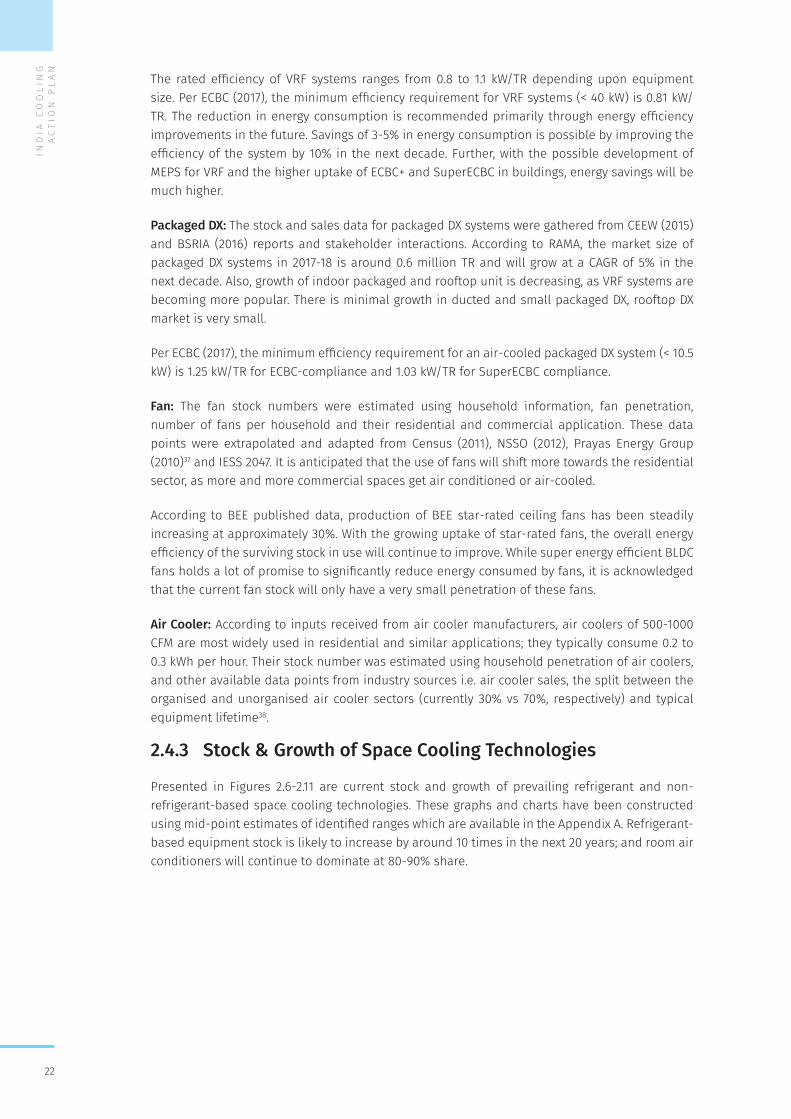
IND
IA C
OO
LIN
G A
CT
ION
PL
AN
22
The rated efficiency of VRF systems ranges from 0.8 to 1.1 kW/TR depending upon equipment size. Per ECBC (2017), the minimum efficiency requirement for VRF systems (< 40 kW) is 0.81 kW/TR. The reduction in energy consumption is recommended primarily through energy efficiency improvements in the future. Savings of 3-5% in energy consumption is possible by improving the efficiency of the system by 10% in the next decade. Further, with the possible development of MEPS for VRF and the higher uptake of ECBC+ and SuperECBC in buildings, energy savings will be much higher.
Packaged DX: The stock and sales data for packaged DX systems were gathered from CEEW (2015) and BSRIA (2016) reports and stakeholder interactions. According to RAMA, the market size of packaged DX systems in 2017-18 is around 0.6 million TR and will grow at a CAGR of 5% in the next decade. Also, growth of indoor packaged and rooftop unit is decreasing, as VRF systems are becoming more popular. There is minimal growth in ducted and small packaged DX, rooftop DX market is very small.
Per ECBC (2017), the minimum efficiency requirement for an air-cooled packaged DX system (< 10.5 kW) is 1.25 kW/TR for ECBC-compliance and 1.03 kW/TR for SuperECBC compliance.
Fan: The fan stock numbers were estimated using household information, fan penetration, number of fans per household and their residential and commercial application. These data points were extrapolated and adapted from Census (2011), NSSO (2012), Prayas Energy Group (2010)37 and IESS 2047. It is anticipated that the use of fans will shift more towards the residential sector, as more and more commercial spaces get air conditioned or air-cooled.
According to BEE published data, production of BEE star-rated ceiling fans has been steadily increasing at approximately 30%. With the growing uptake of star-rated fans, the overall energy efficiency of the surviving stock in use will continue to improve. While super energy efficient BLDC fans holds a lot of promise to significantly reduce energy consumed by fans, it is acknowledged that the current fan stock will only have a very small penetration of these fans.
Air Cooler: According to inputs received from air cooler manufacturers, air coolers of 500-1000 CFM are most widely used in residential and similar applications; they typically consume 0.2 to 0.3 kWh per hour. Their stock number was estimated using household penetration of air coolers, and other available data points from industry sources i.e. air cooler sales, the split between the organised and unorganised air cooler sectors (currently 30% vs 70%, respectively) and typical equipment lifetime38.
2.4.3 Stock & Growth of Space Cooling Technologies
Presented in Figures 2.6-2.11 are current stock and growth of prevailing refrigerant and non-refrigerant-based space cooling technologies. These graphs and charts have been constructed using mid-point estimates of identified ranges which are available in the Appendix A. Refrigerant-based equipment stock is likely to increase by around 10 times in the next 20 years; and room air conditioners will continue to dominate at 80-90% share.
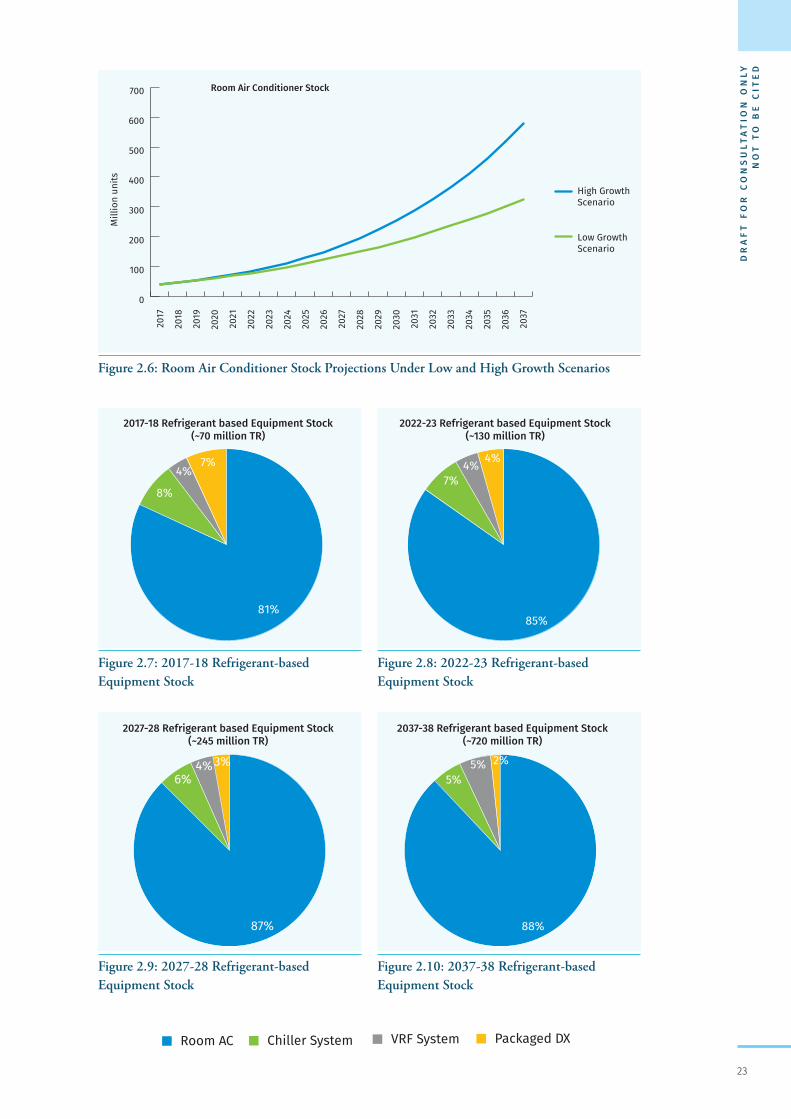
DR
AF
T F
OR
CO
NS
ULT
AT
ION
ON
LY
NO
T T
O B
E C
ITE
D
23
0
100
200
300
400
500
600
700
High GrowthScenario
Low GrowthScenario
2017
2018
2019
2020
2021
2022
2023
2024
2025
2026
2027
2028
2029
2030
2031
2032
2033
2034
2035
2036
2037
Room Air Conditioner Stock
Mill
ion
units
Figure 2.6: Room Air Conditioner Stock Projections Under Low and High Growth Scenarios
Packaged DX VRF SystemChiller SystemRoom AC
81%
8%
4%7% 2017-18 Refrigerant based Equipment Stock
(~70 million TR)
Packaged DX VRF SystemChiller SystemRoom AC
85%
7%4% 4% 2022-23 Refrigerant based Equipment Stock
(~130 million TR)
Figure 2.7: 2017-18 Refrigerant-based Equipment Stock
Figure 2.9: 2027-28 Refrigerant-based Equipment Stock
Figure 2.8: 2022-23 Refrigerant-based Equipment Stock
Figure 2.10: 2037-38 Refrigerant-based Equipment Stock
Packaged DX VRF SystemChiller SystemRoom AC
87%
6%4%3% 2027-28 Refrigerant based Equipment Stock
(~245 million TR)
Packaged DX VRF SystemChiller SystemRoom AC
88%
5%5% 2%
2037-38 Refrigerant based Equipment Stock (~720 million TR)
2017-18 Refrigerant based Equipment Stock (~70 million TR)
2037-38 Refrigerant based Equipment Stock (~720 million TR)
2027-28 Refrigerant based Equipment Stock (~245 million TR)
2022-23 Refrigerant based Equipment Stock (~130 million TR)
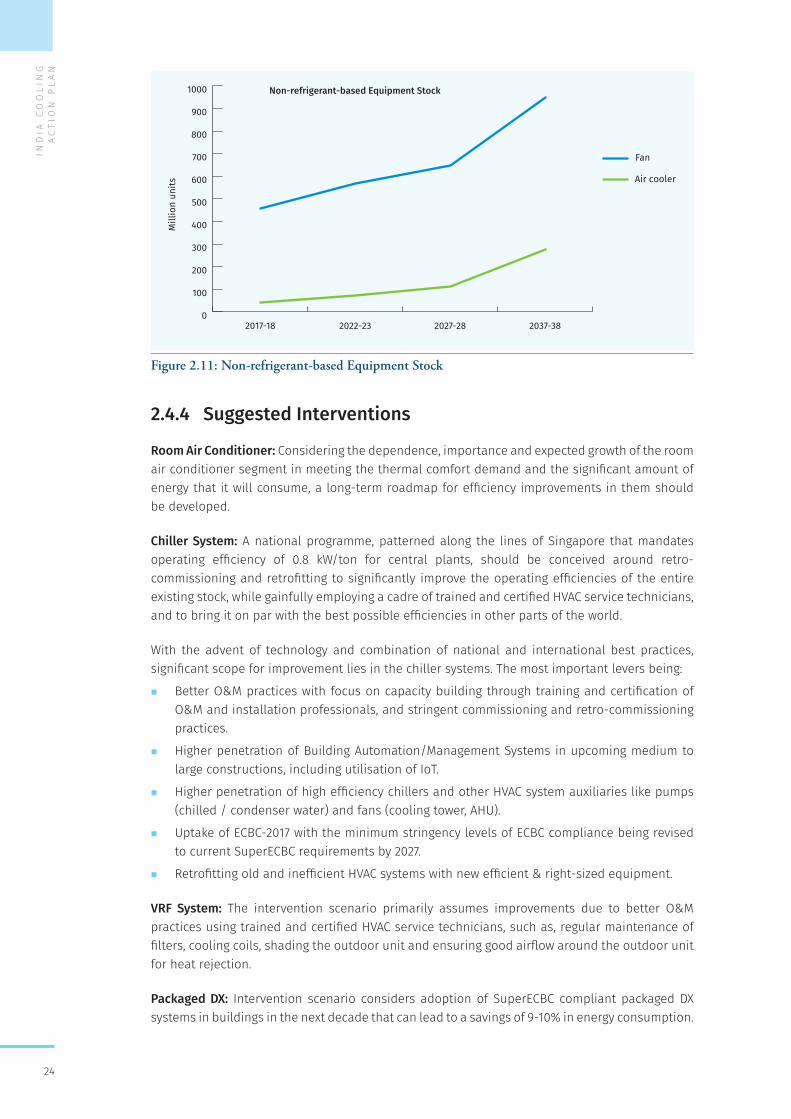
IND
IA C
OO
LIN
G A
CT
ION
PL
AN
24
Figure 2.11: Non-refrigerant-based Equipment Stock
2.4.4 Suggested Interventions
Room Air Conditioner: Considering the dependence, importance and expected growth of the room air conditioner segment in meeting the thermal comfort demand and the significant amount of energy that it will consume, a long-term roadmap for efficiency improvements in them should be developed.
Chiller System: A national programme, patterned along the lines of Singapore that mandates operating efficiency of 0.8 kW/ton for central plants, should be conceived around retro-commissioning and retrofitting to significantly improve the operating efficiencies of the entire existing stock, while gainfully employing a cadre of trained and certified HVAC service technicians, and to bring it on par with the best possible efficiencies in other parts of the world.
With the advent of technology and combination of national and international best practices, significant scope for improvement lies in the chiller systems. The most important levers being:
� Better O&M practices with focus on capacity building through training and certification of O&M and installation professionals, and stringent commissioning and retro-commissioning practices.
� Higher penetration of Building Automation/Management Systems in upcoming medium to large constructions, including utilisation of IoT.
� Higher penetration of high efficiency chillers and other HVAC system auxiliaries like pumps (chilled / condenser water) and fans (cooling tower, AHU).
� Uptake of ECBC-2017 with the minimum stringency levels of ECBC compliance being revised to current SuperECBC requirements by 2027.
� Retrofitting old and inefficient HVAC systems with new efficient & right-sized equipment.
VRF System: The intervention scenario primarily assumes improvements due to better O&M practices using trained and certified HVAC service technicians, such as, regular maintenance of filters, cooling coils, shading the outdoor unit and ensuring good airflow around the outdoor unit for heat rejection.
Packaged DX: Intervention scenario considers adoption of SuperECBC compliant packaged DX systems in buildings in the next decade that can lead to a savings of 9-10% in energy consumption.
0
100
200
300
400
500
600
700
800
900
1000
Fan
Air cooler
2037-382027-282022-232017-18
Non-refrigerant-based Equipment Stock
Mill
ion
units
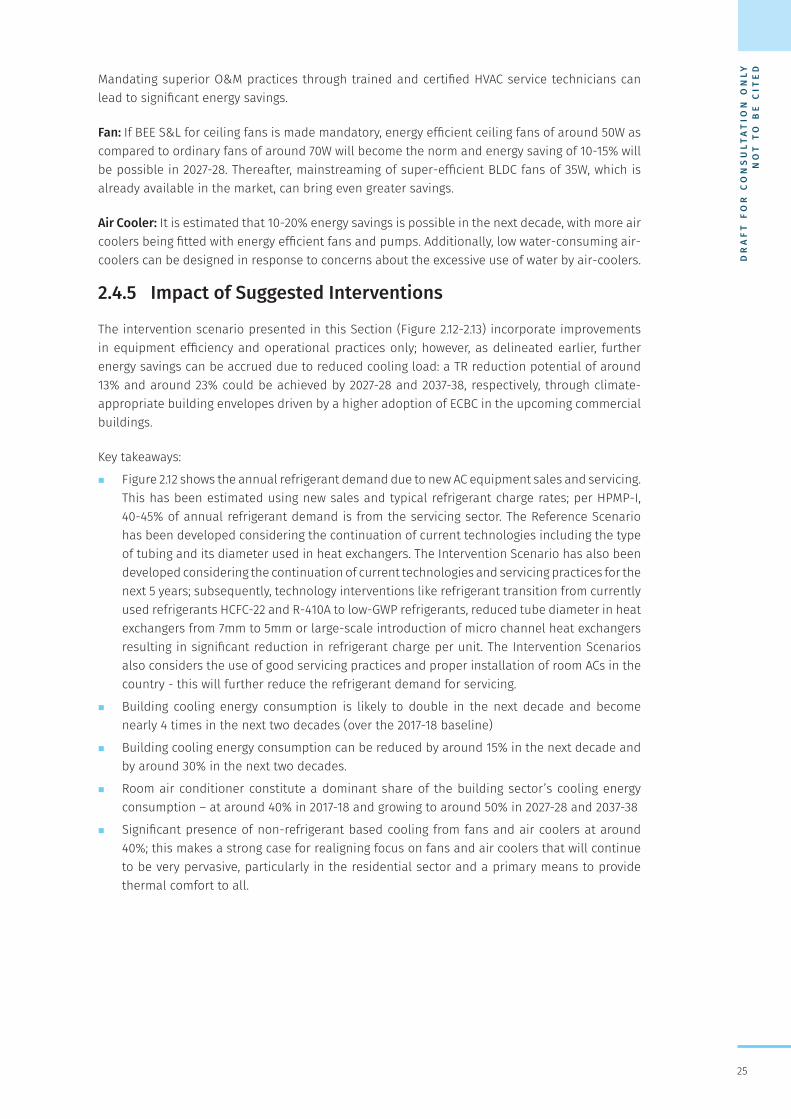
DR
AF
T F
OR
CO
NS
ULT
AT
ION
ON
LY
NO
T T
O B
E C
ITE
D
25
Mandating superior O&M practices through trained and certified HVAC service technicians can lead to significant energy savings.
Fan: If BEE S&L for ceiling fans is made mandatory, energy efficient ceiling fans of around 50W as compared to ordinary fans of around 70W will become the norm and energy saving of 10-15% will be possible in 2027-28. Thereafter, mainstreaming of super-efficient BLDC fans of 35W, which is already available in the market, can bring even greater savings.
Air Cooler: It is estimated that 10-20% energy savings is possible in the next decade, with more air coolers being fitted with energy efficient fans and pumps. Additionally, low water-consuming air-coolers can be designed in response to concerns about the excessive use of water by air-coolers.
2.4.5 Impact of Suggested Interventions
The intervention scenario presented in this Section (Figure 2.12-2.13) incorporate improvements in equipment efficiency and operational practices only; however, as delineated earlier, further energy savings can be accrued due to reduced cooling load: a TR reduction potential of around 13% and around 23% could be achieved by 2027-28 and 2037-38, respectively, through climate-appropriate building envelopes driven by a higher adoption of ECBC in the upcoming commercial buildings.
Key takeaways:
� Figure 2.12 shows the annual refrigerant demand due to new AC equipment sales and servicing. This has been estimated using new sales and typical refrigerant charge rates; per HPMP-I, 40-45% of annual refrigerant demand is from the servicing sector. The Reference Scenario has been developed considering the continuation of current technologies including the type of tubing and its diameter used in heat exchangers. The Intervention Scenario has also been developed considering the continuation of current technologies and servicing practices for the next 5 years; subsequently, technology interventions like refrigerant transition from currently used refrigerants HCFC-22 and R-410A to low-GWP refrigerants, reduced tube diameter in heat exchangers from 7mm to 5mm or large-scale introduction of micro channel heat exchangers resulting in significant reduction in refrigerant charge per unit. The Intervention Scenarios also considers the use of good servicing practices and proper installation of room ACs in the country - this will further reduce the refrigerant demand for servicing.
� Building cooling energy consumption is likely to double in the next decade and become nearly 4 times in the next two decades (over the 2017-18 baseline)
� Building cooling energy consumption can be reduced by around 15% in the next decade and by around 30% in the next two decades.
� Room air conditioner constitute a dominant share of the building sector’s cooling energy consumption – at around 40% in 2017-18 and growing to around 50% in 2027-28 and 2037-38
� Significant presence of non-refrigerant based cooling from fans and air coolers at around 40%; this makes a strong case for realigning focus on fans and air coolers that will continue to be very pervasive, particularly in the residential sector and a primary means to provide thermal comfort to all.
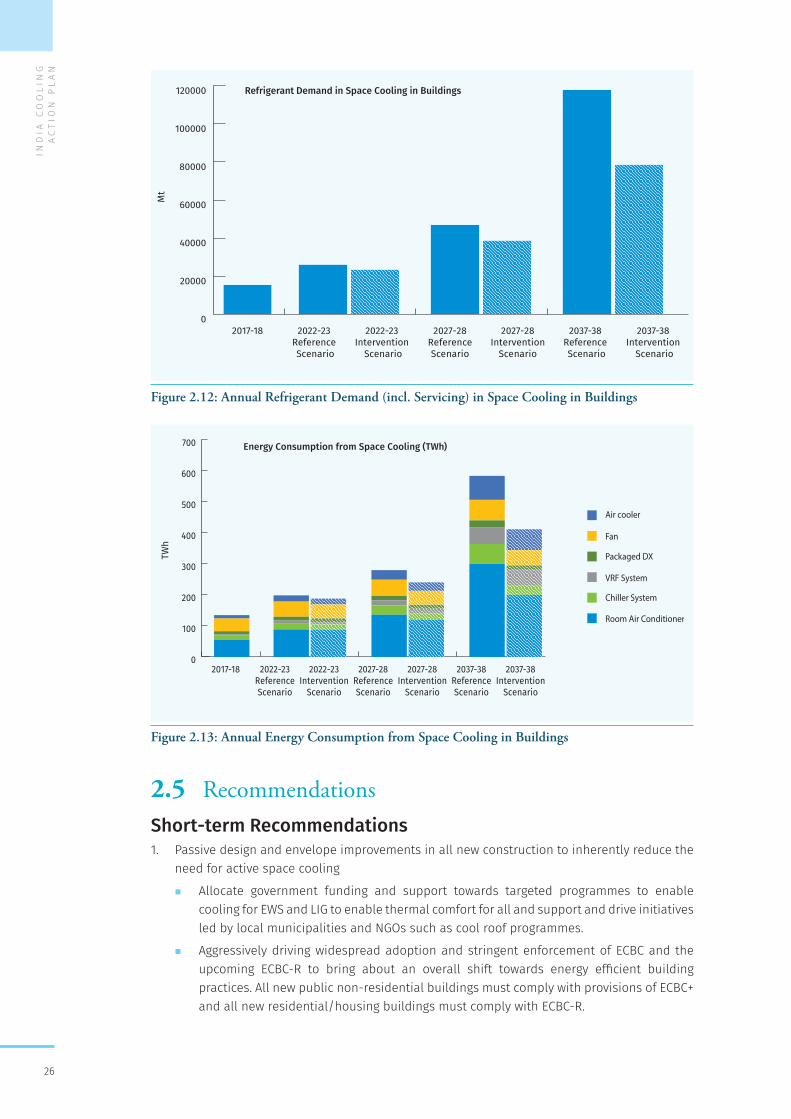
IND
IA C
OO
LIN
G A
CT
ION
PL
AN
26
Figure 2.12: Annual Refrigerant Demand (incl. Servicing) in Space Cooling in Buildings
Figure 2.13: Annual Energy Consumption from Space Cooling in Buildings
2.5 Recommendations Short-term Recommendations1. Passive design and envelope improvements in all new construction to inherently reduce the
need for active space cooling
� Allocate government funding and support towards targeted programmes to enable cooling for EWS and LIG to enable thermal comfort for all and support and drive initiatives led by local municipalities and NGOs such as cool roof programmes.
� Aggressively driving widespread adoption and stringent enforcement of ECBC and the upcoming ECBC-R to bring about an overall shift towards energy efficient building practices. All new public non-residential buildings must comply with provisions of ECBC+ and all new residential/housing buildings must comply with ECBC-R.
0
20000
40000
60000
80000
100000
120000
2037-38 Intervention
Scenario
2037-38 Reference Scenario
2022-23 Intervention
Scenario
2022-23 Reference Scenario
2017-18 2027-28ReferenceScenario
2027-28Intervention
Scenario
Refrigerant Demand in Space Cooling in Buildings
Mt
0
100
200
300
400
500
600
700
2037-38Intervention
Scenario
2037-38ReferenceScenario
2027-28Intervention
Scenario
2027-28ReferenceScenario
2022-23Intervention
Scenario
2022-23ReferenceScenario
2017-18
Air cooler
Fan
Packaged DX
VRF System
Chiller System
Room Air Conditioner
Energy Consumption from Space Cooling (TWh)
TWh
DR
AF
T F
OR
CO
NS
ULT
AT
ION
ON
LY
NO
T T
O B
E C
ITE
D
27
� Aggressive market awareness campaigns to sensitize both the construction community as well as the users towards the multiple benefits of efficient buildings – reduced operational costs, health and comfort, environmental and societal benefits.
� Develop a windows energy-labelling programme.
2. Leveraging the existing levels of technology to make it available for wider market adoption
� Drive widespread adoption of 5-star labelled fans and room air conditioners in new and existing public buildings and running campaigns to exhort the private sector and consumers to do the same to save money and the environment.
� Room Air-Conditioners manufacturers should be encouraged to further develop energy efficient ACs to innovate and bring about step-changes in technology.
� Make BEE Star Labelling of ceiling fans mandatory and introduce BEE Star Labelling for Air Coolers.
� Support information and capacity-building efforts that encourage consumers to opt for energy-efficient products and services.
� Incentivise selective adoption of the feasible new/not-in-kind cooling technologies to displace conventional air conditioning systems.
3. Adoption of Adaptive Thermal Comfort based set-point for air conditioner operation
� The need for shifting behavioural and psychological change towards adaptive thermal comfort (ATC) practices has already been realised by the Government of India.39 The building codes – ECBC and NBC - in their next revision cycles should include guidelines in alignment with ATC practices specific to the Indian climate.40 Accordingly, the minimum thermostat setting could be mandatorily kept between 24°C - 26°C and corresponding temperature setpoint guidelines should be issued by BEE to realise the national energy savings as estimated by AEEE41.
4. Measures to enhance operational efficiency of cooling systems
� Retrofitting and retro-commissioning existing buildings to reduce cooling requirement and energy consumption.
� Capacity building and training of HVAC servicing personnel who perform installation and product servicing is essential. Standardized training programs and certification is one way forward. Leading by example, the government should issue pubic procurement guidelines for trained and certified HVAC service technicians for public buildings.
5. DSM and DR programs for enhancing energy efficiency of cooling equipment
� Institutionalise Demand Side Management (DSM) programmes with DISCOMs to replace inefficient ACs with energy efficient equipment.
� Promote the use of Demand Response (DR)-enabled cooling technology, real-time power consumption displays in all Room Air-Conditioners and Building Automation/Management Systems.
6. Formulation and implementation of policies at the state level
� In line with Ministry of Finance’s General Financial Rules (GFR)- Office Memorandum No. 26/6/12-PPD42 regarding procurement of energy efficient electrical appliances for Ministries/Departments, States and Union Territories (UTs) should also issue public procurement guidelines for energy efficient room air conditioners and ceiling fans for all State/UT Departments.
� All States and UTs should notify and incorporate ECBC-2017 in municipal building bye-laws for stringent enforcement and compliance in all new construction.
� States and UTs should encourage proliferation of trained and certified HVAC O&M service technicians through capacity building and training of existing service professionals, and
IND
IA C
OO
LIN
G A
CT
ION
PL
AN
28
issue pubic procurement guidelines for trained and certified HVAC service technicians for public buildings.
7. Formation of a robust R&D team that leverages global best practices in space cooling and existing knowledge by closely monitoring pertinent policies and technology pathways.
8. Building energy data collection and reporting
� Institute a practise of mandatory building energy and cooling demand disclosures for all commercial buildings that have a connected load of 100 kW or greater.
� Improve data collection and statistics on energy efficiency indicators and make it part of the Open Government Data Platform put in place by the Government of India.
9. Instituting Eco-labelling programme for cooling appliances in India
� The environmental footprint of cooling equipment in terms of GWP (or ODP), GHG emissions, should be factored in combination with safety, performance, and energy efficiency, under a single eco/environmental label.
� Add cooling appliances under MoEF&CC, Government of India’s ‘Ecomark’ scheme on labelling of environment friendly products.
10. Institutionalize holistic and integrated approach for energy efficient building designs of commercial buildings with the mandate to minimize cooling needs under as a condition under Environmental Clearance (EC) policy.
11. Development of urban heat action plans
� Subsequent to Ahmedabad which was the first city to prepare and implement heat action plan, 30 cities in 11 states have adopted urban heat action plans. Municipal bodies of other cities which face extreme heat waves during summer should also adopt urban heat action plan that presents actions to increase preparedness, information-sharing, and response coordination to reduce the health impacts of extreme heat on vulnerable populations.
Medium-term Recommendations12. Greater adoption of the feasible new/not-in-kind cooling technologies (such as discussed
in section 2.4) which can possibly displace around 25% of the conventional air-conditioning systems.
13. All new construction – both residential and commercial – should be 100% code compliant.
14. The minimum stringency levels of ECBC compliance should be revised to current Super ECBC requirements.
15. Building Automation/Management Systems should be made mandatory in all new construction with a connected load of 100 kW or greater.
� Bolster national and international collaboration on cooling-related research
16. Step up funding for cooling research, focusing on emerging technologies that have the potential to drastically lower the emissions from cooling in the long term.
Long-term Recommendations17. Large scale deployment of current new/not-in-kind and upcoming cooling technologies to
significantly displace conventional air conditioning systems.
18. Greater focus on R&D in new low energy, low cost cooling technologies which could possibly be deployed on large scale.
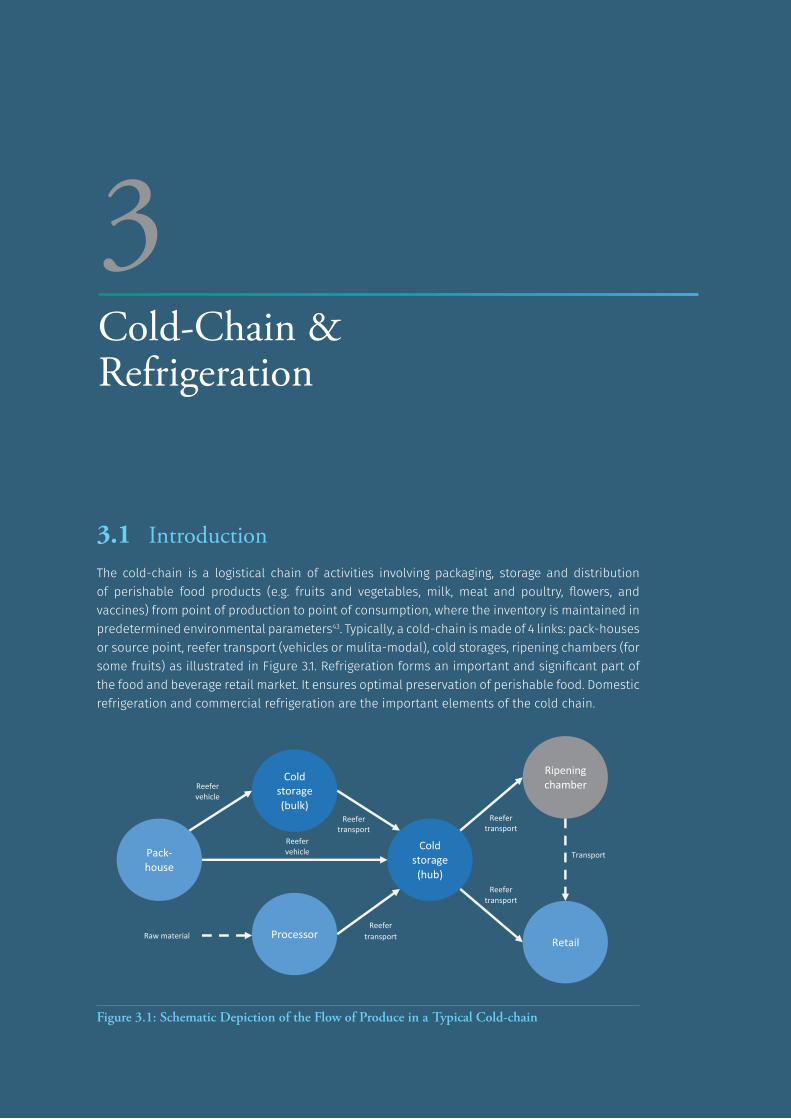
DR
AF
T F
OR
CO
NS
ULT
AT
ION
ON
LY
NO
T T
O B
E C
ITE
D
29
3.1 IntroductionThe cold-chain is a logistical chain of activities involving packaging, storage and distribution of perishable food products (e.g. fruits and vegetables, milk, meat and poultry, flowers, and vaccines) from point of production to point of consumption, where the inventory is maintained in predetermined environmental parameters43. Typically, a cold-chain is made of 4 links: pack-houses or source point, reefer transport (vehicles or mulita-modal), cold storages, ripening chambers (for some fruits) as illustrated in Figure 3.1. Refrigeration forms an important and significant part of the food and beverage retail market. It ensures optimal preservation of perishable food. Domestic refrigeration and commercial refrigeration are the important elements of the cold chain.
Figure 3.1: Schematic Depiction of the Flow of Produce in a Typical Cold-chain
Cold-Chain & Refrigeration
3
Pack-house
Retail
Cold storage (hub)
Cold storage (bulk)
Ripening chamber
Reefer vehicle
Processor Raw material
Reefer transport
Transport
Reefer transport
Reefer transport
Reefer transport
Reefer vehicle
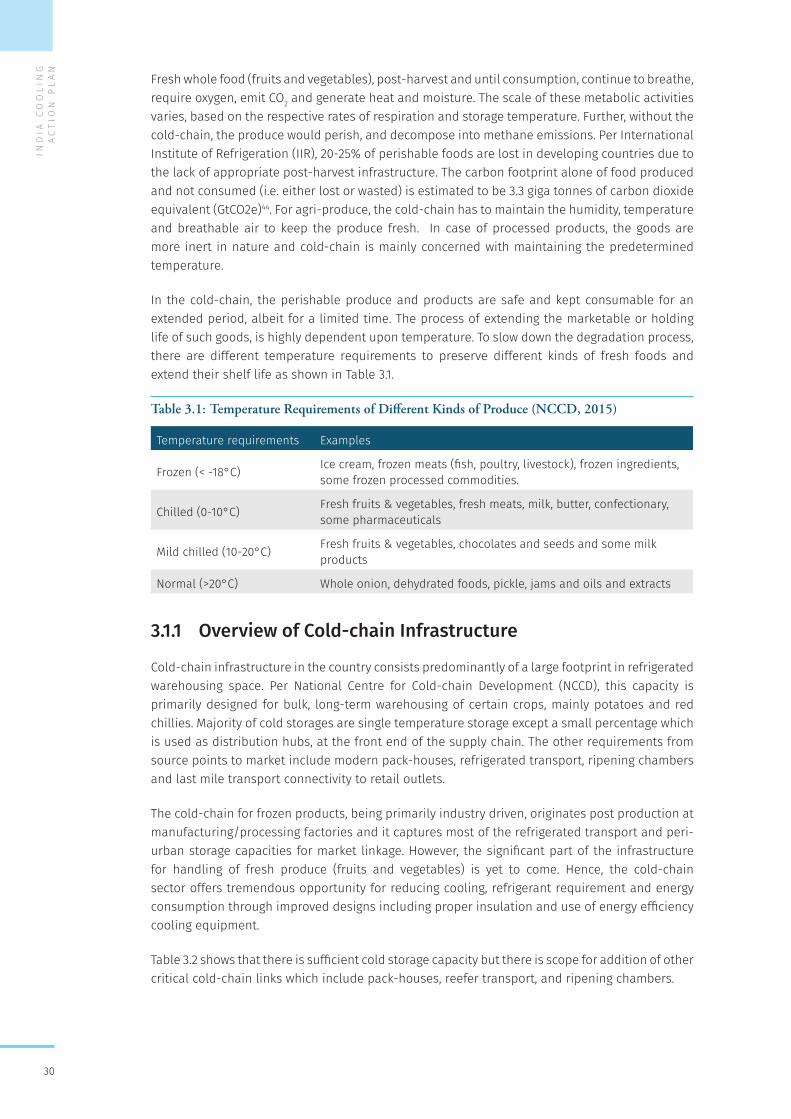
IND
IA C
OO
LIN
G A
CT
ION
PL
AN
30
Fresh whole food (fruits and vegetables), post-harvest and until consumption, continue to breathe, require oxygen, emit CO2 and generate heat and moisture. The scale of these metabolic activities varies, based on the respective rates of respiration and storage temperature. Further, without the cold-chain, the produce would perish, and decompose into methane emissions. Per International Institute of Refrigeration (IIR), 20-25% of perishable foods are lost in developing countries due to the lack of appropriate post-harvest infrastructure. The carbon footprint alone of food produced and not consumed (i.e. either lost or wasted) is estimated to be 3.3 giga tonnes of carbon dioxide equivalent (GtCO2e)44. For agri-produce, the cold-chain has to maintain the humidity, temperature and breathable air to keep the produce fresh. In case of processed products, the goods are more inert in nature and cold-chain is mainly concerned with maintaining the predetermined temperature.
In the cold-chain, the perishable produce and products are safe and kept consumable for an extended period, albeit for a limited time. The process of extending the marketable or holding life of such goods, is highly dependent upon temperature. To slow down the degradation process, there are different temperature requirements to preserve different kinds of fresh foods and extend their shelf life as shown in Table 3.1.
Table 3.1: Temperature Requirements of Different Kinds of Produce (NCCD, 2015)
Temperature requirements Examples
Frozen (< -18°C) Ice cream, frozen meats (fish, poultry, livestock), frozen ingredients, some frozen processed commodities.
Chilled (0-10°C) Fresh fruits & vegetables, fresh meats, milk, butter, confectionary, some pharmaceuticals
Mild chilled (10-20°C) Fresh fruits & vegetables, chocolates and seeds and some milk products
Normal (>20°C) Whole onion, dehydrated foods, pickle, jams and oils and extracts
3.1.1 Overview of Cold-chain Infrastructure
Cold-chain infrastructure in the country consists predominantly of a large footprint in refrigerated warehousing space. Per National Centre for Cold-chain Development (NCCD), this capacity is primarily designed for bulk, long-term warehousing of certain crops, mainly potatoes and red chillies. Majority of cold storages are single temperature storage except a small percentage which is used as distribution hubs, at the front end of the supply chain. The other requirements from source points to market include modern pack-houses, refrigerated transport, ripening chambers and last mile transport connectivity to retail outlets.
The cold-chain for frozen products, being primarily industry driven, originates post production at manufacturing/processing factories and it captures most of the refrigerated transport and peri-urban storage capacities for market linkage. However, the significant part of the infrastructure for handling of fresh produce (fruits and vegetables) is yet to come. Hence, the cold-chain sector offers tremendous opportunity for reducing cooling, refrigerant requirement and energy consumption through improved designs including proper insulation and use of energy efficiency cooling equipment.
Table 3.2 shows that there is sufficient cold storage capacity but there is scope for addition of other critical cold-chain links which include pack-houses, reefer transport, and ripening chambers.
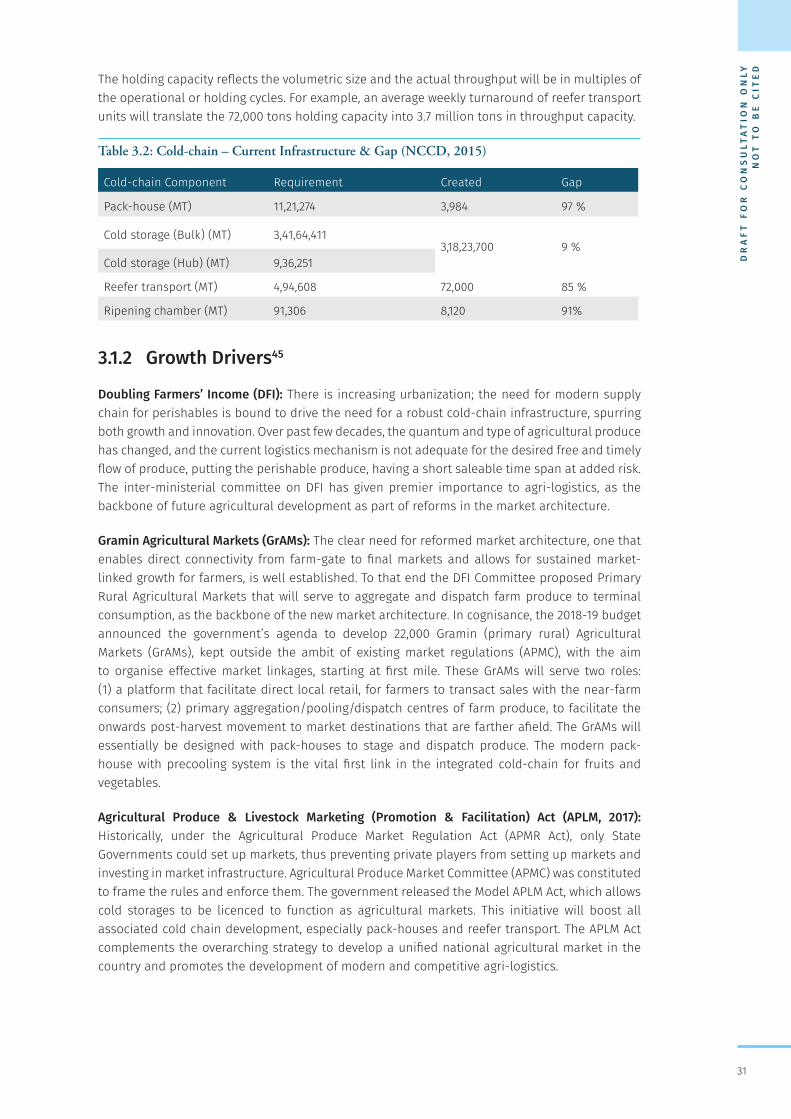
DR
AF
T F
OR
CO
NS
ULT
AT
ION
ON
LY
NO
T T
O B
E C
ITE
D
31
The holding capacity reflects the volumetric size and the actual throughput will be in multiples of the operational or holding cycles. For example, an average weekly turnaround of reefer transport units will translate the 72,000 tons holding capacity into 3.7 million tons in throughput capacity.
Table 3.2: Cold-chain – Current Infrastructure & Gap (NCCD, 2015)
Cold-chain Component Requirement Created Gap
Pack-house (MT) 11,21,274 3,984 97 %
Cold storage (Bulk) (MT) 3,41,64,4113,18,23,700 9 %
Cold storage (Hub) (MT) 9,36,251
Reefer transport (MT) 4,94,608 72,000 85 %
Ripening chamber (MT) 91,306 8,120 91%
3.1.2 Growth Drivers45
Doubling Farmers’ Income (DFI): There is increasing urbanization; the need for modern supply chain for perishables is bound to drive the need for a robust cold-chain infrastructure, spurring both growth and innovation. Over past few decades, the quantum and type of agricultural produce has changed, and the current logistics mechanism is not adequate for the desired free and timely flow of produce, putting the perishable produce, having a short saleable time span at added risk. The inter-ministerial committee on DFI has given premier importance to agri-logistics, as the backbone of future agricultural development as part of reforms in the market architecture.
Gramin Agricultural Markets (GrAMs): The clear need for reformed market architecture, one that enables direct connectivity from farm-gate to final markets and allows for sustained market-linked growth for farmers, is well established. To that end the DFI Committee proposed Primary Rural Agricultural Markets that will serve to aggregate and dispatch farm produce to terminal consumption, as the backbone of the new market architecture. In cognisance, the 2018-19 budget announced the government’s agenda to develop 22,000 Gramin (primary rural) Agricultural Markets (GrAMs), kept outside the ambit of existing market regulations (APMC), with the aim to organise effective market linkages, starting at first mile. These GrAMs will serve two roles: (1) a platform that facilitate direct local retail, for farmers to transact sales with the near-farm consumers; (2) primary aggregation/pooling/dispatch centres of farm produce, to facilitate the onwards post-harvest movement to market destinations that are farther afield. The GrAMs will essentially be designed with pack-houses to stage and dispatch produce. The modern pack-house with precooling system is the vital first link in the integrated cold-chain for fruits and vegetables.
Agricultural Produce & Livestock Marketing (Promotion & Facilitation) Act (APLM, 2017): Historically, under the Agricultural Produce Market Regulation Act (APMR Act), only State Governments could set up markets, thus preventing private players from setting up markets and investing in market infrastructure. Agricultural Produce Market Committee (APMC) was constituted to frame the rules and enforce them. The government released the Model APLM Act, which allows cold storages to be licenced to function as agricultural markets. This initiative will boost all associated cold chain development, especially pack-houses and reefer transport. The APLM Act complements the overarching strategy to develop a unified national agricultural market in the country and promotes the development of modern and competitive agri-logistics.
IND
IA C
OO
LIN
G A
CT
ION
PL
AN
32
3.2 Cold-chain & Refrigeration Components 3.2.1 Pack-house
The pack-house is the entry point into the cold-chain. Pack-houses are used to pre-condition the produce for market connectivity and typically serve a range of operations like sorting, grading, washing, drying, weighing, packaging, pre-cooling and staging. The Government has exempted preconditioning services from Goods and Services Tax (GST) to incentivise the development of pack-houses.
The precooling units and staging chambers require energy intensive cooling. Precooling of the produce rapidly for packaging and thereby prepare the loads for subsequent travel in the cold-chain. Depending on the produce, the pre-cooling process could be by forced-air cooling, hydro cooling, vacuum cooling, and room cooling or top-icing.
A cold staging unit is an insulated and refrigerated chamber which serves as a transient staging space and is a necessary attachment to a pre-cooling unit. A staging room frees the pre-cooler chamber to operate for sequential batches of freshly harvested produce.
The country presently has approximately 500 pack-houses (per inputs received from NCCD, Agricultural and Processed Food Products Export Development Authority (APEDA), National Horticulture Board (NHB) and other cold-chain industry experts) but growth in the creation of pack-houses is expected in the next 10-20 years, primarily driven by the Doubling Farmers’ Income (DFI) mission.
3.2.2 Reefer Transport
A reefer transport unit can be a road vehicle or reefer container, with a fixed insulated body equipped with active refrigeration. There are very small numbers of reefer containers in the country. Over 95% of current existing reefer vehicles are used mainly for carrying frozen products.
A typical reefer unit is considered with a holding capacity of 10 MT and is equipped with a refrigeration unit of 3.6-5 kW cooling capacity. However, a variety of sizes are in operation, of smaller and larger capacity. There are presently about 13,000-14,000 reefer vehicles as per the industry information. The number of reefer vehicles is likely to witness a high growth of 20-25% CAGR in the next 10 years while it is expected that the growth in the subsequent decade will be significantly less. Refrigeration systems using CO2 as a refrigerant and liquid-air based cooling systems are some of the emerging technologies for this sub-sector and are yet to be mainstreamed. Vapour Absorption Refrigeration (VAR) systems are sustainable option wherein waste heat from the prime mover can be utilized.
3.2.3 Cold Storage
A typical cold storage facility comprises a highly insulated and refrigerated warehouse designed to store perishable products to essentially maintain the temperature and humidity parameters, which were initiated at the pack-house (e.g. vegetables) or during manufacturing (egg. ice-cream). Based on the type of product and holding duration, NCCD has categorized cold storages in two categories, i.e. bulk cold storage and hub cold storage.
� Bulk cold storage is an environment-controlled warehousing space with multiple chambers intended for bulk storage of perishable produce and is often viewed as an independent refrigerated warehouse, and not part of an integrated cold-chain. The space is designed for long-term storage of a specific produce to build an inventory buffer which will serve to smoothen episodic production by stabilising & sustaining the supply lines. These are
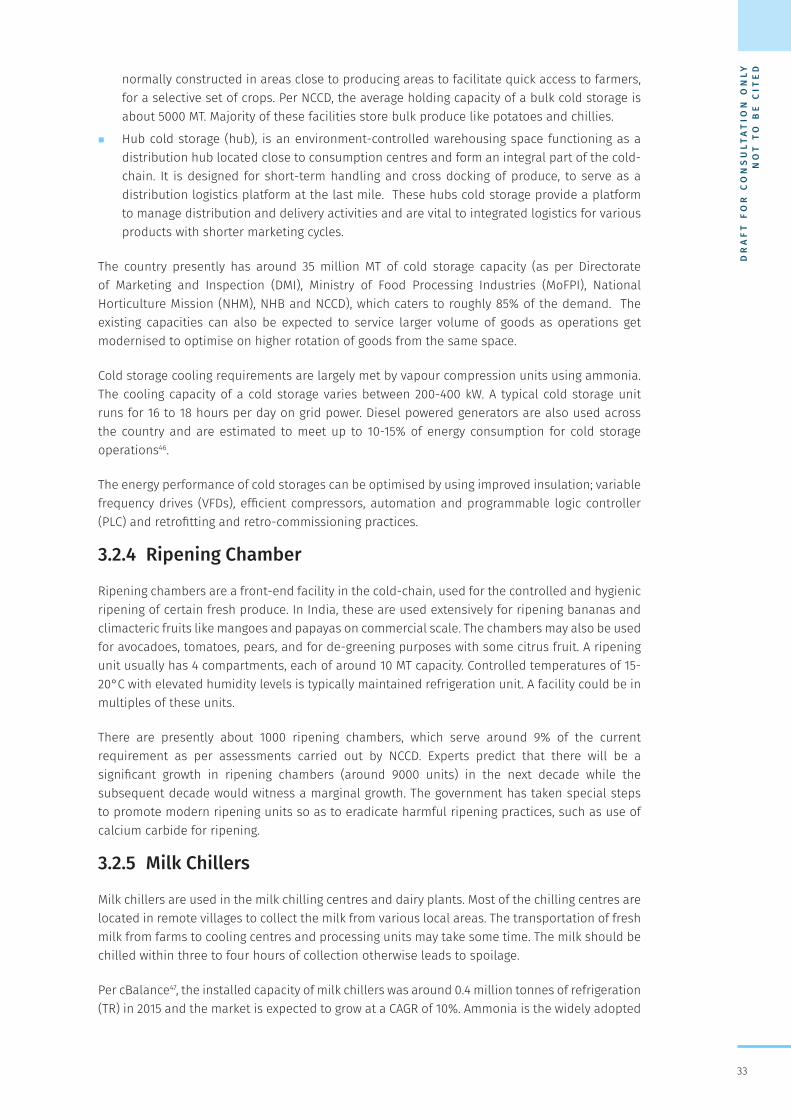
DR
AF
T F
OR
CO
NS
ULT
AT
ION
ON
LY
NO
T T
O B
E C
ITE
D
33
normally constructed in areas close to producing areas to facilitate quick access to farmers, for a selective set of crops. Per NCCD, the average holding capacity of a bulk cold storage is about 5000 MT. Majority of these facilities store bulk produce like potatoes and chillies.
� Hub cold storage (hub), is an environment-controlled warehousing space functioning as a distribution hub located close to consumption centres and form an integral part of the cold-chain. It is designed for short-term handling and cross docking of produce, to serve as a distribution logistics platform at the last mile. These hubs cold storage provide a platform to manage distribution and delivery activities and are vital to integrated logistics for various products with shorter marketing cycles.
The country presently has around 35 million MT of cold storage capacity (as per Directorate of Marketing and Inspection (DMI), Ministry of Food Processing Industries (MoFPI), National Horticulture Mission (NHM), NHB and NCCD), which caters to roughly 85% of the demand. The existing capacities can also be expected to service larger volume of goods as operations get modernised to optimise on higher rotation of goods from the same space.
Cold storage cooling requirements are largely met by vapour compression units using ammonia. The cooling capacity of a cold storage varies between 200-400 kW. A typical cold storage unit runs for 16 to 18 hours per day on grid power. Diesel powered generators are also used across the country and are estimated to meet up to 10-15% of energy consumption for cold storage operations46.
The energy performance of cold storages can be optimised by using improved insulation; variable frequency drives (VFDs), efficient compressors, automation and programmable logic controller (PLC) and retrofitting and retro-commissioning practices.
3.2.4 Ripening Chamber
Ripening chambers are a front-end facility in the cold-chain, used for the controlled and hygienic ripening of certain fresh produce. In India, these are used extensively for ripening bananas and climacteric fruits like mangoes and papayas on commercial scale. The chambers may also be used for avocadoes, tomatoes, pears, and for de-greening purposes with some citrus fruit. A ripening unit usually has 4 compartments, each of around 10 MT capacity. Controlled temperatures of 15-20°C with elevated humidity levels is typically maintained refrigeration unit. A facility could be in multiples of these units.
There are presently about 1000 ripening chambers, which serve around 9% of the current requirement as per assessments carried out by NCCD. Experts predict that there will be a significant growth in ripening chambers (around 9000 units) in the next decade while the subsequent decade would witness a marginal growth. The government has taken special steps to promote modern ripening units so as to eradicate harmful ripening practices, such as use of calcium carbide for ripening.
3.2.5 Milk Chillers
Milk chillers are used in the milk chilling centres and dairy plants. Most of the chilling centres are located in remote villages to collect the milk from various local areas. The transportation of fresh milk from farms to cooling centres and processing units may take some time. The milk should be chilled within three to four hours of collection otherwise leads to spoilage.
Per cBalance47, the installed capacity of milk chillers was around 0.4 million tonnes of refrigeration (TR) in 2015 and the market is expected to grow at a CAGR of 10%. Ammonia is the widely adopted
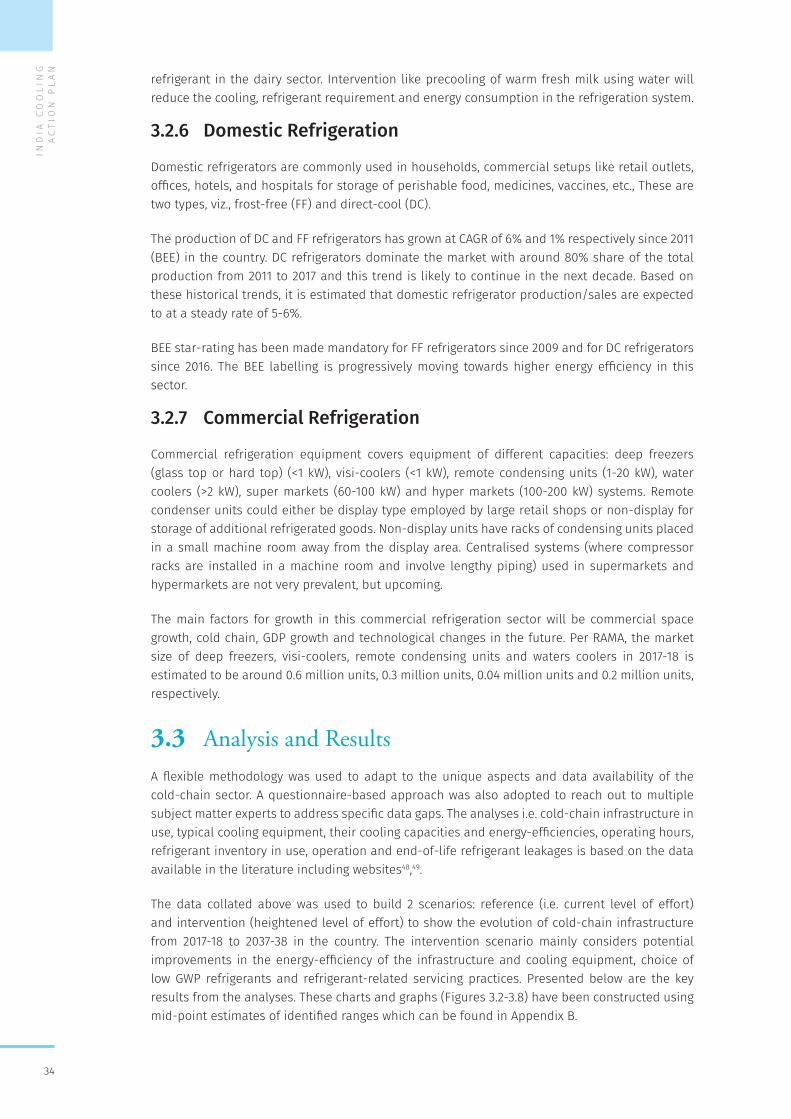
IND
IA C
OO
LIN
G A
CT
ION
PL
AN
34
refrigerant in the dairy sector. Intervention like precooling of warm fresh milk using water will reduce the cooling, refrigerant requirement and energy consumption in the refrigeration system.
3.2.6 Domestic Refrigeration
Domestic refrigerators are commonly used in households, commercial setups like retail outlets, offices, hotels, and hospitals for storage of perishable food, medicines, vaccines, etc., These are two types, viz., frost-free (FF) and direct-cool (DC).
The production of DC and FF refrigerators has grown at CAGR of 6% and 1% respectively since 2011 (BEE) in the country. DC refrigerators dominate the market with around 80% share of the total production from 2011 to 2017 and this trend is likely to continue in the next decade. Based on these historical trends, it is estimated that domestic refrigerator production/sales are expected to at a steady rate of 5-6%.
BEE star-rating has been made mandatory for FF refrigerators since 2009 and for DC refrigerators since 2016. The BEE labelling is progressively moving towards higher energy efficiency in this sector.
3.2.7 Commercial Refrigeration
Commercial refrigeration equipment covers equipment of different capacities: deep freezers (glass top or hard top) (<1 kW), visi-coolers (<1 kW), remote condensing units (1-20 kW), water coolers (>2 kW), super markets (60-100 kW) and hyper markets (100-200 kW) systems. Remote condenser units could either be display type employed by large retail shops or non-display for storage of additional refrigerated goods. Non-display units have racks of condensing units placed in a small machine room away from the display area. Centralised systems (where compressor racks are installed in a machine room and involve lengthy piping) used in supermarkets and hypermarkets are not very prevalent, but upcoming.
The main factors for growth in this commercial refrigeration sector will be commercial space growth, cold chain, GDP growth and technological changes in the future. Per RAMA, the market size of deep freezers, visi-coolers, remote condensing units and waters coolers in 2017-18 is estimated to be around 0.6 million units, 0.3 million units, 0.04 million units and 0.2 million units, respectively.
3.3 Analysis and Results A flexible methodology was used to adapt to the unique aspects and data availability of the cold-chain sector. A questionnaire-based approach was also adopted to reach out to multiple subject matter experts to address specific data gaps. The analyses i.e. cold-chain infrastructure in use, typical cooling equipment, their cooling capacities and energy-efficiencies, operating hours, refrigerant inventory in use, operation and end-of-life refrigerant leakages is based on the data available in the literature including websites48,49.
The data collated above was used to build 2 scenarios: reference (i.e. current level of effort) and intervention (heightened level of effort) to show the evolution of cold-chain infrastructure from 2017-18 to 2037-38 in the country. The intervention scenario mainly considers potential improvements in the energy-efficiency of the infrastructure and cooling equipment, choice of low GWP refrigerants and refrigerant-related servicing practices. Presented below are the key results from the analyses. These charts and graphs (Figures 3.2-3.8) have been constructed using mid-point estimates of identified ranges which can be found in Appendix B.
DR
AF
T F
OR
CO
NS
ULT
AT
ION
ON
LY
NO
T T
O B
E C
ITE
D
35
Figure 3.8 shows the annual refrigerant demand for new equipment as well as for servicing. This has been estimated using new sales and typical refrigerant charge rates. The refrigerant demand from this sector is assumed to reduce by 20-25% in the next 20 years, using a range of interventions: (a) Reduced cooling load through improved insulation (b) Technological improvements to reduce refrigerant charge size (like low-refrigerant charge refrigeration ammonia system) and (3) Improved refrigerant-related servicing practices during operation and end-of-life recovery.
Figure 3.2: Current and Future Trends in Pack-houses
Figure 3.3: Current and Future Trends in Reefer Vehicles
Figure 3.4: Current and Future Trends in Cold Storages
0
1
2
3
4
5
6
2037-382027-282022-232017-180
20
40
60
80
100
120
140
Stock
Pack-house
TWh
Annual EnergyConsumption(Intervention Scenario)
Annual EnergyConsumption(Reference Scenario)
1000 Unit
0
20000
40000
60000
80000
100000
120000
140000
2037-382027-282022-232017-180
100
200
300
400
500
Stock
Reefer Vehicle
TJ
Annual EnergyConsumption(Intervention Scenario)
Annual EnergyConsumption(Reference Scenario)
1000 Unit
3.6
3.8
4.0
4.2
4.4
4.6
4.8
5.0
2037-382027-282022-232017-180
10
20
30
40
50
60
Stock
Cold Storage
TWh
Million M
T Annual EnergyConsumption(Intervention Scenario)
Annual EnergyConsumption(Reference Scenario)
IND
IA C
OO
LIN
G A
CT
ION
PL
AN
36
Figure 3.5: Current and Future Trends in Ripening Chambers
Figure 3.6: Current and Future Trends in Domestic Refrigeration
Figure 3.7: Current and Future Trends in Commercial Refrigeration
0.0
0.2
0.4
0.6
0.8
1.0
1.2
1.4
1.6
2037-382027-282022-232017-180
2
4
6
8
10
12
14
16
Stock
Ripening Chamber
TWh
Annual EnergyConsumption(Intervention Scenario)
Annual EnergyConsumption(Reference Scenario)
1000 Unit
0
50
100
150
200
250
2037-382027-282022-232017-180
50
100
150
200
250
300
350
Annual EnergyConsumption(Intervention Scenario)
Annual EnergyConsumption(Reference Scenario)
Stock
Domestic Refrigerator
TWh
Million Unit
0
20
40
60
80
100
2037-382027-282022-232017-180
10
20
30
40
50
Annual EnergyConsumption(Intervention Scenario)
Annual EnergyConsumption(Reference Scenario)
Stock
Commercial Refrigeration
TWh
Million TR
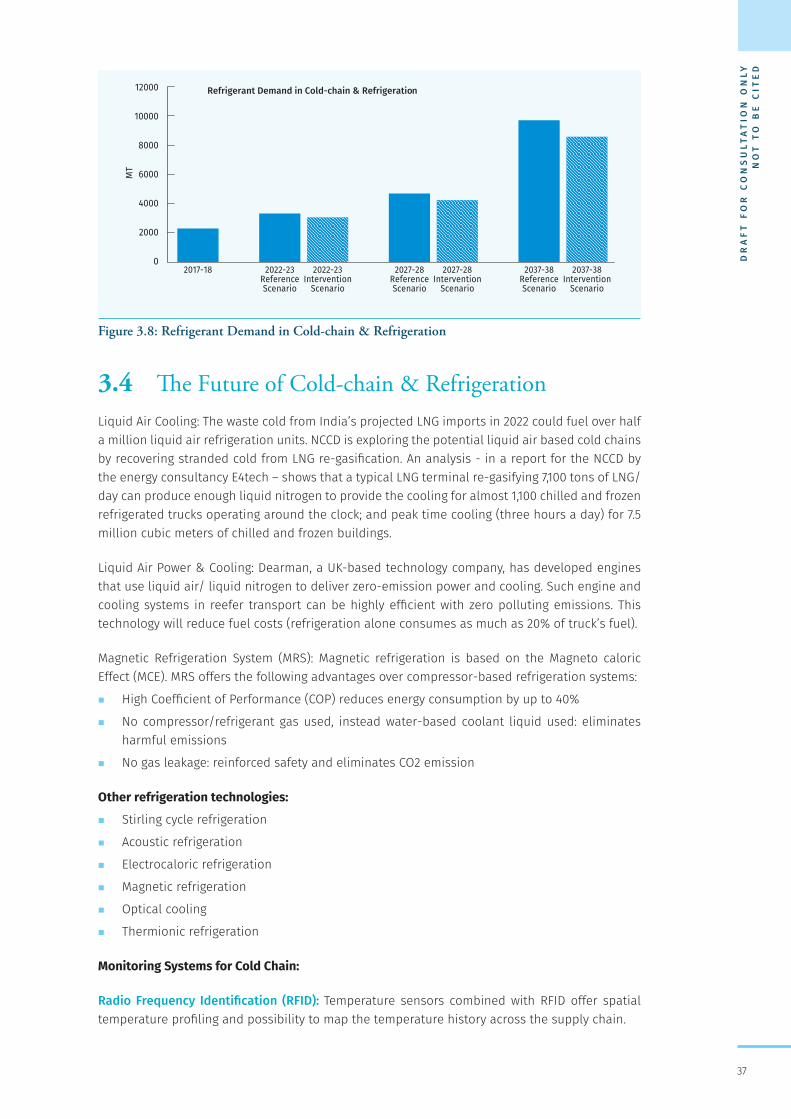
DR
AF
T F
OR
CO
NS
ULT
AT
ION
ON
LY
NO
T T
O B
E C
ITE
D
37
Figure 3.8: Refrigerant Demand in Cold-chain & Refrigeration
3.4 The Future of Cold-chain & RefrigerationLiquid Air Cooling: The waste cold from India’s projected LNG imports in 2022 could fuel over half a million liquid air refrigeration units. NCCD is exploring the potential liquid air based cold chains by recovering stranded cold from LNG re-gasification. An analysis - in a report for the NCCD by the energy consultancy E4tech – shows that a typical LNG terminal re-gasifying 7,100 tons of LNG/day can produce enough liquid nitrogen to provide the cooling for almost 1,100 chilled and frozen refrigerated trucks operating around the clock; and peak time cooling (three hours a day) for 7.5 million cubic meters of chilled and frozen buildings.
Liquid Air Power & Cooling: Dearman, a UK-based technology company, has developed engines that use liquid air/ liquid nitrogen to deliver zero-emission power and cooling. Such engine and cooling systems in reefer transport can be highly efficient with zero polluting emissions. This technology will reduce fuel costs (refrigeration alone consumes as much as 20% of truck’s fuel).
Magnetic Refrigeration System (MRS): Magnetic refrigeration is based on the Magneto caloric Effect (MCE). MRS offers the following advantages over compressor-based refrigeration systems:
� High Coefficient of Performance (COP) reduces energy consumption by up to 40%
� No compressor/refrigerant gas used, instead water-based coolant liquid used: eliminates harmful emissions
� No gas leakage: reinforced safety and eliminates CO2 emission
Other refrigeration technologies:
� Stirling cycle refrigeration
� Acoustic refrigeration
� Electrocaloric refrigeration
� Magnetic refrigeration
� Optical cooling
� Thermionic refrigeration
Monitoring Systems for Cold Chain:
Radio Frequency Identification (RFID): Temperature sensors combined with RFID offer spatial temperature profiling and possibility to map the temperature history across the supply chain.
0
2000
4000
6000
8000
10000
12000
2017-18 2022-23ReferenceScenario
2022-23Intervention
Scenario
2027-28ReferenceScenario
2027-28Intervention
Scenario
2037-38ReferenceScenario
2037-38Intervention
Scenario
Refrigerant Demand in Cold-chain & Refrigeration
MT
IND
IA C
OO
LIN
G A
CT
ION
PL
AN
38
Wireless Sensor Network (WSN) and Internet of Things (IoT): IoT is an ideal platform for remotely monitoring and controlling the real-time status of perishable goods across the cold-chain with very less human intervention. It enables integration of food safety systems and regulatory requirements and support specific report generation (as programmed in the algorithm).
Time Temperature Indicators (TTI): TTI’s are simple and inexpensive devices, which indicate the time-temperature history of the product when they are applied to them. Logging of humidity levels are also incorporated when handling fresh produce.
The early adoption of the latest monitoring, control mechanisms and automation in data capturing will be very useful tool as cold-chain sector has a long way to go. The key to transforming this aspect is to localize the technologies to suit the scale of industry and by creating flexibility in the system to accommodate and modify the elements of complex supply chains on a need basis.
Renewable and Alternate Energy Technologies:
There are a number of renewable and alternate energy technologies that are promising especially for cold chain application. In order to deliver on their potential for a sustained period of time, these technologies will require excellent engineering and installation, high quality components, and stringent commissioning and O&M services. Cooling options using available technology include:
� Solar PV systems
� Solar thermal systems
� Biomass gasifier
� Solar/Biomass Co-generation (Waste heat Recovery)
� Thermal Energy Storage by application of phase change materials (PCM)
National Institute of Solar Energy (NISE), TERI & Thermax developed biomass/biomass–solar hybrid system. The system can provide cold storage facility for storing (at 0°C) about 25 tonnes of fruits and vegetables. The Ministry of Agriculture & Farmers Welfare supports the deployment of such alternate energy technologies in cold-chain development.
PCM based refrigeration trucks are being manufactured by TESSOL in India and the shift from usage of a diesel generator to PCM can reduce the overall transportation cost by up to 50% for the end user. Pluss Polymers is a leading Indian player in the field of PCMs designed to cater to a wide range of temperatures between -33 to +89ºC.
3.5 RecommendationsShort-term Recommendations 1. Standardisation of design, construction and associated specifications for small, medium and
large cold-chain infrastructure components.
2. Link the incentives being provided for development of cold-chain infrastructure to the adoption of energy efficient practices for operation and maintenance
3. Commission demonstration projects for cold chain elements like pack- house, ripening chambers, etc., both for small as well as large units.
4. Address the current skill gaps through extensive capacity building and training necessary for professional’s, operators and technicians to promote the proper functioning of cold chains.
5. Training farmers on better management of produce both pre-harvest and post-harvest.
DR
AF
T F
OR
CO
NS
ULT
AT
ION
ON
LY
NO
T T
O B
E C
ITE
D
39
6. Promote research and development of low-cost technologies, and alternate and hybrid sources of energy, to address the specific problems of local supply chain.
7. Develop Management Information System through inter-ministerial collaboration, to track relevant information on infrastructure development and e- performance monitoring to improve overall efficiency of the cold-chain system.
8. Development of safety standards for flammable and toxic refrigerants for cold storage and other segments of the cold chain
9. Drive greater proliferation of efficient refrigeration equipment by fostering user awareness on purchase cost versus equipment life-cycle (operational) cost. This can be achieved through appropriate product labelling, and the government and industry’s collaboration on awareness campaigns.
10. Following proper O&M practices including basic measures such as regular cleaning of evaporator and ventilation grills holds tremendous potential to improve and upkeep operational energy performance especially for commercial refrigeration equipment. Both direct emissions from refrigerant leakage and indirect emissions from energy savings can be decreased by proper maintenance, including check of leaks and cleaning of appliances.
11. Proven market transformation mechanisms, such as EESL’s replacement scheme for Room Air-Conditioners, or government-supported refrigerator retrofit/upcycle programmes in other countries, can be emulated and adapted to eliminate inefficiencies due to obsolete refrigeration equipment.
12. All super market counters or cabinets should have operable doors or proper curtains to avoid energy wastages.
13. Apply appropriate policy measures to drive equipment efficiency improvements.
14. It is recommended that the country’s appliance standards and labelling programme which currently focuses on the consumer appliance categories be expanded to include widely used commercial refrigeration appliances such as deep freezers and visi-coolers as well. Plans should be formulated to put MEPS in place for the most widely used and energy-intensive commercial refrigeration equipment, which would encourage adoption of known technology, such as LED lights, advanced compressors, efficient evaporator and condenser fan motors.
15. Provide capacity building for technicians with national level certification schemes. Training should cover aspects such as installation and maintenance of refrigeration plant, energy efficient operation, and safe installation, management and recycling of equipment and refrigerant.
16. In line with Ministry of Finance’s General Financial Rules (GFR)- Office Memorandum No. 26/6/12-PPD regarding procurement of energy efficient electrical appliances for Ministries/Departments, States and Union Territories (UTs) should also establish public procurement guidelines for energy efficient refrigerators for all State/UT Departments.
Medium-term Recommendations17. Retrofitting old and inefficient cold chain systems with low-GWP, low refrigerant charge,
energy efficient & right-sized cold chain equipment.
18. Greater implementation of retrofitting and replacement programs for old inefficient refrigeration equipment.
19. Considering the energy-intensive nature and sharply rising demand of commercial refrigeration systems, Bureau of Energy Efficiency should mandate MEPS for select product categories.
Long-term Recommendations20. Selective adoption of feasible new cold-chain and refrigeration technologies

IND
IA C
OO
LIN
G A
CT
ION
PL
AN
40
DR
AF
T F
OR
CO
NS
ULT
AT
ION
ON
LY
NO
T T
O B
E C
ITE
D
41
4.1 OverviewAn accessible and connected transport infrastructure is the precursor of socio-economic development of a country as the obstacles leading to immobility restrict market growth, increase production cost, and decrease accessibility.50 In India, the transport sector is intrinsically diverse to cater to the needs of 1.25 billion people spread over a land area of 3.3 million km2. One of the key characteristics of Indian transport is the dominance of land transport (both road and railways).51 The Indian transport sector comprises one of the largest roads and rail networks in the world at 5.23 million km and 65,808 route km, respectively.52
India’s high growth in passenger and freight traffic during the past two decades has primarily been driven by factors, such as improvement in infrastructure facilities under various programmes like the National Highways Development Project (NHDP), Jawaharlal Nehru National Urban Renewal Mission (JNNURM), National Urban Livelihood Mission (NULM), etc., coupled with rapid urbanization, increasing affordability of individuals, and presence of multinational vehicle manufacturers.
While the road transport sector in India has experienced an overall growth (including passenger-kilometre and tonne-kilometre) of over 12% CAGR in the last 15 years, rail transport has experienced overall growth of 2.5% CAGR. The current trends of growth in these sectors is expected to continue in the future years to meet needs arising due to expected rapid pace of urbanization coupled with population and economic growth. The growing transport sector also translates to increased cooling requirements in this sector due to harsh climatic conditions prevailing in the country. Mobile Air Conditioning (MAC) is growing rapidly and forms a significant proposition of the total cooling requirement in the country. Refrigerant demand for the mobile air conditioning sector has also been growing exponentially in the last three decades.
Transport Air-Conditioning
4
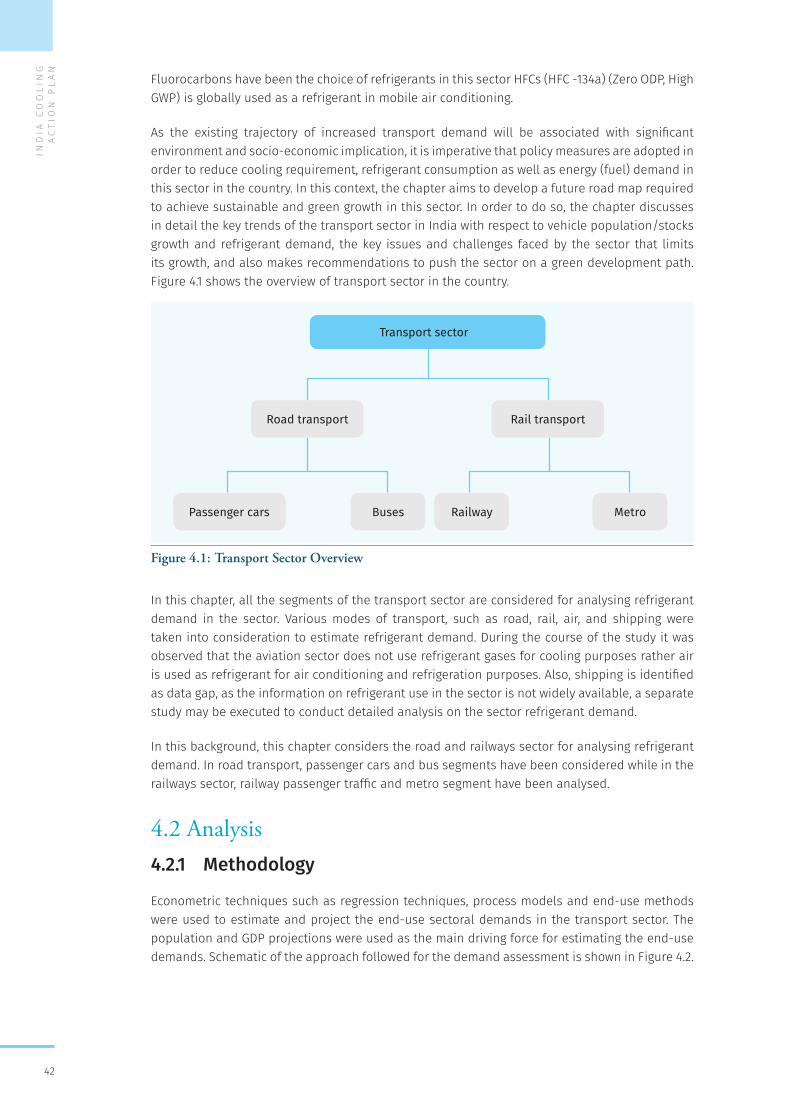
IND
IA C
OO
LIN
G A
CT
ION
PL
AN
42
Fluorocarbons have been the choice of refrigerants in this sector HFCs (HFC -134a) (Zero ODP, High GWP) is globally used as a refrigerant in mobile air conditioning.
As the existing trajectory of increased transport demand will be associated with significant environment and socio-economic implication, it is imperative that policy measures are adopted in order to reduce cooling requirement, refrigerant consumption as well as energy (fuel) demand in this sector in the country. In this context, the chapter aims to develop a future road map required to achieve sustainable and green growth in this sector. In order to do so, the chapter discusses in detail the key trends of the transport sector in India with respect to vehicle population/stocks growth and refrigerant demand, the key issues and challenges faced by the sector that limits its growth, and also makes recommendations to push the sector on a green development path. Figure 4.1 shows the overview of transport sector in the country.
Figure 4.1: Transport Sector Overview
In this chapter, all the segments of the transport sector are considered for analysing refrigerant demand in the sector. Various modes of transport, such as road, rail, air, and shipping were taken into consideration to estimate refrigerant demand. During the course of the study it was observed that the aviation sector does not use refrigerant gases for cooling purposes rather air is used as refrigerant for air conditioning and refrigeration purposes. Also, shipping is identified as data gap, as the information on refrigerant use in the sector is not widely available, a separate study may be executed to conduct detailed analysis on the sector refrigerant demand.
In this background, this chapter considers the road and railways sector for analysing refrigerant demand. In road transport, passenger cars and bus segments have been considered while in the railways sector, railway passenger traffic and metro segment have been analysed.
4.2 Analysis4.2.1 Methodology
Econometric techniques such as regression techniques, process models and end-use methods were used to estimate and project the end-use sectoral demands in the transport sector. The population and GDP projections were used as the main driving force for estimating the end-use demands. Schematic of the approach followed for the demand assessment is shown in Figure 4.2.
Transport sector
Road transport
Passenger cars RailwayBuses Metro
Rail transport
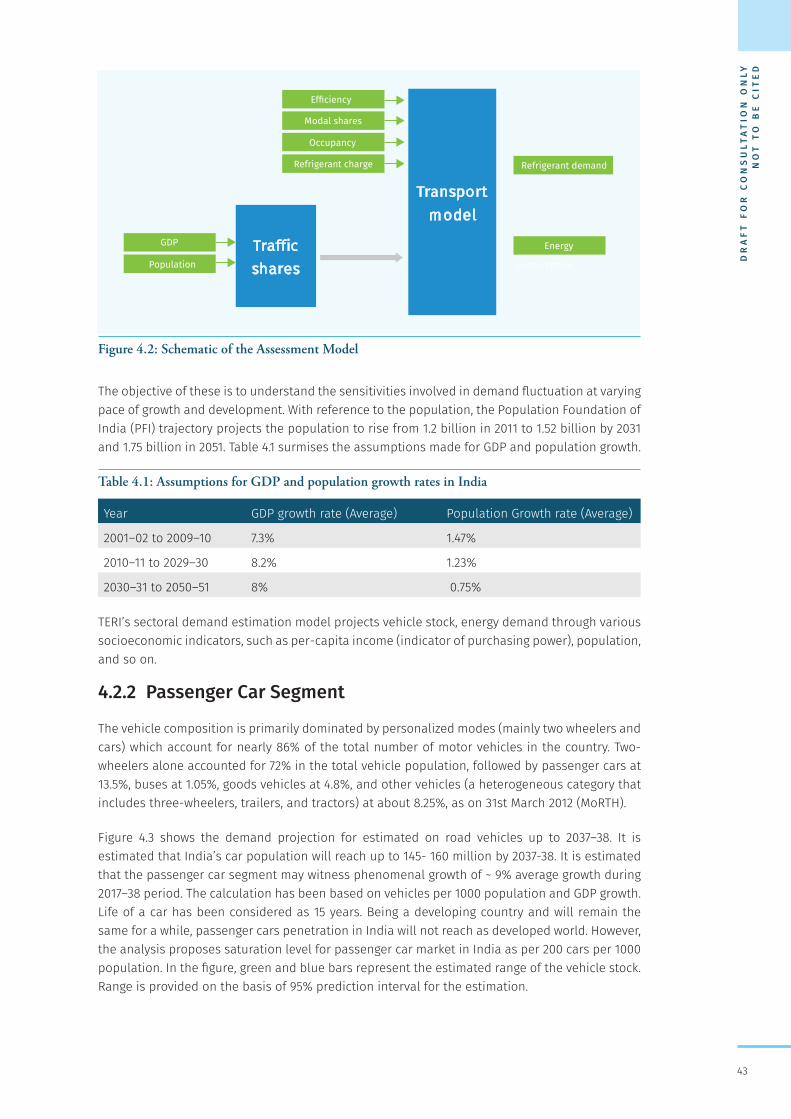
DR
AF
T F
OR
CO
NS
ULT
AT
ION
ON
LY
NO
T T
O B
E C
ITE
D
43
Figure 4.2: Schematic of the Assessment Model
The objective of these is to understand the sensitivities involved in demand fluctuation at varying pace of growth and development. With reference to the population, the Population Foundation of India (PFI) trajectory projects the population to rise from 1.2 billion in 2011 to 1.52 billion by 2031 and 1.75 billion in 2051. Table 4.1 surmises the assumptions made for GDP and population growth.
Table 4.1: Assumptions for GDP and population growth rates in India
Year GDP growth rate (Average) Population Growth rate (Average)
2001–02 to 2009–10 7.3% 1.47%
2010–11 to 2029–30 8.2% 1.23%
2030–31 to 2050–51 8% 0.75%
TERI’s sectoral demand estimation model projects vehicle stock, energy demand through various socioeconomic indicators, such as per-capita income (indicator of purchasing power), population, and so on.
4.2.2 Passenger Car Segment
The vehicle composition is primarily dominated by personalized modes (mainly two wheelers and cars) which account for nearly 86% of the total number of motor vehicles in the country. Two-wheelers alone accounted for 72% in the total vehicle population, followed by passenger cars at 13.5%, buses at 1.05%, goods vehicles at 4.8%, and other vehicles (a heterogeneous category that includes three-wheelers, trailers, and tractors) at about 8.25%, as on 31st March 2012 (MoRTH).
Figure 4.3 shows the demand projection for estimated on road vehicles up to 2037–38. It is estimated that India’s car population will reach up to 145- 160 million by 2037-38. It is estimated that the passenger car segment may witness phenomenal growth of ~ 9% average growth during 2017–38 period. The calculation has been based on vehicles per 1000 population and GDP growth. Life of a car has been considered as 15 years. Being a developing country and will remain the same for a while, passenger cars penetration in India will not reach as developed world. However, the analysis proposes saturation level for passenger car market in India as per 200 cars per 1000 population. In the figure, green and blue bars represent the estimated range of the vehicle stock. Range is provided on the basis of 95% prediction interval for the estimation.
Transport model
GDP
Population
Traffic shares
Efficiency
Modal shares
Occupancy
Energy
consumption
Refrigerant demandRefrigerant charge
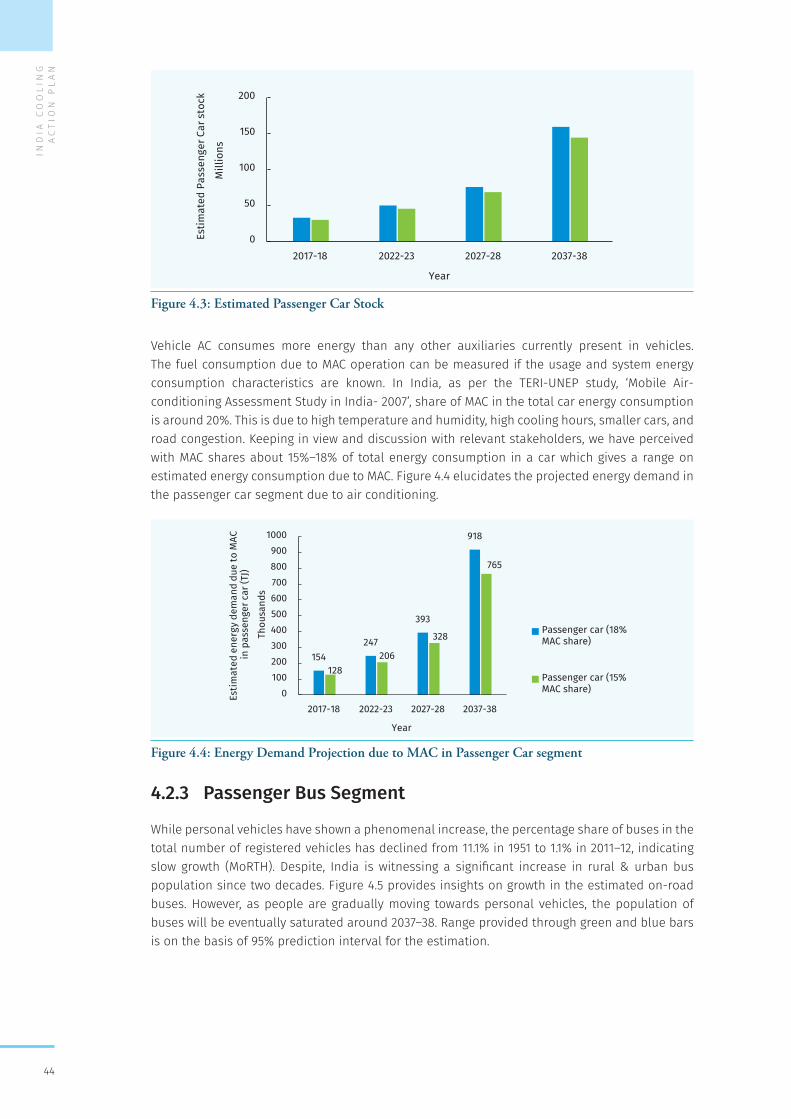
IND
IA C
OO
LIN
G A
CT
ION
PL
AN
44
Figure 4.3: Estimated Passenger Car Stock
Vehicle AC consumes more energy than any other auxiliaries currently present in vehicles. The fuel consumption due to MAC operation can be measured if the usage and system energy consumption characteristics are known. In India, as per the TERI-UNEP study, ‘Mobile Air-conditioning Assessment Study in India- 2007’, share of MAC in the total car energy consumption is around 20%. This is due to high temperature and humidity, high cooling hours, smaller cars, and road congestion. Keeping in view and discussion with relevant stakeholders, we have perceived with MAC shares about 15%–18% of total energy consumption in a car which gives a range on estimated energy consumption due to MAC. Figure 4.4 elucidates the projected energy demand in the passenger car segment due to air conditioning.
Figure 4.4: Energy Demand Projection due to MAC in Passenger Car segment
4.2.3 Passenger Bus Segment
While personal vehicles have shown a phenomenal increase, the percentage share of buses in the total number of registered vehicles has declined from 11.1% in 1951 to 1.1% in 2011–12, indicating slow growth (MoRTH). Despite, India is witnessing a significant increase in rural & urban bus population since two decades. Figure 4.5 provides insights on growth in the estimated on-road buses. However, as people are gradually moving towards personal vehicles, the population of buses will be eventually saturated around 2037–38. Range provided through green and blue bars is on the basis of 95% prediction interval for the estimation.
0
50
100
150
200
2017-18 2022-23 2027-28 2037-38
kcots raC regnessPa
Estim
ated
Mill
ions
Year
154247
393
918
128206
328
765
0100200300400500600700800900
1000
2017-18 2022-23 2027-28 2037-38
CAM ot eud dna
med ygrene detamitsE
in p
asse
nger
car
(TJ)
Thou
sand
s
Year
Passenger car (18%MAC share)
Passenger car (15%MAC share)
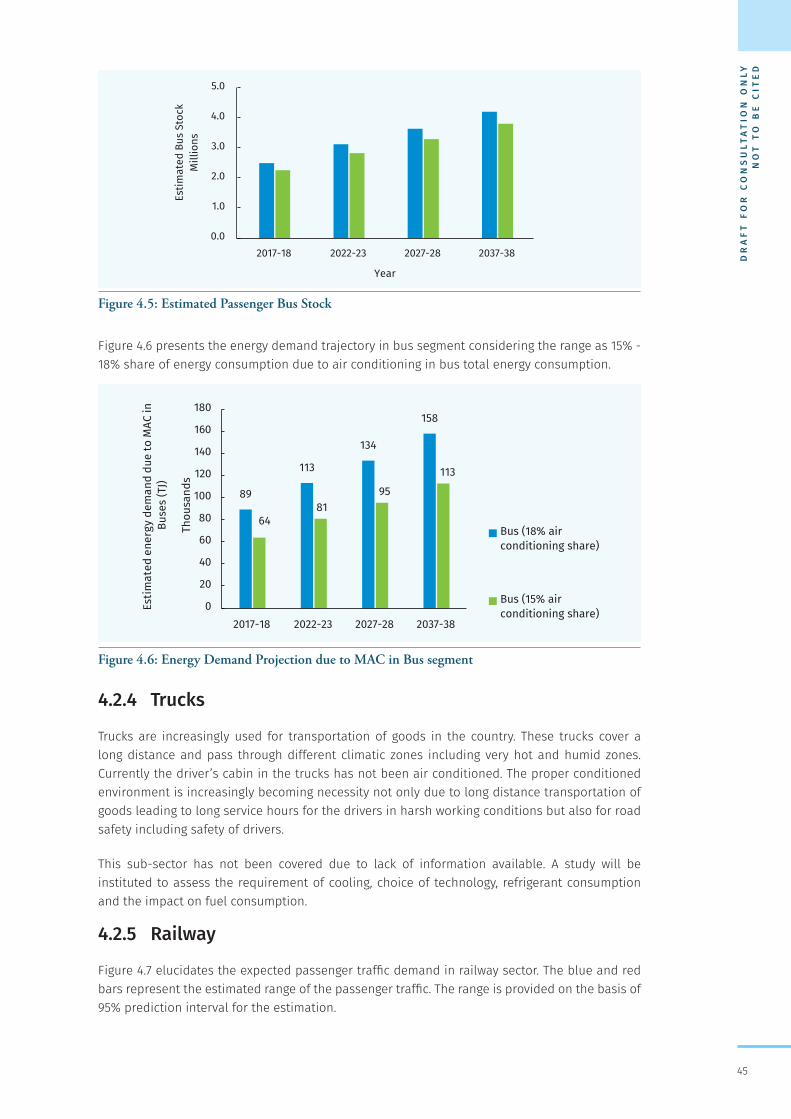
DR
AF
T F
OR
CO
NS
ULT
AT
ION
ON
LY
NO
T T
O B
E C
ITE
D
45
Figure 4.5: Estimated Passenger Bus Stock
Figure 4.6 presents the energy demand trajectory in bus segment considering the range as 15% - 18% share of energy consumption due to air conditioning in bus total energy consumption.
Figure 4.6: Energy Demand Projection due to MAC in Bus segment
4.2.4 Trucks
Trucks are increasingly used for transportation of goods in the country. These trucks cover a long distance and pass through different climatic zones including very hot and humid zones. Currently the driver’s cabin in the trucks has not been air conditioned. The proper conditioned environment is increasingly becoming necessity not only due to long distance transportation of goods leading to long service hours for the drivers in harsh working conditions but also for road safety including safety of drivers.
This sub-sector has not been covered due to lack of information available. A study will be instituted to assess the requirement of cooling, choice of technology, refrigerant consumption and the impact on fuel consumption.
4.2.5 Railway
Figure 4.7 elucidates the expected passenger traffic demand in railway sector. The blue and red bars represent the estimated range of the passenger traffic. The range is provided on the basis of 95% prediction interval for the estimation.
0.0
1.0
2.0
3.0
4.0
5.0
2017-18 2022-23 2027-28 2037-38
Estim
ated
Bus
Sto
ckM
illio
ns
Year
89
113
134
158
6481
95113
0
20
40
60
80
100
120
140
160
180
2017-18 2022-23 2027-28 2037-38
ni CAM ot eud dna
med ygrene detamitsE
Buse
s (T
J)
Thou
sand
s
Year
Bus (18% airconditioning share)
Bus (15% airconditioning share)
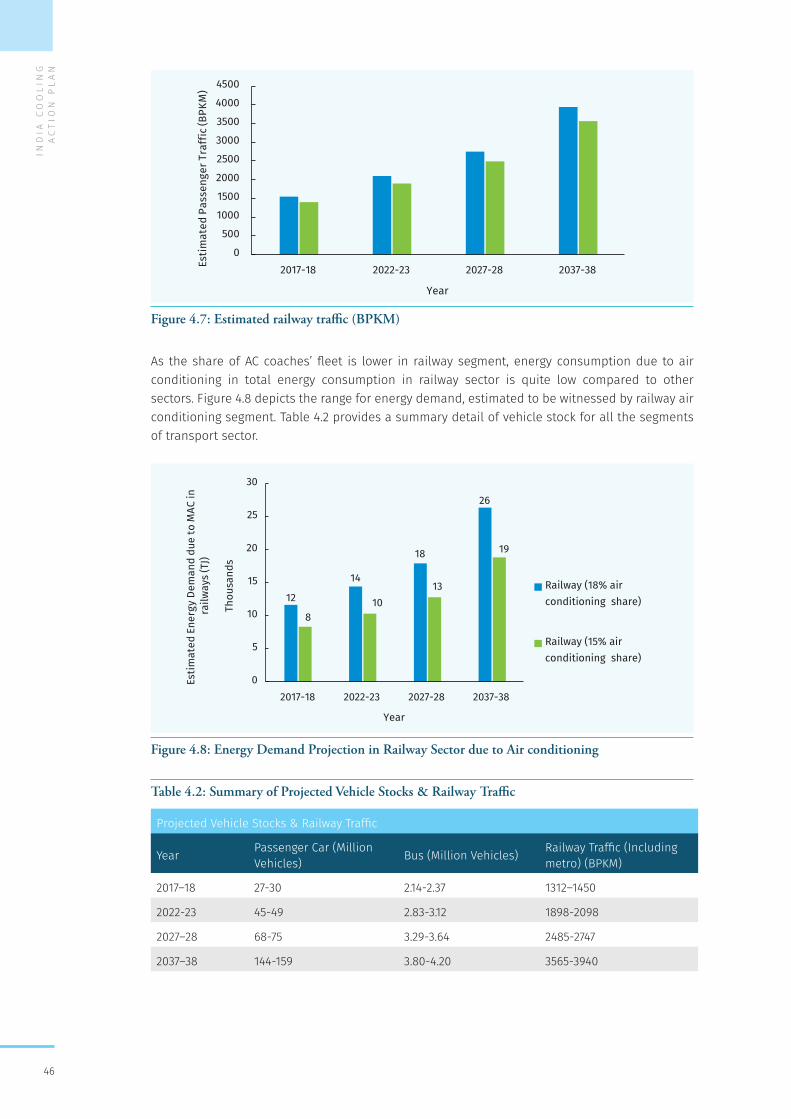
IND
IA C
OO
LIN
G A
CT
ION
PL
AN
46
Figure 4.7: Estimated railway traffic (BPKM)
As the share of AC coaches’ fleet is lower in railway segment, energy consumption due to air conditioning in total energy consumption in railway sector is quite low compared to other sectors. Figure 4.8 depicts the range for energy demand, estimated to be witnessed by railway air conditioning segment. Table 4.2 provides a summary detail of vehicle stock for all the segments of transport sector.
Figure 4.8: Energy Demand Projection in Railway Sector due to Air conditioning
Table 4.2: Summary of Projected Vehicle Stocks & Railway Traffic
Projected Vehicle Stocks & Railway Traffic
Year Passenger Car (Million Vehicles) Bus (Million Vehicles) Railway Traffic (Including
metro) (BPKM)
2017–18 27-30 2.14-2.37 1312–1450
2022-23 45-49 2.83-3.12 1898-2098
2027–28 68-75 3.29-3.64 2485-2747
2037–38 144-159 3.80-4.20 3565-3940
0
500
1000
1500
2000
2500
3000
3500
4000
4500
2017-18 2022-23 2027-28 2037-38
)MKPB( ciffarT regnessaP deta
mitsE
Year
12
14
18
26
810
13
19
0
5
10
15
20
25
30
2017-18 2022-23 2027-28 2037-38
ni CAM ot eud dna
meD ygrenE detamitsE
railw
ays
(TJ)
Thou
sand
s
Year
Railway (18% airconditioning share)
Railway (15% airconditioning share)
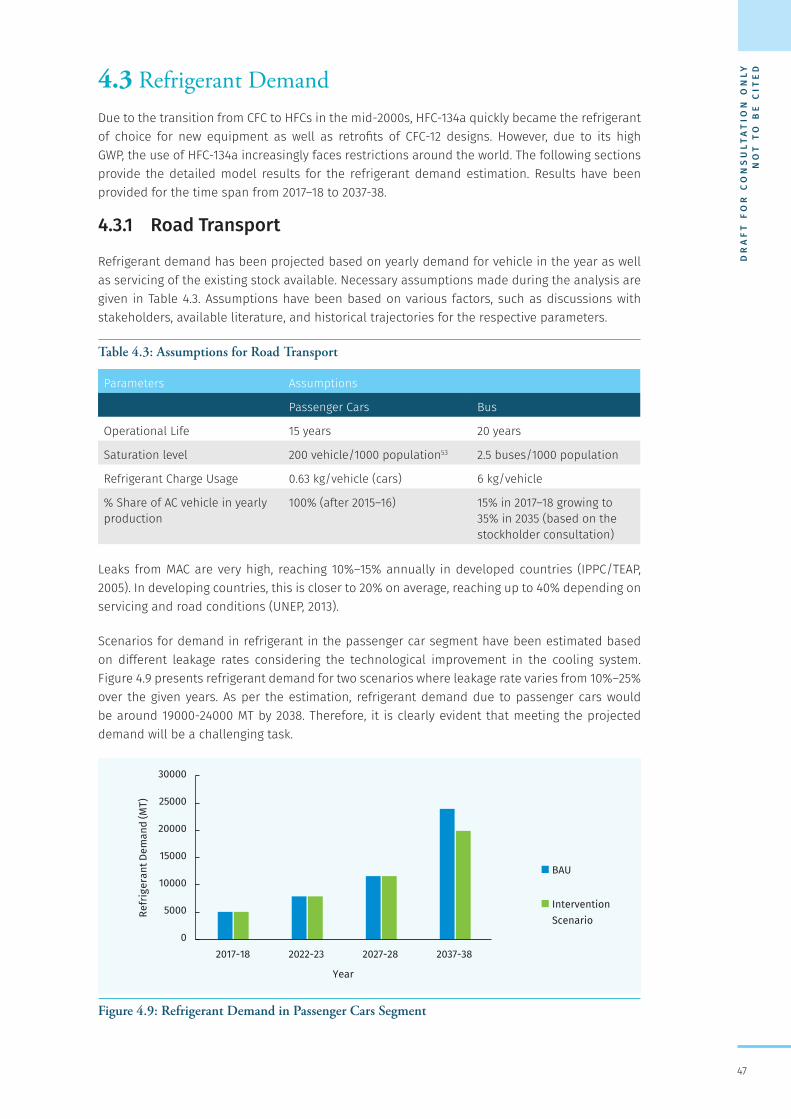
DR
AF
T F
OR
CO
NS
ULT
AT
ION
ON
LY
NO
T T
O B
E C
ITE
D
47
4.3 Refrigerant Demand Due to the transition from CFC to HFCs in the mid-2000s, HFC-134a quickly became the refrigerant of choice for new equipment as well as retrofits of CFC-12 designs. However, due to its high GWP, the use of HFC-134a increasingly faces restrictions around the world. The following sections provide the detailed model results for the refrigerant demand estimation. Results have been provided for the time span from 2017–18 to 2037-38.
4.3.1 Road Transport
Refrigerant demand has been projected based on yearly demand for vehicle in the year as well as servicing of the existing stock available. Necessary assumptions made during the analysis are given in Table 4.3. Assumptions have been based on various factors, such as discussions with stakeholders, available literature, and historical trajectories for the respective parameters.
Table 4.3: Assumptions for Road Transport
Parameters Assumptions
Passenger Cars Bus
Operational Life 15 years 20 years
Saturation level 200 vehicle/1000 population53 2.5 buses/1000 population
Refrigerant Charge Usage 0.63 kg/vehicle (cars) 6 kg/vehicle
% Share of AC vehicle in yearly production
100% (after 2015–16) 15% in 2017–18 growing to 35% in 2035 (based on the stockholder consultation)
Leaks from MAC are very high, reaching 10%–15% annually in developed countries (IPPC/TEAP, 2005). In developing countries, this is closer to 20% on average, reaching up to 40% depending on servicing and road conditions (UNEP, 2013).
Scenarios for demand in refrigerant in the passenger car segment have been estimated based on different leakage rates considering the technological improvement in the cooling system. Figure 4.9 presents refrigerant demand for two scenarios where leakage rate varies from 10%–25% over the given years. As per the estimation, refrigerant demand due to passenger cars would be around 19000-24000 MT by 2038. Therefore, it is clearly evident that meeting the projected demand will be a challenging task.
Figure 4.9: Refrigerant Demand in Passenger Cars Segment
0
5000
10000
15000
20000
25000
30000
2017-18 2022-23 2027-28 2037-38
)TM( dna
meD tnaregirfeR
Year
BAU
InterventionScenario
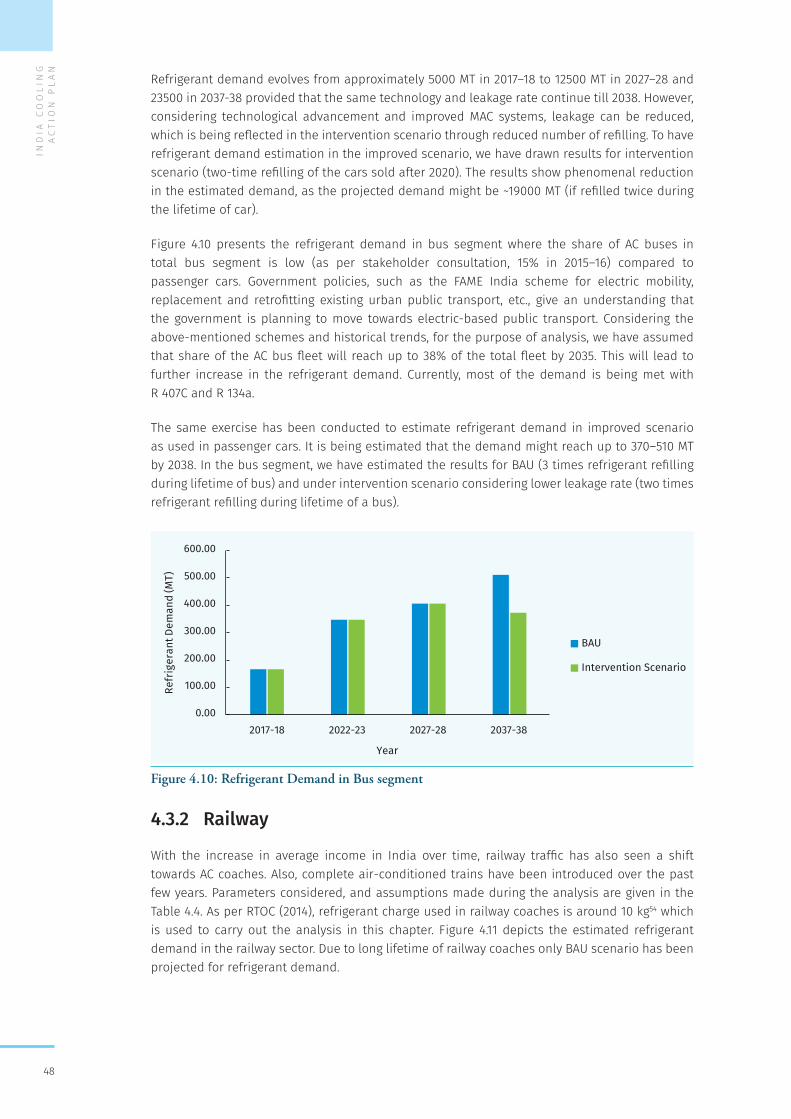
IND
IA C
OO
LIN
G A
CT
ION
PL
AN
48
Refrigerant demand evolves from approximately 5000 MT in 2017–18 to 12500 MT in 2027–28 and 23500 in 2037-38 provided that the same technology and leakage rate continue till 2038. However, considering technological advancement and improved MAC systems, leakage can be reduced, which is being reflected in the intervention scenario through reduced number of refilling. To have refrigerant demand estimation in the improved scenario, we have drawn results for intervention scenario (two-time refilling of the cars sold after 2020). The results show phenomenal reduction in the estimated demand, as the projected demand might be ~19000 MT (if refilled twice during the lifetime of car).
Figure 4.10 presents the refrigerant demand in bus segment where the share of AC buses in total bus segment is low (as per stakeholder consultation, 15% in 2015–16) compared to passenger cars. Government policies, such as the FAME India scheme for electric mobility, replacement and retrofitting existing urban public transport, etc., give an understanding that the government is planning to move towards electric-based public transport. Considering the above-mentioned schemes and historical trends, for the purpose of analysis, we have assumed that share of the AC bus fleet will reach up to 38% of the total fleet by 2035. This will lead to further increase in the refrigerant demand. Currently, most of the demand is being met with R 407C and R 134a.
The same exercise has been conducted to estimate refrigerant demand in improved scenario as used in passenger cars. It is being estimated that the demand might reach up to 370–510 MT by 2038. In the bus segment, we have estimated the results for BAU (3 times refrigerant refilling during lifetime of bus) and under intervention scenario considering lower leakage rate (two times refrigerant refilling during lifetime of a bus).
Figure 4.10: Refrigerant Demand in Bus segment
4.3.2 Railway
With the increase in average income in India over time, railway traffic has also seen a shift towards AC coaches. Also, complete air-conditioned trains have been introduced over the past few years. Parameters considered, and assumptions made during the analysis are given in the Table 4.4. As per RTOC (2014), refrigerant charge used in railway coaches is around 10 kg54 which is used to carry out the analysis in this chapter. Figure 4.11 depicts the estimated refrigerant demand in the railway sector. Due to long lifetime of railway coaches only BAU scenario has been projected for refrigerant demand.
0.00
100.00
200.00
300.00
400.00
500.00
600.00
2017-18 2022-23 2027-28 2037-38
)TM( dna
meD tnaregirfeR
Year
BAU
Intervention Scenario
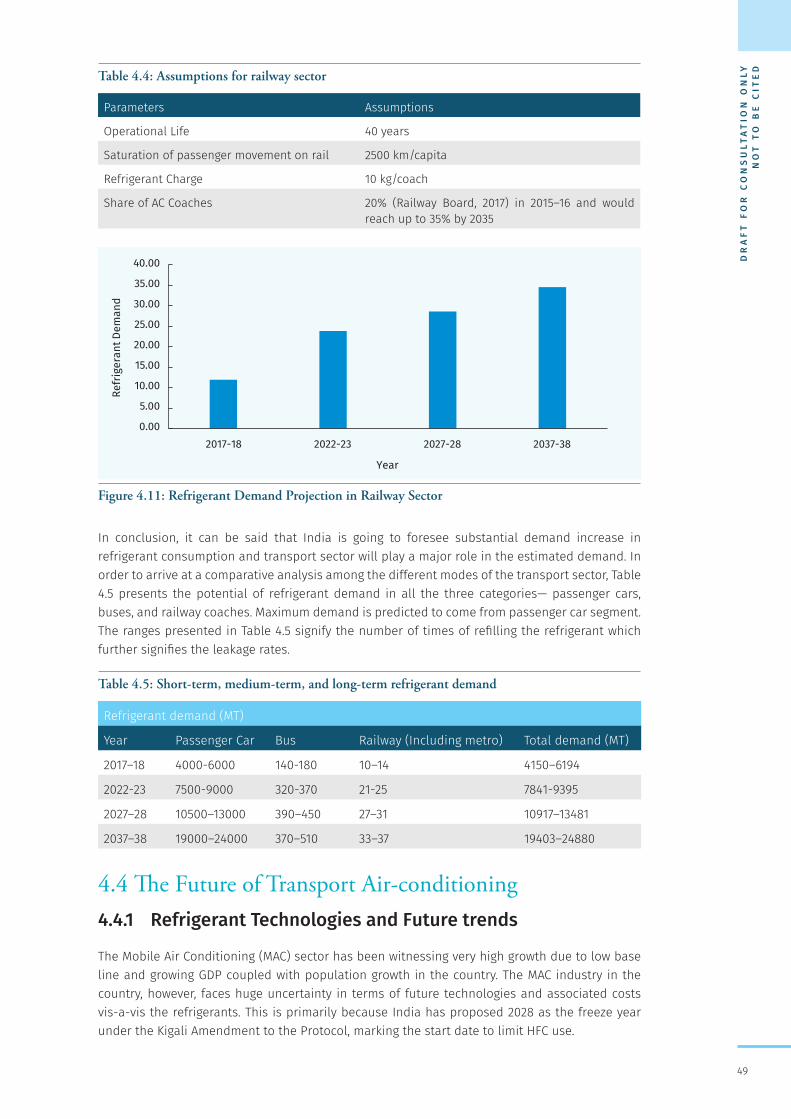
DR
AF
T F
OR
CO
NS
ULT
AT
ION
ON
LY
NO
T T
O B
E C
ITE
D
49
Table 4.4: Assumptions for railway sector
Parameters Assumptions
Operational Life 40 years
Saturation of passenger movement on rail 2500 km/capita
Refrigerant Charge 10 kg/coach
Share of AC Coaches 20% (Railway Board, 2017) in 2015–16 and would reach up to 35% by 2035
Figure 4.11: Refrigerant Demand Projection in Railway Sector
In conclusion, it can be said that India is going to foresee substantial demand increase in refrigerant consumption and transport sector will play a major role in the estimated demand. In order to arrive at a comparative analysis among the different modes of the transport sector, Table 4.5 presents the potential of refrigerant demand in all the three categories— passenger cars, buses, and railway coaches. Maximum demand is predicted to come from passenger car segment. The ranges presented in Table 4.5 signify the number of times of refilling the refrigerant which further signifies the leakage rates.
Table 4.5: Short-term, medium-term, and long-term refrigerant demand
Refrigerant demand (MT)
Year Passenger Car Bus Railway (Including metro) Total demand (MT)
2017–18 4000-6000 140-180 10–14 4150–6194
2022-23 7500-9000 320-370 21-25 7841-9395
2027–28 10500–13000 390–450 27–31 10917–13481
2037–38 19000–24000 370–510 33–37 19403–24880
4.4 The Future of Transport Air-conditioning 4.4.1 Refrigerant Technologies and Future trends
The Mobile Air Conditioning (MAC) sector has been witnessing very high growth due to low base line and growing GDP coupled with population growth in the country. The MAC industry in the country, however, faces huge uncertainty in terms of future technologies and associated costs vis-a-vis the refrigerants. This is primarily because India has proposed 2028 as the freeze year under the Kigali Amendment to the Protocol, marking the start date to limit HFC use.
0.00
5.00
10.00
15.00
20.00
25.00
30.00
35.00
40.00
2017-18 2022-23 2027-28 2037-38
Refr
iger
ant D
eman
d
Year
IND
IA C
OO
LIN
G A
CT
ION
PL
AN
50
To reduce the refrigerant demand as well as global greenhouse gas emissions from mobile air conditioning, the following ways may be explored:
1. Improving the current HFC 134a-based MAC technologies and reduce the charge use capacity
2. Switching to other low GWP refrigerants
3. Explore the possibility of other non-vapour compression type technologies
Improved HFC-134a Systems: Many efficiency-improving technologies are now being used in current production of HFC-134a systems, for example, internal heat exchangers, oil separators in compressors, increased use of externally controlled compressors, etc. Internationally, with the introduction of the credit system in the USA and also upcoming legislation in Europe, more vehicle original equipment manufacturers (OEMs) are introducing technologies to reduce fuel consumption with HFC-134a refrigerants.
HFO-1234yf Systems: HFO-1234yf systems are able to achieve the same system performance and fuel efficiency as HFC-134a system if they use either an internal heat exchanger (IHX) or a condenser in which the sub-cooling area is enlarged by about 10% while keeping the same total exchange area.
Carbon Dioxide (R-744) Systems: R-744 refrigerant charge volume is typically reduced by 20%–30% as compared to HFC-134a systems. R-744, with suitable system design and control, has shown to be comparable to HFC-134a systems with respect to cooling performance and total GHG emissions due to MAC systems.
HFC-152a Systems: Due to its flammability, HFC-152a would require additional safety systems. Recent development activities have been focussed on using this refrigerant in a secondary loop, preferably in a double secondary loop system (RTOC 2010) for safe use. Refrigerant charge amounts could be reduced by 25%–30% with a secondary loop system and, typically up to 50% in double secondary loop system. Industry experts have recommended using HFC-152a, but only in a secondary loop type system. A secondary loop system uses glycol and water as the coolant in the passenger compartment. The coolant is cooled under hood by the refrigerant. A double secondary loop system uses glycol and water as the direct coolant passenger compartment and another glycol and water loop being used with the condenser. The use of two loops prevents refrigerant leaking into passenger compartment or leaking during breach of condenser during an accident.
Currently, more than one refrigerant is being used for the car and light truck air conditioning system. However, HFC-134a is the most commonly used refrigerant, while HFC-1234yf is piloted in some models and anticipated to upscale its usage in more models in the years to come. R-744 car air conditioning systems have also been developed and used commercially in some models especially in Germany. It has not yet accepted for high end car models due to its initial costs and is expected to roll out in for industrial applications.
4.4.2. MAC System Technologies and Future Trends
Significant R&D efforts focus on improving the energy efficiency of current systems by deploying efficient compressors and internal heat exchangers as well as exploring the possibility to use. Current MAC are becoming obsolete, resulting in the development of advanced and innovative systems focussing on energy efficiency, cost competitiveness, and better durability. The global automakers focus and prefer to use refrigeration systems with minimal environment effects and high safety.
The adoption of improved components (compressor and heat exchangers) and the introduction of internal heat exchangers have improved the efficiency of the system.
DR
AF
T F
OR
CO
NS
ULT
AT
ION
ON
LY
NO
T T
O B
E C
ITE
D
51
Certain opportunities, such as Ejector, high side pressure controller, two-stage compressor, and low leakage along with improved hose materials can also reduce fuel consumption thereby refrigerant emissions and minimize the frequency of required maintenance or service.55
Apart from technological improvement in MAC system, some of the passive technical solutions can be employed to reduce the cooling load resulting in optimum refrigerant usage and fuel consumption.
It is expected that the passenger cars and light duty vehicle domain is rapidly moving towards downsized turbocharged engines often coupled with different levels of hybridization to make the overall powertrain more efficient and reduce the CO2 emissions. Increased levels of transmission gears, moving vehicles from 4/5/6 levels to 7/8/9 levels reduce the average compressor speeds, thus, implying AC capacity concerns at low speeds in some cases or to the increase of the compressor displacement or finally to the adoption of electrically driven systems (RTOC, 2014).
Also, various regulatory measures around the globe are driving to more efficient on-board systems, including MACs and to the replacement of high GWP fluid with lower GWP substances.
In this framework, the thermal systems and especially the MAC systems have a relevant role and will likely undergo a deep change where the system integration will represent a relevant evolution guideline.
Stop & Start and Hybrid Vehicles: The diffusion of vehicles able to carry out part of their mission with the combustion engine off (e.g. stop & start, extended stop & start, and hybrids) asks for new solutions for the air conditioning system to guarantee the summer and winter thermal comfort in all the operational conditions.
The majority of these vehicles will have 12 V to 48 V electric energy sources and only part of them will have higher voltage network (e.g. up to 350 V), while all will have an additional on-board electric energy storage unit with a capacity ranging from 0.2 kWh (low voltage) up to 5 kWh (high voltage).
Plug-in Hybrids and Battery-driven Electric Vehicles: For Plug-in Hybrids (PHEV) and Battery-driven electric vehicles (BEVs), vehicle air conditioning systems for cooling as well as heat pump systems for heating need to be highly energy efficient to minimize the impact on the vehicle driving range.
4.5 Policy Mapping The government has pushed the transport sector towards green growth by promoting policies which improve the green coverage alongside highways to mitigate the air pollution concern and improve the (fuel) efficiency of the vehicles to effectively meet the fuel demand. As far as refrigerant use is concerned, road transport has already been shifted to HFCs for cooling requirement; the sector is not affected by the on-going HCFC phase out plan. It may be noted that historically, refrigerants have not been considered while establishing the sector-wise policy frame work. Policies which may have an impact on refrigerant demand are being mentioned herein.
Improved efficiency of vehicles across modes:
To reduce the average fuel consumption of new cars introduced in the Indian market, medium and long-term fuel consumption standards for new cars have been announced. The Government of India through the Bureau of Energy Efficiency has notified the CAFÉ norms for passenger cars
IND
IA C
OO
LIN
G A
CT
ION
PL
AN
52
in 2015. Phase 1 of the fuel efficiency norms have been implemented during 2017–21 and Phase 2 will be effective from 2022 onwards. The Fuel Consumption Standards provide a mandate to manufacturers to continuously reduce the average fuel consumption of cars sold by them in the next 10 years.
Push towards public transport:
The Atal Mission for Rejuvenation and Urban Transformation (AMRUT) programme of Government of India aims to develop urban infrastructure. The impact of AMRUT on the transportation sector will primarily focus on improved infrastructure facilities. It will suggest urban reforms to decentralize funds and functions, thus ensuring that positive measures to improve transport infrastructure is in the hands of urban local bodies. This will result in efficient transportation systems in the 500 cities and towns where this mission is implemented along with a rise in the level of transport activity in those cities.
As we move towards public transport, overall mobile cooling demand might witness a decline so the refrigerant as well.
Faster adoption of hybrid and electric vehicles in India:
The Government of India has launched a scheme titled FAME India ‘(Faster Adoption and Manufacture of Electric Vehicles in India) under the National Electric Mobility Mission Plan (NEMMP) 2020. This scheme focusses on providing incentives for the manufacturing and promotion of both hybrid and electric vehicles in India. Success of this scheme will lead to higher penetration of electric vehicles in the public transport system. Growing share of airconditioned vehicles in road transport will increase the refrigerant demand in the country.
4.6 Recommendations In the rapidly changing world, government policies need to be flexible enough to encompass the contemporary requirements vis-a-vis the energy sector. The government is well intended to develop a future road map for green growth along with minimal carbon footprint of the transport sector in India. However, demand projections in this chapter regarding cooling in transport sector, impose a formidable challenge to achieve the intended objective.
Short-term Recommendations1. Improved efficiency of vehicles across modes:
� Through efforts such as the fuel efficiency norms, there should be a continuous increase in the energy efficiency of vehicles.
� While testing of the vehicle for compliance with CAFÉ, currently air conditioning has been switched off. Testing may be considered with AC ON, which would give a more realistic fuel consumption scenario. There is a 30%–40% improvement potential available in the passenger car MAC system (IPCC 2005).
� Use of new technologies in the field of mobile air conditioning should be encouraged to make the system more efficient.
2. Star labelling of Passenger Cars:
3. Labelling systems for cars could help consumers to make informed choices and promote efficient vehicles.
4. In addition, other incentive and disincentive mechanisms can help push efforts in improving transport sector emissions intensity.
DR
AF
T F
OR
CO
NS
ULT
AT
ION
ON
LY
NO
T T
O B
E C
ITE
D
53
5. COP and fuel consumption of the mobile air conditioning system can also be mentioned on the label which will further make consumers aware about importance of air conditioning in overall fuel consumption.
6. Incentivise the manufacturers while compliance with CAFÉ standards: Extra credits can be given to the manufacturers who comply with CAFÉ norms and if they use high energy efficient MAC system in their fleet.
Medium-term Recommendations 7. Push towards public transport:
8. Large volume of the transport infrastructure is going to be built in the near future to provide access both in urban and rural regions. It is therefore important to ensure that the modes identified for providing access are relatively efficient and less cooling intensive.
9. Reduction of cooling and refrigerant demand by shifting the passenger traffic towards public transport.
10. Development of low refrigerant charge MAC systems including secondary loop systems.
11. Incentives or rebates for energy efficient technology:
12. Investment is required in the system modification to improve the efficiency and adopt a new refrigerant. For example, changes in AC piping/hoses and internal heat exchanger to use HFO 1234yf in MAC leads to extra cost in manufacturing. At present there is no credit policy which prevents OEMs to implement new technology due to no benefit and extra cost. There is need of robust financing policy or fiscal incentive programme for energy efficiency investments.
13. Also, better coordination is required for resolving patent issues. It is significant to mention here that resolution of patenting issues from gas manufacturers can lead the way for readily available HFO gas use as refrigerant in MAC systems.
14. Promote compressor manufacturing in India and incentivise those manufacturers who produce compressors in India.
Long-term Recommendations15. Improving the MAC systems efficiency of hybrid and electric vehicles in India: Cooling
requirement in EVs is high compared to conventional vehicles, as it requires secondary cooling for the battery. This may increase the refrigerant demand in the near future. Therefore, it is necessary to look for higher efficient MAC systems in hybrid and electric vehicles.
16. Push towards building integrated and high-quality public transport systems in Tier 2 and Tier 3 cities to reduce the personalized vehicle demand.

IND
IA C
OO
LIN
G A
CT
ION
PL
AN
54
DR
AF
T F
OR
CO
NS
ULT
AT
ION
ON
LY
NO
T T
O B
E C
ITE
D
55
5.1 IntroductionAn important implication of the rapid increase of ownership of residential and commercial air-conditioners, as well as cars, is that the market for servicing these technologies has also increased rapidly. RAC servicing sector is important as it is directly related to (i) consumption of refrigerants and (ii) optimum and efficient performance of in-use air conditioning equipment. Interventions in RAC servicing sector provide for twin benefits of environmental protection and livelihood enhancements. The HPMP Stage II roadmap estimates that the servicing sector consumes more than 40% of the total refrigerant consumption in the country Thus, Training of RAC service technicians becomes important. More so, the new alternative refrigerants while phasing out HCFCs are either mildly flammable or flammable. The technicians need to be trained on their safe handling. Besides, more service technicians are in informal sector then in the formal one.
For the RAC servicing sector, formal sector is defined as the enterprises that are incorporated under the Companies Act, or registered under Shops and Commercial Establishments Act, Micro, Small & Medium Enterprises registration, etc., while informal sector are own-account enterprises which are unincorporated or lack legal organization, as well as freelance/ self-employed technicians. It should be noted that formal sector enterprises may employ informal/casual workers and unregistered enterprises may formally employ technicians. One important characteristic of ‘formal employment’ is access to social security benefits, provident fund, workman’s compensation, etc.
It is important to view the servicing sector within a framework that can capture the key aspects of this sector and how these aspects influence each other. Figure 5.1 presents a framework of elements that are critical for better understanding of this sector, and devise policy interventions for preparing for the future.
Refrigeration and Air-Conditioning Servicing Sector
5
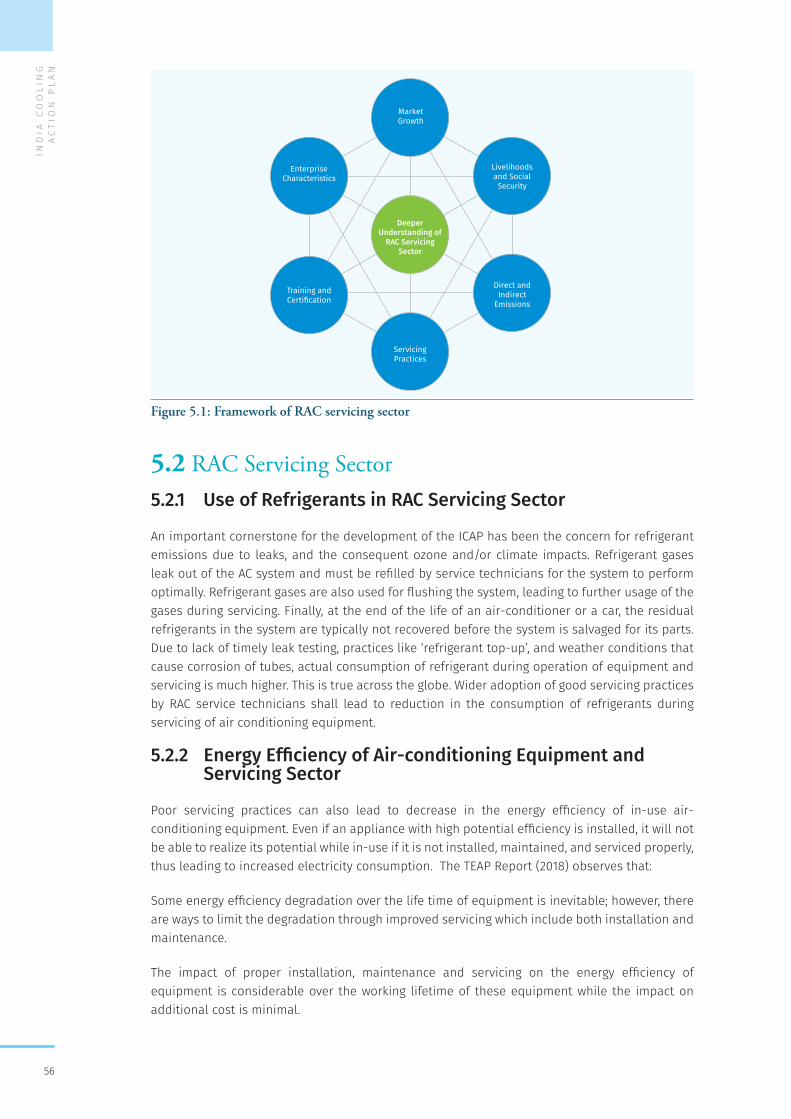
IND
IA C
OO
LIN
G A
CT
ION
PL
AN
56
Figure 5.1: Framework of RAC servicing sector
5.2 RAC Servicing Sector5.2.1 Use of Refrigerants in RAC Servicing Sector
An important cornerstone for the development of the ICAP has been the concern for refrigerant emissions due to leaks, and the consequent ozone and/or climate impacts. Refrigerant gases leak out of the AC system and must be refilled by service technicians for the system to perform optimally. Refrigerant gases are also used for flushing the system, leading to further usage of the gases during servicing. Finally, at the end of the life of an air-conditioner or a car, the residual refrigerants in the system are typically not recovered before the system is salvaged for its parts. Due to lack of timely leak testing, practices like ‘refrigerant top-up’, and weather conditions that cause corrosion of tubes, actual consumption of refrigerant during operation of equipment and servicing is much higher. This is true across the globe. Wider adoption of good servicing practices by RAC service technicians shall lead to reduction in the consumption of refrigerants during servicing of air conditioning equipment.
5.2.2 Energy Efficiency of Air-conditioning Equipment and Servicing Sector
Poor servicing practices can also lead to decrease in the energy efficiency of in-use air-conditioning equipment. Even if an appliance with high potential efficiency is installed, it will not be able to realize its potential while in-use if it is not installed, maintained, and serviced properly, thus leading to increased electricity consumption. The TEAP Report (2018) observes that:
Some energy efficiency degradation over the life time of equipment is inevitable; however, there are ways to limit the degradation through improved servicing which include both installation and maintenance.
The impact of proper installation, maintenance and servicing on the energy efficiency of equipment is considerable over the working lifetime of these equipment while the impact on additional cost is minimal.
Deeper Understanding of
RAC Servicing Sector
Livelihoods and Social Security
Direct and Indirect
Emissions
Servicing Practices
Training and Certification
Enterprise Characteristics
Market Growth
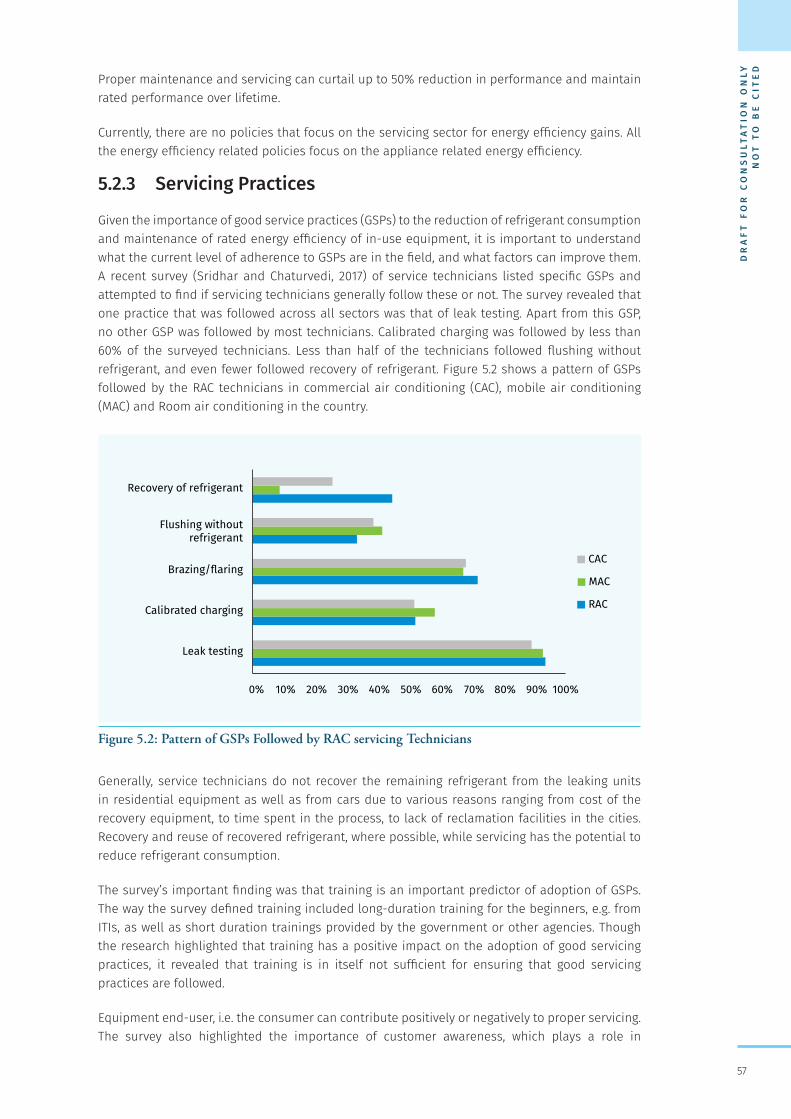
DR
AF
T F
OR
CO
NS
ULT
AT
ION
ON
LY
NO
T T
O B
E C
ITE
D
57
Proper maintenance and servicing can curtail up to 50% reduction in performance and maintain rated performance over lifetime.
Currently, there are no policies that focus on the servicing sector for energy efficiency gains. All the energy efficiency related policies focus on the appliance related energy efficiency.
5.2.3 Servicing Practices
Given the importance of good service practices (GSPs) to the reduction of refrigerant consumption and maintenance of rated energy efficiency of in-use equipment, it is important to understand what the current level of adherence to GSPs are in the field, and what factors can improve them. A recent survey (Sridhar and Chaturvedi, 2017) of service technicians listed specific GSPs and attempted to find if servicing technicians generally follow these or not. The survey revealed that one practice that was followed across all sectors was that of leak testing. Apart from this GSP, no other GSP was followed by most technicians. Calibrated charging was followed by less than 60% of the surveyed technicians. Less than half of the technicians followed flushing without refrigerant, and even fewer followed recovery of refrigerant. Figure 5.2 shows a pattern of GSPs followed by the RAC technicians in commercial air conditioning (CAC), mobile air conditioning (MAC) and Room air conditioning in the country.
Figure 5.2: Pattern of GSPs Followed by RAC servicing Technicians
Generally, service technicians do not recover the remaining refrigerant from the leaking units in residential equipment as well as from cars due to various reasons ranging from cost of the recovery equipment, to time spent in the process, to lack of reclamation facilities in the cities. Recovery and reuse of recovered refrigerant, where possible, while servicing has the potential to reduce refrigerant consumption.
The survey’s important finding was that training is an important predictor of adoption of GSPs. The way the survey defined training included long-duration training for the beginners, e.g. from ITIs, as well as short duration trainings provided by the government or other agencies. Though the research highlighted that training has a positive impact on the adoption of good servicing practices, it revealed that training is in itself not sufficient for ensuring that good servicing practices are followed.
Equipment end-user, i.e. the consumer can contribute positively or negatively to proper servicing. The survey also highlighted the importance of customer awareness, which plays a role in
0% 10% 20% 30% 40% 50% 60% 70% 80% 90% 100%
Leak testing
Calibrated charging
Brazing/flaring
Flushing withoutrefrigerant
Recovery of refrigerant
CAC
MAC
RAC
IND
IA C
OO
LIN
G A
CT
ION
PL
AN
58
increasing adherence to GSPs by technicians. Technicians also reported that often customers due to time or price sensitivity, are unwilling to get their equipment properly serviced. If high efficiency equipment is not serviced and maintained properly, it will be operating below the potential equipment efficiency. The role of servicing technicians is very important part of this process, as is the role of customers who need to ensure regular servicing of their air-conditioning equipment.
Sridhar & Chaturvedi (2017) also highlights the issue of ownership of tools as being important for proper installation, servicing and maintenance of air-conditioning equipment. Though, tools are considered important, the ownership rate of the complete set of tools required for following GSPs is low, arguably due to their high cost as well as challenges in handling their transportation to servicing site, given that most technicians travel on two-wheelers. Cost of servicing tools matters, especially for technicians who have their own enterprise or who freelance. As per industry estimates, the full set of tools for technicians can cost around INR 200,000. It is critical to consider this aspect while planning for adequate servicing and maintenance of equipment.
5.2.4 Market growth: An Immediate Need to Plug the Data Gap
For planning and policy formulation for the servicing sector, it is imperative to understand the current number of servicing sector technicians, as well as their potential future growth. It is estimated that around 200,000 technicians in the stationary air conditioning service sector as per existing AC stock are present in the country (HPMP Stage II Document, 2017). Many service technicians are also involved in Car Air Conditioning (MAC) sector.
In terms formal vs informal break-up of technicians in the MAC sector, Federation of Automobile Dealers Association (FADA), reports that approximately 50% of servicing enterprises to be informal. Number of technicians employed by car dealerships falls between 40 – 50 on average according to a FADA estimate. Among the formal enterprises in MAC, about 75% are authorised service centres and remaining is constituted by multi-brand service centres. There is huge potential for employment generation in this sector.
An in-depth study is required to assess number of air conditioning and refrigeration (RAC) service technicians in residential, commercial and mobile air conditioning. Similar assessments would also be required for cold chain, and process cooling sectors which have not been separately dealt here. Irrespective of the number of service technicians, what is known with certainty is that the size of this market will grow at a fast pace in the country given the growth in ownership of air-conditioners and cars in the country.
5.2.5 Training and Certification
5.2.5.1 TRAINING
Training is critical for service technicians to properly deliver on their job. Training has to encompass various aspects of the air-conditioning system, ranging from technical operation and servicing of the system, to safety issues and occupational hazards. Given the context, training cannot be only a theoretical training, the practical training is a critical aspect of the training process. Experiences from previous servicing sector projects funded by Multilateral Fund (MLF) for the implementation of the Montreal Protocol in India have shown that technicians who have undergone training significantly improve servicing practices.
Training programmes to familiarise technicians with the ODS phase-out scheme under the Montreal protocol was first set up in India in 1998 through collaborative efforts by the Indo-Swiss-German leading towards Ecological Refrigeration in the country two projects, Ecological
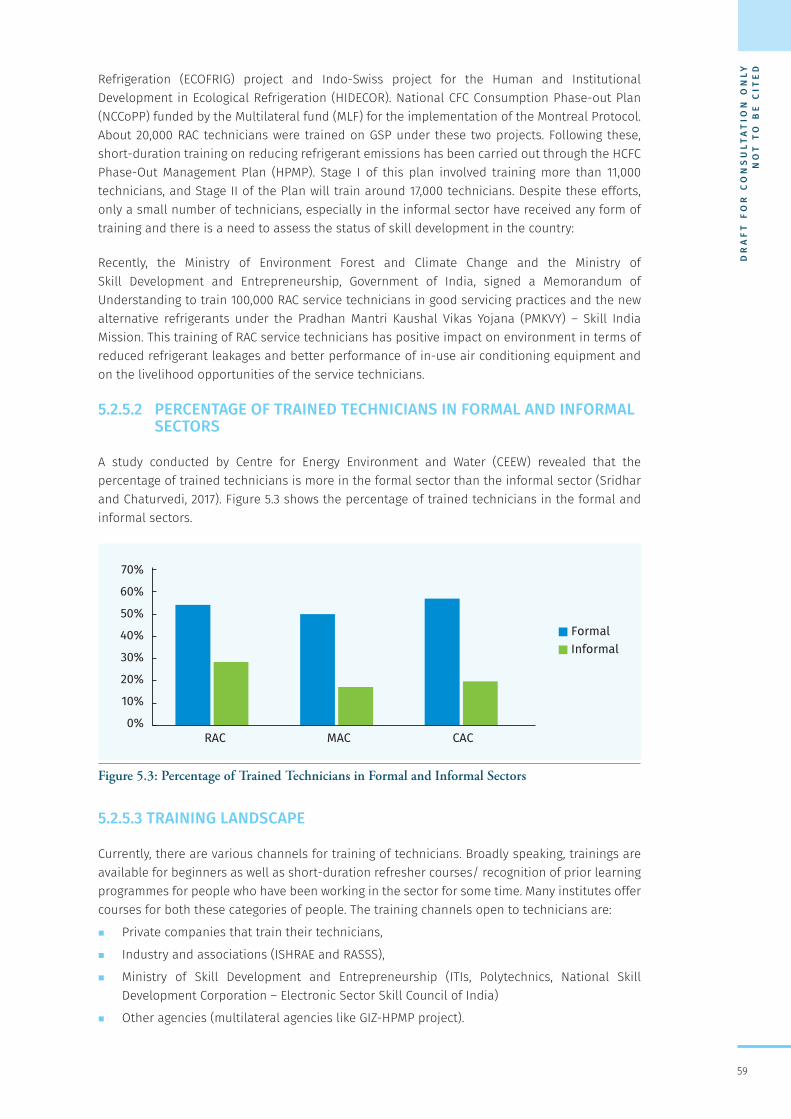
DR
AF
T F
OR
CO
NS
ULT
AT
ION
ON
LY
NO
T T
O B
E C
ITE
D
59
Refrigeration (ECOFRIG) project and Indo-Swiss project for the Human and Institutional Development in Ecological Refrigeration (HIDECOR). National CFC Consumption Phase-out Plan (NCCoPP) funded by the Multilateral fund (MLF) for the implementation of the Montreal Protocol. About 20,000 RAC technicians were trained on GSP under these two projects. Following these, short-duration training on reducing refrigerant emissions has been carried out through the HCFC Phase-Out Management Plan (HPMP). Stage I of this plan involved training more than 11,000 technicians, and Stage II of the Plan will train around 17,000 technicians. Despite these efforts, only a small number of technicians, especially in the informal sector have received any form of training and there is a need to assess the status of skill development in the country:
Recently, the Ministry of Environment Forest and Climate Change and the Ministry of Skill Development and Entrepreneurship, Government of India, signed a Memorandum of Understanding to train 100,000 RAC service technicians in good servicing practices and the new alternative refrigerants under the Pradhan Mantri Kaushal Vikas Yojana (PMKVY) – Skill India Mission. This training of RAC service technicians has positive impact on environment in terms of reduced refrigerant leakages and better performance of in-use air conditioning equipment and on the livelihood opportunities of the service technicians.
5.2.5.2 PERCENTAGE OF TRAINED TECHNICIANS IN FORMAL AND INFORMAL SECTORS
A study conducted by Centre for Energy Environment and Water (CEEW) revealed that the percentage of trained technicians is more in the formal sector than the informal sector (Sridhar and Chaturvedi, 2017). Figure 5.3 shows the percentage of trained technicians in the formal and informal sectors.
Figure 5.3: Percentage of Trained Technicians in Formal and Informal Sectors
5.2.5.3 TRAINING LANDSCAPE
Currently, there are various channels for training of technicians. Broadly speaking, trainings are available for beginners as well as short-duration refresher courses/ recognition of prior learning programmes for people who have been working in the sector for some time. Many institutes offer courses for both these categories of people. The training channels open to technicians are:
� Private companies that train their technicians,
� Industry and associations (ISHRAE and RASSS),
� Ministry of Skill Development and Entrepreneurship (ITIs, Polytechnics, National Skill Development Corporation – Electronic Sector Skill Council of India)
� Other agencies (multilateral agencies like GIZ-HPMP project).
0%
10%
20%
30%
40%
50%
60%
70%
RAC MAC CAC
FormalInformal
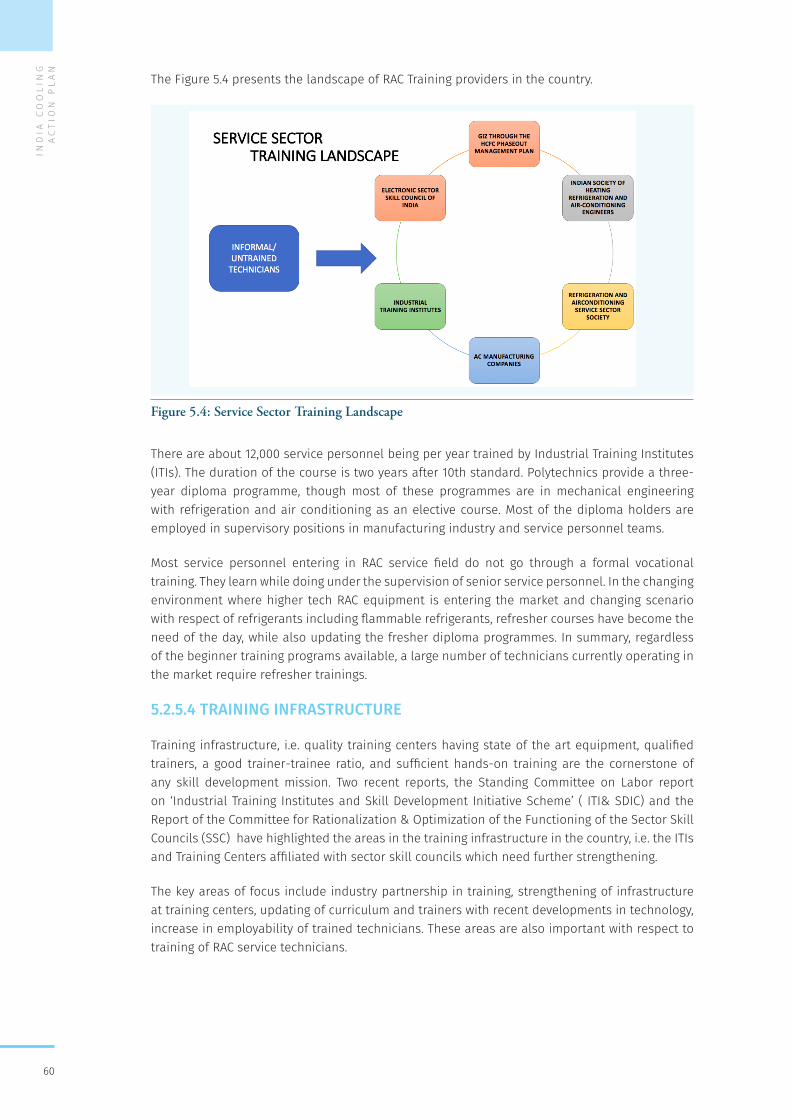
IND
IA C
OO
LIN
G A
CT
ION
PL
AN
60
The Figure 5.4 presents the landscape of RAC Training providers in the country.
Figure 5.4: Service Sector Training Landscape
There are about 12,000 service personnel being per year trained by Industrial Training Institutes (ITIs). The duration of the course is two years after 10th standard. Polytechnics provide a three-year diploma programme, though most of these programmes are in mechanical engineering with refrigeration and air conditioning as an elective course. Most of the diploma holders are employed in supervisory positions in manufacturing industry and service personnel teams.
Most service personnel entering in RAC service field do not go through a formal vocational training. They learn while doing under the supervision of senior service personnel. In the changing environment where higher tech RAC equipment is entering the market and changing scenario with respect of refrigerants including flammable refrigerants, refresher courses have become the need of the day, while also updating the fresher diploma programmes. In summary, regardless of the beginner training programs available, a large number of technicians currently operating in the market require refresher trainings.
5.2.5.4 TRAINING INFRASTRUCTURE
Training infrastructure, i.e. quality training centers having state of the art equipment, qualified trainers, a good trainer-trainee ratio, and sufficient hands-on training are the cornerstone of any skill development mission. Two recent reports, the Standing Committee on Labor report on ‘Industrial Training Institutes and Skill Development Initiative Scheme’ ( ITI& SDIC) and the Report of the Committee for Rationalization & Optimization of the Functioning of the Sector Skill Councils (SSC) have highlighted the areas in the training infrastructure in the country, i.e. the ITIs and Training Centers affiliated with sector skill councils which need further strengthening.
The key areas of focus include industry partnership in training, strengthening of infrastructure at training centers, updating of curriculum and trainers with recent developments in technology, increase in employability of trained technicians. These areas are also important with respect to training of RAC service technicians.
DR
AF
T F
OR
CO
NS
ULT
AT
ION
ON
LY
NO
T T
O B
E C
ITE
D
61
5.2.5.5 CERTIFICATION
The UNEP OzonAction defines certification as “means by which a person (or enterprise), as a result of training, education, external review and assessment, receives official approval of being able to competently complete a job or task.” Certification can be after a formal assessment as explained or that of participation received by attending a course or training. The latter cannot replace a formal certification preceded by skill and knowledge assessment. While a lot of training can terminate with certification, OzonAction recommends separation of the two steps for impartial assessment.
There are many certification schemes across different countries, many of which or voluntary or mandatorily required. In India, employers consider ITI diplomas as formal training. Trainings for RAC service technicians are implemented by industry. ISHRAE also runs training programmes RAC service technicians where assessment and certification is part of the programme.
The Ministry of Skill Development and Entrepreneurship (MSDE), Government of India is mandated with development skill ecosystem in the country and oversees and administers skilling and vocational training. There is a specific focus of the Government on skilling through the Skill India Mission implemented by MSDE. The National Skill Qualification Framework under MSDE provides for certification of skills through National Skill Development Corporation, which implements the certification programme through thematic Sector Skill Councils. The RAC servicing sector is catered by the Electronic Sector Skill Council. This could be further strengthened in terms of infrastructure and technical content. This system could be developed as a single certification system that has to be obtained by all technicians. The same can be updated as per the latest technical standards and criteria.
While many technicians recognize the value of certification, few have any such certification. Furthermore, many technicians believe that such certification does not prepare them for their profession as the curriculum is largely theoretical knowledge, and on-job training becomes necessary. , The most important benefits of certification is standardization of training, a minimum level of skill, and assurance to customers and employers regarding the technicians’ skills. In many countries, such certification for technicians is not only considered important, but has been made mandatory. Given the large impact of refrigerants on the environment and the increasing use of flammable refrigerants, such certification may be necessary in the long-run.
The certification system could be strengthened by the following:
� Uniform and standardised and in-depth training curriculum that is in line with latest available technical improvements;
� Sufficiently large network of training centres across the country;
� A system of checks and balances that ensure constant interaction with certified technicians for unbiased feedback, which in turn can be used to improve the assessment methods;
� Awareness among customers and employers will be required to incentivise the benefits of training.
Therefore, certification should be introduced in a gradual manner so that technicians are prepared for it and are not forced out of the profession due to lack of ability to access training.
5.3 Enterprise CharacteristicsServicing sector enterprises are an important part of the value chain. Given that the penetration of air-conditioners and cars is still very low in the country, the nature of servicing sector enterprise sector is still evolving. There are, however, some interesting characteristics of this sector in
IND
IA C
OO
LIN
G A
CT
ION
PL
AN
62
the country. Broadly speaking, there are three channels through which Room Air-Conditioners servicing is offered in the country.
5.3.1 Manufacturing Companies
The first consists of manufacturing companies. The manufacturing companies have a formal servicing setup and a pool of trained service personnel. These companies largely operate through franchised service network i.e. third-party sales and service dealers or authorized service providers, though they may have a few engineers/technicians on payroll, at supervisory/managerial levels. The company routes the service calls/requests for both installation and repairs to these franchisees. Actual service delivery is completed by these franchisees using their service technicians.
Most of the products under the category of air-conditioners are warranted for a period of one year. During the warranty period apart from assuring satisfactory performance of the product, a few proactive services are provided by almost all OEMs at site. It is also a prevalent practice that the installations are often done by a technician employed by the sales distributor/dealer of the OEM. These technicians have been trained only for installation and a certain few routine checks of the product to commission the unit after installation at the customer premises. These technicians do not have thorough diagnostic skills on the product. This practice has become popular to cater to the demand for speedy installation after the air conditioner has been purchased by the customer. After the warranty period has expired, customers generally resort to non-authorized service enterprise or freelance technicians due to the relative expense of authorized servicing.
5.3.2 Third Party Servicing Companies
The second channel consists of third-party servicing companies. These could be either formally registered or unregistered, but they do not have any franchisee relationship with the OEM. In the MAC sector, many such enterprises offer specialized services and may even be preferred by customers.
5.3.3 Freelance Technicians
The third channel is that of the freelance servicing technicians available in the country. Servicing air-conditioners is a growing opportunity, especially in the urban India. Technicians who already have a knowhow of servicing air-conditioning systems hire people interested in the trade and train them on the job. Given the informal nature of this set-up, it is difficult to estimate the number of technicians operating in this manner and their level of training. Moreover, many people employed in the sector for servicing electronics like washing machine, fridge, etc., enter into the air-conditioning servicing sector during peak season. Even technicians employed at enterprises often freelance during their free time.
5.3.4 Challenge of asymmetric information
Given the specialized nature of RAC servicing and the lack of clear information on what exactly constitutes good servicing from the perspective of the consumer, the servicing sector faces the ‘lemon problem’. The lemon problem arises due to the asymmetric information available with the buyer and seller of a service/good about the value of the service/good. For the given servicing sector context, it is impossible for the customer to differentiate between a good and knowledgeable service technician, and the one who is below par. All enterprises/technicians claim to be good. However, only after the customer has selected the technician can he or she find out the quality of the technician. In fact, for basic servicing, most times the customer will not be able to decipher the difference.
DR
AF
T F
OR
CO
NS
ULT
AT
ION
ON
LY
NO
T T
O B
E C
ITE
D
63
This situation leads to what is known as ‘adverse selection’ in the market. The lemons, or sub-par/partially-skilled technicians, reduce the average price of the market as they offer services at the lower price, and the buyer is ready to pay the price that reflects only the average quality of the market. The sellers of good quality service will not want to sell their service at the average price but are compelled to do so in the face of competition from the lemons. This forces them to either reduce the quality of their service, or to find ways to convince the customer that the quality of their service is better than that of lemons, which is a time intensive process, that eventually might or might not be successful. Policy makers and planner need to devise ways to eliminate the information asymmetry in the market, for improving the quality of the service, as well as eliminate lemons from the market.
5.4 Livelihoods and Social SecurityStable and secure livelihoods, and long-term social security, are important from the perspective of social welfare. In large unorganised sectors in developing economies, livelihoods are vulnerable to unexpected shocks. This is also true for service technicians in the air-conditioning industry. For example, a prolonged illness could lead to a significant impact on the income of a technician, as well as eat away a large part of financial savings, pushing them harder into the unorganised sector.
As the economy of the country is growing, it is imperative that the larger service sector, which includes the air-conditioning and refrigeration servicing sector, needs to strengthen its quality of delivery. This in turn implies that the mean performance of technicians ought to grow to deliver higher quality service. An understanding of current status is useful for better planning for the future.
Some aspects of the current situation are clear based on the detailed focused group discussion with the technicians, as well as discussion with sector experts.
First, there is some disparity in the annual earning of service technicians in the Room Air-Conditioners, Commercial Air conditioning (CAC) and Mobile Air Conditioning (MAC) sectors. There is also a distinct seasonal pattern to this work, with busy season lasting for six to nine months, depending on the location. During the off-season many technicians service other electronic equipment or do installation work.
Secondly, there is marked difference between average earnings for technicians working for authorised/ specialized service centres, and the average earnings of technicians working with other enterprises or freelancing, with the former earning higher than their counterparts.
Thirdly, access to social security schemes is not prevalent in the Room Air-Conditioners service sector in India. The primary reason for this is that most technicians are either self-employed or informally/casually employed by authorized service centres/registered enterprises. Only a small percentage of technicians who are employed at managerial/supervisory level by OEMs have access to the benefits associated with formal employment. A secondary reason is that many technicians are unaware of the distinct categories of insurance coverage available in the market such as health insurance, accidental insurance and life insurance or their purpose. As per a CEEW study, many technicians find health insurance to be an additional expenditure; something they cannot afford with their current earning. A lot of them were unaware of the occupational hazard associated with their line of work. In several cases, health insurance was perceived as something they would invest in at a later stage.
As RAC servicing sector is largely informal in nature there is scope to provide social security benefits. There are some pilot projects to provide insurance coverage to RAC service technicians.
IND
IA C
OO
LIN
G A
CT
ION
PL
AN
64
The Ministry of Labour has proposed a comprehensive social security system that will be rolled out in three phases over the next ten years56. Workers in the unorganized sectors will be target beneficiaries of this scheme. Through this social security system, health insurance and retirement benefits will be provided in the first phase, followed by unemployment and other welfare benefits in the second and third phases.
Fourthly, along with livelihoods and social security, occupation hazard related issues are becoming more and more important, especially in the context of flammable refrigerants. Most training sessions do discuss occupational safety, but how much of this is practiced by service technicians is uncertain and there is a need for technicians to be able to access benefits like accidental insurance, workman’s compensation, etc. A recently signed memorandum of understanding (MoU) between the Ministry of Environment, Forest and Climate Change (MoEF&CC) and Ministry of Skill Development and Entrepreneurship (MSDE) provides for accident insurance through the National Skill Development Corporation (NSDC)’s scheme for all trainees under the scheme. There is a need to make such accidental insurance available widely, across the sector.
Social security benefits and occupational safety could also work as an important incentive for servicing technicians to invest in their education and training, in proper tools and equipment’s, which may indirectly benefit environmental objectives as well.
5.5 Recommendations The key objectives of the policy actions for the service sector fall under the purview of developmental and environmental goals. Five main stakeholders of the service sector make contributions at various capacities for achieving this transition: service technicians, industry, government, civil society, and customers. Depending on their role in the life-cycle of the equipment, each stakeholder has a different role to play. The government would facilitate the transition through policies, regulations, incentive schemes etc., while the industry would play an important role in increasing access to social security, training and certification for technicians. Service technicians and customers are responsible for field-level implementation of regular and appropriate servicing and maintenance practices. Feedback from service technicians and customers would be central to creating policy actions. Civil society plays an important role in advisory and research capacities. This section provides a framework of the sector keeping in mind future objectives and the above mentioned role of stakeholders.
Policy interventions can therefore have a cascading effect on this sectoral transition. The foremost issue that must be addressed is that of data gaps. Composition of the Room/Mobile/Commercial AC service sector needs to be captured through collection of country-wide data on the numbers of trained or semi-trained/untrained technicians that work in registered and unregistered enterprises. In the long-term, an accurate assessment of the number of technicians, their qualifications, annual earning, years of experience, etc. must be available. Long-term projection of the sectoral growth should also be done. In order to build training infrastructure, gaining access to accurate data is going to be imperative.
Bettering training infrastructure is perhaps the biggest contributor to improving the service sector. Through better training infrastructure, many technicians can be trained effectively and regularly. Training infrastructure would include but not be limited to quality training centres across the country, communication channels, acquiring more trainers and training sessions (short-term and long-term), certification schemes and networking opportunities. Building a suitable training infrastructure is perhaps the most challenging among the interventions to plan and implement.
DR
AF
T F
OR
CO
NS
ULT
AT
ION
ON
LY
NO
T T
O B
E C
ITE
D
65
Following are some suggested interventions to transition the servicing sector towards achieving the long-term environmental and developmental objectives:
Short-term recommendation
1. Institute Studies in the following areas:
� Ascertain population of servicing technicians operating in the country along with geographical spread, financial soundness, skills and competencies and gaps in terms of availability and market demand
� Existing training infrastructure including human capital and gaps vis-à-vis international benchmarking and promoting synergies amongst the existing institutions/centres including those operating under the Skill India Mission framework.
� Policy measures/incentives required for promoting RAC Servicing sector in the country
� Certification models for RAC servicing technicians and proposed model for India
2. Promote involvement and greater participation of air-conditioning equipment manufacturers in designing of training programmes, development of training curricula including training material and delivery of training.
3. Encourage industry participation in advisory/stakeholder capacities at the MSDE, ITIs, etc.
4. Creating an e-platform for service technicians: Given the widespread use of smartphones, an internet-based network could act as a single window information source for the RAC servicing technicians. The e-platform would also be a useful manner to collate all available trainings for technicians from different stakeholders. However, for the platform to be effective, synergies amongst different stakeholders including associations such as RASSS, ISHRAE and training centres need to be promoted. Necessary security systems also need to be built in the e-platform
5. Promoting mass awareness on the importance of regular servicing and good practices: One important reason for lack of proper servicing and maintenance is lack of customer awareness and demand for proper maintenance. Mass awareness campaign across a long period of time can change this customer behaviour, and lead to customers recognising the importance of regular and proper maintenance.
6. Public procurement of RAC services by trained and certified technicians: Promote utilisation of trained servicing technicians for all maintenance and servicing requirements of air-conditioning equipment in government ministries/departments and institutions.
Mid-term recommendations7. Develop a national database of RAC servicing technicians
8. Establishment/upgradation of training infrastructure: Based on the demand assessment of existing training centres and their available infrastructure, new training centres/centres of excellence and upgradation of training centres should be done that conform to latest technical requirements. Collaboration with industry may also be promoted in this initiative
9. Mandatory adherence to standardized training curriculum by all training providers: Within 5 years of developing standards, all the trainings, whether these happen in private companies, polytechnics, or undertaken by the government, all these should be based on a standard curriculum. This curriculum should be devised with the help of intensive interactions with stakeholders and companies, and regularly updated as per technology needs. There should be periodic review and updating of curricula to address technology developments.
10. Certification for all technicians at different levels: Towards standardizing training, all the trained technicians should be certified under a single framework. The certification may be open to all technicians and be available at different levels (Installation only, Installation and Servicing, etc.) based on which, technicians would receive the required certification.
IND
IA C
OO
LIN
G A
CT
ION
PL
AN
66
Since there is already an existing set-up for skill certification, the National Skill Qualification Framework under the MSDE, the same may be harmonised with technical inputs from MoEF&CC. Awareness about the certification among customers and industries may also need to be created to incentive the training.
11. Develop and promote Online Training Courses: Internet based eLearning training modules can give critical basic ideas to budding technicians and can give refresher training on new technologies for technicians.
12. Implementing social security schemes for certified technicians: Social security schemes should be implemented on the ground with adequate health cover and life insurance. These should be given only to technicians who are certified as a way to incentivize certification. This phase should include strong monitoring and feedback system for continuous learning and upgrade to make this architecture more effective.
Long-term recommendations13. Mandatory certification of technicians: In the long run, the objective is to have only certified
technicians operate in the market. This implies ensuring continuous efforts to motivate technicians to go through the training process (either through public and /or private recognized certification agencies) AC companies or private training focused companies) and get certified. At this stage, the country should start moving to completely formalise the service technician sector.
14. Promote mass customer awareness for hiring only certified technicians: Massive customer awareness programmes is going to be critical throughout the future till the objective of certified technicians and customer awareness is achieved. At this stage, customer awareness programmes should move from their focus on the importance of regular servicing, to hiring only certified technicians, paying higher for getting better service, and adopting good practices as a regular feature.
15. Ensure coverage for all certified technicians through a centralized social security scheme dedicated to servicing sector technicians: Develop a robust plan to connect the technicians with existing social security schemes run by the centre as well as state governments. This can be done through regular and reliable information flow as well as awareness campaigns to motivate trained and certified technicians to enrol in these schemes and avail their benefits.
DR
AF
T F
OR
CO
NS
ULT
AT
ION
ON
LY
NO
T T
O B
E C
ITE
D
67
6.1 Background India established fluorocarbon refrigerant manufacturing facility in 1960s and has not only been self-sufficient in refrigerant production but has also been one of the major exporters of refrigerants to several other countries. The fluorocarbon industry has been developing and adding products to meet the changing demand of refrigerant in the country.
The phase-out of production and consumption of Hydrochlorofluorocarbons (HCFCs) is presently underway as per the control measures set out under the Montreal Protocol. Hydrofluorocarbons (HFCs) being non-Ozone Depleting Substances (ODSs) have emerged as the alternative refrigerants to HCFCs. However, HFCs have high Global Warming Potential (GWP). The world community, recognizing the impact of growing global production and consumption of HFCs, decided to phase-down HFCs. The Parties to the Montreal Protocol adopted an amendment to the Montreal Protocol at its 28th Meeting in October 2016 at Kigali, Rwanda for phase-down of HFCs.
Since the Kigali Amendment to the Montreal Protocol, India has embarked on drawing a perspective plan for facilitating implementation of the Kigali Amendment wherein GHG gases like HFCs are required to be gradually phased down leading to a gradual shift in refrigerants from high-GWP HFCs to low-GWP/zero-GWP HFCs, Hydrofluoroolefins (HFOs) and other climate-suitable and safe substances. From the perspective of the refrigerant production sector, a long- term plan is envisaged for refrigerant use in different sectors, foaming agents and other cooling technologies under ICAP.
Refrigerant Demand and Indigenous Production
6
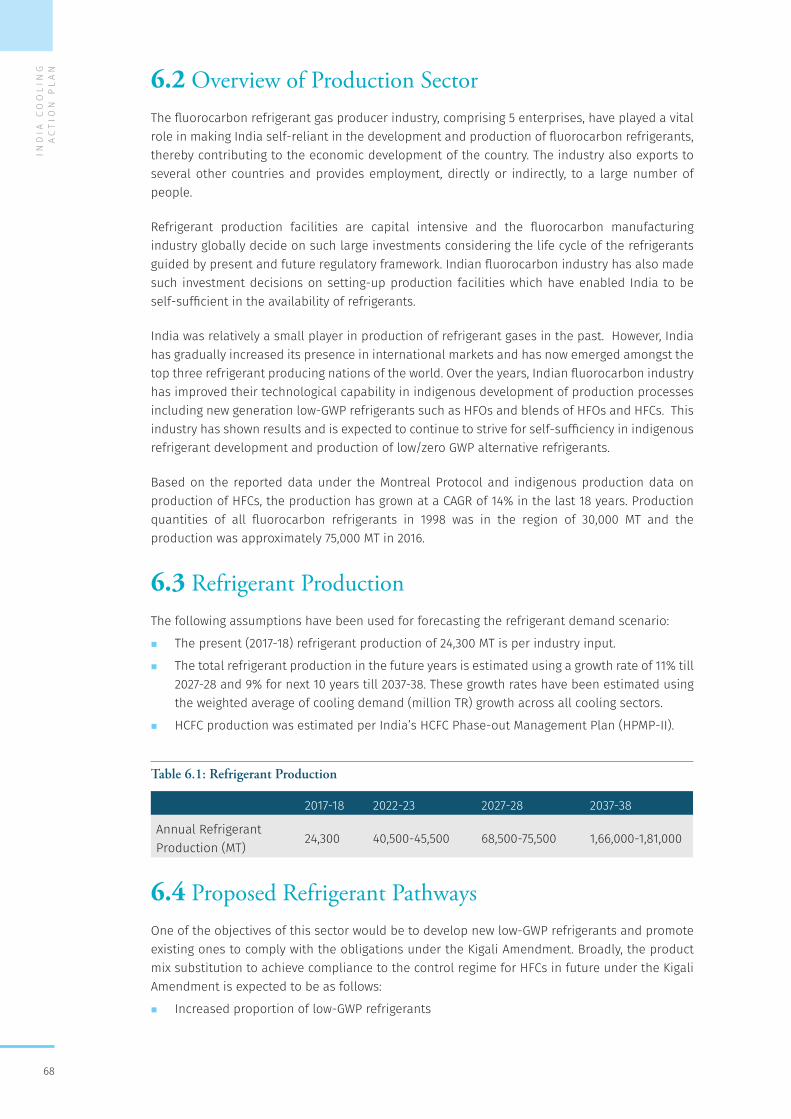
IND
IA C
OO
LIN
G A
CT
ION
PL
AN
68
6.2 Overview of Production Sector The fluorocarbon refrigerant gas producer industry, comprising 5 enterprises, have played a vital role in making India self-reliant in the development and production of fluorocarbon refrigerants, thereby contributing to the economic development of the country. The industry also exports to several other countries and provides employment, directly or indirectly, to a large number of people.
Refrigerant production facilities are capital intensive and the fluorocarbon manufacturing industry globally decide on such large investments considering the life cycle of the refrigerants guided by present and future regulatory framework. Indian fluorocarbon industry has also made such investment decisions on setting-up production facilities which have enabled India to be self-sufficient in the availability of refrigerants.
India was relatively a small player in production of refrigerant gases in the past. However, India has gradually increased its presence in international markets and has now emerged amongst the top three refrigerant producing nations of the world. Over the years, Indian fluorocarbon industry has improved their technological capability in indigenous development of production processes including new generation low-GWP refrigerants such as HFOs and blends of HFOs and HFCs. This industry has shown results and is expected to continue to strive for self-sufficiency in indigenous refrigerant development and production of low/zero GWP alternative refrigerants.
Based on the reported data under the Montreal Protocol and indigenous production data on production of HFCs, the production has grown at a CAGR of 14% in the last 18 years. Production quantities of all fluorocarbon refrigerants in 1998 was in the region of 30,000 MT and the production was approximately 75,000 MT in 2016.
6.3 Refrigerant Production The following assumptions have been used for forecasting the refrigerant demand scenario:
� The present (2017-18) refrigerant production of 24,300 MT is per industry input.
� The total refrigerant production in the future years is estimated using a growth rate of 11% till 2027-28 and 9% for next 10 years till 2037-38. These growth rates have been estimated using the weighted average of cooling demand (million TR) growth across all cooling sectors.
� HCFC production was estimated per India’s HCFC Phase-out Management Plan (HPMP-II).
Table 6.1: Refrigerant Production
2017-18 2022-23 2027-28 2037-38
Annual Refrigerant Production (MT)
24,300 40,500-45,500 68,500-75,500 1,66,000-1,81,000
6.4 Proposed Refrigerant Pathways One of the objectives of this sector would be to develop new low-GWP refrigerants and promote existing ones to comply with the obligations under the Kigali Amendment. Broadly, the product mix substitution to achieve compliance to the control regime for HFCs in future under the Kigali Amendment is expected to be as follows:
� Increased proportion of low-GWP refrigerants
DR
AF
T F
OR
CO
NS
ULT
AT
ION
ON
LY
NO
T T
O B
E C
ITE
D
69
� Use of natural refrigerants like R-290 (propane), R-717 (ammonia) and R-744 (CO2) where possible
� Reduce usage of R-404A, R-407C (from the year 2028) and R-410A as the alternatives get developed;
� Gradual reduction of use of HFC-134a in transport air-conditioning beyond 2032; this is likely to happen post IPR limitations and indigenous production of HFO-1234yf
Currently there are a limited number of technically proven commercially available refrigerant options.
6.5 Recommendations 1. Setting up a national R&D institutional framework for refrigerants and HVAC technology
innovation
2. Develop application centres for enhancing capabilities of refrigerant manufacturers for energy-efficient and environmentally-friendly refrigerants
3. Harmonization of national regulations with international regulations in accordance with the Montreal Protocol and its amendments
4. Development of harmonized system codes for HFCs
5. Amendment of Ozone Depleting Substances (Regulation and Control) Rules 2000 and its amendment to align with Kigali Amendment to the Montreal Protocol
6. Licensing system for import and export of HFCs
7. Development of safety standards for flammable refrigerants
8. Capacity building of law enforcement officers to combat illegal trade of refrigerants including blends of refrigerants
9. Monitoring and enforcement of regulations of Petroleum & Explosives Safety Organization (PESO) with respect to use of disposable cylinders

IND
IA C
OO
LIN
G A
CT
ION
PL
AN
70
DR
AF
T F
OR
CO
NS
ULT
AT
ION
ON
LY
NO
T T
O B
E C
ITE
D
71
7.1 BackgroundDriving Research & Development (R&D) for developing an innovation ecosystem in the country is pivotal for enabling sustainable cooling and thermal comfort for all. The development of a robust R&D innovation ecosystem will, inter alia, involve: (i) further development of scientific manpower in the area; (ii) requisite academic and R&D institutional capacities; (iii) support for R&D activities on various facets of cooling, including but not limited to refrigerants, cooling equipment, passive building design interventions, not-in-kind technologies and new emerging technologies; and (iv) industry preparedness to assimilate new technologies. Participation of industry at all stages is a must for effective delivery of cooling solutions for maximizing societal benefits. R&D is also very important for supporting the Make in India programme, which encourages domestic manufacturing of goods and products.
The most critical aspect for sustainable cooling is the availability of cost effective low GWP and non-ODS refrigerants. Most of the low GWP alternative refrigerants are heavily patented by multinational companies and are very costly. It is imperative to develop cost effective indigenously developed solutions to meet the cooling demand of the country.
R&D will spur innovation to enhance the energy efficiency of refrigeration and air conditioning equipment by improving the component efficiencies of compressors, fans, heat exchangers, and expansion valves, among other things. Secondly, R&D will unlock technologies and refrigerants that best suit Indian climatic conditions. Through sustained R&D efforts in both public and private sector the reliance on imported equipment and parts needs to be reduced. This will also require a greater domestic manufacturing base producing equipment and components specifically suited to the local needs. It is important to enable a conducive R&D environment to channelize resources and to help India pursue its Sustainable Developments Goals. A simplified representation of major stakeholders in the R&D innovation ecosystem is given in Figure 7.1.
Research & Development
7
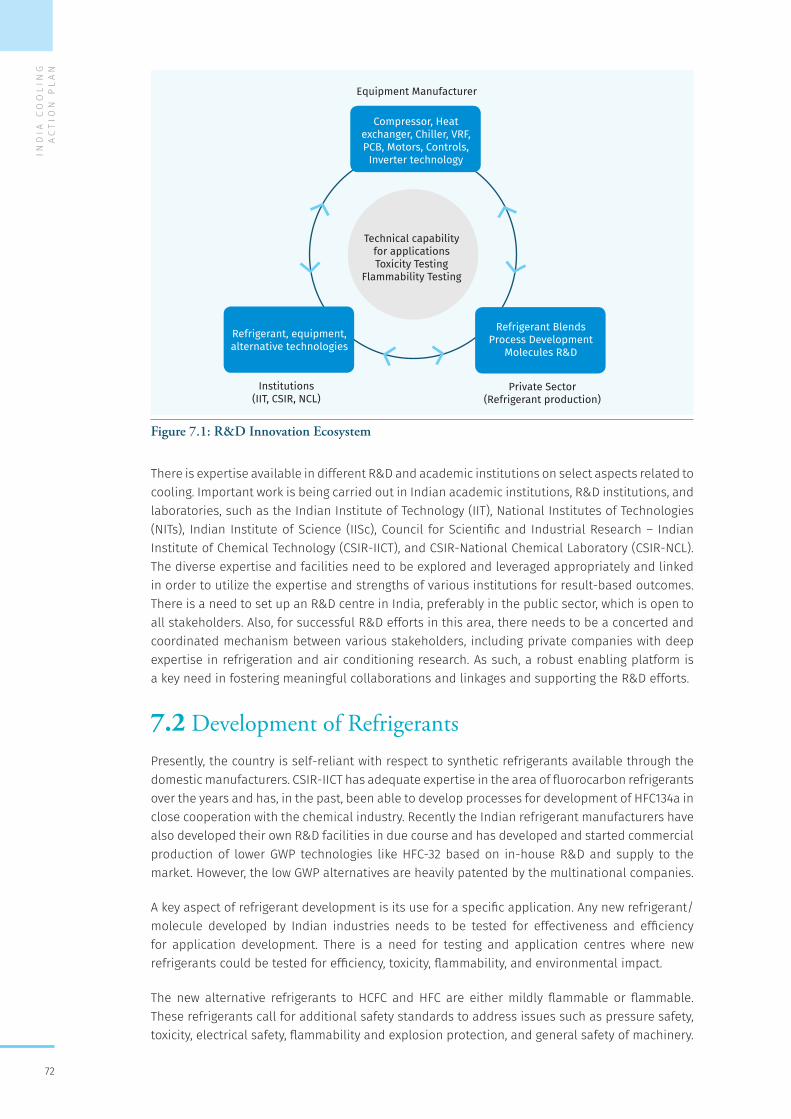
IND
IA C
OO
LIN
G A
CT
ION
PL
AN
72
Figure 7.1: R&D Innovation Ecosystem
There is expertise available in different R&D and academic institutions on select aspects related to cooling. Important work is being carried out in Indian academic institutions, R&D institutions, and laboratories, such as the Indian Institute of Technology (IIT), National Institutes of Technologies (NITs), Indian Institute of Science (IISc), Council for Scientific and Industrial Research – Indian Institute of Chemical Technology (CSIR-IICT), and CSIR-National Chemical Laboratory (CSIR-NCL). The diverse expertise and facilities need to be explored and leveraged appropriately and linked in order to utilize the expertise and strengths of various institutions for result-based outcomes. There is a need to set up an R&D centre in India, preferably in the public sector, which is open to all stakeholders. Also, for successful R&D efforts in this area, there needs to be a concerted and coordinated mechanism between various stakeholders, including private companies with deep expertise in refrigeration and air conditioning research. As such, a robust enabling platform is a key need in fostering meaningful collaborations and linkages and supporting the R&D efforts.
7.2 Development of Refrigerants Presently, the country is self-reliant with respect to synthetic refrigerants available through the domestic manufacturers. CSIR-IICT has adequate expertise in the area of fluorocarbon refrigerants over the years and has, in the past, been able to develop processes for development of HFC134a in close cooperation with the chemical industry. Recently the Indian refrigerant manufacturers have also developed their own R&D facilities in due course and has developed and started commercial production of lower GWP technologies like HFC-32 based on in-house R&D and supply to the market. However, the low GWP alternatives are heavily patented by the multinational companies.
A key aspect of refrigerant development is its use for a specific application. Any new refrigerant/molecule developed by Indian industries needs to be tested for effectiveness and efficiency for application development. There is a need for testing and application centres where new refrigerants could be tested for efficiency, toxicity, flammability, and environmental impact.
The new alternative refrigerants to HCFC and HFC are either mildly flammable or flammable. These refrigerants call for additional safety standards to address issues such as pressure safety, toxicity, electrical safety, flammability and explosion protection, and general safety of machinery.
Equipment Manufacturer
Technical capability for applicationsToxicity Testing
Flammability Testing
Compressor, Heatexchanger, Chiller, VRF,PCB, Motors, Controls,
Inverter technology
Refrigerant, equipment,alternative technologies
Institutions(IIT, CSIR, NCL)
Refrigerant BlendsProcess Development
Molecules R&D
Private Sector(Refrigerant production)
DR
AF
T F
OR
CO
NS
ULT
AT
ION
ON
LY
NO
T T
O B
E C
ITE
D
73
Global safety standards applicable to refrigeration and air-conditioning are mainly sourced from the International Standardisation Organisation (ISO) and the International Electrotechnical Commission (IEC), apart from some regional standards like the European Committee for Standardisation (CEN) and the European Committee for Electrotechnical Standardization (CENELEC). All refrigerant gases are classified primarily based on their toxicity and flammability per ISO 81757, IEC 6033558, EN 37859 and ASHRAE 3460.
Natural refrigerants such as hydrocarbons, carbon dioxide and ammonia are some of the low GWP refrigerant options available other than synthetic refrigerants. India is the first country globally, to commercially produce air conditioners with R-290 refrigerant. Similarly, majority of cold storages in the country operate upon ammonia. There is a recognized need to have safety standards for new alternative refrigerants including natural refrigerants. The Bureau of Indian Standards (BIS) is working on developing refrigerant safety standards for room air conditioners, especially for the natural refrigerants which are generally toxic and flammable.
7.2.1 Government Initiative for R&D for Low-GWP Alternatives to HFCs
As a first step, the Ministry of Environment, Forest and Climate Change (MoEF&CC) on 15 September 2016, announced a collaborative R&D programme to develop cost effective low-GWP alternative technologies to HFCs. This R&D initiative brings together government, research institutes, industry and civil society. Some of the key players of the initiative include the Council of Scientific & Industrial Research and its allied institutions, Department of Science and Technology, R&D and academic institutes, as well as key industry players. The deliberations for the collaborative R&D programme have further underscored the importance of undertaking R&D in the area of cooling. As part of the initiation of the collaborative research programme, the Department of Science and Technology has already sponsored a research programme for the development low-GWP alternative to HFCs at IICT Hyderabad.
7.3 Development of HVAC&R Technology R&D in HVAC&R is conducted primarily in the HVAC&R equipment manufacturing sector. However, currently there is no formal linkage between the refrigerant and HVAC technology development sectors. Some academic institutions – Indian Institute of Technologies (IITs), IISC, and NITs - have expertise to carry out research in the field of HVAC&R: new improvised refrigeration cycles, heat transfer, compressors, energy efficient electric motors, controls and heat exchangers.
For example, the Refrigeration and Air-conditioning lab at IIT Madras has embarked on a pilot study to evaluate the performance of multi-ejector CO2 system as an alternate to HCFC and HFC refrigerants; and, IIT Bombay has developed several patents on liquid desiccant cooling technologies and novel mobile air conditioning which can reduce dependence on conventional technologies. The Centre for Advanced Research in Building Science and Energy at CEPT University has done exemplary research in the field of building energy efficiency, covering energy-efficient design, energy-efficient building construction processes, environment friendly construction materials, resource audit and management, solar passive architecture and several green building technologies. There may be a lack of physical infrastructure for testing and evaluation, as it requires heavy investment. This gap could be filled by the industry, by extending such facilities within their own premises. This would prove to be a win-win situation, both for the industry and academic institutions. Such a model of operation is very common and successfully utilized in other countries.
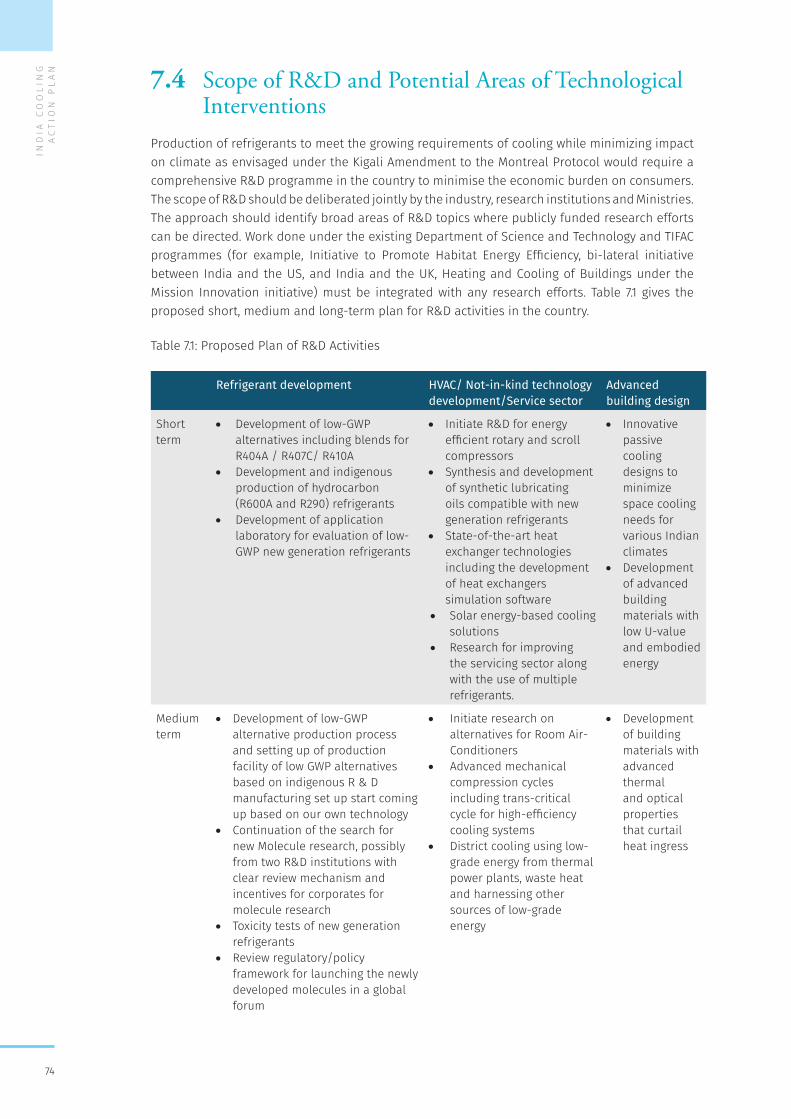
IND
IA C
OO
LIN
G A
CT
ION
PL
AN
74
7.4 Scope of R&D and Potential Areas of Technological Interventions
Production of refrigerants to meet the growing requirements of cooling while minimizing impact on climate as envisaged under the Kigali Amendment to the Montreal Protocol would require a comprehensive R&D programme in the country to minimise the economic burden on consumers. The scope of R&D should be deliberated jointly by the industry, research institutions and Ministries. The approach should identify broad areas of R&D topics where publicly funded research efforts can be directed. Work done under the existing Department of Science and Technology and TIFAC programmes (for example, Initiative to Promote Habitat Energy Efficiency, bi-lateral initiative between India and the US, and India and the UK, Heating and Cooling of Buildings under the Mission Innovation initiative) must be integrated with any research efforts. Table 7.1 gives the proposed short, medium and long-term plan for R&D activities in the country.
Table 7.1: Proposed Plan of R&D Activities
Refrigerant development HVAC/ Not-in-kind technology development/Service sector
Advanced building design
Short term
• Development of low-GWP alternatives including blends for R404A / R407C/ R410A
• Development and indigenous production of hydrocarbon (R600A and R290) refrigerants
• Development of application laboratory for evaluation of low-GWP new generation refrigerants
• Initiate R&D for energy efficient rotary and scroll compressors
• Synthesis and development of synthetic lubricating oils compatible with new generation refrigerants
• State-of-the-art heat exchanger technologies including the development of heat exchangers simulation software
• Solar energy-based cooling solutions
• Research for improving the servicing sector along with the use of multiple refrigerants.
• Innovative passive cooling designs to minimize space cooling needs for various Indian climates
• Development of advanced building materials with low U-value and embodied energy
Medium term
• Development of low-GWP alternative production process and setting up of production facility of low GWP alternatives based on indigenous R & D manufacturing set up start coming up based on our own technology
• Continuation of the search for new Molecule research, possibly from two R&D institutions with clear review mechanism and incentives for corporates for molecule research
• Toxicity tests of new generation refrigerants
• Review regulatory/policy framework for launching the newly developed molecules in a global forum
• Initiate research on alternatives for Room Air-Conditioners
• Advanced mechanical compression cycles including trans-critical cycle for high-efficiency cooling systems
• District cooling using low-grade energy from thermal power plants, waste heat and harnessing other sources of low-grade energy
• Development of building materials with advanced thermal and optical properties that curtail heat ingress
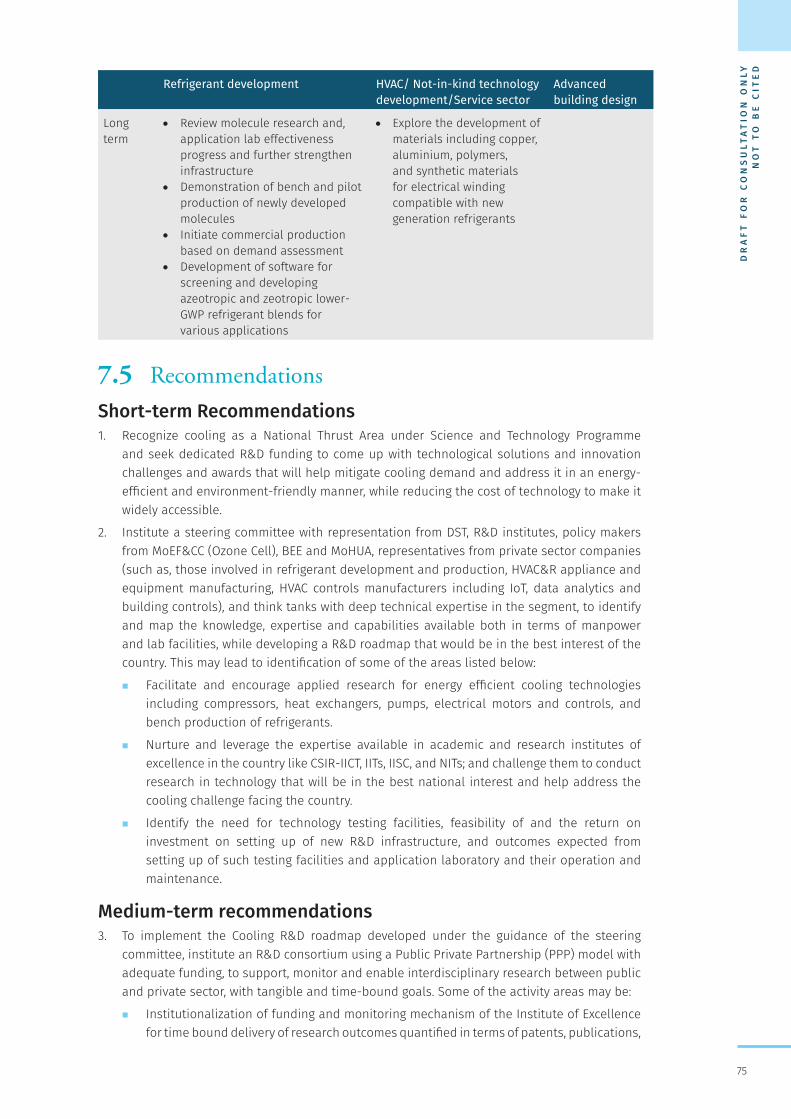
DR
AF
T F
OR
CO
NS
ULT
AT
ION
ON
LY
NO
T T
O B
E C
ITE
D
75
Refrigerant development HVAC/ Not-in-kind technology development/Service sector
Advanced building design
Long term
• Review molecule research and, application lab effectiveness progress and further strengthen infrastructure
• Demonstration of bench and pilot production of newly developed molecules
• Initiate commercial production based on demand assessment
• Development of software for screening and developing azeotropic and zeotropic lower-GWP refrigerant blends for various applications
• Explore the development of materials including copper, aluminium, polymers, and synthetic materials for electrical winding compatible with new generation refrigerants
7.5 Recommendations Short-term Recommendations 1. Recognize cooling as a National Thrust Area under Science and Technology Programme
and seek dedicated R&D funding to come up with technological solutions and innovation challenges and awards that will help mitigate cooling demand and address it in an energy-efficient and environment-friendly manner, while reducing the cost of technology to make it widely accessible.
2. Institute a steering committee with representation from DST, R&D institutes, policy makers from MoEF&CC (Ozone Cell), BEE and MoHUA, representatives from private sector companies (such as, those involved in refrigerant development and production, HVAC&R appliance and equipment manufacturing, HVAC controls manufacturers including IoT, data analytics and building controls), and think tanks with deep technical expertise in the segment, to identify and map the knowledge, expertise and capabilities available both in terms of manpower and lab facilities, while developing a R&D roadmap that would be in the best interest of the country. This may lead to identification of some of the areas listed below:
� Facilitate and encourage applied research for energy efficient cooling technologies including compressors, heat exchangers, pumps, electrical motors and controls, and bench production of refrigerants.
� Nurture and leverage the expertise available in academic and research institutes of excellence in the country like CSIR-IICT, IITs, IISC, and NITs; and challenge them to conduct research in technology that will be in the best national interest and help address the cooling challenge facing the country.
� Identify the need for technology testing facilities, feasibility of and the return on investment on setting up of new R&D infrastructure, and outcomes expected from setting up of such testing facilities and application laboratory and their operation and maintenance.
Medium-term recommendations 3. To implement the Cooling R&D roadmap developed under the guidance of the steering
committee, institute an R&D consortium using a Public Private Partnership (PPP) model with adequate funding, to support, monitor and enable interdisciplinary research between public and private sector, with tangible and time-bound goals. Some of the activity areas may be:
� Institutionalization of funding and monitoring mechanism of the Institute of Excellence for time bound delivery of research outcomes quantified in terms of patents, publications,
IND
IA C
OO
LIN
G A
CT
ION
PL
AN
76
and commercialisation of the technological achievements, translating into quantifiable benefits for the nation and its people.
� Institutionalize mechanisms for Intellectual Property Rights (IPR) in consultation with the Department of Industrial Policy and Promotion, Ministry of Commerce, and industry and the private sector partners.
� Institutionalize consultative process and draw long term strategies to avoid undue financial burden on the industry and the country, as the fluorocarbon refrigerant producing industry is capital intensive and subject to comply with international and national environmental regulations.
� Develop and facilitate scientific and technical environment for basic research in materials and refrigerants, especially new next generation molecules and oils.
Long-term recommendations4. Setting-up of an inter-disciplinary autonomous centre (s) of Excellence for Cooling technologies
housed in one of the Academic and/or recognized research institutes, capitalizing on the expertise and R&D facilities available; or recognize Centres of Excellence within existing institutes to work on specific areas, enabling active participation and engagement of the private sector.
DR
AF
T F
OR
CO
NS
ULT
AT
ION
ON
LY
NO
T T
O B
E C
ITE
D
77
8.1 BackgroundWhile addressing the rapidly rising cooling requirement of the country, aligning the domestic policies and programmes with international multilateral environment agreements will maximize the achievable environmental and societal benefits.
Acknowledging that cooling is a cross cutting requirement, an integrated and long-term vision across sectors is a prerequisite for addressing the cooling requirement in a sustainable manner and also providing access to cooling and thermal comfort to all. There are both international and domestic regulatory instruments impacting various facets of cooling. Additionally, there are different ongoing policies and programmes of the Government that co-relate with cooling. There are also overarching priorities and thrusts of the Government in terms of developmental objectives. Within this context, the ICAP lays out cooling demand estimates over a 20-year term in order that synergies could be forged, and cross-cutting integrated policies could be developed, where required, to secure the benefits and meet the developmental needs of the country.
Both refrigerant transition and energy efficiency standards necessitate changes in the equipment design. To provide a clear way forward for the industry, synchronization of regulatory measures for energy efficiency and refrigerant phase-out/transition, while meeting the domestic objectives as well as international commitments under Kigali amendment and Paris agreement, should be carried out wherever possible. The hallmark for success of Montreal Protocol in the country is the active participation of stakeholders including the industry. The role and collaboration of industry in moving towards new technologies for addressing the rising cooling requirement is most critical. A policy framework that supports and incentivizes industry involvement in the move towards sustainable cooling and thermal comfort for all will be an important requirement.
The environmental benefits of phase out of Ozone Depleting Substances under the Montreal Protocol are well recognized not only in terms of ozone layer protection but also in terms of the carbon
Recommendations and Way Forward
8
IND
IA C
OO
LIN
G A
CT
ION
PL
AN
78
dioxide equivalents avoided, as ODSs are high GWP gases. Presently, hydrochlorofluorocarbons (HCFC) are being phased out and several large, Indian AC manufacturers are moving from HCFC 22 to HFC 32. The HCFC phase out shall go on till 2030. This shall be overlapped with HFC phase down schedules as agreed under Kigali Amendment to the Montreal Protocol. In addition to mitigating the direct emissions of CO2 equivalent due to refrigerant emissions, an additional ~80 % of the total emissions attributed to AC equipment is related to indirect emissions associated with energy use.
However, it is recognized that, even by 2038, a significant percentage of the households shall not be able to afford refrigerant-based cooling equipment. Therefore, wider proliferation of thermally efficient residential built spaces, that have reduced heat load and enhanced ventilation, is required. This should be coupled with availability of efficient non-refrigerant based cooling equipment, such as fans and coolers, to fulfill the cooling need.
8.2 Short, Medium and Long-term Recommendations Sustainable cooling can be achieved through reduction in cooling load, passive cooling interventions for buildings, moving towards more energy efficient RAC equipment, operational efficiency enhancements, and use of new and alternative technologies including not-in-kind technologies, while implementing the Montreal protocol. The move to sustainable cooling shall also be reinforced through a robust innovation ecosystem to develop and implement new technologies, and a skilled RAC service technicians’ work force.
In this chapter, major recommendations from the preceding chapters have been culled out to draw synergies with different ongoing policies and programmes of the Government. Table 8.1 has some such examples where actions related to cooling could be linked to ongoing governmental schemes and programmes.
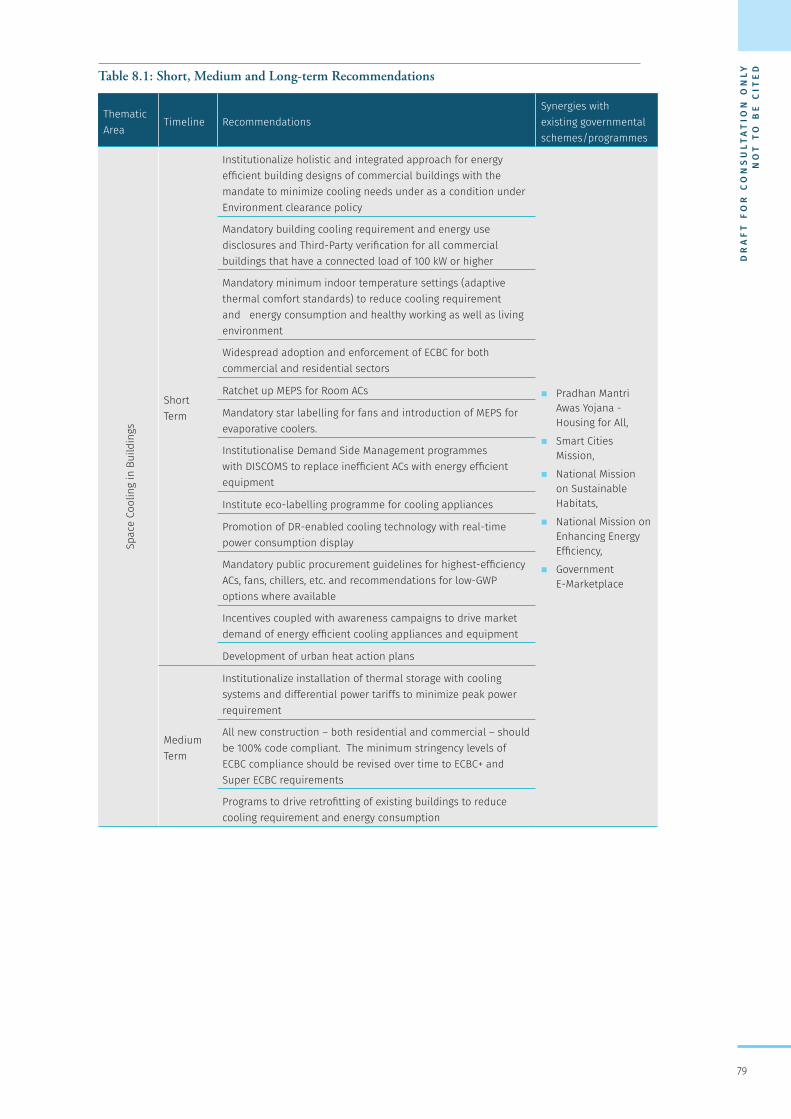
DR
AF
T F
OR
CO
NS
ULT
AT
ION
ON
LY
NO
T T
O B
E C
ITE
D
79
Table 8.1: Short, Medium and Long-term Recommendations
Thematic Area
Timeline Recommendations Synergies with existing governmental schemes/programmes
Spac
e Co
olin
g in
Bui
ldin
gs
Short Term
Institutionalize holistic and integrated approach for energy efficient building designs of commercial buildings with the mandate to minimize cooling needs under as a condition under Environment clearance policy
� Pradhan Mantri Awas Yojana - Housing for All,
� Smart Cities Mission,
� National Mission on Sustainable Habitats,
� National Mission on Enhancing Energy Efficiency,
� Government E-Marketplace
Mandatory building cooling requirement and energy use disclosures and Third-Party verification for all commercial buildings that have a connected load of 100 kW or higher
Mandatory minimum indoor temperature settings (adaptive thermal comfort standards) to reduce cooling requirement and energy consumption and healthy working as well as living environment
Widespread adoption and enforcement of ECBC for both commercial and residential sectors
Ratchet up MEPS for Room ACs
Mandatory star labelling for fans and introduction of MEPS for evaporative coolers.
Institutionalise Demand Side Management programmes with DISCOMS to replace inefficient ACs with energy efficient equipment
Institute eco-labelling programme for cooling appliances
Promotion of DR-enabled cooling technology with real-time power consumption display
Mandatory public procurement guidelines for highest-efficiency ACs, fans, chillers, etc. and recommendations for low-GWP options where available
Incentives coupled with awareness campaigns to drive market demand of energy efficient cooling appliances and equipment
Development of urban heat action plans
Medium Term
Institutionalize installation of thermal storage with cooling systems and differential power tariffs to minimize peak power requirement
All new construction – both residential and commercial – should be 100% code compliant. The minimum stringency levels of ECBC compliance should be revised over time to ECBC+ and Super ECBC requirements
Programs to drive retrofitting of existing buildings to reduce cooling requirement and energy consumption
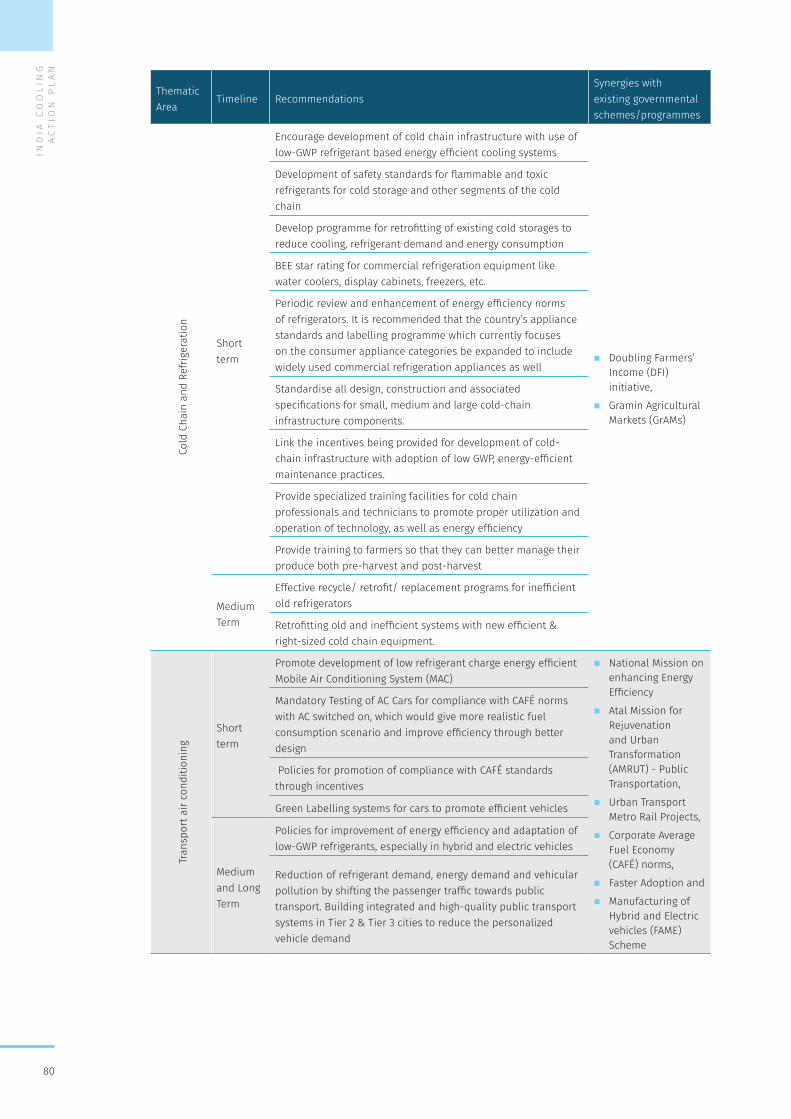
IND
IA C
OO
LIN
G A
CT
ION
PL
AN
80
Thematic Area
Timeline Recommendations Synergies with existing governmental schemes/programmes
Cold
Cha
in a
nd R
efrig
erat
ion
Short term
Encourage development of cold chain infrastructure with use of low-GWP refrigerant based energy efficient cooling systems
� Doubling Farmers’ Income (DFI) initiative,
� Gramin Agricultural Markets (GrAMs)
Development of safety standards for flammable and toxic refrigerants for cold storage and other segments of the cold chain
Develop programme for retrofitting of existing cold storages to reduce cooling, refrigerant demand and energy consumption
BEE star rating for commercial refrigeration equipment like water coolers, display cabinets, freezers, etc.
Periodic review and enhancement of energy efficiency norms of refrigerators. It is recommended that the country’s appliance standards and labelling programme which currently focuses on the consumer appliance categories be expanded to include widely used commercial refrigeration appliances as well
Standardise all design, construction and associated specifications for small, medium and large cold-chain infrastructure components.
Link the incentives being provided for development of cold-chain infrastructure with adoption of low GWP, energy-efficient maintenance practices.
Provide specialized training facilities for cold chain professionals and technicians to promote proper utilization and operation of technology, as well as energy efficiency
Provide training to farmers so that they can better manage their produce both pre-harvest and post-harvest
Medium Term
Effective recycle/ retrofit/ replacement programs for inefficient old refrigerators
Retrofitting old and inefficient systems with new efficient & right-sized cold chain equipment.
Tran
spor
t air
cond
ition
ing
Short term
Promote development of low refrigerant charge energy efficient Mobile Air Conditioning System (MAC)
� National Mission on enhancing Energy Efficiency
� Atal Mission for Rejuvenation and Urban Transformation (AMRUT) - Public Transportation,
� Urban Transport Metro Rail Projects,
� Corporate Average Fuel Economy (CAFÉ) norms,
� Faster Adoption and
� Manufacturing of Hybrid and Electric vehicles (FAME) Scheme
Mandatory Testing of AC Cars for compliance with CAFÉ norms with AC switched on, which would give more realistic fuel consumption scenario and improve efficiency through better design
Policies for promotion of compliance with CAFÉ standards through incentives
Green Labelling systems for cars to promote efficient vehicles
Medium and Long Term
Policies for improvement of energy efficiency and adaptation of low-GWP refrigerants, especially in hybrid and electric vehicles
Reduction of refrigerant demand, energy demand and vehicular pollution by shifting the passenger traffic towards public transport. Building integrated and high-quality public transport systems in Tier 2 & Tier 3 cities to reduce the personalized vehicle demand
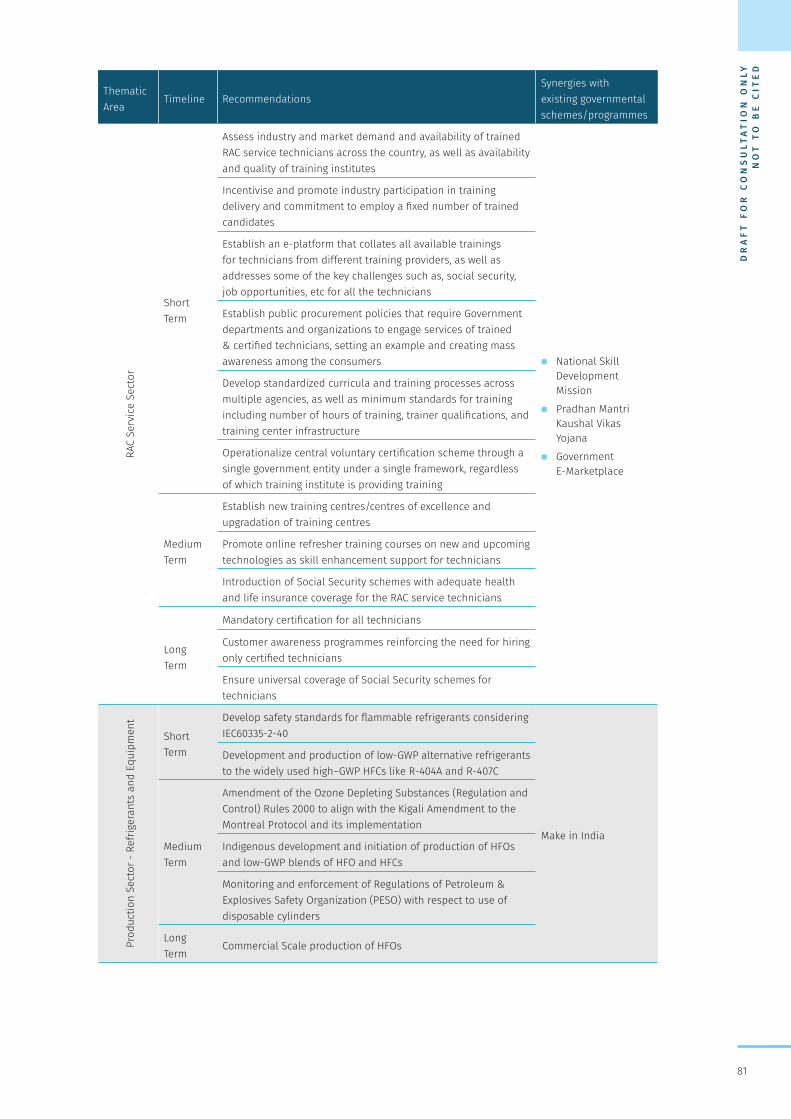
DR
AF
T F
OR
CO
NS
ULT
AT
ION
ON
LY
NO
T T
O B
E C
ITE
D
81
Thematic Area
Timeline Recommendations Synergies with existing governmental schemes/programmes
RAC
Serv
ice
Sect
or
Short Term
Assess industry and market demand and availability of trained RAC service technicians across the country, as well as availability and quality of training institutes
� National Skill Development Mission
� Pradhan Mantri Kaushal Vikas Yojana
� Government E-Marketplace
Incentivise and promote industry participation in training delivery and commitment to employ a fixed number of trained candidates
Establish an e-platform that collates all available trainings for technicians from different training providers, as well as addresses some of the key challenges such as, social security, job opportunities, etc for all the technicians
Establish public procurement policies that require Government departments and organizations to engage services of trained & certified technicians, setting an example and creating mass awareness among the consumers
Develop standardized curricula and training processes across multiple agencies, as well as minimum standards for training including number of hours of training, trainer qualifications, and training center infrastructure
Operationalize central voluntary certification scheme through a single government entity under a single framework, regardless of which training institute is providing training
Medium Term
Establish new training centres/centres of excellence and upgradation of training centres
Promote online refresher training courses on new and upcoming technologies as skill enhancement support for technicians
Introduction of Social Security schemes with adequate health and life insurance coverage for the RAC service technicians
Long Term
Mandatory certification for all technicians
Customer awareness programmes reinforcing the need for hiring only certified technicians
Ensure universal coverage of Social Security schemes for technicians
Prod
uctio
n Se
ctor
- Re
frig
eran
ts a
nd E
quip
men
t
Short Term
Develop safety standards for flammable refrigerants considering IEC60335-2-40
Make in India
Development and production of low-GWP alternative refrigerants to the widely used high–GWP HFCs like R-404A and R-407C
Medium Term
Amendment of the Ozone Depleting Substances (Regulation and Control) Rules 2000 to align with the Kigali Amendment to the Montreal Protocol and its implementation
Indigenous development and initiation of production of HFOs and low-GWP blends of HFO and HFCs
Monitoring and enforcement of Regulations of Petroleum & Explosives Safety Organization (PESO) with respect to use of disposable cylinders
Long Term
Commercial Scale production of HFOs
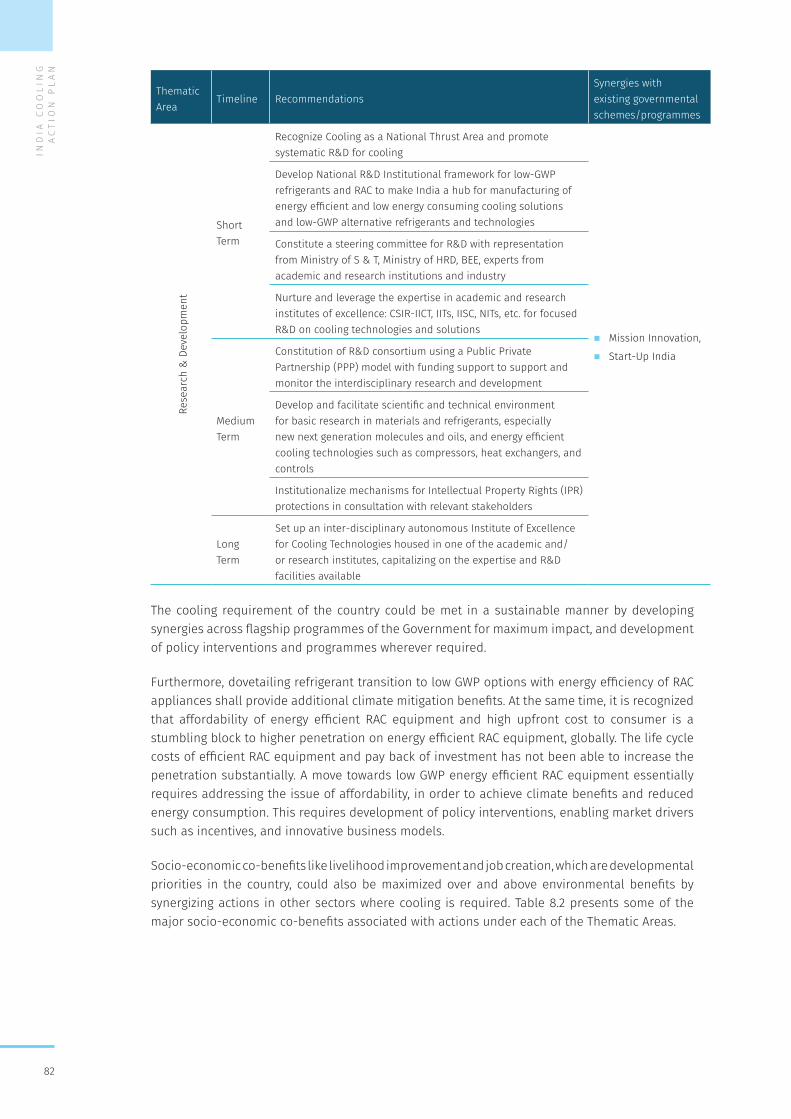
IND
IA C
OO
LIN
G A
CT
ION
PL
AN
82
Thematic Area
Timeline Recommendations Synergies with existing governmental schemes/programmes
Rese
arch
& D
evel
opm
ent
Short Term
Recognize Cooling as a National Thrust Area and promote systematic R&D for cooling
� Mission Innovation,
� Start-Up India
Develop National R&D Institutional framework for low-GWP refrigerants and RAC to make India a hub for manufacturing of energy efficient and low energy consuming cooling solutions and low-GWP alternative refrigerants and technologies
Constitute a steering committee for R&D with representation from Ministry of S & T, Ministry of HRD, BEE, experts from academic and research institutions and industry
Nurture and leverage the expertise in academic and research institutes of excellence: CSIR-IICT, IITs, IISC, NITs, etc. for focused R&D on cooling technologies and solutions
Medium Term
Constitution of R&D consortium using a Public Private Partnership (PPP) model with funding support to support and monitor the interdisciplinary research and development
Develop and facilitate scientific and technical environment for basic research in materials and refrigerants, especially new next generation molecules and oils, and energy efficient cooling technologies such as compressors, heat exchangers, and controls
Institutionalize mechanisms for Intellectual Property Rights (IPR) protections in consultation with relevant stakeholders
Long Term
Set up an inter-disciplinary autonomous Institute of Excellence for Cooling Technologies housed in one of the academic and/or research institutes, capitalizing on the expertise and R&D facilities available
The cooling requirement of the country could be met in a sustainable manner by developing synergies across flagship programmes of the Government for maximum impact, and development of policy interventions and programmes wherever required.
Furthermore, dovetailing refrigerant transition to low GWP options with energy efficiency of RAC appliances shall provide additional climate mitigation benefits. At the same time, it is recognized that affordability of energy efficient RAC equipment and high upfront cost to consumer is a stumbling block to higher penetration on energy efficient RAC equipment, globally. The life cycle costs of efficient RAC equipment and pay back of investment has not been able to increase the penetration substantially. A move towards low GWP energy efficient RAC equipment essentially requires addressing the issue of affordability, in order to achieve climate benefits and reduced energy consumption. This requires development of policy interventions, enabling market drivers such as incentives, and innovative business models.
Socio-economic co-benefits like livelihood improvement and job creation, which are developmental priorities in the country, could also be maximized over and above environmental benefits by synergizing actions in other sectors where cooling is required. Table 8.2 presents some of the major socio-economic co-benefits associated with actions under each of the Thematic Areas.
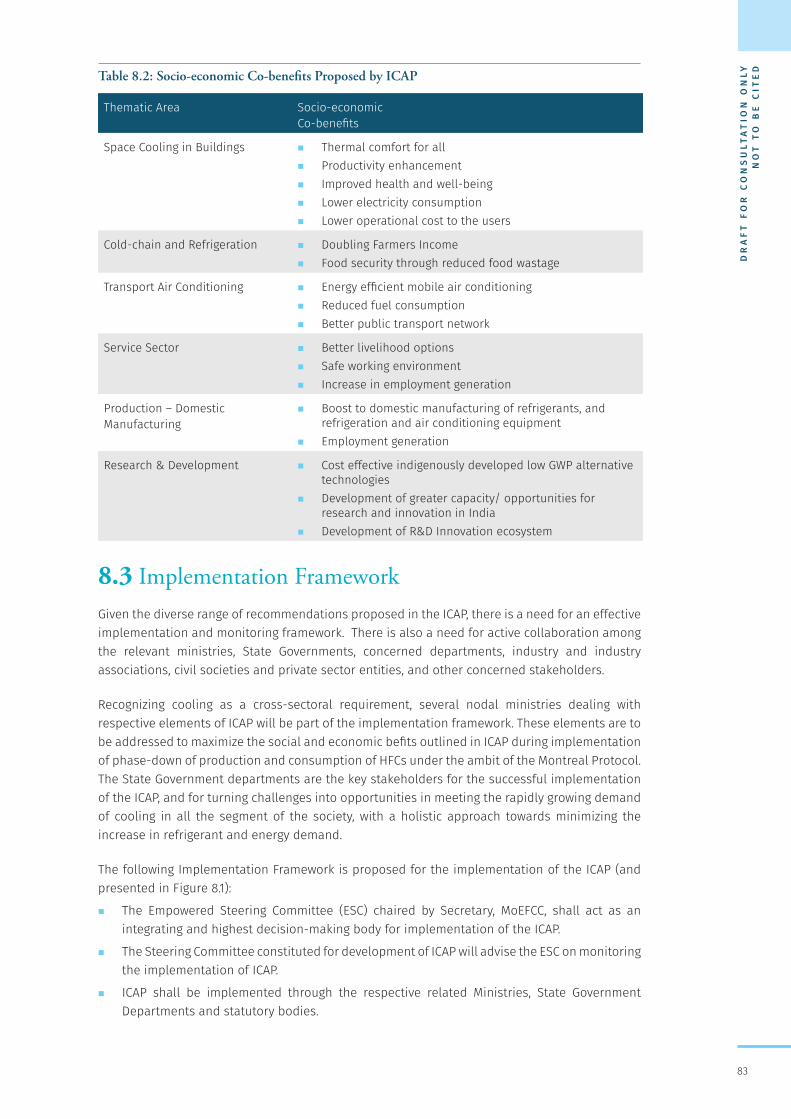
DR
AF
T F
OR
CO
NS
ULT
AT
ION
ON
LY
NO
T T
O B
E C
ITE
D
83
Table 8.2: Socio-economic Co-benefits Proposed by ICAP
Thematic Area Socio-economicCo-benefits
Space Cooling in Buildings � Thermal comfort for all � Productivity enhancement � Improved health and well-being � Lower electricity consumption � Lower operational cost to the users
Cold-chain and Refrigeration � Doubling Farmers Income � Food security through reduced food wastage
Transport Air Conditioning � Energy efficient mobile air conditioning � Reduced fuel consumption � Better public transport network
Service Sector � Better livelihood options � Safe working environment � Increase in employment generation
Production – Domestic Manufacturing
� Boost to domestic manufacturing of refrigerants, and refrigeration and air conditioning equipment
� Employment generation
Research & Development � Cost effective indigenously developed low GWP alternative technologies
� Development of greater capacity/ opportunities for research and innovation in India
� Development of R&D Innovation ecosystem
8.3 Implementation Framework Given the diverse range of recommendations proposed in the ICAP, there is a need for an effective implementation and monitoring framework. There is also a need for active collaboration among the relevant ministries, State Governments, concerned departments, industry and industry associations, civil societies and private sector entities, and other concerned stakeholders.
Recognizing cooling as a cross-sectoral requirement, several nodal ministries dealing with respective elements of ICAP will be part of the implementation framework. These elements are to be addressed to maximize the social and economic befits outlined in ICAP during implementation of phase-down of production and consumption of HFCs under the ambit of the Montreal Protocol. The State Government departments are the key stakeholders for the successful implementation of the ICAP, and for turning challenges into opportunities in meeting the rapidly growing demand of cooling in all the segment of the society, with a holistic approach towards minimizing the increase in refrigerant and energy demand.
The following Implementation Framework is proposed for the implementation of the ICAP (and presented in Figure 8.1):
� The Empowered Steering Committee (ESC) chaired by Secretary, MoEFCC, shall act as an integrating and highest decision-making body for implementation of the ICAP.
� The Steering Committee constituted for development of ICAP will advise the ESC on monitoring the implementation of ICAP.
� ICAP shall be implemented through the respective related Ministries, State Government Departments and statutory bodies.
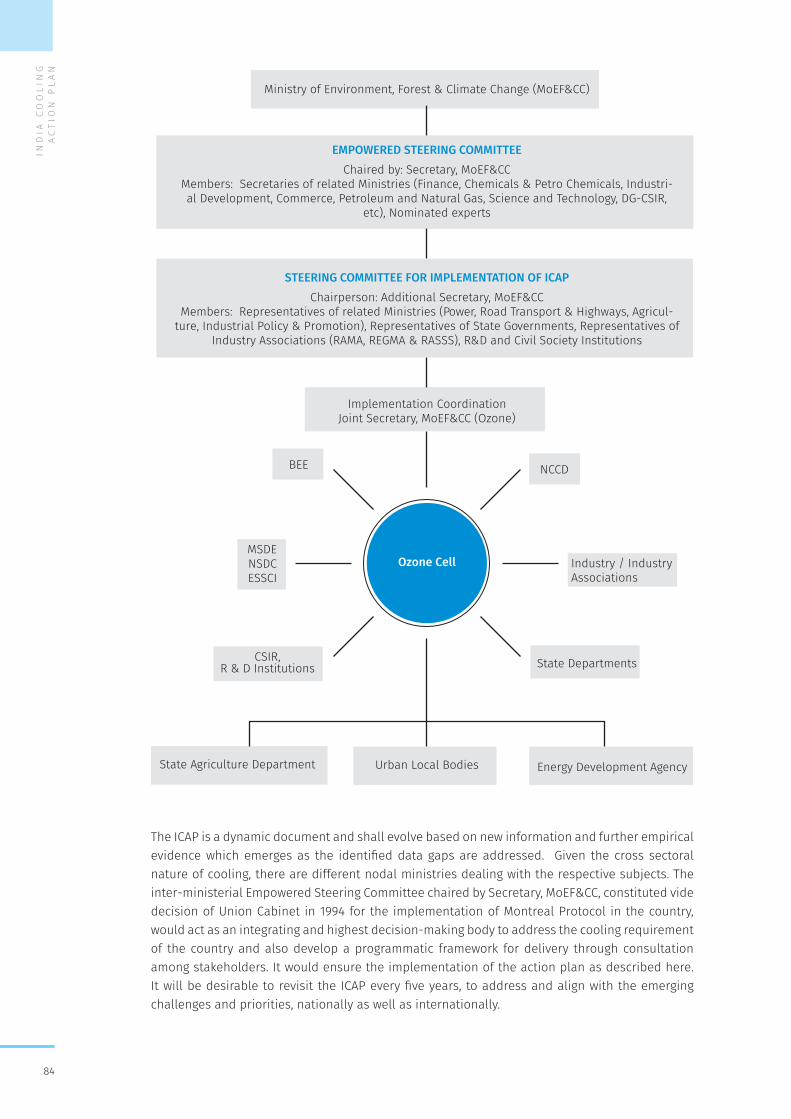
IND
IA C
OO
LIN
G A
CT
ION
PL
AN
84
The ICAP is a dynamic document and shall evolve based on new information and further empirical evidence which emerges as the identified data gaps are addressed. Given the cross sectoral nature of cooling, there are different nodal ministries dealing with the respective subjects. The inter-ministerial Empowered Steering Committee chaired by Secretary, MoEF&CC, constituted vide decision of Union Cabinet in 1994 for the implementation of Montreal Protocol in the country, would act as an integrating and highest decision-making body to address the cooling requirement of the country and also develop a programmatic framework for delivery through consultation among stakeholders. It would ensure the implementation of the action plan as described here. It will be desirable to revisit the ICAP every five years, to address and align with the emerging challenges and priorities, nationally as well as internationally.
Ministry of Environment, Forest & Climate Change (MoEF&CC)
Implementation CoordinationJoint Secretary, MoEF&CC (Ozone)
Ozone Cell
EMPOWERED STEERING COMMITTEEChaired by: Secretary, MoEF&CC
Members: Secretaries of related Ministries (Finance, Chemicals & Petro Chemicals, Industri-al Development, Commerce, Petroleum and Natural Gas, Science and Technology, DG-CSIR,
etc), Nominated experts
STEERING COMMITTEE FOR IMPLEMENTATION OF ICAPChairperson: Additional Secretary, MoEF&CC
Members: Representatives of related Ministries (Power, Road Transport & Highways, Agricul-ture, Industrial Policy & Promotion), Representatives of State Governments, Representatives of
Industry Associations (RAMA, REGMA & RASSS), R&D and Civil Society Institutions
State Agriculture Department Urban Local Bodies Energy Development Agency
MSDENSDCESSCI
CSIR,R & D Institutions State Departments
Industry / IndustryAssociations
BEE NCCD
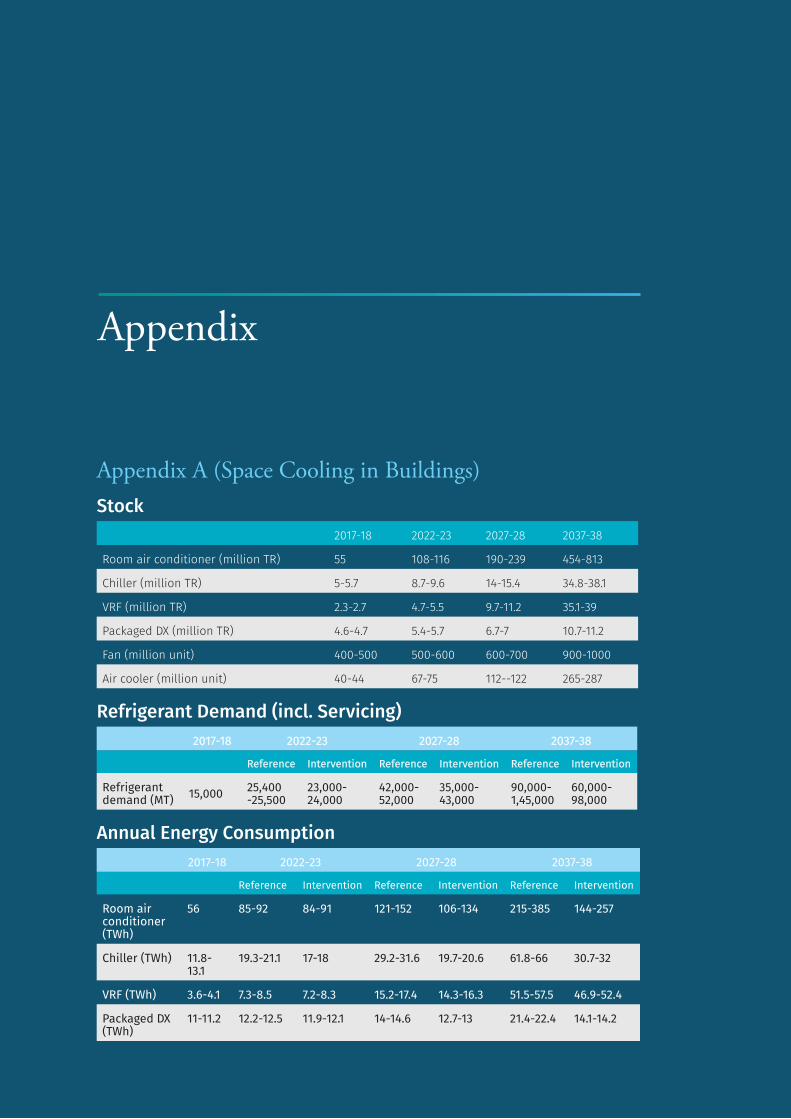
DR
AF
T F
OR
CO
NS
ULT
AT
ION
ON
LY
NO
T T
O B
E C
ITE
D
85
Appendix A (Space Cooling in Buildings)Stock
2017-18 2022-23 2027-28 2037-38
Room air conditioner (million TR) 55 108-116 190-239 454-813
Chiller (million TR) 5-5.7 8.7-9.6 14-15.4 34.8-38.1
VRF (million TR) 2.3-2.7 4.7-5.5 9.7-11.2 35.1-39
Packaged DX (million TR) 4.6-4.7 5.4-5.7 6.7-7 10.7-11.2
Fan (million unit) 400-500 500-600 600-700 900-1000
Air cooler (million unit) 40-44 67-75 112--122 265-287
Refrigerant Demand (incl. Servicing) 2017-18 2022-23 2027-28 2037-38
Reference Intervention Reference Intervention Reference Intervention
Refrigerant demand (MT) 15,000 25,400
-25,50023,000-24,000
42,000-52,000
35,000-43,000
90,000-1,45,000
60,000-98,000
Annual Energy Consumption 2017-18 2022-23 2027-28 2037-38
Reference Intervention Reference Intervention Reference Intervention
Room air conditioner (TWh)
56 85-92 84-91 121-152 106-134 215-385 144-257
Chiller (TWh) 11.8-13.1
19.3-21.1 17-18 29.2-31.6 19.7-20.6 61.8-66 30.7-32
VRF (TWh) 3.6-4.1 7.3-8.5 7.2-8.3 15.2-17.4 14.3-16.3 51.5-57.5 46.9-52.4
Packaged DX (TWh)
11-11.2 12.2-12.5 11.9-12.1 14-14.6 12.7-13 21.4-22.4 14.1-14.2
Appendix
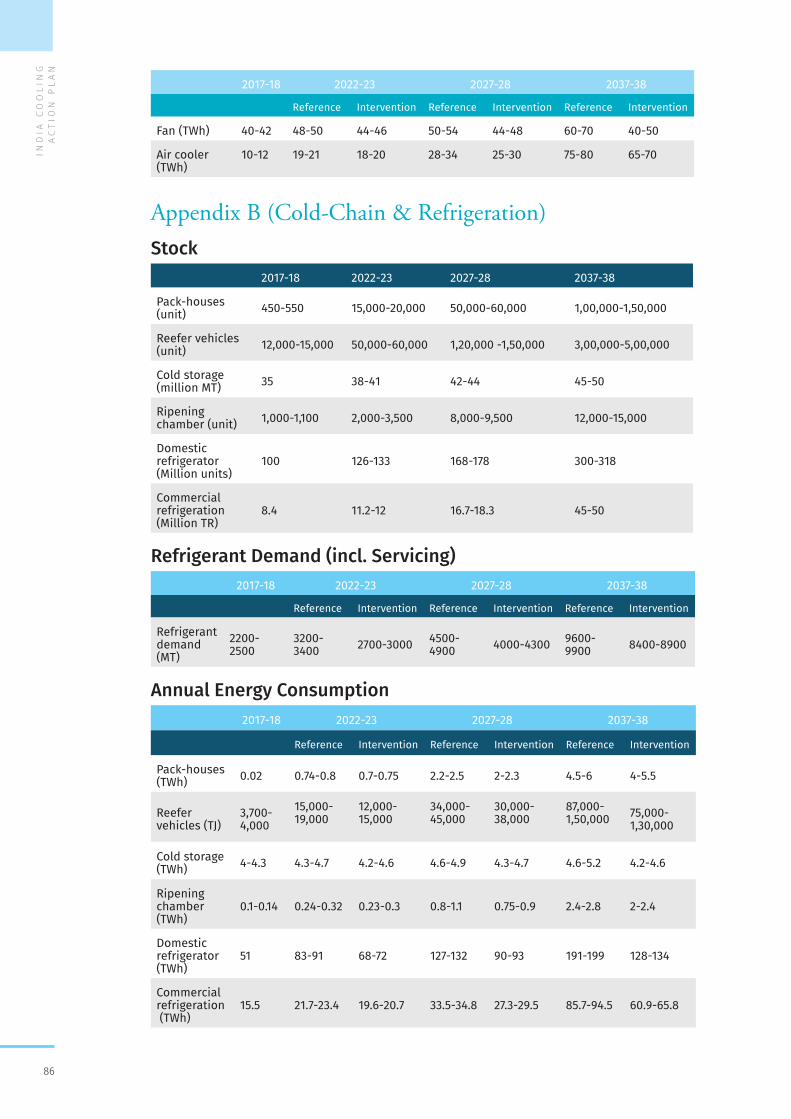
IND
IA C
OO
LIN
G A
CT
ION
PL
AN
86
2017-18 2022-23 2027-28 2037-38
Reference Intervention Reference Intervention Reference Intervention
Fan (TWh) 40-42 48-50 44-46 50-54 44-48 60-70 40-50
Air cooler (TWh)
10-12 19-21 18-20 28-34 25-30 75-80 65-70
Appendix B (Cold-Chain & Refrigeration)Stock
2017-18 2022-23 2027-28 2037-38
Pack-houses (unit) 450-550 15,000-20,000 50,000-60,000 1,00,000-1,50,000
Reefer vehicles (unit) 12,000-15,000 50,000-60,000 1,20,000 -1,50,000 3,00,000-5,00,000
Cold storage (million MT) 35 38-41 42-44 45-50
Ripening chamber (unit) 1,000-1,100 2,000-3,500 8,000-9,500 12,000-15,000
Domestic refrigerator (Million units)
100 126-133 168-178 300-318
Commercial refrigeration(Million TR)
8.4 11.2-12 16.7-18.3 45-50
Refrigerant Demand (incl. Servicing)2017-18 2022-23 2027-28 2037-38
Reference Intervention Reference Intervention Reference Intervention
Refrigerant demand (MT)
2200-2500
3200-3400 2700-3000 4500-
4900 4000-4300 9600-9900 8400-8900
Annual Energy Consumption 2017-18 2022-23 2027-28 2037-38
Reference Intervention Reference Intervention Reference Intervention
Pack-houses (TWh) 0.02 0.74-0.8 0.7-0.75 2.2-2.5 2-2.3 4.5-6 4-5.5
Reefer vehicles (TJ)
3,700-4,000
15,000-19,000
12,000-15,000
34,000-45,000
30,000-38,000
87,000-1,50,000 75,000-
1,30,000
Cold storage (TWh) 4-4.3 4.3-4.7 4.2-4.6 4.6-4.9 4.3-4.7 4.6-5.2 4.2-4.6
Ripening chamber (TWh)
0.1-0.14 0.24-0.32 0.23-0.3 0.8-1.1 0.75-0.9 2.4-2.8 2-2.4
Domestic refrigerator (TWh)
51 83-91 68-72 127-132 90-93 191-199 128-134
Commercial refrigeration (TWh)
15.5 21.7-23.4 19.6-20.7 33.5-34.8 27.3-29.5 85.7-94.5 60.9-65.8
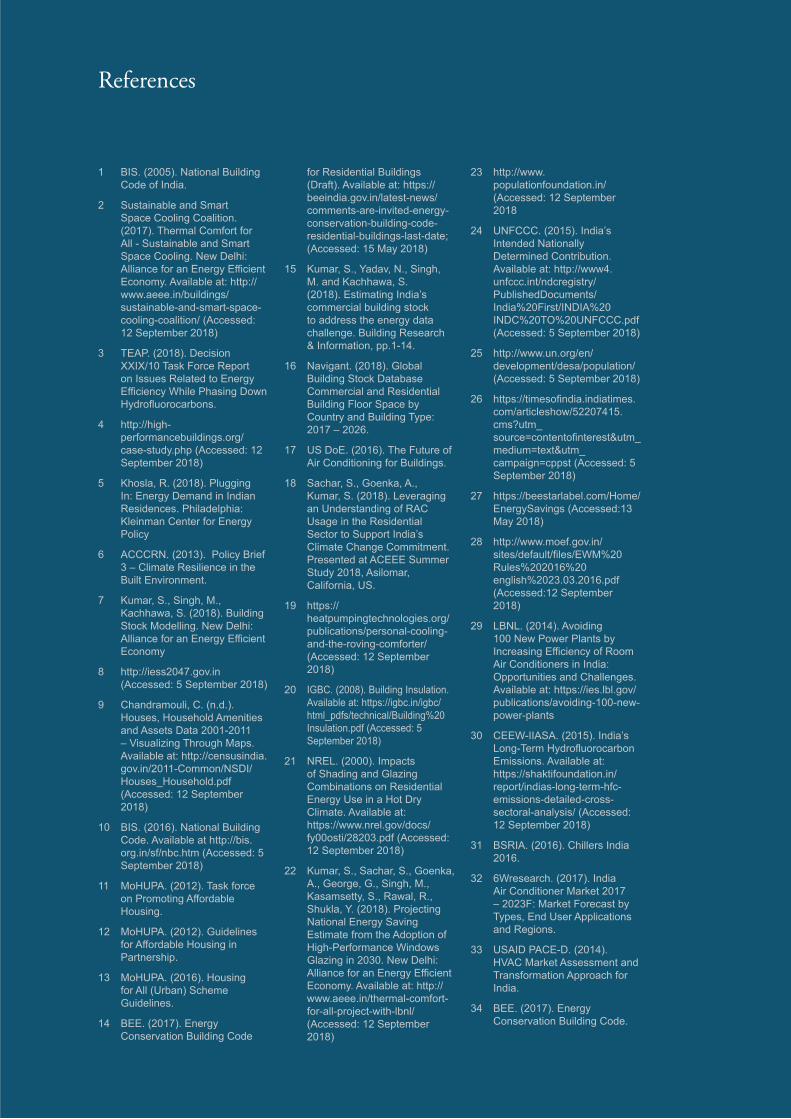
DR
AF
T F
OR
CO
NS
ULT
AT
ION
ON
LY
NO
T T
O B
E C
ITE
D
87
References
1 BIS. (2005). National Building Code of India.
2 Sustainable and Smart Space Cooling Coalition. (2017). Thermal Comfort for All - Sustainable and Smart Space Cooling. New Delhi: Alliance for an Energy Efficient Economy. Available at: http://www.aeee.in/buildings/sustainable-and-smart-space-cooling-coalition/ (Accessed: 12 September 2018)
3 TEAP. (2018). Decision XXIX/10 Task Force Report on Issues Related to Energy Efficiency While Phasing Down Hydrofluorocarbons.
4 http://high-performancebuildings.org/case-study.php (Accessed: 12 September 2018)
5 Khosla, R. (2018). Plugging In: Energy Demand in Indian Residences. Philadelphia: Kleinman Center for Energy Policy
6 ACCCRN. (2013). Policy Brief 3 – Climate Resilience in the Built Environment.
7 Kumar, S., Singh, M., Kachhawa, S. (2018). Building Stock Modelling. New Delhi: Alliance for an Energy Efficient Economy
8 http://iess2047.gov.in (Accessed: 5 September 2018)
9 Chandramouli, C. (n.d.). Houses, Household Amenities and Assets Data 2001-2011 – Visualizing Through Maps. Available at: http://censusindia.gov.in/2011-Common/NSDI/Houses_Household.pdf (Accessed: 12 September 2018)
10 BIS. (2016). National Building Code. Available at http://bis.org.in/sf/nbc.htm (Accessed: 5 September 2018)
11 MoHUPA. (2012). Task force on Promoting Affordable Housing.
12 MoHUPA. (2012). Guidelines for Affordable Housing in Partnership.
13 MoHUPA. (2016). Housing for All (Urban) Scheme Guidelines.
14 BEE. (2017). Energy Conservation Building Code
for Residential Buildings (Draft). Available at: https://beeindia.gov.in/latest-news/comments-are-invited-energy-conservation-building-code-residential-buildings-last-date; (Accessed: 15 May 2018)
15 Kumar, S., Yadav, N., Singh, M. and Kachhawa, S. (2018). Estimating India’s commercial building stock to address the energy data challenge. Building Research & Information, pp.1-14.
16 Navigant. (2018). Global Building Stock Database Commercial and Residential Building Floor Space by Country and Building Type: 2017 – 2026.
17 US DoE. (2016). The Future of Air Conditioning for Buildings.
18 Sachar, S., Goenka, A., Kumar, S. (2018). Leveraging an Understanding of RAC Usage in the Residential Sector to Support India’s Climate Change Commitment. Presented at ACEEE Summer Study 2018, Asilomar, California, US.
19 https://heatpumpingtechnologies.org/publications/personal-cooling-and-the-roving-comforter/ (Accessed: 12 September 2018)
20 IGBC. (2008). Building Insulation. Available at: https://igbc.in/igbc/html_pdfs/technical/Building%20Insulation.pdf (Accessed: 5 September 2018)
21 NREL. (2000). Impacts of Shading and Glazing Combinations on Residential Energy Use in a Hot Dry Climate. Available at: https://www.nrel.gov/docs/fy00osti/28203.pdf (Accessed: 12 September 2018)
22 Kumar, S., Sachar, S., Goenka, A., George, G., Singh, M., Kasamsetty, S., Rawal, R., Shukla, Y. (2018). Projecting National Energy Saving Estimate from the Adoption of High-Performance Windows Glazing in 2030. New Delhi: Alliance for an Energy Efficient Economy. Available at: http://www.aeee.in/thermal-comfort-for-all-project-with-lbnl/ (Accessed: 12 September 2018)
23 http://www.populationfoundation.in/ (Accessed: 12 September 2018
24 UNFCCC. (2015). India’s Intended Nationally Determined Contribution. Available at: http://www4.unfccc.int/ndcregistry/PublishedDocuments/India%20First/INDIA%20INDC%20TO%20UNFCCC.pdf (Accessed: 5 September 2018)
25 http://www.un.org/en/development/desa/population/ (Accessed: 5 September 2018)
26 https://timesofindia.indiatimes.com/articleshow/52207415.cms?utm_source=contentofinterest&utm_medium=text&utm_campaign=cppst (Accessed: 5 September 2018)
27 https://beestarlabel.com/Home/EnergySavings (Accessed:13 May 2018)
28 http://www.moef.gov.in/sites/default/files/EWM%20Rules%202016%20english%2023.03.2016.pdf (Accessed:12 September 2018)
29 LBNL. (2014). Avoiding 100 New Power Plants by Increasing Efficiency of Room Air Conditioners in India: Opportunities and Challenges. Available at: https://ies.lbl.gov/publications/avoiding-100-new-power-plants
30 CEEW-IIASA. (2015). India’s Long-Term Hydrofluorocarbon Emissions. Available at: https://shaktifoundation.in/report/indias-long-term-hfc-emissions-detailed-cross-sectoral-analysis/ (Accessed: 12 September 2018)
31 BSRIA. (2016). Chillers India 2016.
32 6Wresearch. (2017). India Air Conditioner Market 2017 – 2023F: Market Forecast by Types, End User Applications and Regions.
33 USAID PACE-D. (2014). HVAC Market Assessment and Transformation Approach for India.
34 BEE. (2017). Energy Conservation Building Code.
IND
IA C
OO
LIN
G A
CT
ION
PL
AN
88
35 ASHRAE. (2016). Standard 90.1 Energy Standard for Buildings Except Low-Rise Residential Buildings.
36 BSRIA. (2016). World Air Conditioning 2016.
37 Prayas (Energy Group). (2010). Energy Saving Potential in Indian Households from Improved Appliance Efficiency.
38 Symphony. (2018). Corporate Presentation.
39 http://pib.nic.in/newsite/PrintRelease.aspx?relid=180281 (Accessed: 12 September 2018)
40 Manu, S., Shukla, Y., Rawal, R., Thomas, L. and de Dear, R. (2016). Field studies of thermal comfort across multiple climate zones for the subcontinent: India Model for Adaptive Comfort (IMAC). Building and Environment, 98, pp.55-70.
41 Kumar, S., Sachar, S., Kachhawa, S., Singh, M., Goenka, A., Kasamsetty, S., George, G., Rawal, R., Shukla, Y. (2018). Projecting National Energy Saving Estimate from the Adoption of Adaptive Thermal Comfort Standards in 2030. New Delhi: Alliance for an Energy Efficient Economy. Available at: http://www.aeee.in/thermal-comfort-for-all-project-with-lbnl/ (Accessed: 12 September 2018)
42 https://www.finmin.nic.in/sites/default/files/OM_energy_ElecAppl.pdf (Accessed: 12 September 2018)
43 NCCD. (2015). All India Cold-chain Infrastructure and Capacity. Available at: https://www.nccd.gov.in/PDF/
CCSG_Final%20Report_Web.pdf (Accessed: 12 September 2018)
44 FAO. (2015). Food Wastage Footprint and Climate Change. Available at: http://www.fao.org/fileadmin/templates/nr/sustainability_pathways/docs/FWF_and_climate_change.pdf (Accessed: 12 September 2018)
45 MoAFW. (2017). Report of the Inter-ministerial Committee on Doubling Farmers’ Income, Vol. III (Post Production Logistics) and IV (Post Production Interventions: Agriculture Marketing).
46 National Horticultural Board (2014). All India Cold Storage Capacity and Technology - Baseline study conducted by Hansa Research Group.
47 cBalance. (2016). Mapping Natural Refrigerant Technology Uptake in India: Current State and Future Narratives.
48 CLASP. (2014). Commercial Refrigeration Equipment: Mapping and Benchmarking.
49 UNEP. (2014). Refrigeration, Air-conditioning and Heat Pumps.
50 Filip Nistor, C. P. (2014). THE ROLE OF TRANSPORT IN ECONOMIC DEVELOPMENT. “Mircea cel Batran” Naval Academy Press, Scientific Bulletin, Volume XVII – 2014 – Issue 2.
51 NTDPC. (2014). India Transport Report: Moving India to 2032. India: Routledge.
52 TEDDY. (2017). TERI Energy & Environment Data Diary and Yearbook 2016-17. Delhi:
The Energy and Resources Institute.
53 TERI. (n.d.). Modelling Study on Greenhouse Gas Emissions and Emission Intensity of Indian Economy.
54 http://ozone.unep.org/sites/ozone/files/documents/RTOC-Assessment-Report-2014.pdf (Accessed: 13 September 2018)
55 http://conf.montreal-protocol.org/meeting/mop/cop11-mop29/presession/Background-Documents/TEAP-EEWG-Report-october2017.pdf (Accessed: 13 September 2018)
56 https://economictimes.indiatimes.com/news/economy/policy/government-readies-social-security-scheme-for-50-crore-workers/articleshow/63130835.cms (Accessed: 12 September 2018)
57 ISO. (2014). ISO 817: 2014 Refrigerants — Designation and safety classification.
58 IEC. (2018). IEC 60335-2-40 (2018) Safety of household and similar electrical appliances — Part 2-40: Particular requirements for electrical heat pumps, air-conditioners and dehumidifiers.
59 EN. (2016). EN378 (2016) - Refrigerating Systems & Heat Pumps-Safety & Environmental Requirements.
60 ASHRAE. (2015). Addenda Supplement to ANSI/ASHRAE Standard 34-2013, Designation and Safety Classification of Refrigerants.


IND
IA C
OO
LIN
G A
CT
ION
PL
AN
90


![Natural Draft Cooling Towers[1]](https://img.pdfslide.net/doc/110x75/577d26911a28ab4e1ea1924b/natural-draft-cooling-towers1.jpg)