Embed Size (px)
Citation preview
Draft
MAKANA MUNICIPALITY
INTEGRATED DEVELOPMENT PLAN
2018-2019
(i) FOREWORD:
This document constitutes the first review of the five year term of 2017/2022 Integrated
Development Plan (IDP). This IDP revision will provide Municipality with an opportunity to
reflect and devise innovative ways to improve service delivery. We continuously strive towards
a more Integrated planning approach whereby we seamlessly integrate our IDP, budget and
performance management system with one another while simultaneously aligning our planning
to National and Provincial plans and frameworks specifically the National Development Plan
2030 and Provincial Strategic Plan which sets out the Eastern Cape Government’s vision and
strategic priorities for their current term of office.
Our development priorities remain substantially the same as last terms of with some changes,
Priority Number remain Basic Service Delivery and Infrastructure Development with revised key
focus Service delivery improvement plan prioritising Water and Sanitation Infrastructure
development, maintenance of roads and refurbishment of electricity infrastructure. Community
and Social Development is priority number two with main focus are of clean city and waste
management also upgrading of infrastructure like fleet.
Priority three Local Economic Development and rural Development, with key focus areas like
radical socio economic transformation, job creation, SMME’ development, Heritage & Tourism
and Agriculture development
Priority four Institutional development and Financial Viability with revised special emphasis on Institutional Strengthening and Human Resources and Revenue Improvement Programme and Financial
Sustainability.
Priority number five is Good Governance and Public Participation with special emphasis on
Improve Stakeholders and community engagement and alignment to sector department. We
also need to place a strong emphasis on good governance, especially financial management,
performance management and compliance with laws and regulations. We are pleased to say
that our 2016/2017 Audit outcome was qualified and we need to improve this opinion and build
on this achievement.
Priority number six Human Settlement Management with understanding the function is not
mandate of the municipality, however we will ensure beneficiary administration is properly
managed and upgrading infill areas with intention FastTrack Township establishment.
The global and national economic recession has an impact on our Municipality and manifests in
poverty and an inability of many residents to pay municipal service charges. We have therefore
need to review our financial policies in a bid to ensure that we meet the basic needs of the
community and that our services are equitable and accessible.
We also need to focus on the economic development of our community, especially the creation
of an enabling environment for economic growth, Jobs and Development initiative.

Good municipal infrastructure, service delivery and clean governance are pre-requisites to
attracting investment and development within in our municipal area.
The Constitution places a developmental duty on Municipalities which requires us to structure
and manage our administration, budgeting and planning processes in a manner that gives
priority to the basic needs of the community whilst promoting social and economic
development.

(I) FOREWORD 2 (II) TABLE OF CONTENTS 4
(III) ACRONYMS AND ABBREVIATION 8 (IV) MUNICIPAL OVERVIEW 9 (V) MAKANA VISION AND MISSION AND CORE VALUES 11 CHAPTER ONE: PREPARATORY AND PLANNING PROCESS 12
1.1 Background 1.2 Legal Framework 1.3 Makana Five Year Integrated Development Plan 1.4 Mandate and Guide Parameters 1.5 Process Plan (2017/18) 1.6 Public Participation Strategy
CHAPTER TWO: SITUATIONAL ANALYSIS 37 2.1 Municipal Profile 2.2 Municipal Demographics 2.3 Socio Economic Dimensions and Analysis 2.4 Institutional Plan 2.5 Good Governance and Public Participation 2.6 Local Economic Development and Planning 2.7 Public Safety and Community Services 2.8 Basic Service Delivery & Infrastructure Planning 2.9 Basic Service Delivery Infrastructure High level Challenges 2.10 Financial Viability CHAPTER THREE: AGENDA 2022 STRATEGIC INTERVENTION 191
3.1 Makana Vision and Mission Statement 3.2 Core Values of the Municipality 3.3 Municipal Development Priorities 3.4 Development Goals and Objectives 3.5 IDP Project Register CHAPTER FOUR INTEGRATION 244
4.1 Introduction 4.2 Summary of Sector Plans 4.3 Performance Management- Institutional Level 4.4 Performance Management- Individual Level
MAPS
Map 1 : Makana Local Municipality
Map 2 : Makana Municipality within Sarah Baartman District Municipality
Map3 : Sarah Baartman District Municipality’s Spatial Location
Map 4 : Makana Spatial Development Framework
Map 5 : Makana Environmental Biodiversity
Map 6 : Makana Human Settlement
DIAGRAMS, CHARTS & GRAPHS
NO.1 : Municipal Core Values
NO.2 : Population Profile
NO.3 : % Population by Language
NO.4 : % Gender Population
NO.5 : Makana % Pyramid
NO.6 : % Population by age
NO.7 : Sarah Baartman Human Development Index
NO.8 : District Poverty Levels
NO.9 : Good Services Rendered
NO.10 : Makana 2016 Living Standards
NO.11 : Makana Employment Index
NO.12 : Makana Employment Growth
NO.13 : Informal Sector Employment Growth 1995- 2015
NO.14 : Fixed Capital Stock
NO.15 : Organisational Structure
NO.16 : Political Structure
NO.17 : Public & Community Participation Process
NO.18 : LED Capacity
TABLES
NO.1 : National Outcome NO.2 : SBDM Long Term Vision Strategy
NO.3 : SBDM Development Priorities NO.4 : Makana Development Priority Agenda
NO.5 : Development Planning Strategic
Framework Alignment
NO.6 : State of the Nation and Province
NO.7 : Summary of Provincial Budget
Allocation
NO.8 : MEC Comments Ratings
NO.9 : Roles and Responsibilities – Internal & External
NO.10 : Mechanism for Community & Stakeholder Participation
No11 Mechanism for Alignment No.12 Revised Time Schedule of Key
Deadlines for Current Financial Year
No.13 : IDP Mayoral Public Consultations No.14 : IDP Budget Road Shows
No.15 Review Session No.16 : Land Use Options per Land
Capabilities Class
No.17 : Land Capability in Makana No.18 : Population and area Km2- EC,
SBDM & Makana
No.19 : Demographics No.20 : Population Density
No.21 : Population by Gender No.22 : Population by Age
No.23 : Household Profile No.24 : Education profile
NO.25 : Makana Schools NO.26 : Educational Institution Attendance
No.27 : Education Levels No.28 : School Attendance
No.29 : Level of Education 20+ No.30 : Field of TVET
No.31 : Field of Higher Education No.32 : Level of Schooling
No.33 : Grant Dependency- District No.34 : Grant Dependency- Makana
No.35 : Crime Stats No.36 : Municipal Wide Challenges
No.37 : Rating of the Overall Quality
Service
No.38 Income Category
No.39 Individual Income per Ward No.40 Household income
No.41 Labour Force by ward No.42 Labour Status & Trends
No3.4 Employment – Formal / Informal No.44 Skills in Formal Employment
No.45 Sector Contribution to
employment in Makana & GVA
2015
No.46 Sectors with comparative
Advantage
No.47 Investment in Makana No.48 Powers and Functions
No.49 Organisational Structure No.50 Vacancy Rate Schedule
No.51 Staffing & Vacancy Rating No.52 Filled & Vacant Senior Management
Position
No.53 Speaker and Council No.54 Strategic Risk Confirmation
No.55 Proposed Road Maps No.56 Ward Clustering
No.57 Stakeholder consultation No.58 Audit Outcomes
No.59 Basis for Qualified Opinion No.60 Opinion Emphasis
No.61 Additional Matters No.62 Predetermined Objectives
No.63 Community Engagements by
wards
No.64 Stakeholder Register: NGO’s/ CBO’s
No.65 Public Participation Forums No.66 Makana Clinics and Hospitals
No.67 Community Facilities & Amenities No.68 Makana Police Stations
No.69 Access to Basic Services No.70 Free Basic Services
No.71 Blue Drop Status No.72 Green Drop Status
No.73 Road Infrastructure & Transport
Modes
No.74 Housing Provision: Roles and
Responsibilities
No.75 Housing Backlog No.76 Population Distribution
No.77 Informal Dwellings No.78 Backyard Shacks
No.79 Dwelling Types and Tenure Status No.80 Rhodes Student Numbers
No.81 Community By-Laws and Policies No.82 Comprehensive Infrastructure Plan
No.83 Budget Overview No.84 MTREF 2016- 17
No.85 Revenue Summary No.86 Operating Expenditure Summary
No.87 Capital Revenue and Expenditure No.88 Financial Policies
No.89 Six Municipal Development
Priorities
No.90 Integrated Development Plan
Register
No.91 Sector Plans Summary No.92 Human Resource Plan
No.93 Water Services Backlog No.94 Status of Supply
No.95 Cost of Eradicating Backlogs No.96 Strategy to Eradicate Backlogs
No.97 Situational Analysis Report No.98 The Vision Key Principles
No.99 Monitoring Reports No.100 Reporting Template
No.101 Annual Performance Report No.102 Performance Management Plan
No.103 Stakeholder Roles and
Responsibilities
No.104 Performance Review Template
No.105 Performance Rating Template No.106 Evaluation Template
No.107 The Rating Calculator

(III) ACRONYMS AND ABBREVIATIONS:
IDP Integrated Development Plan
Agric Agriculture
ASGISA Accelerated and Shares Growth Initiative for South Africa
CBP Community Based Planning
CDM Cacadu District Municipality
CDW Community Development Worker
CFO Chief Financial Officer
Cllr Councilor
EM Executive Mayor
MM Municipal Manager
CSS Community and Social Services
DBSA Development Bank South Africa
DEAET Department of Economic Affairs, Environmental and Tourism
DLGHTA Department Local Government, Housing and Traditional Affairs
DoSD Department Of Social Development
DPLG Department of Provincial and Local Government
DTIS Department of Technical and Infrastructure Services
DWAF Department of Water Affairs and Forestry
ECDC Eastern Cape Development Corporation
EHS Environmental Health Services
FM Financial Manager
GHT Grahamstown
GTZ German Technical Corporation
HASTI HIV and AIDS and Sexually Transmitted Infections
LSA Local Service Area
Makana LM Makana Local Municipality
MEC Member of the Executive Council
MMEC Member of Municipal Executive Committee
MIG Municipal Infrastructure Grant
MPCC Multi-Purpose Community Centre
Mun Municipality
NSDP National Spatial Development Plan
PGDP Provincial Growth and Development Plan
PHP People Housing Process
PMS Performance Management System
Rep Representative
SDBIP Service Delivery and Budget Implementation Plan
SDF Spatial Development Framework
WSDP Water Service Development Plan
WTW Water Treatment Works
WWTW Waste Water Treatment Works
AFF Asset Financing Fund
Opex Operation expenditure
Capex Capital Expenditure
MAPC Municipal Public Account Committee
CIP Comprehensive Infrastructure Plan
LED Local Economic Development
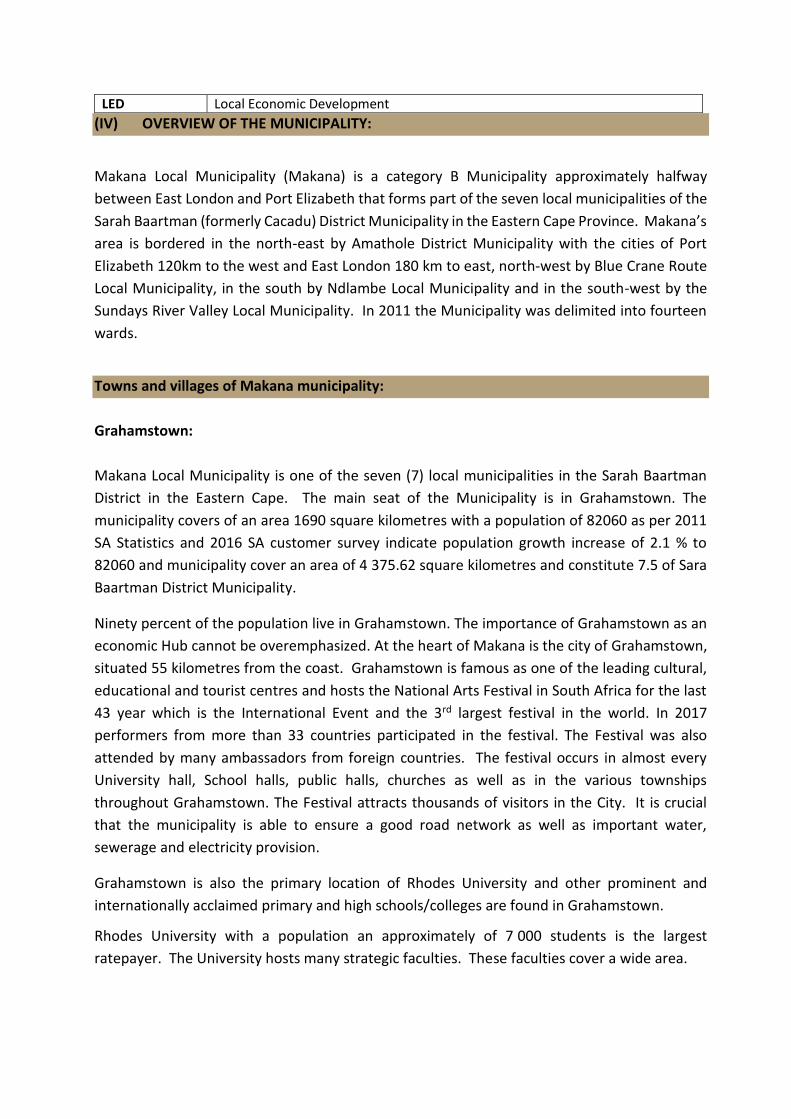
(IV) OVERVIEW OF THE MUNICIPALITY:
Makana Local Municipality (Makana) is a category B Municipality approximately halfway
between East London and Port Elizabeth that forms part of the seven local municipalities of the
Sarah Baartman (formerly Cacadu) District Municipality in the Eastern Cape Province. Makana’s
area is bordered in the north-east by Amathole District Municipality with the cities of Port
Elizabeth 120km to the west and East London 180 km to east, north-west by Blue Crane Route
Local Municipality, in the south by Ndlambe Local Municipality and in the south-west by the
Sundays River Valley Local Municipality. In 2011 the Municipality was delimited into fourteen
wards.
Towns and villages of Makana municipality:
Grahamstown:
Makana Local Municipality is one of the seven (7) local municipalities in the Sarah Baartman
District in the Eastern Cape. The main seat of the Municipality is in Grahamstown. The
municipality covers of an area 1690 square kilometres with a population of 82060 as per 2011
SA Statistics and 2016 SA customer survey indicate population growth increase of 2.1 % to
82060 and municipality cover an area of 4 375.62 square kilometres and constitute 7.5 of Sara
Baartman District Municipality.
Ninety percent of the population live in Grahamstown. The importance of Grahamstown as an
economic Hub cannot be overemphasized. At the heart of Makana is the city of Grahamstown,
situated 55 kilometres from the coast. Grahamstown is famous as one of the leading cultural,
educational and tourist centres and hosts the National Arts Festival in South Africa for the last
43 year which is the International Event and the 3rd largest festival in the world. In 2017
performers from more than 33 countries participated in the festival. The Festival was also
attended by many ambassadors from foreign countries. The festival occurs in almost every
University hall, School halls, public halls, churches as well as in the various townships
throughout Grahamstown. The Festival attracts thousands of visitors in the City. It is crucial
that the municipality is able to ensure a good road network as well as important water,
sewerage and electricity provision.
Grahamstown is also the primary location of Rhodes University and other prominent and
internationally acclaimed primary and high schools/colleges are found in Grahamstown.
Rhodes University with a population an approximately of 7 000 students is the largest
ratepayer. The University hosts many strategic faculties. These faculties cover a wide area.
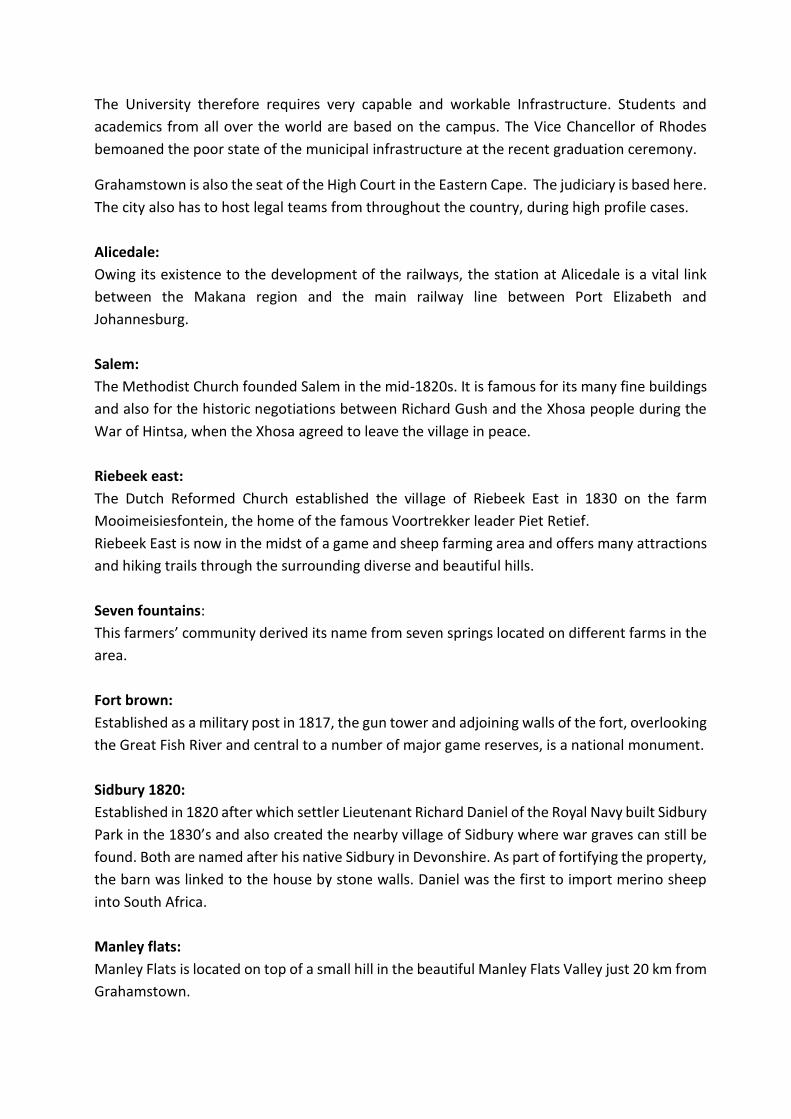
The University therefore requires very capable and workable Infrastructure. Students and
academics from all over the world are based on the campus. The Vice Chancellor of Rhodes
bemoaned the poor state of the municipal infrastructure at the recent graduation ceremony.
Grahamstown is also the seat of the High Court in the Eastern Cape. The judiciary is based here.
The city also has to host legal teams from throughout the country, during high profile cases.
Alicedale:
Owing its existence to the development of the railways, the station at Alicedale is a vital link
between the Makana region and the main railway line between Port Elizabeth and
Johannesburg.
Salem:
The Methodist Church founded Salem in the mid-1820s. It is famous for its many fine buildings
and also for the historic negotiations between Richard Gush and the Xhosa people during the
War of Hintsa, when the Xhosa agreed to leave the village in peace.
Riebeek east:
The Dutch Reformed Church established the village of Riebeek East in 1830 on the farm
Mooimeisiesfontein, the home of the famous Voortrekker leader Piet Retief.
Riebeek East is now in the midst of a game and sheep farming area and offers many attractions
and hiking trails through the surrounding diverse and beautiful hills.
Seven fountains:
This farmers’ community derived its name from seven springs located on different farms in the
area.
Fort brown:
Established as a military post in 1817, the gun tower and adjoining walls of the fort, overlooking
the Great Fish River and central to a number of major game reserves, is a national monument.
Sidbury 1820:
Established in 1820 after which settler Lieutenant Richard Daniel of the Royal Navy built Sidbury
Park in the 1830’s and also created the nearby village of Sidbury where war graves can still be
found. Both are named after his native Sidbury in Devonshire. As part of fortifying the property,
the barn was linked to the house by stone walls. Daniel was the first to import merino sheep
into South Africa.
Manley flats:
Manley Flats is located on top of a small hill in the beautiful Manley Flats Valley just 20 km from
Grahamstown.

Carlisle Bridge:
Carlisle Bridge is a small farm area that is found 15.2 Km from Riebeek East and 37 km to
Grahamstown.
(V) MAKANA VISION AND MISSION STATEMENT
“Makana Municipality strives to ensure sustainable, affordable, equitable and quality
services in a just, friendly, secure and healthy environment, which promotes social and
economic growth for all”.
CORE VALUES OF THE MUNICIPALITY:
Figure1
Value –Behaviour
Honest – Corrupt Free
Accountability - answerable for our actions
Participation Democracy- Ensure Maximum involvement of all stakeholders in all our activities
Transparency - open and communicate freely
Quality - committed to a culture in which we continuously strive for excellence
Professionalism - practice the highest standards applicable to our work and we embrace
humanity, discipline and respect
Map 1

CHAPTER ONE: PREPARATION AND PLANNING PROCESS:
The Makana local municipality’s is undergoing its first review of the five year Integrated
Development Plan (2017-2021)
1.1 BACKGROUND
The Municipal Systems Act (No. 32) of 2000 requires that Local Government Structures prepare
Integrated Development Plans (IDPs). The IDP serves as a tool for the facilitation and
management of development within the areas of jurisdiction. In conforming to the Act’s
requirements Makana Municipality’s Council has delegated the authority to the Municipal
Manager to prepare the IDP.
Makana Municipality’s commitment to developing a “Great Place to be” is driven with specific
emphasis of translating the Municipality’s strategies into an Implementable Action Plan. The
Municipality will be committed in ensuring that, its revised Developmental Priorities in the IDP
2017-22 are achieved.
1.2 LEGAL FRAMEWORK
This document represents the First review of Makana Municipality’s Integrated Development
Plan (IDP) 2017 –2022). IDP’s are compiled in terms of the requirements of Chapter 5 of the
Municipal Systems Act (MSA) (Act 32 of 2000), Section 25 of the MSA states inter-alia the
following:
Each municipal council must, within a prescribed period after the start of its elected term, adopt
a Single Inclusive and Strategic Plan for the development of the municipality which:
a) links, integrates and co-ordinate plans and takes into account proposals for the
development of the municipality;
b) aligns the resources and capacity of the municipality with the implementation of the
plan;
c) forms the policy framework and general basis on which annual budgets must be based;
d) complies with the provisions of the chapter ;and
e) be compatible with National and Provincial Development Plans and planning
requirements binding on the municipality in terms of legislation”.
The Annual Review and Amendments of Integrated Development Plan (IDP) a municipal council-
a) must review its IDP
(i) annually in accordance with an assessment of its performance
measurements in terms of section 41 of the MSA,
(ii) according to the extent that changing circumstances so demand; and
b) may amend its IDP in accordance with a prescribed process.
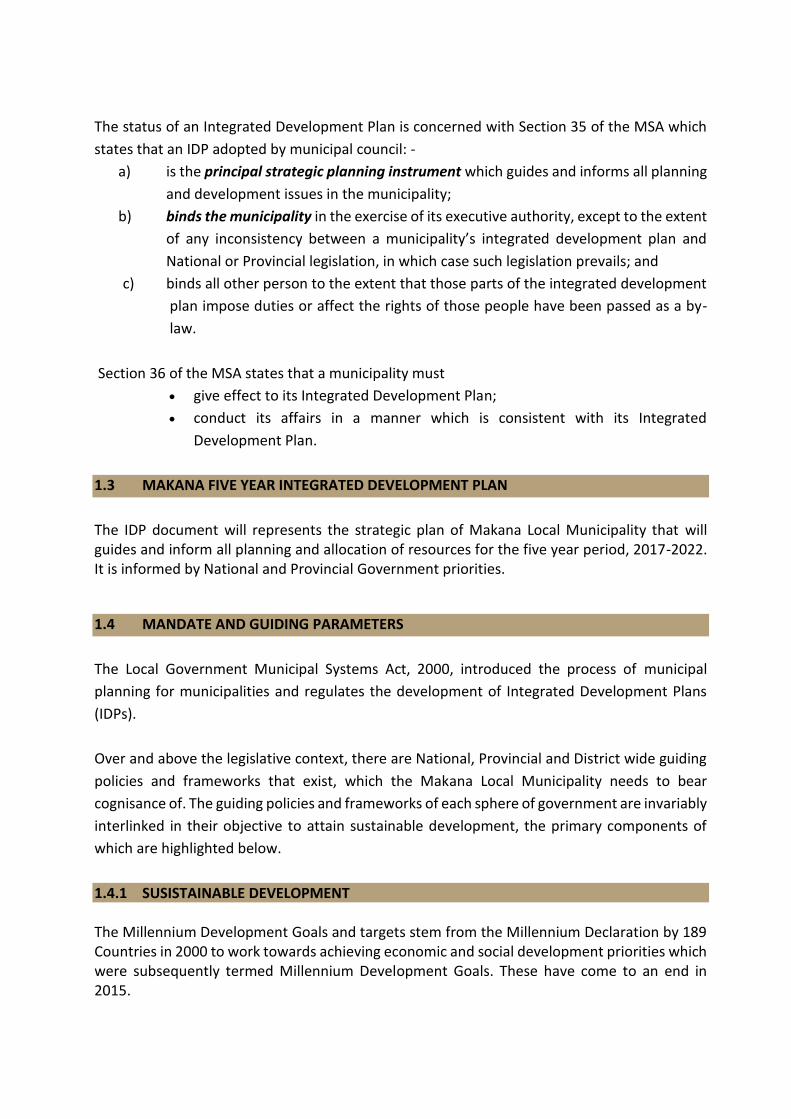
The status of an Integrated Development Plan is concerned with Section 35 of the MSA which
states that an IDP adopted by municipal council: -
a) is the principal strategic planning instrument which guides and informs all planning
and development issues in the municipality;
b) binds the municipality in the exercise of its executive authority, except to the extent
of any inconsistency between a municipality’s integrated development plan and
National or Provincial legislation, in which case such legislation prevails; and
c) binds all other person to the extent that those parts of the integrated development
plan impose duties or affect the rights of those people have been passed as a by-
law.
Section 36 of the MSA states that a municipality must
give effect to its Integrated Development Plan;
conduct its affairs in a manner which is consistent with its Integrated
Development Plan.
1.3 MAKANA FIVE YEAR INTEGRATED DEVELOPMENT PLAN
The IDP document will represents the strategic plan of Makana Local Municipality that will guides and inform all planning and allocation of resources for the five year period, 2017-2022. It is informed by National and Provincial Government priorities.
1.4 MANDATE AND GUIDING PARAMETERS
The Local Government Municipal Systems Act, 2000, introduced the process of municipal
planning for municipalities and regulates the development of Integrated Development Plans
(IDPs).
Over and above the legislative context, there are National, Provincial and District wide guiding
policies and frameworks that exist, which the Makana Local Municipality needs to bear
cognisance of. The guiding policies and frameworks of each sphere of government are invariably
interlinked in their objective to attain sustainable development, the primary components of
which are highlighted below.
1.4.1 SUSISTAINABLE DEVELOPMENT The Millennium Development Goals and targets stem from the Millennium Declaration by 189 Countries in 2000 to work towards achieving economic and social development priorities which were subsequently termed Millennium Development Goals. These have come to an end in 2015.
Seventeen sustainable development goals have been put together for the next fifteen years to 2030. South Africa is signatory to that agreement. The MDG’s have been embraced by Government and are aligned with the Medium Term Strategic Framework, which outlines national government development priorities. The Makana Local Municipality will consider the 17 sustainable development goals in its development agenda.
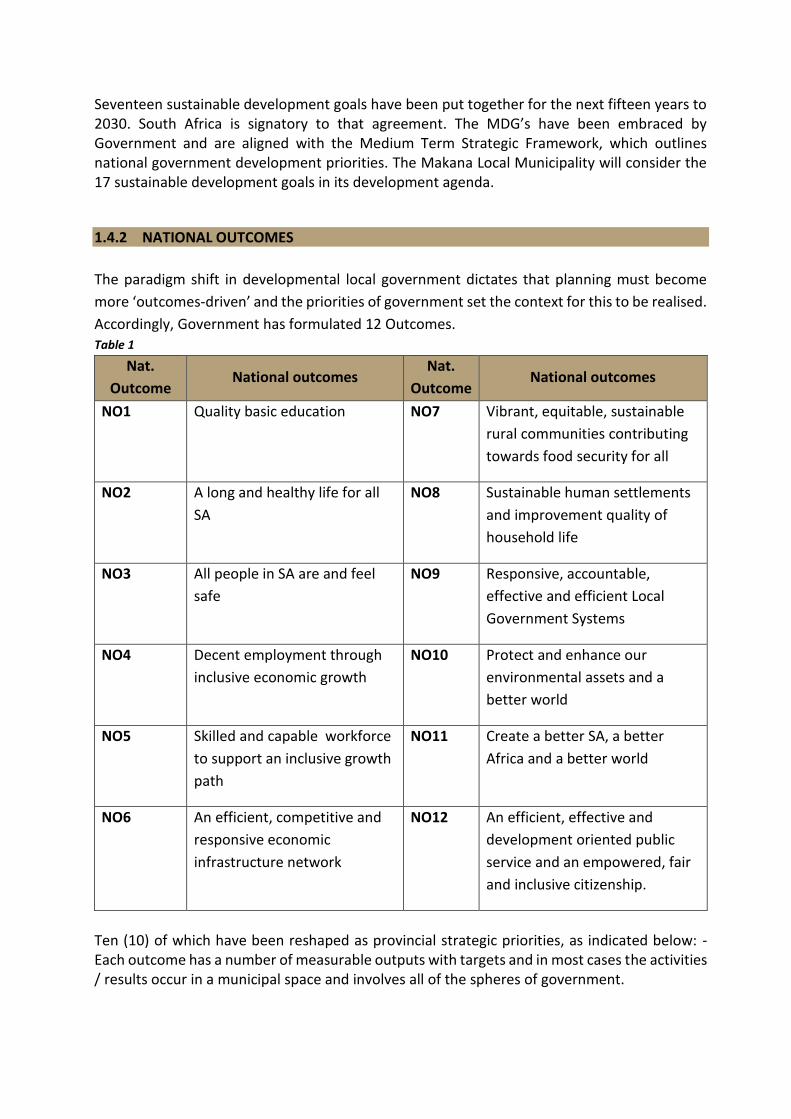
1.4.2 NATIONAL OUTCOMES
The paradigm shift in developmental local government dictates that planning must become
more ‘outcomes-driven’ and the priorities of government set the context for this to be realised.
Accordingly, Government has formulated 12 Outcomes. Table 1
Nat.
Outcome National outcomes
Nat.
Outcome National outcomes
NO1 Quality basic education NO7 Vibrant, equitable, sustainable
rural communities contributing
towards food security for all
NO2 A long and healthy life for all
SA
NO8 Sustainable human settlements
and improvement quality of
household life
NO3 All people in SA are and feel
safe
NO9 Responsive, accountable,
effective and efficient Local
Government Systems
NO4 Decent employment through
inclusive economic growth
NO10 Protect and enhance our
environmental assets and a
better world
NO5 Skilled and capable workforce
to support an inclusive growth
path
NO11 Create a better SA, a better
Africa and a better world
NO6 An efficient, competitive and
responsive economic
infrastructure network
NO12 An efficient, effective and
development oriented public
service and an empowered, fair
and inclusive citizenship.
Ten (10) of which have been reshaped as provincial strategic priorities, as indicated below: - Each outcome has a number of measurable outputs with targets and in most cases the activities / results occur in a municipal space and involves all of the spheres of government.

1.4.3 NATIONAL DEVELOPMENT PLAN
The National Development Plan sets out firm proposals to solve the country’s problems and to
deepen the engagement of all South Africans from all walks of life in building the future. Focus
on people’s capabilities is at the centre of the plan. These include education, skills, decent
accommodation, nutrition, safe communities, social security, transport, and job opportunities.
The National Development Plan goal is to reduce poverty, inequality and unemployment by 2030. The MTSF priorities which are regarded as Government’s five year implementation phase of the NDP are informed by the NDP following intervention areas,
Economy and Employment
Economic Infrastructure
Environmental Sustainability and Resilience
Improving Education Training and Innovation
Health Promotion
Inclusive Rural Economy
Human Settlements and Spatial Transformation
Social Protection
The National Development informs the fourteen (14) Medium Term Strategic Framework
priorities and is regarded as the five year implementation plan of the NDP. Provincial
Development Plan – Vision 2030 The PDP principles in a nutshell include social economic and
spatial justice; Gender Equality; Intergovernmental Equity; Citizens participation; promotes
ethical, integrated multi-agent action; Public good; Respects evidence and critical deliberations
and takes accountability seriously.
1.4.4 PROVINCE DEVELOPMENT PLAN
The Eastern Cape Province, guided by the NDP has developed its own long term vision, a
Provincial Development Plan. The PDP is aligned to the seven Provincial Strategic Priorities
which are: Transforming the economy to create jobs
Stimulating rural development, land reform and food security
Better access to Quality education
Promote Better healthcare for all our people
Intensifying the fight against crime
Integrated human settlements and
Strengthening the developmental state and good governance
Transformation of the economy to create jobs and sustainable livelihoods
The strategic priorities are aligned to the National Government’s Medium Term Strategic
Framework (2014 – 2019)

1.4.5 DISTRICT DEVELOPMENT INTERVENTION PRIORITY ISSUES Table 2
SARAH BAARTMAN LONG TERM VISION STRATEGY
Economic Development Human Development Infrastructure
Energy Mass Employment Programmes energy
Green Economy Poverty Eradication Programme Water
Agro-industry Access to basic services Irrigation and ago-logistics
Tourism Skills and education Transport
Creative industries
Bulk Infrastructure
Component supplies WSA/WSP
Maritime
Key Enabler and Interventions Programmes
Institutional Transformation - Governance
IDP Process alignment, consultation & incorporation
Table 3
DEVELOPMENT 2011/17 DEVELOPMENT PRIORITIES 2017-2022
Infrastructure Development Basic Service and Infrastructure Development
Economic Development Local Economic Development
Capacity Building and Support to Local Municipalities
Municipal Financial Viability and Management
Institutional Development Municipal Transformation and Organizational Development
Review the following functions: WSA/WSP Environmental Health Service Fire Services With the intent of the District delivering
the services directly
Community Services Governance and Public Participation
1.4.6 MAKANA DEVELOPMENT PRIORITIES/ AGENDA The Makana Municipality has adopted the Local Government Strategic Agenda Priorities as the
priorities that will achieve their respective visions.
This is in line with aligning IDP and Budget for MSCOA reporting and in response to the call to
President and Premier to be visible and active champions of the National Development Plan
with their offices being the catalytic agencies to drive implementation at Provincial and
Municipal levels. The five year IDP responds to the NDP, PDP, MTSF and Provincial Strategic
Priorities by identifying the development priorities listed below for the Makana Municipality
The combination of community planning with inter-spheres strategic planning will culminate in
local initiatives becoming central to provincial and national government programs that will
manifest in credible IDPs which are reflective of a developmental state.
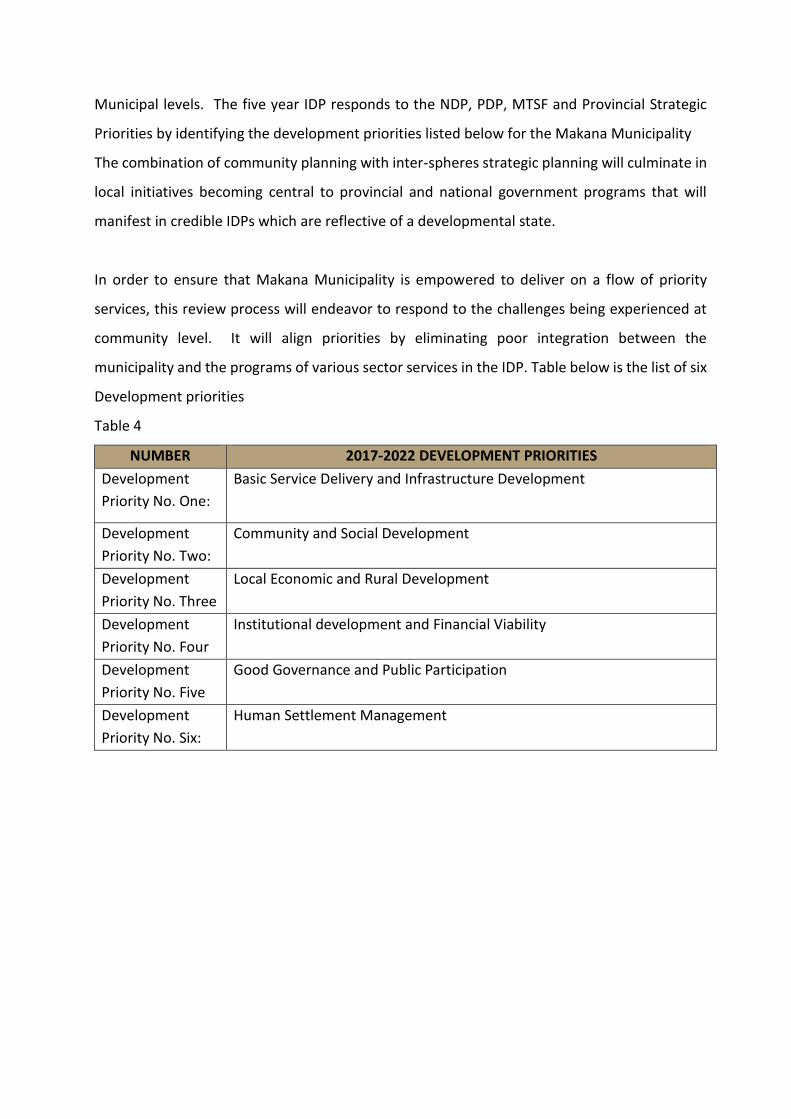
In order to ensure that Makana Municipality is empowered to deliver on a flow of priority
services, this review process will endeavor to respond to the challenges being experienced at
community level. It will align priorities by eliminating poor integration between the
municipality and the programs of various sector services in the IDP. Table below is the list of six
Development priorities
Table 4
NUMBER 2017-2022 DEVELOPMENT PRIORITIES
Development
Priority No. One:
Basic Service Delivery and Infrastructure Development
Development
Priority No. Two:
Community and Social Development
Development
Priority No. Three
Local Economic and Rural Development
Development
Priority No. Four
Institutional development and Financial Viability
Development
Priority No. Five
Good Governance and Public Participation
Development
Priority No. Six:
Human Settlement Management
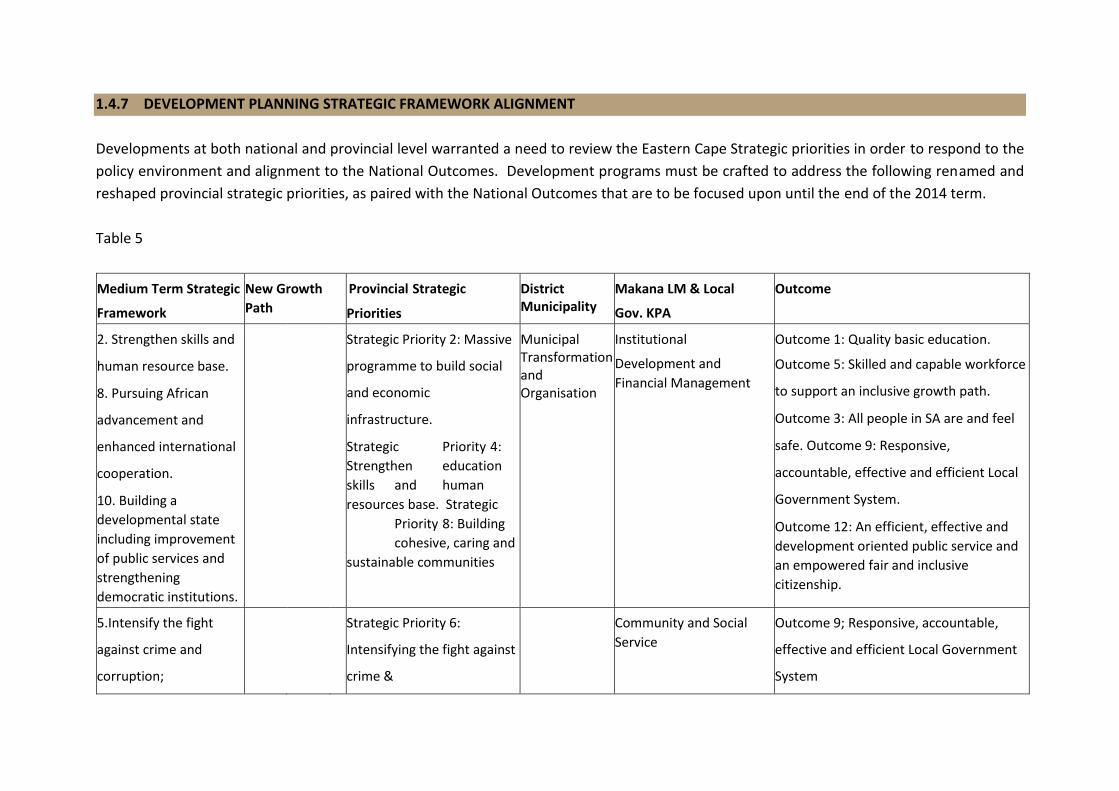
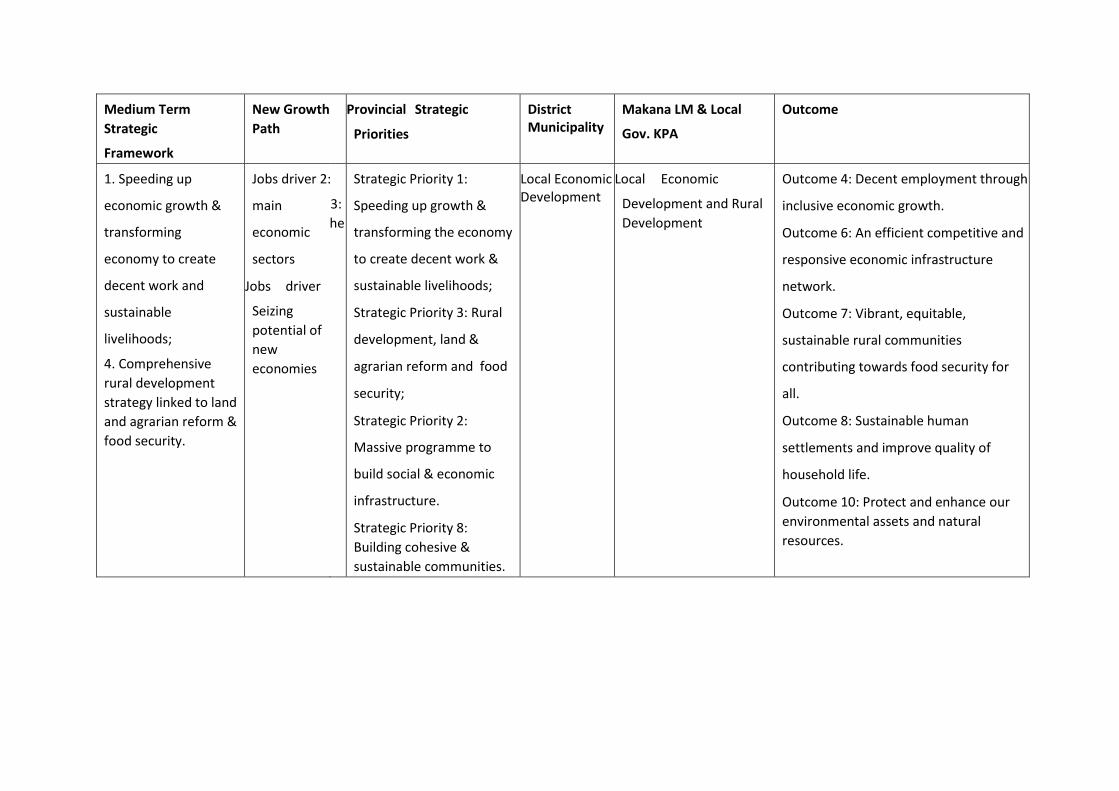
1.4.7 DEVELOPMENT PLANNING STRATEGIC FRAMEWORK ALIGNMENT
Developments at both national and provincial level warranted a need to review the Eastern Cape Strategic priorities in order to respond to the
policy environment and alignment to the National Outcomes. Development programs must be crafted to address the following renamed and
reshaped provincial strategic priorities, as paired with the National Outcomes that are to be focused upon until the end of the 2014 term.
Table 5
Medium Term Strategic
Framework
New Growth
Path
Provincial Strategic
Priorities
District Municipality
Makana LM & Local
Gov. KPA
Outcome
2. Strengthen skills and
human resource base.
8. Pursuing African
advancement and
enhanced international
cooperation.
10. Building a
developmental state
including improvement
of public services and
strengthening
democratic institutions.
Strategic Priority 2: Massive
programme to build social
and economic
infrastructure.
Strategic Priority 4:
Strengthen education
skills and human
resources base. Strategic
Priority 8: Building
cohesive, caring and
sustainable communities
Municipal Transformation and Organisation
Institutional
Development and
Financial Management
Outcome 1: Quality basic education.
Outcome 5: Skilled and capable workforce
to support an inclusive growth path.
Outcome 3: All people in SA are and feel
safe. Outcome 9: Responsive,
accountable, effective and efficient Local
Government System.
Outcome 12: An efficient, effective and
development oriented public service and
an empowered fair and inclusive
citizenship.
5.Intensify the fight
against crime and
corruption;
Strategic Priority 6:
Intensifying the fight against
crime &
Community and Social
Service
Outcome 9; Responsive, accountable,
effective and efficient Local Government
System
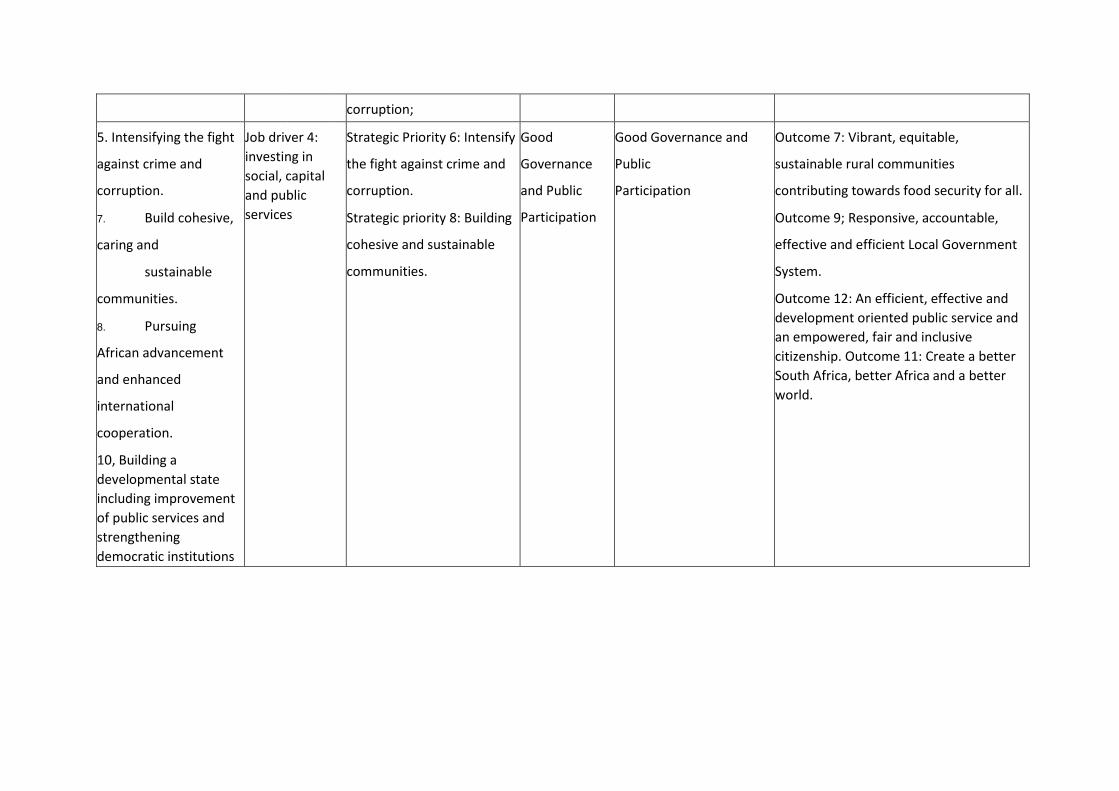
corruption;
5. Intensifying the fight
against crime and
corruption.
7. Build cohesive,
caring and
sustainable
communities.
8. Pursuing
African advancement
and enhanced
international
cooperation.
10, Building a
developmental state
including improvement
of public services and
strengthening
democratic institutions
Job driver 4:
investing in
social, capital
and public
services
Strategic Priority 6: Intensify
the fight against crime and
corruption.
Strategic priority 8: Building
cohesive and sustainable
communities.
Good
Governance
and Public
Participation
Good Governance and
Public
Participation
Outcome 7: Vibrant, equitable,
sustainable rural communities
contributing towards food security for all.
Outcome 9; Responsive, accountable,
effective and efficient Local Government
System.
Outcome 12: An efficient, effective and
development oriented public service and
an empowered, fair and inclusive
citizenship. Outcome 11: Create a better
South Africa, better Africa and a better
world.
Medium Term
Strategic
Framework
New Growth
Path
Provincial Strategic
Priorities
District Municipality
Makana LM & Local
Gov. KPA
Outcome
1. Speeding up
economic growth &
transforming
economy to create
decent work and
sustainable
livelihoods;
4. Comprehensive
rural development
strategy linked to land
and agrarian reform &
food security.
Jobs driver 2:
main
economic
sectors
Jobs driver
Seizing
potential of
new
economies
3:
the
Strategic Priority 1:
Speeding up growth &
transforming the economy
to create decent work &
sustainable livelihoods;
Strategic Priority 3: Rural
development, land &
agrarian reform and food
security;
Strategic Priority 2:
Massive programme to
build social & economic
infrastructure.
Strategic Priority 8:
Building cohesive &
sustainable communities.
Local Economic Development
Local Economic
Development and Rural
Development
Outcome 4: Decent employment through
inclusive economic growth.
Outcome 6: An efficient competitive and
responsive economic infrastructure
network.
Outcome 7: Vibrant, equitable,
sustainable rural communities
contributing towards food security for
all.
Outcome 8: Sustainable human
settlements and improve quality of
household life.
Outcome 10: Protect and enhance our
environmental assets and natural
resources.
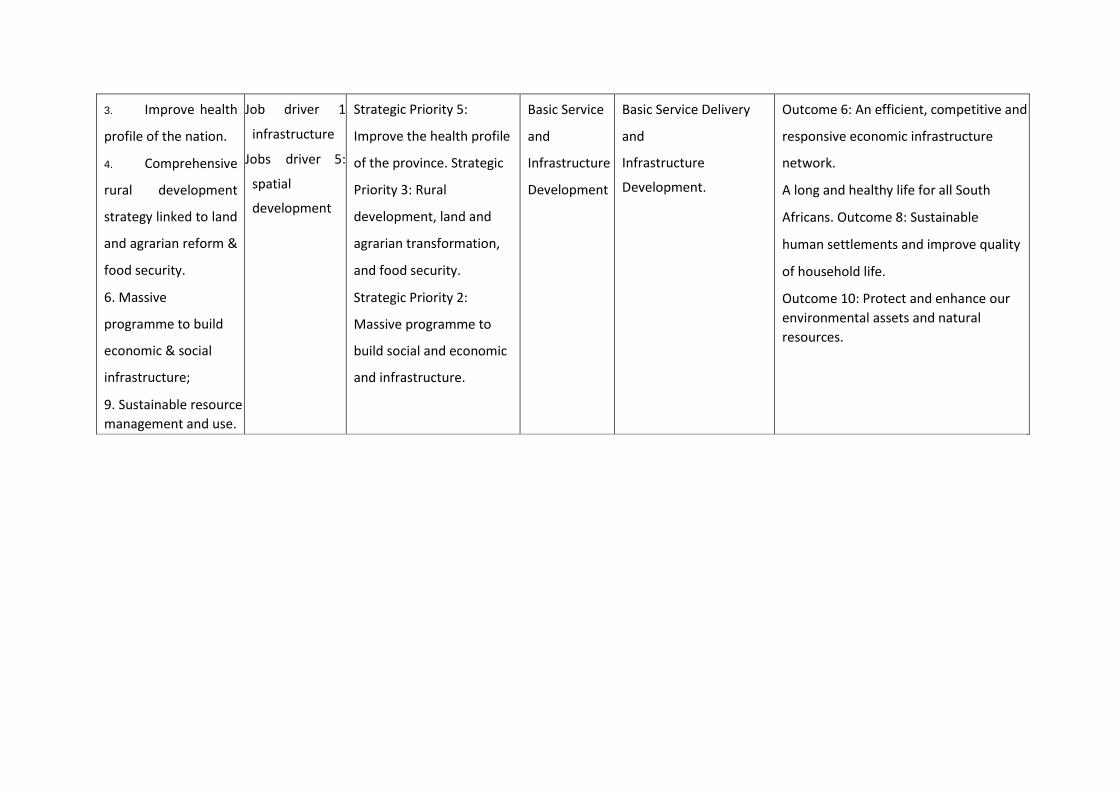
3. Improve health
profile of the nation.
4. Comprehensive
rural development
strategy linked to land
and agrarian reform &
food security.
6. Massive
programme to build
economic & social
infrastructure;
9. Sustainable resource
management and use.
Job driver 1
infrastructure
Jobs driver 5:
spatial
development
Strategic Priority 5:
Improve the health profile
of the province. Strategic
Priority 3: Rural
development, land and
agrarian transformation,
and food security.
Strategic Priority 2:
Massive programme to
build social and economic
and infrastructure.
Basic Service
and
Infrastructure
Development
Basic Service Delivery
and
Infrastructure
Development.
Outcome 6: An efficient, competitive and
responsive economic infrastructure
network.
A long and healthy life for all South
Africans. Outcome 8: Sustainable
human settlements and improve quality
of household life.
Outcome 10: Protect and enhance our
environmental assets and natural
resources.
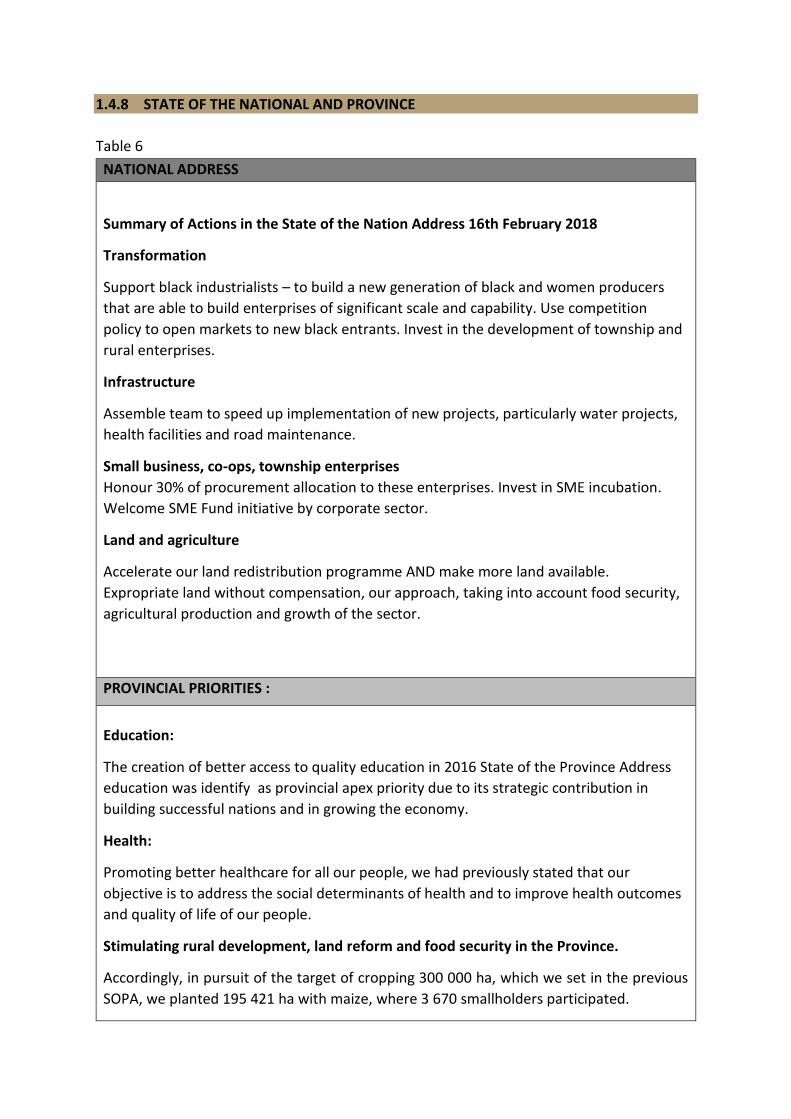
1.4.8 STATE OF THE NATIONAL AND PROVINCE
Table 6
NATIONAL ADDRESS
Summary of Actions in the State of the Nation Address 16th February 2018
Transformation
Support black industrialists – to build a new generation of black and women producers
that are able to build enterprises of significant scale and capability. Use competition
policy to open markets to new black entrants. Invest in the development of township and
rural enterprises.
Infrastructure
Assemble team to speed up implementation of new projects, particularly water projects,
health facilities and road maintenance.
Small business, co-ops, township enterprises
Honour 30% of procurement allocation to these enterprises. Invest in SME incubation.
Welcome SME Fund initiative by corporate sector.
Land and agriculture
Accelerate our land redistribution programme AND make more land available.
Expropriate land without compensation, our approach, taking into account food security,
agricultural production and growth of the sector.
PROVINCIAL PRIORITIES :
Education:
The creation of better access to quality education in 2016 State of the Province Address
education was identify as provincial apex priority due to its strategic contribution in
building successful nations and in growing the economy.
Health:
Promoting better healthcare for all our people, we had previously stated that our
objective is to address the social determinants of health and to improve health outcomes
and quality of life of our people.
Stimulating rural development, land reform and food security in the Province.
Accordingly, in pursuit of the target of cropping 300 000 ha, which we set in the previous
SOPA, we planted 195 421 ha with maize, where 3 670 smallholders participated.

For the current season, 15 000 ha have been ploughed, and other inputs have been
procured to the value of R91.6 million. Furthermore, a total of 3 409 households were
supported with seedlings, garden equipment and water harvesting facilities
Transformation of the economy to create jobs and sustainable livelihoods
Through our economic agencies such as COEGA IDZ, East London IDZ and the ECDC, we
have added a total of 12 740 new jobs in the areas of manufacturing, logistics, alternative
energy and agro-processing. In agro- processing, through the work done by our IDZs, a total
of 2 035 operational jobs and 1 188 construction jobs have been created. As part of the
social safety net a total of 98 185 job opportunities were created in the Expanded Public
Works Programme. Through the community works programme, we created 37 346 jobs,
with women being the most beneficiaries.
Roads are a critical enabler to access and mobility.
Slowly but surely, our roads infrastructure is improving. I am sure all of you can attest to
the fact that everywhere you go in the Province there are road works
Through our collaboration with SANRAL, we are continuing to upgrade provincial and
national roads within the province.
Strengthening the developmental state and good governance.
It has been sixteen years since the establishment of wall to wall developmental local
government in South Africa, which among other things, was intended to bring government
closer to the people. On the whole, the system of local government in the Province has
been fairly stable since its establishment. Of course there have been challenges which we
have had to respond to through a myriad of programmes and special interventions.
Through the Back to Basics Programme, we are providing hands-on support to
municipalities throughout the Province. We are also rolling out War Rooms in all wards in
order to promote citizen participation in planning and 20 | Page 2016 State of the Province
Address programme implementation. As we speak, the Chris Hani district has been leading
in the rolling out of these War Rooms at ward level, with 112 of them established and
functional.
Integrated human settlements:
This remains a key focus of Government as we move towards a society characteristic of a
better life for all. At the Congress of the People, back in 1955 in Kliptown, we said, that
“there shall be houses for all.” Accordingly, we are continuing with our programme of
providing sustainable human settlements for our people. Among other things, as part of a
national drive to promote home ownership, 2 954 title deeds have been issued. Similarly,
eighteen informal settlements have been upgraded. 2016 State of the Province Address
Page | 23 For the current financial year we had planned to build 13 100 quality housing
units, service 10 231 sites and rectify 2 311 units. Up to 97% of the targeted housing units
were delivered, and we have surpassed the targets for site servicing and rectification.

Building of cohesive communities and nation building.
Putting first the welfare and future of the people of the Province remains a top priority in
the government. In 2016 State of the Province Address has identified harsh economic
times, the poor were the most affected. The poor were the prime victims in the crisis that
they did not cause and are unable to resolve.
1.4.8 PROVINCE BUDGET FRAMEWORK
1.4.8.1 BUDGET FRAMEWORK:
Honourable Members, the Eastern Cape Provincial Government finances its budget through
National Transfers (Provincial Equitable Share and Conditional Grants) and Provincial Own
Receipts. The projected receipts for the 2018/19 financial year are R78.177 billion and
R249.146 billion over the 2018 MTEF period. The 2018/19 financial year provincial receipt
consist of:
Equitable Share of R 65.499 billion which accounts for 83.8 % of provincial receipts,
Conditional Grant 11.263 billion which accounts for 14.4 % , and
The Provincial Own Receipts of R1.414 billion which accounts for 1 %.
1.4.8.2 HUMAN SETTLEMENTS
An amount of R 7.497 billion is allocated in 2018/19 to the Department of Human Settlements
and R 2.376 billion over the MTEF to continue building adequate housing for our people in
line with the Freedom Charter principle which states that “There Shall be Houses, Security
and Comfort”.
ALLOCATION AMOUNT
New houses units 8950 units
Rural Intervention R902.578t
Informal Settlement Development and
Upgrading
R 363. 649
Title Deeds Restoration R 65.583

1.4.8.3 SOCIAL DEVELOPMENT
A total amount of R 9.114 billion has been allocated to the department of Social Development
over the 2018 MTEF, of which R2.836 billion for 2018/19
ALLOCATION AMOUNT
Provision of Social Welfare Service to
communities
R 1.124 Billion
Violence Against Women and Children R 27.998 million
Frail Care Person R 126.721million
Service to Older Person R 86.170 million
Service to Person with Disabilities R 30.315 million
Early Childhood Development and Partial
Care
R 272.483 million
Youth Development R 2.385 million
Women Empower R2.624 million
Institutional Capacity Building R 12 million
1.4.8.4 HEALTH
A total of R75.966 billion has been allocated to the Department of health over the 2018 MTEF
of which R 23.699 billion
ALLOCATION AMOUNT
Health Infrastructure R 1.585 billion
Comprehensive HIV/AIDS and TB R 2.098 billion
Training and Development R 885.346

Tertiary and Specialised Hospital Services R 3.447
National Health Laboratory Services for
blood testing
R 746.747 million
Medicine R 1.956 billion
Medical Supplies encompassing blood
products and medical implants
R 740.572
Emergency Medical Services R 1.284
Priority Hospital R 678.060
EDUCATION
ALLOCATION AMOUNT
1. Public Ordinary School
Universalization of early Childhood Development ( ECD)
Inclusive Education Public Schools
Independent schools
Educator Post Provisioning Norm (PPN)
Teacher Development
Learner Attainment Improvement strategy (LAIS)
Learner Teacher support Material (LTSM) and School furniture
School Furniture
Maths, Science and Technology (MSTE) grant
Education infrastructure
National School Nutrition Programme (NSNP)
HIV and Aids ( Life Skills Education)
R6.345 billion R2.5 billion R2 577 billion R415.308 million R82.917 billion R752.087 R80 million and R255 million R2.297 billion R692.748 million R46.805 million R4.433 billion R3.862 billion R136.395 million
TRANSPORT
2. Public transport
School transport
Law enforcement on provincial roads
Roads Infrastructure
R502.128 million R504.531 million R308.777 million R2.184 billion
RURAL DEVELOPMENT AND AGRAIAN REFORM
3. Food Security
Veterinary Services
Agricultural infrastructure
Magwa Business Rescue
R165.290 million R901.384 million1 211.597 million R53.313 million

COOPERATIVE GOVERNANCE AND TRADTIONAL AFFAIRS
4. Municipal Support R242.475 million
PUBLIC WORKS
5. Expanded Public works programme R95.511 million
Public works infrastructure R1.667 billion
ECONOMIC DEVELOPMENT, ENVIRONMENT AFFAIRS & TOURISM
Economic Development and Tourism R591.542 million
Eastern cape Liquor Board R59.541 million
Local and Regional Economic Development
R21.001 million
Eastern cape Development Cooperation (ECDC)
R12.600 million
Coega Development Cooperation R94.947million
1.5 PROCESS PLAN (2017/18 CYCLE)
Council formulated and adopted an IDP Process Plan in August 2017 to serve as guide in
preparation for the review of the Integrated Development Plan. In brief the IDP Process Plan
outlines the time frames of scheduled events / activities, and co-ordinate structures involved
in the processes.
The Integrated Development Planning (IDP) Process is a process through which Municipalities
prepare strategic development plans for a five year period. An IDP is one of the key tools for
Local Government to cope with its developmental role and seek to arrive at decisions on
issues such as municipal budget, land management, promotion of local economic
development and institutional transformation in a consultative manner.
1.5.1 OBJECTIVE OF THE IDP REVIEW PROCESS PLAN
Makana Municipality wants to continue to develop its IDP as an effective management tool
for the municipality, this includes:
Creating a greater level of focus and thereby improving on the strategic nature of the
document.
Aligning this strategic document with the realities of the resources available i.e.
financial and human,
Alignment of the IDP with the activities of the Sector Departments and other service
providers (vice versa) and
Alignment of the IDP with the various sector plans.
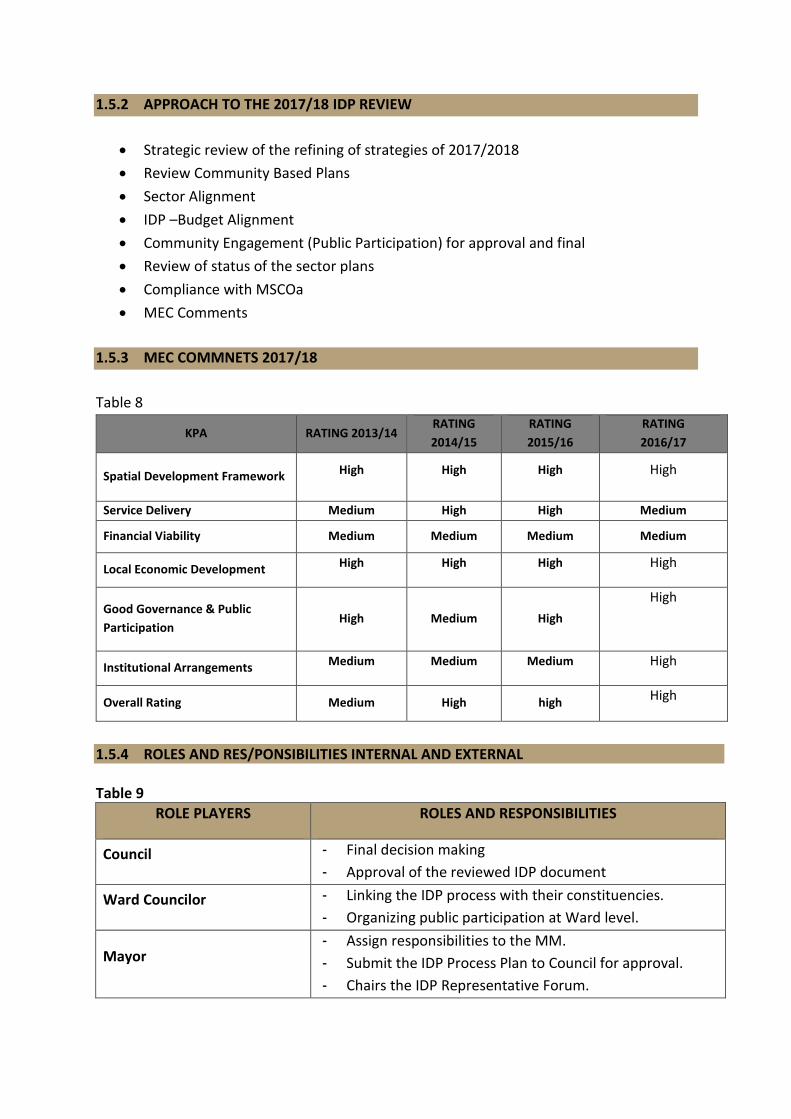
1.5.2 APPROACH TO THE 2017/18 IDP REVIEW
Strategic review of the refining of strategies of 2017/2018
Review Community Based Plans
Sector Alignment
IDP –Budget Alignment
Community Engagement (Public Participation) for approval and final
Review of status of the sector plans
Compliance with MSCOa
MEC Comments
1.5.3 MEC COMMNETS 2017/18
Table 8
KPA RATING 2013/14 RATING
2014/15
RATING
2015/16
RATING
2016/17
Spatial Development Framework High High High High
Service Delivery Medium High High Medium
Financial Viability Medium Medium Medium Medium
Local Economic Development High High High High
Good Governance & Public
Participation High Medium High
High
Institutional Arrangements Medium Medium Medium High
Overall Rating Medium High high High
1.5.4 ROLES AND RES/PONSIBILITIES INTERNAL AND EXTERNAL Table 9
ROLE PLAYERS ROLES AND RESPONSIBILITIES
Council - Final decision making
- Approval of the reviewed IDP document
Ward Councilor - Linking the IDP process with their constituencies.
- Organizing public participation at Ward level.
Mayor - Assign responsibilities to the MM.
- Submit the IDP Process Plan to Council for approval.
- Chairs the IDP Representative Forum.

ROLE PLAYERS ROLES AND RESPONSIBILITIES
Municipal Manager
- Prepare IDP process plan.
- Ensures that timeframes are adhered to.
- Decide on and monitor IDP process.
- Overall management and co-ordination.
Chief financial Officer
- Prepare Budget
- Advice on availability of financial resources
- Alignment of IDP and Budget
- Input on the Development of SDBIP
Mayoral Committee
- Helps to harness common understanding between
political and administrative components before the IDP
reports are considered at Council meeting.
- Makes recommendations to the IDP Representative
Forum.
IDP Manager
- Day to day management of the IDP process.
- Co-ordinate technical or sector expertise.
- Co-ordinate Sector plan inputs
- Prepare draft progress reports.
IDP Steering Committee
- Assist and support the Municipal Manager/IDP Manager
and IDP Representative Forum.
- Information “GAP” identification.
- Oversee the alignment of the planning process internally
with those of the Local Municipality areas.
- Portfolio head to lead related Portfolio matters
- Monitor the Process plan progress
- Plan Public Participation Engagement
- Alignment of IDP and Budget
- Plan stakeholder Engagement
- Integration with Sector departments
The District Council
- Co-ordination role with all Local Municipalities within the
District.
- Ensuring horizontal and vertical alignment of the IDPs of
the Municipalities in the District Council area.
- Facilitation of vertical alignment of IDPs with other
spheres of Government and Sector Departments.
- Provide events for joint strategy workshops with Local
municipalities, Provincial and National role players and
other subject matter specialist.
ROLE PLAYERS ROLES AND RESPONSIBILITIES
Ward Committees To be consulted on an individual or collective basis to establish community needs and reach consensus on IDP Projects/ Initiatives and Priorities.
IDP Representative Forum Representing public interest and contributing knowledge and ideas.
Government Departments, Parastatals and NGO’s
Provide data and information.
Budget information
Alignment of budget with the IDP
Provide professional and technical support.
To assist in facilitating the Community Based Planning (CBP)
DBSA Planning Expert and Sarah Baartman DM
Methodology guidance and professional support in: - Strategic and Town Planning - Sector Plan Inputs - IDP Document preparation. - Alignment with National, Provincial and SBDM
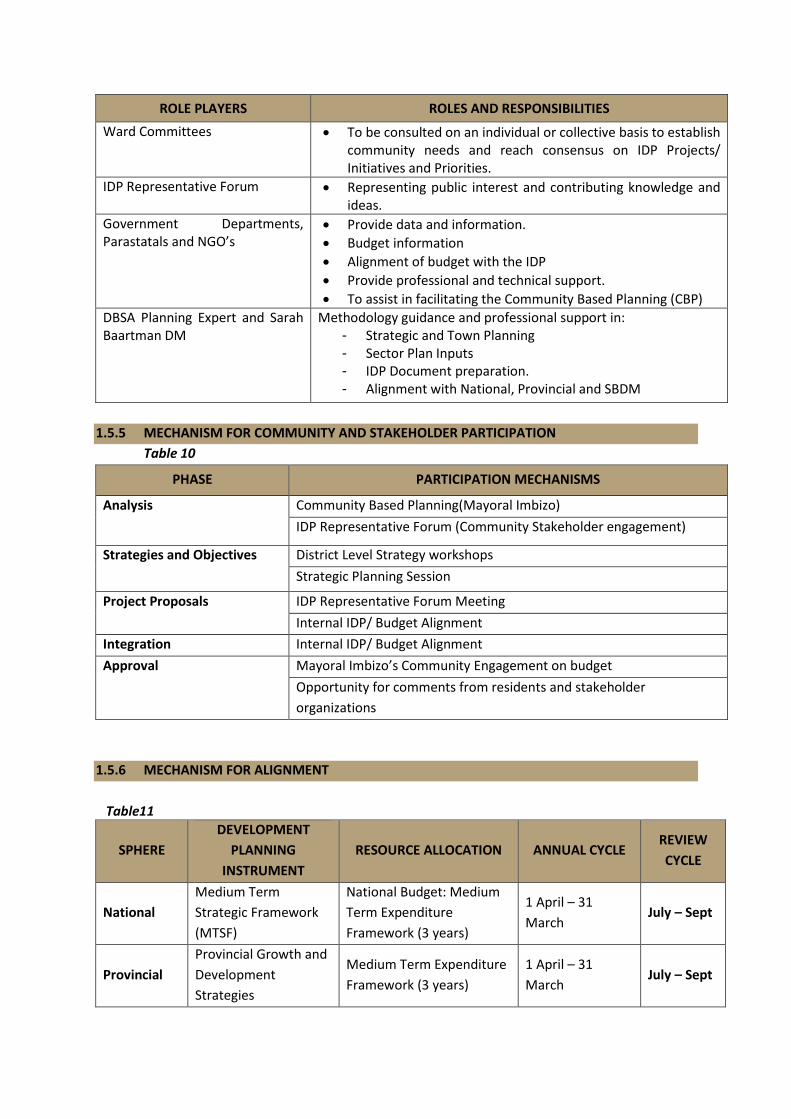
1.5.5 MECHANISM FOR COMMUNITY AND STAKEHOLDER PARTICIPATION
Table 10
PHASE PARTICIPATION MECHANISMS
Analysis Community Based Planning(Mayoral Imbizo)
IDP Representative Forum (Community Stakeholder engagement)
Strategies and Objectives District Level Strategy workshops
Strategic Planning Session
Project Proposals IDP Representative Forum Meeting
Internal IDP/ Budget Alignment
Integration Internal IDP/ Budget Alignment
Approval Mayoral Imbizo’s Community Engagement on budget
Opportunity for comments from residents and stakeholder
organizations
1.5.6 MECHANISM FOR ALIGNMENT
Table11
SPHERE
DEVELOPMENT
PLANNING
INSTRUMENT
RESOURCE ALLOCATION ANNUAL CYCLE REVIEW
CYCLE
National
Medium Term
Strategic Framework
(MTSF)
National Budget: Medium
Term Expenditure
Framework (3 years)
1 April – 31
March July – Sept
Provincial
Provincial Growth and
Development
Strategies
Medium Term Expenditure
Framework (3 years)
1 April – 31
March July – Sept

Sector Strategic Plans for
sector departments MTREF (3 years)
1 April – 31
March July – Sept
Local/
Rhodes
University
Integrated
Development Plan
Municipal Budget
(5 year plan) 1 July -30 June Sept – Feb
1.5.7 REVISED TIME SCHEDULE OF KEY DEADLINES FOR 2017/2018
Table 12
ORIGINAL
COMPLETION DATE ACTIVITY TIME FRAMES
IDP and Budget
Preparation of an IDP / Budget Timetable August 2017
Co-ordination role of the budget process through preparation and completion of the process plan
September 2017
Tabling of the Timelines to Council
Submission of the Timelines to Provincial Treasury
Beginning of Annual Report Preparation Process.
Submission of the Budget Checklist
Preparation of the budget related Policies
Review of IDP and Budget processes and develop improvements.
October 2017
IDP/Budget
Determine the funding/ revenue projections for the next three years.
CFO to liaise with Council regarding the strategic objectives for service delivery and development for the next three years
The Executive Mayor to determine the strategic objectives for service delivery and development for the next three years (IDP reviews)
A budgeting workshop will be held to clarify budgetary requirements and discussing the budgeting tool.
November 2017
Budget
Preparation of the draft budget by the various departments.
Directors to meet with their HOD’s and any relevant staff members to discuss draft capital / operational budget to ensure that anticipated expenditure meets parameters set out by National / Provincial Government.
NOVEMEBR 2017
Budget
Budget plans, capital / operational budget and all related items to have been consolidated (based on the budget inputs submitted by Departments).
December/Janury 2017
ORIGINAL
COMPLETION DATE ACTIVITY TIME FRAMES
Budget and PMS Mid- year budget and performance assessment visits
January 2018
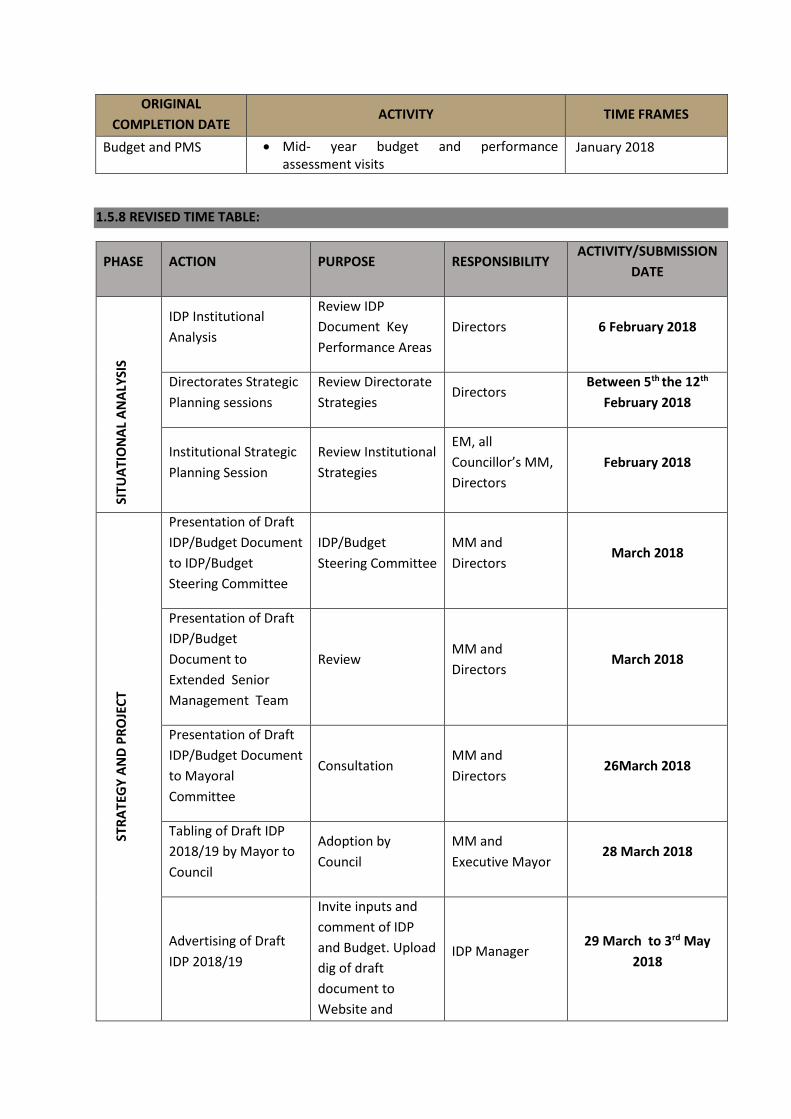
1.5.8 REVISED TIME TABLE:
PHASE ACTION PURPOSE RESPONSIBILITY ACTIVITY/SUBMISSION
DATE
SITU
ATI
ON
AL
AN
ALY
SIS
IDP Institutional
Analysis
Review IDP
Document Key
Performance Areas
Directors 6 February 2018
Directorates Strategic
Planning sessions
Review Directorate
Strategies Directors
Between 5th the 12th
February 2018
Institutional Strategic
Planning Session
Review Institutional
Strategies
EM, all
Councillor’s MM,
Directors
February 2018
STR
AT
EGY
AN
D P
RO
JEC
T
Presentation of Draft
IDP/Budget Document
to IDP/Budget
Steering Committee
IDP/Budget
Steering Committee
MM and
Directors March 2018
Presentation of Draft
IDP/Budget
Document to
Extended Senior
Management Team
Review MM and
Directors March 2018
Presentation of Draft
IDP/Budget Document
to Mayoral
Committee
Consultation MM and
Directors 26March 2018
Tabling of Draft IDP
2018/19 by Mayor to
Council
Adoption by
Council
MM and
Executive Mayor 28 March 2018
Advertising of Draft
IDP 2018/19
Invite inputs and
comment of IDP
and Budget. Upload
dig of draft
document to
Website and
IDP Manager 29 March to 3rd May
2018

publicise
IDP/Budget road
shows
Presentation of Draft
IDP/Budget Document
to Councillors
Consultation MM and
Directors April 2018
Presentation of Draft
IDP/Budget Document
to IDP Representative
Forum
Consultation MM and
Directors April 2018
IDP/Budget Road
Show Consultation
MM and
Directors April/May 2018
Presentation of Final
IDP/Budget Document
Council
Approval MM and
Directors 31 May 2018

1.6 PUBLIC PARTICIPATION STRATEGY AND PROCEDURE
Our public participation strategy is based on the definition of a Municipality as contained in the Section
2 of the Municipal Systems Act that states that a municipality consists of:
The political structures of the
municipality (Council).
The administration of the
municipality.
The community of the
municipality.
A municipality functions in its area in accordance with the political, statutory and other relationships
between its political structures, political office bearers, administration and its community. This
relationship can be depicted as follows:
Our public participation mechanisms comprise;
* Sector engagements
* Ward Public meetings
* IDP Representative Forums
* Ward Committee Meetings
The objective of the public participation process to solicit inputs for the 201/2022 IDP review. The
Municipality established the following mechanisms to facilitate public participation;
1.6.1 SECTOR ENGAGEMENTS
In a bid to enhance the quality our public participation outcomes, we divided the Municipal Area
(Community Circle in figure above) into 14 sectors and have commenced with individual sector
engagements with registered stakeholders in each sector.
Sector engagements take the form of on-going two way dialogues between and amongst sector
representatives and the Municipality and are proving to be very effective as they focus on issues as
well as ways and means of resolving issues jointly. They also enable the Municipality to solicit more
detailed inputs than it is possible to do in public meetings.
1.6.2 WARD PUBLIC MEETINGS
In terms of the approved Time Schedule of Key Deadlines, two series of Ward Public Meetings are
convened as part of the IDP revision / budget process. The first series of meetings was held in
November 2017 and was aimed at the review and re-prioritisation of needs by the communities the
IDP Mayoral Imbizo Consultation. The meetings were scheduled as follows:
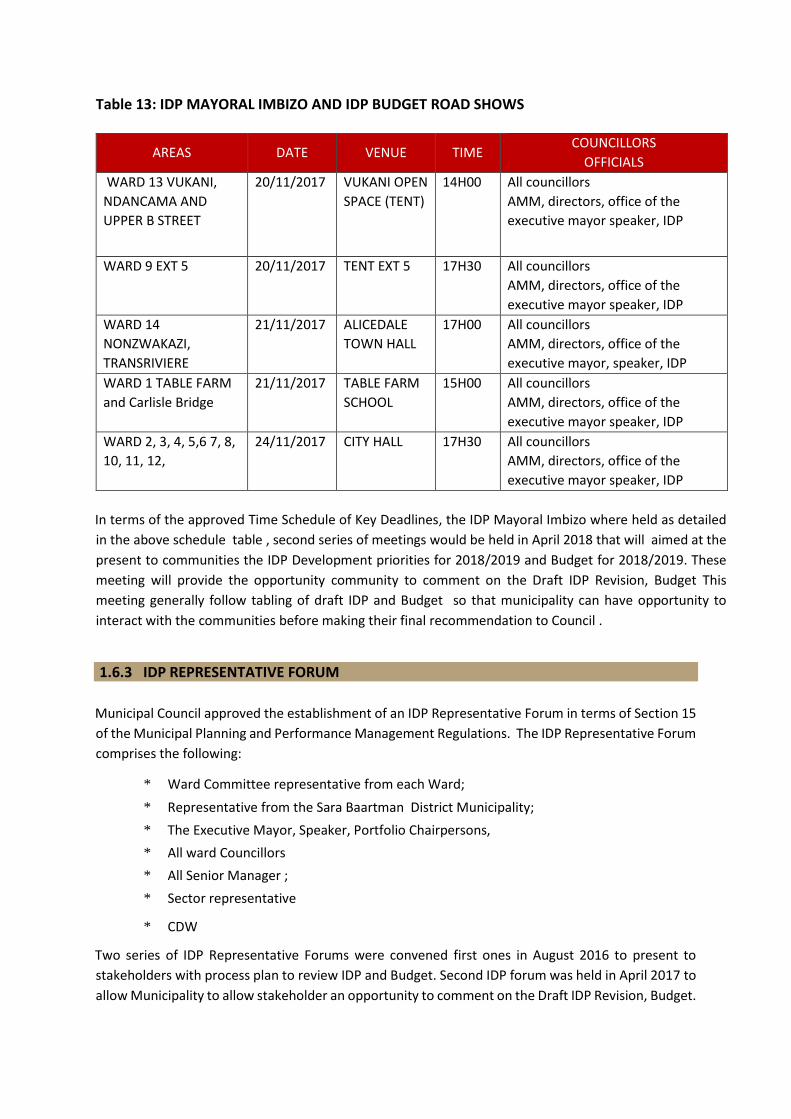
Table 13: IDP MAYORAL IMBIZO AND IDP BUDGET ROAD SHOWS
AREAS DATE VENUE TIME COUNCILLORS
OFFICIALS
WARD 13 VUKANI,
NDANCAMA AND
UPPER B STREET
20/11/2017 VUKANI OPEN
SPACE (TENT)
14H00 All councillors
AMM, directors, office of the
executive mayor speaker, IDP
WARD 9 EXT 5 20/11/2017 TENT EXT 5 17H30 All councillors
AMM, directors, office of the
executive mayor speaker, IDP
WARD 14
NONZWAKAZI,
TRANSRIVIERE
21/11/2017
ALICEDALE
TOWN HALL
17H00 All councillors
AMM, directors, office of the
executive mayor, speaker, IDP
WARD 1 TABLE FARM
and Carlisle Bridge
21/11/2017 TABLE FARM
SCHOOL
15H00 All councillors
AMM, directors, office of the
executive mayor speaker, IDP
WARD 2, 3, 4, 5,6 7, 8,
10, 11, 12,
24/11/2017 CITY HALL 17H30 All councillors
AMM, directors, office of the
executive mayor speaker, IDP
In terms of the approved Time Schedule of Key Deadlines, the IDP Mayoral Imbizo where held as detailed
in the above schedule table , second series of meetings would be held in April 2018 that will aimed at the
present to communities the IDP Development priorities for 2018/2019 and Budget for 2018/2019. These
meeting will provide the opportunity community to comment on the Draft IDP Revision, Budget This
meeting generally follow tabling of draft IDP and Budget so that municipality can have opportunity to
interact with the communities before making their final recommendation to Council .
1.6.3 IDP REPRESENTATIVE FORUM
Municipal Council approved the establishment of an IDP Representative Forum in terms of Section 15
of the Municipal Planning and Performance Management Regulations. The IDP Representative Forum
comprises the following:
* Ward Committee representative from each Ward;
* Representative from the Sara Baartman District Municipality;
* The Executive Mayor, Speaker, Portfolio Chairpersons,
* All ward Councillors
* All Senior Manager ;
* Sector representative
* CDW
Two series of IDP Representative Forums were convened first ones in August 2016 to present to
stakeholders with process plan to review IDP and Budget. Second IDP forum was held in April 2017 to
allow Municipality to allow stakeholder an opportunity to comment on the Draft IDP Revision, Budget.

1.6.4. WARD COMMITTEE MEETINGS
Two series of ward committee are proposed, first sessions of Ward Committee Meetings are convened
as part of their usually meetings to review and re-prioritisation of needs by the various sectors
represented on the Ward Committees. These meetings generally precede the IDP review public
meetings. The second series of Ward Committee Meetings is scheduled for April 2018 and will be
aimed at providing Ward Committees with the opportunity to comment on the Draft IDP Revision,
Budget.
1.7 INSTITUTIONAL ANALYSIS REVIEW SESSION Table 15
PHASE
SESSION
DATE
Strategic Planning
Corporate and Share service 8th February 2018
Public Safety and Community
Services 8th February 2018
EIS Strategic Planning 8th February 2018
Finance Service 13th February 2018
LED Strategic Planning 23 February 2018
CHAPTER TWO: SITUATIONAL ANALYSIS
2.1 MUNICIPAL PROFILE
The analysis phase aims to assess the existing level of development within the municipality
through the analysis of the prevailing environment, the impact thereof on the inhabitants of
the municipality and by taking cognisance of community perceptions and needs. It also
facilitates the identification and analysis of the environmental challenges facing the
municipality and allows the municipality to accurately prioritize these challenges.
The analysis phase should be seen as the foundation of the IDP that informs the ensuing
phases. Municipal planning, budgeting, decision-making and service delivery are based on the
IDP and it is therefore critical that the analysis phase of the IDP provides an accurate
understanding of the prevailing environment to ensure credibility of the final IDP. This chapter
provides a strategic analysis of the external and internal dimensions hereunder, which have
a direct impact on development in Makana Local Municipality. Makana Municipality has
conducted a Diagnostic Assessment in 2014 through the assistance of National/ Provincial
Treasury and CGTAEC.
Given the nature of the financial problems an independent and detailed assessment needed
to be undertaken so that the key objectives of development and a Recovery Financial Plan is
indeed achieved and which also meet the requirements of Section 142 of the Municipal
Financial Management Act(MFMA)
The approach adopted in the development of the plan was a consultative approach that
involved a detailed analysis of relevant documentation as well as engagement with amongst
others the Executive Mayor, Administrator, Councillors and Senior Officials of the
Municipality and Community.
2.1.1 SPATIAL AND GEOGRAPHY ANALYSIS
2.1.1.1 SPATIAL OVERVIEW AND GEOGRAPHIC DESCRIPTION
The Makana Municipality falls within the Sarah Baartman District Municipal area. The
Municipality’s area is bordered on the North-east by Amathole District Municipality, North-west
by Blue Crane Route, the South by Ndlambe Municipalities and the South-west by Sunday’s River
Valley.
Based on the Stats SA 2016, the population figure is 82 060. The largest concentration of people
is found in Grahamstown. Makana Local Municipality covers an area of 4,375.62 km2 and
constitutes 07.5% of the Sarah Baartman District.
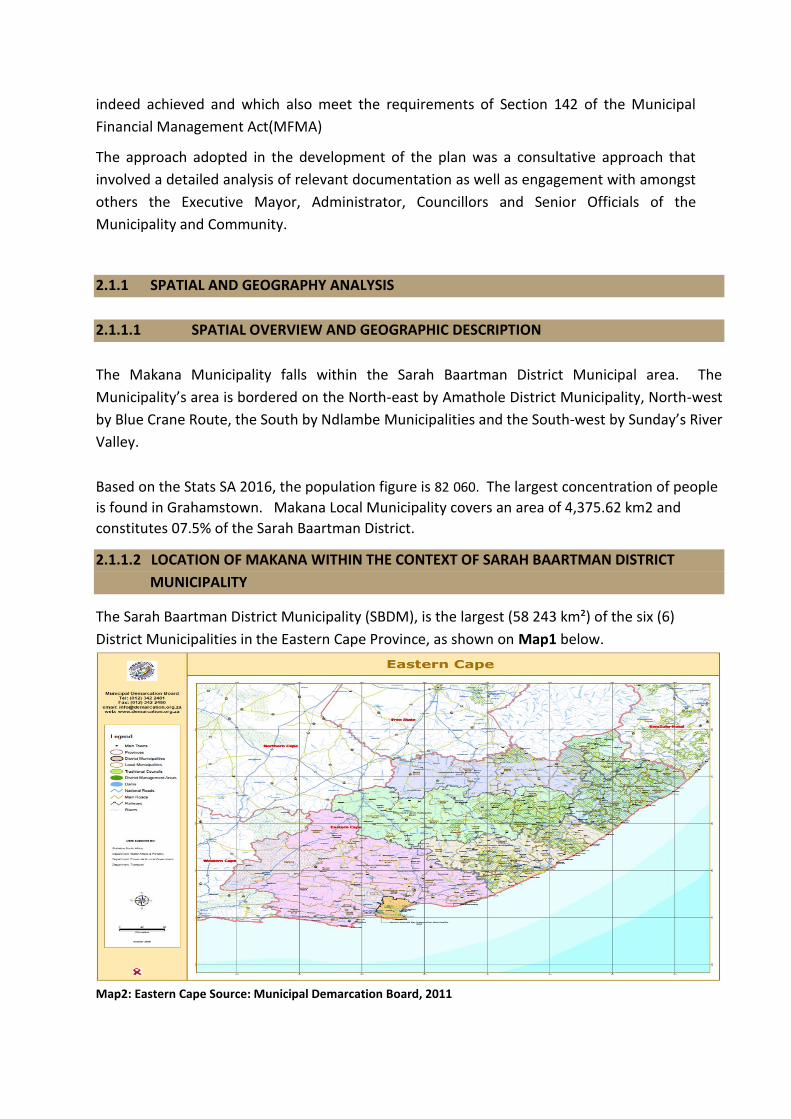
2.1.1.2 LOCATION OF MAKANA WITHIN THE CONTEXT OF SARAH BAARTMAN DISTRICT
MUNICIPALITY
The Sarah Baartman District Municipality (SBDM), is the largest (58 243 km²) of the six (6)
District Municipalities in the Eastern Cape Province, as shown on Map1 below.
Map2: Eastern Cape Source: Municipal Demarcation Board, 2011
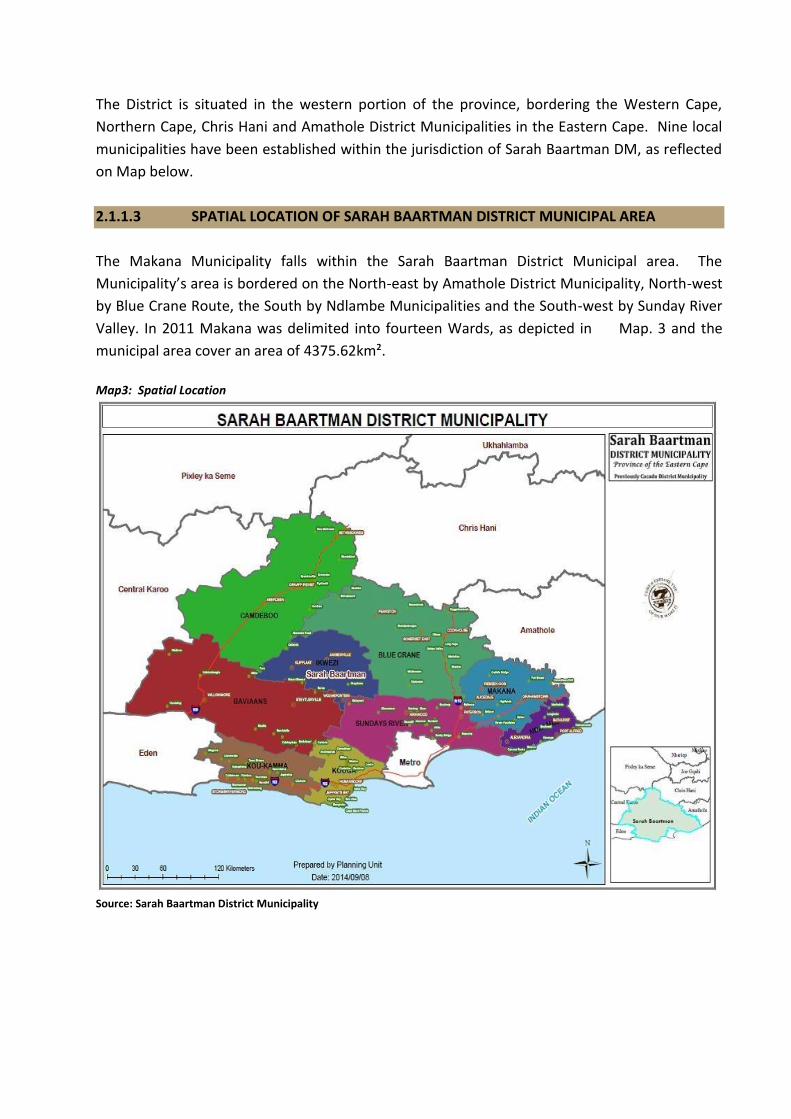
The District is situated in the western portion of the province, bordering the Western Cape,
Northern Cape, Chris Hani and Amathole District Municipalities in the Eastern Cape. Nine local
municipalities have been established within the jurisdiction of Sarah Baartman DM, as reflected
on Map below.
2.1.1.3 SPATIAL LOCATION OF SARAH BAARTMAN DISTRICT MUNICIPAL AREA
The Makana Municipality falls within the Sarah Baartman District Municipal area. The
Municipality’s area is bordered on the North-east by Amathole District Municipality, North-west
by Blue Crane Route, the South by Ndlambe Municipalities and the South-west by Sunday River
Valley. In 2011 Makana was delimited into fourteen Wards, as depicted in Map. 3 and the
municipal area cover an area of 4375.62km².
Map3: Spatial Location
Source: Sarah Baartman District Municipality

2.1.1.4 EASTERN CAPE PROVINCIAL SPATIAL DEVELOPMENT PLAN (ECPSDP)
The Department of Local Government and Traditional Affairs review of the Eastern Cape
Provincial Spatial Development Plan (ECPSDP) in 2010. The Review underscores the clustering of
opportunities in nodes and development corridors to achieve areas of shared impact.
It also takes into account the environmental potential, and characteristics, economic attributes,
migration trends and the impact of climate change on development. The impact of these factors
will influence the development trends in Makana taking into account the current Spatial
Development Framework (SDF) review.
2.1.1.5 MAKANA SPATIAL DEVELOPMENT FRAMEWORK
The Makana Municipality’s Spatial Development Framework was last revised and adopted in
November 2013.
Map 4: Statistic SA 2016
2.1.1.6 LEGAL FRAMEWORK FOR THE SDF
Section 26 (e) of the Municipal Systems Act 32 of 2000 (Act No. 32 of 2000) states that an
integrated development plan must reflect a spatial development framework which must include
the provision of basic guidelines for a Land Use Management System for the Municipality.
In order to achieve this, the government has adopted a range of new legislation and policies
which allows for a more flexible, participative planning methodology that is principle-lead and
rights-based.
The legislation includes the following:
Makana Integrated Land use Management scheme
Makana land use management Ordinance 15 of 1985
The Local Government: Municipal Planning and Performance Management Regulations
(GNR796 of 2001)
Spatial Planning and land use management Act(16of2013)
2.1.1.7 SPATIALLY RELEVANT FOCUS AREAS:
• Expediting the provision of services such as roads, alternative water source and
• provision of alternative energy sources for rural and urban areas
• Addressing housing backlog
• Addressing fragmented spatial planning in urban areas and land distribution rural area
• Address ageing infrastructure
• Ensure Sustainable Human Settlements
• Rural development, land reforms, food production
• Ensure sustainable development
2.1.1.8 SPATIAL OUTCOMES
Environmental Key Issues
• The ECPSDF (Eastern Cape Province Spatial Development Framework) has identified a
biodiversity footprint that from a Provincial perspective, is considered to be ‘non-
negotiable’.
• This footprint has been adopted into the SBDM’s SDF and will be accommodated into
Makana’s SDF.
• Cognisance needs to be taken of the protected expansion areas.
• There are critical biodiversity areas that fall outside of the protected area network.
• The extent and location of the components of the Environmental Footprint have not
been ‘ground trothed’.
Strategies:
• Map the ECPSDF biodiversity framework (Critical biodiversity areas, protected nature
reserves and parks etc.)
• Make the information available to all stakeholders.
• Specific attention needs to be given to the critical biodiversity areas that fall outside of
the protected area network.

• Determine guidelines and actions to ensure that the environmental footprint is
achieved.
• Ensure that the provisions of NEMA are applied.
• Establish partnerships with the relevant stakeholders to ensure cross border alignment.
• The accurate identification of the various components of the environmental network
needs to be undertaken, either on a project by project basis through the EIA process or
by means of a specific verification process.
Map 5: Environment Biodiversity:
2.1.1.9 CURRENT STATUS
A Spatial Development Framework is a sector plan of the IDP – without one our IDP is non-
compliant. Our current SDF was prepared in 2013 and was never approved by the Province
meaning it has retained draft status until now. Even so, just like the IDP we are required to
prepare a new SDF every 5 years in terms Systems Act.
The preparation of an SDF is a costly exercise involving specialist studies and public
participation. It is usually contracted to a service provider – generally consisting of a team of
professionals led by a Town Planner (+/-R500 000).
The municipality was in discussion with MISA (Municipal Infrastructure Support Agency) to
finance and manage the preparation on our behalf – unfortunately the official who was
advocating on our behalf was unable to get the budget approved.
Later he assisted us in drafting 10 letters to possible funders including provincial and national
departments and others like ECSECC. Most replied with the same response that the SDF if a
Municipal responsibility and not within their mandate to fund, none were positive.
We are now exploring the only other option – to prepare the SDF internally, to which COGTA
has pledged their support. This is not as bad as it sounds as we do have the competency in-
house it will merely be a problem in terms of capacity and specialist studies that will not be
possible.
2.1.2 LAND USE MANAGEMENT SYSTEM
As indicated in Section 26(e) of the Municipal Systems Act, the SDF is required to “include the
provisions of basic guidelines for a Land Use Management System (LUMS) for the municipality”.
2.1.2.1 LAND USE MANAGEMENT AIMS TO REGULATE:
Land-use changes such as the rezoning of a property from residential to commercial use.
‘Green fields’ land development, i.e. the development of previously undeveloped land;
Subdivision and consolidation of land parcels
Regularization and upgrading process of informal settlements, and
The facilitation of land development through the more active participation of the
municipality in the land development process, especially through public-private
partnerships
2.1.2.2 PLANNING SCHEMES/ MECHANISMS
The Planning Schemes are the statutory mechanisms whereby land may be developed, managed
and regulated.
2.1.2.3 LAND USE MANAGEMENT NEEDS
The current land use management mechanisms in Makana are unable to address the needs of
the residents. The following shortcomings have been identified:
Ineffective zoning records, specifically for the former Western District Council Area
The public does not have easy access to information regarding land
No database of the registered municipal land
A full set of general guidelines for Land Use Applications are contained in the SDF and for this
reason will not be elaborated upon in the IDP.

2.1.2.4 MUNICIPAL PLANNING TRIBUNAL
A Municipal Planning Tribunal (MPT) is intended to be the decision-making body for Land Use decisions
in terms of SPLUMA (Spatial Planning and Land Use Management Act). Any application submitted since 1
July 2015 should be dealt with in terms of SPLUMA.
SPLUMA requires that applications are categorised so that the decision making is split between a Land
Development Officer (Riana) and the MPT – as things stand we have managed to avoid the issue by
delegating almost all decision making to the LDO rather than the MPT – however at the end of the day
this is not in line with the spirit of the Act.
The MPT should consist of qualified people in the field of town planning, engineering, law, quantity
surveying etc. Internal people can sit on the tribunal, but obviously no-one who has had input into the
processing of an application can do so – we will be very hard pressed to find enough officials for this –
although this option has not been explored extensively enough in my opinion. The other problem is that
anyone from outside must also not have a vested interest and they will expect to be paid for their time.
2.1.3 ENVIRONMENTAL ANALYSIS
2.1.3.1 ENVIRONMENTAL OVERVIEW
Guidelines pertaining to environmental aspects within the municipality are guided by the
Subtropical Thicket Ecosystem Planning (STEP) initiative / project. The STEP Project encompasses
the South-Eastern Cape region, extending from the Kei River to Riversdale, referred to as the STEP
domain. The project’s aim was to assess the region’s biodiversity in terms of the diversity of
indigenous plants and animals and the processes that sustain them with special emphasis on the
unique, indigenous vegetation type known as thicket. The assessment measured how much of
this vegetation type has been destroyed or damaged by human activities and determines the
degree to which biodiversity is endangered in different areas.
Based on assessment, development guidelines pertaining to environmental issues were compiled,
the objectives of which were to:
• Ensure the persistence of biodiversity by developing a co-operative strategy for conserving
corridors of land along major river valleys and the coast (the Mega Conservancy Network)
which were identified as needing special safeguarding.
• Ensure the retention of biodiversity by categorizing those areas not contained within the
Network into areas of conservation status with guidelines for appropriate land use.
2.1.3.2 ENVIRONMENTAL PROFILE
This Environmental profile provides an overview of the environmental characteristics of the
Makana area. Development associated with primary activities such as mining and agriculture, as
well as tertiary activity such as tourism is often based on an area’s physical attributes.

The environmental profile will thus feed into the developmental potential that can be based on
Makana’s inherent physical characteristics. The environmental characteristics of Makana are
discussed under the following sub-sections.
2.1.3.3 CLIMATE
The Southern portion of the municipality has the highest rainfall. The majority of the municipality
is classified as semi-arid. Makana lies in a subtropical climatic zone, meaning that the area is
characterized by warm summers and cool winters and fairly evenly distributed rainfall throughout
the year. The Grahamstown area experiences moderate weather conditions. Rain falls throughout
the year with mean precipitation averaging 680mm.
Summer temperatures (January) vary from an average maximum of 26’C to a minimum of 15’C.
In winter (July) temperatures vary from an average maximum of 18’C to an average minimum of
4’C. The prevailing wind direction is from the west and southwest. In Alicedale, rainfall is
approximately 555mm per year.
Temperatures in Alicedale range from 40’C to 15’C in summer and 18’C to -8’C in the winter
months. Rainfall in Riebeek East area is approximately 865mm per year, with identical average
winter and summer temperatures to those experienced Grahamstown.
2.1.3.4 CLIMATE CHANGE
Climate change is defined as a change of climate which is attributed directly or indirectly to
human activity that alters the composition of the global atmosphere and which is in addition to
natural climate variability over comparable time periods. (United Nations Framework
Convention on Climate Change)
The manifestation of climate change in the Eastern Cape is expected to be:
• High temperature increases towards the North -West Interior with lowest increases
along the coast.
• A drying trend towards the South and South -West.
• Increased precipitation more likely towards the east of the Province.
• Sea level rise scenario’s ranging from 2m to 6,5m depending on exposure.
• Risk assessment, adaptation and mitigation measures addressed in SBDM and Eastern
Cape Climate Change Response Strategy (DEDEAT, 2011).
No spatial demarcation has been made of the high risk areas:
• Lower rainfall in the South and South-West and higher rainfall to the east.
• Water shortages
• Lower food production
• Reduced tourism
• Increased fire risk

These areas need to be mapped and reflected in the Makana Disaster Plan
2.1.3.5 GEOLOGY AND SOIL
From a municipal wide perspective there are no unfavorable geotechnical conditions that will
prevent development or require specific safety considerations. The necessary on-site
investigations should be undertaken to ensure that the site specific circumstances are suitable
for the intended development.
2.1.3.6 TOPOGRAPHY
The eastern part of the municipality can be classified as lowlands, with contours generally lying
below 300m above sea level. The western part of the locality in which Alicedale is situated can be
classified as being of a moderate elevation, lying between 300m and 600m above sea level. The
central part of the municipality that contains Grahamstown and Riebeek East has the highest
elevation of between 600m and 900m above sea level. Grahamstown is situated in a valley that
cuts into a plateau.
The highest point on the plateau is 770m above sea level and the lowest point in the valley is
490m above sea level. Alicedale is located about 360m above sea level in a flood plain created by
the confluence of the Bushman’s river and the New Year’s river. Riebeek East is located 630m
above sea level.
2.1.3.7 TOPOGRAPHY AND SLOPE
Most of the land in Makana has a slope of either between 3-8º or between 8-20 º (State of the
Sarah Baartman Environment, 2005)
2.1.3.8 HYDROLOGY
The major water related driver in the municipal area is the Orange-Fish-Sundays Water Supply
system which ensures continuous sustainable water supply for economic activity and is essential
for community’s well-being and socio-economic prosperity in the area. The whole municipality is
classified as a primary catchment area, with a mean quaternary runoff of between 12m³ and
40m³. (State of the Sarah Baartman Environment (2005)
Surface water is largely provided by dams and reservoirs that are linked to perennial and non-
perennial rivers. Ground water is provided by boreholes and springs that are evenly distributed
throughout the municipality. In terms of water sources in the towns it is found that:
• Grahamstown’s water is from local dams and sources transferred from the Orange River.
• There is adequate supply to cater for the 8.6M/m³ that it uses but there is also a need for
more groundwater development.
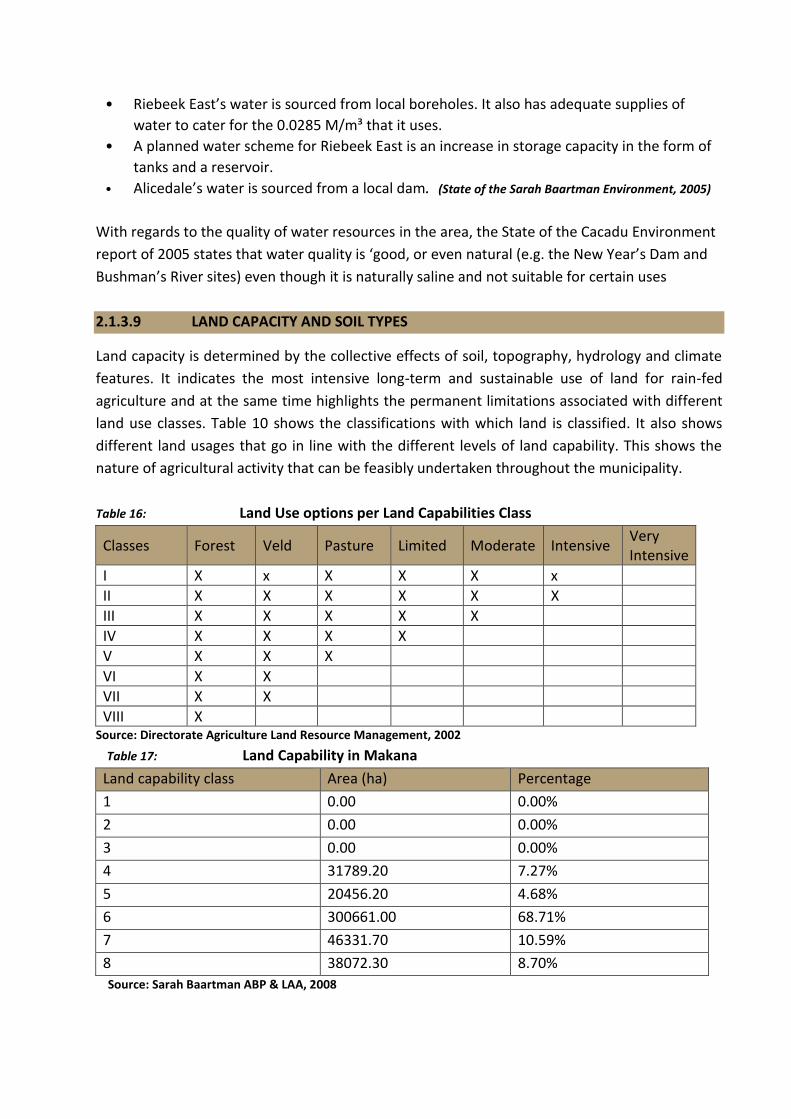
• Riebeek East’s water is sourced from local boreholes. It also has adequate supplies of
water to cater for the 0.0285 M/m³ that it uses.
• A planned water scheme for Riebeek East is an increase in storage capacity in the form of
tanks and a reservoir.
• Alicedale’s water is sourced from a local dam. (State of the Sarah Baartman Environment, 2005)
With regards to the quality of water resources in the area, the State of the Cacadu Environment
report of 2005 states that water quality is ‘good, or even natural (e.g. the New Year’s Dam and
Bushman’s River sites) even though it is naturally saline and not suitable for certain uses
2.1.3.9 LAND CAPACITY AND SOIL TYPES
Land capacity is determined by the collective effects of soil, topography, hydrology and climate
features. It indicates the most intensive long-term and sustainable use of land for rain-fed
agriculture and at the same time highlights the permanent limitations associated with different
land use classes. Table 10 shows the classifications with which land is classified. It also shows
different land usages that go in line with the different levels of land capability. This shows the
nature of agricultural activity that can be feasibly undertaken throughout the municipality.
Table 16: Land Use options per Land Capabilities Class
Classes Forest Veld Pasture Limited Moderate Intensive Very Intensive
I X x X X X x
II X X X X X X
III X X X X X
IV X X X X
V X X X
VI X X
VII X X
VIII X Source: Directorate Agriculture Land Resource Management, 2002
Table 17: Land Capability in Makana
Land capability class Area (ha) Percentage
1 0.00 0.00%
2 0.00 0.00%
3 0.00 0.00%
4 31789.20 7.27%
5 20456.20 4.68%
6 300661.00 68.71%
7 46331.70 10.59%
8 38072.30 8.70%
Source: Sarah Baartman ABP & LAA, 2008

Most of the land (68.71%) in Makana is classified under class 6. This means that the majority of
land in Makana is only suitable for grazing of animals and non-arable. Based on the results
presented in Table 6.2 and Figure 6.2, the Makana Area Based Plan (2008) states that land in the
Makana area has suitable potential to for:
• Large areas of irrigation, should water be available
• Rain-fed cropping of Wheat, chicory, pecan nuts and aloe
• Irrigation-fed cropping of stone fruit, olives, cotton, vegetable, sugar beet and oranges
• Livestock including game farming and ostrich farming
Soils in the Makana area are generally shallow and weakly developed, with depths typically not
exceeding 600mm. This is because the municipality’s geology is based on Beaufort group
sandstones and shale’s which dominate the landscape. The shallow and weakly developed soils
limit the types of crops that may be planted throughout the municipality as this affects root
development, nutrient retention and moisture drainage.
There are some rich alluvial and colluvial soils close to rivers, which support intensive
agricultural cultivation. Topsoil textures vary from loamy sand to sandy clay loam (Makana ABP &
LAA, 2008).
2.1.3.10 VEGETATION TYPES AND BIODIVERSITY
The vegetation in an area represents an integration of climate, soil and a number of other
biological factors. Physical factors including geomorphology and geology also act as variables
that determine vegetation types and biodiversity.
The Makana District has richly diverse and unique vegetation, comprising of ten vegetation
types, representing six of the seven major Southern African biomes namely:
1. forest,
2. grassland,
3. succulent Karoo,
4. fynbos,
5. savannah grasslands and
6. the thicket vegetation.
The Makana municipality is situated in the Albany Centre of Endemism and has 27 endemic plant
species of which 17 (62%) are cited as being vulnerable and 5 (32%) are cited as being endangered.
Significant portions of land in the Makana municipality are classified as “Critical Biodiversity
Areas”. This means that they are to be managed for biodiversity and conservation, with only
limited development in the form of small scale tourism amenities recommended. Critical
Biodiversity Areas also have guidelines on the form an agriculture that may take place (State of the
Sarah Baartman Environment, 2005; Makana ABP and LAA, 2008)
The biodiversity of the thicket within Makana is threatened by several factors, including:
• Urbanization
• Transformation of land for agricultural purposes
• Overgrazing by livestock
• Habitat loss through preparation of cultivated land for products such as cash crops
• Overpopulation of alien species introduced through agriculture and game reserves
• Unsustainable resource use
• Collection of plant species for medicinal and ornamental uses
• Land degradation due to the use of irrigation in areas with poor soils
2.1.4 LAND REFORM PROGRAMME
The Department of Rural Development and Land Affairs has compiled an Area Based Plan, for the
Sarah Baartman District area as a whole. An Area Based Plan essentially is a sector plan that seeks
to address land related issues at a municipal level and is intended to form part of the Integrated
Development Plan (IDP), informing the Spatial Development Framework (SDF) and Land Use
Management System (LUMS).
Fundamentally the Plan seeks to integrate Land Reform into the municipal planning process
wherein identified projects are supported during and post implementation phases to ensure
sustainability. Also to develop an implementation tool for pro-active land acquisition to facilitate
acquisition of land at scale by DRD & LR to meet the 2014 target of transferring 30% of white
owned land into the hands of the black farming class.
The Land Reform Programme is anchored on three key programmes, namely:
1. restitution,
2. redistribution and
3. tenure reform.
These were developed to promote land acquisition, restore land rights lost through
dispossession and achieve tenure upgrade respectively. Source: Municipal Demarcation Board, 2011
Twenty seven councilors have been elected and the seat of the municipality is situated in
Grahamstown. The Makana area comprises of rural commercial farms with small rural nodes and
Grahamstown is the main urban town.

2.2 MUNICIPAL DEMOGRAPHIC AND SOCIAL SERVICES PROFILE
2.2.1 POPULATION AND POPULATION DENSITY
The Makana relies on the South African National census 2011 and the Community Survey 2016
(StatsSA) data information on official population figures, assisting it to make informed decision
relating to population challenges faced by the Municipality.
The census determined the country's population as 55.7 million, Sarah Baartman’s population to
be 479 923 and Makana 82060. The Municipality has undertaken to access a number of
alternative sources of data to provide a comparative analysis against the census 2011 figures and
also assist in evaluating the growth trends within the district, namely:
Information obtained from the 2003 the Eastern Cape Socio Consultative Council survey;
Information obtained from the 2004 district economic growth and development strategy
as undertaken by the Urban Econ Group;
Information obtained from the Global Insight Group reflecting projected population
estimates as per 2011.
Information obtained from the Community Survey 2016 reflection mid-term population
estimates
Population and extent of Area km² - EC, SBDM and MLM Table 18
Stats SA 2016 Eastern Cape SBDM Makana Local
Total Population 6 996 976 479922 82060
Area km² 168 966 km² 58 266.3 km² 4375.62 km²
Table 16 Source: Stats SA 2016
As indicated by the statistical information above, Makana accounts for 17.8% of the Sarah
Baartman District and 1.2% of the Provincial population. Makana is the second largest population
contributor in the district. Geographically Makana has a fairly large population living in a relatively
small area with a population density of 18.4 per km².
2.2.2 POPULATION DISTRIBUTION
Age distribution, Gender, Population Grouping and Head of Household
Source: Stats SA 2016
2.2.2.1 DEMOGRAPHICS
Table 19:
DEMOGRAPHICS 2011 2016
No % No %
Population Profile 80 390 82 060
Population growth 2.1

Population profile:
Black African 62 702 78.0 66 257 80.7
Coloured 9 725 12.1 8 788 10.7
Indian or Asian 525 0.7 470 0.6
White 6 974 8.7 6 546 8.0
2.2.2.2 POPULATION DENSITY
Table 20:
POPULATION DENSITY 2011 % 2016 %
POPULATION BY HOME LANGUAGE:
Afrikaans 11 111 14.8 8 868 11.0
English 7 831 10.5 7 051 8.7
IsiXhosa 53 494 71.5 63 887 79.0
IsiZulu 321 0.4 279 0.3
Sesotho 272 0.4 76 0.1
Other 1 791 2.4 686 0.9
Figure 3: Languages
2.2.2.3 GENDER
Table 21: GENDER 2011 % 2016 %
Male 38 175 47.5 39 218 47.8
Female 42 215 52.5 42 842 52.2
Figure 5
15.0 10.0 5.0 0.0 5.0 10.0 15.0
00-04
10-14
20-24
30-34
40-44
50-54
60-64
70-74
80-84
Makana % Pyramid
Female Male
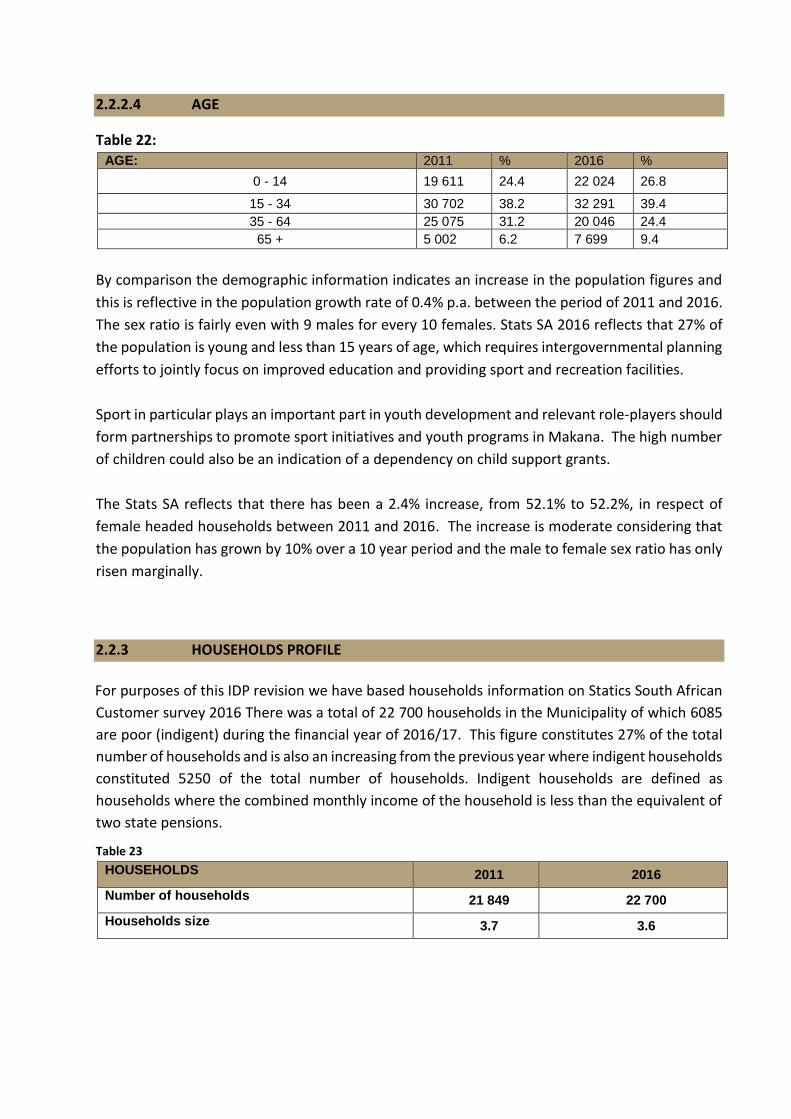
2.2.2.4 AGE
Table 22: AGE: 2011 % 2016 %
0 - 14 19 611 24.4 22 024 26.8
15 - 34 30 702 38.2 32 291 39.4
35 - 64 25 075 31.2 20 046 24.4
65 + 5 002 6.2 7 699 9.4
By comparison the demographic information indicates an increase in the population figures and
this is reflective in the population growth rate of 0.4% p.a. between the period of 2011 and 2016.
The sex ratio is fairly even with 9 males for every 10 females. Stats SA 2016 reflects that 27% of
the population is young and less than 15 years of age, which requires intergovernmental planning
efforts to jointly focus on improved education and providing sport and recreation facilities.
Sport in particular plays an important part in youth development and relevant role-players should
form partnerships to promote sport initiatives and youth programs in Makana. The high number
of children could also be an indication of a dependency on child support grants.
The Stats SA reflects that there has been a 2.4% increase, from 52.1% to 52.2%, in respect of
female headed households between 2011 and 2016. The increase is moderate considering that
the population has grown by 10% over a 10 year period and the male to female sex ratio has only
risen marginally.
2.2.3 HOUSEHOLDS PROFILE
For purposes of this IDP revision we have based households information on Statics South African
Customer survey 2016 There was a total of 22 700 households in the Municipality of which 6085
are poor (indigent) during the financial year of 2016/17. This figure constitutes 27% of the total
number of households and is also an increasing from the previous year where indigent households
constituted 5250 of the total number of households. Indigent households are defined as
households where the combined monthly income of the household is less than the equivalent of
two state pensions.
Table 23
HOUSEHOLDS 2011 2016
Number of households 21 849 22 700
Households size 3.7 3.6

2.2.4 SOCIAL PROFILE
2.2.4.1 EDUCATION:
Education is the cornerstone to sustainable development and it is therefore very important to be prioritised because 66% of the population fall between 0-34 years of age in Makana. Table 24
CATEGORY AGE PERCENTAGE
Youth 15-34 39%
Adult 35-64 24%
Elder 65+ 9%
Children 0-14 27%
2.2.4.2 SCHOOLS IN MAKANA Table 25
SCHOOL P/S/F/J
ANDREW MOYAKE PUBLIC SCHOOL JUN SEC
ARCHIE MBOLEKWA JUNIOR SECONDARY SCHOOL JUN SEC
GEORGE JACQUES JUNIOR SECONDARY SCHOOL JUN SEC
HENDRIK KANISE COMBINED SCHOOL COMBINED/FARM
KHUTLISO DANIELS SECONDARY SCHOOL SECONDARY
NATHANIEL NYALUZA SENIOR SECONDARY SCHOOL SECONDARY
NOMBULELO SECONDARY SCHOOL SECONDARY
NTABA MARIA JUNIOR SECONDARY SCHOOL JUN SEC
NTSIKA SENIOR SECONDARY SCHOOL SECONDARY
HOëRSKOOL P J OLIVIER COMBINED
T E M MRWETYANA SECONDARY SCHOOL SECONDARY
VICTORIA GIRLS' HIGH SCHOOL SECONDARY
C M VELLEM JUNIOR SECONDARY SCHOOL JUN SEC
D D SIWISA PRIMARY SCHOOL PRIMARY
FIKIZOLO PUBLIC PRIMARY SCHOOL JUN SEC
GRAHAMSTOWN SDA PRIMARY SCHOOL JUN SEC
MAKANA PUBLIC PRIMARY SCHOOL JUN SEC
N V CEWU PUBLIC PRIMARY SCHOOL JUN SEC
SAMUEL NTLEBI PRIMARY SCHOOL JUN SEC
SAMUEL NTSIKO PRIMARY SCHOOL JUN SEC
TANTYI PUBLIC SCHOOL PRIMARY
VICTORIA PRIMARY SCHOOL JUN SEC
GEORGE DICKERSON PRIMARY SCHOOL JUN SEC
GOOD SHEPHERD EC PRIMARY SCHOOL JUN SEC
GRAEME COLLEGE BOYS' HIGH COMBINED
GRAHAMSTOWN PRIMARY SCHOOL JUN SEC
JOHAN CARINUS ART CENTRE JUN SEC
MARY WATERS SECONDARY SCHOOL JUN SEC
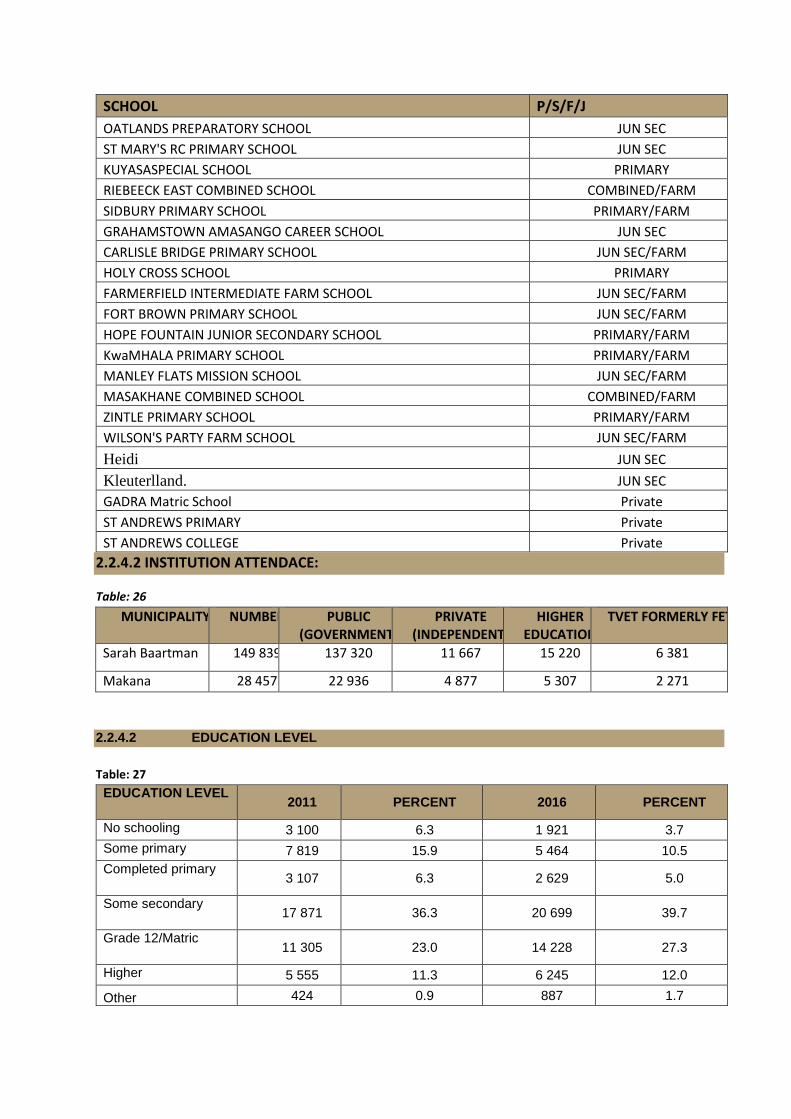
SCHOOL P/S/F/J
OATLANDS PREPARATORY SCHOOL JUN SEC
ST MARY'S RC PRIMARY SCHOOL JUN SEC
KUYASASPECIAL SCHOOL PRIMARY
RIEBEECK EAST COMBINED SCHOOL COMBINED/FARM
SIDBURY PRIMARY SCHOOL PRIMARY/FARM
GRAHAMSTOWN AMASANGO CAREER SCHOOL JUN SEC
CARLISLE BRIDGE PRIMARY SCHOOL JUN SEC/FARM
HOLY CROSS SCHOOL PRIMARY
FARMERFIELD INTERMEDIATE FARM SCHOOL JUN SEC/FARM
FORT BROWN PRIMARY SCHOOL JUN SEC/FARM
HOPE FOUNTAIN JUNIOR SECONDARY SCHOOL PRIMARY/FARM
KwaMHALA PRIMARY SCHOOL PRIMARY/FARM
MANLEY FLATS MISSION SCHOOL JUN SEC/FARM
MASAKHANE COMBINED SCHOOL COMBINED/FARM
ZINTLE PRIMARY SCHOOL PRIMARY/FARM
WILSON'S PARTY FARM SCHOOL JUN SEC/FARM
Heidi JUN SEC
Kleuterlland. JUN SEC
GADRA Matric School Private
ST ANDREWS PRIMARY Private
ST ANDREWS COLLEGE Private
2.2.4.2 INSTITUTION ATTENDACE:
Table: 26
MUNICIPALITY NUMBER PUBLIC (GOVERNMENT)
PRIVATE (INDEPENDENT)
HIGHER EDUCATION
TVET FORMERLY FET)
Sarah Baartman 149 839 137 320 11 667 15 220 6 381
Makana 28 457 22 936 4 877 5 307 2 271
2.2.4.2 EDUCATION LEVEL
Table: 27
EDUCATION LEVEL 2011 PERCENT 2016 PERCENT
No schooling 3 100 6.3 1 921 3.7
Some primary 7 819 15.9 5 464 10.5
Completed primary 3 107 6.3 2 629 5.0
Some secondary 17 871 36.3 20 699 39.7
Grade 12/Matric 11 305 23.0 14 228 27.3
Higher 5 555 11.3 6 245 12.0
Other 424 0.9 887 1.7
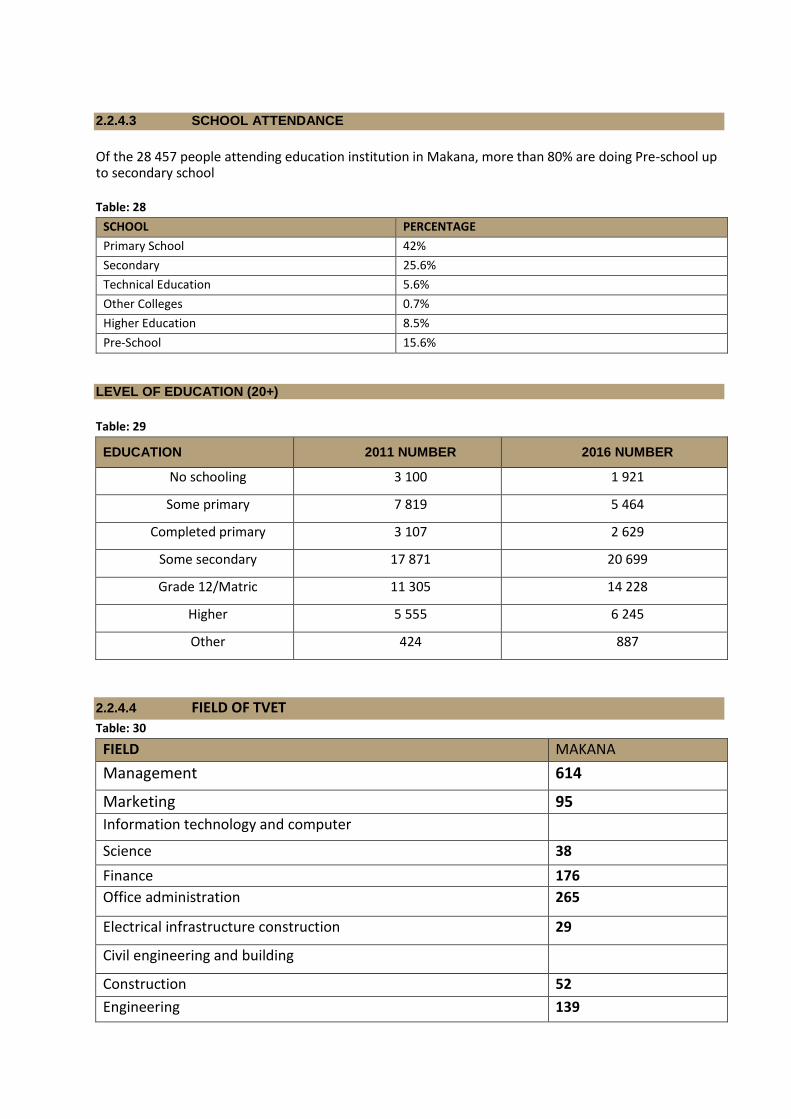
2.2.4.3 SCHOOL ATTENDANCE
Of the 28 457 people attending education institution in Makana, more than 80% are doing Pre-school up to secondary school Table: 28
SCHOOL PERCENTAGE
Primary School 42%
Secondary 25.6%
Technical Education 5.6%
Other Colleges 0.7%
Higher Education 8.5%
Pre-School 15.6%
LEVEL OF EDUCATION (20+)
Table: 29
EDUCATION 2011 NUMBER 2016 NUMBER
No schooling 3 100 1 921
Some primary 7 819 5 464
Completed primary 3 107 2 629
Some secondary 17 871 20 699
Grade 12/Matric 11 305 14 228
Higher 5 555 6 245
Other 424 887
2.2.4.4 FIELD OF TVET
Table: 30
FIELD MAKANA
Management 614
Marketing 95
Information technology and computer
Science 38
Finance 176
Office administration 265
Electrical infrastructure construction 29
Civil engineering and building
Construction 52
Engineering 139
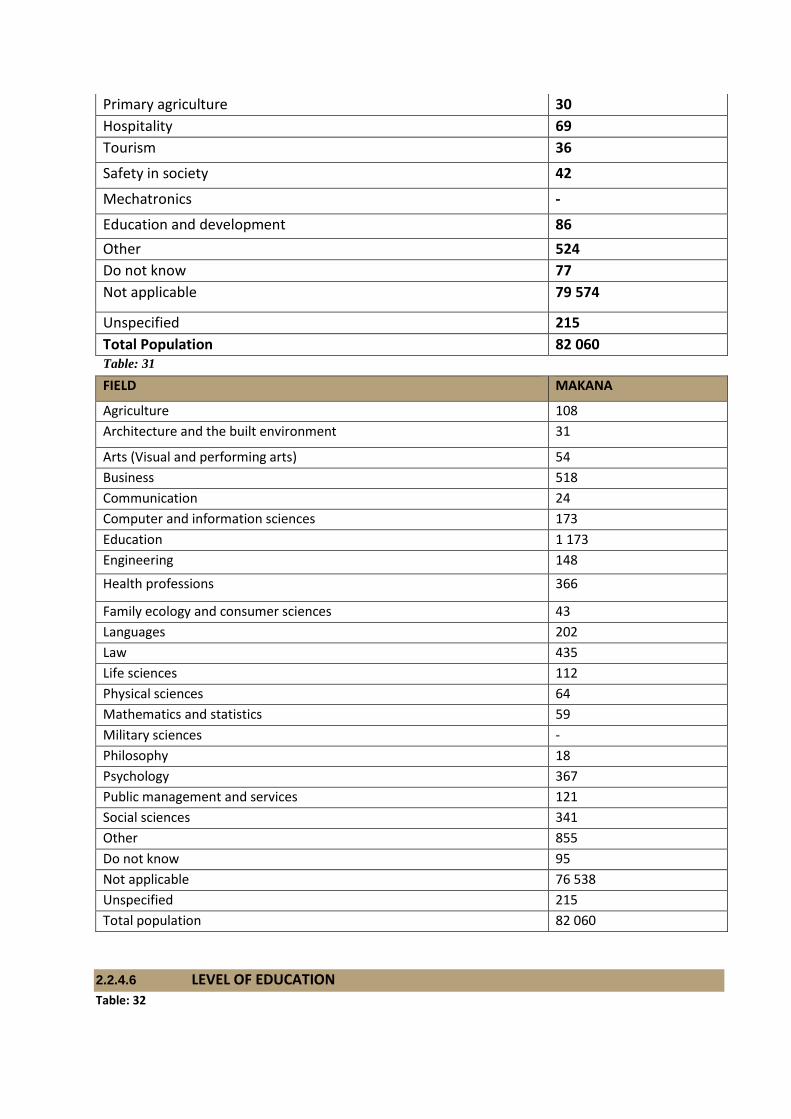
Primary agriculture 30
Hospitality 69
Tourism 36
Safety in society 42
Mechatronics -
Education and development 86
Other 524
Do not know 77
Not applicable 79 574
Unspecified 215
Total Population 82 060 Table: 31
FIELD MAKANA
Agriculture 108
Architecture and the built environment 31
Arts (Visual and performing arts) 54
Business 518
Communication 24
Computer and information sciences 173
Education 1 173
Engineering 148
Health professions 366
Family ecology and consumer sciences 43
Languages 202
Law 435
Life sciences 112
Physical sciences 64
Mathematics and statistics 59
Military sciences -
Philosophy 18
Psychology 367
Public management and services 121
Social sciences 341
Other 855
Do not know 95
Not applicable 76 538
Unspecified 215
Total population 82 060
2.2.4.6 LEVEL OF EDUCATION
Table: 32

LEVEL NUMBER OF PEOPLE
% SHARE
LEVEL OF EDUCATION NUMBER OF PEOPLE
% SHARE
No schooling 8 831 10.80% N4/NTC 4 443 0.50%
Grade 0 3 038 3.70% N5/NTC 5 218 0.30%
Grade 1 2 498 3.00% N6/NTC 6 532 0.60%
Grade 2 1 651 2.00%
Certificate with less than Gr 12 66 0.10%
Grade 3 3 185 3.90%
Diploma with less than Gr 12 78 0.10%
Grade 4 2 624 3.20%
Advanced Certificate with Gr 12 564 0.70%
Grade 5 3 021 3.70% Diploma with Grade 12 1 147 1.40%
Grade 6 3 241 3.90% Higher Diploma 774 0.90%
Grade 7 3 605 4.40% Post-Higher Diploma 741 0.90%
Grade 8 4 932 6.00% Bachelor's degree 1 479 1.80%
Grade 9 5 002 6.10% Honours degree 323 0.40%
Grade 10 8 143 9.90% Masters degree 452 0.60%
Grade 11 9 067 11.00% PHD (Doctoral degree) 310 0.40%
Grade 12 14 804 18.00% Other 312 0.40%
NTC I/N1 115 0.10% Do not know 607 0.70%
NTCII/N2 49 0.10% Unspecified 156 0.20%
NTCIII/N3 52 0.10% Total (Makana LM) 82 060 100%
2.2.6 POVERTY
Very serious poverty (where people live on less than$2 or R 14 – R 18 per day) is rapidly declining,
probably in response to the roll out of social grants in South Africa
2.2.6.1 HUMAN DEVELOPMENT
The Human Development Index
Figure 7: The Sarah Baartman Human Development Index 2001 and 2011
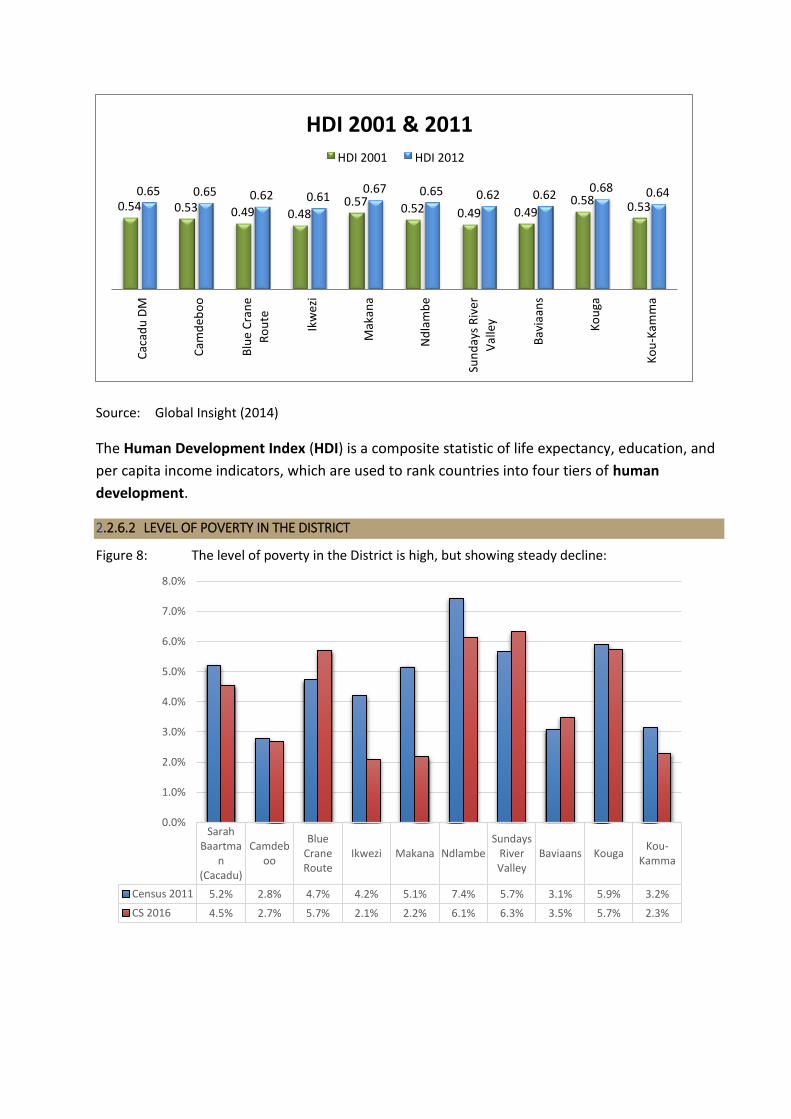
Source: Global Insight (2014)
The Human Development Index (HDI) is a composite statistic of life expectancy, education, and
per capita income indicators, which are used to rank countries into four tiers of human
development.
2.2.6.2 LEVEL OF POVERTY IN THE DISTRICT
Figure 8: The level of poverty in the District is high, but showing steady decline:
SarahBaartma
n(Cacadu)
Camdeboo
BlueCraneRoute
Ikwezi Makana NdlambeSundays
RiverValley
Baviaans KougaKou-
Kamma
Census 2011 5.2% 2.8% 4.7% 4.2% 5.1% 7.4% 5.7% 3.1% 5.9% 3.2%
CS 2016 4.5% 2.7% 5.7% 2.1% 2.2% 6.1% 6.3% 3.5% 5.7% 2.3%
0.0%
1.0%
2.0%
3.0%
4.0%
5.0%
6.0%
7.0%
8.0%
0.54 0.53 0.49 0.48 0.57 0.52 0.49 0.49
0.58 0.53 0.65 0.65 0.62 0.61
0.67 0.65 0.62 0.62 0.68 0.64
HDI 2001 & 2011
HDI 2001 HDI 2012
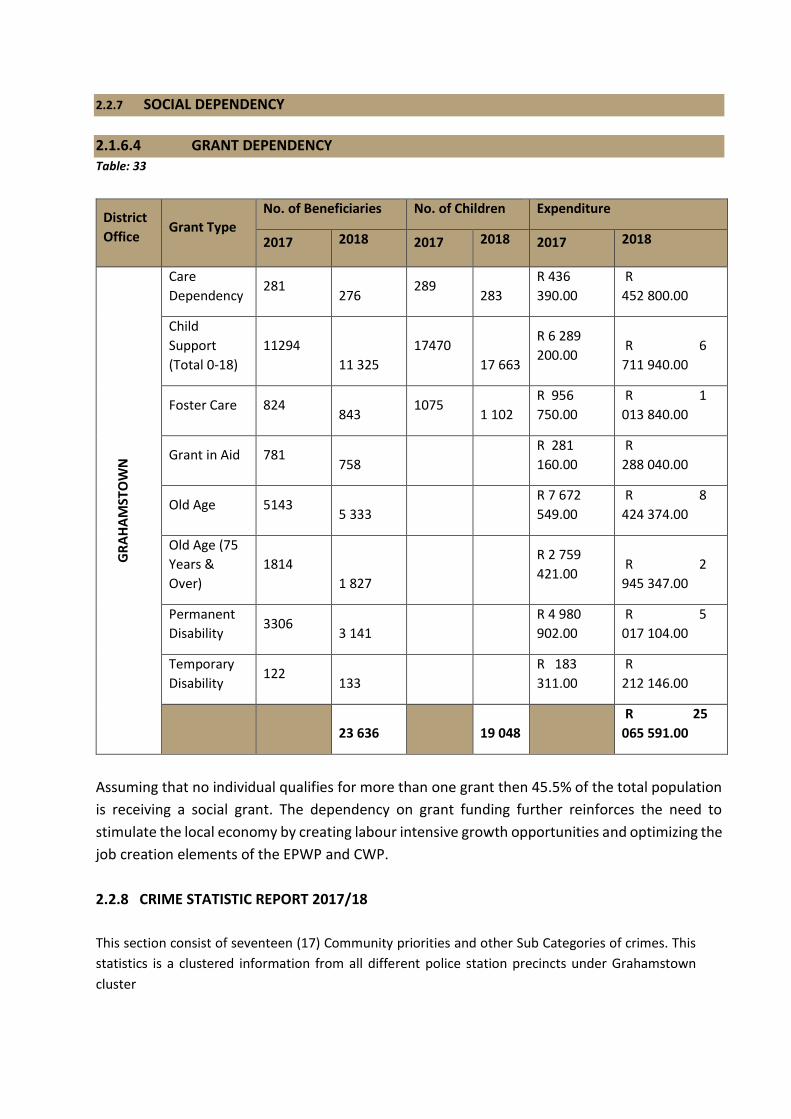
2.2.7 SOCIAL DEPENDENCY
2.1.6.4 GRANT DEPENDENCY Table: 33
District
Office Grant Type
No. of Beneficiaries No. of Children Expenditure
2017 2018 2017 2018 2017 2018
GR
AH
AM
STO
WN
Care
Dependency 281
276 289
283
R 436
390.00
R
452 800.00
Child
Support
(Total 0-18)
11294
11 325
17470
17 663
R 6 289
200.00 R 6
711 940.00
Foster Care 824
843 1075
1 102
R 956
750.00
R 1
013 840.00
Grant in Aid 781
758
R 281
160.00
R
288 040.00
Old Age 5143
5 333
R 7 672
549.00
R 8
424 374.00
Old Age (75
Years &
Over)
1814
1 827
R 2 759
421.00 R 2
945 347.00
Permanent
Disability 3306
3 141
R 4 980
902.00
R 5
017 104.00
Temporary
Disability 122
133
R 183
311.00
R
212 146.00
23 636
19 048
R 25
065 591.00
Assuming that no individual qualifies for more than one grant then 45.5% of the total population
is receiving a social grant. The dependency on grant funding further reinforces the need to
stimulate the local economy by creating labour intensive growth opportunities and optimizing the
job creation elements of the EPWP and CWP.
2.2.8 CRIME STATISTIC REPORT 2017/18
This section consist of seventeen (17) Community priorities and other Sub Categories of crimes. This
statistics is a clustered information from all different police station precincts under Grahamstown
cluster
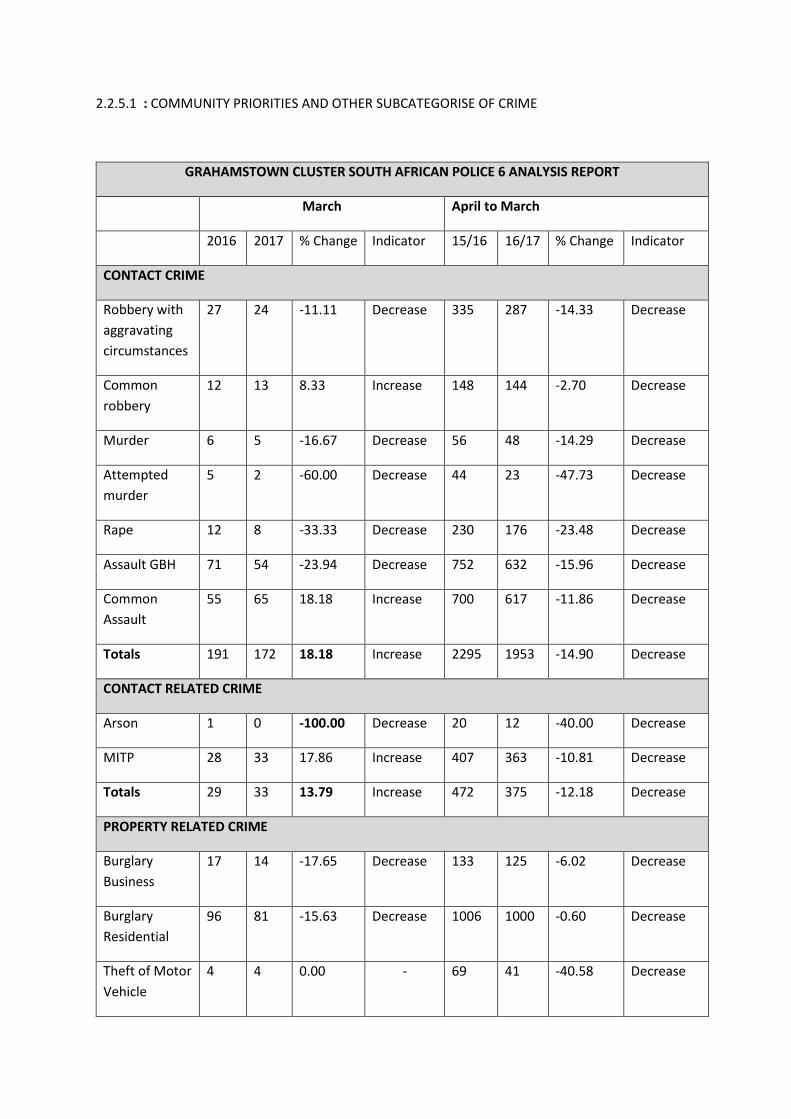
2.2.5.1 : COMMUNITY PRIORITIES AND OTHER SUBCATEGORISE OF CRIME
GRAHAMSTOWN CLUSTER SOUTH AFRICAN POLICE 6 ANALYSIS REPORT
March April to March
2016 2017 % Change Indicator 15/16 16/17 % Change Indicator
CONTACT CRIME
Robbery with
aggravating
circumstances
27 24 -11.11 Decrease 335 287 -14.33 Decrease
Common
robbery
12 13 8.33 Increase 148 144 -2.70 Decrease
Murder 6 5 -16.67 Decrease 56 48 -14.29 Decrease
Attempted
murder
5 2 -60.00 Decrease 44 23 -47.73 Decrease
Rape 12 8 -33.33 Decrease 230 176 -23.48 Decrease
Assault GBH 71 54 -23.94 Decrease 752 632 -15.96 Decrease
Common
Assault
55 65 18.18 Increase 700 617 -11.86 Decrease
Totals 191 172 18.18 Increase 2295 1953 -14.90 Decrease
CONTACT RELATED CRIME
Arson 1 0 -100.00 Decrease 20 12 -40.00 Decrease
MITP 28 33 17.86 Increase 407 363 -10.81 Decrease
Totals 29 33 13.79 Increase 472 375 -12.18 Decrease
PROPERTY RELATED CRIME
Burglary
Business
17 14 -17.65 Decrease 133 125 -6.02 Decrease
Burglary
Residential
96 81 -15.63 Decrease 1006 1000 -0.60 Decrease
Theft of Motor
Vehicle
4 4 0.00 - 69 41 -40.58 Decrease
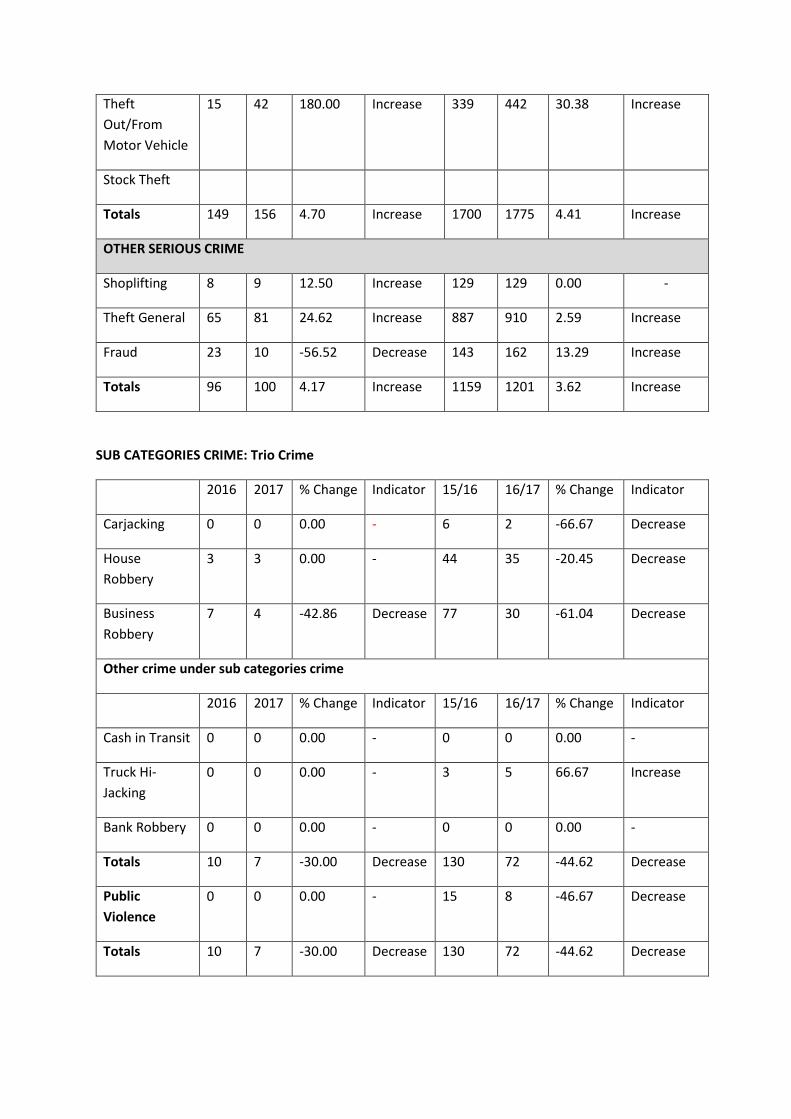
Theft
Out/From
Motor Vehicle
15 42 180.00 Increase 339 442 30.38 Increase
Stock Theft
Totals 149 156 4.70 Increase 1700 1775 4.41 Increase
OTHER SERIOUS CRIME
Shoplifting 8 9 12.50 Increase 129 129 0.00 -
Theft General 65 81 24.62 Increase 887 910 2.59 Increase
Fraud 23 10 -56.52 Decrease 143 162 13.29 Increase
Totals 96 100 4.17 Increase 1159 1201 3.62 Increase
SUB CATEGORIES CRIME: Trio Crime
2016 2017 % Change Indicator 15/16 16/17 % Change Indicator
Carjacking 0 0 0.00 - 6 2 -66.67 Decrease
House
Robbery
3 3 0.00 - 44 35 -20.45 Decrease
Business
Robbery
7 4 -42.86 Decrease 77 30 -61.04 Decrease
Other crime under sub categories crime
2016 2017 % Change Indicator 15/16 16/17 % Change Indicator
Cash in Transit 0 0 0.00 - 0 0 0.00 -
Truck Hi-
Jacking
0 0 0.00 - 3 5 66.67 Increase
Bank Robbery 0 0 0.00 - 0 0 0.00 -
Totals 10 7 -30.00 Decrease 130 72 -44.62 Decrease
Public
Violence
0 0 0.00 - 15 8 -46.67 Decrease
Totals 10 7 -30.00 Decrease 130 72 -44.62 Decrease

Public
Violence
0 0 0.00 - 15 8 -46.67 Decrease
Robber Aggravated(incl Trio)
Robbery with
Firearm
14 9 -35.71 Decrease 168 102 -39.29 Decrease
Robbery with
other weapon
13 15 15.38 Increase 167 185 10.78 Increase
Total for Serious Offences
All Sexual
Offences
15 9 -40.00 Decrease 260 202 -22.31 Decrease
All Trio Crime 10 7 -30.00 Decrease 127 67 -47.24 Decrease
All Serious
offences
465 461 -0.86 Decrease 5581 5304 -4.96 Decrease
2.2.9 COMMUNITY SURVEY 2016
2.2.9.1 THE VOICE OF PEOPLE IN MAKANA
A question was introduced in the Community Survey 2016 that asked households what they considered to be the main problem or difficulty they were facing in their municipality presently. The voice of people in Makana was recorded in terms of:
• Municipal Wide is challenges facing presently; • the extent to which the municipality is trying to resolve the problem; • how people in the municipality rate the services that they receive; • the importance of services provided by the municipality 2.2.9.2 MUNICIPAL WIDE CHALLENGES
Table: 36
CHALLENGES NUMBER %
Lack of safe and reliable water supply 16 779 20%
Lack of/inadequate employment opportunities 12 498 15%
Inadequate housing 11 767 14%
Inadequate roads 11 612 14%
Violence and crime 4 315 5%
Cost of water 3 755 5%
Inadequate sanitation/sewerage/toilet services 3 718 5%

Cost of electricity 3 068 4%
None 2 669 3%
Other 1 964 2%
Inadequate refuse/waste removal 1 954 2%
Alcohol abuse 1 487 2%
Lack of reliable electricity supply 1 450 2%
Corruption 1 448 2%
Inadequate street lights 1 322 2%
Drug abuse 884 1%
Lack of/inadequate parks and recreational area 636 1%
Gangsterism 269 0%
Lack of/inadequate healthcare services 267 0%
Lack of/inadequate public transport 105 0%
Lack of/inadequate educational facilities 92 0%
Grand Total 82 060 100%
2.2.9.3 THE TOP 5 CHALLENGES CURRENTLY FACING MAKANA LOCAL MUNICIPALITY, 2016
According to the community survey conducted by Stats SA (2016), the top five challenges that Makana local municipality is facing presently are as follows:
• Lack of safe and reliable water supply (20% of the population) • Lack of employment opportunity (15% of the population) • Inadequate housing (14% of the population) • Inadequate road (14% of the population) • Violence and crime (5% of the population) 2.2.9.4. RATING OF THE OVERALL QUALITY OF SERVICES
Table: 37
SERVICES GOOD AVERAGE POOR NO ACCESS DO NOT USE TOTAL POPULATION
Electricity supply services 56 698 18 277 5 682 815 587 82 060
Refuse removal services 53 392 19 586 7 799 988 295 82 060
Local public hospital 53 200 16 414 4 843 2 162 5 441 82 060
Local public school 49 309 15 686 8 084 3 016 5 966 82 060
Local public clinic 48 437 16 167 12 048 1 638 3 769 82 060
Toilet/sanitation services 47 863 13 775 17 152 2 667 603 82 060
Local police services 34 839 17 875 22 366 1 409 5 571 82 060
Govrt RDP/subsidised dwelling
9 472 8 831 11 191 61 52 505 82 060

Electricity supply services 69% 22% 7% 1% 1% 100%
Refuse removal services 65% 24% 10% 1% 0% 100%
Local public hospital 65% 20% 6% 3% 7% 100%
Local public school 60% 19% 10% 4% 7% 100%
Local public clinic 59% 20% 15% 2% 5% 100%
Toilet/sanitation services 58% 17% 21% 3% 1% 100%
Local police services 42% 22% 27% 2% 7% 100%
Government RDP/subsidised dwelling
12% 11% 14% 0% 64% 100%
2.2.9.5 .GOOD SERVERS RENDERD
Figure 9:
1 Electricity supply
2 Refuse removal
3 Local public Hospital
4 Local public school
5 Local public clinic
6 Toilet/sanitation
7 Local police
8 Govrt
RDP/Subsidised
9
RDP/subsidised
1 2 3 4 5 6 7 8
69% 65% 65% 60% 59% 58% 42% 12%
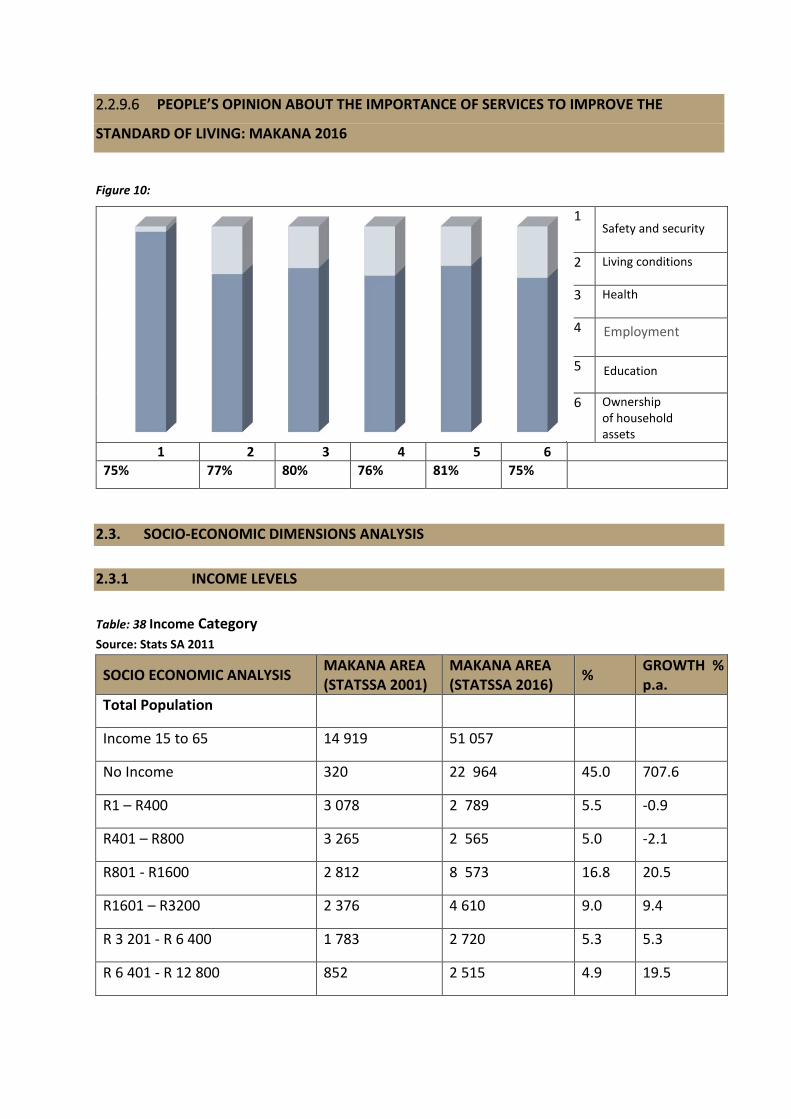
2.2.9.6 PEOPLE’S OPINION ABOUT THE IMPORTANCE OF SERVICES TO IMPROVE THE
STANDARD OF LIVING: MAKANA 2016
Figure 10:
1 Safety and security
2 Living conditions
3 Health
4 Employment
5 Education
6 Ownership of household assets
1 2 3 4 5 6
75% 77% 80% 76% 81% 75%
2.3. SOCIO-ECONOMIC DIMENSIONS ANALYSIS
2.3.1 INCOME LEVELS
Table: 38 Income Category Source: Stats SA 2011
SOCIO ECONOMIC ANALYSIS MAKANA AREA (STATSSA 2001)
MAKANA AREA (STATSSA 2016)
% GROWTH % p.a.
Total Population
Income 15 to 65 14 919 51 057
No Income 320 22 964 45.0 707.6
R1 – R400 3 078 2 789 5.5 -0.9
R401 – R800 3 265 2 565 5.0 -2.1
R801 - R1600 2 812 8 573 16.8 20.5
R1601 – R3200 2 376 4 610 9.0 9.4
R 3 201 - R 6 400 1 783 2 720 5.3 5.3
R 6 401 - R 12 800 852 2 515 4.9 19.5
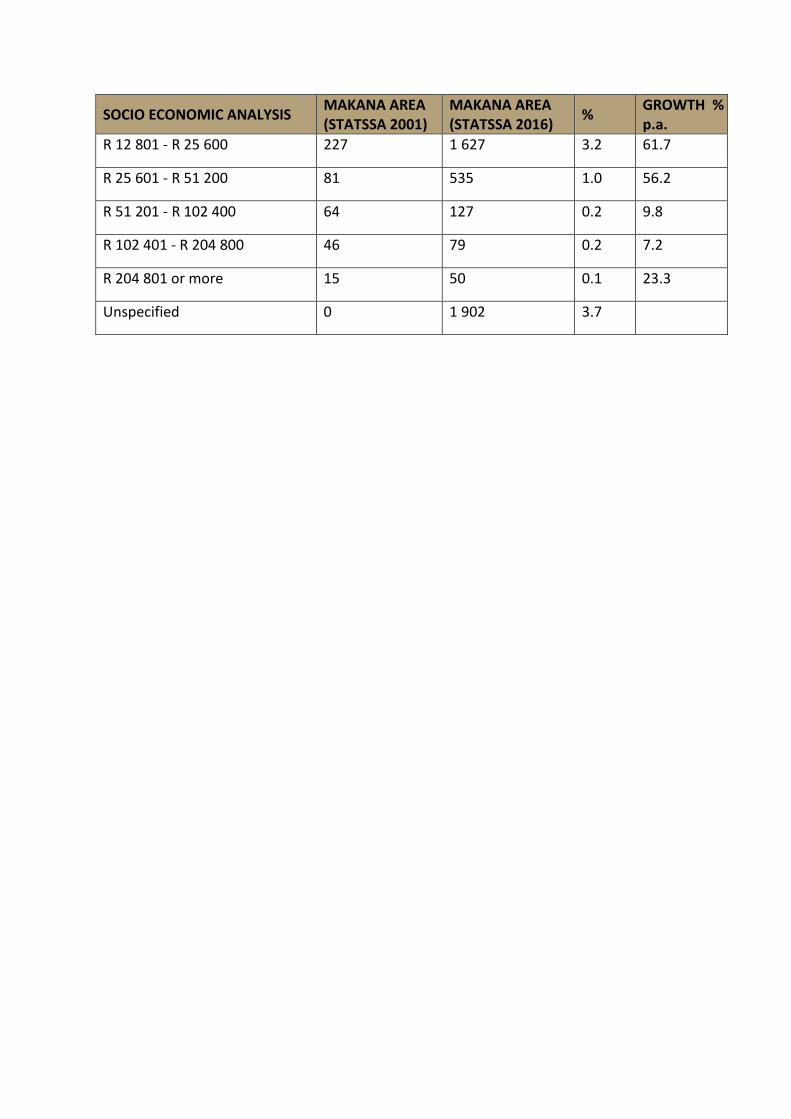
SOCIO ECONOMIC ANALYSIS MAKANA AREA (STATSSA 2001)
MAKANA AREA (STATSSA 2016)
% GROWTH % p.a.
R 12 801 - R 25 600 227 1 627 3.2 61.7
R 25 601 - R 51 200 81 535 1.0 56.2
R 51 201 - R 102 400 64 127 0.2 9.8
R 102 401 - R 204 800 46 79 0.2 7.2
R 204 801 or more 15 50 0.1 23.3
Unspecified 0 1 902 3.7

Table : Statics South; Family Electoral Wards ,Geography by Individual monthly income for
Person weighted
Table 39
No income
R 1 – R 400
R 401 - R 800
R 801 – R 1 600
R 1 601 – R 3 200
R 3 201 – R 6 400
R 6 401 - R 12 800
R 12 801 – R 25 600
R 25 601 – R 51 200
R 51 201 - R 102 400
R 102 401 - R 204 800
R 204 801 or more
Grand Total
21004001: Ward 1
881 513 238 736 247 86 90 43 22 6 2 - 2862
21004002: Ward 2
3386 1013 222 1148 389 281 231 66 20 2 4 1 6762
21004003: Ward 3
3093 575 238 870 385 261 252 217 97 29 12 6 6033
21004004: Ward 4
3172 211 170 716 554 551 666 565 186 57 30 22 6900
21004005: Ward 5
3463 1933 370 1369 556 203 130 32 28 - - - 8085
21004006: Ward 6
2130 787 283 608 258 208 183 94 16 2 4 2 4574
21004007: Ward 7
946 485 175 592 171 76 45 12 3 - - - 2505
21004008: Ward 8
1357 185 49 276 248 279 347 321 83 15 7 9 3176
21004009: Ward 9
2145 892 267 815 302 139 132 90 15 2 1 - 4801
21004010: Ward 10
3338 823 211 1190 388 238 200 58 14 - 2 1 6462
21004011: Ward 11
2757 1661 321 1374 343 120 79 37 17 - 2 - 6712
21004012: Ward 12
52 5 3 7 18 28 33 41 20 1 1 2 211
21004013: Ward 13
2135 887 354 1187 427 201 148 79 57 9 7 - 5491
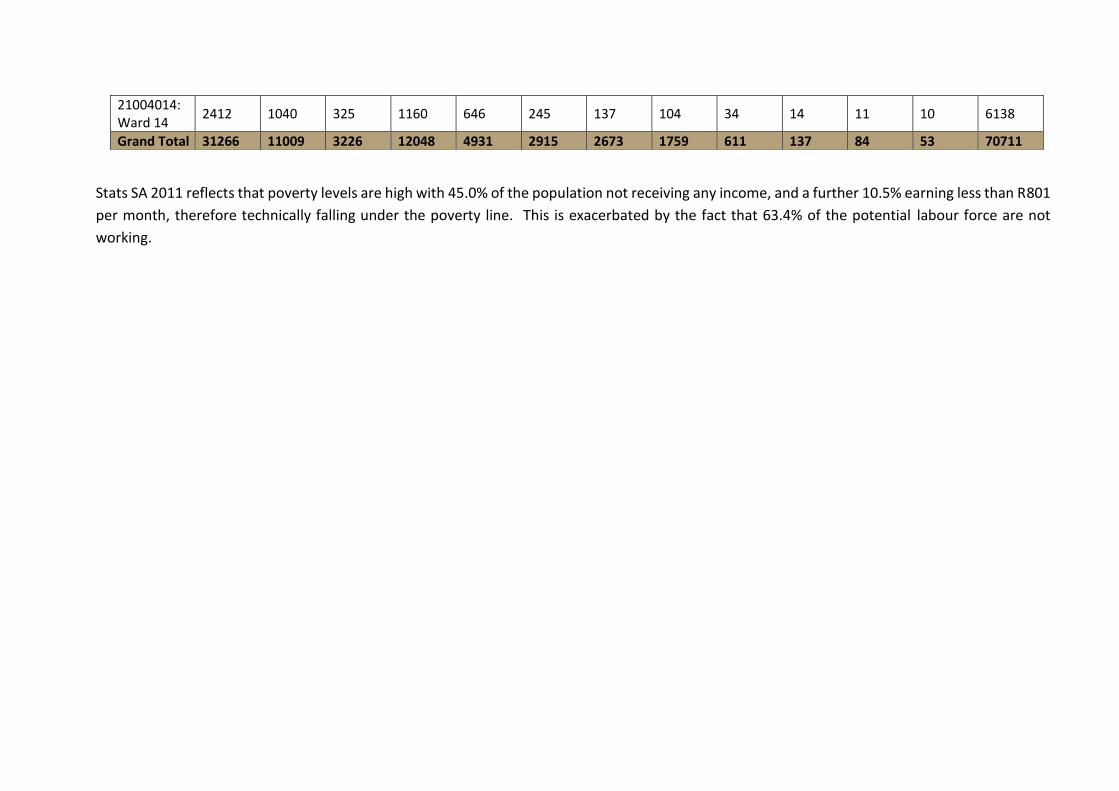
Stats SA 2011 reflects that poverty levels are high with 45.0% of the population not receiving any income, and a further 10.5% earning less than R801
per month, therefore technically falling under the poverty line. This is exacerbated by the fact that 63.4% of the potential labour force are not
working.
21004014: Ward 14
2412 1040 325 1160 646 245 137 104 34 14 11 10 6138
Grand Total 31266 11009 3226 12048 4931 2915 2673 1759 611 137 84 53 70711
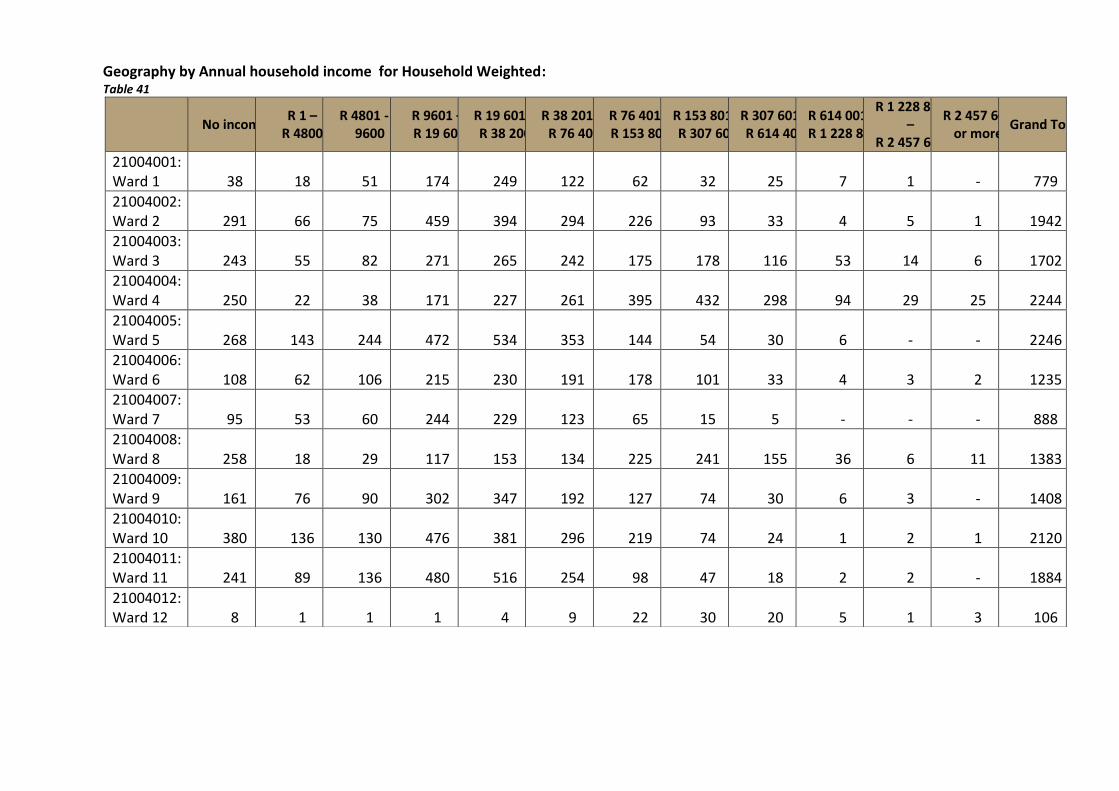
Geography by Annual household income for Household Weighted: Table 41
No income
R 1 – R 4800
R 4801 - R 9600
R 9601 – R 19 600
R 19 601 – R 38 200
R 38 201 – R 76 400
R 76 401 – R 153 800
R 153 801 – R 307 600
R 307 601 – R 614 400
R 614 001 – R 1 228 800
R 1 228 801 –
R 2 457 600
R 2 457 601 or more
Grand Total
21004001: Ward 1 38 18 51 174 249 122 62 32 25 7 1 - 779
21004002: Ward 2 291 66 75 459 394 294 226 93 33 4 5 1 1942
21004003: Ward 3 243 55 82 271 265 242 175 178 116 53 14 6 1702
21004004: Ward 4 250 22 38 171 227 261 395 432 298 94 29 25 2244
21004005: Ward 5 268 143 244 472 534 353 144 54 30 6 - - 2246
21004006: Ward 6 108 62 106 215 230 191 178 101 33 4 3 2 1235
21004007: Ward 7 95 53 60 244 229 123 65 15 5 - - - 888
21004008: Ward 8 258 18 29 117 153 134 225 241 155 36 6 11 1383
21004009: Ward 9 161 76 90 302 347 192 127 74 30 6 3 - 1408
21004010: Ward 10 380 136 130 476 381 296 219 74 24 1 2 1 2120
21004011: Ward 11 241 89 136 480 516 254 98 47 18 2 2 - 1884
21004012: Ward 12 8 1 1 1 4 9 22 30 20 5 1 3 106
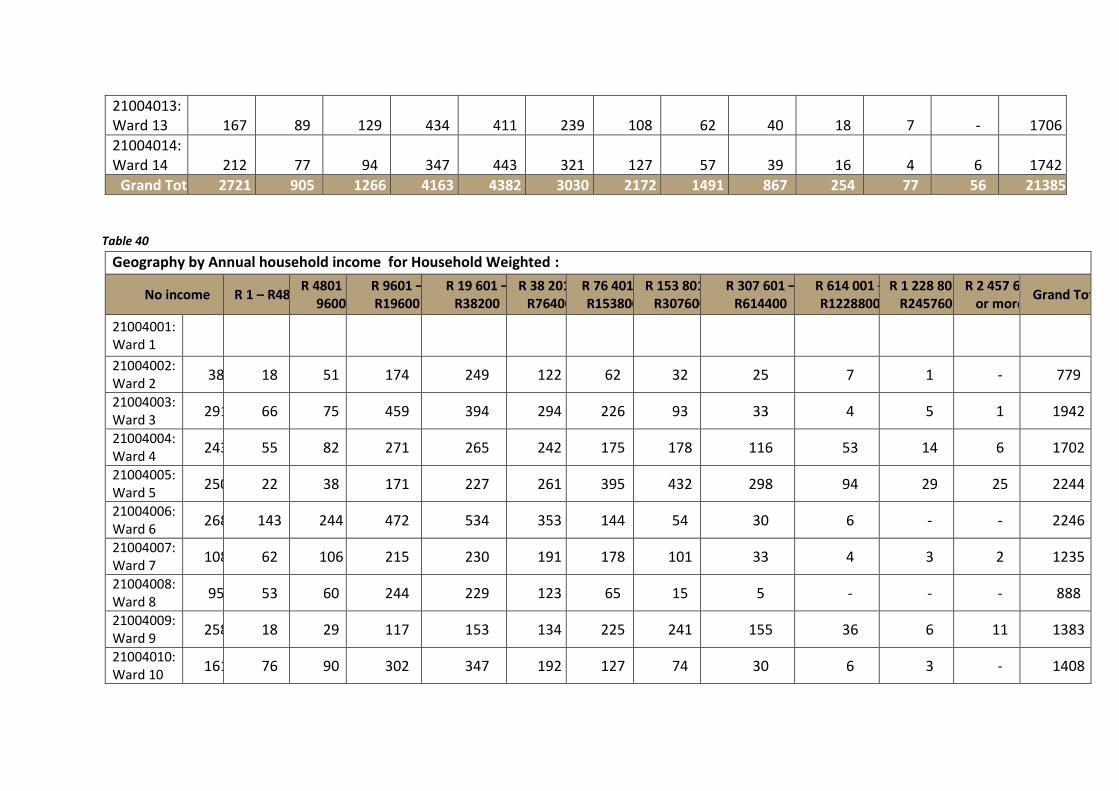
Table 40
Geography by Annual household income for Household Weighted :
No income R 1 – R4800 R 4801 - R
9600 R 9601 –R19600
R 19 601 – R38200
R 38 201 – R76400
R 76 401 – R153800
R 153 801 – R307600
R 307 601 –R614400
R 614 001 –R1228800
R 1 228 801 – R2457600
R 2 457 601 or more
Grand Total
21004001: Ward 1
21004002: Ward 2
38 18 51 174 249 122 62 32 25 7 1 - 779
21004003: Ward 3
291 66 75 459 394 294 226 93 33 4 5 1 1942
21004004: Ward 4
243 55 82 271 265 242 175 178 116 53 14 6 1702
21004005: Ward 5
250 22 38 171 227 261 395 432 298 94 29 25 2244
21004006: Ward 6
268 143 244 472 534 353 144 54 30 6 - - 2246
21004007: Ward 7
108 62 106 215 230 191 178 101 33 4 3 2 1235
21004008: Ward 8
95 53 60 244 229 123 65 15 5 - - - 888
21004009: Ward 9
258 18 29 117 153 134 225 241 155 36 6 11 1383
21004010: Ward 10
161 76 90 302 347 192 127 74 30 6 3 - 1408
21004013: Ward 13 167 89 129 434 411 239 108 62 40 18 7 - 1706
21004014: Ward 14 212 77 94 347 443 321 127 57 39 16 4 6 1742
Grand Total 2721 905 1266 4163 4382 3030 2172 1491 867 254 77 56 21385

78
2.3.2 LABOUR FORCE: GEOGRAPHY BY SUMMATION
Table: 42 Geography by summation
Area Number Percentage
Employed Unemployed Total Employed Unemployed Total
Ward 1 1 123 94 1 217 92.3 7.7 100
Ward 2 1 367 939 2 305 59.3 40.7 100
Ward 3 1 686 586 2 272 74.2 25.8 100
Ward 4 2 809 502 3 311 84.8 15.2 100
Ward 5 1 617 1 321 2 938 55 45 100
Ward 6 930 542 1 472 63.1 36.9 100
Ward 7 695 514 1 209 57.5 42.5 100
Ward 8 1 243 127 1 369 90.8 9.2 100
Ward 9 1 017 910 1 927 52.8 47.2 100
Ward 10 1 407 1 269 2 677 52.6 47.4 100
Ward 11 1 325 1 019 2 344 56.5 43.5 100
Ward 12 117 2 119 98.3 1.7 100
Ward 13 1 953 793 2 746 71.1 28.9 100
Ward 14 1 946 642 2 589 75.2 24.8 100
2.3.3 LABOUR STATUS AND TRENDS
Table: 43 Labour Status
SOCIO ECONOMIC ANALYSIS MAKANA AREA (STATSSA 2001)
MAKANA AREA (STATSSA 2011)
% GROWTH % p.a.
Total Population
Labour status 15 to 65 50 915 52 582
Employed 14 922 19 234 36.6 2.9
Unemployed 14 489 9 260 17.6 -3.6
Non economically active 21 504 24 088 45.8 1.2
Source: Stats SA 2011

79
2.3.4 MAKANA EMPLOYMENT INDEX
Figure11
2.3.4.1 EMPLOYMENT GROWTH IN MAKANA LM (1995-2015)
Figure 12:
1 Ikwezi 2 Ndlambe
3 Makana
4 Kouga
5 Camdeboo
6 Sarah
7 Sundays
8 Baviaans
9 Kou-Kamma
1 2 3 4 5 6 7 8 9
27% 17% 17% 14% 12% 10% 3% -3% -5% Source: Stats SA – Quantec Easy Data, 2016
Makana employment index, 2005 = 100
Jobs in the primary sector have declined by 34 index points
140
133
120 125
110
125
100
90
80
70 64
60
50
2 005 2 006 2 007 2 008 2 009 2 010 2 011 2 012 2 013 2 014 2 015
130

80
2.3.4.2 FORMAL AND INFORMAL EMPLOYMENT
Over the past two decades, informal sector employment in Makana local municipality has more than double
Table 44
Informal Sector Employment
1995 2000 2005 2010 2015 Growth rate
1995 - 2015
Formal employment 16 611 15 807 15 593 14 975 15 792 -5%
Formal: Skilled 3 227 2 978 3 080 3 120 3 144 -3%
Formal: Semi-skilled 6 652 6 265 6 360 6 161 6 541 -2%
Formal: Low skilled 6 732 6 564 6 153 5 694 6 107 -9%
Informal employment 3 845 3 830 3 742 5 597 8 177 113%
Formal + Informal employment
20 456 19 637 19 335 20 572 23 969 17%
Between 1995 and 2015, employment in the informal sector grew most in Ikwezi and Makana Figure 13:
1 Ikwezi 2 Ndlambe
3 Blue Crane
4 Makana
5 Kouga
6 Camdeboo
7 Sarah
8 Sundays
9 Baviaans
10 Kou-Kamma
1 2 3 4 5 6 7 8 9 10
148% 113% 112% 105% 102% 86% 83% 48% 47% 25%

81
2.3.4.3 SKILLS IN MAKANA FORMAL EMPLOYMENT
Skills in Makana’s Formal employment (For every 10 people employed in the formal sector, 2 are skilled) Table 45
EMPLOYMENT PERCENTAGE
FORMAL EMPLOYMENT 66%
Low skilled 39%
Semi-skilled 41%
Formal skilled 20%
INFORMAL EMPLOYMENT 34%
2.3.4.4 SECTOR CONTRIBUTION TO EMPLOYMENT IN MAKANA AND GVA, 2015 Table 46
DEPARTMENTS PERCENTAGE GVA
Agriculture 10% 2.40%
Mining 0% 0.10%
Manufacturing 6% 11.60%
Electricity 0% 1.00%
Construction 8% 4.50%
Trade 25% 19.20%
Transport 5% 7.90%
Finance 10% 19.50%
Community services 19% 8.90%
General government 17% 24.90%
TOTAL 100% 100%

82
2.3.4.5 SECTORS CONTRIBUTION TO GDP: (MAKANA, 2015)Table 47
SECTORS PERCENTAGE Agriculture 1%
Mining 0%
Manufacturing 12%
Electricity 1%
Construction 5%
Trade 19%
Transport 8%
Finance 19%
Community services 9%
General government 25%
2.3.4.6 SECTORS WITH COMPARATIVE ADVANTAGE Table 48
SECTORS PERCENTAGE
Leather and leather products 3.71
Motor vehicles + parts 2.6
Transport equipment 2.24
Education 2.03
Rubber products 1.94
Non-metallic mineral products 1.73
Catering and accommodation services 1.66
Other community services 1.55
Community and personal services 1.51
National and Provincial government 1.5
General government 1.49
Local government 1.42
Basic chemicals 1.36
Health and social work (Private) 1.28
Trade 1.27
Food 1.27
Wholesale and retail trade 1.24
Textiles 1.17
Tertiary sector 1.17
Construction 1.16
Business activities n.e.c. 1.15
Agriculture 1.13
Textiles, clothing and leather goods 1.12

83
SECTORS PERCENTAGE
Food, beverages and tobacco 1.06
Business services 1.03
Other manufacturing groups 1.01
Professional business services 1
2.3.4.6 INVESTMENT IN MAKANA
Building and construction works investment in Makana is 48%, machinery 38% and total
investment in 2015 was R961 million.
Table 49
SECTORS PERCENTAGE
Transfer costs 2%
Building and construction works 48%
Machinery and other equipment 38%
Transport equipment 12%
2.4 INSTITUTIONAL PLAN
2.4.1 COMPOSITION OF THE MUNICIPALITY
Makana Municipality is established in terms of Section 12 of the Municipal Structures Act, 1998 (Act 118
of 1998) Structures Act as a Municipality with a Mayoral Executive System combined with a Ward
Participatory System. Section 2(b) of the Municipal Systems Act states that a Municipality is constituted
by its political structures, administration and community; Political structures include:
The Municipal Council which comprises 27 Councillors, 14 of whom are Ward Councillors and 13 of whom
are Proportional Representation (PR) Councillors;
The Office of the Speaker: the Speaker is the Chairperson of the Municipal Council; o The Executive Mayor
and Executive Mayoral Committee; and Portfolio Committees who oversight Directorate operations. The
Administration is divided in 6 Directorate Namely:
DIRECTORATE OFFICE
01. The Municipal Manager City Hall, Church Square, Grahamstown
02. Corporate and Shared Services City Hall, Church Square, Grahamstown
03. Public Safety and Community
Services
City Hall, Church Square, Grahamstown
04. Budget and Treasury office 86 High Street, Grahamstown

84
05. Engineering and Technical Services 86 High Street, Grahamstown
06. Local Economic Development and
Planning
Church Square, Grahamstown
SATELLITE OFFICE
01. Riebeeck East 63 Morgan Street Riebeeck East 580
02. Alicedale 1003 Main Alicedale 6135
Municipality has created community structures include: Ward Committees, the IDP Representative
Forum, Sector Engagements Forums and Ward Room Forums, Business sector forums
2.4.2 POWERS AND FUNCTIONS
Section 156, read together with Schedules 4B and 5B of the Constitution sets out the functions of a
Municipality. Section 84 of the Municipal Structures Act regulates the division of these functions
between the District and Local Municipality.
The Makana LM currently has 36 different functions, based on the Municipal Systems Act, No 32 of
2000 and Act 117 of 1998.
Table 50
No. POWERS AND FUNCTION No. POWERS AND FUNCTION
1. Child care facilities 19. Local amenities
2. Firefighting DM function 20. Municipal parks and recreation
3. Municipal airports 21. Municipal Roads
4. Municipal Health services 22. Noise pollution
5. Pontoons and ferries 23. Pound
6. Trading regulations 24. Public places
7. Sanitation 25. Refuse removal, refuse dumps and solid
waste disposal
8. Building regulations 26. Control of undertakings that sell liquor to the
public
9. Electricity reticulation 27. Fencing and fences
10. Local tourism 28. Street trading
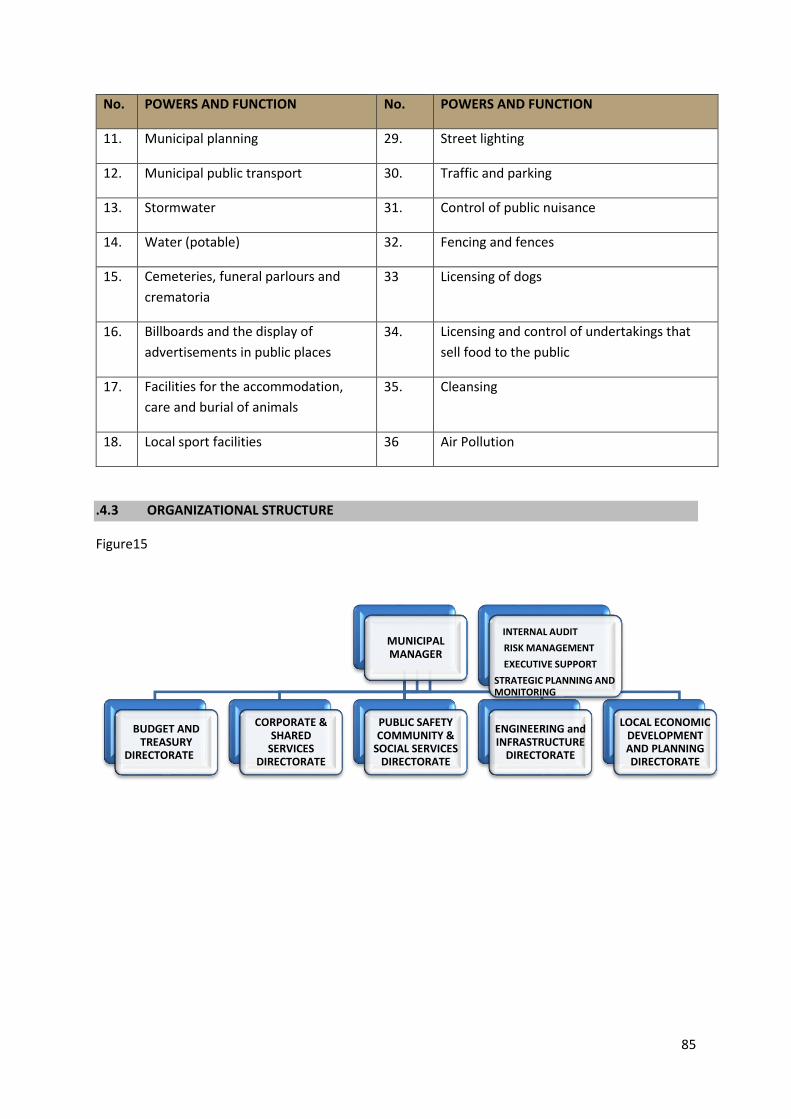
85
No. POWERS AND FUNCTION No. POWERS AND FUNCTION
11. Municipal planning 29. Street lighting
12. Municipal public transport 30. Traffic and parking
13. Stormwater 31. Control of public nuisance
14. Water (potable) 32. Fencing and fences
15. Cemeteries, funeral parlours and
crematoria
33 Licensing of dogs
16. Billboards and the display of
advertisements in public places
34. Licensing and control of undertakings that
sell food to the public
17. Facilities for the accommodation,
care and burial of animals
35. Cleansing
18. Local sport facilities 36 Air Pollution
.4.3 ORGANIZATIONAL STRUCTURE
Figure15
MUNICIPALMANAGER
BUDGET AND TREASURY
DIRECTORATE
CORPORATE & SHARED
SERVICES DIRECTORATE
PUBLIC SAFETY COMMUNITY &
SOCIAL SERVICES DIRECTORATE
ENGINEERING and INFRASTRUCTURE
DIRECTORATE
LOCAL ECONOMIC DEVELOPMENT AND PLANNING DIRECTORATE
INTERNAL AUDIT
RISK MANAGEMENT
EXECUTIVE SUPPORT
STRATEGIC PLANNING AND MONITORING

86
Table 51
DIRECTORATE DEPARTMENT
Municipal Manager’s Office
Risk Management
Internal Audit
Executive support
Strategic Planning and Monitoring
Information Technology and Communication
Legal and Land Estate
Corporate and Share Services
Human Resources
Legal Services
Administration
Council support
Records Management
Budget and Treasury Services
Budget
Revenue Management
Expenditure Management
Supply Chain Management
Compliance and Reporting
Public Safety and Community Services
Library services
Environmental management
Waste Management
Traffic control and road worthy
Fire and rescue services
Disaster management
Engineering and Technical Services Water and sanitation
Roads and storm water

87
DIRECTORATE DEPARTMENT
Electricity
Housing
PMU
Local Economic Development and
Planning
SMME development
Tourism
Trade and investment
Heritage development
Agriculture
Spatial Development Framework
Rural Development
2.4.3.1 ORGANIZATIONAL STRUCTURE CHALLENGES
The municipality annually undertook a comprehensive organisational development exercise for the entire
institution. The objective is the alignment of the current and future organisational needs. The current
organisational structure which is under review was approved by Council in January 2017.
2.4.3.2 STAFFING AND ESTABLISHMENT, CRITICAL POSITION AND VACANCY RATE
Table 52
2.4.3.2.1: VACANCY RATE SCHEDULE
Total positions of the entity
(incl. non-funded positions)
Total vacant non-funded
positions Total Vacant Positions as per Organogram
1031 290 405
Table 53
POSITION TASK GRADE STATUS
MUNICIPAL MANAGER'S OFFICE
1 X Municipal Manager Section 56 Advertised

88
POSITION TASK GRADE STATUS
1 X Manager ICT 15 Filled
1 X Secretary to the MM 7 Awaiting for motivation
1 X Systems Administrator 12 Interviews: 26 February 2018
TOTAL VACANT POSITIONS 4
ENGINEERING & INFRASTRUCTURAL SERVICES
1 X Manager: PMU
1 X Sewer Worker / Operator Grade 2 3
1 X TLB Operator: Water Reticulation /
Maintenance
6 Re-advertised :31 March 2017 (on hold due
to moratorium)
2 X Truck Drivers: Water Reticulation /
Maintenance
6 To be re-advertised
1 X Manager: Roads & Storm water 15 Moratorium
1 X Senior Technician 14 Moratorium
11 X General Worker 3 Moratorium
1 X Shift man 6 Moratorium
1 X Senior Mechanic 10 Moratorium
1 X Superintendent 11 Moratorium
1 X Plumber 9 Moratorium
1 X Pump Attendant 6 Moratorium
1 X Light Fitter Highmast 5 Moratorium
1 X Driver 6 Moratorium
1 X Supervisor Driver 6 Moratorium
1 X Grader Operator 6 Moratorium
TOTAL VACANT POSITIONS 27
COMMUNITY & PUBLIC SAFETY
Parks Department

89
POSITION TASK GRADE STATUS
1 X Sports and Recreation Officer 11 Moratorium
4 X Machine Operator 3 Moratorium
1 X Tractor Driver 5 Moratorium
1 X Truck Driver 6 Moratorium
2 X Machine Operator (Vegetation
Control Unit)
4 Moratorium
1 X Machine Operator (Sports Ground) 4 Moratorium
2 X Leading Hand (Nursery) 5 Moratorium
1 X Foreman (Auxiliary Services) 9 Moratorium
1 X Commonage Artisan 3 Moratorium
1 X General Worker (Collection) 3 Moratorium
2 X Library Assistant 5 Moratorium
1 X Toilet Cleaner 3 Moratorium
2 X Cleaner 3 Moratorium
2 X General Worker 3 Moratorium
1 X Street Sweeper 3 Moratorium
TOTAL VACANT POSITIONS 23
Cleansing Department
1 X Superintendent 9 Ready for shortlisting
1 X Driver Supervisor 7 Ready for shortlisting
5 X General Worker (Cleansing) 3 Moratorium
2 X Toiler Cleaner (Cleansing) 3 Moratorium
2 X Street Sweeper (Cleansing) 3 Moratorium
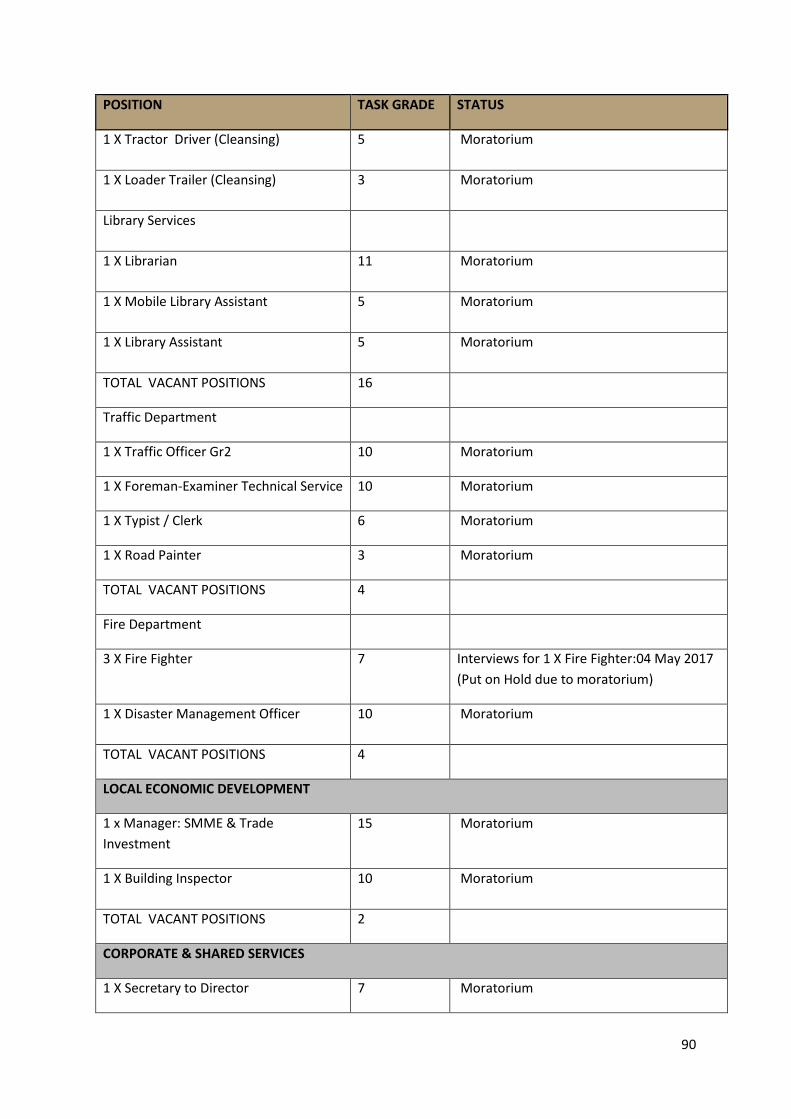
90
POSITION TASK GRADE STATUS
1 X Tractor Driver (Cleansing) 5 Moratorium
1 X Loader Trailer (Cleansing) 3 Moratorium
Library Services
1 X Librarian 11 Moratorium
1 X Mobile Library Assistant 5 Moratorium
1 X Library Assistant 5 Moratorium
TOTAL VACANT POSITIONS 16
Traffic Department
1 X Traffic Officer Gr2 10 Moratorium
1 X Foreman-Examiner Technical Service 10 Moratorium
1 X Typist / Clerk 6 Moratorium
1 X Road Painter 3 Moratorium
TOTAL VACANT POSITIONS 4
Fire Department
3 X Fire Fighter 7 Interviews for 1 X Fire Fighter:04 May 2017
(Put on Hold due to moratorium)
1 X Disaster Management Officer 10 Moratorium
TOTAL VACANT POSITIONS 4
LOCAL ECONOMIC DEVELOPMENT
1 x Manager: SMME & Trade
Investment
15 Moratorium
1 X Building Inspector 10 Moratorium
TOTAL VACANT POSITIONS 2
CORPORATE & SHARED SERVICES
1 X Secretary to Director 7 Moratorium

91
POSITION TASK GRADE STATUS
2 X Records Clerk (Registry) 5 Moratorium
1 X Committee Clerk 7 Moratorium
1 X Employee Wellness Practitioner 10 Moratorium
2 X General Worker (Alicedale) 3 Moratorium
TOTAL VACANT POSITIONS 8
BUDGET & TREASURY
1X Senior Clerk: Rates & Indigent 7 Closing date: 09 February 2018
1 X Clerk Grade / Payroll Clerk 6 Moratorium
TOTAL VACANT POSITIONS 2
2.4.3.2.3 FILLED SENIOR MANAGERS POSITION AND VACANT
Table 54
OFFICE POSITION NAME
EXECUTIVE MAYOR Strategic Manager Vacant
SPU Manager Mr. V. Wali
SPEAKERS OFFICE Manager in the Office of the Speaker Ms. N. Santi
MM’S OFFICE
MUNICIPAL MANAGER VACANT
Risk Officer Mrs. N, Kosi
Strategic Planning & Monitoring Mr. M. Pasiya
Manager Internal Audit Mr. A. Ngcauzele
Manager ICT Mr. A. Tsewu
PMU Manager In progress
Manager: Support Services Mr. E. Ganza
Unit Manager Riebeeck East Ms. N. Kulati
Director Mrs. N. Mazwayi
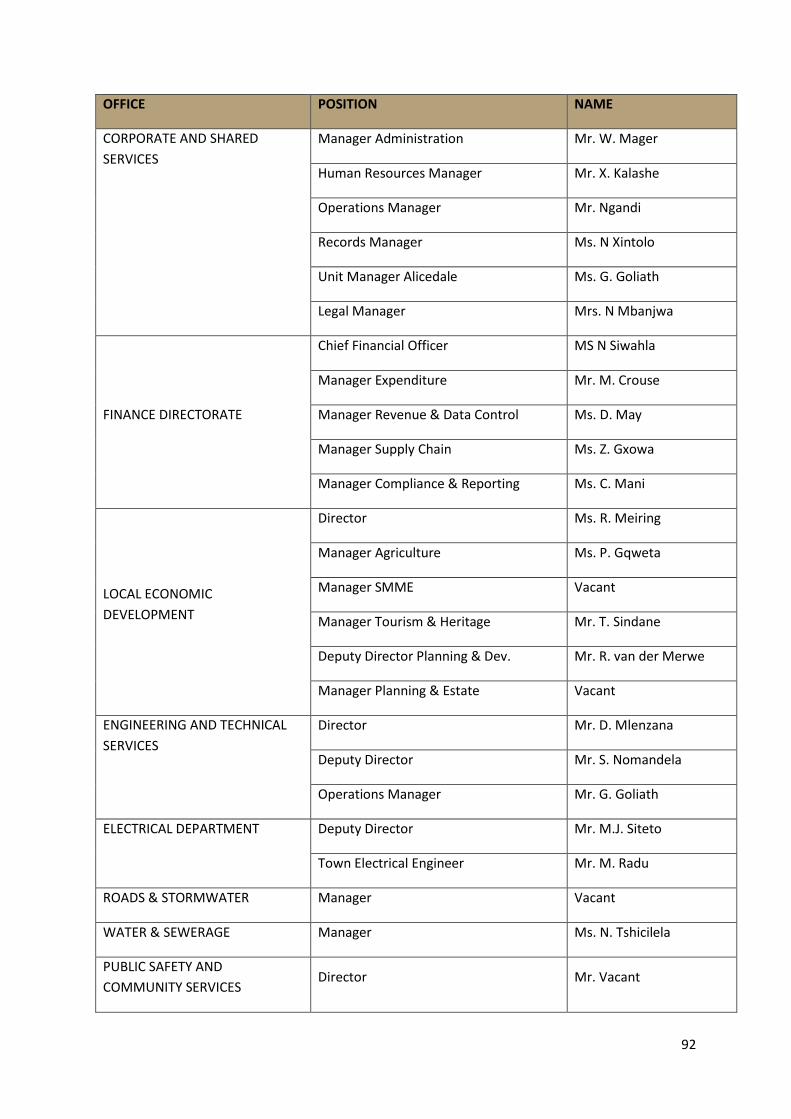
92
OFFICE POSITION NAME
CORPORATE AND SHARED
SERVICES
Manager Administration Mr. W. Mager
Human Resources Manager Mr. X. Kalashe
Operations Manager Mr. Ngandi
Records Manager Ms. N Xintolo
Unit Manager Alicedale Ms. G. Goliath
Legal Manager Mrs. N Mbanjwa
FINANCE DIRECTORATE
Chief Financial Officer MS N Siwahla
Manager Expenditure Mr. M. Crouse
Manager Revenue & Data Control Ms. D. May
Manager Supply Chain Ms. Z. Gxowa
Manager Compliance & Reporting Ms. C. Mani
LOCAL ECONOMIC
DEVELOPMENT
Director Ms. R. Meiring
Manager Agriculture Ms. P. Gqweta
Manager SMME Vacant
Manager Tourism & Heritage Mr. T. Sindane
Deputy Director Planning & Dev. Mr. R. van der Merwe
Manager Planning & Estate Vacant
ENGINEERING AND TECHNICAL
SERVICES
Director Mr. D. Mlenzana
Deputy Director Mr. S. Nomandela
Operations Manager Mr. G. Goliath
ELECTRICAL DEPARTMENT Deputy Director Mr. M.J. Siteto
Town Electrical Engineer Mr. M. Radu
ROADS & STORMWATER Manager Vacant
WATER & SEWERAGE Manager Ms. N. Tshicilela
PUBLIC SAFETY AND
COMMUNITY SERVICES Director Mr. Vacant
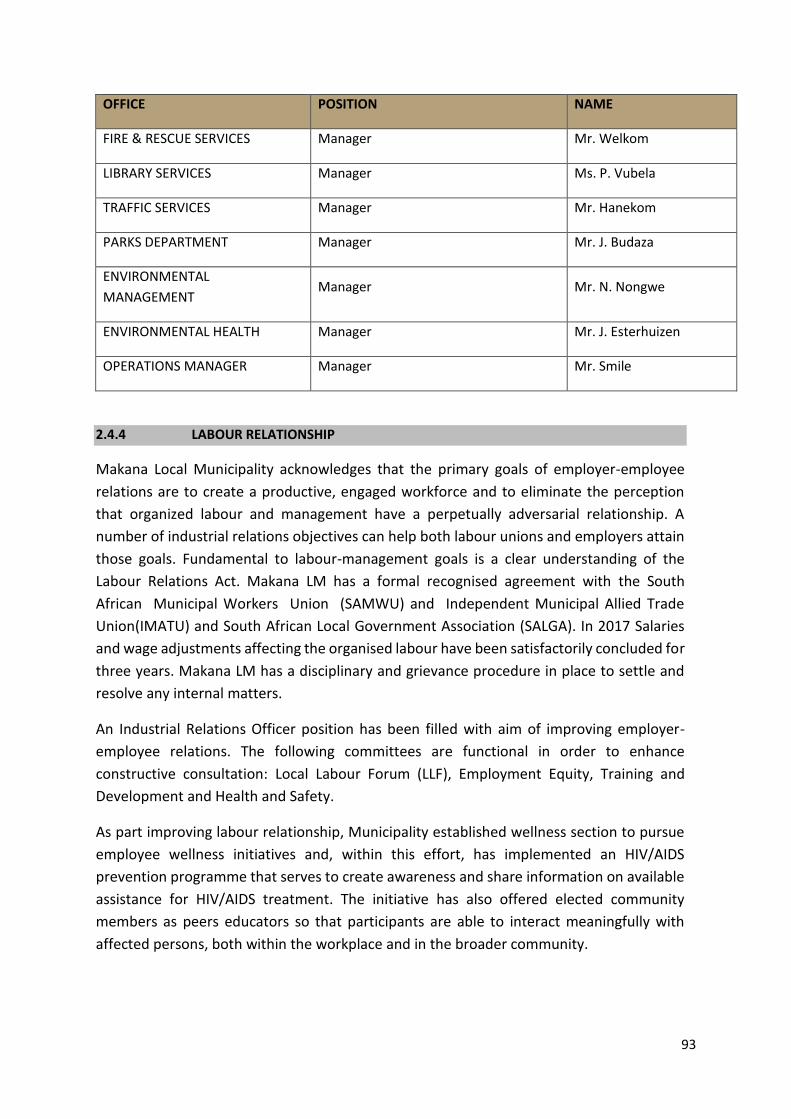
93
OFFICE POSITION NAME
FIRE & RESCUE SERVICES Manager Mr. Welkom
LIBRARY SERVICES Manager Ms. P. Vubela
TRAFFIC SERVICES Manager Mr. Hanekom
PARKS DEPARTMENT Manager Mr. J. Budaza
ENVIRONMENTAL
MANAGEMENT Manager Mr. N. Nongwe
ENVIRONMENTAL HEALTH Manager Mr. J. Esterhuizen
OPERATIONS MANAGER Manager Mr. Smile
2.4.4 LABOUR RELATIONSHIP
Makana Local Municipality acknowledges that the primary goals of employer-employee
relations are to create a productive, engaged workforce and to eliminate the perception
that organized labour and management have a perpetually adversarial relationship. A
number of industrial relations objectives can help both labour unions and employers attain
those goals. Fundamental to labour-management goals is a clear understanding of the
Labour Relations Act. Makana LM has a formal recognised agreement with the South
African Municipal Workers Union (SAMWU) and Independent Municipal Allied Trade
Union(IMATU) and South African Local Government Association (SALGA). In 2017 Salaries
and wage adjustments affecting the organised labour have been satisfactorily concluded for
three years. Makana LM has a disciplinary and grievance procedure in place to settle and
resolve any internal matters.
An Industrial Relations Officer position has been filled with aim of improving employer-
employee relations. The following committees are functional in order to enhance
constructive consultation: Local Labour Forum (LLF), Employment Equity, Training and
Development and Health and Safety.
As part improving labour relationship, Municipality established wellness section to pursue
employee wellness initiatives and, within this effort, has implemented an HIV/AIDS
prevention programme that serves to create awareness and share information on available
assistance for HIV/AIDS treatment. The initiative has also offered elected community
members as peers educators so that participants are able to interact meaningfully with
affected persons, both within the workplace and in the broader community.

94
2.4.5 WORK SKILLS PLAN AND TRAINING DEVELOPMENT
Workplace Skills Plan is developed annually by the Skills Development Facilitator. This is a
product of numerous processes that ranged from identifying the employee current, gaps or
future skills. The Workplace Skills Plan is approved by Council with a specific budget and
implementation report is submitted to the Local Government SETA on the 30 March 2018 to
recover a portion of monies spent on implementing the plan. The Makana LM offers various
annual in-service training, internship opportunities to promote the development of skills in
specific areas in order to encourage growth and exposure for the youth.
Targeted training and employment are also used to affirm previously disadvantaged
categories, with a special training initiative to address the gender imbalances in the
workforce. There has been a particular focus on developing women as water treatment works
operators over the past five years, this trend will continue in the future.
2.4.6 PERFORMANCE MANAGEMENT
It is noted that the municipality has revised its Performance Management System and was approved
by Council in June 2016. PMS is not implemented in the across municipality, Performance evaluation
are only done at senior management only.
Makana does not actively manage performance outcomes in relation to development, managing poor
performance and recognition of performance. There is lack of consequence for poor performance and
transgression of policies and procedures within the municipality.
This has created a culture of non-performance which has a negative impact on service delivery,
financial management sustainability and the audit outcome.
Some of the root causes that have been identified to have led to performance management related
issues include: The non-availability of a champion and to oversee the implementation of The
Performance Management System within the municipality; and
The lack of segregation of duties between the IDP/PMS Manager and the relevant personnel
responsible for Performance Management within the municipality as organisational performance
management fall within the IDP/PMS function. This weakens the control environment and the
effective implementation of the performance management system (PMS) within the municipality.
The municipality will therefore undertake a process of performance review of all municipal employees
and implement measures to address poor or non-performance.
The human resources function has not undertaken any workshops on performance management for
all departments and/ or employees within the municipality, specifically regarding target setting which
requires performance targets to be specific in clearly identifying the nature and required level of
performance.
Evidence also suggests that thirty-three percent (33%) of the indicators were not well defined, specific
or time-bound according to the SMART principle and hence, it is critical that the human resource
function takes the role of work shopping all stakeholders on performance management.

95
The human resource function in the municipality requires support in the development and
implementation of a good practice framework and/ or guidelines to ensure that the performance
management framework illustrates how key performance indicators (KPIs) should be cascaded from
the strategic level to the lowest level in the municipality.
2.4.7 INSTITUTIONAL POLICIES AND PROCEDURES
NO POLICY TITLE DIRECTORATE LAST REVIEW
1 Telephone Use Corporate and Shared Services 24-Jun-2017
2 Use of Municipal halls Corporate and Shared Services 11-Jun-15
3 Report writing Corporate and Shared Services 11-Jun-15
4 Records Management Corporate and Shared Services 24-Jun-16
5 Communication Corporate and Shared Services 24-Jun-16
6 Termination of
employment
Corporate and Shared Services 24-Jun-2017
7 Employee Wellness
programme
Corporate and Shared Services 24-Jun-2017
8 Internship Corporate and Shared Services 24-Jun-2017
9 Leave of absence and
procedure
Corporate and Shared Services 24-Jun-2017
10 Overtime and
procedure
Corporate and Shared Services 24-Jun-2017
11 Recruitment and
Selection
Corporate and Shared Services 24-Jun-2017
12 Retention Corporate and Shared Services 24-Jun-2017
13 Study Assistance Corporate and Shared Services 24-Jun-2017
14 Training and
Development
Corporate and Shared Services 24-Jun-16
15 Transport allowance Corporate and Shared Services 24-Jun-16

96
NO POLICY TITLE DIRECTORATE LAST REVIEW
16 Fleet Management Corporate and Shared Services 24-Jun-16
17 Subsistence & Travel Corporate and Shared Services 24-Jun-16
18 Placement, Promotion,
Demotion and Transfer
Policy
Corporate and Shared Services Adopted in 2016
19 Dress Code Policy Corporate and Shared Services Adopted in 2016
20 Municipal Residents
Policy
LED and Planning Adopted in 2016
21 Land Disposal Policy LED and Planning 24-Jun-16
22 ICT Policy Framework Municipal Manager’s Office 11-Jun-15
23 Information &
Technology Change
Management Policy
Municipal Manager’s Office 11-Jun-15
24 IT Use Policy Municipal Manager’s Office 11-Jun-15
25 Change Control Policy
and Procedure
Municipal Manager’s Office 24-Jun-16
26 Fraud Prevention Municipal Manager’s Office 11-Jun-15
27 Risk Management Policy Municipal Manager’s Office 24-Mar-13
28 International Relations Municipal Manager’s Office
29 IGR Framework Municipal Manager’s Office
30 Catering Municipal Manager’s Office
31 Performance
Management Policy
Municipal Manager’s Office Last reviewed in 2017

97
NO POLICY TITLE DIRECTORATE LAST REVIEW
32 Property Rates Budget and Treasury 26-May-16
33 Property Rates by-law Budget and Treasury 26-May-16
34 Assistance to the poor
& Indigent
Budget and Treasury 26-May-16
35 Cash Management and
Investment
Budget and Treasury 26-May-16
36 Funding Reserves Budget and Treasury 11-Jun-15
37 Tariff Budget and Treasury 26-May-16
38 Expenditure Budget and Treasury 24-Jun-16
39 Budget Budget and Treasury 26-May-16
40 Asset Management Budget and Treasury 11-Jun-15
41 Supply Chain
Management
Budget and Treasury 24-Jun-16
42 Petty cash Budget and Treasury 24-Jun-16
43 Grant in Aid in Lieu of
Rates
Budget and Treasury 26-May-16
44 Credit Control and Debt
Collection
Budget and Treasury 26-May-16
45 Credit Control and
Revenue Management
by-law
Budget and Treasury 26-May-16
46 Provision of Debt Write
off – Doubtful debt
Budget and Treasury 26-May-16
47 Inventory Management Budget and Treasury 24-Jun-16
48 Virement Budget and Treasury 11-Jun-15
49 HIV/AIDS Mayor’s Office
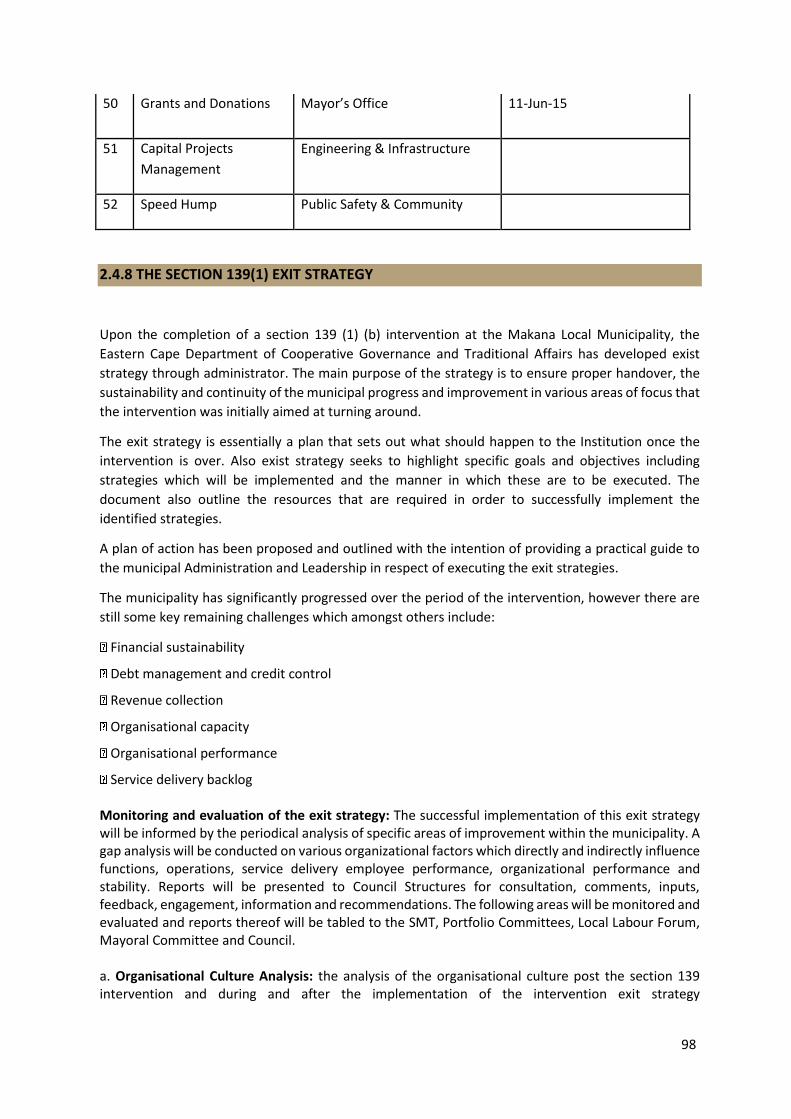
98
50 Grants and Donations Mayor’s Office 11-Jun-15
51 Capital Projects
Management
Engineering & Infrastructure
52 Speed Hump Public Safety & Community
2.4.8 THE SECTION 139(1) EXIT STRATEGY
Upon the completion of a section 139 (1) (b) intervention at the Makana Local Municipality, the
Eastern Cape Department of Cooperative Governance and Traditional Affairs has developed exist
strategy through administrator. The main purpose of the strategy is to ensure proper handover, the
sustainability and continuity of the municipal progress and improvement in various areas of focus that
the intervention was initially aimed at turning around.
The exit strategy is essentially a plan that sets out what should happen to the Institution once the
intervention is over. Also exist strategy seeks to highlight specific goals and objectives including
strategies which will be implemented and the manner in which these are to be executed. The
document also outline the resources that are required in order to successfully implement the
identified strategies.
A plan of action has been proposed and outlined with the intention of providing a practical guide to
the municipal Administration and Leadership in respect of executing the exit strategies.
The municipality has significantly progressed over the period of the intervention, however there are
still some key remaining challenges which amongst others include:
Financial sustainability
Debt management and credit control
Revenue collection
Organisational capacity
Organisational performance
Service delivery backlog Monitoring and evaluation of the exit strategy: The successful implementation of this exit strategy will be informed by the periodical analysis of specific areas of improvement within the municipality. A gap analysis will be conducted on various organizational factors which directly and indirectly influence functions, operations, service delivery employee performance, organizational performance and stability. Reports will be presented to Council Structures for consultation, comments, inputs, feedback, engagement, information and recommendations. The following areas will be monitored and evaluated and reports thereof will be tabled to the SMT, Portfolio Committees, Local Labour Forum, Mayoral Committee and Council. a. Organisational Culture Analysis: the analysis of the organisational culture post the section 139 intervention and during and after the implementation of the intervention exit strategy

99
implementation to observe the employee and management behaviour, performance improvements, commitment, conduct and loyalty.
b. Local Community Surveys: the conducting of community surveys in ascertaining their views, perceptions about the changes, service delivery improvements, rates and imposed tariffs, commitment to pay rates, and including general perceptions about the status of the municipality.
c. Municipal and Employee Performance Analysis: An analysis of the municipality and individual departmental performance informed by employee’s performance in each department with emphasis on how the exit strategies have impacted on beneficiaries.
d. Institutional Sustainability Analysis: An analysis of cost effectiveness on the impact of the implementation of exit strategies to the Institutional survival and turnaround.
e. Budget Expenditure Analysis: An analysis of departmental and municipal exit strategy budget expenditure, implications on over and or under-expenditure and return-on-investment.
f. Cost-Benefit Analysis: to systematically analyse and estimate the strengths and weaknesses of activities implemented by, estimating the equivalent of budget, resources spent and costs to the benefits achieved within the municipality and to the communities to see if the implementation of activities was worthwhile.
2.5. GOOD GOVERNANCE AND PUBLIC PARTICIPATION
Makana Municipality is a Category B Municipality (local municipality) with an executive Mayoral
Committee System combined with a Ward Participatory System, as defined under Chapter 1 of
the Local Government: Municipal Structures Act No. 117 of 1998. The Political and
Administrative seat is situated in Grahamstown.
2.5.1 GOVERNANCE STRUCTURES
Section 53 of the Municipal Systems Act (Act 32 of 200), stipulates inter alia that the respective
roles and areas of responsibilities of each political structures and each Political Office Bearer of
the Municipality and the Municipal Manager must be defined. Makana Municipality has
Fourteen (14) ward and 28 Councillors.
2.5.2 MAKANA POLITICAL STRUCTURE OVERVIEW
The Makana Local Municipality was established in terms of Section 12 of the Local Government
Municipal Structures Act (Act No. 177 of 1998). Council has of twenty eight (28) Councillors
(including the Mayor), 12 of whom are proportional councillors.
The municipality operates in an Executive Mayoral Committee system with an Executive Mayor
and five Portfolio Chairpersons being members of the Mayoral Committee.
The Council plays an oversight role in terms of the delegations and the Mayor and council
provides political guidance over the financial matters of the Municipality.

100
There is a fully functional Audit Committee attached to the municipality that provides opinions
and recommendations on financial processes and performance and provides comments to the
Oversight Committee on the Annual Report.
The Municipal Public Accounts Committee is comprised of non-executive councillors, with the
specific purpose of providing the Council with comments and recommendations on the Annual
Report. The Oversight Committee report will be published separately in accordance with MFMA
guidance.
2.5.2.1 OUTLINE OF THE POLITICAL STRUCTURE
Figure16
EXECUTIVE MAYOR: CLR N. Gaga
MAYORAL COMMITTEE MEMBERS
Chairperson of Social Services Development Committee Cllr P. Matyumza
Chairperson of Finance, Administration, Monitoring and
Evaluation Committee Cllr T. Masoma
Chairperson of Infrastructure Development Committee Cllr M. Matyumza
Chairperson of Local Economic Development Committee Cllr E. Louw
COUNCIL
SPEAKER
EXECUTIVE MAYOR MAYORAL COMMITTEE
AUDIT COMMITTEE
MPEC
STANDING COMMITTEE
Financial Admin, Monitoring & Evaluation
Social Services Development
Infrastructure Development
Local Economic Development
Tourism and Creative Industries
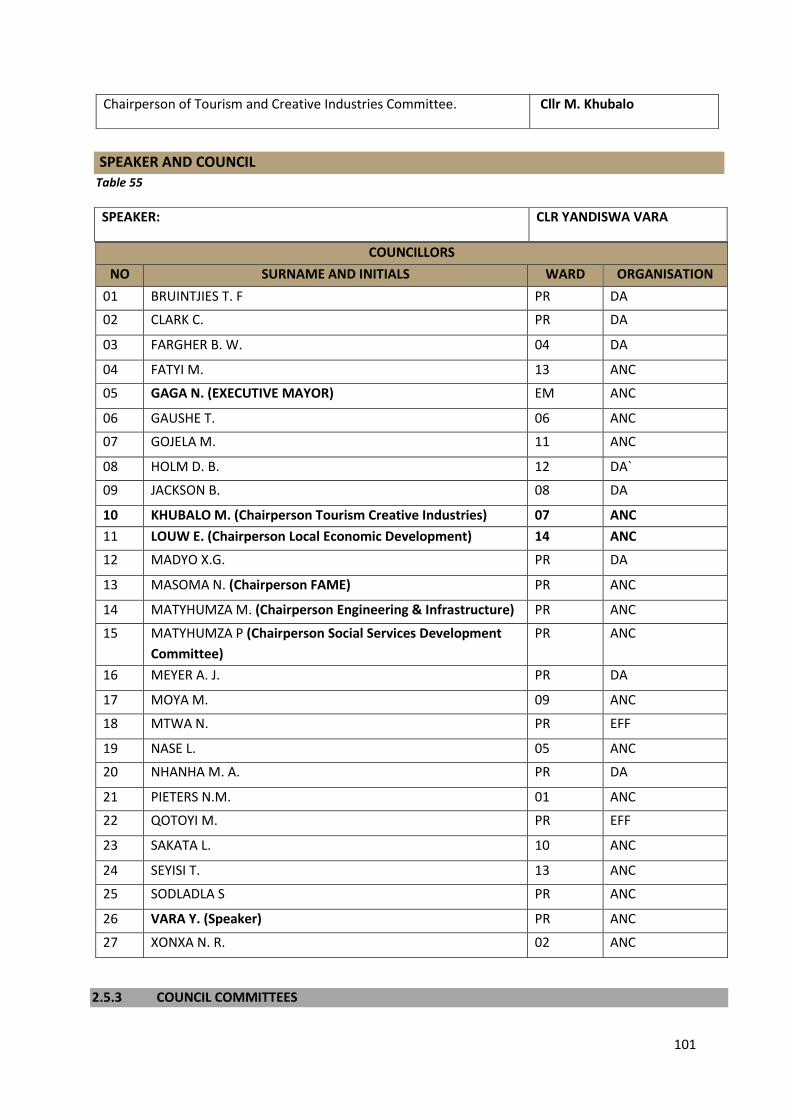
101
SPEAKER AND COUNCIL Table 55
COUNCILLORS
NO SURNAME AND INITIALS WARD ORGANISATION
01 BRUINTJIES T. F PR DA
02 CLARK C. PR DA
03 FARGHER B. W. 04 DA
04 FATYI M. 13 ANC
05 GAGA N. (EXECUTIVE MAYOR) EM ANC
06 GAUSHE T. 06 ANC
07 GOJELA M. 11 ANC
08 HOLM D. B. 12 DA`
09 JACKSON B. 08 DA
10 KHUBALO M. (Chairperson Tourism Creative Industries) 07 ANC
11 LOUW E. (Chairperson Local Economic Development) 14 ANC
12 MADYO X.G. PR DA
13 MASOMA N. (Chairperson FAME) PR ANC
14 MATYHUMZA M. (Chairperson Engineering & Infrastructure) PR ANC
15 MATYHUMZA P (Chairperson Social Services Development
Committee)
PR ANC
16 MEYER A. J. PR DA
17 MOYA M. 09 ANC
18 MTWA N. PR EFF
19 NASE L. 05 ANC
20 NHANHA M. A. PR DA
21 PIETERS N.M. 01 ANC
22 QOTOYI M. PR EFF
23 SAKATA L. 10 ANC
24 SEYISI T. 13 ANC
25 SODLADLA S PR ANC
26 VARA Y. (Speaker) PR ANC
27 XONXA N. R. 02 ANC
2.5.3 COUNCIL COMMITTEES
Chairperson of Tourism and Creative Industries Committee. Cllr M. Khubalo
SPEAKER: CLR YANDISWA VARA
102
2.5.3.1 Section 80 Committees
Financial Admin, Monitoring & Evaluation
Social Services Development
Infrastructure Development
Local Economic Development
Tourism and Culture Industries
2.5.4 WARD COMMITTEES AND COMMUNITY DEVELOPMENT WORKERS
Makana Municipality has 13 Ward committees in place the 14th ward is the Rhodes University area and
Grahamstown Foundation (Monument) and the matter is the subject of an IEC probe. Issues pertinent to
IDP are referred from these structures and other fora like IDP Representative Forum which they are part of
and through the Ward Councillor to the IDP unit for attention.
A Community Development Worker (CDW) is based in each Ward and acts as an ex-officio member in the
Ward Committee. Ward Committees meet on a monthly basis and regular constituency meetings are held,
to keep the communities informed about Municipal affairs, progress with project implementation and also
to receive public input on matters of general concern.
2.5.5 COMMUNITY-BASED PLANNING
The Ward-based public participation for developing the 2016 – 2017 IDP and its annual review was even
more rigorous than previous year. Community-Based Planning Workshops were held for 13 Wards and a
comprehensive CBP Report containing extensive data for each Ward which was a final outcome. This in
turn informed Municipal and Sector Department as to the Development Needs & Priorities of the
Communities and assisted them in their project planning & design for the forthcoming fiscal and outer
years. Community Consultation & Participation is taken further by regular Ward Meetings held by Ward
Councillor and their Ward Committees, as well as the Mayoral Imbizo and other events.
2.5.6 INTER-GOVERNMENTAL RELATIONS
The Honourable Mayor has established an Inter-Governmental Relations Forum and is in the process of
developing a local IGR Strategy, to ensure its efficient and effective functioning and also clarifying the
aims & objectives, as well as the roles and responsibilities of the IGR and its various stakeholders. This
structure also serves to co-ordinate the planning of projects and implementation of programmes
stemming from the IDP process, Ward-based Plans, etc.
2.5.7 AUDIT COMMITTEES
Makana Municipality has its own Audit Committee. The Audit Committee holds regular meetings and
performs its function in terms of the Makana Municipality Audit Committee Charter Approved on the
30th May 2013 (Reviewed Annually).
Other parties in attendance are:
Makana Municipality : The Municipal Manager, Director of Budget & Treasury, Chief financial officer ,
Director of LED, Director Technical , Director of Corporate Services and Director Public Safety and
Community Services. Internal Auditor and Auditor-General representative

103
2.5.8 INTERNAL AUDIT
Makana Municipality has an Internal Audit Unit in place, headed by an Internal Audit Manager. The staff
component consists of a Senior Internal Auditor and an intern. The required audits are compiled on the
Performance Management information and the unit also compiles regular reports to the Audit Committee.
2.5.9 RISK MANAGEMENT
Table 56: SUMMARY OF STRATEGIC RISKS CONFIRMED DURING THE WORKSHOP
RISK CATEGORY DESCRIPTION NO OF RISK
INHERITED
NO OF RISK
RESIDUAL
High Loss of ability to sustain on-going operations or a
significant impact on achievements of strategic
objectives
25 20
Medium Poor management of inter-governmental relations 16 9.6
Makana Municipality has seen the need to address Risk Management as per MFMA Section 62(1) (c) (i).
The Audit Committee of Makana was designated as its Risk Management Committee which considers and
approves the Risk Implementation Plan of the Municipality.
Below are the top ten risks to the Municipality as identified by Management?
1. Poor Communication
2. Lack of managing integrated management practices
3. Inability to effectively utilise available resources (Human and Financial)
4. Insufficient revenue collection
5. Inadequate implementation of policies
6. Poor maintenance of infrastructure
7. High unemployment rate
8. Poor labour relations
9. Poor leadership
10. Poor document management
2.5.10 SOCIAL COHESION IN MUNICIPAL PLANNING
ACTIVITIES PERIOD
National Art Festival June/ July yearly
Science Festival March yearly
Makana Freedom Festival April yearly
Mayoral Cup Easter weekend
2.5.11 DIMENSIONS AND CROSS-CUTTING ISSUES: SPU

104
Municipal planning is influenced by a number of dimensions and cross-cutting issues. The main dimension
being: Social, Spatial, Economic, Institutional, Natural Environment.
The impact that projects can and will have on the above must always be borne in mind, hence the
importance of designing strategies that will incorporate these considerations, as well as address cross-
cutting issues such as Poverty Relief, HIV/AIDS and SPU.
A Special Programmes Unit (SPU) has been established in the Municipality in the office of the Mayor. The
Special Programmes Unit of the Makana Municipality is responsible for the following categories:
People living with disabilities
Youth (incl. Sports)
Gender
Older persons
HIV/AID
The post of Manager: Special Programmes was included and filled as part of the restructuring of the
Municipality’s Organogram. The Manager SPU is holding monthly meetings and has already successfully
activated a number of Special Events, such as Youth tournament, etc. Programmes have also been
identified for inclusion in the Municipality’s Operating Budget, whilst some projects of capital nature have
been earmarked for external funding.
HIV/AIDS is a matter of such importance that features as a cross-cutting issues in every area of
development. Makana municipality has an HIV/AIDS Policy/ Plan which is revised annually.
Other programs the office is involves in is mainstreaming HIV/AIDS in workplace and society, awareness of
HIV/AIDS, how to manage it within the workplace and curb the spread of it. It is further advocated during
all project training and employment orientation sessions.
2.5.12 GOOD GOVERNANCE AND PUBLIC PARTICPATION CHALLENGES AND DEVELOPMENT PRIORITIES
2.5.12.1 COUNCIL COMMITTEES
Governance and oversight within the municipality must be strengthened for improved decision making and
service delivery. A meeting schedule for all Council and Committee meetings is compiled and approved by
Council for a financial year. With a few exceptions meeting dates are adhered to and well attended by
Councillors and Officials.
A Control and Monitoring Sheet was developed which sets clear time-lines for among others the
compilation and distribution of agendas, the finalization of minutes and the date the minutes and action
sheets should be distributed to Directors and Managers for implementation.
This has contributed to the timeous implementation of council resolutions and committee decisions within
the municipality. Adherence to the scheduled dates of Council and Committee meetings is critical. There is
a need for an improvement in Council resolutions being tracked, monitored and the implementation
thereof.

105
The implementation and enforcement of a code of conduct for councillors is critical. The system of
delegations was reviewed. The political component of the municipality should however also be addressed.
Adequate personnel are available to provide administrative services for Council and Committee meetings.
The personnel however lack experience but are receiving regular in-service training. The late submission of
agenda items and/ or relevant reports for the meetings is being addressed with Directors and Managers.
The culture of poor or non-performance and the perception that transgressions were an accepted norm
within the municipality should be addressed. This would assist in improving service delivery, financial
management and the audit outcomes.
The municipality has a developed a communication strategy, and a public participation and communication
(internally and externally) programme in on continue basis and is enhanced.
2.5.12.2 INTERNAL AUDIT, RISK MANAGEMENT
Internal audit: The municipality has an Internal Audit Manager and none of the internal audit functions
have been outsourced. The Internal Audit unit is functional
The municipality when addressing internal audit should focus amongst others on an internal audit structure
review, skills and gap analysis together with the development program, filling of critical posts and quality
assurance and improvement.
Risk management: A risk management framework is in existence and there is a risk based audit plan but
the implementation remains a challenge. In addition, the risk based audit plan needs to be reviewed and
updated in light of the current challenges at the municipality. Risk management is not fully embedded in
the culture and internal control processes of the municipality.
Strategic risk register has been developed and report on produces on implementation corrective action
quarterly basis.
2.5.12.3 AUDIT OUTCOMES
Table 60
30 June 2017 30 June 2016 30 June 2015
Qualified Qualified Disclaimer
Table 61 BASIS FOR QUALIFIED OPINION:
No Qualification
1. Consumer Debtors
2. Receivable from non-exchange
3. Payables from exchange
4. Payables form non-exchange transaction
5. Inventory
6. Employee cost
7. Commitments
8. Irregular expenditure
9. Unauthorised expenditure
10. Contingent liabilities
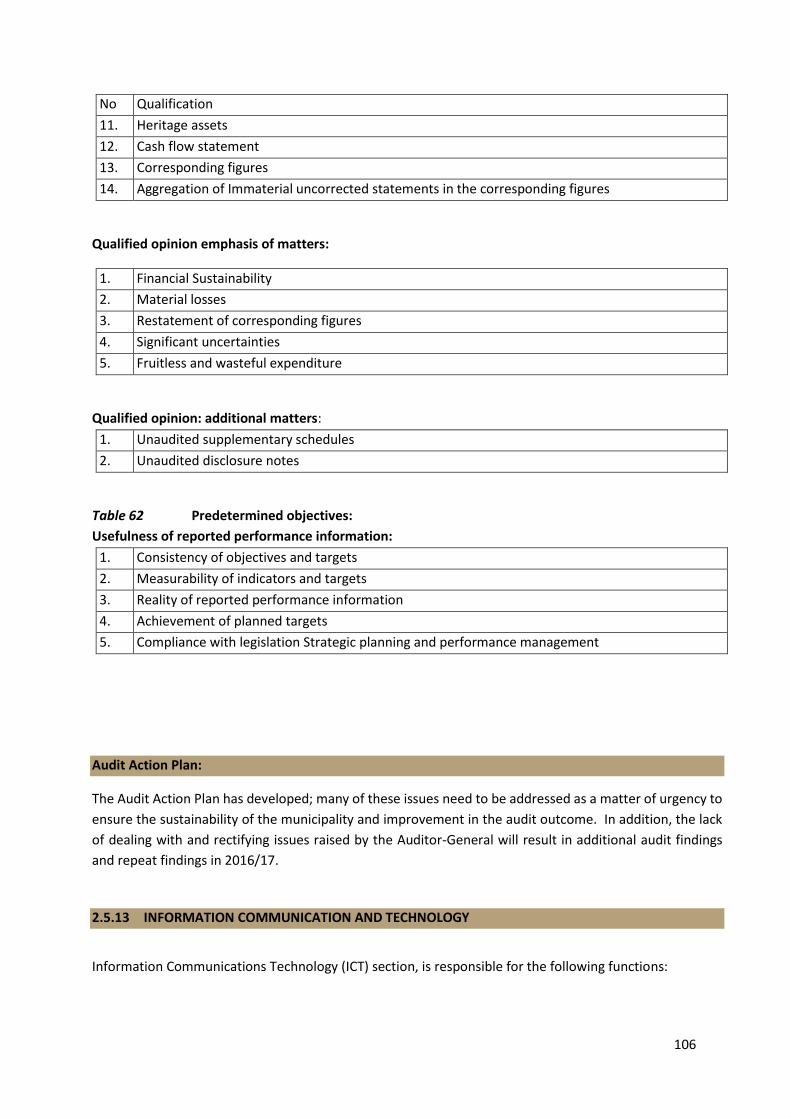
106
No Qualification
11. Heritage assets
12. Cash flow statement
13. Corresponding figures
14. Aggregation of Immaterial uncorrected statements in the corresponding figures
Qualified opinion emphasis of matters:
1. Financial Sustainability
2. Material losses
3. Restatement of corresponding figures
4. Significant uncertainties
5. Fruitless and wasteful expenditure
Qualified opinion: additional matters:
1. Unaudited supplementary schedules
2. Unaudited disclosure notes
Table 62 Predetermined objectives:
Usefulness of reported performance information:
1. Consistency of objectives and targets
2. Measurability of indicators and targets
3. Reality of reported performance information
4. Achievement of planned targets
5. Compliance with legislation Strategic planning and performance management
Audit Action Plan:
The Audit Action Plan has developed; many of these issues need to be addressed as a matter of urgency to
ensure the sustainability of the municipality and improvement in the audit outcome. In addition, the lack
of dealing with and rectifying issues raised by the Auditor-General will result in additional audit findings
and repeat findings in 2016/17.
2.5.13 INFORMATION COMMUNICATION AND TECHNOLOGY
Information Communications Technology (ICT) section, is responsible for the following functions:

107
Planning, Network, Data, Security and Support. Makana Municipality’s ICT Environment supports about 150
users. The municipality has the following offices namely:
I. City Hall
II. Finance Building
III. Alicedale Office
IV. Riebeek East Office
V. Electricity
VI. Stores
VII. Housing
VIII. Parks
In the current financial year, the municipality has managed to appoint an ICT Manager to provide the
strategic direction for the unit, however there are still vacant critical positions not yet filled as per the
organogram. So far the municipality has managed to procure a server which runs on Microsoft Windows
server 2008 R2 Standard OS. The server is installed to facilitate network connectivity, domain control
functions, active directory and password management for all those who have access to computers.
Access control unit has been installed to access the server room. Fire detection and suppression system,
water detection system, sensors have also been installed.
Munsoft Financial system, Payday system are installed in the Finance building Server room and accessible
only to authorized users. Also, system generated reports can be extracted from both systems as and when
required.
The ICT Master Plan is developed but not yet approved, the document details all ICT activities to be
performed in ensuring that ICT is enabling the institution to realize its goals and objectives in an efficient
manner.
2.5.14 RECORD MANAGEMENT:
The municipality does not have proper record keeping and no record management system is in place to
ensure that documents are filed and stored correctly. The municipality currently has a manual system of
record keeping and document management and the system is characterised by poor record keeping and
ineffective document management as well as the loss of documents amongst others. An electronic
document management system was installed in the municipality but it has not been functional. Staff should
be trained on the electronic document system. The record keeping function within the municipality needs
to be reviewed and improved including document security for the protection and management of
information.
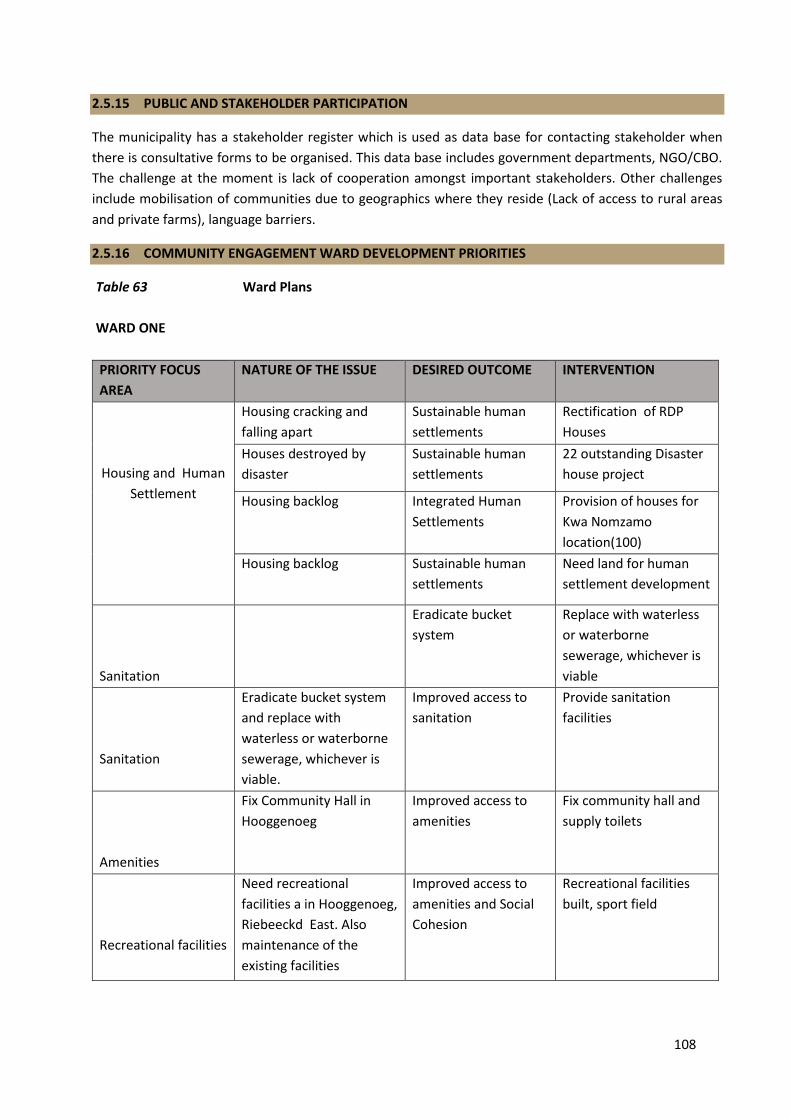
108
2.5.15 PUBLIC AND STAKEHOLDER PARTICIPATION
The municipality has a stakeholder register which is used as data base for contacting stakeholder when
there is consultative forms to be organised. This data base includes government departments, NGO/CBO.
The challenge at the moment is lack of cooperation amongst important stakeholders. Other challenges
include mobilisation of communities due to geographics where they reside (Lack of access to rural areas
and private farms), language barriers.
2.5.16 COMMUNITY ENGAGEMENT WARD DEVELOPMENT PRIORITIES
Table 63 Ward Plans
WARD ONE
PRIORITY FOCUS
AREA
NATURE OF THE ISSUE DESIRED OUTCOME INTERVENTION
Housing and Human
Settlement
Housing cracking and
falling apart
Sustainable human
settlements
Rectification of RDP
Houses
Houses destroyed by
disaster
Sustainable human
settlements
22 outstanding Disaster
house project
Housing backlog Integrated Human
Settlements
Provision of houses for
Kwa Nomzamo
location(100)
Housing backlog Sustainable human
settlements
Need land for human
settlement development
Sanitation
Eradicate bucket
system
Replace with waterless
or waterborne
sewerage, whichever is
viable
Sanitation
Eradicate bucket system
and replace with
waterless or waterborne
sewerage, whichever is
viable.
Improved access to
sanitation
Provide sanitation
facilities
Amenities
Fix Community Hall in
Hooggenoeg
Improved access to
amenities
Fix community hall and
supply toilets
Recreational facilities
Need recreational
facilities a in Hooggenoeg,
Riebeeckd East. Also
maintenance of the
existing facilities
Improved access to
amenities and Social
Cohesion
Recreational facilities
built, sport field
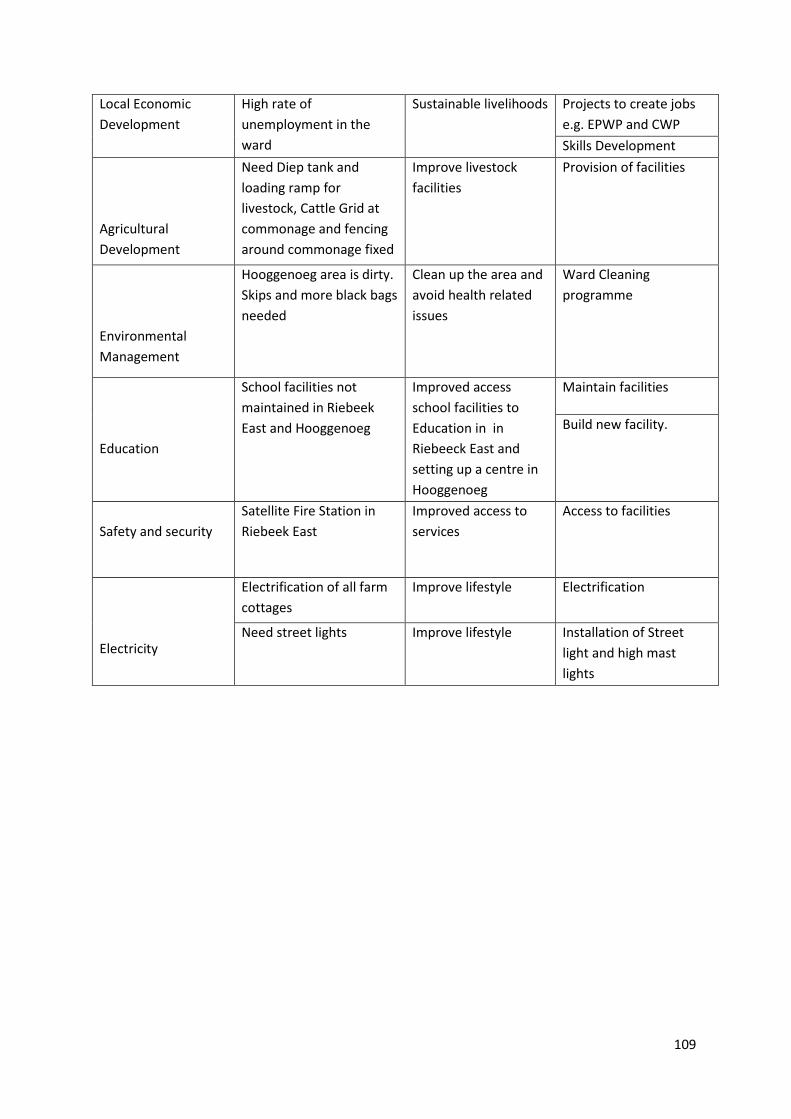
109
Local Economic
Development
High rate of
unemployment in the
ward
Sustainable livelihoods Projects to create jobs
e.g. EPWP and CWP
Skills Development
Agricultural
Development
Need Diep tank and
loading ramp for
livestock, Cattle Grid at
commonage and fencing
around commonage fixed
Improve livestock
facilities
Provision of facilities
Environmental
Management
Hooggenoeg area is dirty.
Skips and more black bags
needed
Clean up the area and
avoid health related
issues
Ward Cleaning
programme
Education
School facilities not
maintained in Riebeek
East and Hooggenoeg
Improved access
school facilities to
Education in in
Riebeeck East and
setting up a centre in
Hooggenoeg
Maintain facilities
Build new facility.
Safety and security
Satellite Fire Station in
Riebeek East
Improved access to
services
Access to facilities
Electricity
Electrification of all farm
cottages
Improve lifestyle Electrification
Need street lights Improve lifestyle Installation of Street
light and high mast
lights
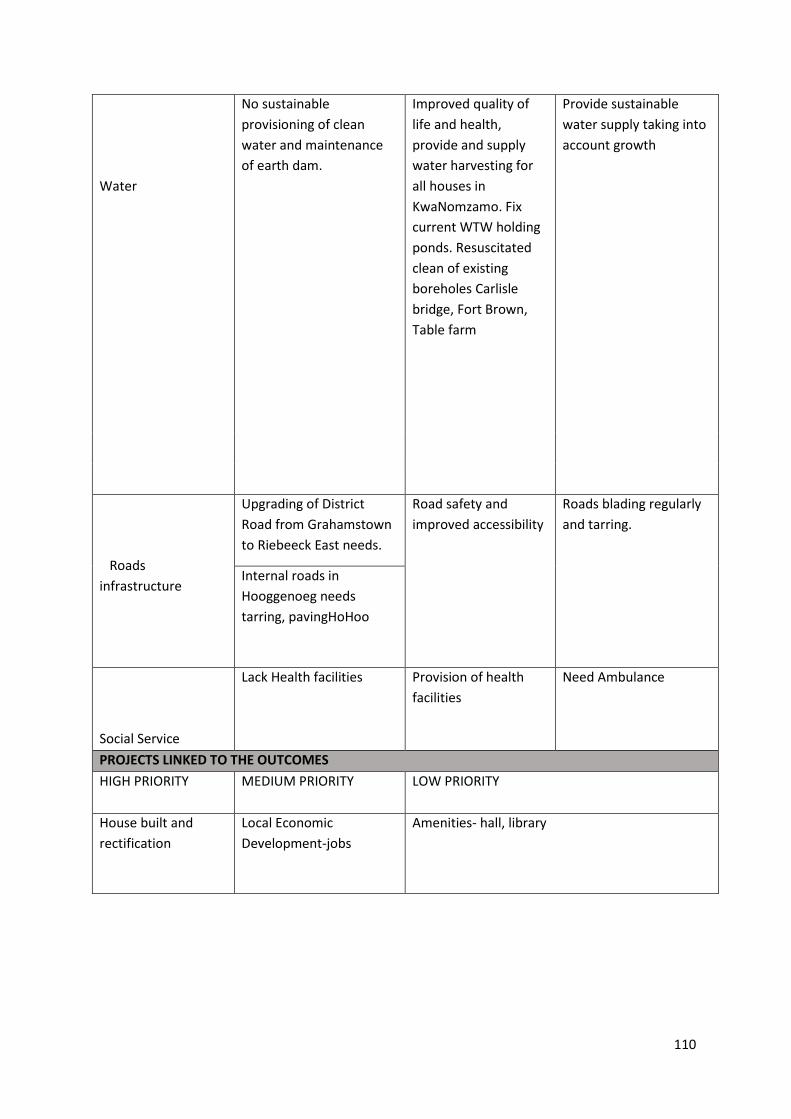
110
Water
No sustainable
provisioning of clean
water and maintenance
of earth dam.
Improved quality of
life and health,
provide and supply
water harvesting for
all houses in
KwaNomzamo. Fix
current WTW holding
ponds. Resuscitated
clean of existing
boreholes Carlisle
bridge, Fort Brown,
Table farm
Provide sustainable
water supply taking into
account growth
Roads
infrastructure
Upgrading of District
Road from Grahamstown
to Riebeeck East needs.
Road safety and
improved accessibility
Roads blading regularly
and tarring.
Internal roads in
Hooggenoeg needs
tarring, pavingHoHoo
Social Service
Lack Health facilities Provision of health
facilities
Need Ambulance
PROJECTS LINKED TO THE OUTCOMES
HIGH PRIORITY MEDIUM PRIORITY LOW PRIORITY
House built and
rectification
Local Economic
Development-jobs
Amenities- hall, library

111
WARD TWO
PRIORITY AREA NATURE OF THE
PROBLEM
MAIN OUTCOME
ANTICIPATED BY THE
COMMUNITY
STRATEGIES TO BE
ADOPTED
Water Water outages Improved access to
water
Provide the necessary
interventions to restore
water supply
Water Water Harvesting Improved access to
water
Provide the necessary
interventions to restore
water supply
Sanitation
Upgrade of sewer bulk
line(KwaThaTha
Improved access to
sanitation
Provide sanitation
facilities
Sanitation
Clear/eradicate the
bucket system Improved access to
sanitation
Provide sanitation
facilities Blocked toilets are an
issue
Waste Management
Waste is dumped at the
ward, need proper and
accessible waste
disposal facilities
Improve waste
management
Provide more waste
bags (x2) and
Containers for Garden
refuse
Human Settlement
Need houses to be
built
Improved access to
sustainable human
settlements
Provision of houses
Rectification of houses
Improved access to
sustainable human
settlements
Provision of houses
Upper Mnandi
Formalisation of infill
areas for housing
development
Formalisation of infill
areas
Local Economic
Development
Need Jobs facilitated
for unemployed artists Sustainable living Job creation
Agriculture
Development Food Security Improve food security
Local food security
action group- Food
security officer
Roads infrastructure
Need more speed
humps to reduced road
safety incidents
Improved road safety
Construction of speed
humps at Nompondo
,Ncame street and
Roads maintenance
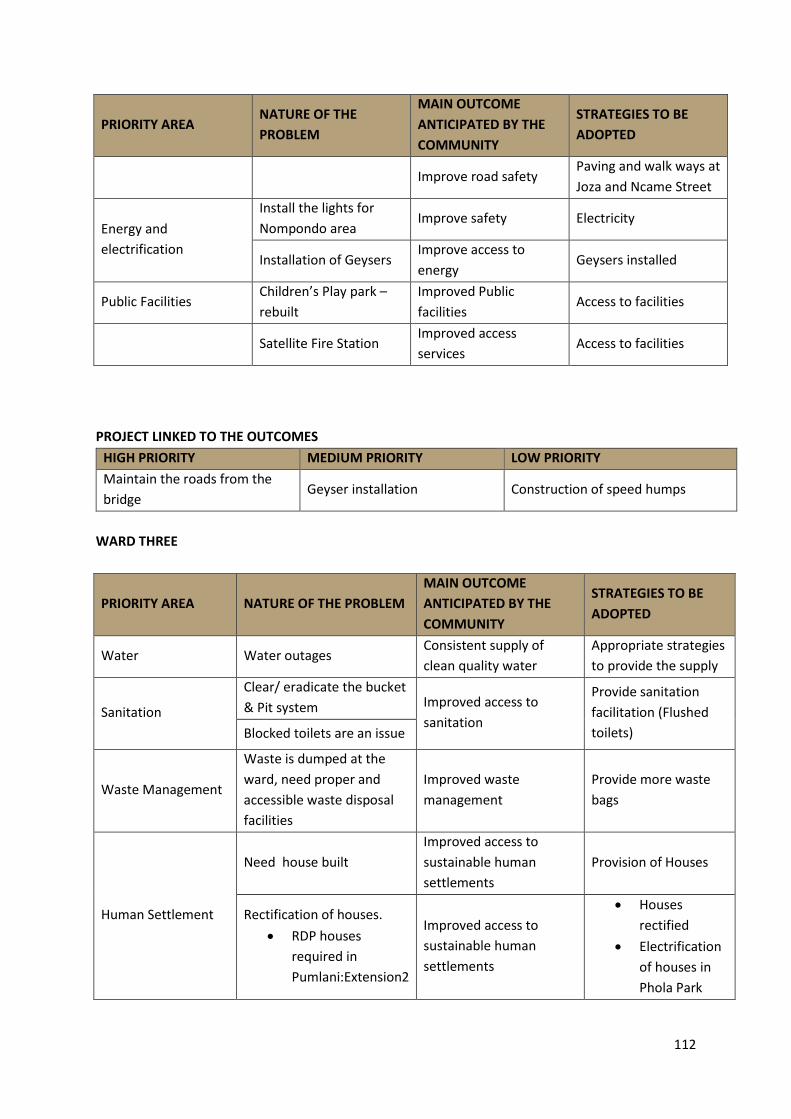
112
PRIORITY AREA NATURE OF THE
PROBLEM
MAIN OUTCOME
ANTICIPATED BY THE
COMMUNITY
STRATEGIES TO BE
ADOPTED
Improve road safety Paving and walk ways at
Joza and Ncame Street
Energy and
electrification
Install the lights for
Nompondo area Improve safety Electricity
Installation of Geysers Improve access to
energy Geysers installed
Public Facilities Children’s Play park –
rebuilt
Improved Public
facilities Access to facilities
Satellite Fire Station Improved access
services Access to facilities
PROJECT LINKED TO THE OUTCOMES
HIGH PRIORITY MEDIUM PRIORITY LOW PRIORITY
Maintain the roads from the
bridge Geyser installation Construction of speed humps
WARD THREE
PRIORITY AREA NATURE OF THE PROBLEM
MAIN OUTCOME
ANTICIPATED BY THE
COMMUNITY
STRATEGIES TO BE
ADOPTED
Water Water outages Consistent supply of
clean quality water
Appropriate strategies
to provide the supply
Sanitation
Clear/ eradicate the bucket
& Pit system Improved access to
sanitation
Provide sanitation
facilitation (Flushed
toilets) Blocked toilets are an issue
Waste Management
Waste is dumped at the
ward, need proper and
accessible waste disposal
facilities
Improved waste
management
Provide more waste
bags
Human Settlement
Need house built
Improved access to
sustainable human
settlements
Provision of Houses
Rectification of houses.
RDP houses
required in
Pumlani:Extension2
Improved access to
sustainable human
settlements
Houses
rectified
Electrification
of houses in
Phola Park
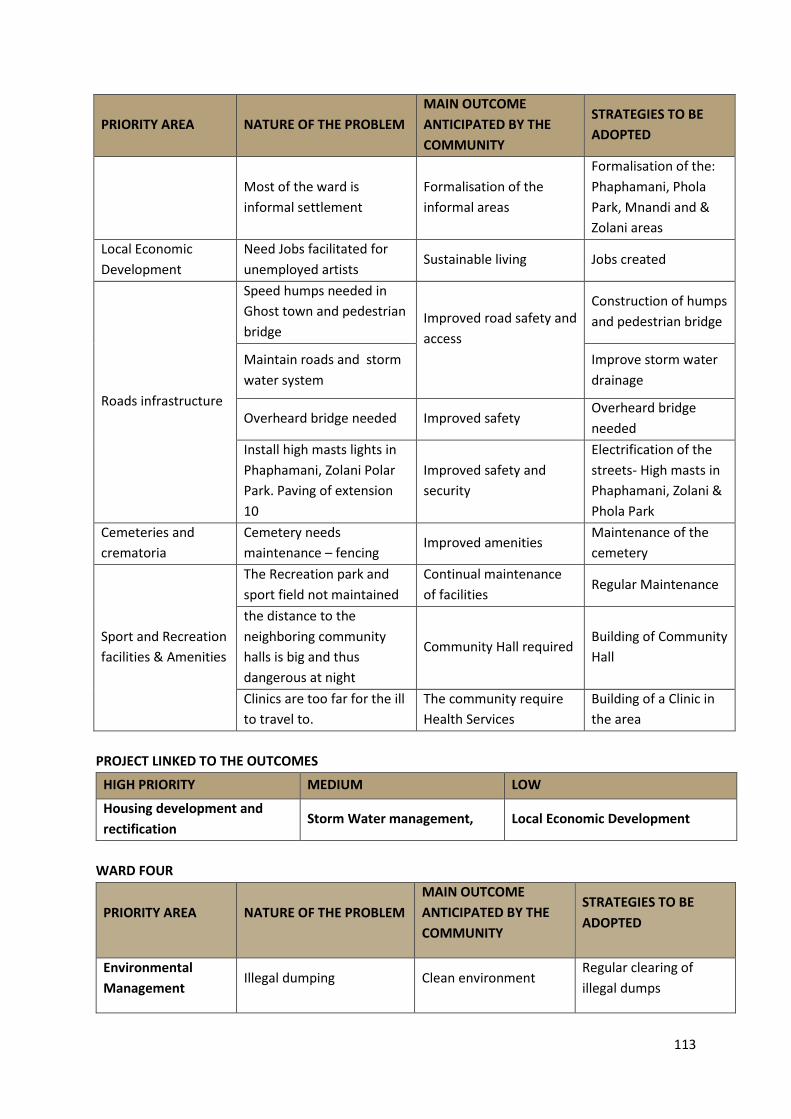
113
PRIORITY AREA NATURE OF THE PROBLEM
MAIN OUTCOME
ANTICIPATED BY THE
COMMUNITY
STRATEGIES TO BE
ADOPTED
Most of the ward is
informal settlement
Formalisation of the
informal areas
Formalisation of the:
Phaphamani, Phola
Park, Mnandi and &
Zolani areas
Local Economic
Development
Need Jobs facilitated for
unemployed artists Sustainable living Jobs created
Roads infrastructure
Speed humps needed in
Ghost town and pedestrian
bridge Improved road safety and
access
Construction of humps
and pedestrian bridge
Maintain roads and storm
water system
Improve storm water
drainage
Overheard bridge needed Improved safety Overheard bridge
needed
Install high masts lights in
Phaphamani, Zolani Polar
Park. Paving of extension
10
Improved safety and
security
Electrification of the
streets- High masts in
Phaphamani, Zolani &
Phola Park
Cemeteries and
crematoria
Cemetery needs
maintenance – fencing Improved amenities
Maintenance of the
cemetery
Sport and Recreation
facilities & Amenities
The Recreation park and
sport field not maintained
Continual maintenance
of facilities Regular Maintenance
the distance to the
neighboring community
halls is big and thus
dangerous at night
Community Hall required Building of Community
Hall
Clinics are too far for the ill
to travel to.
The community require
Health Services
Building of a Clinic in
the area
PROJECT LINKED TO THE OUTCOMES
HIGH PRIORITY MEDIUM LOW
Housing development and
rectification Storm Water management, Local Economic Development
WARD FOUR
PRIORITY AREA NATURE OF THE PROBLEM
MAIN OUTCOME
ANTICIPATED BY THE
COMMUNITY
STRATEGIES TO BE
ADOPTED
Environmental
Management Illegal dumping Clean environment
Regular clearing of
illegal dumps
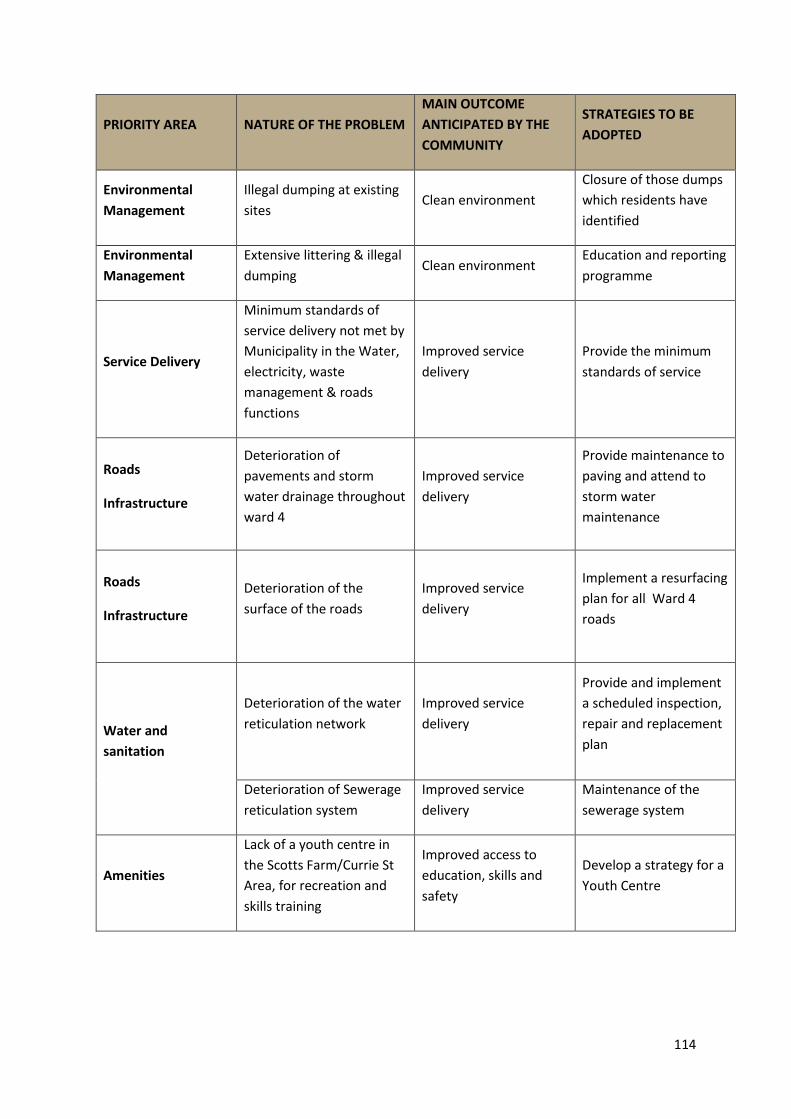
114
PRIORITY AREA NATURE OF THE PROBLEM
MAIN OUTCOME
ANTICIPATED BY THE
COMMUNITY
STRATEGIES TO BE
ADOPTED
Environmental
Management
Illegal dumping at existing
sites Clean environment
Closure of those dumps
which residents have
identified
Environmental
Management
Extensive littering & illegal
dumping Clean environment
Education and reporting
programme
Service Delivery
Minimum standards of
service delivery not met by
Municipality in the Water,
electricity, waste
management & roads
functions
Improved service
delivery
Provide the minimum
standards of service
Roads
Infrastructure
Deterioration of
pavements and storm
water drainage throughout
ward 4
Improved service
delivery
Provide maintenance to
paving and attend to
storm water
maintenance
Roads
Infrastructure
Deterioration of the
surface of the roads
Improved service
delivery
Implement a resurfacing
plan for all Ward 4
roads
Water and
sanitation
Deterioration of the water
reticulation network
Improved service
delivery
Provide and implement
a scheduled inspection,
repair and replacement
plan
Deterioration of Sewerage
reticulation system
Improved service
delivery
Maintenance of the
sewerage system
Amenities
Lack of a youth centre in
the Scotts Farm/Currie St
Area, for recreation and
skills training
Improved access to
education, skills and
safety
Develop a strategy for a
Youth Centre

115
PRIORITY AREA NATURE OF THE PROBLEM
MAIN OUTCOME
ANTICIPATED BY THE
COMMUNITY
STRATEGIES TO BE
ADOPTED
Cemeteries Albany Cemetery boundary
not maintained Improved services
Maintenance of
cemetery fences
Traffic infrastructure
Speed hump needed in
Scott’s farm Fitchart street
Improved service
delivery and promote
improved access
Speed humps needed in
Scotts Farm , Fitchart
street
Painting of traffic lines Improved road safety Implement regular
painting programme
Safety and security
Reputedly high levels of
crime in Scotts Farm and
adjoining areas
Improved safety and
security
Improved and regular
liaison with SAPS
Electricity
Deterioration of the
electrical distribution
network
Improved service
delivery
Implement a
maintenance and where
necessary, an upgrade
programme
Electricity Street lights not
maintained
Improved safety and
security
Maintenance of the
street lights
Maintenance of
recreational halls
Drastic deterioration of the
two halls – Crown Hall
where the floor has been
destroyed and in both
halls, the infrastructure
needs urgent attention
Securing the municipal
assets and improving
quality of life for
residents
Implementing
maintenance and repair
programmes
Local Economic
Development
High unemployment levels
particularly in Scotts Farm Sustainable livelihoods
EPWP Skills programme
and a youth centre
needed
Integrated Human
Settlements RDP homes are needed
Improved access to
housing
Ensure beneficiaries on
Housing list receive
houses when RDP
programmes are
completed

116
PRIORITY AREA NATURE OF THE PROBLEM
MAIN OUTCOME
ANTICIPATED BY THE
COMMUNITY
STRATEGIES TO BE
ADOPTED
Integrated Human
Settlements Housing Rectification
Improved access to
housing
Rectification in mainly
the Scotts Farm area
must be implemented
Integrated Human
Settlements
Drastic deterioration of
Emergency Houses from
the 2008 tornado
Improved access to
housing
The approx. 10 units in
Scotts Farm must either
be replaced or houses
must be provided
Social Development Drug and Alcohol Abuse Improve living condition
Improve liaison with
Social Services,
education authorities
and law enforcement
PROJECT LINKED TO THE OUTCOMES
HIGH PRIORITY MEDIUM LOW
Improved maintenance of
services
Cleaning of ward
Housing and repair of houses
Recreational halls repairing
Youth Centre & skills
Alcohol & drug abuse
WARD FIVE
PRIORITY AREA NATURE OF THE
PROBLEM
MAIN OUTCOMES
ANTICIPATED BY THE
COMMUNITY
STRATEGIES TO BE
ADOPTED
Human Settlements RDP houses are needed Integrated human
settlements Provision of housing
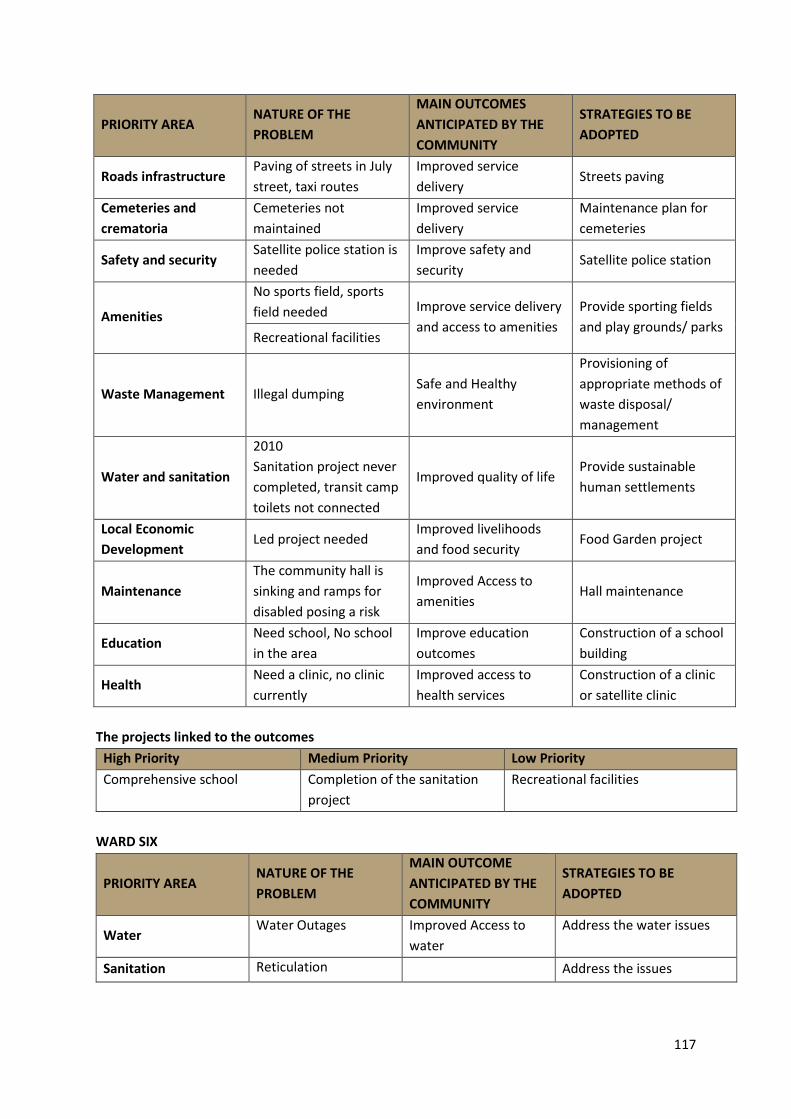
117
PRIORITY AREA NATURE OF THE
PROBLEM
MAIN OUTCOMES
ANTICIPATED BY THE
COMMUNITY
STRATEGIES TO BE
ADOPTED
Roads infrastructure Paving of streets in July
street, taxi routes
Improved service
delivery Streets paving
Cemeteries and
crematoria
Cemeteries not
maintained
Improved service
delivery
Maintenance plan for
cemeteries
Safety and security Satellite police station is
needed
Improve safety and
security Satellite police station
Amenities
No sports field, sports
field needed Improve service delivery
and access to amenities
Provide sporting fields
and play grounds/ parks Recreational facilities
Waste Management Illegal dumping Safe and Healthy
environment
Provisioning of
appropriate methods of
waste disposal/
management
Water and sanitation
2010
Sanitation project never
completed, transit camp
toilets not connected
Improved quality of life Provide sustainable
human settlements
Local Economic
Development Led project needed
Improved livelihoods
and food security Food Garden project
Maintenance
The community hall is
sinking and ramps for
disabled posing a risk
Improved Access to
amenities Hall maintenance
Education Need school, No school
in the area
Improve education
outcomes
Construction of a school
building
Health Need a clinic, no clinic
currently
Improved access to
health services
Construction of a clinic
or satellite clinic
The projects linked to the outcomes
High Priority Medium Priority Low Priority
Comprehensive school Completion of the sanitation
project
Recreational facilities
WARD SIX
PRIORITY AREA NATURE OF THE
PROBLEM
MAIN OUTCOME
ANTICIPATED BY THE
COMMUNITY
STRATEGIES TO BE
ADOPTED
Water Water Outages Improved Access to
water
Address the water issues
Sanitation Reticulation Address the issues

118
PRIORITY AREA NATURE OF THE
PROBLEM
MAIN OUTCOME
ANTICIPATED BY THE
COMMUNITY
STRATEGIES TO BE
ADOPTED
Bucket system needs
to be eradicated
Improved access to
sanitation
Waste Management
The illegal dumping
sites need to be done
away with
Improved waste
management
Conversion of Illegal dumping Sites into community parks.
Electricity
High masts are needed Improved safety levels
and security
Provisioning of the high
masts: Emithini and
Extension 4 areas
Electrification 25 Sites area
Roads Infrastructure
Construction of speed
humps
Improve road safety Construction of speed
humps
Paving of main and access
roads
Local Economic
Development
Skills development Improved livelihoods Skills development
programmes
Roads Infrastructure
Storm water drainage
an issue
Improve access and
road safety
Storm water drainage
system implemented
Human Settlement RDP houses Improve access to
human settlements
Project 25 Sites Project and
New Houses
PROJECT LINKED TO THE OUTCOMES
HIGH PRIORITY MEDIUM LOW
Water availability Sanitation (eradication of
bucket system lining)
Electrification
WARD SEVEN
PRIORITY AREA NATURE OF THE PROBLEM
MAIN OUTCOMES
ANTICIPATED BY
THE COMMUNITY
STRATEGIES TO BE
ADOPTED
Water Water outages Improved access to
water Address the water issues
Storm water Flooding Safe communities
Drainage system In Hlalani streets. storm Water drainage between Hlalani and K street ( to improve access)
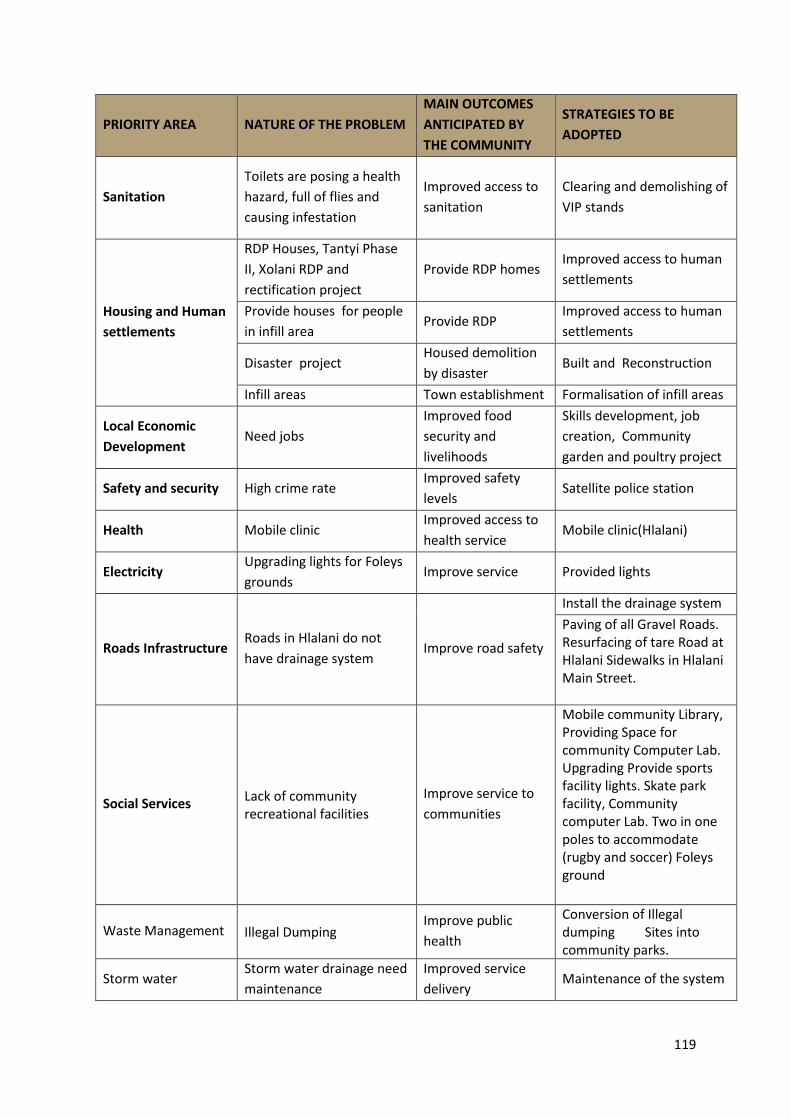
119
PRIORITY AREA NATURE OF THE PROBLEM
MAIN OUTCOMES
ANTICIPATED BY
THE COMMUNITY
STRATEGIES TO BE
ADOPTED
Sanitation
Toilets are posing a health
hazard, full of flies and
causing infestation
Improved access to
sanitation
Clearing and demolishing of
VIP stands
Housing and Human
settlements
RDP Houses, Tantyi Phase
II, Xolani RDP and
rectification project
Provide RDP homes Improved access to human
settlements
Provide houses for people
in infill area Provide RDP
Improved access to human
settlements
Disaster project Housed demolition
by disaster Built and Reconstruction
Infill areas Town establishment Formalisation of infill areas
Local Economic
Development Need jobs
Improved food
security and
livelihoods
Skills development, job
creation, Community
garden and poultry project
Safety and security High crime rate Improved safety
levels Satellite police station
Health Mobile clinic Improved access to
health service Mobile clinic(Hlalani)
Electricity Upgrading lights for Foleys
grounds Improve service Provided lights
Roads Infrastructure Roads in Hlalani do not
have drainage system Improve road safety
Install the drainage system
Paving of all Gravel Roads. Resurfacing of tare Road at Hlalani Sidewalks in Hlalani Main Street.
Social Services Lack of community recreational facilities
Improve service to
communities
Mobile community Library, Providing Space for community Computer Lab. Upgrading Provide sports facility lights. Skate park facility, Community computer Lab. Two in one poles to accommodate (rugby and soccer) Foleys ground
Waste Management Illegal Dumping Improve public
health
Conversion of Illegal dumping Sites into community parks.
Storm water Storm water drainage need
maintenance
Improved service
delivery Maintenance of the system

120
The projects linked to the outcomes
HIGH PRIORITY MEDIUM PRIORITY LOW PRIORITY
Water availability Sanitation Housing development
WARD EIGHT
PRIORITY AREA NATURE OF THE
PROBLEM
MAIN OUTCOMES
ANTICIPATED BY THE
COMMUNITY
STRATEGIES TO BE
ADOPTED
Water Water outages Improved access to
water Address the water issues
Sanitation
Major sewer blockages
and leakage of sewer
in De Villiers Close
Improved access to
sanitation Address the issues
LED Need Jobs Improved food security
and livelihoods Urban agriculture
Safety and security
High rate of violence
murder, burglary,
rapes and crime
Improved safety levels Police visibility
Roads Infrastructure
Need speed humps in
Powell Street, George
street, Mathews,
Improve road safety Construction of speed
humps
Ungraded roads and
potholes Improve accessibility Upgrade the roads
Roads Infrastructure Storm water drainage
need maintenance Improve access Maintenance of the system
Refuse removal Waste not managed
properly
Improve waste
management
Waste management
system/ plan
PROJECT LINKED TO THE OUTCOMES
HIGH PRIORITY MEDIUM LOW
Water availability LED Programme Safety and security visibility of
police
WARD NINE

121
PRIORITY AREAS NATURE OF THE
PROBLEM
MAIN OUTCOME
ANTICIPATED BY THE
COMMUNITY
STRATEGIES TO BE
ADOPTED
Water
No water coming from
stand pipes at
Eluxolweni
Improved access to
water Address the water issues
Sanitation
50 bucket system
toilets needs
eradication
Improved access to
sanitation
Construction of waterborne
toilets
Burst sewer pipes Maintain sewer pipes
Promote a healthy
environment
Improved Human
Settlement
Renovations on
Eluxolweni houses
The area needs
toilets
They also need
geysers
Installation of
Solar geysers
Construction of
Water Borne
Toilets
Outside toilets have no
doors
Maintain outside
toilets
Health Services A clinic is needed Improved health Provision of a clinic in the
area
Community services
Grave yard not fenced
off
Improved access
amenities Maintenance plan
2 Sports field need
fencing
Improved access to
amenities Maintenance plan
Housing and Human
Settlements
1000 RDP homes
needed
Improved access to
human settlement Housing development
Housing rectification in
Hlalani
Improved access to
housing Rectification programme
Reconstruction of
disaster houses in
Vukani-10 units
Improved access to
housing
Reconstruction of houses,
Continue with housing
outstanding project
Roads
Paving of extension 5
at the circle.
Main road needs
street lights
Maintenance of
existing road in
extension 5
Improved roads Improve access
Installation of geysers:
C&D areas in Joza
Disaster houses
Renovation of the
disaster houses in
Lower Vukani
Improve access to Human
Settlement
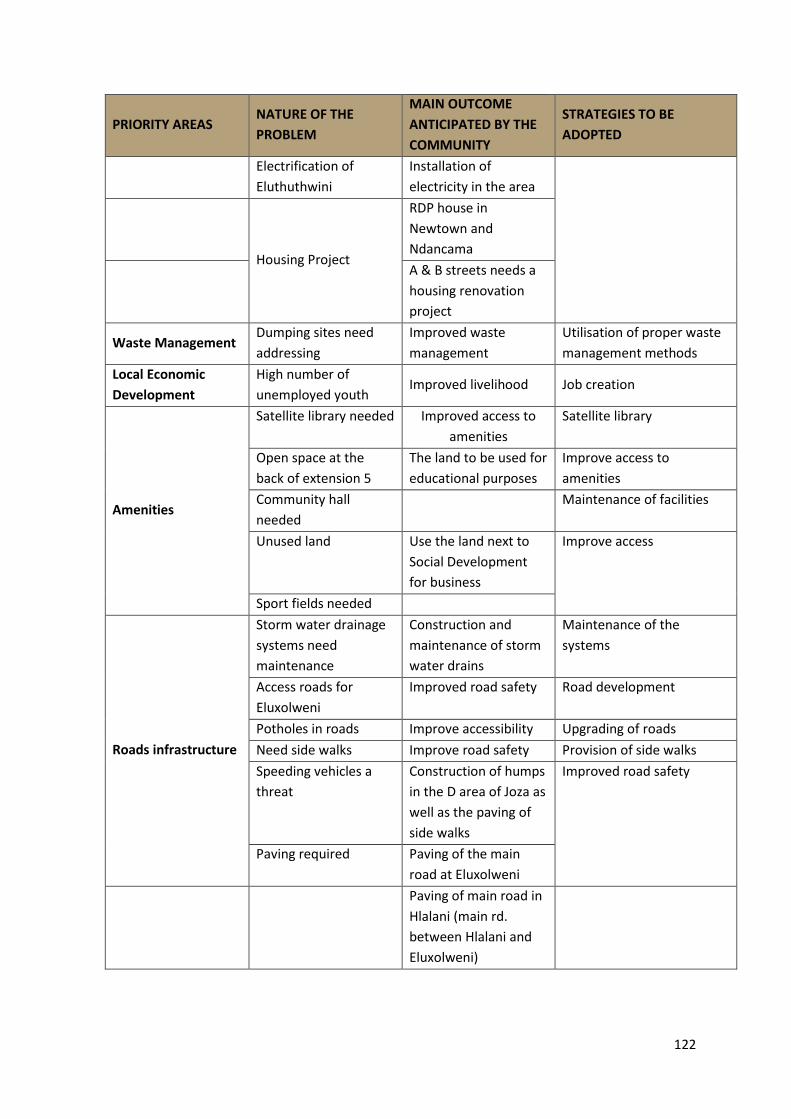
122
PRIORITY AREAS NATURE OF THE
PROBLEM
MAIN OUTCOME
ANTICIPATED BY THE
COMMUNITY
STRATEGIES TO BE
ADOPTED
Electrification of
Eluthuthwini
Installation of
electricity in the area
Housing Project
RDP house in
Newtown and
Ndancama
A & B streets needs a
housing renovation
project
Waste Management Dumping sites need
addressing
Improved waste
management
Utilisation of proper waste
management methods
Local Economic
Development
High number of
unemployed youth Improved livelihood Job creation
Amenities
Satellite library needed Improved access to
amenities
Satellite library
Open space at the
back of extension 5
The land to be used for
educational purposes
Improve access to
amenities
Community hall
needed
Maintenance of facilities
Unused land Use the land next to
Social Development
for business
Improve access
Sport fields needed
Roads infrastructure
Storm water drainage
systems need
maintenance
Construction and
maintenance of storm
water drains
Maintenance of the
systems
Access roads for
Eluxolweni
Improved road safety Road development
Potholes in roads Improve accessibility Upgrading of roads
Need side walks Improve road safety Provision of side walks
Speeding vehicles a
threat
Construction of humps
in the D area of Joza as
well as the paving of
side walks
Improved road safety
Paving required Paving of the main
road at Eluxolweni
Paving of main road in
Hlalani (main rd.
between Hlalani and
Eluxolweni)
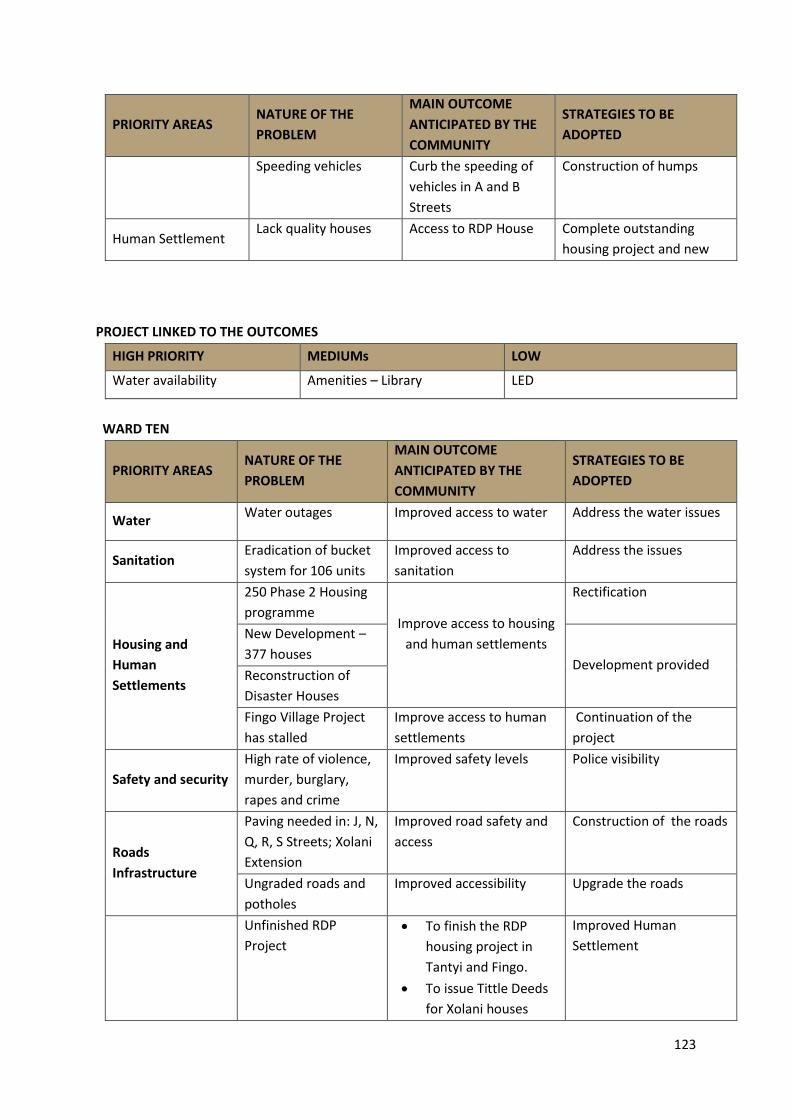
123
PRIORITY AREAS NATURE OF THE
PROBLEM
MAIN OUTCOME
ANTICIPATED BY THE
COMMUNITY
STRATEGIES TO BE
ADOPTED
Speeding vehicles Curb the speeding of
vehicles in A and B
Streets
Construction of humps
Human Settlement Lack quality houses Access to RDP House Complete outstanding
housing project and new
PROJECT LINKED TO THE OUTCOMES
HIGH PRIORITY MEDIUMs LOW
Water availability Amenities – Library LED
WARD TEN
PRIORITY AREAS NATURE OF THE
PROBLEM
MAIN OUTCOME
ANTICIPATED BY THE
COMMUNITY
STRATEGIES TO BE
ADOPTED
Water Water outages Improved access to water Address the water issues
Sanitation Eradication of bucket
system for 106 units
Improved access to
sanitation
Address the issues
Housing and
Human
Settlements
250 Phase 2 Housing
programme Improve access to housing
and human settlements
Rectification
New Development –
377 houses Development provided
Reconstruction of
Disaster Houses
Fingo Village Project
has stalled
Improve access to human
settlements
Continuation of the
project
Safety and security
High rate of violence,
murder, burglary,
rapes and crime
Improved safety levels Police visibility
Roads
Infrastructure
Paving needed in: J, N,
Q, R, S Streets; Xolani
Extension
Improved road safety and
access
Construction of the roads
Ungraded roads and
potholes
Improved accessibility Upgrade the roads
Unfinished RDP
Project
To finish the RDP
housing project in
Tantyi and Fingo.
To issue Tittle Deeds
for Xolani houses
Improved Human
Settlement

124
Speeding vehicles a
threat to children
Curb speeding Construction of speed
humps in D Street and
Albany Rd
PROJECT LINKED TO THE OUTCOMES
HIGH PRIORITY MEDIUM LOW
Continuous Water supply Eradication of bucket system Paving of roads
WARD ELEVEN
PRIORITY AREAS NATURE OF THE
PROBLEM
MAIN OUTCOME
ANTICIPATED BY THE
COMMUNITY
STRATEGIES TO BE
ADOPTED
Water Water outages Improved access to water Address the water issue
Electrification
Maintenance of high
masts Improve safety Provide high masts
Electrification of 100
households in
Ethembeni
Improved access to
amenities
Electricity connection and
Geyser installation
Waste
Management
Dumping sites need
addressing
Improved waste
management
Utilisation of proper waste
management methods
Local Economic
Development
High number of
unemployed youth Improved livelihood Job creation
Amenities
Satellite library
needed Improved access to
amenities
Satellite library
Maintenance of facilities
Community hall
needed
Sport fields needed
Maintenance of the
grave site Improved access
Maintenance of the
facilities
Human Settlement 2000 RDP houses
needed
Access to improved
human settlement Provision of RDP houses
Poor RDP Housing
standard Improve RDP conditions
Rectification of houses Ext
7
Roads Poor roads Upgrading and
maintenance of roads Paving of Taxi route Ext
Sanitation Bucket system Eradication of bucket
system Ethembeni, Squatter camp
PROJECTS LINKED TO STRATEGIES AND OBJECTIVES
HIGH PRIORITY MEDIUM PRIORITY LOW PRIORITY
Water availability Local Economic Development
programmes Amenities
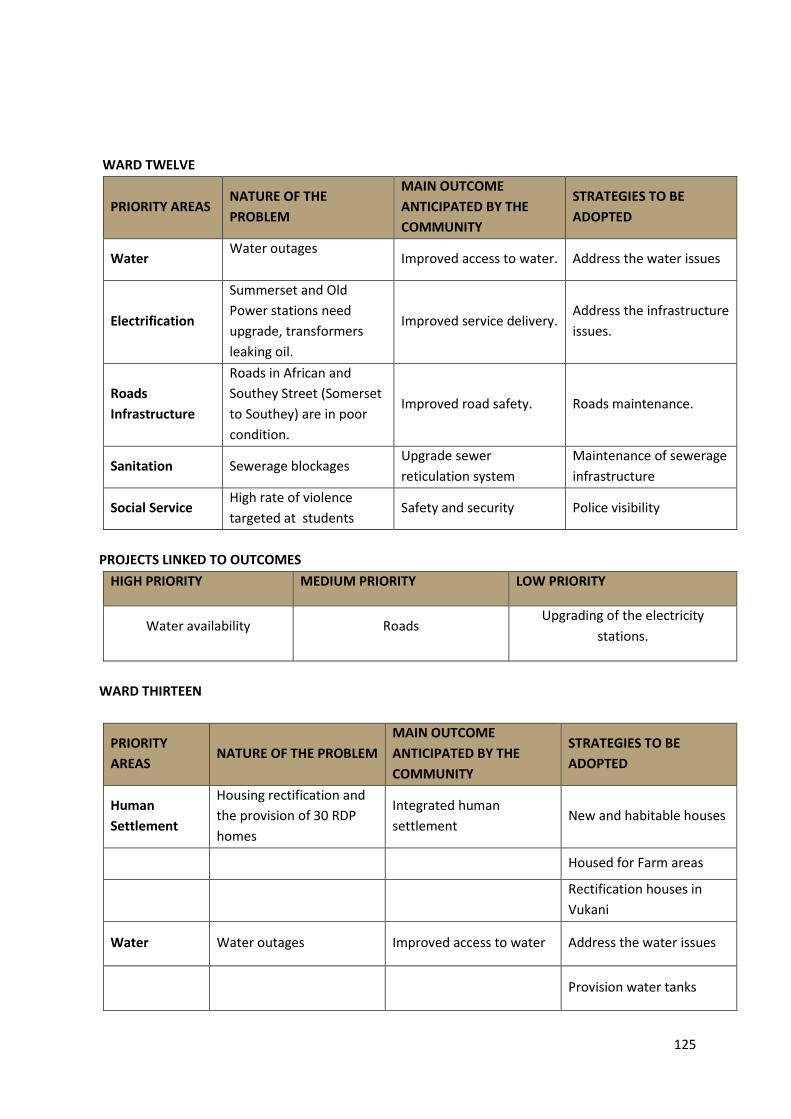
125
WARD TWELVE
PRIORITY AREAS NATURE OF THE
PROBLEM
MAIN OUTCOME
ANTICIPATED BY THE
COMMUNITY
STRATEGIES TO BE
ADOPTED
Water Water outages
Improved access to water. Address the water issues
Electrification
Summerset and Old
Power stations need
upgrade, transformers
leaking oil.
Improved service delivery. Address the infrastructure
issues.
Roads
Infrastructure
Roads in African and
Southey Street (Somerset
to Southey) are in poor
condition.
Improved road safety. Roads maintenance.
Sanitation Sewerage blockages Upgrade sewer
reticulation system
Maintenance of sewerage
infrastructure
Social Service High rate of violence
targeted at students Safety and security Police visibility
PROJECTS LINKED TO OUTCOMES
HIGH PRIORITY MEDIUM PRIORITY LOW PRIORITY
Water availability Roads Upgrading of the electricity
stations.
WARD THIRTEEN
PRIORITY
AREAS NATURE OF THE PROBLEM
MAIN OUTCOME
ANTICIPATED BY THE
COMMUNITY
STRATEGIES TO BE
ADOPTED
Human
Settlement
Housing rectification and
the provision of 30 RDP
homes
Integrated human
settlement New and habitable houses
Housed for Farm areas
Rectification houses in
Vukani
Water Water outages Improved access to water Address the water issues
Provision water tanks
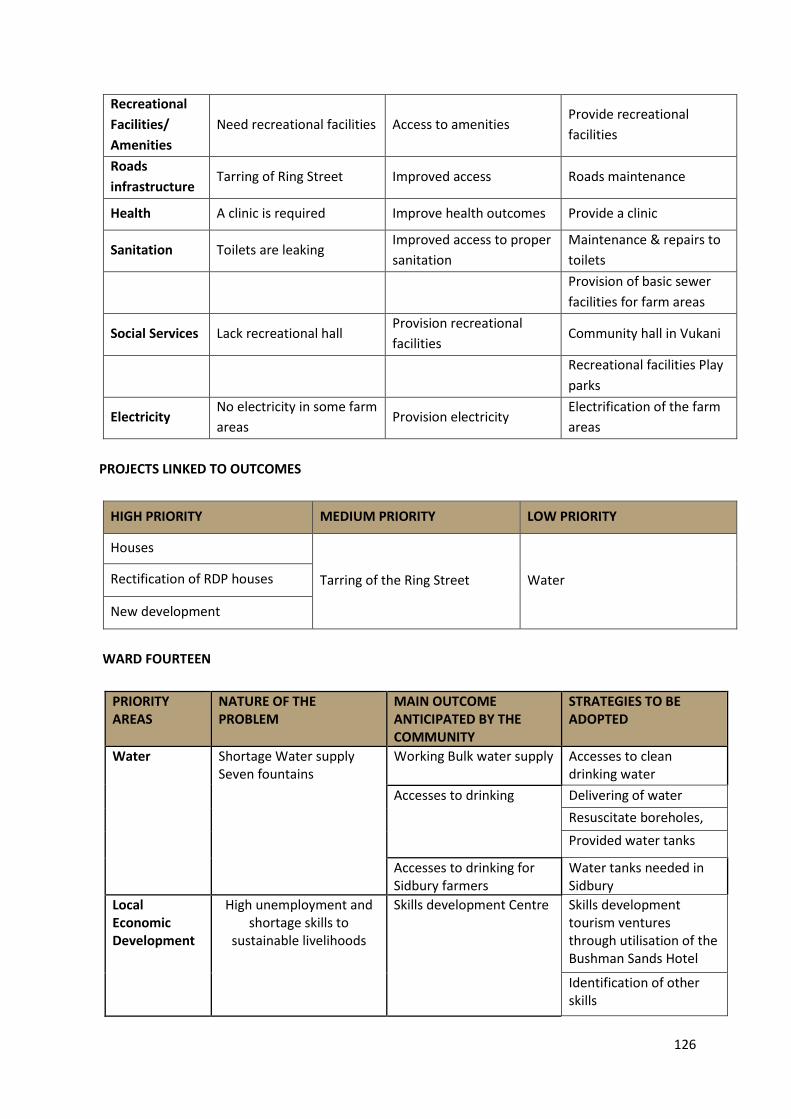
126
Recreational
Facilities/
Amenities
Need recreational facilities Access to amenities Provide recreational
facilities
Roads
infrastructure Tarring of Ring Street Improved access Roads maintenance
Health A clinic is required Improve health outcomes Provide a clinic
Sanitation Toilets are leaking Improved access to proper
sanitation
Maintenance & repairs to
toilets
Provision of basic sewer
facilities for farm areas
Social Services Lack recreational hall Provision recreational
facilities Community hall in Vukani
Recreational facilities Play
parks
Electricity No electricity in some farm
areas Provision electricity
Electrification of the farm
areas
PROJECTS LINKED TO OUTCOMES
HIGH PRIORITY MEDIUM PRIORITY LOW PRIORITY
Houses
Tarring of the Ring Street Water Rectification of RDP houses
New development
WARD FOURTEEN
PRIORITY AREAS
NATURE OF THE PROBLEM
MAIN OUTCOME ANTICIPATED BY THE COMMUNITY
STRATEGIES TO BE ADOPTED
Water Shortage Water supply Seven fountains
Working Bulk water supply Accesses to clean drinking water
Accesses to drinking Delivering of water
Resuscitate boreholes,
Provided water tanks
Accesses to drinking for Sidbury farmers
Water tanks needed in Sidbury
Local Economic Development
High unemployment and shortage skills to
sustainable livelihoods
Skills development Centre Skills development tourism ventures through utilisation of the Bushman Sands Hotel
Identification of other skills
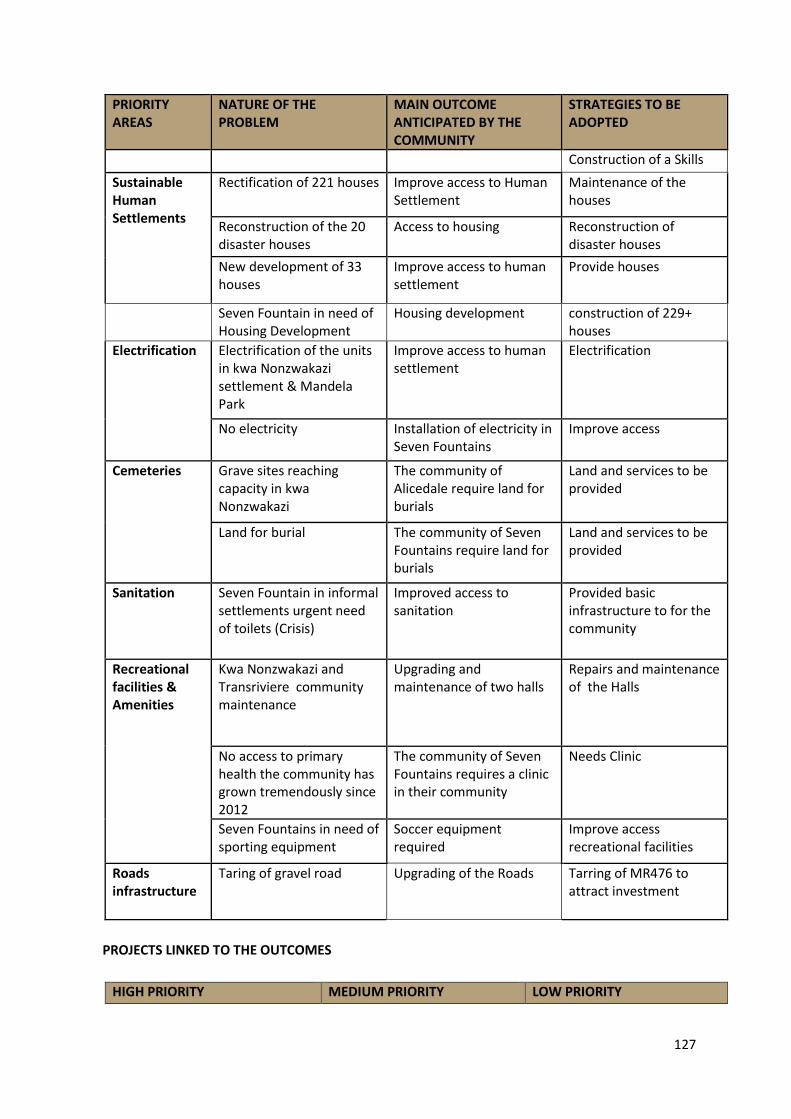
127
PRIORITY AREAS
NATURE OF THE PROBLEM
MAIN OUTCOME ANTICIPATED BY THE COMMUNITY
STRATEGIES TO BE ADOPTED
Construction of a Skills
Sustainable Human Settlements
Rectification of 221 houses Improve access to Human Settlement
Maintenance of the houses
Reconstruction of the 20 disaster houses
Access to housing Reconstruction of disaster houses
New development of 33 houses
Improve access to human settlement
Provide houses
Seven Fountain in need of Housing Development
Housing development construction of 229+ houses
Electrification Electrification of the units in kwa Nonzwakazi settlement & Mandela Park
Improve access to human settlement
Electrification
No electricity Installation of electricity in Seven Fountains
Improve access
Cemeteries Grave sites reaching capacity in kwa Nonzwakazi
The community of Alicedale require land for burials
Land and services to be provided
Land for burial The community of Seven Fountains require land for burials
Land and services to be provided
Sanitation Seven Fountain in informal settlements urgent need of toilets (Crisis)
Improved access to sanitation
Provided basic infrastructure to for the community
Recreational facilities & Amenities
Kwa Nonzwakazi and Transriviere community maintenance
Upgrading and maintenance of two halls
Repairs and maintenance of the Halls
No access to primary health the community has grown tremendously since 2012
The community of Seven Fountains requires a clinic in their community
Needs Clinic
Seven Fountains in need of sporting equipment
Soccer equipment required
Improve access recreational facilities
Roads infrastructure
Taring of gravel road Upgrading of the Roads Tarring of MR476 to attract investment
PROJECTS LINKED TO THE OUTCOMES
HIGH PRIORITY MEDIUM PRIORITY LOW PRIORITY
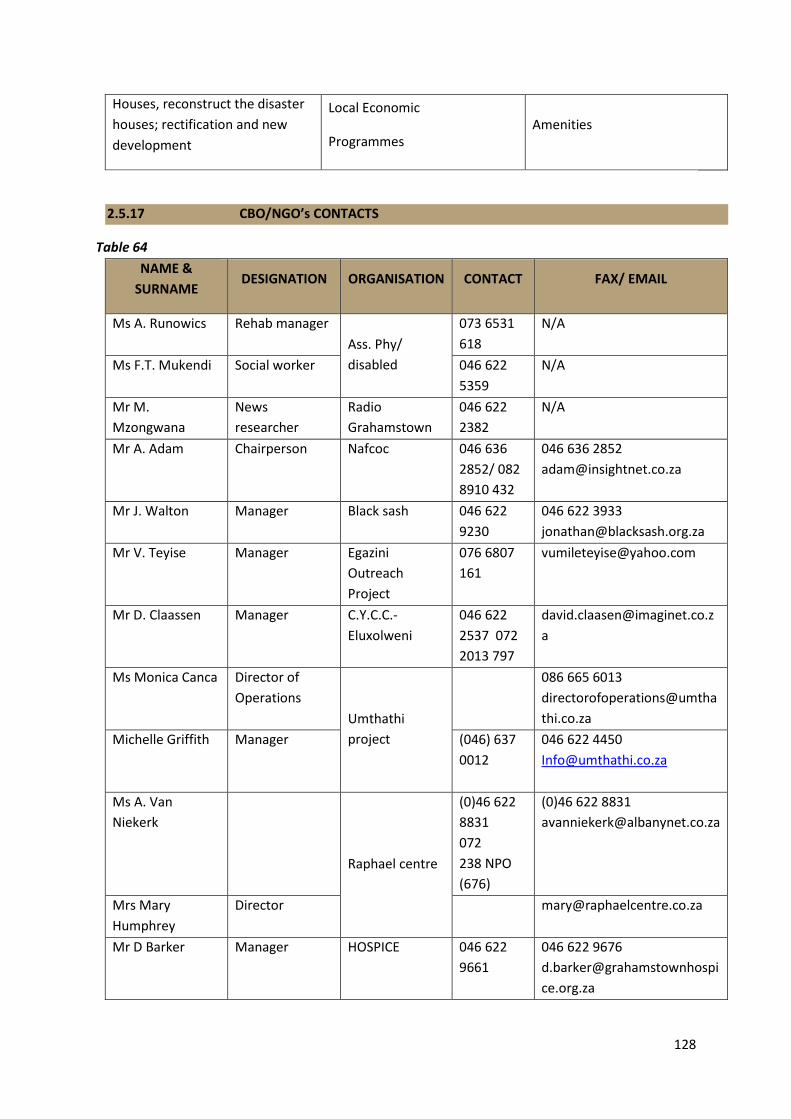
128
Houses, reconstruct the disaster
houses; rectification and new
development
Local Economic
Programmes Amenities
2.5.17 CBO/NGO’s CONTACTS
Table 64
NAME &
SURNAME DESIGNATION ORGANISATION CONTACT FAX/ EMAIL
Ms A. Runowics Rehab manager
Ass. Phy/
disabled
073 6531
618
N/A
Ms F.T. Mukendi Social worker 046 622
5359
N/A
Mr M.
Mzongwana
News
researcher
Radio
Grahamstown
046 622
2382
N/A
Mr A. Adam Chairperson Nafcoc 046 636
2852/ 082
8910 432
046 636 2852
Mr J. Walton Manager Black sash 046 622
9230
046 622 3933
Mr V. Teyise Manager Egazini
Outreach
Project
076 6807
161
Mr D. Claassen Manager C.Y.C.C.-
Eluxolweni
046 622
2537 072
2013 797
a
Ms Monica Canca Director of
Operations
Umthathi
project
086 665 6013
directorofoperations@umtha
thi.co.za
Michelle Griffith Manager (046) 637
0012
046 622 4450
Ms A. Van
Niekerk
Raphael centre
(0)46 622
8831
072
238 NPO
(676)
(0)46 622 8831
Mrs Mary
Humphrey
Director [email protected]
Mr D Barker Manager HOSPICE 046 622
9661
046 622 9676
d.barker@grahamstownhospi
ce.org.za

129
NAME &
SURNAME DESIGNATION ORGANISATION CONTACT FAX/ EMAIL
Mrs A. Harris Manager Famsa 046 622
2580
Mr M.J. Bradshaw School Principal Amasango 083 5429
555
Mrs W. Bischoff Manager Child Welfare 046 636
1355
046 636 1366
et
Mrs L. Naidoo Manager ECARP 046 622
5429
046 622 2617
Ms Adne [email protected]
Mr Mafongosi Masifunde 046 622
6527
046 622 5587
fundile_m@masifunde. co.za
Ms Babalwa
Mthana
Nurse Mentor Africare 046 622
5847
046 622 4918
2.5.18 PUBLIC PARTICIPATION FORUMS
Table 65
SECTOR FORUM
LED Mayoral Forum
Community and Social Services
Road and Transport Forum
Environmental Management Forum
Community Safety Forum
Special Program Offices
Youth Forum
Women forum
People with disability
HIV/ADIS Council
2.6 LOCAL ECONOMIC DEVELOPMENT
Local Economic Development Institutional Capacity
Position Status Supporting Staff
1x Director Filled Personal Assistance
1 x Manager Agriculture Filled
1 X ADMINISTRATIVE ASSISTANT,2 X AGRICULTURAL OFFICERS (VACANTNON- FUNDED-PROPOSED-POST), 1 X COORDINATOR (1 X VACANT-NONFUNDED- PROPOSED-POST), 2 X RURAL DEVELOPMENT OFFICER

130
1 X ADMINISTRATION OFFICER (1 X VACANT-FUNDED)
1x Manager SMME Vacant
1 X SMME TRADE & INVESTMENT RESEARCHER (Proposed Vacancy non-funded) 1x Trade and Investment Facilitator
(TG 11/12) (Proposed Vacancy
1x Manager Tourism & Heritage Filled 1 X TOURISM AND HERITAGE OFFICER (TG 14) (VACANT-NONFUNDED- PROPOSED-POST) 1X TOURISM FACILITATOR (VACAN-NON-FUNDED-PROPOSEDPOST) ( 1X TOURISM RESEARCHER (VACANT-
NON-FUNDED-PROPOSEDPOST
1x Deputy Director Planning & Dev. Mr. R. van der Merwe 3X TOWN PLANNER(MS 1 X VACANTX
(LAND USE MANAGEMENT OFFICER)
ADMINISTRATRIVE OFFICER,1 X
BUILDING CONTROL OFFICER,3 X
CLERKS GRADE TG 3 (1 X VACANT-
NON-FUNDED-PROPOSED-POST), 3 X
BUILDING INSPECTORS; 1 X VACANT,
1 x Manager Planning & Estate Vacant N/A
2.6.1 MAKANA LOCAL ECONOMIC STRATEGY
LED Strategy: The LED Strategy was approved on the 3rd of February 2010 and it is due for review in 2017 SECTORIAL PLANS: The following sectorial plans are in place
Tourism Sector Plan – approved in 2009 and due for review in 2017
Tourism SMME Development and Support Plan – approved in 2010 and due for review in 2015
SMME strategy – approved in 2012 and due for review in 2017
Agriculture Development Strategy – approved in 2011 and due for review in 2018
Investment Incentives Policy – approved in 2011 and due for review in 2018 According to the LED Strategy Makana has a strong competitive advantage in agriculture and government services. This is in line with its role as one of the larger small towns in the province.
The town was historically strong in terms of agriculture but losing its advantage within the province.
The municipality’s strength in government and community services is improving, as a result of the expansion of education facilities found in Grahamstown between 2001 and 2007 Compared to the provincial average Makana performs poorly in terms of manufacturing, transport and communication, utilities and business services.
131
Because Grahamstown is a small town, there is a smaller emphasis on the provision of business services, utilities and transport and communication infrastructure.
Makana does not have a comparative advantage in manufacturing, as most major industry in the province is located in East London and Port Elizabeth. This means that per capita, less manufacturing activity takes place in Makana than in the rest of the Eastern Cape.
2.6.2 PROVINCIAL SPATIAL ECONOMIC DEVELOPMENT STRATEGY (PSEDS)
In terms of the PSEDS, the following Sectors of the provincial economy will drive the growth of the
Province and address unemployment and poverty:
Agriculture, including Agri-industry (with opportunities to impact considerably on the economic needs
of the poor through Land Reform)
Industry, including heavy and light industry and manufacturing
Tourism, including domestic and foreign TOURISM
Service sector including financial, social, transport, retail and government.
The following critical threats are identified in the PSEDS: Agriculture and Land Reform
Loss of productive commercial agricultural land to residential development
Loss of land with agricultural potential in poor rural areas
Land reform resulting in a loss of productive commercial agriculture
Municipal rates on agricultural land
Poor infrastructure in the farms
Provision of adequate water supplies
Tourism
- Safety and Security - Land invasion and illegal activities affecting tourism assets
Industry
- Reliability of services - Social support services - Destructive Inter-Municipal competition - Municipal rates on Industrial and commercial development
A creative city project was launched with following strategic objective and goals:
1. Grahamstown to be recognized as a creative city of South Africa by 2020.
a. To create 500 jobs in the arts and creative sector.
b. Create 500 jobs in the supporting industries.
c. To foster a strong cohesion in the Municipality through creativity and arts.
d. To create an environment conducive to creative
e. To identify public art spaces, places of learning and performances.
f. To increase access to existing creative/ tourism outlets
g. To ensure that capacity building takes place to facilitate the establishment and growth of sustainable
enterprises

132
h. To foster strong partnerships with the government, government agencies, Businesses and NGO’s.
2.6.3 LED AND PLANNING INSTITUTIONAL CAPACITY
Four positions were added to the organogram namely:
1. Liaison Officers under the Managers: Agriculture,
2. Tourism and Heritage,
3. SMME,
4. Trade and Investment
Figure 18 The Makana R-GDP in 2007 (at year 2000 constant prices) was approximately R1, 3 billion, which
accounted for 19.7% of the Cacadu R-GDP and 1.51% of the provincial R-GDP. Grahamstown makes the
largest contribution to the Makana economy, mainly in the form of educational services and tourism
related activities.
2.6.4 SECTORIAL PROFILES
This section provides an overview of all the economic sectors in Makana, profiling the nature and
extent of activity to be found as well as their defining traits. In Makana there are three distinct types of
activity to be found in this sector are:
2.6.4.1 AGRICULTURE
Commercial Agriculture
Commercial agriculture is found in the north of Grahamstown known as Upper Albany, and accounts for
approximately two thirds of the municipality. Livestock and game farming thus dominate in Upper
Albany. Lower Albany land is well suited to rain-fed cropping (Agriculture in Makana, 2008).
The main source of income for commercial farmers (78%) is from livestock farming and animal products.
This is largely made up of dairy farming (41%). With regards to field crops, the majority of income comes
from maize and chicory (a combined contribution of 74%).
Most value addition of commercial agricultural produce (packaging, canning, manufacturing, processing,
etc.) occurs outside the Makana Municipality. There is however, some value addition that takes place,
which will be discussed in the manufacturing sector profile.
2.6.4.2 Challenges Faced by Commercial Farmers in Makana include:
Water shortages and inadequate infrastructure (irrigation, boreholes etc.) to mitigate resultant effects.
Problem animals that are introduced through Private Game Reserves. These kill livestock and introduce
diseases to the area
Crime in the form of stock theft (Agriculture in Makana, 2008).

133
2.6.4.3 Emerging and Subsistence Agriculture
Emerging and subsistence agriculture in Makana follows patterns found throughout most of the Eastern
Cape.
2.6.4.5 Emerging farmers:
Makana has PDIs that are engaging in agriculture of a commercial orientation, often on farms that were
previously farmed by commercial farmers. Emerging farmers typically operate on plots of land that are
less than 20ha in size which are often in the form of commonages leased out from the Makana
Municipality or the Department of Agriculture. Group and cooperative activity dominates as the most
common form of organisation due to limited resources (such as land and equipment) and skills. Emerging
farmers are principally involved in the rearing of livestock, piggeries and poultry.
2.6.4.6 Subsistence Agriculture:
Makana is made up of people residing in villages and townships that use agriculture as a means to
supplement their food and income requirements. This form of agriculture is impeded by the availability
of arable and grazing land, which reduces the potential for increased maize and livestock production
going into the future. Because Makana is a largely urbanised area (with most settlements being in
townships rather than rural villages) subsistence agriculture is not spatially spread out, which further
diminishes the availability of land.
a) Bee-keeping project
5 Farmers were trained in bee- keeping. There were hives over the N2 road that the group had identified,
which had to be transferred into boxes. All the hives were transferred successfully and there were 2
boxes with bees.
b) Food gardens All implements to develop food garden were delivered. In total 5 gardens (Tantyi Clinic, Extension 6,
Mavikela Poultry N-street, St Augustine, Umthathi Projects) were developed in urban setting and 2 from
rural areas have benefited.
The farmers were provided with inputs such as compost, seedlings, and garden tools and few were
provided with bicycles with trailers (means of sustainable transport to reduce carbon emission. In rural
areas (Castle Farm and Yarrow Farm) the tendering process for small tunnels is still in the pipeline. This
is a strategy to extend the SUS programme to rural areas, 2 farms (Castle and Yarrow Farms) were
identified through consultation with various stakeholders including the relevant councilors.
Small tunnels (5mx 12m) will be built and the purpose is to pilot the project in rural areas develop more
productive ways of producing vegetables. Terms of Reference are available electronically.
c) Competition
134
A farmer’s completion held in Alicedale and a total of 5 co-ops won seed funding. In total 5 co-ops have
benefited from Municipal agricultural-related programmes. One co-op benefited (Inqaba Yegolide)
supplied inputs for SUS programme and also won the competition in Alicedale.
Some of the challenges they face include:
Lack of skills, training and education
Inadequate land, which leads to problems such as stray animals, theft, land degradation, etc.
Insufficient support from the Department of Agriculture in the form of mentorship, extension officers,
dipping facilities etc.
Low profit margins because of low market prices and small scope of operations
Inadequate working capital for day-today operations (chemicals, seed, fuel, etc.)
Access to markets (Makana Farmers Association, 2009)
2.6.4.7 HUNTING AND PRIVATE GAME RESERVES The third distinct type of activity found in Makana’s agricultural sector is hunting and private game
reserves. This is a form of activity that has grown immensely in Makana from 1995 in terms of market
players, hectares covered and revenue. Though now somewhat saturated, the market for Private game
reserves and Hunting is now a notable contributor to agricultural sector output in Makana.
The transformation of land from pastoral farming to use as hunting and game reserves has yielded mixed
fortunes throughout the Makana area. Average employee wages on game reserves and hunting operations
are typically higher than those on traditional farms. However, these operations are often less labour
intensive than traditional agriculture and thus employ fewer people than farms. This means that total
community welfare and income (as expressed through wages earned and other benefits such as rations,
housing subsidies, etc.) may not necessarily rise in every instance in which farmland has been converted
into a hunting and game reserve (Whisson, 2009).
2.6.4.8 MINING SECTOR
This sector includes the extraction and beneficiation of minerals occurring naturally through underground
and surface mines, quarries and all supplemental activities for dressing and beneficiating for ores and other
crude materials.
Based on the above definition, mining in Makana takes the form of surface mining of Kaolin and sand
quarrying. Mining in Makana makes the smallest contribution of all the sectors in Makana. With regards
to employment, between 1995 and 2007 the number of people employed in the Makana mining sector
has gone up from 66 to 78. Although increasing, this represents only 0.6% of all the people employed in
Makana.
Challenges: As much as Makana possesses large reserves of Kaolin, this does not directly translate into
significant potential for economic growth and development. Due to extrinsic matters (locality of Makana

135
in relation to major industrial hubs, market factors, waning global demand, etc.) the scope for an expansion
of mining activity or even that of improved sectorial linkage is very limited.
R500, 000.00 was secured from the IDC to commission a business plan for Kaolin Mining and a feasibility
study. The final reports will be presented to a Kaolin PSC during this month. These studies are outlining
the way forward for Kaolin mining in Makana. On the basis of the draft reports that were presented to the
PSC last month the CDM and other funders such as ECDC have already showed interest in funding some
aspects of the project.
2.6.4.9 TOURISM OVERVIEW
Grahamstown tourism potential is varied from heritage sites to its close proximately to the Addo Elephant
Park and location midway between Port Elizabeth and East London. Makana Local Tourism Organisation is
registered as a Section 21 Company and is functional and meetings are held monthly. Makana Tourism
and Heritage Manager attend as members of the Executive Committee
The main forms of Tourism in Makana are Environmental, Educational and Cultural tourism. This section
will not repeat previously stated facts, but profile these forms of tourism in further detail. Tables 4.5 to 4.7
will list some of the activities, attractions and products that constitute Makana’s tourism offering as listed
in the Responsible Tourism Sector Plan 2009 Review Report.
Environmental Tourism
Amakhala Private Game Reserve Beggars Bush State Forest
Hunts Hoek Safaris, Fish River Lalibela Private Game Reserve
Idwala / Kichaka Lodge, Assegaai Lanka Safaris Aylesby
Assegaai Hiking Trails, Kenton Rd Blaauwkrantz Reserve, Bathurst Rd
Assegaai Sport Horse Stud, Riding School, Lezulu Game Reserve - Salisbury Plains
Kwandwe Private Game Reserve Burchell Game Farm, Alicedale
Aylesby Nature Reserve, Riebeeck East New Year’s Dam, Alicedale
Kwantu Game Reserve, Sidbury Bushman Sands Game Reserve, Alicedale
Oldenburgia Hiking Trail, Grahamstown Coleridge Game Reserve, Grahamstown South
Coombs View Reserve, Governor’s Kop Pumba Game Reserve, Grahamstown
Rochdale Game Ranches, Alicedale Rd Rabbit Bush Reserve, Governor’s Kop
Diepkloof Private Reserve East Cape Game Farm
Shamwari Private Game Reserve Settlers Dam, Thomas Baines
Ecca Nature Reserve, Ecca Pass Fish River Nature Reserve Complex
Springvale Olive Farm, SE of Alicedale Signal Hill, Grahamstown
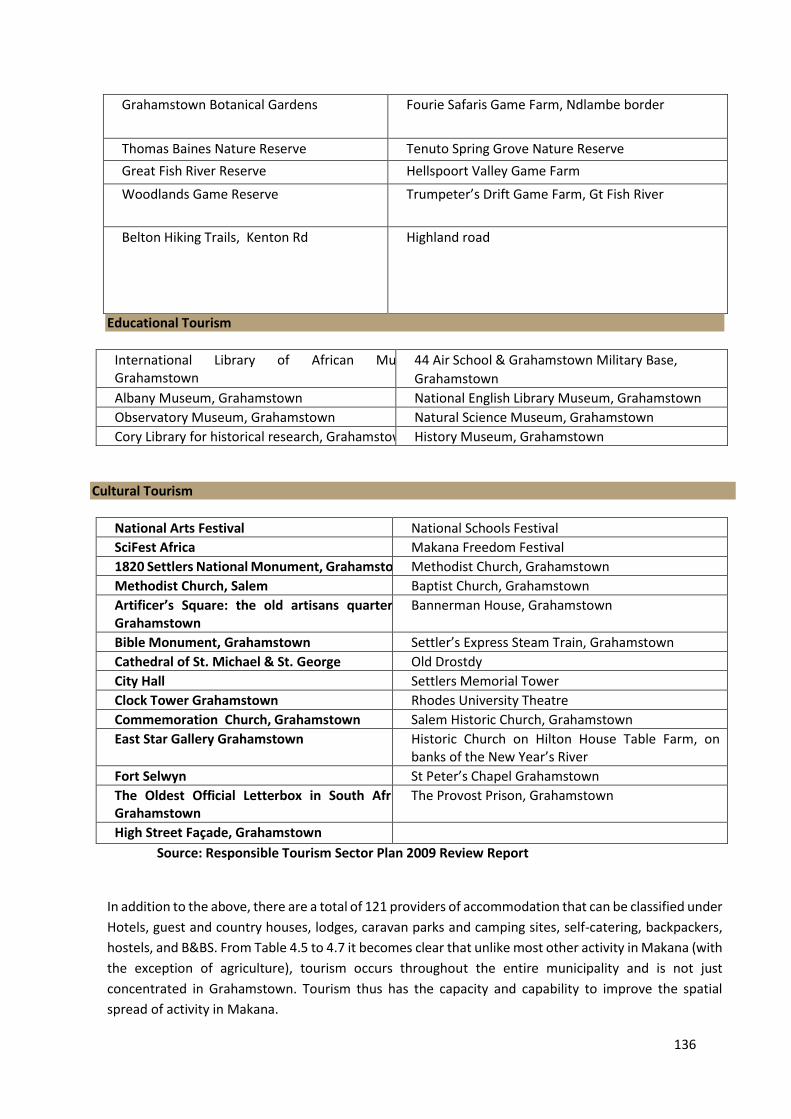
136
Grahamstown Botanical Gardens Fourie Safaris Game Farm, Ndlambe border
Thomas Baines Nature Reserve Tenuto Spring Grove Nature Reserve
Great Fish River Reserve Hellspoort Valley Game Farm
Woodlands Game Reserve Trumpeter’s Drift Game Farm, Gt Fish River
Belton Hiking Trails, Kenton Rd Highland road
Educational Tourism
International Library of African Music, Grahamstown
44 Air School & Grahamstown Military Base,
Grahamstown
Albany Museum, Grahamstown National English Library Museum, Grahamstown
Observatory Museum, Grahamstown Natural Science Museum, Grahamstown
Cory Library for historical research, Grahamstown History Museum, Grahamstown
Cultural Tourism
National Arts Festival National Schools Festival
SciFest Africa Makana Freedom Festival
1820 Settlers National Monument, Grahamstown Methodist Church, Grahamstown
Methodist Church, Salem Baptist Church, Grahamstown
Artificer’s Square: the old artisans quarter in Grahamstown
Bannerman House, Grahamstown
Bible Monument, Grahamstown Settler’s Express Steam Train, Grahamstown
Cathedral of St. Michael & St. George Old Drostdy
City Hall Settlers Memorial Tower
Clock Tower Grahamstown Rhodes University Theatre
Commemoration Church, Grahamstown Salem Historic Church, Grahamstown
East Star Gallery Grahamstown Historic Church on Hilton House Table Farm, on the banks of the New Year’s River
Fort Selwyn St Peter’s Chapel Grahamstown
The Oldest Official Letterbox in South Africa, Grahamstown
The Provost Prison, Grahamstown
High Street Façade, Grahamstown
Source: Responsible Tourism Sector Plan 2009 Review Report
In addition to the above, there are a total of 121 providers of accommodation that can be classified under
Hotels, guest and country houses, lodges, caravan parks and camping sites, self-catering, backpackers,
hostels, and B&BS. From Table 4.5 to 4.7 it becomes clear that unlike most other activity in Makana (with
the exception of agriculture), tourism occurs throughout the entire municipality and is not just
concentrated in Grahamstown. Tourism thus has the capacity and capability to improve the spatial
spread of activity in Makana.
137
Tourism is currently marketed by Makana tourism. It has approximately 120-130 members that engage
in the different forms of tourism profiled.
In addition to Makana tourism, the following associations and organisations are involved with tourism
activity:
The Grahamstown Foundation, which is involved with the various Festivals that take place in Makana
region
Indalo, which is an association for Private Game and Nature Reserves
The Grahamstown Hospitality Guild, which is involved with grading of accommodation facilities
Makana EduTourism Project, which is a partnership between Grahamstown Foundation, Makana
Municipality and Makana Tourism.
Challenge: There is a need for marketing of Makana’s tourism offerings to be coordinated and
intensified for cooperative synergies to be experienced
2.6.4.10 TRADE AND BUSINESS SERVICES
The trade sector is defined as the resale (sale without transformation) of new and used goods to the
general public for personal or household consumption or use by shops, department stores, stalls,
hawkers etc. The trade sector entails wholesale, commission trade, retail trade and repair of personal
household goods; sale, maintenance and repair of motor vehicles and motor cycles; hotels, restaurants,
bars, canteens, camping sites and other provision of short-stay accommodation. It can thus be seen that
this sector involves a broad spectrum of activity which is diverse and varied in nature.
The sale of goods and services by shops and stores represents general commerce related to the day-to-
day existence of local residents. The sale of goods and services by restaurants, camping sites, hotels and
other short stay accommodation providers represents some elements of tourism related activity. This
sector is thus important as it reflects activity that originates from within Makana (shops, and stores) and
activity that originates from outside Makana (tourism through hotels and restaurants)
The nature and challenges of trade in Makana:
There are several national chains and franchises located in Grahamstown, including Pick n Pay, Shoprite,
Edgars and Pep Stores. There are two main shopping centers – the 6 876m2 Pepper grove Mall which
targets the middle to high income band and the 6 130 m2 Market Square Mall which targets the lower to
middle income band. In addition to these, there is a variety of shops in the Grahamstown town Centre
(mainly in High street, Beaufort Street and Hill Street), and several informal spaza traders located in the
townships. (Mall guide, 2009)
Despite the wide array of options (in comparison to other similarly sized towns), there is a significant
amount of expenditure leakage to other towns such as Port Elizabeth for goods such as specialty
products, luxury items, electronic equipment and clothing. This is a result of Makana’s demographic
profile, which is made up of young, upwardly mobile consumers that seek variety. High income earners
thus often travel outside the Makana locality to buy goods and services. As a result of the relatively small

138
population in Makana, there is little wholesale activity, as demand levels are insufficient to reach the
necessary critical mass.
In the tourism trade there are several restaurants (including take-away, convenience food and fast food
outlets) short term accommodation facilities (including hotels, guest houses and camp sites) in
Grahamstown. These will be expanded upon in the tourism sector profile. It must be noted that these
serve both tourism demand, and demand from local residents as well. Facilities situated in the township
(such as homestays and taverns) are underprovided, when consideration of the actual size and
population of the townships in Makana is made. In the other areas in Makana (Riebeeck East and
Alicedale), owner managed enterprise dominates the trade sector. This applies to both the retail and
tourism sides of the trade sector. This is because it is not profitable for large businesses to establish
themselves in these areas due to their small populations and low income levels. The smaller settlements
in Makana are thus dominated by general dealers, liquor stores and mini-markets that serve the needs
of local resident.
2.6.4.11 MANUFACTURING
This sector is broadly defined as the physical or chemical transformation of materials or compounds into
new products. The Manufacturing sector is thus the sector where natural resources and other
intermediate goods are converted through value adding processes into final products for the Trade
sector.
Manufacturing in Makana is described under the Industry classification has ‘limited prospects overall’
and under the Carvalho classification as making a ‘marginal’ contribution to the municipality’s economy.
Despite this forecast, there is scope for specialist/niche manufacturing activity such as deboning of
ostrich meat.
As a result of Makana’s industrial profile, such operations will not typically employ large amounts of
labour. They can however, generate much needed income into the area and will often have linkages with
other economic sectors
2.6.4.12 CONSTRUCTION
The construction sector includes activities related to site preparation, construction of buildings, building
installations, building completion and the renting of construction equipment. The range of activity
contained within the construction sector thus includes shop fitting, plumbing, electrical contracting,
painting and decoration. There are few large and accredited building contractors in Makana that are able
to undertake large, high value projects.
Such contractors are typically associated with the Master Builders Association. Large construction sector
organisations in the Makana area include CM Heunis Building contractors and Strydom and Kroqwana
Construction. In order to remain accredited, they often have to bring in skilled and certified labourers
from outside the Makana area, which represents an income and employment leakage out of the Makana
area. A leakage in this context refers to a flow of resources out of the local economy. Building contractors
are thus often brought in from outside the Makana area in order to oversee building projects.

139
The contractors who are from outside the LM do however provide jobs for the locals but often bring in
their own labour, and for this reason local job creation is not as high as it could be in the construction
sector. In addition to this, limited institutional support for apprenticeship, mentorships and other forms
of training propagate continued leakage of incomes from the area. There are several emerging building
contractors located within the Makana region. However, they are often plagued with a lack of
experienced and skilled staff, which limits their growth. Other problems faced by emerging contractors
include project management capacity constraints that ultimately affect project completion and quality.
As a result of no accreditation, emerging contractors are often bypassed when it comes to opportunities
to tender for high value construction projects such as government funded infrastructure provision. This
then reinforces a cycle in which emerging contractors remain too small, inexperienced and under
capitalised to grow their businesses. (Lisa Trading, 2009)
Physical inputs are widely available throughout the Makana area, as there are a wide range of suppliers
or equipment, tools, machinery, etc. though falling under the Trade sector; these include large (MBA
associated) organisations such as Penny pinchers, PG Glass and BUCO. Small emerging businesses such
as Khaya Blocks and Quarry also contribute.
2.6.4.13 TRANSPORT AND COMMUNICATION IN MAKANA
In terms of transport services in Makana, there is no water transport, regularly scheduled air transport
or transport by pipeline. Rail transport used to be important in the region, but has been significantly
reduced in recent years. This then means that the bulk of transport services in the municipality may be
classified under road transport.
There are several operators of road transport within Makana that provide transport within the
municipality and to other regions as well.
The following forms of transport activity are found within the Makana area:
Bus and Coach Passenger lines (such as Greyhound and Intercape) operate in the area, even though they
do not have base offices in Makana.
Mass Commuter transport (in the form of minibuses/ taxis, associated with Uncedo, the taxi
organisation)
Shuttle services (such JCs shuttle service and Rhode Trip)
Flights from the Grahamstown airstrip for entertainment purposes (such as E.P. skydiving and guests to
game reserves such as Kwandwe)
Occasional sightseeing rail tours (such as the Alicedale adventure)
These activities are supported by enabling infrastructure and service including:
Grahamstown’s proximity to the N2 highway and linkages with other major roads as shown in the
infrastructure profile
A taxi rank facility that serves a hub for transport within and outside Makana
Several petrol stations (garages) that trade on local and transient demand
Travel agents (such as Go travel)

140
In terms of communications, Makana is relatively well linked. Postal services are provided by Postnet
(Private) and The Post Office (Public). In addition to these, several courier companies such as speed
services and UTI sun operates within the Makana area, as do several internet cafes.
Rhodes University also has comprehensive information and communication technology (ICT)
infrastructure. In fact, South Africa’s first internet link was based at Rhodes University in 1988. This led
to the establishment of UNINET, which was a gateway that provided internet access for South African
universities. In recognition of this, a Centre of Excellence in Distributed Media was established at Rhodes
University in 1997, in association with Telkom SA and other partners.
Challenges in Transport and Communication:
The transport sector in Makana has limited opportunities for growth, partly as a result of its small and
stable population. The communications sector grew while the transport sector declined between 1995
and 2007. With linkages to the trade and service sectors, a growing communication sector can allow
business growth and the establishment of a knowledge economy
2.6.4.14 FINANCE AND BUSINESS SERVICES IN MAKANA
In terms of finance and insurance, all the major banks are found in Grahamstown (ABSA, FNB, Standard
Bank, Nedbank, Capitec Bank, Old Mutual Bank and GBS Mutual Bank. These largely service the banking
requirements of local businesses and farmers in the area.
A range of mortgage providers, micro-lenders and investment facilitators such as Wesbank and Louhen
financial Services are also present. Insurance brokers such as Sanlam life assurance and McCallum
Brokers also operate in the Makana area. These target personal financial services.
A full range of business services are also available in Grahamstown These include accounting (Neill Pike,
the Tax House), real estate agents (Pam Golding, Remax, Lew Geffen Sotheby’s etc.), attorneys
(Nettletons, Whitesides, Wheeldon Rushmere & Cole etc.), IT services (Albany Computers, Oracle
Consulting, IT Solutions), engineers (MBB consulting) and other forms of activity.
It is apparent that a broad spectrum of activity in the business services sector is covered in Makana. It is
prudent to point out that some of the business services located in Makana are directly linked to the
existence of Rhodes University, and may not have been established in Makana if it were not for the
presence of the university.
These include:
Birch’s (Robe making for university gowns)
CES (linked to Environmental Science department)
Grocott’s Mail (Department of Journalism)
Geodetic (Geography and Information Systems Departments)
NISC (Department of linguistics, Rhodes library, research office)
Private consultancies run by Rhodes university faculty members and alumni
The number of real estate agents is high compared to other towns of a similar size. This is a result of the
demand for accommodation that results from the student population studying at Rhodes University.

141
In a pattern that resembles the other sectors, provision of business and financial services is mainly
centered in the Grahamstown area, with few businesses in other towns such as Salem, Riebeeck East
and Alicedale. This means that residents of these towns often have to commute to Grahamstown in
order to have access to these services.
Challenge:
This sector will have a role in economic development through its ability to attract and its ability to absorb
local semi-skilled and skilled labour. One of this sector’s roles in economic development is that of
improving the quality of financial and business services rendered to economic development stakeholders
and beneficiaries. The performance of this sector also has an impact on the true ‘cost of doing business’
in Makana as it represents the bulk of the tertiary sector of the economy.
2.6.4.15 GOVERNMENT SERVICES IN MAKANA
Based on their annual reports and financial statements publicly available online, it emerges that the two
main entities in Makana’s government sector are Rhodes University and the Makana Municipality
(Rhodes University Annual Report, 2007; Makana Municipality IDP, 2007).
Rhodes University which provides educational services is responsible for approximately 71% of the
government sector’s output in Makana, and approximately 21% of the sector’s permanent employment.
Of its entire workforce 26% are employed in academic instruction and research, 43% are employed in
administrative support and 31% are employed in support service positions.
The Makana Municipality which provides local governance and public administration is responsible for
approximately 19.4% of the government sector’s output, and 8% of its employment creation. That means
that Rhodes University and the Makana Municipality make a combined contribution of 90% of the
government sector’s output.
Other organisations and forms of activity in the Makana government sector include
Government departments (such as Home Affairs, Roads and Transport, Agriculture, Education, Labour,
Water Affairs and Forestry, amongst others)
Defense activities (such as the SANDF Grahamstown military base, Midlands Command and the SAPS)
Government agencies (such as SEDA, ECARP)
Justice services including the department of Public Prosecutions, High court, Magistrates court and Small
Claims Court
Education (The East Cape Midlands College and Schools such as Nombulelo High School, Mary Waters
School, St Andrews, DSG, Victoria Girls, amongst others)
Health facilities (such as Settler’s hospital)
It can thus be seen that the majority of activity classified under the government sector within Makana is
undertaken in Grahamstown.
2.6.4.16 COMMUNITY WORK PROGRAM (CWP)
The creation of decent work will take time and the Community Work Programme (CWP) has been
operationalized in the interim. The programme is intended to supplement unemployed individual’s
142
existing livelihood and offers a basic income through work. It is designed to create work for 8 days a
month, for 8 hours a day and be paid a stipend of R60 per day. Makana is a CWP Site and more than 1200
participants are benefitting from this programme.
The following are the mechanisms aimed at supporting CWP:
Establishment of Local Reference Committee
Assistance with the recruitment of participants
Reporting and document management
Project monitoring and evaluation.
2.6.4.17 SMALL MEDIUM AND MICRO-ENTERPRISE DEVELOPMENT
SMME’s base line information:
SMME’s base line information and targets going forward
A majority of SMME’s fall within the survivalist, micro and small enterprise category with few SMME’s
in the medium category;
Increased potential and performance of tourism enterprises as a result of the strong tourism sector in
the economy;
Organised farming sector with a potential for growth;
Increase in start-up mining enterprises as a result of good prospects in the kaolin value chain;
Existence of an SMME Development strategy which is based on the following pillars:
o Training;
o Access to land;
o Access to finance;
o Information;
o Communication;
o Access to Land; and
o SMME Database.
o Targets for SMME development are underpinned and articulated in the SMME Strategy Development
and are the following:
Facilitate the training of 100 SMMEs in technical and business skills by 2014;
Develop a communication policy and strategy, which is inclusive of social networking, for SMME by
2014;
Facilitate the release of 300 hectares of land for industrious SMMEs and Cooperatives for 2014;
Identify premises for SMME information and incubation centre by 2014;
Sign 4 MoUs with at least four national and provincial SMME support structures ensuring a physical
presence in Makana;
Develop a database of SMMEs and Cooperatives in Makana; and
Review SCM to ensure maximum participation of SMMEs in Makana.
Co-operatives in Makana Municipality
Makana has ±80 co-operatives (includes registered and those who are in the registration process), the
list is inclusive of co-operatives registered by Department of Social Development, Department of Sport,
143
Arts and Culture, Department of Rural Development and Agricultural Reform who are other stakeholders
who are involved in co-operative development;
Facilitated the registration of 9 co-operatives in this current financial year;
Conducted 7 co-operative information sessions;
Facilitated the establishment of Makana local co-operative forum, which is a local representative
structure for all co-operatives in Makana
2.6.4.18 OTHER CRITICAL LOCAL ECONOMIC DEVELOPMENT CHALLENGES AND DEVELOPMENT
PRIORITIES
The challenges at Makana relating to Local Economic Development (LED) and Planning can be
summarised as follows:
Investment into the township by profiling investment opportunities .e.g. retail centre in Joza Extension
6, packaging as well and promotion of the opportunities.
The turn-around time for approval of land use applications is prolonged by postponement of meetings
of Council and Mayoral Committees;
Legal action against the municipality due to failure to process land use applications within the stipulated
period;
There is a need for prioritisation of funds to implement LED projects, land audit and town establishment;
Lengthy process for the approval of building plans due to a lack of inter-departmental cooperation;
The MIG component of LED to be examined and prioritised for LED projects;
Lack of investor confidence in the municipality due to infrastructure related challenges i.e. constant
electricity and water outages;
There is a need to improve Makana tourism and review the service level agreement with Eastern Cape
Tourism;
There is a need to conclude a land audit of all municipal land with a view to prioritise development which
will assist to increase its revenue base and assist the municipality’s cash flow;
LED strategy should be reviewed, engaged with relevant stakeholders for example Eastern Cape Tourism
and Rhodes University, refined as well as an investment policy and both policies should be implemented;
There is a need to improve the alignment of the IDP and budget as well as communication with the
community;
Annual IDP process plan to be fully implemented and be fully compliant with legislation;
IDP directorate is currently under Corporate Services and this might need to be reviewed and addressed
through the organisational restructuring;
The municipality does not have a communication strategy, and public participation and the
communication programme/ plan needs improvement. All the wrong things get communicated which
can be resolved with the implementation of a media strategy;
Media briefing sessions to be held after Council meetings, mayoral Imbizo, amongst others. In addition,
Ward councillors should communicate the relevant details regarding projects and any other initiatives
they need to update the community with;
Human resource structure to be reviewed and capacity addressed;
Undertake governance training and entrepreneurial development training amongst others,

144
Currently the customer care unit resides in different units, e.g. corporate services, Speakers office and
there is a need for integration of customer care to ensure consistency in implementation; and
The website needs to be revamped and updated to ensure relevant information is placed in compliance
with legislation.
The municipality should prioritise a funding strategy to implement LED projects which are critical for
increasing the revenue base of the municipality. Council and Committee meetings should be prioritised
and take place as scheduled. The adequacy of resolutions and timely circulation should be addressed.
The town planning section and all other relevant units should have weekly meetings to consider any new
building plans. The introduction of a public participation and communication programme to ensure a
proper communication channel internally and externally.
To contribute to the sustainability of the municipality the following activities should take place;
implement anchor projects for which funding is required which include Creative City Project, Egazini
Memorial Site, Development of Hawkers Stalls, Inner city Regeneration (business plan), Extension 6 Mall
and Land Audit. Makana should sign a service level agreement with Eastern Cape Tourism to ensure all
tourism matters Eastern Cape Tourism need to carry out on behalf of the Municipality are carried out.
Foster relationships with Eastern Cape Tourism, Rhodes University and other key investors within the
municipality’s jurisdiction.
The municipality should also review its lease agreements to identify non-paying tenants and those that
pay less than a market related rental.
The municipality, through the LED Directorate, had an engagement with the local business sector, the
purpose of the meeting was to gain an understanding of the challenges that are faced by the sector
and to agree on remedial actions.
The following challenges were identified and remedial actions were proposed:
Lack of understanding of compliance issues with regards to supply chain management. It was agreed
that a workshop on procurement processes and a presentation of the SCM policy will be arranged;
Local service providers are not prioritised when the municipality pays its creditors. It was agreed that
the Finance Department arrange a meeting/ communicate with all service providers that have not been
paid; and
Tenders are not unbundled with references made to the human settlements tenders. The municipality
to have quarterly engagements with the construction sector to discuss this and many other issues. It
was agreed that a meeting with the Department of Human Settlements be arranged.
In terms of the Provincial Spatial Economic Development Strategy (PSEDS), the following sectors of the
provincial economy will drive the growth of the Province and address unemployment and poverty:
Agriculture, including agri-industry (with opportunities to impact considerably on the economic needs of
the poor through land reform);
Industry, including heavy and light industry and manufacturing;
Tourism, including domestic and foreign tourism; and
Service sector including financial, social, transport, retail and government.

145
The results of the economic analysis show that the Makana area of jurisdiction has considerable
investment potential evidenced by the consideration to invest and the desire to recommend the area as
an investment location. Most sectors indicate that business prospects have not been negative which
emphasises that there is scope for business growth and, more importantly, gives an indication of the
sectors that appear to provide the most potential.
However, the information is static while business prospects and business sentiment is fluid, which means
that they are subject to change and Makana has not kept up to the growth potential of the region. This
final note suggests that the assessment of Makana’s needs must not be simply taken as a part of a larger
project, as is the case here, but as a continuing concern that is regularly considered by Makana policy
makers.
Rhodes University Centre for Entrepreneurship in May 2011 undertook a Makana Investment
Incentives Policy and Investor Friendly Environment Initiative.
The list of specific concerns raised in interviews was as follows:
Inadequate road development in areas around small farmers that require improved accessibility;
Lack of assistance for small farmers seeking capital for inputs (fertilisers, tilling, seed, etc.);
Lack of recognition for outstanding business performers;
No municipal backed skills training for residents;
Weak water service delivery and quality;
No forum for the regular review of stakeholder considerations;
No programme to facilitate technological awareness and access;
There is not enough support for stakeholders seeking institutional financial support;
The need for an improved social environment through the encouragement/ support of social
engagement activities;
The need to attract labour creating businesses; and
A greater focus on improving the number of value added products that are made in the area.
The development strategies in respect of local economic development, taking the above into account,
are as follows:
Promote and support agricultural development and capacity building:
- capacity building programmes for small scale farmers;
- funding for agricultural projects;
- establishment of an agricultural forum;
- establishment of a strategic partnership to promote sustainable agricultural development;
- infrastructural development at Thorn Park;
- promote and support co-operatives through seed funding;
- roll out of the sustainable urban agricultural programme to promote a green economy;
146
- co-fund projects funded by other departments; and
- women and youth agricultural support programme.
Promote and support tourism development and capacity development:
- heritage promotion;
- inner city regeneration;
- national arts festival marketing programme;
- participation in tourism trade shows;
- promotion of forts and towers;
- roll out of creative city project;
- support for Kwam eMakana homestay project;
- tourism internship programme;
- tourism promotion; and
- develop a business plan and a feasibility study for aloe production.
Support enterprise development:
- roll out a community works programme;
- SMME start-up package;
- co-operative seed funding;
- support to business chamber;
- informal sector support;
- training for Kaolin Co-operatives;
- secretariat for the Kaolin project steering committee; and
- support for the formation of new businesses.
2.7 PUBLIC SAFETY AND COMMUNITY SERVICE
2.7.1 COMMUNITY HALLS:
There are 8 community/ town halls in the Makana area which are utilised by the community. Some of
these facilities are in need of maintenance and repairs.
2.7.2 LIBRARIES:
There are 8 libraries in Makana managed by the Municipality in terms of a Service Level Agreement
with the Province. These libraries are situated in ward 1; 7; 8; 10; 14 and a mobile library that services
ward 5.

147
2.7.3 SPORT AND RECREATION FACILITIES:
Grahamstown- Rhini
Indoor Sports Centre (New Facility functional)
Mickey Yili Rugby Fields (2 x Playing fields) - In need of upgrading especially lighting and stands
Millennium Cricket Stadium (1 x field with turf wicket and Practice nets)
Dlepu Stadium (2 x soccer fields) In need of upgrading especially lighting, ablutions and Pavilion
Foley's Ground (soccer field with tennis court and basketball court under construction
The Oval - Lavender Valley Sports grounds (2 x rugby fields and Basketball court) In
need of upgrading, leveling of fields, ablutions and lighting
Egazini Rugby field (1 x field under reconstruction)
Extension 5 Satellite Soccer ground (3 x Soccer fields - out on tender)
Alicedale:
Transriviere (1 x Rugby Field plus two netball courts)
KwaNozwakazi (1 x Soccer Field and Netball court)
Riebeeck east: KwaNomzamo (1 x Rugby field and netball court) Council in 2014-15 financial year has an approved
budget for Maintenance. Budget for Sporting grounds is valued at R 2,062,620, all-inclusive and Capital
Program at R 406,000. There are two Golf Courses in the Municipal Area, both privately run, one
in Grahamstown and the other in Alicedale
2.7.4 CEMETERIES
Grahamstown
Mayfield Cemetery (currently in use and has capacity for another 12 Years at the current rate of burials
Waainek Cemetery (currently in use and has capacity for a further 5 years at current rate of burials
Lavender Valley (Currently not in use other than for reserved graves)
Grahamstown Historical Cemetery (currently not in use other than for reserved graves)
Extension 1 Cemetery (currently not in use)
Kings Flats Cemetery (currently not in use other than for reserved graves)
Kwa Dinga Cemetery (currently not in use)
Alicedale
Kwa Nonzwakazi (currently at capacity)
Transriviere (currently in use and has capacity for a further 5 years at current rate of burials)
Town Cemetery (currently in use and has capacity for a further 5 years at current rate of burials) Riebeeck East
KwaNomzamo (currently in use and has capacity for a further 5 years at current rate of burials)
Town Cemetery (currently in use and has capacity for a further 5 years at current rate of burials)

148
Outlying Districts
A number of farm cemeteries that are not registered (status of cemetery and available space for burials still being investigated
2.7.5 PRIMARY HEALTH CARE
There are 9 clinics and 2 ambulance services and 5 hospital all stationed in Grahamstown. Opening hours
for all the clinics are from 8h00 to 16h30, 5 days a week
Professional nurses ranges between 3 to 5 per clinic depending on the headcount of the clinic(how big
the clinic is)
Doctors visit clinics some clinics once a week others once in two weeks
Table 66 Makana Clinics and Hospitals
NO CLINICS HOSPITAL
1. Town Clinic 1. Settlers Hospital (Public)
2. Grahamstown Mobiles 2. Settlers Hospital (Private)
3. Joza Clinic 3. Fort England Hospital
4. Kwa-Nonzwakazi Clinic 4. Settlers Day Hospital
5. Middle Terrace Clinic 5. Themba TB Hospital
6. NG Dlukulu Clinic (Ext 7)
7. Raglan Road Clinic
8. Riebeeck East Clinic
9. Tantyi Clinic
Makana Municipality has two Ambulance Services i.e. EMS and Netcare. For those patients referred to
either Port Elizabeth or East London there is transportation organised by the hospital and the ambulance
service; on Monday, Wednesday and Friday to PE and Tuesday & Thursday to East London.
COMMON DISEASES: REFERRAL SYSTEM:
TB
HIV
Hypertension(High Blood pressure)
Diabetes
Arthritis
Asthma
Ward Based outreach Teams
Clinic
Community Health Centre
Hospital(District or TB hospital)
Port Elizabeth (Tertiary hospitals) – Specialist
Clinics
2.7.6 COMMUNITY FACILITIES AND PUBLIC AMENITIES
Table 67
COMMUNITY SERVICES AND
FACILITIES WARD NAME
TOTAL IN MAKANA
MUNICIPAL AREA
Clinic 1,2,3 Mobile Clinic 3
Taxi Rank 8 Ncedo Taxi Association and
Border Alliance
2

149
COMMUNITY SERVICES AND
FACILITIES WARD NAME
TOTAL IN MAKANA
MUNICIPAL AREA
Post office 7 & 8 Market Square, High Street &
Joza
3
Pension pay points 3; 5; 7; 8; 9;
10
Recreation; B.B. Zondani 2
Sports facilities and Local sports
activities
2,3 J.D Dlepu; Mikki Yili; Foley’s
Ground; Lavender Valley
4
Cemetery
1; 3; 4; 9 &
11
Albany Old Cemetery;
Ndancama; Waainek; Mayfield;
Thatha & Ext 7
6
Church/Place of Worship
1; 2; 3; 4; 6;
7; 8; 9; 10;
11; 12; 13;
14
Methodist; Anglican;
Presbyterian; Zion; Adventist;
Pentecostal
Numerous
Banking Facilities 8 NED BANK, ABSA, FNB,
STANDARD BANK, CAPITEC
5
Parks & Recreation 1,3,6 Pumlani Park, Lavender Valley,
Memorial Park
3
Libraries
1, 2, 3, 5,
10, 12, 13 &
14.
There are 8 libraries in the
Makana Area. The libraries are
situated in the following wards
8
2.7.7 TRAFFIC SERVICES
Makana municipality operates a traffic service (7 posts). A fully functional motor vehicle test center is
located in Grahamstown and is fully operational. There is also Grade A Traffic and Parking (town).
Makana delivers an agency service for licensing (NATIS) on behalf of the Provincial Department.
Three Peace Officers have been appointed to enforce by-laws.
2.7.8 COMMUNITY SAFETY
The South African Police Service Act as amended made provision for the establishment of municipal police
services and community police forums. In Makana a cluster ward approach was undertaken to establish
Community Police Forums, in total five have been established. During the Community based planning,
concern was raised around the effectiveness of these forums and the lack of visibility of the SAPS.
SAPS Crime Research Statistics show that crime levels are high in Grahamstown. Contact crimes against
a persons and burglary at residential premises are most prevalent.

150
Table 68 Police Stations in Makana Area
NAME WARD
Grahamstown CBD Area 8
1x Riebeeck East 1
1x Alicedale 14
1x Fort Brown 1
1x (Extension 6 New Police station) 6
Seven Fountain 14
Committees Drift 1
Joza Police Station 6
2.7.9 CHALLENGES AND DEVELOPMENT PRIORITIES
The Directorate of Public Safety and Community Services is one of the biggest departments within the
municipality and is made up of about 40% of the staff employed by the municipality. The Directorate is
responsible for the provision of parks, recreational and sporting facilities, cleansing and environmental
health services, library services, environmental management, traffic services, fire and emergency services.
The challenges facing the Public Safety and Community Services Directorate are as follows:
Lack of human capacity to implement the by-laws. The by-laws are not updated and some are
not approved, which could result in possible litigation as regards billing for and collection of
monies levied for services;
Implementation of unfunded and underfunded mandates, example firefighting which is a district
function. Engagements with the Sarah Baartman District Municipality are taking place in this
regard.
Lack of resources e.g. no fire stations in outlying areas and therefore the inability to respond to
fires on time especially in areas like Alicedale and Riebeeck East;
Establishment of libraries in the new areas not done due to a lack of funding;
Inadequate customer complaint handling processes. At present all complaints are referred to
the Fire Services and therefore there is a need to establish a centralised responsive customer
care unit/ centre to deal with customer care complaints and emergencies; and
Vehicles are old and unreliable and impact negatively on service delivery; and
Eradication of illegal dumping sites, fencing of legal dumping sites, improvement of street
cleaning, the provision of the cleaning services in all areas of Makana and monitoring of
cleaning staff.
Improve and Increase visibility of Police, Resuscitate Community Policing Forums and
establishing Community Safety Forum

151
The municipality should prioritise, update, approve and enforce the by-laws. The billing of refuse and an
audit of all refuse removals to ensure that consumers are being billed correctly for the amount of refuse
removed should be undertaken. The acquisition of vehicles and equipment, cleanliness of the town,
identify and cost unfunded and underfunded mandates which are the competency of the district and other
departments and engage these institutions to address the matter, must be undertaken amongst others.
2.8 BASIC SERVICE DELIVERY & INFRASTRUCTURE PLANNING
2.8.1 ACCESS TO BASIC SERVICES
The Makana local municipality is both, the Water Service Authority and Water Service Provider and is also
responsible to provide all the other local government services such as municipal roads, storm water
management, electricity and waste collection and disposal etc. The Municipality is granted an equitable
share which it receives from government in terms of the Division of Revenue Act (DORA) for the provision
of free basic services to households who cannot afford to pay for their services. National policy requires
that poor households should receive50 kWh of free basic electricity, 6Kl of free basic water, free basic
sanitation and free weekly refuse removal. There are a total of 6085 poor (indigent) households on the
Municipality’s indigent register who are provided with indigent support in terms of the Municipality’s
Indigent Policy monthly.
Table: 69
SERVICES 2011 2016
Number Percent Number Percent
Access to housing:
Formal 18 269 85.4 20 589 90.7
Traditional 780 3.6 1 046 4.6
Informal 2 153 10.1 934 4.1
Other 186 0.9 132 0.6
Access to water:
Access to piped water 20 854 95.8 21 431 94.4
No Access to piped water 924 4.2 1 269 5.6
Access to sanitation:
Flush toilet 16 283 76.2 19 382 85.4
Chemical 28 0.1 50 0.2
Pit toilet 3 439 16.1 2 110 9.3
Bucket 774 3.6 264 1.2
None 854 4.0 480 2.1
Energy for lighting:
Electricity 19 505 89.7 21 934 97.0
Other 2 238 10.3 688 3.0
Energy for cooking
Electricity 17 589 80.9 20 594 90.9
Other 4 154 19.1 2 059 9.1
Access to refuse removal:
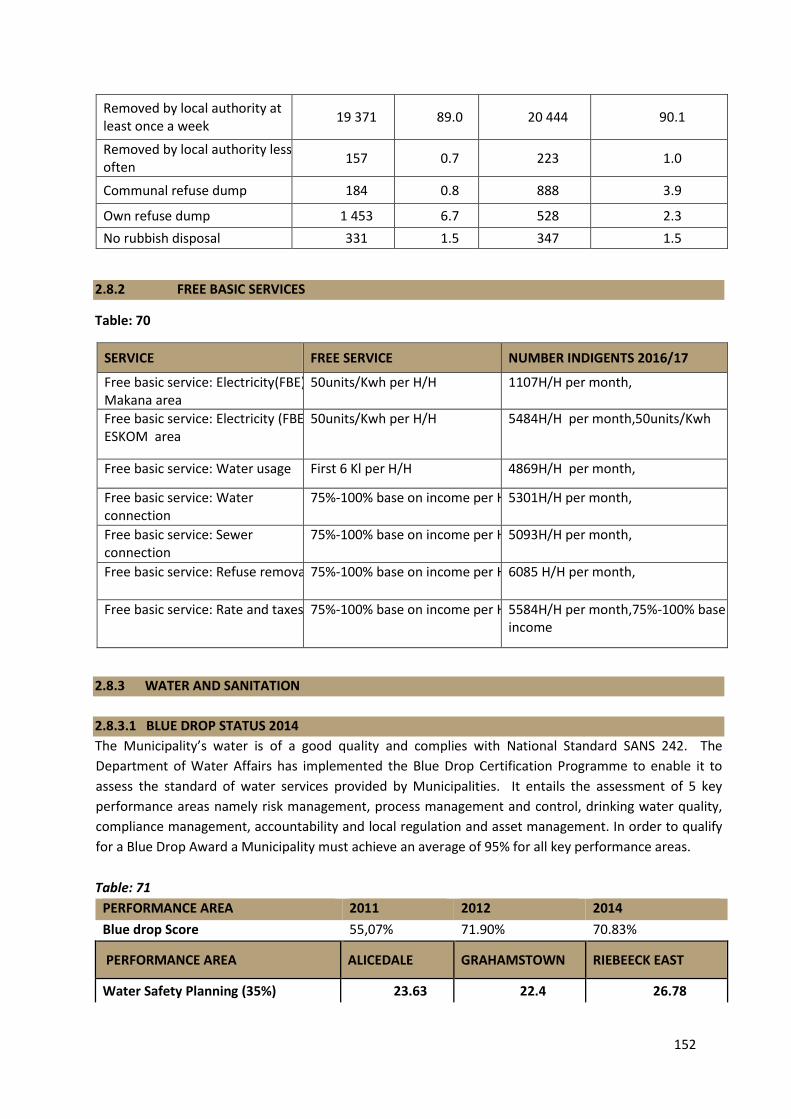
152
Removed by local authority at least once a week
19 371 89.0 20 444 90.1
Removed by local authority less often
157 0.7 223 1.0
Communal refuse dump 184 0.8 888 3.9
Own refuse dump 1 453 6.7 528 2.3
No rubbish disposal 331 1.5 347 1.5
2.8.2 FREE BASIC SERVICES
Table: 70
SERVICE FREE SERVICE NUMBER INDIGENTS 2016/17
Free basic service: Electricity(FBE) Makana area
50units/Kwh per H/H 1107H/H per month,
Free basic service: Electricity (FBE) ESKOM area
50units/Kwh per H/H 5484H/H per month,50units/Kwh
Free basic service: Water usage First 6 Kl per H/H 4869H/H per month,
Free basic service: Water connection
75%-100% base on income per H/H 5301H/H per month,
Free basic service: Sewer connection
75%-100% base on income per H/H 5093H/H per month,
Free basic service: Refuse removal 75%-100% base on income per H/H 6085 H/H per month,
Free basic service: Rate and taxes 75%-100% base on income per H/H 5584H/H per month,75%-100% base on income
2.8.3 WATER AND SANITATION
2.8.3.1 BLUE DROP STATUS 2014
The Municipality’s water is of a good quality and complies with National Standard SANS 242. The
Department of Water Affairs has implemented the Blue Drop Certification Programme to enable it to
assess the standard of water services provided by Municipalities. It entails the assessment of 5 key
performance areas namely risk management, process management and control, drinking water quality,
compliance management, accountability and local regulation and asset management. In order to qualify
for a Blue Drop Award a Municipality must achieve an average of 95% for all key performance areas.
Table: 71
PERFORMANCE AREA 2011 2012 2014
Blue drop Score 55,07% 71.90% 70.83%
PERFORMANCE AREA ALICEDALE GRAHAMSTOWN RIEBEECK EAST
Water Safety Planning (35%) 23.63 22.4 26.78
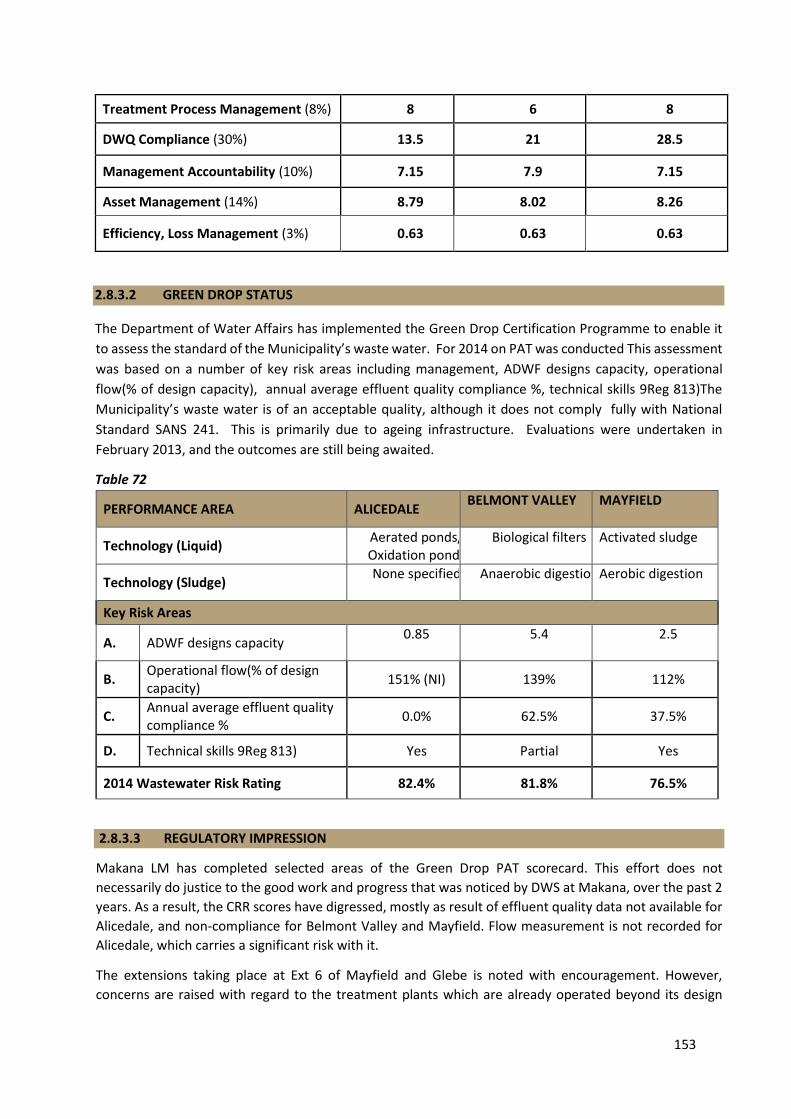
153
Treatment Process Management (8%) 8 6 8
DWQ Compliance (30%) 13.5 21 28.5
Management Accountability (10%) 7.15 7.9 7.15
Asset Management (14%) 8.79 8.02 8.26
Efficiency, Loss Management (3%) 0.63 0.63 0.63
2.8.3.2 GREEN DROP STATUS
The Department of Water Affairs has implemented the Green Drop Certification Programme to enable it
to assess the standard of the Municipality’s waste water. For 2014 on PAT was conducted This assessment
was based on a number of key risk areas including management, ADWF designs capacity, operational
flow(% of design capacity), annual average effluent quality compliance %, technical skills 9Reg 813)The
Municipality’s waste water is of an acceptable quality, although it does not comply fully with National
Standard SANS 241. This is primarily due to ageing infrastructure. Evaluations were undertaken in
February 2013, and the outcomes are still being awaited.
Table 72
PERFORMANCE AREA ALICEDALE BELMONT VALLEY
MAYFIELD
Technology (Liquid) Aerated ponds/ Oxidation ponds
Biological filters
Activated sludge
Technology (Sludge) None specified
Anaerobic digestion
Aerobic digestion
Key Risk Areas
A. ADWF designs capacity 0.85
5.4
2.5
B. Operational flow(% of design capacity)
151% (NI) 139% 112%
C. Annual average effluent quality compliance %
0.0% 62.5% 37.5%
D. Technical skills 9Reg 813) Yes Partial Yes
2014 Wastewater Risk Rating 82.4% 81.8% 76.5%
2.8.3.3 REGULATORY IMPRESSION
Makana LM has completed selected areas of the Green Drop PAT scorecard. This effort does not
necessarily do justice to the good work and progress that was noticed by DWS at Makana, over the past 2
years. As a result, the CRR scores have digressed, mostly as result of effluent quality data not available for
Alicedale, and non-compliance for Belmont Valley and Mayfield. Flow measurement is not recorded for
Alicedale, which carries a significant risk with it.
The extensions taking place at Ext 6 of Mayfield and Glebe is noted with encouragement. However,
concerns are raised with regard to the treatment plants which are already operated beyond its design

154
capacity and where the effluent quality is not meeting the legal specification. This additional flow will place
undue pressure on the plant to perform and comply with its legal specification. Makana LM is requested
to communicate with the DWS on this pertinent matter, as no indication was given as to the status of
upgrading the plants.
These aspects result in all three (3) treatment facilities residing in high risk positions during the current
assessment.
The completion of a well structure W2RAP is however noted and commended. The key 31 risks are being
identified, rated and addressed in this risk management plan. Regrettably, the need to upgrade the plant.
2.8.3.4 WATER AND SANITATION BULK INFRASTRUCTURE RESOURCES
2.8.3.4.1 Howisons Poort Dam
The Howiesons Poort Dam is located in the Palmiet River Catchment (upstream of the Kariega River now
part of the Thomas Baine Nature Reserve) and was constructed in 1031 with an estimated capacity of
883x10ᶾmᶾ and surface area of 16.3ha. The estimated 1:50 year yields including the Settlers Dam is
2450x10ᶾmᶾ of which 2200 x 10ᶾmᶾ is for domestic supply (the remainder for irrigation and other uses.)
According to the DWA, the registered permit volume p.a. is 500 x 10ᶾmᶾ. Raw water is pumped from the
Howisonspoort pump station situated slightly downstream and south west of the dam wall, directly to the
Waainek WTW.
2.8.3.4.2 Settlers Dam
The Settlers Dam is located in the Kariega River catchment further south which supplies the Albany Coastal
catchment area. The dam was constructed in 1962 with an estimated capacity of 4020 x 10ᶾmᶾ, making it
the biggest in the Makana region. The surface area of the dam is 82.2ha. The registered volume permit
from the DWA is 1000x10ᶾmᶾ p.a. to increase capacity the dam wall as raised by 2.3m in 1981.Raw water
in this dam is pumped directly into the Howiesonspoort Dam thus augmenting the Howiesonspoort in time
of low water availability.
2.8.3.4.3 Jameson Dam
The Jameson Dam I located in the Nuwejaarsspruit River on the farm Slaaikraal. It is also referred to
sometimes as the Slaaikraal Jameson dam for this reason. This dam was constructed in 1906 with an
estimated reservoir capacity of 575x10ᶾmᶾ. The surface area of the dam is 15.5ha.
The estimated total yield is 460x10ᶾmᶾ although no exact figures are available confirming what portion is
earmarked for irrigation or other uses. The registered volume permit from the DWA is 150x10ᶾmᶾ p.a. raw
water from this dam gravitates to the downstream Milner Dam from where it gravitates towards the ton
filter storage tank in Grahamstown via a 200mmᴓ main. From there it is pumped to the Waainek WTW via
a 150mmᴓ steel or F

155
2.8.3.4.4 Milner Dam
The Milner Dam is located downstream of the Jameson Dam in the Nuwejaars River, also on the farm
Slaaikraal. This dam was constructed in 1898 making it the oldest functional dam in the Makana region.
The estimated reservoir capacity of 255x10ᶾmᶾ with the surface are of 7.7ha. The estimated total yield is
190x10ᶾmᶾ. The registered volume permit from the DWA is 150 x 10ᶾmᶾ p.a. the same as Jameson Dam.
According to the Stewart Scott report, the dam’s full supply level is approximately 626.4 msl. Thus the
hydraulic grade difference between Milner Dam and Town Filter Storage is approximately 15.9m (Town
Filter Storage is at 610.5 m.s.l). Based on a gravity main length of 6380m (exact distance to be confirmed)
indicates a much lower figure of 15-20l/s. since the incoming flow is not measured, this cannot be
confirmed.
2.8.3.4.5 Service Reservoirs
One 2.5MLservice reservoir and an elevated storage tank is located on the precinct of the works. The
elevated water tank of approximately 8mᶾ and 10m height supplies the Waainek WTW and two houses
with potable water. This tank is manufactured form fabricated steel panels which is in a very poor condition
due to corrosion. The tank is leaking and the non-return valve is also not working and needs to be replaced.
The inside of the tank also needs to be repaired, the Makana Municipality is currently in the planning stages
to have the elevated storage tank repaired.
The 2.5ML high level reservoir acts as the main distribution reservoir for the industrial and higher lying
residential areas. This reservoir is still in good condition with no problems reported.
During failures or other interruptions, the potable water supply to the higher lying areas becomes
problematic as this reservoir tends to run dry since it feeds water to the downstream reservoir as well.
To ensure that sufficient potable water storage is available for the higher lying areas, it is proposed that
the existing 10ML raw water storage dam on the eastern side of the WTW be converted in a clear water
storage reservoir. This will be achieved by installing a floating HDPE roof cover to this reservoir.
2.8.4.5.6 WAAINEK WATER PURIFICATION WORKS(PLANT)
The WTW is located next to the N2 highway west of Grahamstown. Access to the treatment works is
directly from the N2. The current processes involved to treat the water includes flocculation,
sedimentation, filtration and disinfection.
Waainek Water Treatment Works is supplied with raw water from 4 sources, the Howison’s Poort and
Settlers dams in the Kariega River catchment, and the Jameson and Milner dams in the Slaaikraal
catchment
The existing Waainek Water Treatment Works has a capacity of 9 Ml/d and designed to operate over a 24 hour period. The works comprises a 16Ml raw water storage dam. There is an additional 6MI raw water storage constructed above the works from which raw water is gravitated to the inlet works. Total raw water storage represents 60 hours of the works capacity. The works is supplied either directly from the Howison's Poort pumping main or from the raw water storage reservoirs
2.8.4.5.7 Raw Water Inlet
Water from both the Howiesonspoort and Town Filter Storage Tanks are pumped to the WTW. The system
is designed so that raw water from Howiesonspoort PS directly enters the WTW with a bypass weir to

156
supply water to the lower lying raw water storage reservoir. The won filter supply pumps directly to the
lower raw water storage dam. A bypass system is in place to divert water directly to the inlet works.
2.8.4.5.8 Raw Water Storage Reservoirs
The WTW has two raw water storage reservoirs, one a 16ML on the west of the WTW and a newer storage
reservoir on the east of approximately 10ML. the 16ML lower lying reservoir has recently been relined and
is in a good condition. The exact construction date of the new upper reservoir is unknown although it can
be confirmed that the lining still appears to be in a relatively good condition. It has deteriorated to some
extent due on the edges due to little or no maintenance and on some sections of the liner it could be
noticed that vegetation has penetrated the liner (which needs to be repaired).
2.8.4.5.9 JAMES KLEYNHANS WATER TREATMENT WORKS
James is Kleiyhans water treatment works supply mostly Grahamstown east, Water Treatment Works
is supplied with raw water from the Glen Melville Dam, owned and operated by DWS. . Water from the
Orange River is released into the upper reaches of the Fish River as part of the Orange-Fish-Sundays
scheme. Water abstracted from the Fish River is stored in the off-channel Glen Melville dam. Water from
the dam gravitates to the James Kleynhans WTW.
Currently, Grahamstown’s allocation of water from the Glen Melville dam is 3000 Mℓ/annum (average daily abstraction of 8.22 Ml/d). The James Kleynhans Water Treatment Works has a capacity of 10 Ml/d and designed to operate over a 24 hour period. Elements within the works require upgrading, as the existing required capacity is 12.96 Ml/d (2.96 Ml/d shortfall)
2.8.4.5.10 MAKANA BULK SANITATION BULK PROVISION
Grahamstown Waste Water Treatment Works. The Grahamstown sewerage network is divided into two distinct drainage areas namely North and South which drains to the Mayfield Wastewater Treatment Works (WWTW) and the Belmont Valley WWTW respectively. Belmont Valley WWTW: The Belmont Valley Wastewater Treatment Works (WWTW) is a 5.4Ml biological filter plant currently being operated at an average inflow of between 7 and 8Ml/d. The plant is servicing the entire CBD and Western side and 60% of the Eastern side.
Mayfield WWTW:
The Mayfield WWTW has a stated existing hydraulic capacity of 2.5 Ml/day and currently treats flows from the areas known as Mayfield, Makanaskop, Kingsflats, Transit Camp and Extensions 6 and 7. Alicedale WWTW:

157
Alicedale WWTW has a design capacity of 0.85Ml/d but operating at a capacity of 0.1Ml/d. The plant is servicing the areas of Nomzamo, Mandela and Transrivier.The town is currently not connected but using the septic tanks. The project to connect the town to the plant is under procurement phases and will be implemented during 2017/2018 and 2018/2019 Financial l year through MIG funding.
2.8.6. ELECTRICITY
Makana is currently the service provider for the distribution of electricity only in the old Grahamstown
(CPA) municipal area, while the newer urban settlements, Grahamstown East, Riebeeck East, rural farm
areas are serviced by Eskom except Alicedale is supplied by both Municipality and Eskom
Access to minimum electricity standards is defined as an electricity connection at the dwelling. National
policy also requires that poor households should receive 50kWh of free basic electricity per month.
The Maintenance Plan is in place but not fully adhered to, due to staff shortages. Budgetary constraints
hinder the effective operation and maintenance as the infrastructure is aging and needs upgrading.
The 5 wards with the most households with no access to electricity are
Ward 13
Ward 3
Ward 11
Ward 14
Ward 10
All indigent households and households who are prepared to install a 20 AMP Circuit Breaker get their first
50 KwH free.
The Municipality has no informal townships and all erven have access to electricity. There are therefore
no backlogs in respect of service provision to existing erven within the Municipality’s area of supply. There
is also street lighting in all towns.
There is a direct correlation between electricity backlogs and housing backlogs and planning for the new
proposed areas are in place. The IDP Public Participation process revealed that there are areas within the
Municipal and ESKOM supply area where existing services need to be upgraded. There is also a need for
enhanced maintenance of street lighting. This coupled with the need for development within the
Municipal area necessitates upgrading of the electrical service infrastructure.
2.8.6 SOLID WASTE MANAGEMENT
Makana municipality is responsible for waste management which includes the street sweeping, collection, transportation and disposal of solid waste. The municipality has approved Integrated Waste Management Plan in accordance with section 11 of the NEMA approved by Council 2013 and a Local Waste Management Plan which was endorse by the DEDEAT and by- Law to address issues like illegal dumping.
158
2.8.6.1 REFUSE REMOVAL AND WASTE MANAGEMENT
Basic level services for refuse removal are defined as free weekly refuse removal. All households in urban
areas including Grahamstown East and West have access to weekly refuse removal services that also
include business and other waste is removed by order. Refuse in is taken and disposed in three refuse land
fill sites Grahamstown, Alicedale and Riebeeck East. Dumping rate is higher in Grahamstown and the cost
of transporting the waste has also increasing significantly due to illegal dumping littering.
2.8.6.2 LANDFILL SITE
The Makana Municipality has three landfill sites namely the Grahamstown, Alicedale and Riebeeck East
landfill; all the sites are managed by the Municipality. The landfills are located on municipal property. The
landfill site in Grahamstown was permitted by the Department of Water Affairs and Forestry on 10
September 1996 as a Class G:M:B+ waste disposal site in terms of Section 20 of the Environment
Conservation Act (Act 73 of 1989).
Grahamstown: The site is located 2km from town at co-ordinates: S 330 17’ 28’’ and E 260 29’ 32’’. The
expected lifetime of the site is approximately 20 years. The municipality uses a cell method to dispose of
the waste in an old quarry.
Waste is properly and regularly covered with excavated material from the quarry and building rubble. A
bulldozer is used on the site for compaction and covering purposes. No burning of waste takes place. The
Municipality is experiencing problems with the disposal of chillies and abattoir waste.
These waste streams need to be disposed of in a dedicated deeply dug trench and be covered immediately
after disposal. It could be necessary depending on the quantities of abattoir waste (dead animals) to treat
the waste with lime once disposed of. Illegal scavenging is only taking place on the landfill at night. The
site is properly fenced with an access gate at the entrance. Record-keeping of incoming waste should be
improved and properly recorded. The site continues to be operated in accordance with the permit
conditions for the site and the Minimum Requirements for Waste Disposal by Landfill document as
published by DWAF in 1998.
Position of site: Located approximately 2km from town at
co-ordinates: S 330 17’ 28’’ and E 260 29’ 32’’.
Permit: Yes
Year issued: 10 September 1996
Classification of site: GMB+
Type of Operation (end – tip, trench, cell): Cell method, filling of quarry.
Estimated size of site: Approximately 10 ha.
Estimated remaining life of site: 20 years
Separation of fresh and contaminated water: Yes.
Groundwater monitoring: 6 monthly monitoring of downstream borehole
located at neighbouring ground, water pollution
encountered
Volumes per day, week or month: It is estimated that the site receives
approximately 125 tons per day.
Is cover material available? Yes, from quarry and building rubble
Is the drainage sufficient? Yes

159
Is there access control? Yes, but record keeping of incoming waste should
be improved
Is the site fenced? Yes
Does the site have a sufficient buffer zone? Yes (2 km)
Type of equipment utilised on site: Kamatsu Bulldozer
Operating hours: The site is open 24 hours.
Saving plan for closure: No estimate regarding
closure exists. The Municipality must budget
for the closure and rehabilitation timeously.
Alicedale: this site was authorised in May 2005 through Directions in terms of Section 20(5) (b) of the
Environment Conservation Act, Act 73 of 1989, by the Department of Water Affairs and Forestry. The site
is located approximately 500m from town (Co-ordinates: S 330 19’ 04’’ and E 260 04’ 35’’). The landfill site
is operated by filling an old sandstone quarry. The site is approximately 0.9 Ha in size. The expected lifetime
of the site is approximately 20 years.
Waste is covered once a year by hiring a bulldozer for this purpose. Waste is being burned on a regular
basis although it is prohibited in the authorisation for the site. There is scavenging taking place at the
landfill. The site is not fenced and should be equipped with a gate at the entrance to prevent unauthorised
persons from entering, access is not controlled. It is recommended that the burning of waste be phased
out as an operational method and that waste be covered on a weekly basis as required in the authorisation
for the site, that the site be fenced and proper access control be executed (including proper record-keeping
of incoming waste streams) and that the salvagers be formalised or disallowed on the site. The
management of the site in general should be improved in accordance with the Minimum Requirements
for Waste Disposal by Landfill document published by DWAF in 1998 and in accordance with the
authorisation issued for the site.
Position of site: The site is located 500m from town (Co-ordinates: S 330
19’ 04’’ and E 260 04’ 35’’)
Permit: Yes, controlled through Directions
Year issued: 2005
Classification of site: GCB –Type of Operation (end – tip, trench, cell): Filling of
sandstone quarry, waste burning
Estimated size of site: Approximately 0.9 ha.
Estimated remaining life of site: 20 years
Separation of fresh and contaminated water: None in place.
Groundwater monitoring: Not required. Volumes per day, week or month: It is
estimated that the site receives approximately 1.56 tons
per day.
Is cover material available? Yes, from quarry
Is the drainage sufficient? No
Is there access control? No
Is the site fenced? No
Does the site have a sufficient buffer zone? Yes (500m)
Type of equipment utilised on site: No permanent equipment, a Bulldozer is hired once a
year for covering purposes
Operating hours: There are no official operating hours for the site.

160
Saving plan for closure: No estimate regarding closure exists. The Municipality
must budget for the closure and rehabilitation in the
near future.
Riebeeck East authorised in May 2005 through Directions in terms of Section 20(5) (b) of the Environment
Conservation Act, Act 73 of 1989, by the Department of Water Affairs and Forestry. The site is located
approximately 2 kilometers from town (Co-ordinates: S 330 12’ 35’’ and E 260 10’ 56’’). The site is
approximately 0.5 Ha in size.
The expected lifetime of the current disposal area is approximately 10-15 years. Waste is covered once a
year by hiring a bulldozer for this purpose. Waste is being burned on a regular basis although it is prohibited
in the authorisation for the site.
The site is fenced (but need maintenance) with an access gate to prevent unauthorised persons from
entering. Access to the site is however not properly controlled.
It is recommended that the burning of waste be phased out as an operational method and that waste be
covered on a weekly basis as required in the authorisation for the site.
Access to the site should be controlled and proper record keeping of incoming waste should be done. The
management of the site in general should be improved in accordance with the Minimum Requirements
for Waste Disposal by Landfill document published by DWAF in 1998 and in accordance with the
authorisation issued for the site.
Position of site: The site is located approximately 2 kilometers
from town (Co-ordinates: S 330 12’ 35’’ and E
260 10’ 56’’)
Permit: Yes, controlled through Directions
Year issued: 2005
Classification of site: GCB –
Type of Operation (end – tip, trench, and cell): No proper operational method followed, waste
is burned
Estimated size of site: Approximately 0.5 ha.
Estimated remaining life of site: 10 -15 years
Separation of fresh and contaminated water: None in place.
Groundwater monitoring: No, not required
Volumes per day, week or month: It is estimated that the site receives
approximately 0.56 tons per day.
Is cover material available? Yes
Is the drainage sufficient? No
Is there access control? No
Is the site fenced? Yes, but need maintenance
Does the site have a sufficient buffer zone? Yes, 2 km from nearest house
Type of equipment utilised on site: No permanent equipment, a bulldozer is hired
once a year for covering purposes
Operating hours: There are no official operating hours for the site.
Saving plan for closure: No estimate regarding closure exists. The
Municipality must budget for the closure and
rehabilitation in the near future.

161
2.8.6.3 RECYCLING
Municipality has recycling program in Grahamstown landfill which called Masihlule and has a Public
Private Partnership with Social Development and a private company.
2.8.6.4 AIR QUALITY
There is an opinion that the Air Quality Act requires local municipalities to monitor ambient air quality
within its area of jurisdiction. From an environmental perspective the importance of appointing a
permanent air quality officer to regularly monitor air pollution in highly developed areas with heavy
industrial emissions is acknowledged. This situation does not warrant the appointment of a permanent
air quality officer thus the municipality is looking at a more sustainable solution like partnering with the
Sarah Baartman District Municipality and DEA to monitor the air quality in Makana.
2.8.6.5 TRANSPORT, ROADS AND STORM WATER
The provision and maintenance of roads covers the functional areas of the Department of Roads and Public Works and the Local Municipality. The Municipality have developed Road and Storm water Master Plan and next is to developing a Pavement Management System to carry infrastructure and maintenance.
2.8.6.6 ROAD INFRASTRUCTURE AND TRANSPORT MODES
Table: 73
BASIC SERVICE / INFRASTRUCTURE Municipal Roads
Total length of Roads 757.4Km
Gravel 588Km
Tarred 169km
Man-made house access N/A
Transport Modes Stats’ 2001 74 539
On foot 25 674
By bicycle 435
By motorcycle 173
By car as a driver 2 957
By car as a passenger 3 324
By minibus/taxi 4 386
By bus 573
By train 88
Donkeys
Other 220
Not applicable 36 709
Makana SDF 2013 A large contingent of the population in 2001 was travelling by foot. Unfortunately the 2011/16 Stats’ does not give a comparison. Grahamstown is situated on the N2, which links it to East London/ Bisho and Port Elizabeth

162
• The R400 links Grahamstown to Riebeeck East and the N10. • The MR476 links Grahamstown and Alicedale. • The R343 links Grahamstown and Salem to Kenton-on-Sea and Alexandria. • The R350 links Grahamstown to Bedford. • The R344 links Grahamstown to Adelaide. • The R67 links Grahamstown to Port Alfred in the South and Fort Beaufort to the North. 2.8.6.7 RAIL No functional rail service. The intention is to look at the feasibility of changing the train station to a bus station /depot. 2.8.6.8 Airstrips There is a municipal airstrip just outside of Grahamstown, adjacent to the Army Base.
2.8.6.9 HOUSING
Housing is a concurrent National and Provincial competency in terms of Part A of Schedule 4, of the
Constitution. Section 10 of the Housing Act, 1997 (Act 107 of 1997), sets out the responsibilities of
municipalities in relation to the provision of housing. Housing is included in this section as a basic service
because there is a direct correlation between the provision of basic services and housing, which makes it
a complex function that relies on high levels of cooperation between the Municipality and the Provincial
and National Departments responsible for Housing. The table below provides an overview of these roles
and responsibilities.
2.8.7.1 ROLES AND RESPONSIBILITIES IN RELATION TO HOUSING PROVISION
2.9.1
TABLE: 74
ROLE PLAYER RESPONSIBILITIES
Municipality o Ensure that the IDP addresses the right to adequate housing on a progressive basis;
o Set housing delivery goals in respect of the Municipal Area;
o Plan, co-ordinate, facilitate. promote and facilitate housing development in the
Municipal Area;
ROLE PLAYER RESPONSIBILITIES
o Identify and designate land for housing development;
o Plan and manage land use and development (township establishment, subdivision, consolidation, rezoning etc);
o Provision of bulk engineering services;
o Provision of services in respect of water, sanitation, electricity. roads, storm water drainage etc.;
o Maintenance of a housing data base.
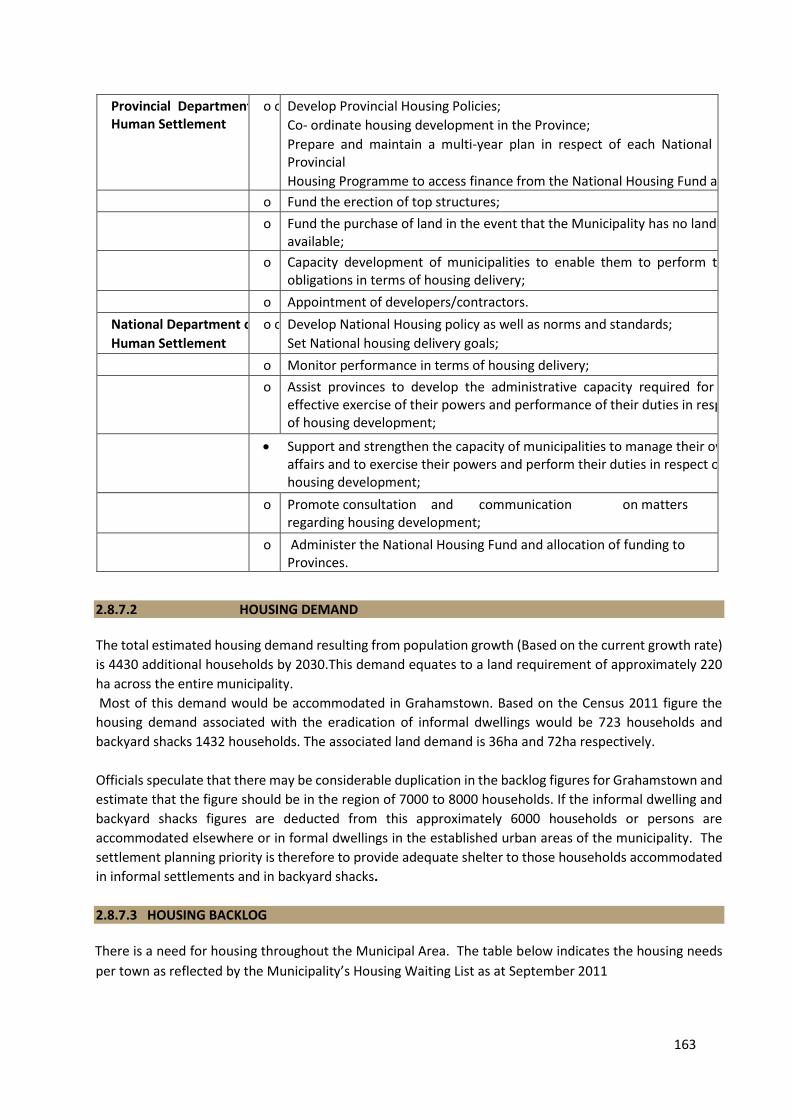
163
Provincial Department of Human Settlement
o o o Develop Provincial Housing Policies;
Co- ordinate housing development in the Province;
Prepare and maintain a multi-year plan in respect of each National and Provincial
Housing Programme to access finance from the National Housing Fund and;
o Fund the erection of top structures;
o Fund the purchase of land in the event that the Municipality has no land available;
o Capacity development of municipalities to enable them to perform their obligations in terms of housing delivery;
o Appointment of developers/contractors.
National Department of
Human Settlement
o o Develop National Housing policy as well as norms and standards;
Set National housing delivery goals;
o Monitor performance in terms of housing delivery;
o Assist provinces to develop the administrative capacity required for the effective exercise of their powers and performance of their duties in respect of housing development;
Support and strengthen the capacity of municipalities to manage their own affairs and to exercise their powers and perform their duties in respect of housing development;
o Promote consultation and communication on matters regarding housing development;
o Administer the National Housing Fund and allocation of funding to Provinces.
2.8.7.2 HOUSING DEMAND The total estimated housing demand resulting from population growth (Based on the current growth rate)
is 4430 additional households by 2030.This demand equates to a land requirement of approximately 220
ha across the entire municipality.
Most of this demand would be accommodated in Grahamstown. Based on the Census 2011 figure the
housing demand associated with the eradication of informal dwellings would be 723 households and
backyard shacks 1432 households. The associated land demand is 36ha and 72ha respectively.
Officials speculate that there may be considerable duplication in the backlog figures for Grahamstown and
estimate that the figure should be in the region of 7000 to 8000 households. If the informal dwelling and
backyard shacks figures are deducted from this approximately 6000 households or persons are
accommodated elsewhere or in formal dwellings in the established urban areas of the municipality. The
settlement planning priority is therefore to provide adequate shelter to those households accommodated
in informal settlements and in backyard shacks.
2.8.7.3 HOUSING BACKLOG There is a need for housing throughout the Municipal Area. The table below indicates the housing needs
per town as reflected by the Municipality’s Housing Waiting List as at September 2011
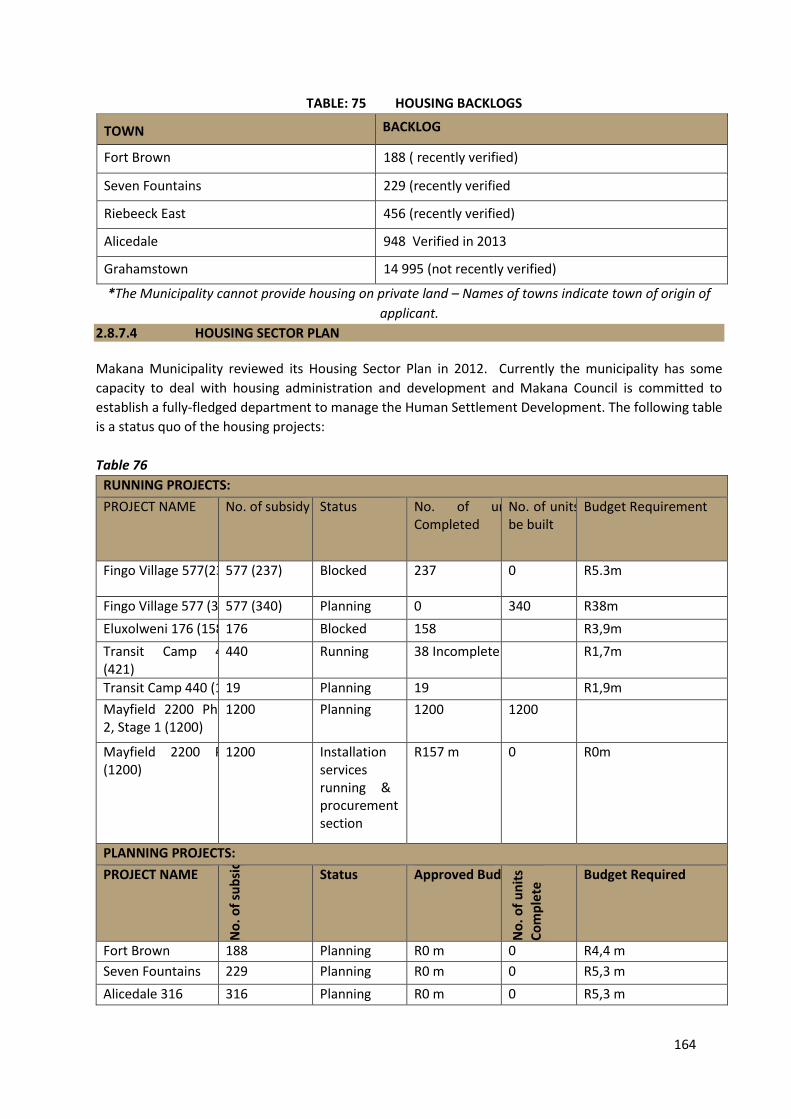
164
TABLE: 75 HOUSING BACKLOGS
TOWN BACKLOG
Fort Brown 188 ( recently verified)
Seven Fountains 229 (recently verified
Riebeeck East 456 (recently verified)
Alicedale 948 Verified in 2013
Grahamstown 14 995 (not recently verified)
*The Municipality cannot provide housing on private land – Names of towns indicate town of origin of
applicant.
2.8.7.4 HOUSING SECTOR PLAN Makana Municipality reviewed its Housing Sector Plan in 2012. Currently the municipality has some
capacity to deal with housing administration and development and Makana Council is committed to
establish a fully-fledged department to manage the Human Settlement Development. The following table
is a status quo of the housing projects:
Table 76
RUNNING PROJECTS:
PROJECT NAME No. of subsidy Status No. of units Completed
No. of units to be built
Budget Requirement
Fingo Village 577(237) 577 (237) Blocked 237 0 R5.3m
Fingo Village 577 (340) 577 (340) Planning 0 340 R38m
Eluxolweni 176 (158) 176 Blocked 158 R3,9m
Transit Camp 440 (421)
440 Running 38 Incomplete R1,7m
Transit Camp 440 (19) 19 Planning 19 R1,9m
Mayfield 2200 Phase 2, Stage 1 (1200)
1200 Planning 1200 1200
Mayfield 2200 Ph2 (1200)
1200 Installation of services is running & top procurement section
R157 m 0 R0m
PLANNING PROJECTS:
PROJECT NAME
No
. of
sub
sid
ies
Status Approved Budget
No
. of
un
its
Co
mp
lete
Budget Required
Fort Brown 188 Planning R0 m 0 R4,4 m
Seven Fountains 229 Planning R0 m 0 R5,3 m
Alicedale 316 316 Planning R0 m 0 R5,3 m

165
Ethembeni 2000 (330) 330 Planning
Alicedale16 27 Construction R0 m 0 R5,3 m
Upper Mnandi 14 Planning R0 m 0 R0,976 m
Lower Mnandi 40 Planning R0 m 0 R2,7 m
Xolani 34 Planning R0 m 0 R2,3 m
Zolani 167 Planning R0 m 0 R11,6 m
N Street 27 Planning R0 m 0 R1,8 m
J Street 31 Planning R0 m 0 R2,1 m
K Street 31 Planning R0 m 0 R2,1 m
PLANNING PROJECTS (SERVICED SITES)
PROJECT NAME
No
. of
sub
sid
ies
Status Approved Budget
No
. of
un
its
Co
mp
lete
Budget Required
25 Sites 25 Construction R0 m 0
Newtown/ Kwa Ndancama
33 Planning R0 m 0
Phumlani 250 250 Planning R0 m 0 R2,1 m
Glebe Mission 28 28 Planning R0 m 0 R2,1 m
Erf 4103 28 Planning R0 m 0 R2,1 m
RECTIFICATION PROJECTS
INFORMAL PROJECT AREAS
PROJECT NAME
NO
. OF
SUB
SID
IES
Project Name No. of subsidies Status Approved Budget
No. of units Completed
Alicedale 221 221 Phaphamani
Information not available
Scott’s farm 90 Polar Park
Ghost town 189 Upper Zolani
Vukani location J,N, Xolani, Upper and lower Mnandi
Extension 9 and Famer Field
DISASTER 2008 PROJECTS:
PROJECT NAME No. of subsidies Status Approved Budget
No. of units Completed
Makana Disaster 2008 161 Not started R20 m Information not available
2.8.7.5 HOUSING AND SETTLEMENT ANALYSIS
2.8.7.5.1 Heritage:

166
The heritage resource of the municipality is significant and contributes to the economy of the municipality and needs to be conserved in terms of the provisions of the National Heritage Resources Act (Act 25 of 1999 - NHRA).The Act introduced an integrated system for the identification, protection and management of heritage resources nationally, provincially and at municipal level. The Act prescribes land use planning and management to give attention to, and respond to, heritage considerations both at site and landscape levels. Of particular significance is the obligation placed on the municipality to undertake the preparation of a comprehensive heritage inventory in terms of Section 30(5) of the National Heritage Resources Act, 1999 (Act 25 of 1999), Makana Municipality has not prepared such an inventory. It is also important to note that the heritage resource of the municipality does not only comprise of conservation worthy buildings and urban precincts, but also includes physical and cultural landscapes. 2.8.7.5.2 URBAN AND RURAL SETTLEMENT AREAS: The existing Settlements are: • Grahamstown
• Riebeeck East
• Alicedale
• Seven Fountains
• Fort Brown
• Salem (Surrounding land is the subject of a substantial land claim, which may result in the need to
expand the settlement)
• Sidbury (Entirely surrounded it has become the administrative centre for game farming and no
longer performs a true human settlement function.)
The Approximate Population Distribution is: Table 77
SETTLEMENT PERCENTAGE
Grahamstown 80%
Alicedale 10%
Riebeeck East 5%
Rural Areas 4%
Map 6: below depicts Human Settlement in Makana Municipality.
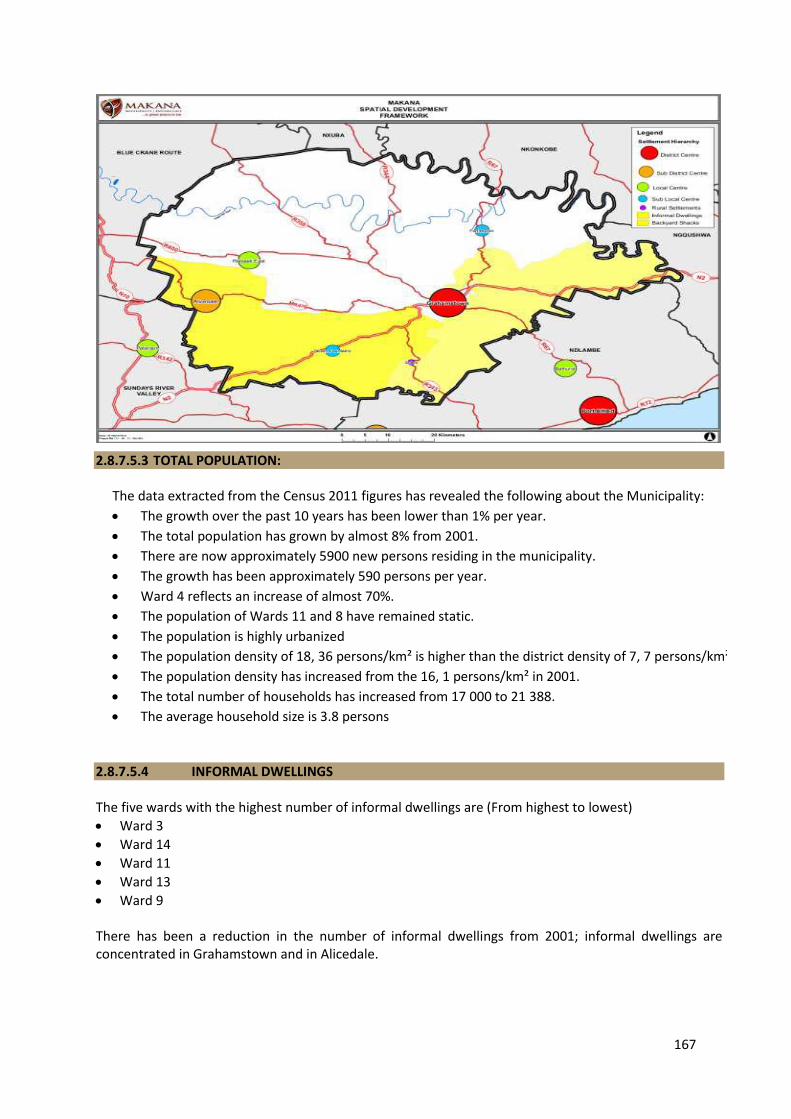
167
2.8.7.5.3 TOTAL POPULATION:
2.8.7.5.4 INFORMAL DWELLINGS The five wards with the highest number of informal dwellings are (From highest to lowest)
Ward 3
Ward 14
Ward 11
Ward 13
Ward 9 There has been a reduction in the number of informal dwellings from 2001; informal dwellings are concentrated in Grahamstown and in Alicedale.
The data extracted from the Census 2011 figures has revealed the following about the Municipality:
The growth over the past 10 years has been lower than 1% per year.
The total population has grown by almost 8% from 2001.
There are now approximately 5900 new persons residing in the municipality.
The growth has been approximately 590 persons per year.
Ward 4 reflects an increase of almost 70%.
The population of Wards 11 and 8 have remained static.
The population is highly urbanized
The population density of 18, 36 persons/km² is higher than the district density of 7, 7 persons/km².
The population density has increased from the 16, 1 persons/km² in 2001.
The total number of households has increased from 17 000 to 21 388.
The average household size is 3.8 persons

168
Table 78
Informal Dwelling Not (Backyard Shacks)
No. of persons (2001) No. of persons (2011) Change
Wards / Areas Numeric % of the total Numeric % of the total Numeric % change
Ward 1 46 2.93 28 1.96 -18 -39.13
Ward 2 76 4.85 4 0.28 -72 -94.74
Ward 3 27 1.72 396 27.65 369 1366.67
Ward 4 664 42.35 16 1.12 -648 -97.59
Ward 5 57 3.64 11 0.77 -46 -80.70
Ward 6 209 13.33 6 0.42 -203 -97.13
Ward 7 3 0.19 63 4.40 60 2000.00
Ward 8 12 0.77 15 1.05 3 25.00
Ward 9 - 29.27 127 8.87 -
Ward 10 459 0.57 103 7.19 -356 -77.56
Ward 11 9 0.38 220 15.36 211 2344.44
Ward 12 6 - 1 0.07 5 -83.33
Ward 13 - - 189 13.20 - -
Ward 14 - 253 17.67 - -
Makana – EC104 1568 100 1432 1000 -136 -8.67
Source: Statssa 2011
2.8.7.5.5 BACKYARD SHACKS The five wards with the highest number of persons living in backyard shacks are (From highest to lowest)
Ward 10
Ward 5
Ward 3
Ward 7
Ward 14
There has been a reduction in the number of persons residing in backyard shacks from 2001. 2.8.7.5.6 BACKYARD SHACKS FROM 2001 Table 79
Informal Dwelling (Backyard Shacks)
No of person (2001) No of persons (2011)
Numeric % of the total Numeric % of the total
21004001: Ward 1 30 3.88 37 5.12
21004002: Ward 2 21 2.72 21 2.90
21004003: Ward 3 15 1.94 99 13.69
21004004: Ward 4 155 20.05 23 3.18
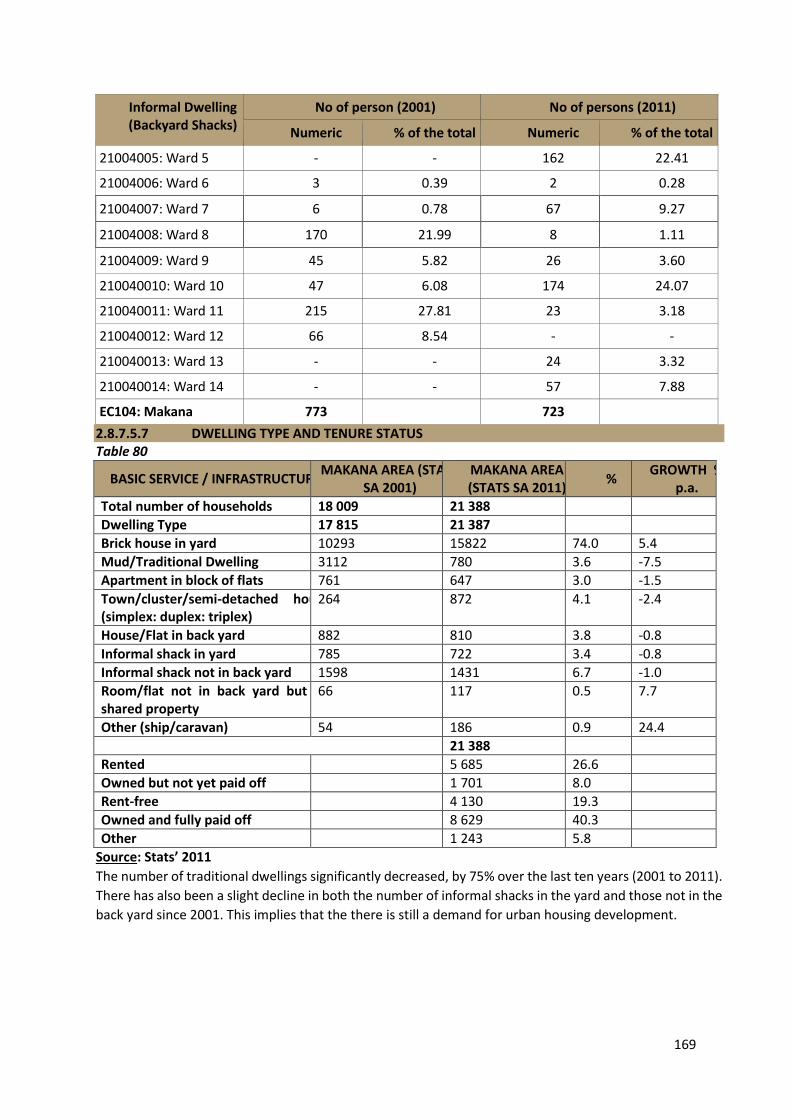
169
Informal Dwelling (Backyard Shacks)
No of person (2001) No of persons (2011)
Numeric % of the total Numeric % of the total
21004005: Ward 5 - - 162 22.41
21004006: Ward 6 3 0.39 2 0.28
21004007: Ward 7 6 0.78 67 9.27
21004008: Ward 8 170 21.99 8 1.11
21004009: Ward 9 45 5.82 26 3.60
210040010: Ward 10 47 6.08 174 24.07
210040011: Ward 11 215 27.81 23 3.18
210040012: Ward 12 66 8.54 - -
210040013: Ward 13 - - 24 3.32
210040014: Ward 14 - - 57 7.88
EC104: Makana 773 723
2.8.7.5.7 DWELLING TYPE AND TENURE STATUS Table 80
BASIC SERVICE / INFRASTRUCTURE MAKANA AREA (STATS
SA 2001) MAKANA AREA (STATS SA 2011)
% GROWTH %
p.a.
Total number of households 18 009 21 388
Dwelling Type 17 815 21 387
Brick house in yard 10293 15822 74.0 5.4
Mud/Traditional Dwelling 3112 780 3.6 -7.5
Apartment in block of flats 761 647 3.0 -1.5
Town/cluster/semi-detached house (simplex: duplex: triplex)
264 872 4.1 -2.4
House/Flat in back yard 882 810 3.8 -0.8
Informal shack in yard 785 722 3.4 -0.8
Informal shack not in back yard 1598 1431 6.7 -1.0
Room/flat not in back yard but on shared property
66 117 0.5 7.7
Other (ship/caravan) 54 186 0.9 24.4
21 388
Rented 5 685 26.6
Owned but not yet paid off 1 701 8.0
Rent-free 4 130 19.3
Owned and fully paid off 8 629 40.3
Other 1 243 5.8
Source: Stats’ 2011
The number of traditional dwellings significantly decreased, by 75% over the last ten years (2001 to 2011).
There has also been a slight decline in both the number of informal shacks in the yard and those not in the
back yard since 2001. This implies that the there is still a demand for urban housing development.

170
2.8.7.5.8 RHODES UNIVERSITY CAMPUS The Rhodes University Campus is the largest single ownership footprint within the Grahamstown urban
footprint. Rhodes University is currently undertaking a review of their long term spatial planning and were
not able to provide any details thereof during the preparation of this document.
For the purpose of this review information was sourced from older Rhodes University Spatial Planning.
Extracts thereof are set out below.
Table 81
PROJECTED GROWTH OF STUDENT NUMBERS
Current Number
6954
2009 2010 2014 2019 2023
2% 7093 7678 8477 9176
4% 7232 8461 10294 12042
8% 6510 10218 15013 20425
PROJECTED GROWTH OF RESIDENCES
Current Number
6954
2009 2010 2014 2019 2023
2% 2 8 18 26
4% 3 18 39 60
8% 7 38 95 158
2.9 BASIC SERVIVE GENERAL INFRASTRUCTURE RESOURCES HIGH LEVEL CHALLENGES
2.9.1 WATER AND SANITATION
Critical high level challenges as regards to water and sanitation services are as follows:
Ageing infrastructure, poor maintenance and poor contract management;
Material water supply shortages leading to service delivery protests;
Inadequate catchment area to Grahamstown West, which could result in possible water
shortages to the community in the future;
Inadequate supply versus demand at the James Kleynhans Water Treatment Works;
Inadequate electricity supply on the western side of Grahamstown, which results in the inability
to supply raw water for purification;
Inadequate storage retention rate (the Department of Water Affairs requirement is 48 hours but
Makana has an average of 12 hours);
Inadequate capacity at waste water treatment works. The plant is operating above design
capacity by 78% and the municipality has received pre-directives on non-compliance by
Department of Water Affairs, which could result in legal action against the accounting officer. In
addition health hazards to the people and pollution to the environment;
Inadequate capacity of the collector mains (rising main and outfalls) resulting in sewer spillages;
Inadequate capacity of pump stations resulting in sewer spillages;

171
Inadequate capacity reticulation network sewers resulting in spillages. Health hazard to the
people and pollution to the environment;
Storm water ingresses to sewer network system increases the inflow to the waste water
treatment works;
Inadequate resources (equipment and human resources) resulting in the inability to attend to
complaints and dealing with the problems; and
Continuous vandalism of critical infrastructure including the exposure of manholes, which could
lead to injury and damage to property resulting in possible litigation.
2.9.1.1 Water source Challenges
- Quality of the raw water from the Glenn Melville Dam – High turbidity
- Unstable pumping system & rising main capacity
- Unreliable electricity supply to pump raw water from H’Poort
-
2.9.1.2 Water treatment works Challenges;
- Mechanical & Electrical poorly maintained
- Civil Works not operating as designed
2.9.1.3 Bulk water distribution Challenges;
- Storage Retention Rate (DWS requires 48hrs but Makana’s 12hrs or less)
- Network Water Leaks (Through broken/old valves, pipes & meters)
- Absence of Bulk Metering (Raw water, treated water & stored water).
2.9.1.4 Service reticulation Challenges:
- High Water Leaks (Resulting to water loss)
- Absence of meters (Impact to Billing mechanism)
- Lack Pressure Control (Continuous water outages to the High Lying areas due to having
water at the bottom part of the settlement)
2.9.2 ROADS AND STORM WATER
The provision and maintenance of roads covers the functional areas of the Department of Roads, the
Department of Public Works and the Makana Municipality.
Makana does not have a storm water master plan/ pavement management system and has insufficient
roads infrastructure with maintenance carried out as and when required, which is also evident during
community based planning, where concerns are always raised about potholes and corrugated gravel roads.
The high level challenges in the main are as follows:
roads and storm water (deteriorating state, unfinished projects, poor workmanship);

172
Makana has Provincial acclaimed roads within its boundary especially in the Grahamstown CBD,
suburbs and rural areas. These roads, including municipal roads, where the condition has
deteriorated substantially have become unaffordable for the municipality to maintain; and
Municipal funds are unable to finance the maintenance of the roads and storm water
infrastructure which is urgently required; and
Makana’s rural areas are fast becoming a safety hazard and are becoming inaccessible due to a
lack of maintenance and upgrading due to a lack of funds, equipment and human resources.
Makana Municipality’s transportation system is categorised as follows, with the varying ownership and
responsibilities of these making the management of this function difficult for Makana:
municipal roads;
provincial roads (Department of Roads and Public Works)
undefined access roads;
rural surfaced and gravel roads; and
national roads (SANRAL)
The roads and storm water operating challenges are as follows:
Budgetary constraints resulting in poor or no maintenance;
Unavailability of resources e.g. machinery and human resources resulting in incomplete work;
Deteriorating condition of the roads causing damage to public vehicles and litigation claims;
storm water flooding which could cause death, damage to peoples’ properties and possible
claims; and
Deteriorating municipal buildings making them inhabitable with the possibility of causing staff
to be sick resulting in possible litigation or charges being laid by the Department of Labour.
The roads and storm water solutions, identified during the assessment, to meet the challenges are as
follows:
Provincial/ district roads maintenance plan have a signed Service Level Agreement with province/
district on the maintenance plan;
Introduce a Pavement Management System (PMS)
Acquisition of machinery for maintenance of roads and storm water infrastructure;
Training of artisans and improving the skills and knowledge of the staff.
2.9.3 FIRE SERVICES AND DISASTER MANAGEMENT
Makana Municipality has 24 hour fulltime fire service with Chief fire officer appointed as manager fire
services. Municipality has signed a corporate agreement with Sarah Baartman District Municipality to
perform the function on agency based. Also the Municipality has co-operative agreement with all other six
(6) Sarah Baartman District Municipalities

173
The aim of the Disaster Management Act, No. 57 of 2002, and the Disaster Management Framework, is to
minimise the effects of hazards on local communities by ensuring coordinated efforts to manage risks.
This plan has been designed around the identified risks, highlighted during the Risk Assessment process.
A Disaster Management Plan outlines the key institutions and programming components relative to deal
effectively with disaster management and emergency responses. Partnerships have been established with
Provincial Government, District and Non-governmental organisations with a responsibility or capacity to
render disaster management services. In terms of Makana Disaster Management Plan the following are
the result of risk assessment conducted that the municipality is prone to:
Tornado
Floods
Fires(Veld and Forest Fires )
Epidemics
Accidents
Furthermore the plan contains contingency plans for every risk identified. The most common disaster
that occurs in the area is floods and protracted drought. Tornado’s is fairly common and has caused
extensive damage to homes in Alicedale and the Grahamstown area.
Disaster Incidents:
Makana Municipality was affected by a disaster on the 8th October 2008 where 161 houses were severely
damaged in Grahamstown and 22 houses in Alicedale. An amount of R101 000.00 was approved by
Provincial Government and the project was to be coordinated by them. The project has been delayed to
date. Makana was again in October 2012 affected by floods where most of its roads infrastructure was
damaged. In October 2012, The Premier of the Province of the Eastern Cape had, in consultation with other
MEC’s declared a provincial state of disaster in terms Section 41 of Disaster Management Act (Act 57 of
2002)
After the occurrence of the October 2012 disaster incident, the Provincial Disaster Management Centre
had, in terms of section 35 of the Disaster Management Act 57 of 2002, initiated efforts to assess the
magnitude and severity of the disaster and informed the National Disaster Management Centre of the cost
of the damages for provision of emergency relief.
The National Treasury had through the National Disaster Management allocated an amount R43.5m for
emergency projects which was divided among the Nelson Mandela Bay Municipality and five other
municipalities in the Sarah Baartman District Municipality. The Makana Municipality was allocated R
2 400 567 for the following projects
1. Repairs to electrical infrastructure at Old town filters, Evans Poort and Market feeders –
R2 400 567 and
2. Repair pump station (replace sewer pump) at Lingelihle – R387 236,
The above mentioned projects were completed between January 2013 and May 2013. There were about
128 informal houses that were damaged by floods. Makana Municipality made an urgent application for
temporary housing structures to the Department of Human Settlement.
On the 23rd of November 2012 the Department of Human settlement together with the municipality made
an assessment of the damage caused by the floods and 39 temporal housing structure where approved.
Subsequent to that Makana Municipality allocated an amount R8 7224 000 for reconstruction and
rehabilitation. The above mentioned amount was intended to re-gravel, reconstruction of municipal roads,
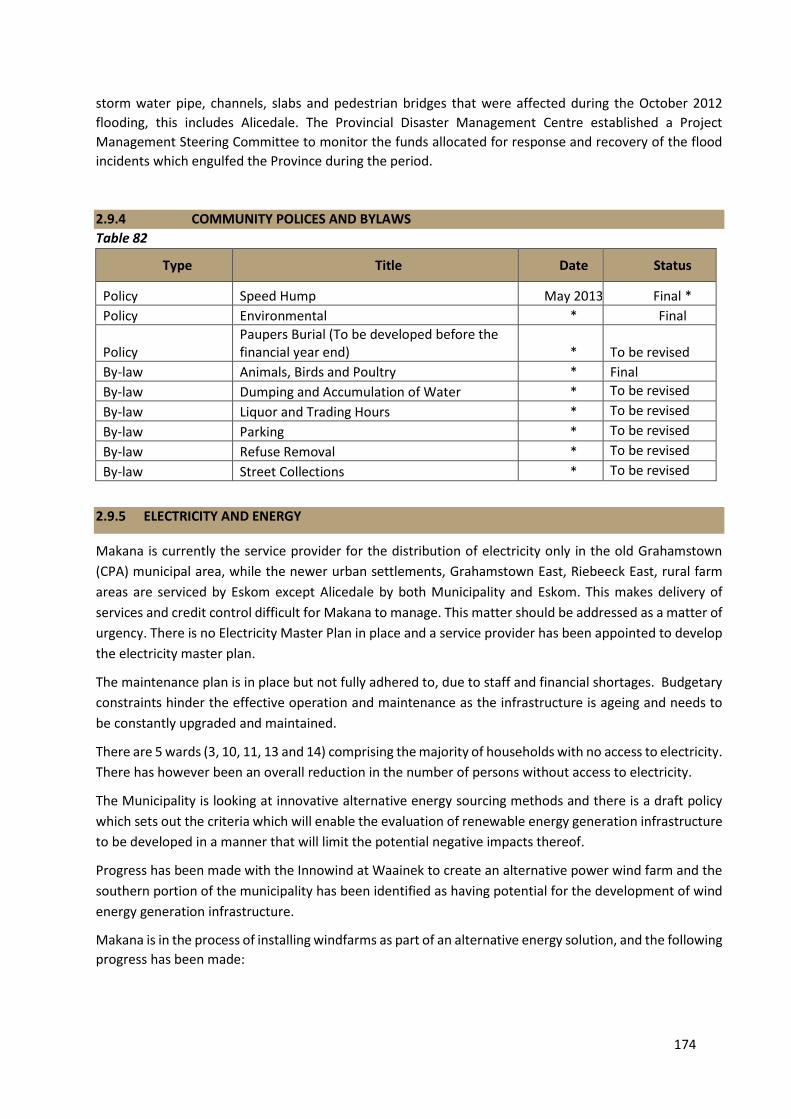
174
storm water pipe, channels, slabs and pedestrian bridges that were affected during the October 2012
flooding, this includes Alicedale. The Provincial Disaster Management Centre established a Project
Management Steering Committee to monitor the funds allocated for response and recovery of the flood
incidents which engulfed the Province during the period.
2.9.4 COMMUNITY POLICES AND BYLAWS
Table 82
Type Title Date Status
Policy Speed Hump May 2013 Final *
Policy Environmental * Final
Policy Paupers Burial (To be developed before the financial year end) * To be revised
By-law Animals, Birds and Poultry * Final
By-law Dumping and Accumulation of Water * To be revised
By-law Liquor and Trading Hours * To be revised
By-law Parking * To be revised
By-law Refuse Removal * To be revised
By-law Street Collections * To be revised
2.9.5 ELECTRICITY AND ENERGY
Makana is currently the service provider for the distribution of electricity only in the old Grahamstown
(CPA) municipal area, while the newer urban settlements, Grahamstown East, Riebeeck East, rural farm
areas are serviced by Eskom except Alicedale by both Municipality and Eskom. This makes delivery of
services and credit control difficult for Makana to manage. This matter should be addressed as a matter of
urgency. There is no Electricity Master Plan in place and a service provider has been appointed to develop
the electricity master plan.
The maintenance plan is in place but not fully adhered to, due to staff and financial shortages. Budgetary
constraints hinder the effective operation and maintenance as the infrastructure is ageing and needs to
be constantly upgraded and maintained.
There are 5 wards (3, 10, 11, 13 and 14) comprising the majority of households with no access to electricity.
There has however been an overall reduction in the number of persons without access to electricity.
The Municipality is looking at innovative alternative energy sourcing methods and there is a draft policy
which sets out the criteria which will enable the evaluation of renewable energy generation infrastructure
to be developed in a manner that will limit the potential negative impacts thereof.
Progress has been made with the Innowind at Waainek to create an alternative power wind farm and the
southern portion of the municipality has been identified as having potential for the development of wind
energy generation infrastructure.
Makana is in the process of installing windfarms as part of an alternative energy solution, and the following
progress has been made:
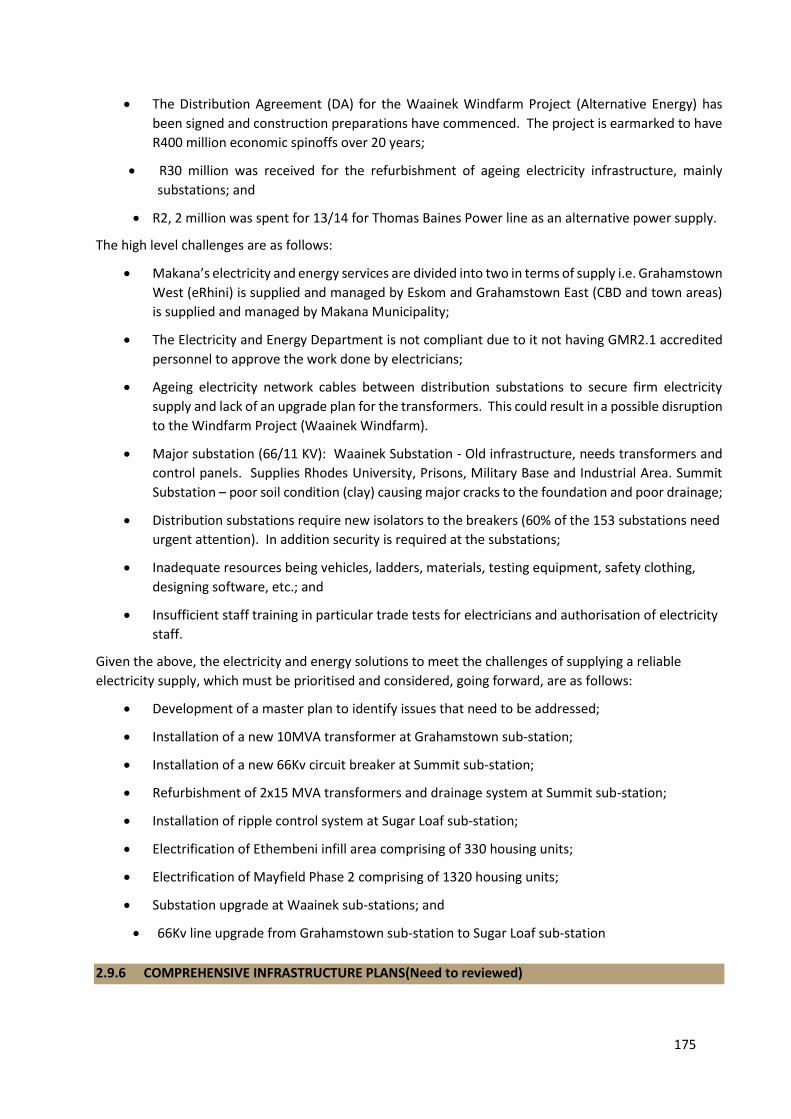
175
The Distribution Agreement (DA) for the Waainek Windfarm Project (Alternative Energy) has
been signed and construction preparations have commenced. The project is earmarked to have
R400 million economic spinoffs over 20 years;
R30 million was received for the refurbishment of ageing electricity infrastructure, mainly
substations; and
R2, 2 million was spent for 13/14 for Thomas Baines Power line as an alternative power supply.
The high level challenges are as follows:
Makana’s electricity and energy services are divided into two in terms of supply i.e. Grahamstown
West (eRhini) is supplied and managed by Eskom and Grahamstown East (CBD and town areas)
is supplied and managed by Makana Municipality;
The Electricity and Energy Department is not compliant due to it not having GMR2.1 accredited
personnel to approve the work done by electricians;
Ageing electricity network cables between distribution substations to secure firm electricity
supply and lack of an upgrade plan for the transformers. This could result in a possible disruption
to the Windfarm Project (Waainek Windfarm).
Major substation (66/11 KV): Waainek Substation - Old infrastructure, needs transformers and
control panels. Supplies Rhodes University, Prisons, Military Base and Industrial Area. Summit
Substation – poor soil condition (clay) causing major cracks to the foundation and poor drainage;
Distribution substations require new isolators to the breakers (60% of the 153 substations need
urgent attention). In addition security is required at the substations;
Inadequate resources being vehicles, ladders, materials, testing equipment, safety clothing,
designing software, etc.; and
Insufficient staff training in particular trade tests for electricians and authorisation of electricity
staff.
Given the above, the electricity and energy solutions to meet the challenges of supplying a reliable
electricity supply, which must be prioritised and considered, going forward, are as follows:
Development of a master plan to identify issues that need to be addressed;
Installation of a new 10MVA transformer at Grahamstown sub-station;
Installation of a new 66Kv circuit breaker at Summit sub-station;
Refurbishment of 2x15 MVA transformers and drainage system at Summit sub-station;
Installation of ripple control system at Sugar Loaf sub-station;
Electrification of Ethembeni infill area comprising of 330 housing units;
Electrification of Mayfield Phase 2 comprising of 1320 housing units;
Substation upgrade at Waainek sub-stations; and
66Kv line upgrade from Grahamstown sub-station to Sugar Loaf sub-station
2.9.6 COMPREHENSIVE INFRASTRUCTURE PLANS(Need to reviewed)

176
Comprehensive infrastructure plans as initiated by the Sarah Baartman District Municipality. The
overriding purpose of CIP’s is to develop a platform which will serve as a single process for all tiers of
government with respect to infrastructure provision & service delivery. To date, phase 1(one) of the CIP
development has been completed.
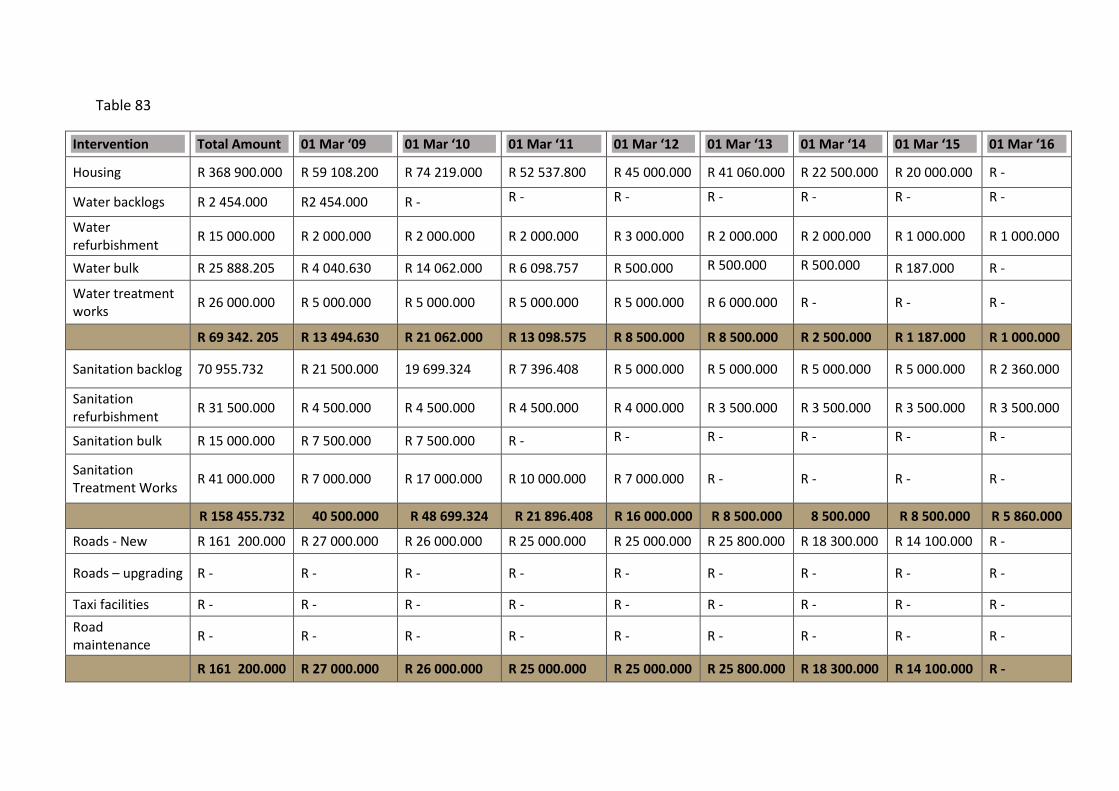
Table 83
Intervention Total Amount 01 Mar ‘09 01 Mar ‘10 01 Mar ‘11 01 Mar ‘12 01 Mar ‘13 01 Mar ‘14 01 Mar ‘15 01 Mar ‘16
Housing R 368 900.000 R 59 108.200 R 74 219.000 R 52 537.800 R 45 000.000 R 41 060.000 R 22 500.000 R 20 000.000 R -
Water backlogs R 2 454.000 R2 454.000 R - R - R - R - R - R - R -
Water refurbishment
R 15 000.000 R 2 000.000 R 2 000.000 R 2 000.000 R 3 000.000 R 2 000.000 R 2 000.000 R 1 000.000 R 1 000.000
Water bulk R 25 888.205 R 4 040.630 R 14 062.000 R 6 098.757 R 500.000 R 500.000 R 500.000 R 187.000 R -
Water treatment works
R 26 000.000 R 5 000.000 R 5 000.000 R 5 000.000 R 5 000.000 R 6 000.000 R - R - R -
R 69 342. 205 R 13 494.630 R 21 062.000 R 13 098.575 R 8 500.000 R 8 500.000 R 2 500.000 R 1 187.000 R 1 000.000
Sanitation backlog 70 955.732 R 21 500.000 19 699.324 R 7 396.408 R 5 000.000 R 5 000.000 R 5 000.000 R 5 000.000 R 2 360.000
Sanitation refurbishment
R 31 500.000 R 4 500.000 R 4 500.000 R 4 500.000 R 4 000.000 R 3 500.000 R 3 500.000 R 3 500.000 R 3 500.000
Sanitation bulk R 15 000.000 R 7 500.000 R 7 500.000 R - R - R - R - R - R -
Sanitation Treatment Works
R 41 000.000 R 7 000.000 R 17 000.000 R 10 000.000 R 7 000.000 R - R - R - R -
R 158 455.732 40 500.000 R 48 699.324 R 21 896.408 R 16 000.000 R 8 500.000 8 500.000 R 8 500.000 R 5 860.000
Roads - New R 161 200.000 R 27 000.000 R 26 000.000 R 25 000.000 R 25 000.000 R 25 800.000 R 18 300.000 R 14 100.000 R -
Roads – upgrading R - R - R - R - R - R - R - R - R -
Taxi facilities R - R - R - R - R - R - R - R - R -
Road maintenance
R - R - R - R - R - R - R - R - R -
R 161 200.000 R 27 000.000 R 26 000.000 R 25 000.000 R 25 000.000 R 25 800.000 R 18 300.000 R 14 100.000 R -
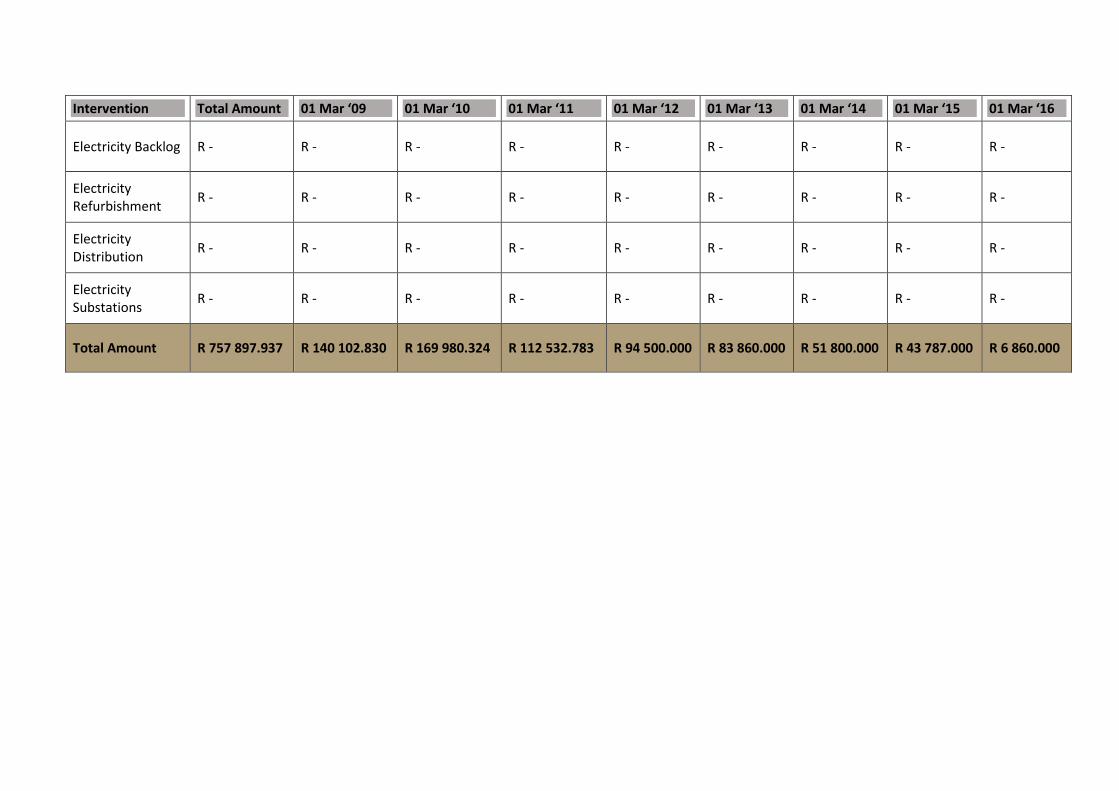
Intervention Total Amount 01 Mar ‘09 01 Mar ‘10 01 Mar ‘11 01 Mar ‘12 01 Mar ‘13 01 Mar ‘14 01 Mar ‘15 01 Mar ‘16
Electricity Backlog R - R - R - R - R - R - R - R - R -
Electricity Refurbishment
R - R - R - R - R - R - R - R - R -
Electricity Distribution
R - R - R - R - R - R - R - R - R -
Electricity Substations
R - R - R - R - R - R - R - R - R -
Total Amount R 757 897.937 R 140 102.830 R 169 980.324 R 112 532.783 R 94 500.000 R 83 860.000 R 51 800.000 R 43 787.000 R 6 860.000

2.10 FINANCIAL VIABILITY
2.10.1 Introduction:
Makana Municipality has been experiencing financial difficulties for the past 5 years and has been receiving Disclaimer Audit Opinion from Auditor- General.
Financial mismanagement has resulted in the municipality finding itself in a dismal financial position with demands for payment of long outstanding debts.
The municipality budget for 2016/17 financial year was found to be flawed in respect of the principles applied during the compilation due to unknown long outstanding debts, tariffs not being cost reflective and billing challenges. 2017/18 Budget also includes budget for long outstanding debts
Revenue enhancement strategy was developed for the purpose of improving the financial situation encountered by the municipality
2.10.2 Revenue Management
Makana Municipality is highly reliant on the revenue from electricity provision for running of the institution including salaries which impacts negatively in honouring Eskom current account.
Debtors’ Age Analysis is currently sitting at R398 million. Most of uncollectable debt owed to municipality is mainly household’s debts from Rini side,
where electricity is supplied by Eskom, liquidated businesses and prescribed debts. Non- payment due to customer data accuracy and staff capacitation. Lack of communication within the municipality Overall collection rate for 2016/17 financial year is 78 % and 2017/18 is sitting at 80%
Revenue collection rate is affected negatively due to the following issues: Data integrity that leads to overstatement of debtors book and billing. Indigent write- offs that should occur every financial year. Prescribed debts Data cleansing exercise has been prioritised to address the overstatement of Age Analysis
and debtors accounts. Implementation of smart metering project will involve meter audit and all illegal connections
will be identified. 2.10.3 Debtors’ age analysis
CATEGORY BALANCE % OF TOTAL OUTSTANDING
Business R 36 548 452 9 %
Residential R 349 463 412 88%
Government R 12 400 629 3 %
Councillors R 21 497 0.01%
Staff Debtors R 450 798 0.11%
Total R398 884 789.95 100%
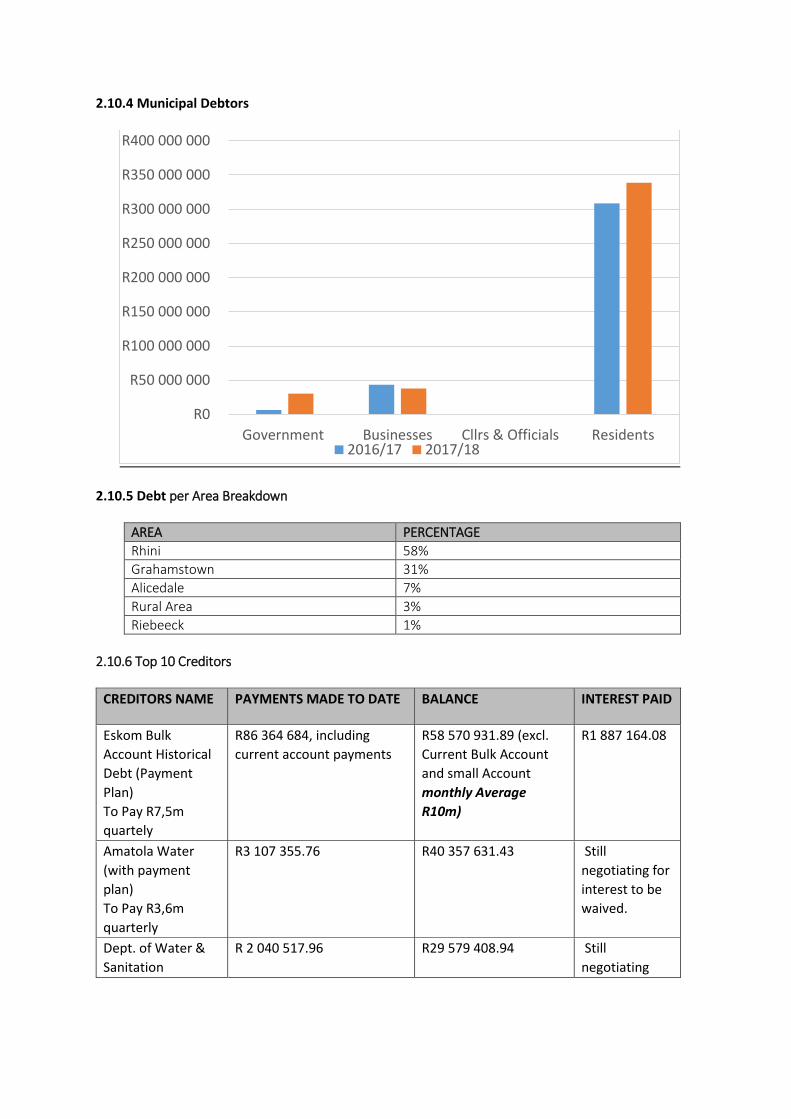
2.10.4 Municipal Debtors
2.10.5 Debt per Area Breakdown
AREA PERCENTAGE
Rhini 58%
Grahamstown 31%
Alicedale 7%
Rural Area 3%
Riebeeck 1%
2.10.6 Top 10 Creditors
CREDITORS NAME PAYMENTS MADE TO DATE BALANCE INTEREST PAID
Eskom Bulk
Account Historical
Debt (Payment
Plan)
To Pay R7,5m
quartely
R86 364 684, including
current account payments
R58 570 931.89 (excl.
Current Bulk Account
and small Account
monthly Average
R10m)
R1 887 164.08
Amatola Water
(with payment
plan)
To Pay R3,6m
quarterly
R3 107 355.76 R40 357 631.43 Still
negotiating for
interest to be
waived.
Dept. of Water &
Sanitation
R 2 040 517.96 R29 579 408.94 Still
negotiating
R0
R50 000 000
R100 000 000
R150 000 000
R200 000 000
R250 000 000
R300 000 000
R350 000 000
R400 000 000
Government Businesses Cllrs & Officials Residents2016/17 2017/18

Auditor- General
Historical debt
(with payment
plan, R350 000 per
month
R4 223 187.30 R12 082 167.30 (excl.
Current Account)
R786 421.96
(to be waived)
Dept. Transport R987 956.96 R1 421 009.81 No interest
Salga R400 000 R4 347643.00 No interest
DBSA Loan:
payment plan with
20 years
repayment term,
R580k per month
R7 473 459.37 R55 246 710.23
Total R104 597 159.98 R197 257 859.50 R2 675 905.83
2.10.7 Monthly Commitment
Description Average Monthly
Amount
Paid to date
Repairs & Maintenance R 469 449.00 R 5 957 159.00
Fuel R 298 645.60 R 2 439 651.60
Telephone R 186 090.79 R 721 750.79
Postage – Consumer Statements R 91 300.00 R 639 100.00
Legal Fees Varies R 1 933 913.00
Security R 244 216.00 R 1 650 433.00
Eskom – Current Accounts + Small
Accounts
R10 000 000 R60 567 912.40
IT Related Payments Varies R 1 678 290.98
Financial System – Monthly Service
payment
R 111 720.00 R 1 282 118.88
Total R11 401 420. R76 870 328.

2.10.8 Salary Cost
Months Total Salaries inclusive of overtime & 3
rd
Parties
Overtime Paid
July R14 135 625.90 R735 811.76
August R14 164 422.96 R801 348.05
September R14 075 742.01 R450 421.62
October R14 092 750.70 R501 137.06
November R20 326 392.72 R424 113.66
December R15 047 376.72 R599 472.43
January R13 968 233.83 522 706.81
Total R105 810 544.46 R4 485 289.53
2.10. 9 Municipal Credit Report
2.10.10 Monthly Cost
The municipality is faced with monthly costs that ranges from R34 million to R40 million from monthly inflows into bank: ±R18 - R28 million.
Actual monthly billing receipts are sitting at ± R16 – R19 million. Revenue generated goes to employee costs that are sitting at R14, 2 million a month. Equitable Share allocated to the municipality is mostly committed to pay long outstanding
debts as per the payment plans attached.
Eskom Bulk42%
Amatola Water24%
DWS17%
Salga2% Auditor-
General8%
SMME's7%
Litigation5%
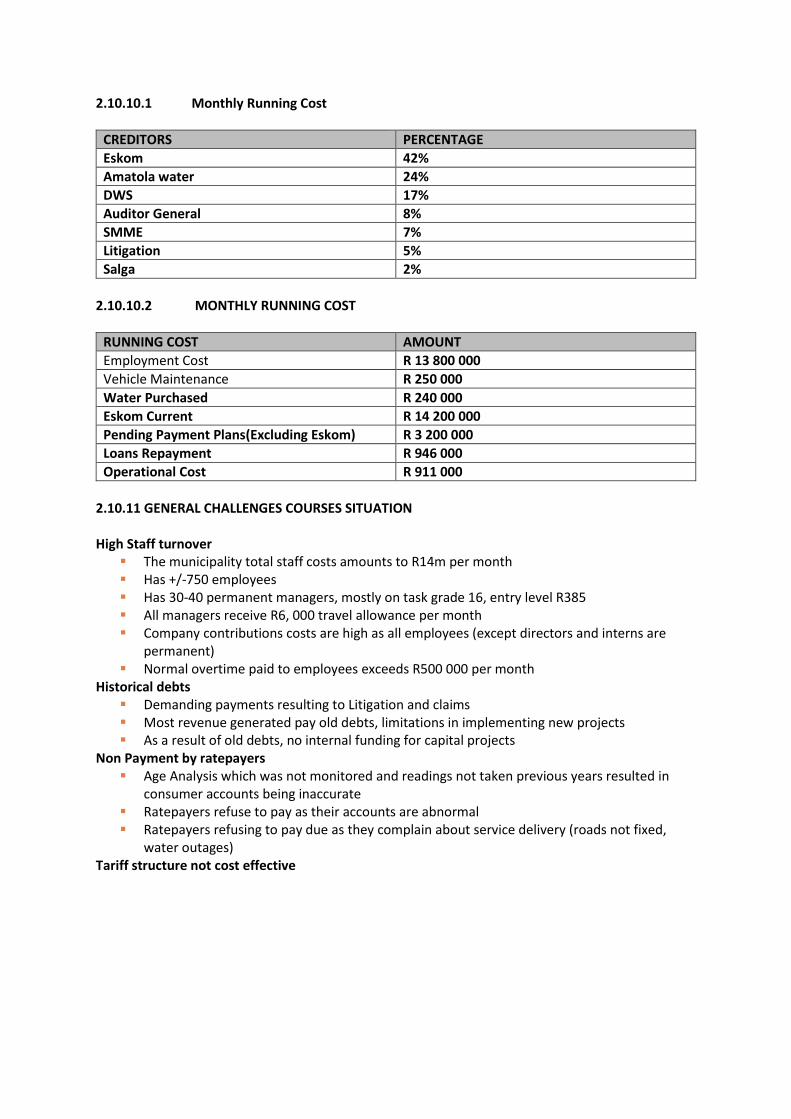
2.10.10.1 Monthly Running Cost
CREDITORS PERCENTAGE
Eskom 42%
Amatola water 24%
DWS 17%
Auditor General 8%
SMME 7%
Litigation 5%
Salga 2%
2.10.10.2 MONTHLY RUNNING COST
RUNNING COST AMOUNT
Employment Cost R 13 800 000
Vehicle Maintenance R 250 000
Water Purchased R 240 000
Eskom Current R 14 200 000
Pending Payment Plans(Excluding Eskom) R 3 200 000
Loans Repayment R 946 000
Operational Cost R 911 000
2.10.11 GENERAL CHALLENGES COURSES SITUATION High Staff turnover
The municipality total staff costs amounts to R14m per month Has +/-750 employees Has 30-40 permanent managers, mostly on task grade 16, entry level R385 All managers receive R6, 000 travel allowance per month Company contributions costs are high as all employees (except directors and interns are
permanent) Normal overtime paid to employees exceeds R500 000 per month
Historical debts Demanding payments resulting to Litigation and claims Most revenue generated pay old debts, limitations in implementing new projects As a result of old debts, no internal funding for capital projects
Non Payment by ratepayers Age Analysis which was not monitored and readings not taken previous years resulted in
consumer accounts being inaccurate Ratepayers refuse to pay as their accounts are abnormal Ratepayers refusing to pay due as they complain about service delivery (roads not fixed,
water outages) Tariff structure not cost effective

3.6 FINANCIAL POLICIES
The purpose of financial policies is to provide a sound environment to manage the financial affairs of
the municipality.
The following are the key financial related policies:
Table 89
POLICY DESCRIPTION LAST
UPDATED REMARKS
Tariff Policy Prescribes the procedures for
calculating tariffs.
This policy is required in terms of
Section 74 of the Local
Government Municipal System
Act, Act 32 of 2000 and Municipal
Finance Management Act, Act 56
of 2003.
26 March
2017
No action required at
present.
Rates Policy Required by the Municipal
Property Rates Act, Act 6 of 2004.
This Policy provides the framework
for the determination of rates and
Municipal Finance Management
Act, Act 56 of 2003.
20 June 2016 No action required at
present.
Indigent
Management
Support
Policy
Policy to provide access to and
regulate free basic service charges
and services to all indigents.
Indigents are those households
who are unable to access or pay for
basic services due to a number of
socio-economic factors.
Indigents must gain access to the
Municipal Services infrastructure
including water supply, sanitation,
refuse removal, electricity and
alternative energy where no
electricity is available.
The Municipality needs to ensure
that the services provided to
indigent households are always
maintained and available.
13 June 2016 No action required at
present
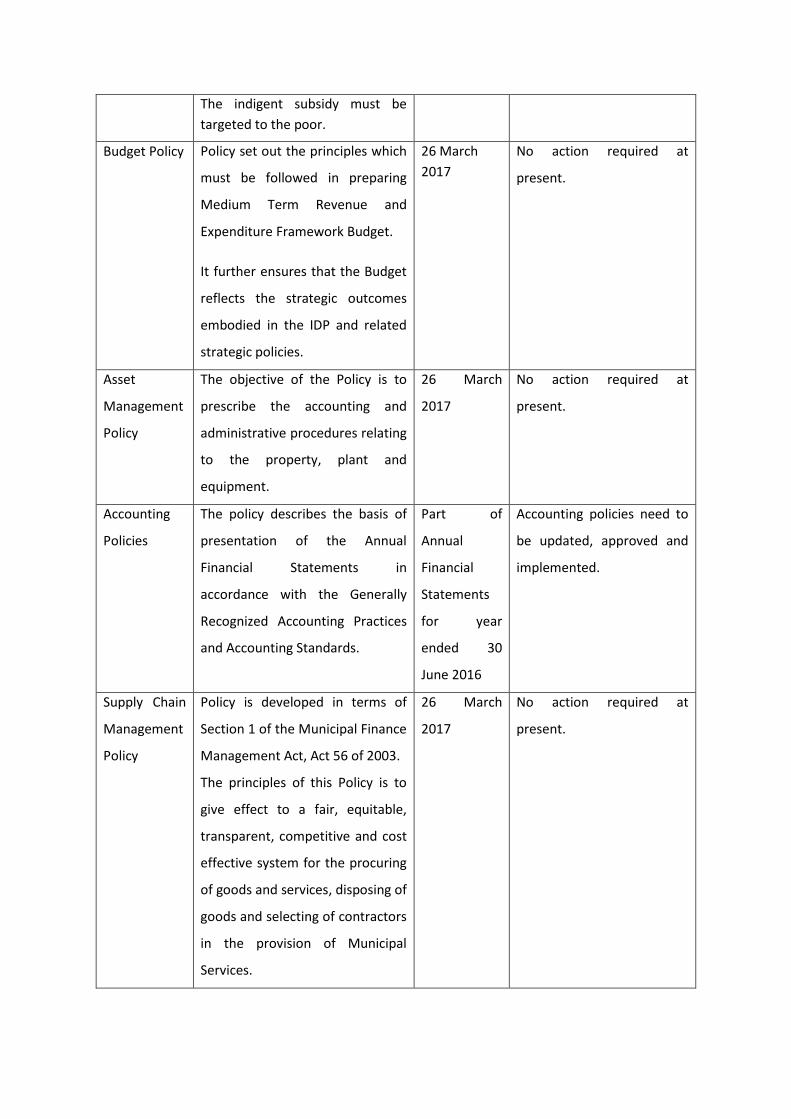
The indigent subsidy must be
targeted to the poor.
Budget Policy Policy set out the principles which
must be followed in preparing
Medium Term Revenue and
Expenditure Framework Budget.
It further ensures that the Budget
reflects the strategic outcomes
embodied in the IDP and related
strategic policies.
26 March
2017
No action required at
present.
Asset
Management
Policy
The objective of the Policy is to
prescribe the accounting and
administrative procedures relating
to the property, plant and
equipment.
26 March
2017
No action required at
present.
Accounting
Policies
The policy describes the basis of
presentation of the Annual
Financial Statements in
accordance with the Generally
Recognized Accounting Practices
and Accounting Standards.
Part of
Annual
Financial
Statements
for year
ended 30
June 2016
Accounting policies need to
be updated, approved and
implemented.
Supply Chain
Management
Policy
Policy is developed in terms of
Section 1 of the Municipal Finance
Management Act, Act 56 of 2003.
The principles of this Policy is to
give effect to a fair, equitable,
transparent, competitive and cost
effective system for the procuring
of goods and services, disposing of
goods and selecting of contractors
in the provision of Municipal
Services.
26 March
2017
No action required at
present.

Subsistence
and Travel
Policy
Policy regulates the
reimbursement of travelling and
subsistence costs to officials and
Councillors attending official
business.
No policy
supplied.
Policy needs to be drafted,
approved and implemented.
Credit
Control and
Debt
Collection
Policy
Policy provides for Credit and Debt
Collection Procedures and
mechanisms to ensure that all
consumers pay for the services.
20 June 2016 No action required at
present.
Cash
Management
and
Investment
Policy
Policy was compiled in accordance
with the Municipal Finance
Management Act, Act 56 of 2003.
20 June 2016 Given the cash flow
challenges faced by the
municipality the policy
should refined, approved
and vigorously be
implemented.
Short-term
Insurance
Policy
The objective of the Policy is to
ensure the safe-guarding of
Council’s assets.
20 June 2016. Policy needs to be drafted,
approved and implemented.
General
Ledger Chart
of Accounts
Maintenance
Policy
A current and accurate chart of
accounts is an integral part of the
accounting systems of the
municipality.
This chart of accounts is generally
consistent with the definitions and
procedures presented in the GRAP
(General Recognize Accounting
Practices) requirement as well as
the General Financial Statistics
(GFS Classification) and various
budget reform processes as
aligned by National Treasury.
No policy
supplied.
Policy needs to be drafted,
approved and implemented.
Information
Technology
Policy
Aim of this policy is:
To promote the professional,
ethical, lawful and productive
No policy
supplied.
Policy needs to be drafted,
approved and implemented.

use of Makana Municipality
information systems;
To define and prohibit
unacceptable use of Makana
Municipality information
systems;
To educate Municipal officials
about their Information Security
responsibilities;
To describe where, when and
why monitoring may take place;
To outline disciplinary
procedures.
Debt
Management
Policy
The objectives of this policy are to:
Record the circumstance under
which a municipality may incur
debt;
Describe the conditions that
must be adhered to by the
Municipal Manager or his/ her
delegate when a loan
application is submitted to
council for approval;
And record the key
performance indicators to
ensure access to the money
markets.
20 June 2016 No action required at
present.
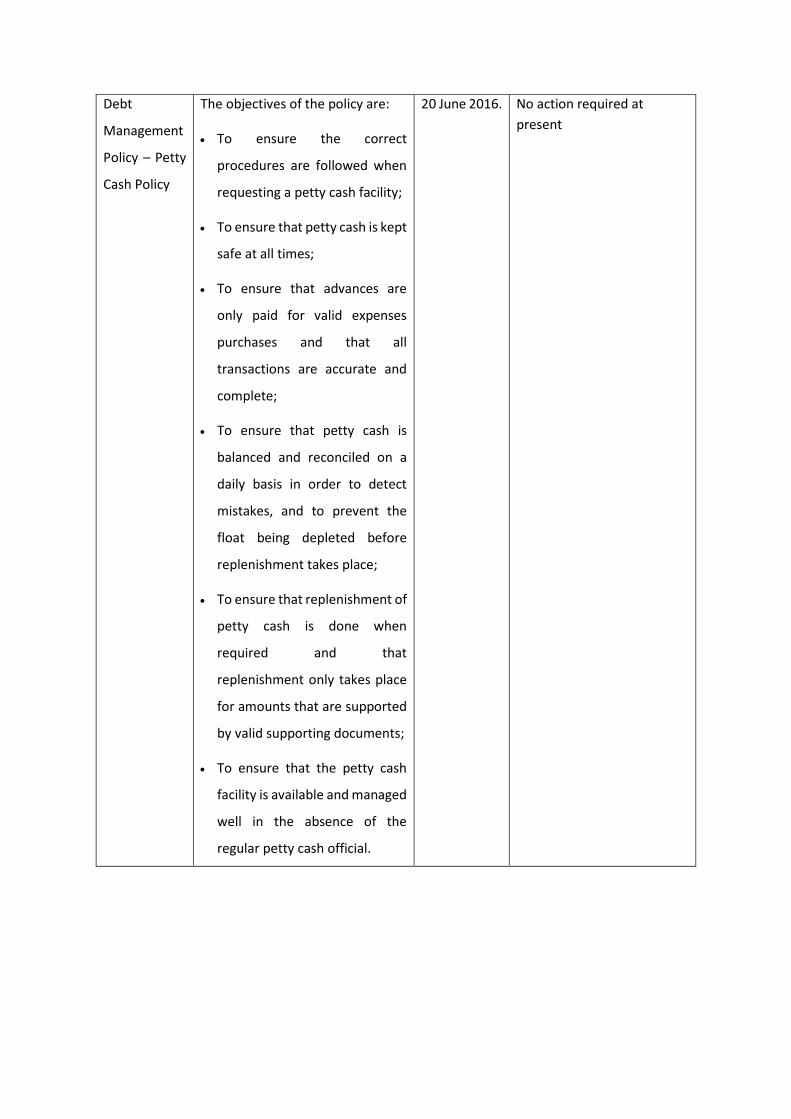
Debt
Management
Policy – Petty
Cash Policy
The objectives of the policy are:
To ensure the correct
procedures are followed when
requesting a petty cash facility;
To ensure that petty cash is kept
safe at all times;
To ensure that advances are
only paid for valid expenses
purchases and that all
transactions are accurate and
complete;
To ensure that petty cash is
balanced and reconciled on a
daily basis in order to detect
mistakes, and to prevent the
float being depleted before
replenishment takes place;
To ensure that replenishment of
petty cash is done when
required and that
replenishment only takes place
for amounts that are supported
by valid supporting documents;
To ensure that the petty cash
facility is available and managed
well in the absence of the
regular petty cash official.
20 June 2016. No action required at
present
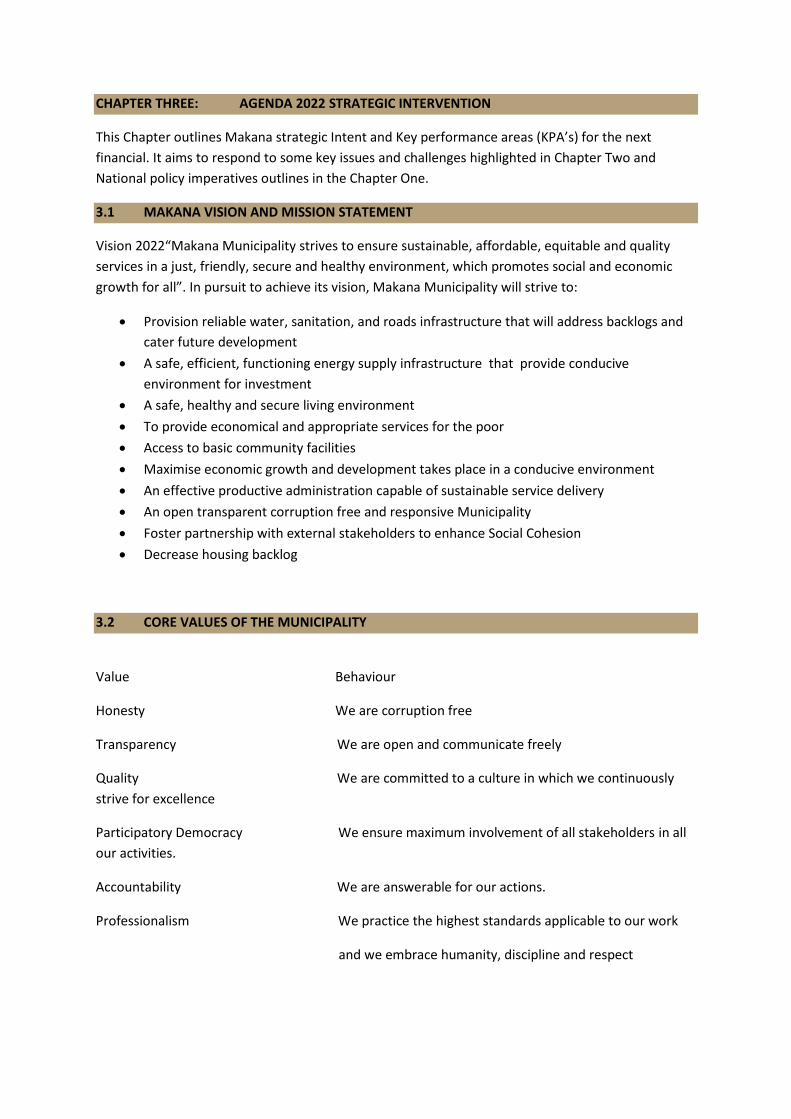
CHAPTER THREE: AGENDA 2022 STRATEGIC INTERVENTION
This Chapter outlines Makana strategic Intent and Key performance areas (KPA’s) for the next
financial. It aims to respond to some key issues and challenges highlighted in Chapter Two and
National policy imperatives outlines in the Chapter One.
3.1 MAKANA VISION AND MISSION STATEMENT
Vision 2022“Makana Municipality strives to ensure sustainable, affordable, equitable and quality
services in a just, friendly, secure and healthy environment, which promotes social and economic
growth for all”. In pursuit to achieve its vision, Makana Municipality will strive to:
Provision reliable water, sanitation, and roads infrastructure that will address backlogs and
cater future development
A safe, efficient, functioning energy supply infrastructure that provide conducive
environment for investment
A safe, healthy and secure living environment
To provide economical and appropriate services for the poor
Access to basic community facilities
Maximise economic growth and development takes place in a conducive environment
An effective productive administration capable of sustainable service delivery
An open transparent corruption free and responsive Municipality
Foster partnership with external stakeholders to enhance Social Cohesion
Decrease housing backlog
3.2 CORE VALUES OF THE MUNICIPALITY
Value Behaviour
Honesty We are corruption free
Transparency We are open and communicate freely
Quality We are committed to a culture in which we continuously
strive for excellence
Participatory Democracy We ensure maximum involvement of all stakeholders in all
our activities.
Accountability We are answerable for our actions.
Professionalism We practice the highest standards applicable to our work
and we embrace humanity, discipline and respect

3.3 MUNICIPAL DEVELOPMENT PRIORITIES FOR 2017-22
Table 90
NUMBER OF PRIORITY DEVELOPMENT PRIORITY
Development Priority No. One: Basic Service Delivery and Infrastructure Development
Development Priority No. Two Community and Social Development
Development Priority No. Three: Local Economic Development and Rural Development
Development Priority No. Four: Institutional Development and Financial Management
Development Priority No. Five Good Governance and Public Participation
Development Priority No. Six Human Settlement Management
3.4 DEVELOPMENT GOALS AND OBJECTIVES
Table 91
GOALS NO STRATEGIC
OBJECTIVES
NO KEY PERFOMANCE INDICATOR
DEVELOPMENT PRIORITIY NO ONE: BASIC SERVICE DEVELIVERY AND INFRASCTURE DEVELOPMENT
Provision
reliable water,
sanitation, and
roads
infrastructure
that will
address
backlogs and
cater future
development
1 Efficient planning of
the basic services
infrastructure
development
1.1 Approved water Service Development Plan by
Council
1.2 Revised Water and Sanitation Master plan by
Council
1.3 % of the milestone achieve in with project
management plan
2
Maintenance of the
existing water and
sanitation
infrastructure
2.1 Disposal of waste water as per authorised
licences
2.2 Maintenance of water exiting reticulation
system infrastructure
2.3 Maintenance of sewer exiting reticulation
system infrastructure
2.4 Schedule maintenance of bulk water and
waste water infrastructure
2.5 Number housed pail removed
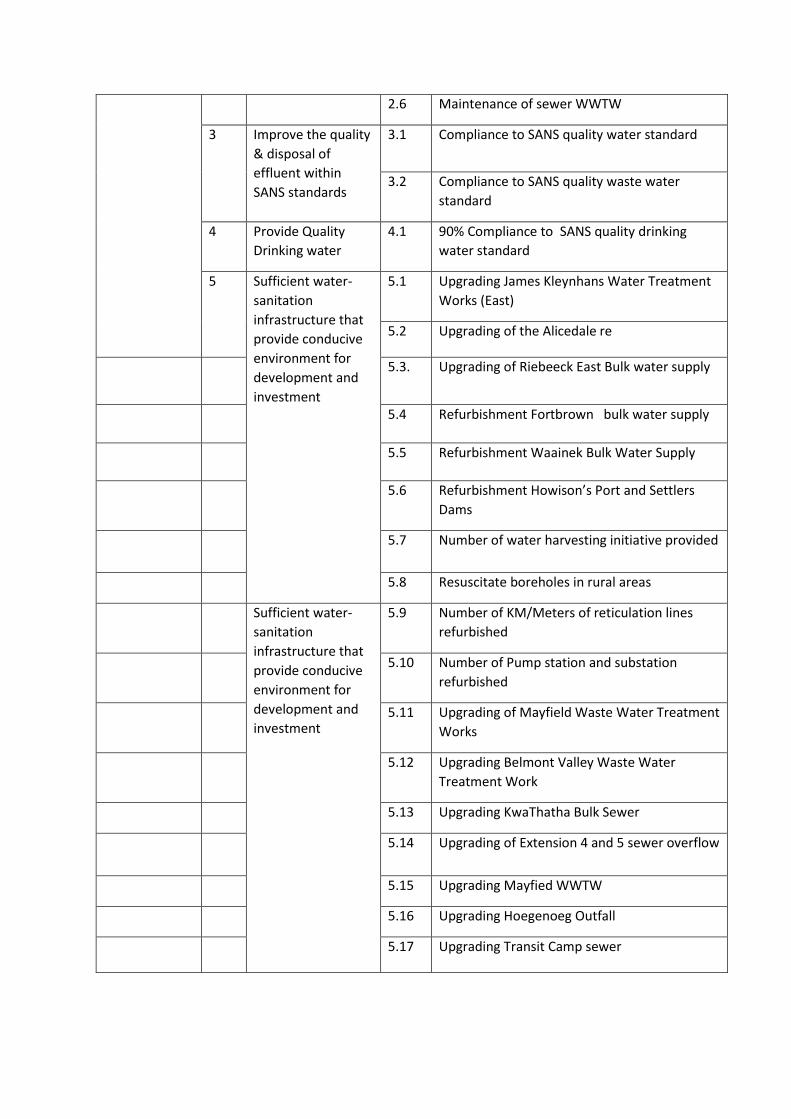
2.6 Maintenance of sewer WWTW
3
Improve the quality
& disposal of
effluent within
SANS standards
3.1 Compliance to SANS quality water standard
3.2 Compliance to SANS quality waste water
standard
4 Provide Quality
Drinking water
4.1 90% Compliance to SANS quality drinking
water standard
5 Sufficient water-
sanitation
infrastructure that
provide conducive
environment for
development and
investment
5.1 Upgrading James Kleynhans Water Treatment
Works (East)
5.2 Upgrading of the Alicedale re
5.3. Upgrading of Riebeeck East Bulk water supply
5.4 Refurbishment Fortbrown bulk water supply
5.5 Refurbishment Waainek Bulk Water Supply
5.6 Refurbishment Howison’s Port and Settlers
Dams
5.7 Number of water harvesting initiative provided
5.8 Resuscitate boreholes in rural areas
Sufficient water-
sanitation
infrastructure that
provide conducive
environment for
development and
investment
5.9 Number of KM/Meters of reticulation lines
refurbished
5.10 Number of Pump station and substation
refurbished
5.11 Upgrading of Mayfield Waste Water Treatment
Works
5.12 Upgrading Belmont Valley Waste Water
Treatment Work
5.13 Upgrading KwaThatha Bulk Sewer
5.14 Upgrading of Extension 4 and 5 sewer overflow
5.15 Upgrading Mayfied WWTW
5.16 Upgrading Hoegenoeg Outfall
5.17 Upgrading Transit Camp sewer

5.18 Upgrading of Alicedale sewer reticulation and
rising main
5.19 Maintenance of water exiting WTW
5.20 Maintenance of water exiting WTW
5.21 Maintenance of WTW
5.22 Maintenance of water WTW
6 Sufficient water-
sanitation
infrastructure that
provide conducive
environment for
development and
investment
6.1 Construction of Riebeeck East Waste Water
Treatment Works
6.2 Installation of Sewer reticulation RIEBEECK
EAST
6.3 Installation of Fortbrown bulk sewer and
reticulation
6.4 Installation of Seven Fountains bulk sewer and
reticulation
6.7 Installation of Salem water and sanitation
infrastructure
6.8 Installation Extension 6 stage 4 Sewer
Reticulation
6.9 Construction of Extension 6 stage 4 Toilet Top-
structures
6.10 Eradication of Bucket to Infill
Areas,J,Zolani,Suncity, Phaphamani
7
Upgrading and
resurfacing of
roads network
7.1 Review Road and Storm water Master Plan
7.2 Number of KM/Meters of road surface in
KwaNomzamo
7.3 Number KM/Meter maintained
7.4 Number of KM upgraded and resurface
Alicedale N2
7.5 Number of KM upgraded and resurface
Riebeeck East to N1
7.6 Number KM/Meters of kerbs Upgrading and
resurfacing
7.7 Number of meters Rehabilitation/resurface of
Ncame Street

7.8 Number of meters in resurfacing Joza Street
7.9 Number of KM/Meters Upgrading of
stormwater resurfacing of roads In Transrivier
7.10 Number of KM/Meters paved in all identifies
areas
8 Maintenance of
Stormwater
channels
8.1 Number of meters maintained Tumwater
channel
A safe,
efficient,
functioning
energy supply
infrastructure
that provide
conducive
environment
for investment
9 Efficient planning of
the energy supply
9.1 Development of Electricity Master Plan
10
Ensure efficient
infrastructure and
reliable energy
supply
10.1 Review provision of electricity to
Grahamstown east
10.2 Report on the number maintenance undertook
quarterly
10.3 Report on the number meters audit conducted
quarterly
11 Adequate street-
lighting and
electrification of all
formal settlements
11.1 Number of highmast installed or maintained
11.2 Number electrical supply infrastructure
provided
11.3 Number of household provided electricity
11.4 Number of Street lights installed or maintained
11.5 Report on the maintenance conducted
quarterly
12 Upgrading and
refurbishing of the
existing electricity
network
12.1 Number of KM/Meters District lines installed
12.2 Number of KM/Meters LV Pane installed
12.3 Number of KM/Meters Krowing MV and LV
Panel upgraded
12.4 Report on the number of refurbishment
undertook in the existing electrical network
infrastructure
12.5 Purchasing of tools by June 2018

12.6 Purchasing of Vehicle by 2018
12.7 Purchasing Isolator Summit by June 2018
12.8 Purchasing Battery Test by June 2018
12.9 Purchasing Tone Mobi Jack and Car diagnoser
by 2018
12.10 Maintanance vehicles
12.11 Number of electricity goods procured
A safe, healthy
and secure
living
environment
13 A safe, healthy and
sustainable
environment within
Makana
Municipality
13.1 Review Integrated Waste Management
13.2 Source funding for town cleaning program
from EPWP
13.3 Expand Recycling and composting programme
13.4 Number of rural areas received refusal of
collection service
13.5 Acquisition of one Tipper Truck by June 2018
13.6 Acquisition of 1 Front loader by June 2018
13.7 Acquisition 4 x Acquisition Containers
13.8 Upgrading of landfill waste site in Makana
13.9 Number of Community education and
awareness programmes conducted
13.10 Number of areas domestic refuse collected per
week
13.11 Number of ward cleaner-up programme
quarterly
To provide
economical
and
appropriate
services for the
poor
14 Increase % of
households with
access to free basic
service
14.1 Report number of indigent households with
access free basic service quarterly
14.2 Update indigent register annually

DEVELOPMENT PRIORITY NO TWO: COMMUNITY AND SOCIAL DEVELOPMENT
A safe, healthy
and secure
living
environment
15 Ensure compliance
with environmental
health by-laws
15.1 Number of water sample conducted and
results
15.2 Number of environmental by laws
15.3 Approved environmental compliance register
by June 2018
16 Reduce ecological
foot print through
renewable energy
sources
16.1 Establishment of Biomass generation plant
16.2 Stablemen of Landfill gas generation plant
16.3 Establishment of waste to energy project
16.4 Establishment of Solar photovoltaic energy
generation
16.5 Establishment Small- scale embedded
generation
16.6 Development of Hydroelectricity
16.7 Establishment Municipal own energy efficiency
16.8 Establishment Municipal own energy efficiency
street and traffic light
16.9 Establishment Energy efficiency in the water
sector
1610 Number of Solar water heaters Introducing
16.11 Number of smart meters Installation
16.12 Installation of Solar panels and geysers
16.13 Number of Climate change initiatives
awareness program implemented
16.14 Adaptation
16.15 Introduction of Green and public transport
17 To promote the
well-being, health ,
safety and security
of our community
17.1 Development of Sport Master Plan
17.2 Report on the number of sport facilities
maintained quarterly
17.3 Number of Children park and sport
recreational facilities established
17.4 Number of trees planted area
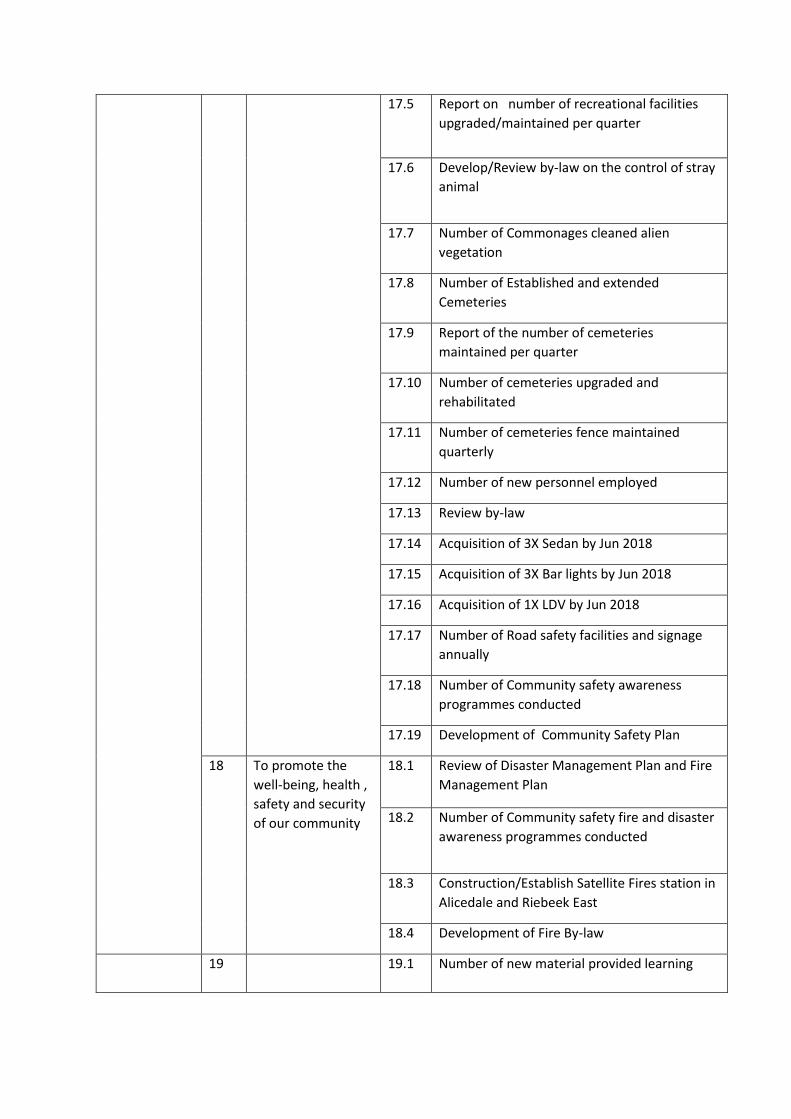
17.5 Report on number of recreational facilities
upgraded/maintained per quarter
17.6 Develop/Review by-law on the control of stray
animal
17.7 Number of Commonages cleaned alien
vegetation
17.8 Number of Established and extended
Cemeteries
17.9 Report of the number of cemeteries
maintained per quarter
17.10 Number of cemeteries upgraded and
rehabilitated
17.11 Number of cemeteries fence maintained
quarterly
17.12 Number of new personnel employed
17.13 Review by-law
17.14 Acquisition of 3X Sedan by Jun 2018
17.15 Acquisition of 3X Bar lights by Jun 2018
17.16 Acquisition of 1X LDV by Jun 2018
17.17 Number of Road safety facilities and signage
annually
17.18 Number of Community safety awareness
programmes conducted
17.19 Development of Community Safety Plan
18 To promote the
well-being, health ,
safety and security
of our community
18.1 Review of Disaster Management Plan and Fire
Management Plan
18.2 Number of Community safety fire and disaster
awareness programmes conducted
18.3 Construction/Establish Satellite Fires station in
Alicedale and Riebeek East
18.4 Development of Fire By-law
19 19.1 Number of new material provided learning

Access to basic
community
facilities
To provide reading
and study material
19.2 Number of community programme conducted
per quarter
19.3 Establishment of libraries to need areas
DEVELOPMENT PRIORITY NO THREE:LOCAL ECONOMIC DEVELOMENT and RURAL DEVELOPMENT
Maximise
economic
growth and
development
takes place in a
conducive
environment
20 To ensure
adherence to town
planning and
building control
legislation
20.1 Review and adopt SDF by June 2018
20.2 Development of the SPLUMA By-Law
20.3 Establishment of the Tribunal and Appeals
Board
20.4 Upgrading Air filed
20.5 Conduct land audit
20.6 Establishment of Waste to Energy
20.7 Number of infill areas approved for town
establishment
20.8 Establishment of east commonage
20.9 Reviewed of the Sub division, Rezoning and
Building control policy
Maximise
economic
growth and
development
takes place in a
conducive
environment
21 Promote and
support SMME
development
21.1 Establishment SMME hurb Business plan
21.2 Number of hawker stalls constructed
21.3 Hosting SMME Seminars
21.4 Development of Trade and Investment attract
Strategy
Maximise
economic
growth and
development
takes place in a
conducive
environment
22 Promote
Municipality
through Tourism
support to SMME's
22.1 Implementation of Town Regeneration Phase
1
22.2 Report to Portfolio Committee on initiatives
identified for implementation under Creative
City project
22.2 Number of SMMEs in tourism sector supported
and Capacitated Quarterly
22.3 Report on funding allocated to Makana
Tourism by the Municipality quarterly
22.4 Development of Gray Dam
22.5 Development of Makana area profile by June
2018
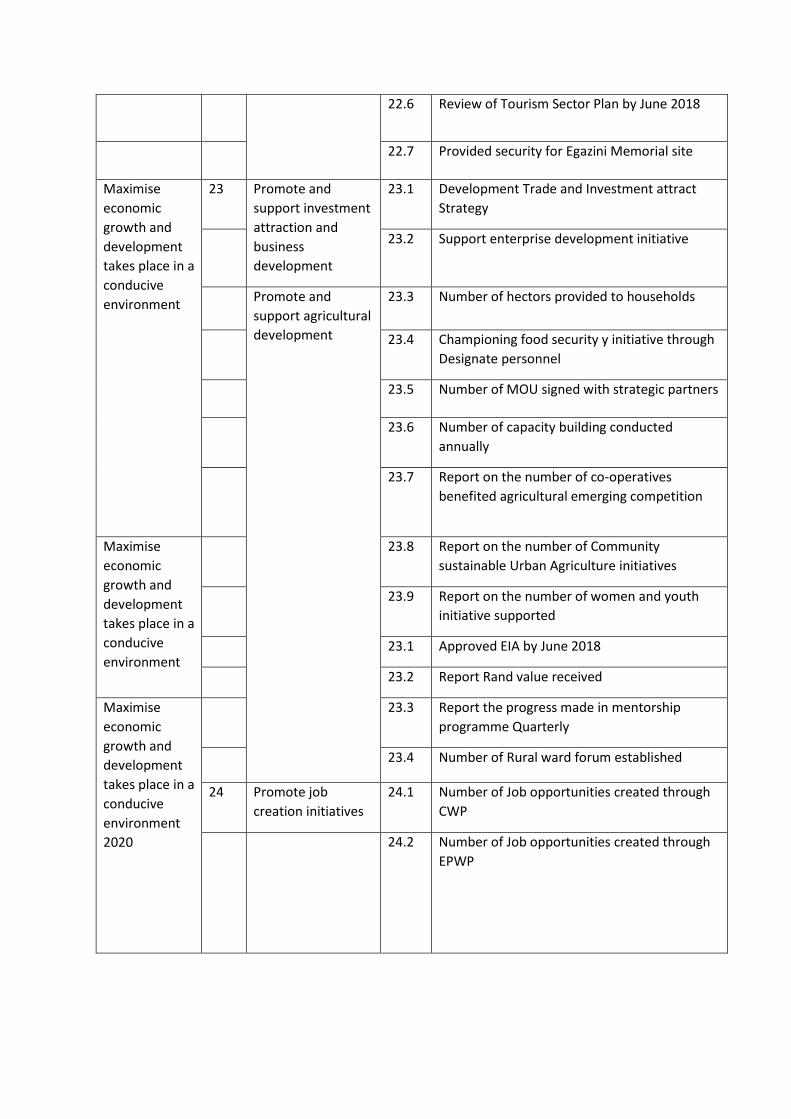
22.6 Review of Tourism Sector Plan by June 2018
22.7 Provided security for Egazini Memorial site
Maximise
economic
growth and
development
takes place in a
conducive
environment
23 Promote and
support investment
attraction and
business
development
23.1 Development Trade and Investment attract
Strategy
23.2 Support enterprise development initiative
Promote and
support agricultural
development
23.3 Number of hectors provided to households
23.4 Championing food security y initiative through
Designate personnel
23.5 Number of MOU signed with strategic partners
23.6 Number of capacity building conducted
annually
23.7 Report on the number of co-operatives
benefited agricultural emerging competition
Maximise
economic
growth and
development
takes place in a
conducive
environment
23.8 Report on the number of Community
sustainable Urban Agriculture initiatives
23.9 Report on the number of women and youth
initiative supported
23.1 Approved EIA by June 2018
23.2 Report Rand value received
Maximise
economic
growth and
development
takes place in a
conducive
environment
2020
23.3 Report the progress made in mentorship
programme Quarterly
23.4 Number of Rural ward forum established
24 Promote job
creation initiatives
24.1 Number of Job opportunities created through
CWP
24.2 Number of Job opportunities created through
EPWP

DEVELOPMENT PRIORITY NO FOUR: INSTITUTIONAL DEVELOPMENT FINANCIAL MANAGEMENT
An effective
productive
administration
capable of
sustainable
service
delivery
25 To ensure a good
relationship
between
management and
employees through
regular interactions
on labour issues
25.1 Number of LLF meeting hosted annually and
Roadshows and staff briefing
26 To create an
efficient, effective
and accountable
administration
26.1 Number of succession policy initiative
implemented
26.2 Number of staff moral programmes
implemented annually
26.3 Number of job description revised
26.4 Number performance agreements signed
26.5 Number wellness programme conducted
26.6 Development Work Skills Plan
26.7 Conduct skill audit
26.8 Number of employees assisted
26.9 Number of Bursaries issued annually
26.10 Quarterly reports on EE plan implementation.
Submission of annual report
26.11 Fill vacant post with three month
27 Effective
organisational
design and policy
development
27.1 Annual Review of Organogram
27.2 Evaluate all job description by June 2018
27.3 Number of roadshows conducted
28 To ensure that all
Municipal buildings
and staff adhere to
and implement OHS
28.1 Number of OHS meetings quarterly
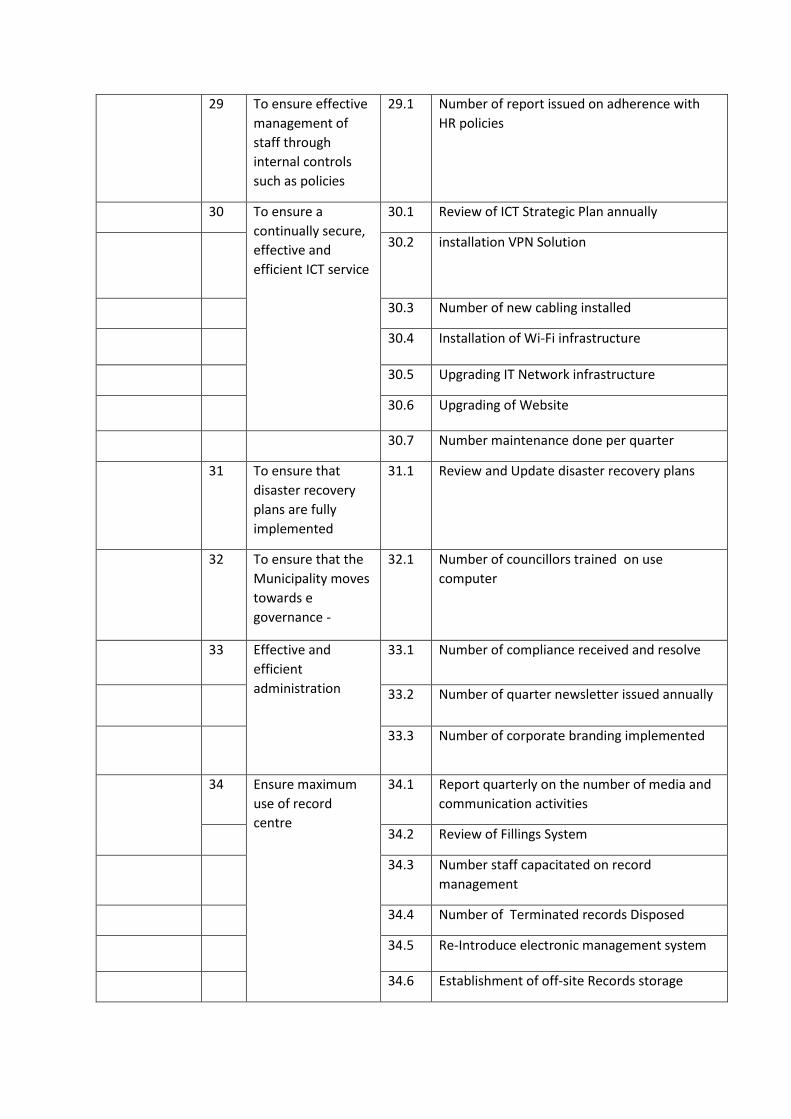
29 To ensure effective
management of
staff through
internal controls
such as policies
29.1 Number of report issued on adherence with
HR policies
30 To ensure a
continually secure,
effective and
efficient ICT service
30.1 Review of ICT Strategic Plan annually
30.2 installation VPN Solution
30.3 Number of new cabling installed
30.4 Installation of Wi-Fi infrastructure
30.5 Upgrading IT Network infrastructure
30.6 Upgrading of Website
30.7 Number maintenance done per quarter
31 To ensure that
disaster recovery
plans are fully
implemented
31.1 Review and Update disaster recovery plans
32 To ensure that the
Municipality moves
towards e
governance -
32.1 Number of councillors trained on use
computer
33 Effective and
efficient
administration
33.1 Number of compliance received and resolve
33.2 Number of quarter newsletter issued annually
33.3 Number of corporate branding implemented
34 Ensure maximum
use of record
centre
34.1 Report quarterly on the number of media and
communication activities
34.2 Review of Fillings System
34.3 Number staff capacitated on record
management
34.4 Number of Terminated records Disposed
34.5 Re-Introduce electronic management system
34.6 Establishment of off-site Records storage

34.7 Reduce legal cost on litigation against
Municipality
34.8 Reduce legal cost on litigation by Municipality
34.9 Reduce legal cost on legal opinion Municipality
An open
transparent
corruption free
and responsive
Municipality
35 To ensure that a
system of
Institutional and
individual
performance
management
system is
implemented by
2022
35.1 Number of performance report
35.2 Number of validation performance report
35.3 Reviewed of the Performance Management
Policy annually
35.4 Number of performance conducted
quarterly/Annually
35.5 Re-Introduce Automated electronic PMS
35.6 Cascading PMS to all staff June 2019
35.7 Number of stakeholder engagement
35.8 Number of Ward Profile revised annually
35.9 Annually review of IDP
35.1 Score high in the IDP assessment
An effective
productive
administration
capable of
sustainable
service
delivery
36 To ensure that all
municipal staff are
adequately housed.
36.1 Number building renovated and report
progress quarterly
A financially
viable and
sustainable
Municipality
Enhance Revenue
strategy
36.1 90% Debt Collection
To expand the
municipal
revenue base
36.2 90% Accurate billing
36.3 Number of smart meters Installed

by providing
accurate bills
for services
rendered
36.4 Review of all service tariffs charges
37 Annually reporting
on the % of the
budget actually
spend
37.1 100% Compliance to MFMA report
requirement
38 To ensure the
efficient and
effective
procurement of
goods and services
38.1 One roadshow annually
38.2 Quarterly reports on bid committee
functionality
38.3 Annual stock count report to CFO.
39 To become a
financial viable
municipality that is
able to account and
report on all
monies spent for
service delivery
purposes
39.1 Number of capacity building training
conducted or attending
39.2 Number of internship programmed provided
annually
39.3 Compliance to Section 102 of MFMA
39.4 Compliance to Section 99b of MFMA
39.5 Annual update of the indigent register
39.6 Number of household provided with subside
39.7 Implementation of mSCoa Plan
39.8 Review of property rates
40 To provide a
credible budget
40.1 Prepare and adoption budget by Council
annually
40.2 Prepare and adoption adjustment budget by
Council annually
41 To ensure
monitoring of
Municipal Assets
through annual
checks and
reporting
41.1 Annual count of assets
42 To ensure
compliance by
developing and
maintaining fully
42.1 Fully GRAP Compliant Asset register
42.2 Annual disposal sale of assets
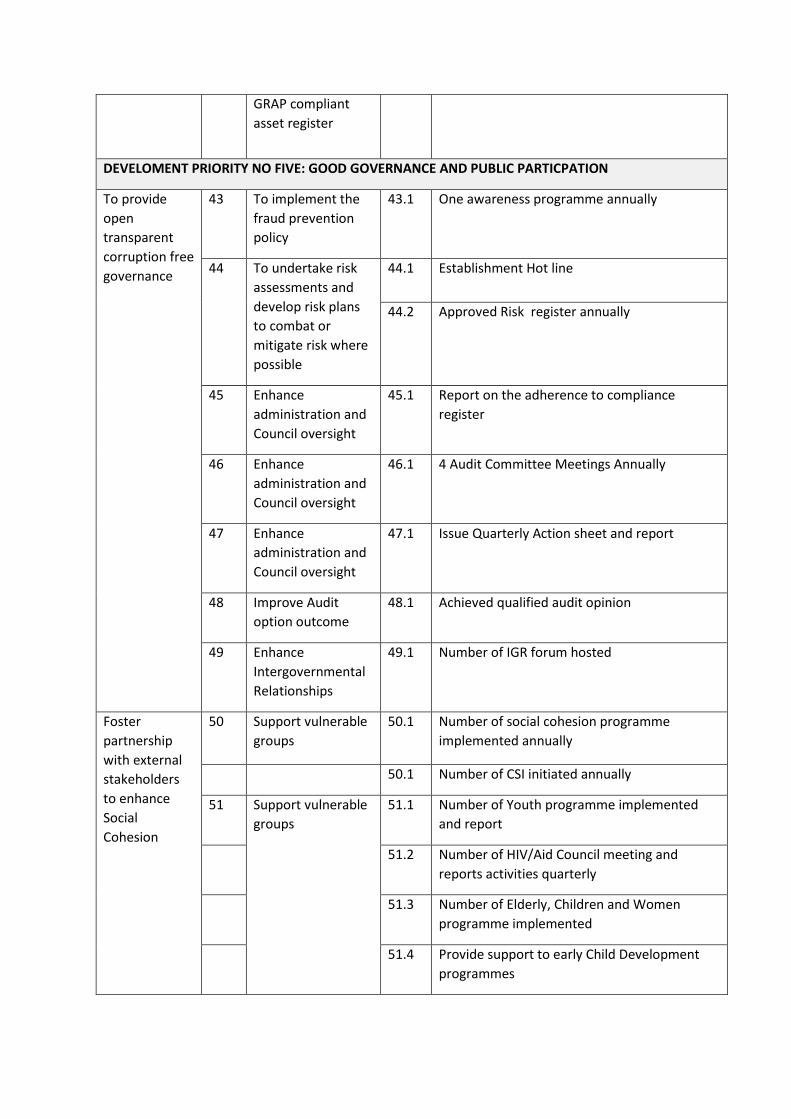
GRAP compliant
asset register
DEVELOMENT PRIORITY NO FIVE: GOOD GOVERNANCE AND PUBLIC PARTICPATION
To provide
open
transparent
corruption free
governance
43 To implement the
fraud prevention
policy
43.1 One awareness programme annually
44 To undertake risk
assessments and
develop risk plans
to combat or
mitigate risk where
possible
44.1 Establishment Hot line
44.2 Approved Risk register annually
45 Enhance
administration and
Council oversight
45.1 Report on the adherence to compliance
register
46 Enhance
administration and
Council oversight
46.1 4 Audit Committee Meetings Annually
47 Enhance
administration and
Council oversight
47.1 Issue Quarterly Action sheet and report
48 Improve Audit
option outcome
48.1 Achieved qualified audit opinion
49 Enhance
Intergovernmental
Relationships
49.1 Number of IGR forum hosted
Foster
partnership
with external
stakeholders
to enhance
Social
Cohesion
50 Support vulnerable
groups
50.1 Number of social cohesion programme
implemented annually
50.1 Number of CSI initiated annually
51 Support vulnerable
groups
51.1 Number of Youth programme implemented
and report
51.2 Number of HIV/Aid Council meeting and
reports activities quarterly
51.3 Number of Elderly, Children and Women
programme implemented
51.4 Provide support to early Child Development
programmes

52 To communicate
effectively and be
responsive to the
needs of the
community
52.1 Number of Masipathisane meetings
52.2 Number of IDP Representative annually
52.3 Report on functioning of ward quarterly
DEVELOPMENT PRIORITY NO SIX: HUMAN SETTLMENT MANAGEMENT
Decrease
housing
backlog
53
To ensure equitable
access to housing
for communities
53.1 Hectors land secure for housing development
53.2 Review Housing Plan
53.3 Number of RDP House rectified annually
53.4 Number of housed built annually
53.5 Review Housing beneficiary list annually

3.5 IDP PROJECT REGISTER
Table 92
GOALS N
O
STRATEGIC
OBJECTIVES
NO
KEY PERFOMANCE
INDICATOR
NO
PROJECT
NAME
PROJECT
DESCRIPTION
INDICATOR
CODE
FUNCTIONAL
AREA
DEVELOPMENT PRIORITIY NO ONE: BASIC SERVICE DEVELIVERY AND INFRASCTURE DEVELOPMENT
Provision reliable
water, sanitation,
and roads
infrastructure
that will address
backlogs and
cater future
development
1 Efficient planning of
the basic services
infrastructure
development
1.1 Approved water
Service Development
Plan by Council
P001 Review of
Water Services
Development
Plan
Development or
review sector
plans
1.1.1.1.P001 Water and
Sanitation
1.2 Revised Water and
Sanitation Master plan
by Council
P002 Review of
Water and
Sanitation
Master plan
Development or
review sector
plans
1.1.1.2 P002 Water and
Sanitation
1.3 % of the milestone
achieve in with project
management plan
P003 Project
Management
Unit
Effective
Management of
Municipal Service
Delivery Projects
1.1.1.3P003 PMU
2 Maintenance of the
existing water and
2.1 Disposal of waste
water as per
authorised licences
P004 Sewer
Disposal
Disposal of waste
water
1.2.2.1P004 Water and
Sanitation
services
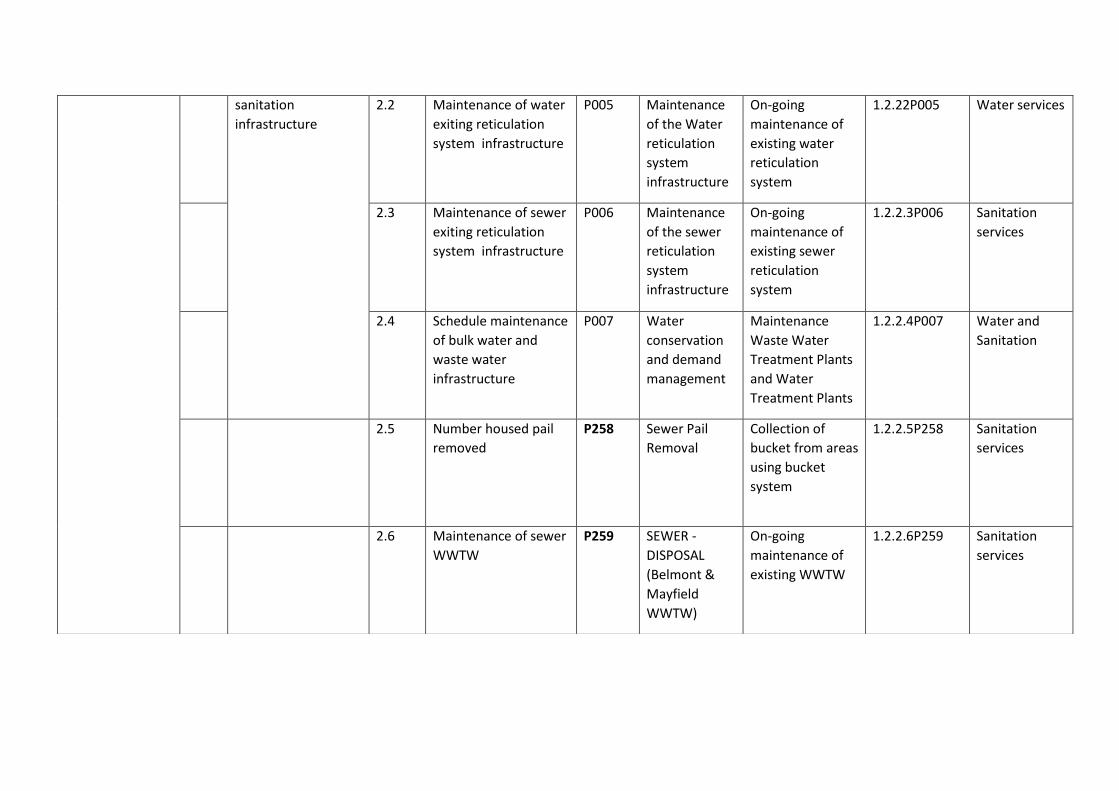
sanitation
infrastructure
2.2 Maintenance of water
exiting reticulation
system infrastructure
P005 Maintenance
of the Water
reticulation
system
infrastructure
On-going
maintenance of
existing water
reticulation
system
1.2.22P005 Water services
2.3 Maintenance of sewer
exiting reticulation
system infrastructure
P006 Maintenance
of the sewer
reticulation
system
infrastructure
On-going
maintenance of
existing sewer
reticulation
system
1.2.2.3P006 Sanitation
services
2.4 Schedule maintenance
of bulk water and
waste water
infrastructure
P007 Water
conservation
and demand
management
Maintenance
Waste Water
Treatment Plants
and Water
Treatment Plants
1.2.2.4P007 Water and
Sanitation
2.5 Number housed pail
removed
P258 Sewer Pail
Removal
Collection of
bucket from areas
using bucket
system
1.2.2.5P258 Sanitation
services
2.6 Maintenance of sewer
WWTW
P259 SEWER -
DISPOSAL
(Belmont &
Mayfield
WWTW)
On-going
maintenance of
existing WWTW
1.2.2.6P259 Sanitation
services
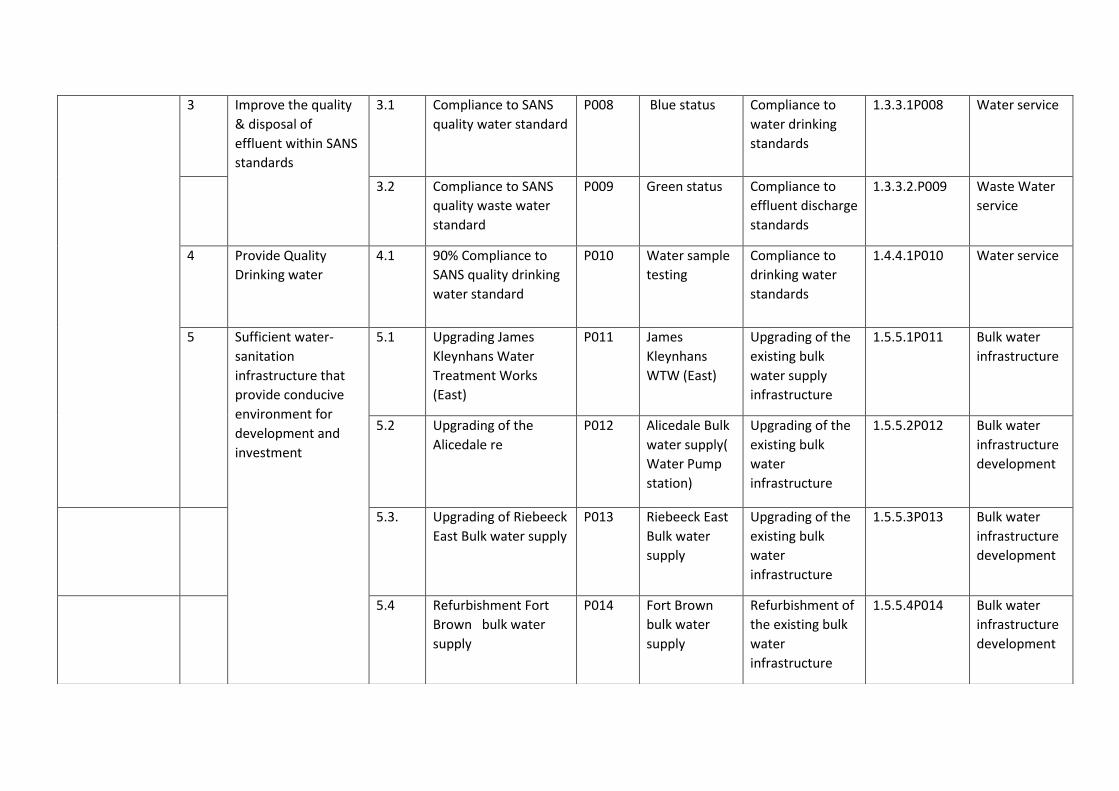
3 Improve the quality
& disposal of
effluent within SANS
standards
3.1 Compliance to SANS
quality water standard
P008 Blue status Compliance to
water drinking
standards
1.3.3.1P008 Water service
3.2 Compliance to SANS
quality waste water
standard
P009 Green status Compliance to
effluent discharge
standards
1.3.3.2.P009 Waste Water
service
4 Provide Quality
Drinking water
4.1 90% Compliance to
SANS quality drinking
water standard
P010 Water sample
testing
Compliance to
drinking water
standards
1.4.4.1P010 Water service
5 Sufficient water-
sanitation
infrastructure that
provide conducive
environment for
development and
investment
5.1 Upgrading James
Kleynhans Water
Treatment Works
(East)
P011 James
Kleynhans
WTW (East)
Upgrading of the
existing bulk
water supply
infrastructure
1.5.5.1P011 Bulk water
infrastructure
5.2 Upgrading of the
Alicedale re
P012 Alicedale Bulk
water supply(
Water Pump
station)
Upgrading of the
existing bulk
water
infrastructure
1.5.5.2P012 Bulk water
infrastructure
development
5.3. Upgrading of Riebeeck
East Bulk water supply
P013 Riebeeck East
Bulk water
supply
Upgrading of the
existing bulk
water
infrastructure
1.5.5.3P013 Bulk water
infrastructure
development
5.4 Refurbishment Fort
Brown bulk water
supply
P014 Fort Brown
bulk water
supply
Refurbishment of
the existing bulk
water
infrastructure
1.5.5.4P014 Bulk water
infrastructure
development

5.5 Refurbishment
Waainek Bulk Water
Supply
P015 Waainek Bulk
Water Supply
Refurbishment
of WT W
Waainek Bulk
Water Supply
Refurbishment
1.5.5.5.P015 Bulk water
infrastructure
development
5.6 Refurbishment
Howison’s Poort and
Settlers Dams
P016 Howison’s
Poort and
Settlers Dams
Refurbishment of
the existing bulk
water
infrastructure
1.5.5.6P016 Bulk water
infrastructure
development
5.7 Number of water
harvesting initiatives
provided
P017 Water
Harvesting
Provide
alternative basic
services facilities
1.5.5.7P017 Bulk water
infrastructure
development
5.8 Resuscitate boreholes
in rural areas
P018 Resuscitate
boreholes
Provide
alternative basic
services facilities
1.5.5.8P018 Bulk water
infrastructure
development
Sufficient water-
sanitation
infrastructure that
provide conducive
environment for
development and
investment
5.9 Number of KM/Meters
of reticulation lines
refurbished
P019 Water &
Waste Water
Infrastructure
Refurbishments
of Bulk & Sewer
Reticulation lines
1.5.5.9P019 Bulk water
infrastructure
development
5.10 Number of Pump
station and substation
refurbished
P020 Refurbishment
s of Bulk &
Sewer
Reticulation
lines, Pump
stations, and
Substations
Refurbishments
of Pump station
and Substation
1.5.5.10P020 Bulk water
infrastructure
development
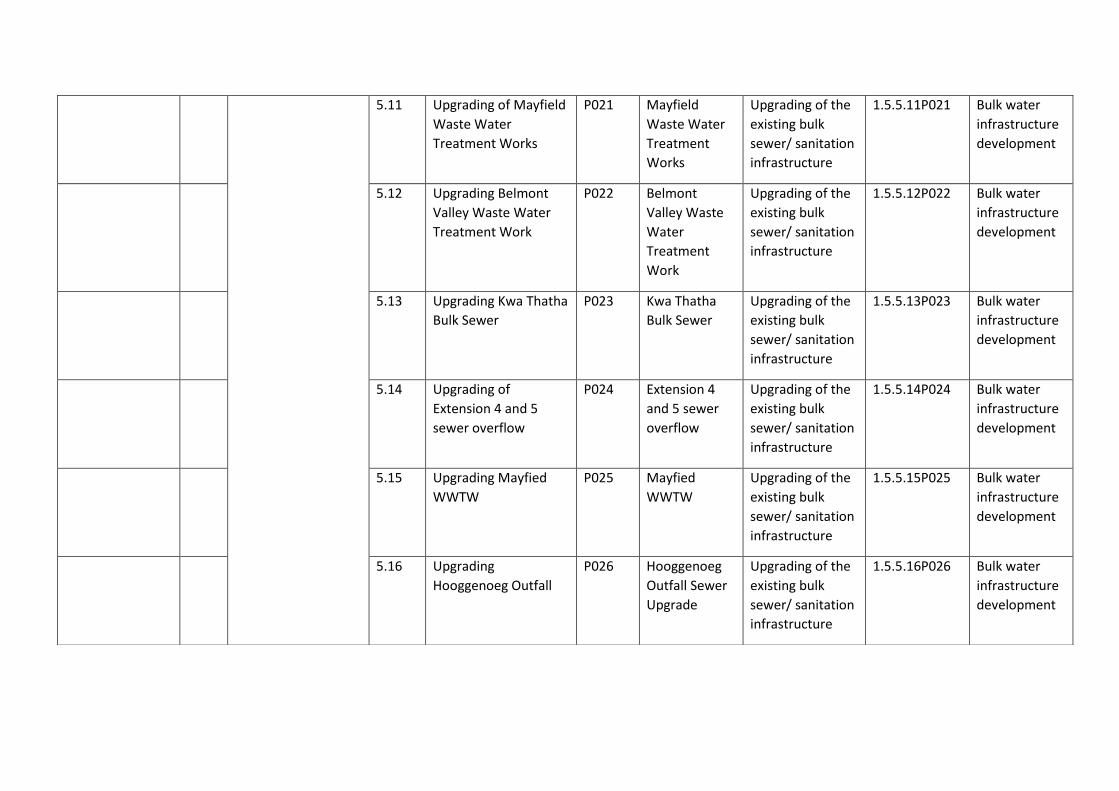
5.11 Upgrading of Mayfield
Waste Water
Treatment Works
P021 Mayfield
Waste Water
Treatment
Works
Upgrading of the
existing bulk
sewer/ sanitation
infrastructure
1.5.5.11P021 Bulk water
infrastructure
development
5.12 Upgrading Belmont
Valley Waste Water
Treatment Work
P022 Belmont
Valley Waste
Water
Treatment
Work
Upgrading of the
existing bulk
sewer/ sanitation
infrastructure
1.5.5.12P022 Bulk water
infrastructure
development
5.13 Upgrading Kwa Thatha
Bulk Sewer
P023 Kwa Thatha
Bulk Sewer
Upgrading of the
existing bulk
sewer/ sanitation
infrastructure
1.5.5.13P023 Bulk water
infrastructure
development
5.14 Upgrading of
Extension 4 and 5
sewer overflow
P024 Extension 4
and 5 sewer
overflow
Upgrading of the
existing bulk
sewer/ sanitation
infrastructure
1.5.5.14P024 Bulk water
infrastructure
development
5.15 Upgrading Mayfied
WWTW
P025 Mayfied
WWTW
Upgrading of the
existing bulk
sewer/ sanitation
infrastructure
1.5.5.15P025 Bulk water
infrastructure
development
5.16 Upgrading
Hooggenoeg Outfall
P026 Hooggenoeg
Outfall Sewer
Upgrade
Upgrading of the
existing bulk
sewer/ sanitation
infrastructure
1.5.5.16P026 Bulk water
infrastructure
development
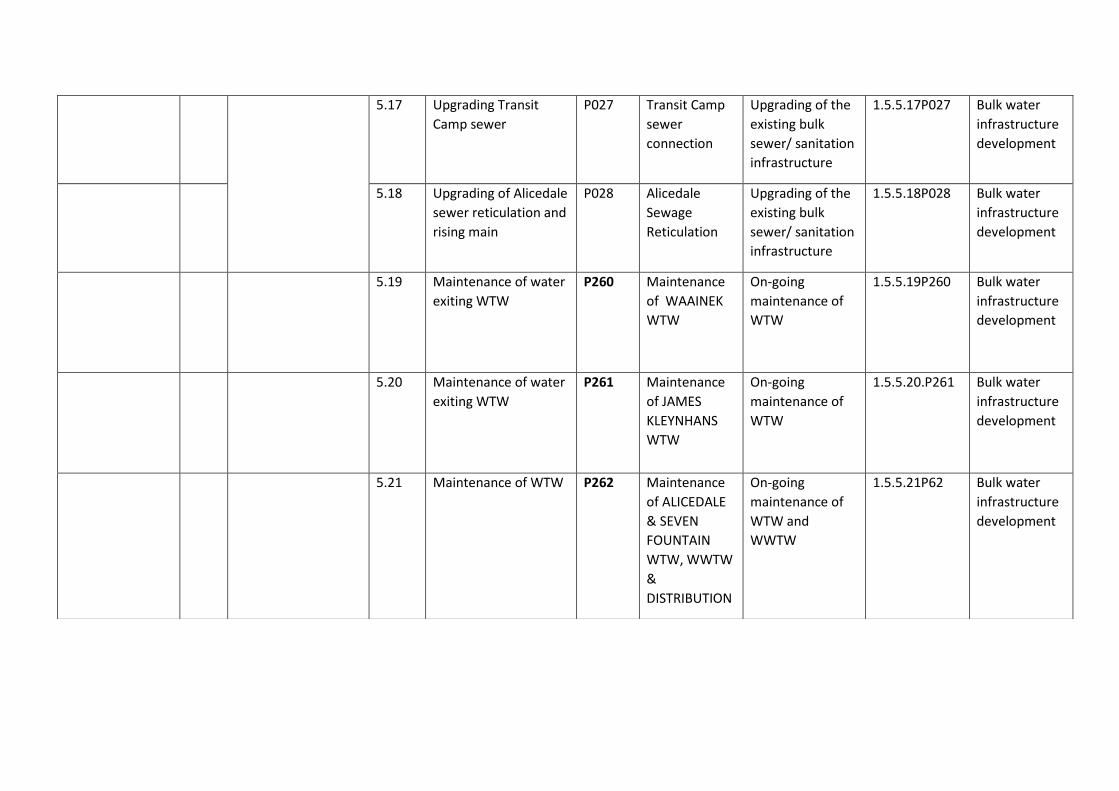
5.17 Upgrading Transit
Camp sewer
P027 Transit Camp
sewer
connection
Upgrading of the
existing bulk
sewer/ sanitation
infrastructure
1.5.5.17P027 Bulk water
infrastructure
development
5.18 Upgrading of Alicedale
sewer reticulation and
rising main
P028 Alicedale
Sewage
Reticulation
Upgrading of the
existing bulk
sewer/ sanitation
infrastructure
1.5.5.18P028 Bulk water
infrastructure
development
5.19 Maintenance of water
exiting WTW
P260 Maintenance
of WAAINEK
WTW
On-going
maintenance of
WTW
1.5.5.19P260 Bulk water
infrastructure
development
5.20 Maintenance of water
exiting WTW
P261 Maintenance
of JAMES
KLEYNHANS
WTW
On-going
maintenance of
WTW
1.5.5.20.P261 Bulk water
infrastructure
development
5.21 Maintenance of WTW P262 Maintenance
of ALICEDALE
& SEVEN
FOUNTAIN
WTW, WWTW
&
DISTRIBUTION
On-going
maintenance of
WTW and
WWTW
1.5.5.21P62 Bulk water
infrastructure
development

5.22 Maintenance of water
WTW
P263 Maintenance
of RIBEECK
EAST WTW &
DISTRIBUTION
On-going
maintenance of
WTW
1.5.5.22P263 Bulk water
infrastructure
development
6 Sufficient water-
sanitation
infrastructure that
provide conducive
environment for
development and
investment
6.1 Construction of
Riebeeck East Waste
Water Treatment
Works
P029 Riebeeck East
Waste Water
Treatment
Works
Provision of new
bulk sanitation
infrastructure
1.6.6.1P029 Water and
Sanitation
6.2 Installation of Sewer
reticulation RIEBEECK
EAST
P030 Sewer
reticulation
RIEBEECK EAST
Provision of new
bulk sanitation
infrastructure
1.6.6.2P030 Water and
Sanitation
6.3 Installation of Fort
Brown bulk sewer and
reticulation
P031 Fort Brown
bulk sewer
and
reticulation
Provision of new
bulk sanitation
infrastructure
1.6.6.3P031 Water and
Sanitation
6.4 Installation of Seven
Fountains bulk sewer
and reticulation
P032 Seven
Fountains
bulk sewer
and
reticulation
Provision of new
bulk sanitation
infrastructure
1.6.6.4P032 Water and
Sanitation
6.7 Installation of Salem
water and sanitation
infrastructure
P033 Salem water
and sanitation
infrastructure
Provision of new
bulk sanitation
infrastructure
1.6.6.7P033 Water and
Sanitation
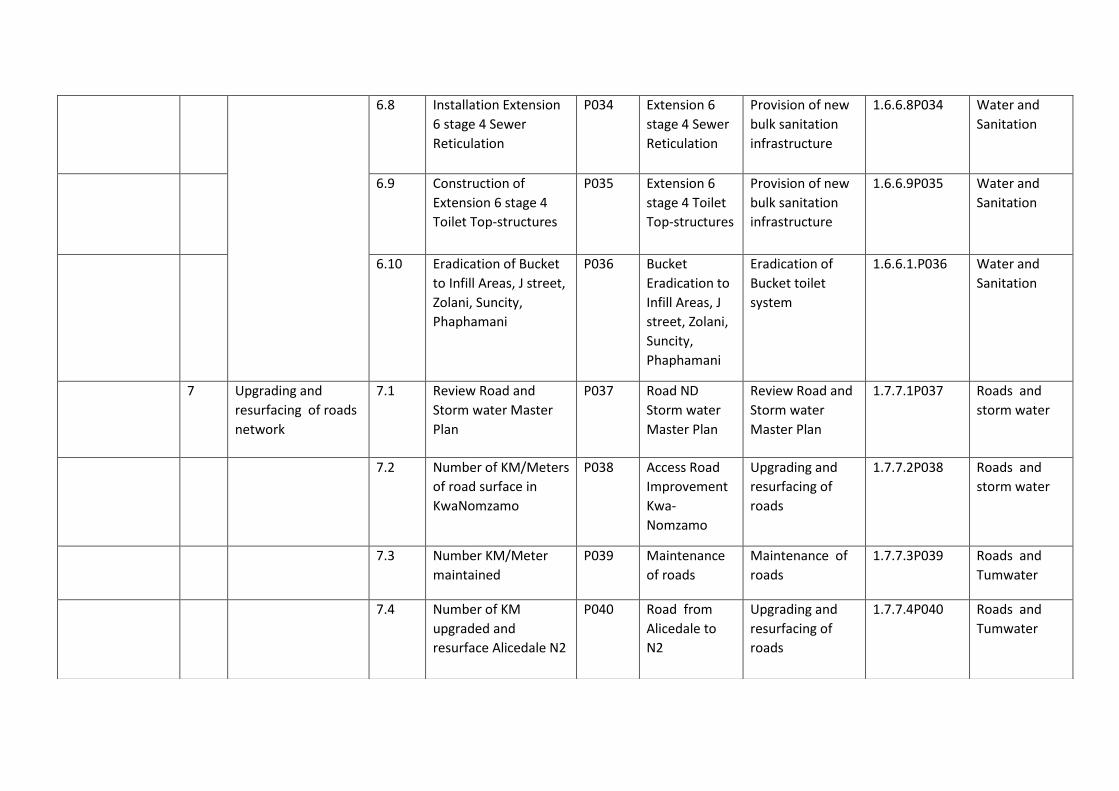
6.8 Installation Extension
6 stage 4 Sewer
Reticulation
P034 Extension 6
stage 4 Sewer
Reticulation
Provision of new
bulk sanitation
infrastructure
1.6.6.8P034 Water and
Sanitation
6.9 Construction of
Extension 6 stage 4
Toilet Top-structures
P035 Extension 6
stage 4 Toilet
Top-structures
Provision of new
bulk sanitation
infrastructure
1.6.6.9P035 Water and
Sanitation
6.10 Eradication of Bucket
to Infill Areas, J street,
Zolani, Suncity,
Phaphamani
P036 Bucket
Eradication to
Infill Areas, J
street, Zolani,
Suncity,
Phaphamani
Eradication of
Bucket toilet
system
1.6.6.1.P036 Water and
Sanitation
7 Upgrading and
resurfacing of roads
network
7.1 Review Road and
Storm water Master
Plan
P037 Road ND
Storm water
Master Plan
Review Road and
Storm water
Master Plan
1.7.7.1P037 Roads and
storm water
7.2 Number of KM/Meters
of road surface in
KwaNomzamo
P038 Access Road
Improvement
Kwa-
Nomzamo
Upgrading and
resurfacing of
roads
1.7.7.2P038 Roads and
storm water
7.3 Number KM/Meter
maintained
P039 Maintenance
of roads
Maintenance of
roads
1.7.7.3P039 Roads and
Tumwater
7.4 Number of KM
upgraded and
resurface Alicedale N2
P040 Road from
Alicedale to
N2
Upgrading and
resurfacing of
roads
1.7.7.4P040 Roads and
Tumwater

7.5 Number of KM
upgraded and
resurface Riebeeck
East to N1
P041 Road from
Riebeeck East
to N1
Upgrading and
resurfacing of
roads
1.7.7.5P041 Roads and
Tumwater
7.6 Number KM/Meters of
kerbs Upgrading and
resurfacing
P042 Number of
roads and
storm water
upgraded
Alicedale Roads
and Storm water
Improvements in
Transriviere and
Mandela Park
Phase 2
1.7.7.6P042 Roads and
Tumwater
7.7 Number of meters
Rehabilitation/resurfa
ce of Ncame Street
P043 Rehabilitation/
resurface of
Ncame Street
Rehabilitation
and resurfacing of
roads
1.7.7.7P043 Roads and
Tumwater
7.8 Number of meters in
resurfacing Joza Street
P044 Resurfacing
Joza Street
Upgrading and
resurfacing of
roads
1.7.7.8P044 Roads and
Tumwater
7.9 Number of KM/Meters
Upgrading of
stormwater
resurfacing of roads In
Transriviere
P045 Alicedale
Roads and
Storm water
Improvements
in Transriviere
and Mandela
Park
Upgrading of
storm water
resurfacing of
roads
1.7.7.9P045 Roads and
storm water
7.10 Number of KM/Meters
paved in all identifies
areas
P046 Paving of
roads
Upgrading of
roads
1.7.7.10P046 Roads and
Tumwater

8 Maintenance of
Storm water
channels
8.1 Number of meters
maintained Storm
water channel
P045 Maintenance
of storm water
channels
On-going
maintenance of
storm water
network
1.8.8.1P045 Storm water
A safe, efficient,
functioning
energy supply
infrastructure
that provide
conducive
environment for
investment
9 Efficient planning of
the energy supply
9.1 Development of
Electricity Master Plan
P046 Electricity
master plan
Development of
Electricity Master
Plan
1.9.9.1P046 Electricity
Planning
10 Ensure efficient
infrastructure and
reliable energy
supply
10.1 Review provision of
electricity to
Grahamstown east
P047 Review
provision of
electricity in
Grahamstown
East
Enhance revenue
for the
Municipality
1.10.10.1P047 Electricity
Planning
10.2 Report on the number
maintenance
undertook quarterly
P048 Maintenance
of the existing
electricity
reticulation
system
infrastructure
On-going
maintenance of
existing
infrastructure:
electricity
services
1.10.10.2P048 Operation and
maintenance
10.3 Report on the number
meters audit
conducted quarterly
P049 Meter audits Minimise
electricity losses
1.10.10.3P049 Operation and
maintenance
11 Adequate street-
lighting and
electrification of all
formal settlements
11.1 Number of high mast
installed or
maintained
P050 MAINT :
REPAIRS TO
HIGH MAST
LIGHTS
Installation high
mast or
maintenance
1.11.11.1P050 Street light
infrastructure
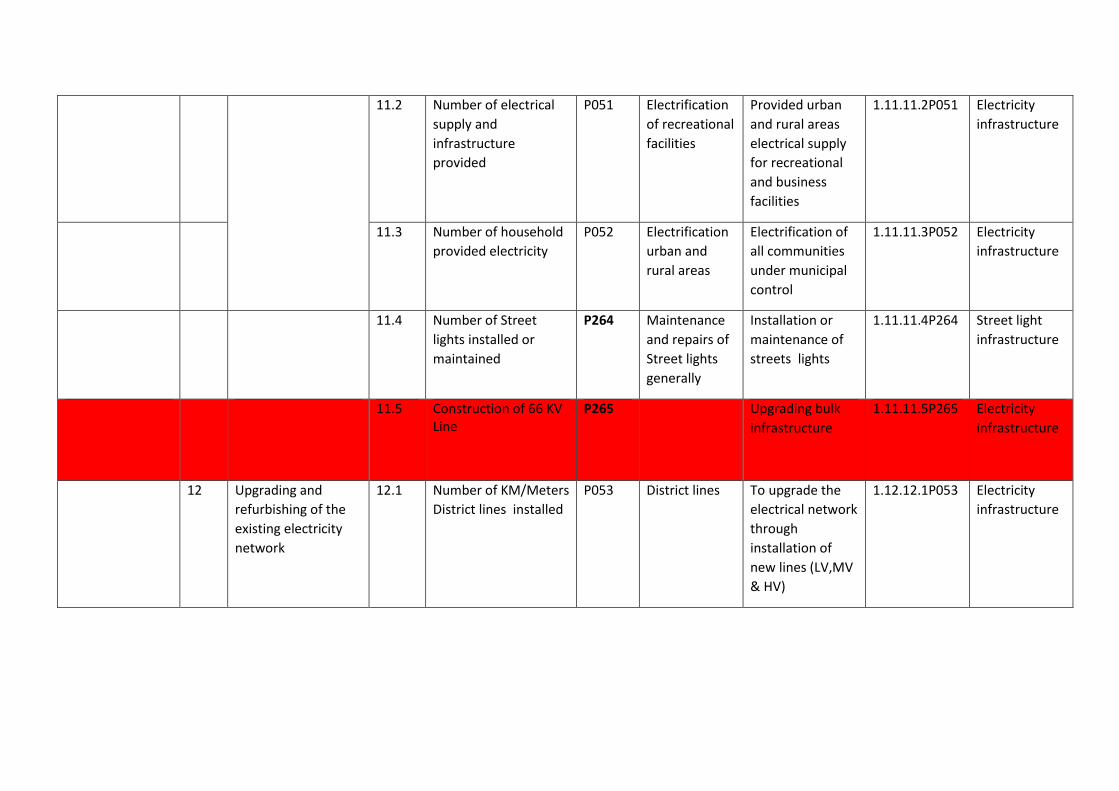
11.2 Number of electrical
supply and
infrastructure
provided
P051 Electrification
of recreational
facilities
Provided urban
and rural areas
electrical supply
for recreational
and business
facilities
1.11.11.2P051 Electricity
infrastructure
11.3 Number of household
provided electricity
P052 Electrification
urban and
rural areas
Electrification of
all communities
under municipal
control
1.11.11.3P052 Electricity
infrastructure
11.4 Number of Street
lights installed or
maintained
P264 Maintenance
and repairs of
Street lights
generally
Installation or
maintenance of
streets lights
1.11.11.4P264 Street light
infrastructure
11.5 Construction of 66 KV Line
P265
Upgrading bulk
infrastructure
1.11.11.5P265 Electricity
infrastructure
12 Upgrading and
refurbishing of the
existing electricity
network
12.1 Number of KM/Meters
District lines installed
P053 District lines To upgrade the
electrical network
through
installation of
new lines (LV,MV
& HV)
1.12.12.1P053 Electricity
infrastructure
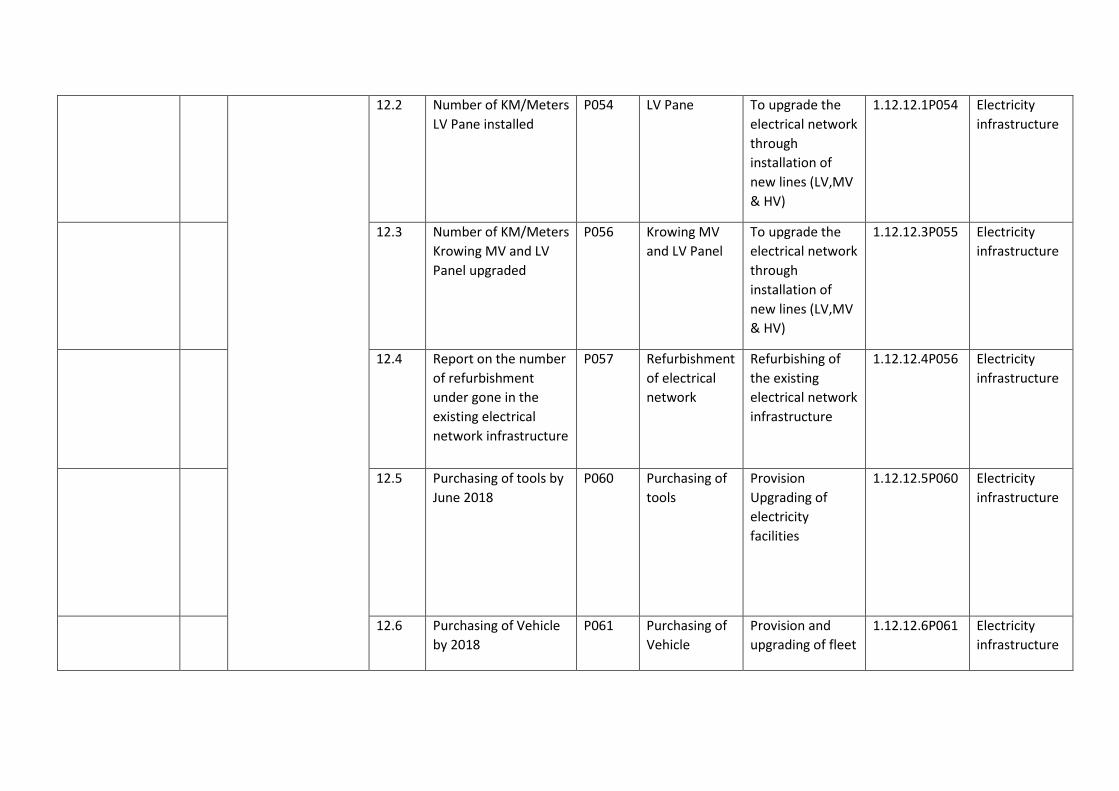
12.2 Number of KM/Meters
LV Pane installed
P054 LV Pane To upgrade the
electrical network
through
installation of
new lines (LV,MV
& HV)
1.12.12.1P054 Electricity
infrastructure
12.3 Number of KM/Meters
Krowing MV and LV
Panel upgraded
P056 Krowing MV
and LV Panel
To upgrade the
electrical network
through
installation of
new lines (LV,MV
& HV)
1.12.12.3P055 Electricity
infrastructure
12.4 Report on the number
of refurbishment
under gone in the
existing electrical
network infrastructure
P057 Refurbishment
of electrical
network
Refurbishing of
the existing
electrical network
infrastructure
1.12.12.4P056 Electricity
infrastructure
12.5 Purchasing of tools by
June 2018
P060 Purchasing of
tools
Provision
Upgrading of
electricity
facilities
1.12.12.5P060 Electricity
infrastructure
12.6 Purchasing of Vehicle
by 2018
P061 Purchasing of
Vehicle
Provision and
upgrading of fleet
1.12.12.6P061 Electricity
infrastructure
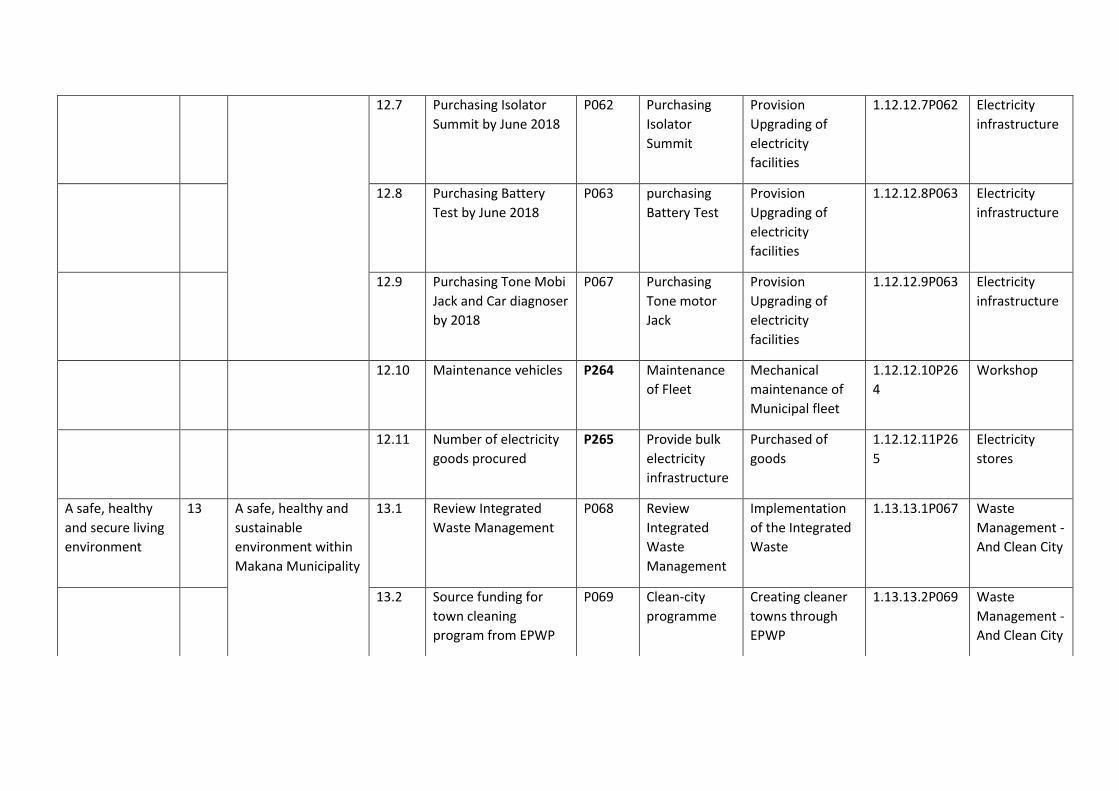
12.7 Purchasing Isolator
Summit by June 2018
P062 Purchasing
Isolator
Summit
Provision
Upgrading of
electricity
facilities
1.12.12.7P062 Electricity
infrastructure
12.8 Purchasing Battery
Test by June 2018
P063 purchasing
Battery Test
Provision
Upgrading of
electricity
facilities
1.12.12.8P063 Electricity
infrastructure
12.9 Purchasing Tone Mobi
Jack and Car diagnoser
by 2018
P067 Purchasing
Tone motor
Jack
Provision
Upgrading of
electricity
facilities
1.12.12.9P063 Electricity
infrastructure
12.10 Maintenance vehicles P264 Maintenance
of Fleet
Mechanical
maintenance of
Municipal fleet
1.12.12.10P26
4
Workshop
12.11 Number of electricity
goods procured
P265 Provide bulk
electricity
infrastructure
Purchased of
goods
1.12.12.11P26
5
Electricity
stores
A safe, healthy
and secure living
environment
13 A safe, healthy and
sustainable
environment within
Makana Municipality
13.1 Review Integrated
Waste Management
P068 Review
Integrated
Waste
Management
Implementation
of the Integrated
Waste
1.13.13.1P067 Waste
Management -
And Clean City
13.2 Source funding for
town cleaning
program from EPWP
P069 Clean-city
programme
Creating cleaner
towns through
EPWP
1.13.13.2P069 Waste
Management -
And Clean City

13.3 Expand Recycling and
composting
programme
P070 Recycling and
composting
project
Reduction of
waste through
expansion of
recycling and
composting
programme
1.13.13.3P070 Waste
Management -
And Clean City
13.4 Number of rural areas
received refusal of
collection service
P071 Provided
alternative
refuse
collection to
rural areas
Waste
Management -
And Clean City
1.13.13.4P071 Environment
and Cleansing
13.5 Acquisition of one
Tipper Truck by June
2018
P072 1 Acquisition
of Tipper
Truck
Provider of
adequate waste
management
facilities and
human resources
1.13.13.5P072 Waste
Management -
Sanitation
13.6 Acquisition of 1 Front
loader by June 2018
P073 1 Front loader Provider of
adequate waste
management
facilities and
human resources
1.13.13.6P073 Waste
Management -
Sanitation
13.7 Acquisition 4 x
Acquisition Containers
P074 4 x
Acquisition
Containers
Provide of
adequate waste
management
facilities and
human resources
1.13.13.7P074 Waste
Management -
Sanitation

13.8 Upgrading of landfill
waste site in Makana
P075 Upgrading of
landfill waste
site
Upgrading and
effective
management of
landfill waste site
1.13.13.8P075 Waste
Management -
And Clean City
13.9 Number of
Community education
and awareness
programmes
conducted
P076 Eradication of
illegal
dumping sites
Community
education and
awareness
programmes in
dealing Illegal
dumping
1.13.13.9P076 Waste
Management -
And Clean City
13.10 Number of areas,
domestic refuse
collected per week
P078 Domestic
refuse
collection
Clean-City 1.13.13.10P07
7
Waste
Management -
And Clean City
13.11 Number of ward
cleaner-up
programme quarterly
P079 Ward clean -
up Campaign
programme
Clean-City 1.13.13.11P07
9
Waste
Management -
And Clean City
To provide
economical and
appropriate
services for the
poor
14 Increase % of
households with
access to free basic
service
14.1 Report number of
indigent households
with access free basic
service quarterly
P080 Free basic
services
Annually report
on the % of
households with
accesses to free
basic services
1.14.14.1P080 FBS
14.2 Update indigent
register annually
P081 Annual review
of Indigent
register
Compilation of an
indigent register
and annual
updating of the
indigent register
1.14.14.2P081 FBS
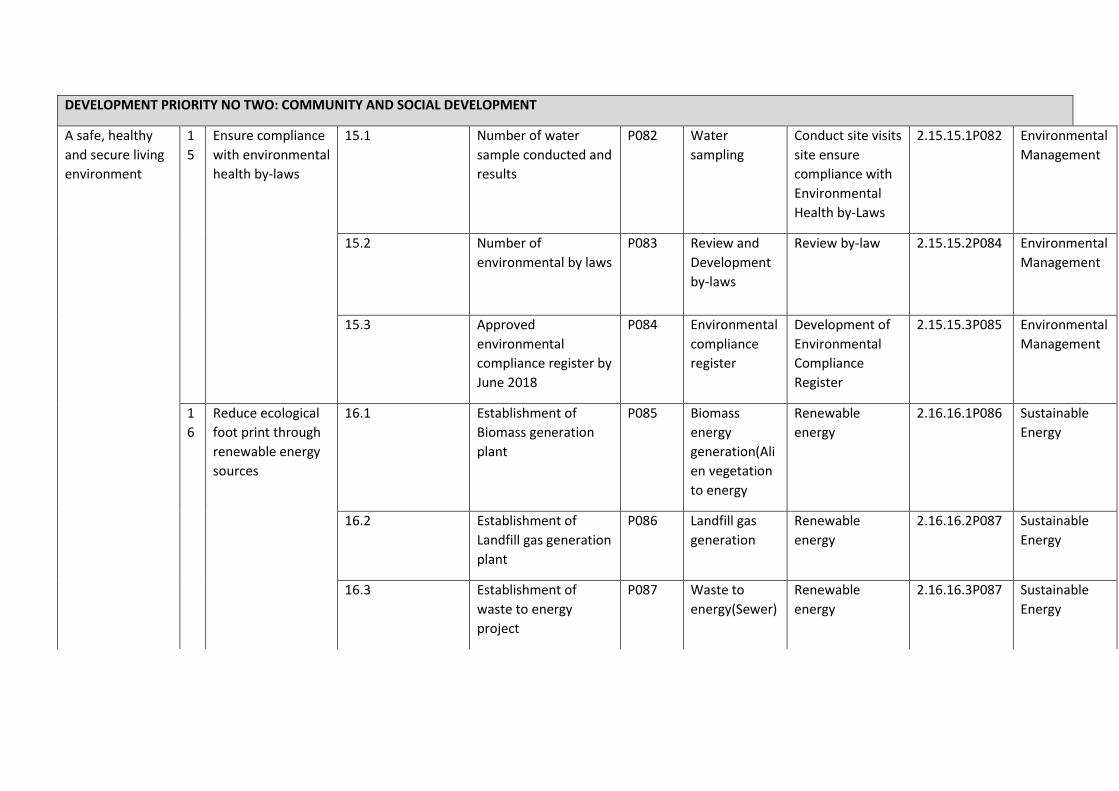
DEVELOPMENT PRIORITY NO TWO: COMMUNITY AND SOCIAL DEVELOPMENT
A safe, healthy
and secure living
environment
1
5
Ensure compliance
with environmental
health by-laws
15.1 Number of water
sample conducted and
results
P082 Water
sampling
Conduct site visits
site ensure
compliance with
Environmental
Health by-Laws
2.15.15.1P082 Environmental
Management
15.2 Number of
environmental by laws
P083 Review and
Development
by-laws
Review by-law 2.15.15.2P084 Environmental
Management
15.3 Approved
environmental
compliance register by
June 2018
P084 Environmental
compliance
register
Development of
Environmental
Compliance
Register
2.15.15.3P085 Environmental
Management
1
6
Reduce ecological
foot print through
renewable energy
sources
16.1 Establishment of
Biomass generation
plant
P085 Biomass
energy
generation(Ali
en vegetation
to energy
Renewable
energy
2.16.16.1P086 Sustainable
Energy
16.2 Establishment of
Landfill gas generation
plant
P086 Landfill gas
generation
Renewable
energy
2.16.16.2P087 Sustainable
Energy
16.3 Establishment of
waste to energy
project
P087 Waste to
energy(Sewer)
Renewable
energy
2.16.16.3P087 Sustainable
Energy

16.4 Establishment of Solar
photovoltaic energy
generation
P088 Solar
photovoltaic
energy
generation
Renewable
energy
2.16.16.4.P088 Sustainable
Energy
16.5 Establishment Small-
scale embedded
generation
P089 Small- scale
embedded
generation
Renewable
energy
2.16.16.5P089 Sustainable
Energy
16.6 Development of
Hydroelectricity
P090 Hydroelectricit
y
Renewable
energy
2.16.16.6.P090 Sustainable
Energy
16.7 Establishment
Municipal own energy
efficiency
P091 Efficiency in
municipal
buildings
Municipal own
energy efficiency
2.16.16.7P091 Sustainable
Energy
16.8 Establishment
Municipal own energy
efficiency street and
traffic light
P092 Street and
traffic lights
Municipal own
energy efficiency
2.16.16.8P092 Sustainable
Energy
16.9 Establishment Energy
efficiency in the water
sector
P093 Energy
efficiency in
the water
sector
Municipal own
energy efficiency
2.16.16.9P093 Sustainable
Energy
1610 Number of Solar
water heaters
Introducing
P094 Solar water
heaters (high
pressure) and
other energy
efficiency
interventions
Energy efficiency
in the economy
2.16.16.10P09
4
Sustainable
Energy
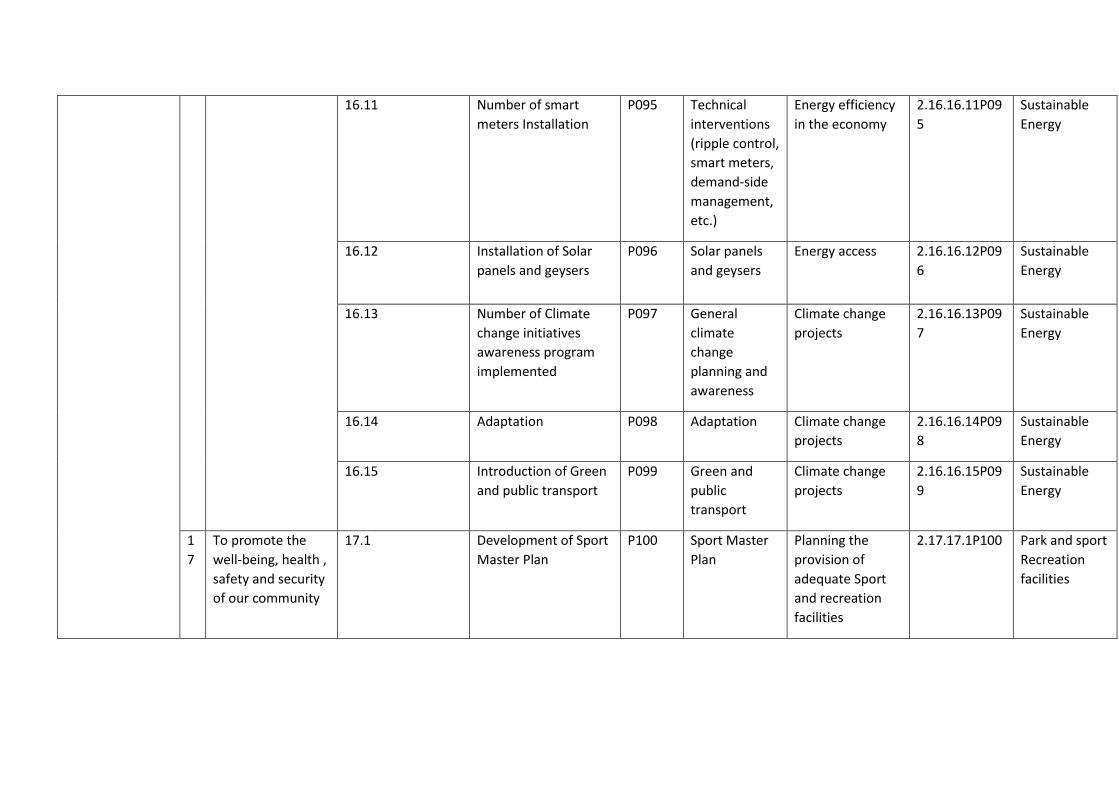
16.11 Number of smart
meters Installation
P095 Technical
interventions
(ripple control,
smart meters,
demand-side
management,
etc.)
Energy efficiency
in the economy
2.16.16.11P09
5
Sustainable
Energy
16.12 Installation of Solar
panels and geysers
P096 Solar panels
and geysers
Energy access 2.16.16.12P09
6
Sustainable
Energy
16.13 Number of Climate
change initiatives
awareness program
implemented
P097 General
climate
change
planning and
awareness
Climate change
projects
2.16.16.13P09
7
Sustainable
Energy
16.14 Adaptation P098 Adaptation Climate change
projects
2.16.16.14P09
8
Sustainable
Energy
16.15 Introduction of Green
and public transport
P099 Green and
public
transport
Climate change
projects
2.16.16.15P09
9
Sustainable
Energy
1
7
To promote the
well-being, health ,
safety and security
of our community
17.1 Development of Sport
Master Plan
P100 Sport Master
Plan
Planning the
provision of
adequate Sport
and recreation
facilities
2.17.17.1P100 Park and sport
Recreation
facilities

17.2 Report on the number
of sport facilities
maintained quarterly
P101 Maintenance
sport
facilities(Sport
fields)
Upgrading and
maintenance of
existing Sport
facilities
2.17.17.2P101 Park and sport
Recreation
facilities
17.3 Number of Children
park and sport
recreational facilities
established
P102 Children’s
Playpark and
sport
recreational
facilities
Provide adequate
Parks and sport
recreation
facilities
2.17.17.3P102 Park and sport
Recreation
facilities
17.4 Number of trees
planted area
P103 Tree Planting Tree Planting in
need areas
2.17.17.4P103 Park and
Recreation
facilities
17.5 Report on number of
recreational facilities
upgraded/maintained
per quarter
P104 Upgrading and
maintenance
of the existing
recreational
facilities
Maintenance and
upgrading of
existing parks,
recreation
facilities, open
space and street
verges
2.17.17.5P104 Park and
Recreation
facilities
17.6 Develop/Review by-
law on the control of
stray animal
P105 Review by law Control of stray
animals in
municipal area
2.17.17.6P105 Stray animals
17.7 Number of
Commonages cleared
alien vegetation
P106 Eradication of
alien
vegetation
Upgrading and
maintenance of
the Commonages
2.17.17.7P106 Commonage
Management
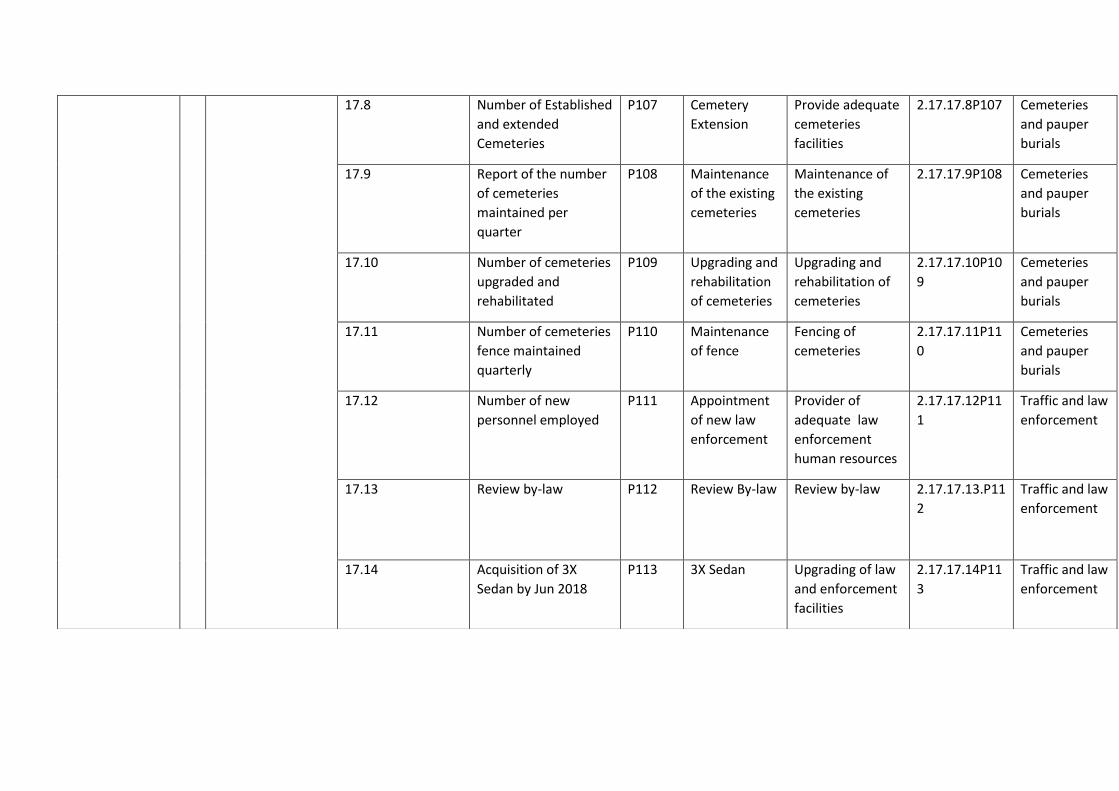
17.8 Number of Established
and extended
Cemeteries
P107 Cemetery
Extension
Provide adequate
cemeteries
facilities
2.17.17.8P107 Cemeteries
and pauper
burials
17.9 Report of the number
of cemeteries
maintained per
quarter
P108 Maintenance
of the existing
cemeteries
Maintenance of
the existing
cemeteries
2.17.17.9P108 Cemeteries
and pauper
burials
17.10 Number of cemeteries
upgraded and
rehabilitated
P109 Upgrading and
rehabilitation
of cemeteries
Upgrading and
rehabilitation of
cemeteries
2.17.17.10P10
9
Cemeteries
and pauper
burials
17.11 Number of cemeteries
fence maintained
quarterly
P110 Maintenance
of fence
Fencing of
cemeteries
2.17.17.11P11
0
Cemeteries
and pauper
burials
17.12 Number of new
personnel employed
P111 Appointment
of new law
enforcement
Provider of
adequate law
enforcement
human resources
2.17.17.12P11
1
Traffic and law
enforcement
17.13 Review by-law P112 Review By-law Review by-law 2.17.17.13.P11
2
Traffic and law
enforcement
17.14 Acquisition of 3X
Sedan by Jun 2018
P113 3X Sedan Upgrading of law
and enforcement
facilities
2.17.17.14P11
3
Traffic and law
enforcement
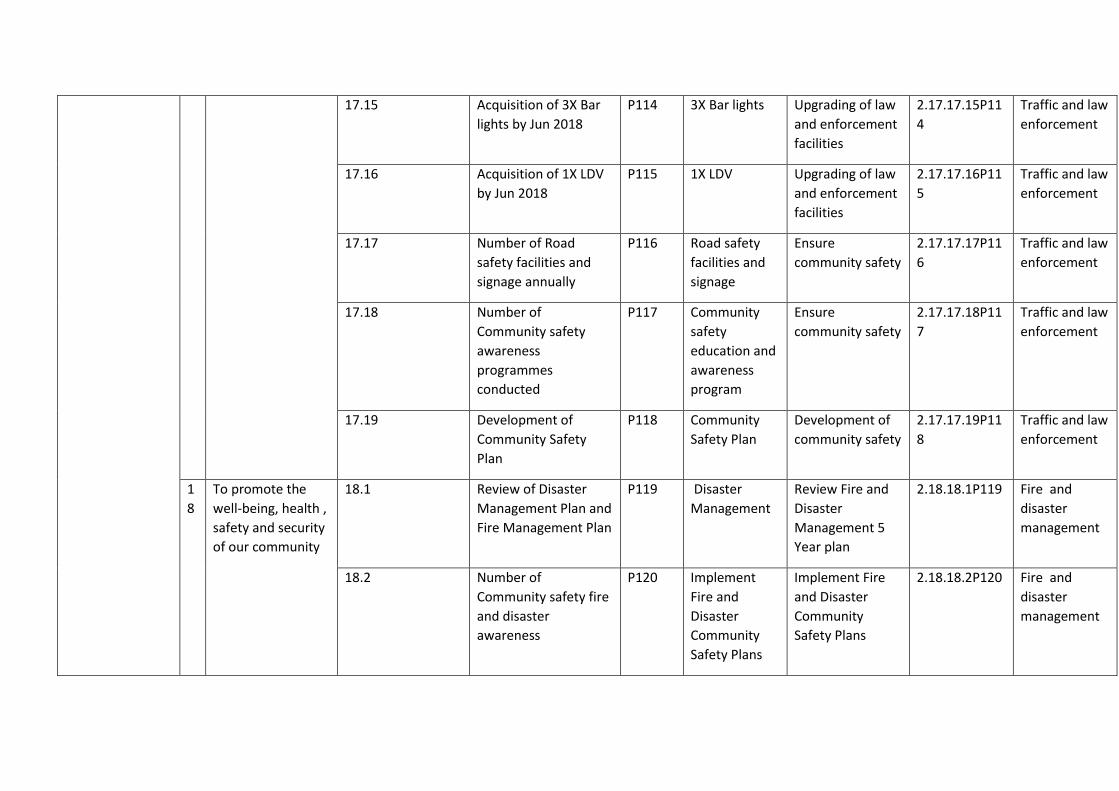
17.15 Acquisition of 3X Bar
lights by Jun 2018
P114 3X Bar lights Upgrading of law
and enforcement
facilities
2.17.17.15P11
4
Traffic and law
enforcement
17.16 Acquisition of 1X LDV
by Jun 2018
P115 1X LDV Upgrading of law
and enforcement
facilities
2.17.17.16P11
5
Traffic and law
enforcement
17.17 Number of Road
safety facilities and
signage annually
P116 Road safety
facilities and
signage
Ensure
community safety
2.17.17.17P11
6
Traffic and law
enforcement
17.18 Number of
Community safety
awareness
programmes
conducted
P117 Community
safety
education and
awareness
program
Ensure
community safety
2.17.17.18P11
7
Traffic and law
enforcement
17.19 Development of
Community Safety
Plan
P118 Community
Safety Plan
Development of
community safety
2.17.17.19P11
8
Traffic and law
enforcement
1
8
To promote the
well-being, health ,
safety and security
of our community
18.1 Review of Disaster
Management Plan and
Fire Management Plan
P119 Disaster
Management
Review Fire and
Disaster
Management 5
Year plan
2.18.18.1P119 Fire and
disaster
management
18.2 Number of
Community safety fire
and disaster
awareness
P120 Implement
Fire and
Disaster
Community
Safety Plans
Implement Fire
and Disaster
Community
Safety Plans
2.18.18.2P120 Fire and
disaster
management

programmes
conducted
18.3 Construction/Establish
Satellite Fires station
in Alicedale and
Riebeek East
P121 Satellite
station
Alicedale and
Riebeek East
Service
Improvement
Plan
2.18.18.3P121 Fire and
disaster
management
18.4 Development of Fire
By-law
P122 Development
Fire –By-law
Enhance revenue
from Fire services
2.18.18.4P122 Fire and
disaster
management
Access to basic
community
facilities
1
9
To provide reading
and study material
19.1 Number of new
material provided
learning
P123 Provide
libraries with
new material
Sources funding
or donation for
new material
2.19.19.1P123 Library
services
19.2 Number of community
programme
conducted per quarter
P124 Community
Outreach
programme
Community
education
support learning
programmes
2.19.19.2P124 Library
services
19.3 Establishment of
libraries to need areas
P125 Establishment
of Libraries
Provision of
library facilities to
need
communities
2.19.19.3P125 Library
services

DEVELOPMENT PRIORITY NO THREE:LOCAL ECONOMIC DEVELOMENT and RURAL DEVELOPMENT
Maximise
economic growth
and development
takes place in a
conducive
environment
20 To ensure
adherence to
town planning
and building
control
legislation
20.1 Review and adopt SDF
by June 2018
P126 Review Spatial
Development
Framework
(SDF)
Develop a
Uniform Zoning
Scheme)
3.20.20.1P126 Spatial
planning
20.2 Development of the
SPLUMA By-Law
P127 Township
Establishment
Implementation
of SPLUMA and
LUPA
3.20.20.2P127 Spatial
planning
20.3 Establishment of the
Tribunal and Appeals
Board
P128 Establishment
of SPLUMA
compliant
Planning
Tribunal
Establishment of
the Tribunal and
Appeals Board for
Land Use
Management
System
3.20.20.3P128 Spatial
planning
20.4 Upgrading Air filed P129 Air filed
development
Upgrading Air
filed
3.20.20.4P129 Spatial
planning
20.5 Conduct land audit P130 Land Audit Land
Audit/Evaluation
of land
3.20.20.5P130 Spatial
planning
20.6 Establishment of
Waste to Energy
P131 Waste to
Energy
Establishment of
Waste to Energy
3.20.20.6P131 Spatial
planning
20.7 Number of infill areas
approved for town
establishment
P132 Town
establishment
Facilitate Town
establishment
3.20.20.7P132 Spatial
planning

20.8 Establishment of east
commonage
P133 East
Commonage
Facilitate
establishment of
commonage
3.20.20.8P133 Spatial
planning
20.9 Review of the Sub
division, Rezoning and
Building control policy
P134 Rezoning and
Building and
building
control policy
Manage and
regulate the built
environment
3.20.20.9P134 Building
control
Maximise
economic growth
and development
takes place in a
conducive
environment
21 Promote and
support SMME
development
21.1 Establishment SMME
hub Business plan
P135 Establishment
SMME hub
Business plan
Development hub
Business plan of
new SMME, new
and start-up
business
3.21.21.1P135 SMME
Development
21.2 Number of hawker
stalls constructed
P136 Construction
hawker stalls
Create an
conducive
environment for
existing, hawker
2.21.21.3P136 SMME
Development
21.3 Hosting SMME
Seminars
P137 SMME
Seminars and
Expo
Provided
information for
existing, new and
start-up business
2.21.21.3P137 SMME
Development
21.4 Development of Trade
and Investment attract
Strategy
P138 Trade and
Investment
attract
Strategy
Develop an
strategy to attract
Trade and
Investment
3.21.21.4P138 Trade and
investment
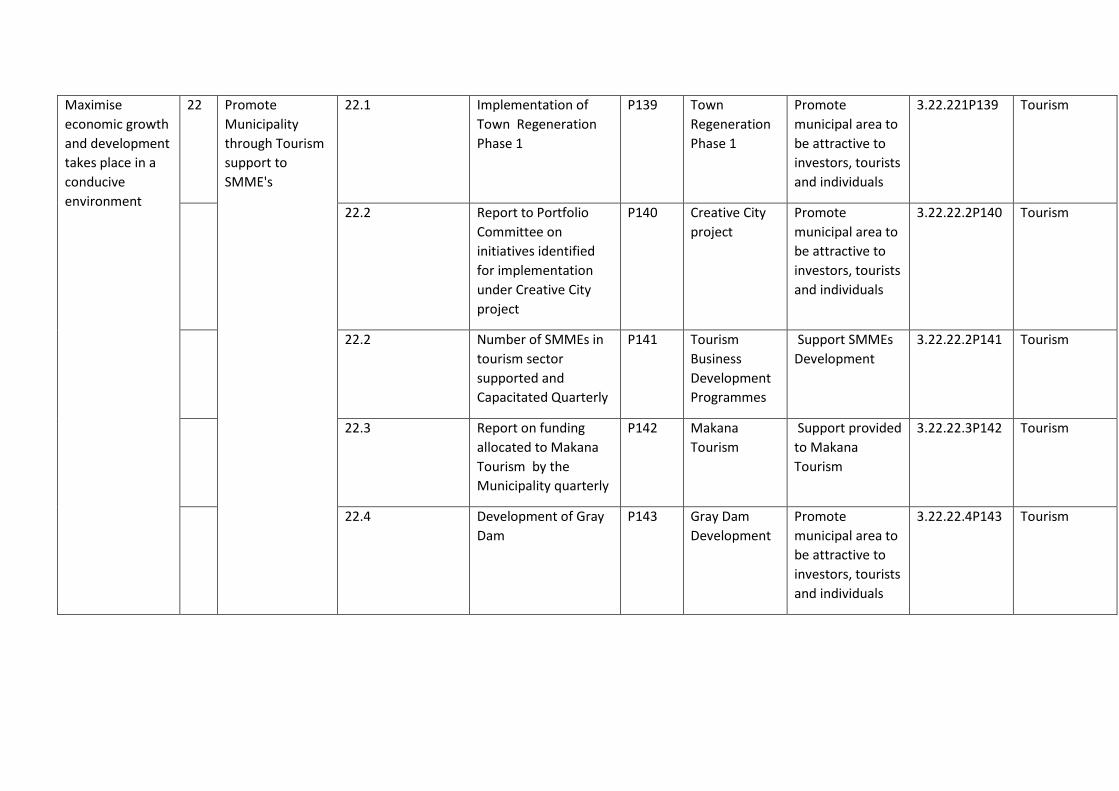
Maximise
economic growth
and development
takes place in a
conducive
environment
22 Promote
Municipality
through Tourism
support to
SMME's
22.1 Implementation of
Town Regeneration
Phase 1
P139 Town
Regeneration
Phase 1
Promote
municipal area to
be attractive to
investors, tourists
and individuals
3.22.221P139 Tourism
22.2 Report to Portfolio
Committee on
initiatives identified
for implementation
under Creative City
project
P140 Creative City
project
Promote
municipal area to
be attractive to
investors, tourists
and individuals
3.22.22.2P140 Tourism
22.2 Number of SMMEs in
tourism sector
supported and
Capacitated Quarterly
P141 Tourism
Business
Development
Programmes
Support SMMEs
Development
3.22.22.2P141 Tourism
22.3 Report on funding
allocated to Makana
Tourism by the
Municipality quarterly
P142 Makana
Tourism
Support provided
to Makana
Tourism
3.22.22.3P142 Tourism
22.4 Development of Gray
Dam
P143 Gray Dam
Development
Promote
municipal area to
be attractive to
investors, tourists
and individuals
3.22.22.4P143 Tourism
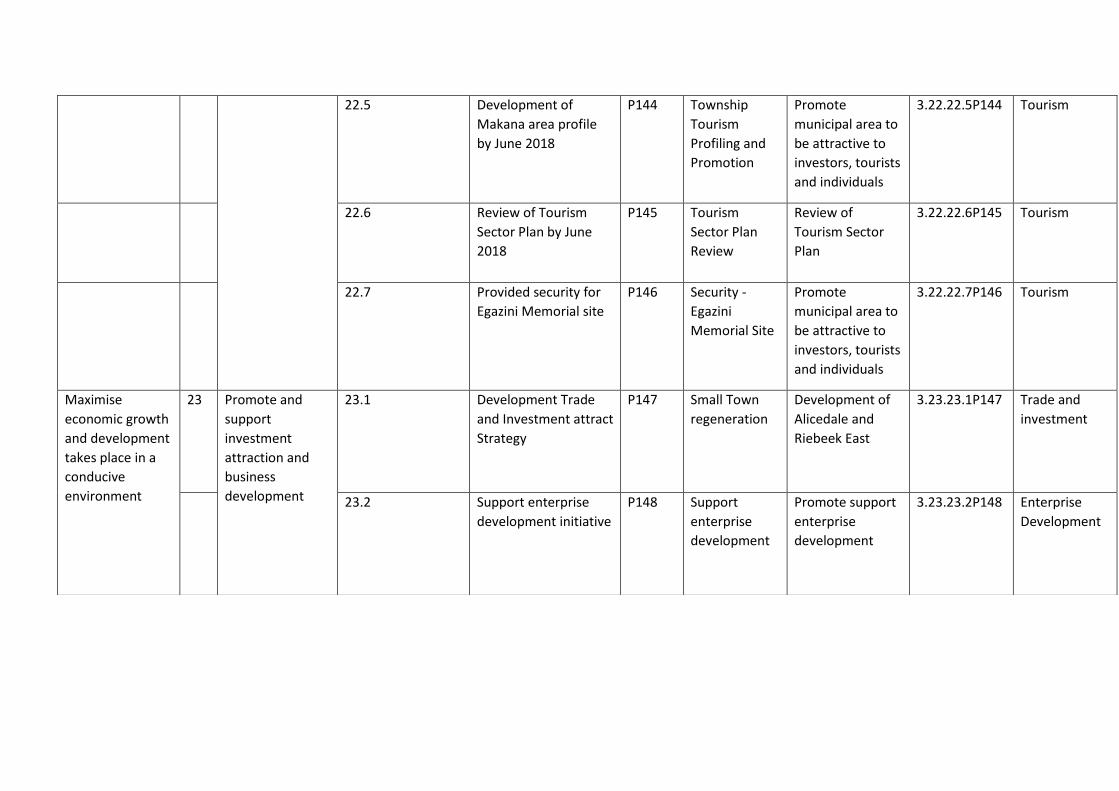
22.5 Development of
Makana area profile
by June 2018
P144 Township
Tourism
Profiling and
Promotion
Promote
municipal area to
be attractive to
investors, tourists
and individuals
3.22.22.5P144 Tourism
22.6 Review of Tourism
Sector Plan by June
2018
P145 Tourism
Sector Plan
Review
Review of
Tourism Sector
Plan
3.22.22.6P145 Tourism
22.7 Provided security for
Egazini Memorial site
P146 Security -
Egazini
Memorial Site
Promote
municipal area to
be attractive to
investors, tourists
and individuals
3.22.22.7P146 Tourism
Maximise
economic growth
and development
takes place in a
conducive
environment
23 Promote and
support
investment
attraction and
business
development
23.1 Development Trade
and Investment attract
Strategy
P147 Small Town
regeneration
Development of
Alicedale and
Riebeek East
3.23.23.1P147 Trade and
investment
23.2 Support enterprise
development initiative
P148 Support
enterprise
development
Promote support
enterprise
development
3.23.23.2P148 Enterprise
Development
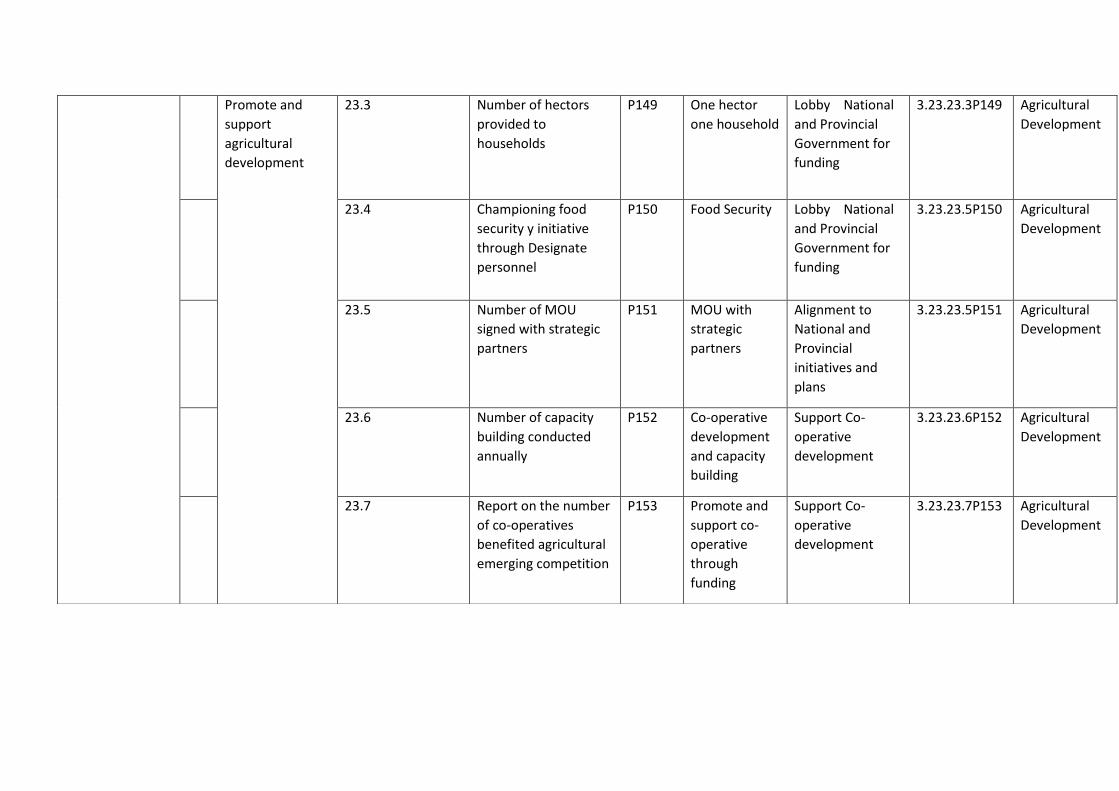
Promote and
support
agricultural
development
23.3 Number of hectors
provided to
households
P149 One hector
one household
Lobby National
and Provincial
Government for
funding
3.23.23.3P149 Agricultural
Development
23.4 Championing food
security y initiative
through Designate
personnel
P150 Food Security Lobby National
and Provincial
Government for
funding
3.23.23.5P150 Agricultural
Development
23.5 Number of MOU
signed with strategic
partners
P151 MOU with
strategic
partners
Alignment to
National and
Provincial
initiatives and
plans
3.23.23.5P151 Agricultural
Development
23.6 Number of capacity
building conducted
annually
P152 Co-operative
development
and capacity
building
Support Co-
operative
development
3.23.23.6P152 Agricultural
Development
23.7 Report on the number
of co-operatives
benefited agricultural
emerging competition
P153 Promote and
support co-
operative
through
funding
Support Co-
operative
development
3.23.23.7P153 Agricultural
Development
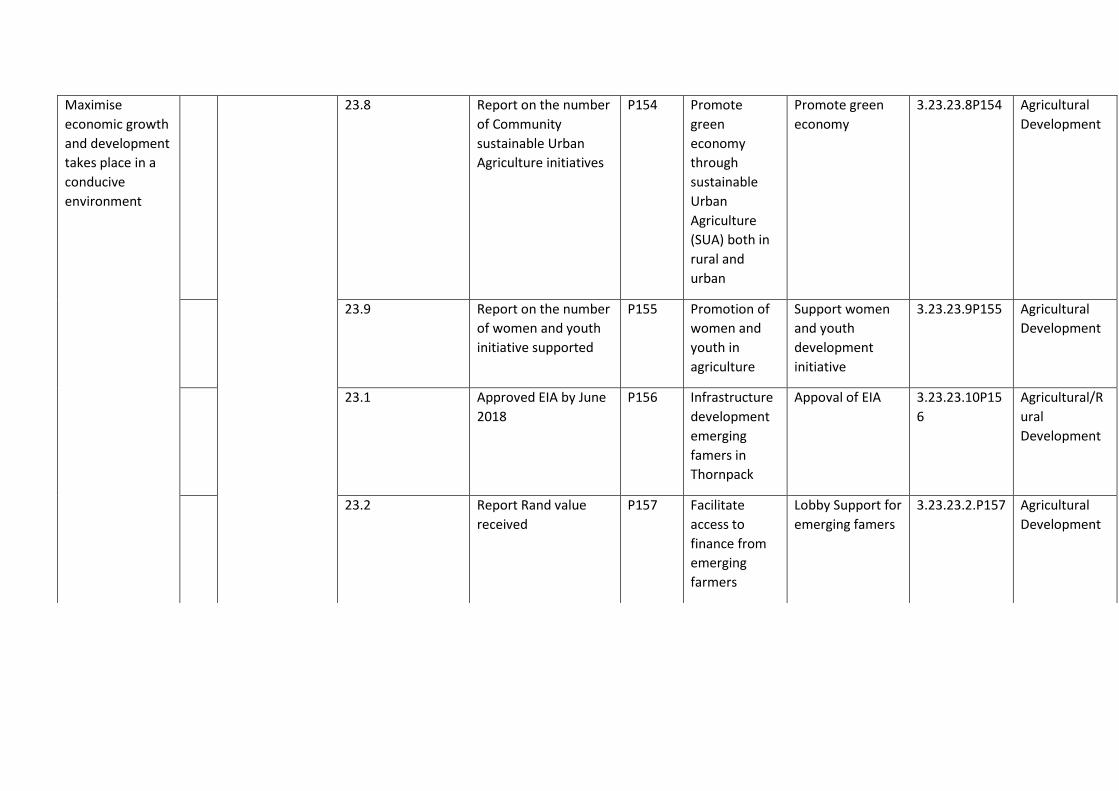
Maximise
economic growth
and development
takes place in a
conducive
environment
23.8 Report on the number
of Community
sustainable Urban
Agriculture initiatives
P154 Promote
green
economy
through
sustainable
Urban
Agriculture
(SUA) both in
rural and
urban
Promote green
economy
3.23.23.8P154 Agricultural
Development
23.9 Report on the number
of women and youth
initiative supported
P155 Promotion of
women and
youth in
agriculture
Support women
and youth
development
initiative
3.23.23.9P155 Agricultural
Development
23.1 Approved EIA by June
2018
P156 Infrastructure
development
emerging
famers in
Thornpack
Appoval of EIA 3.23.23.10P15
6
Agricultural/R
ural
Development
23.2 Report Rand value
received
P157 Facilitate
access to
finance from
emerging
farmers
Lobby Support for
emerging famers
3.23.23.2.P157 Agricultural
Development

Maximise
economic growth
and development
takes place in a
conducive
environment
2020
23.3 Report the progress
made in mentorship
programme Quarterly
P158 Mentorship
programme
Support emerging
famers
3.23.23.3P158 Agricultural
Development
23.4 Number of Rural ward
forum established
P159 Rural
development
ward forum
Support rural
communities
3.23.23.4.P159 Agricultural
Development
24 Promote job
creation
initiatives
24.1 Number of Job
opportunities created
through CWP
P160 Facilitate CWP Job Creation
Project
3.24.24.1P160 Local
Economic
development
24.2 Number of Job
opportunities created
through EPWP
P161 Facilitate
EPWP
Job Creation
Project
3.24.24.2P161 Municipal
Manager
DEVELOPMENT PRIORITY NO FOUR: INSTITUTIONAL DEVELOPMENT FINANCIAL MANAGEMENT
An effective
productive
administration
capable of
sustainable
service delivery
25 To ensure a good
relationship
between
management and
employees
through regular
interactions on
labour issues
25.1 Number of LLF
meeting hosted
annually and
Roadshows and staff
briefing
P162 Quarterly LLF
Meetings,
Conduct Hr
Roadshows &
staff brief
quarterly.
Functional LLF
meetings
quarterly
4.25.25.1P162 Human
Resource
Management
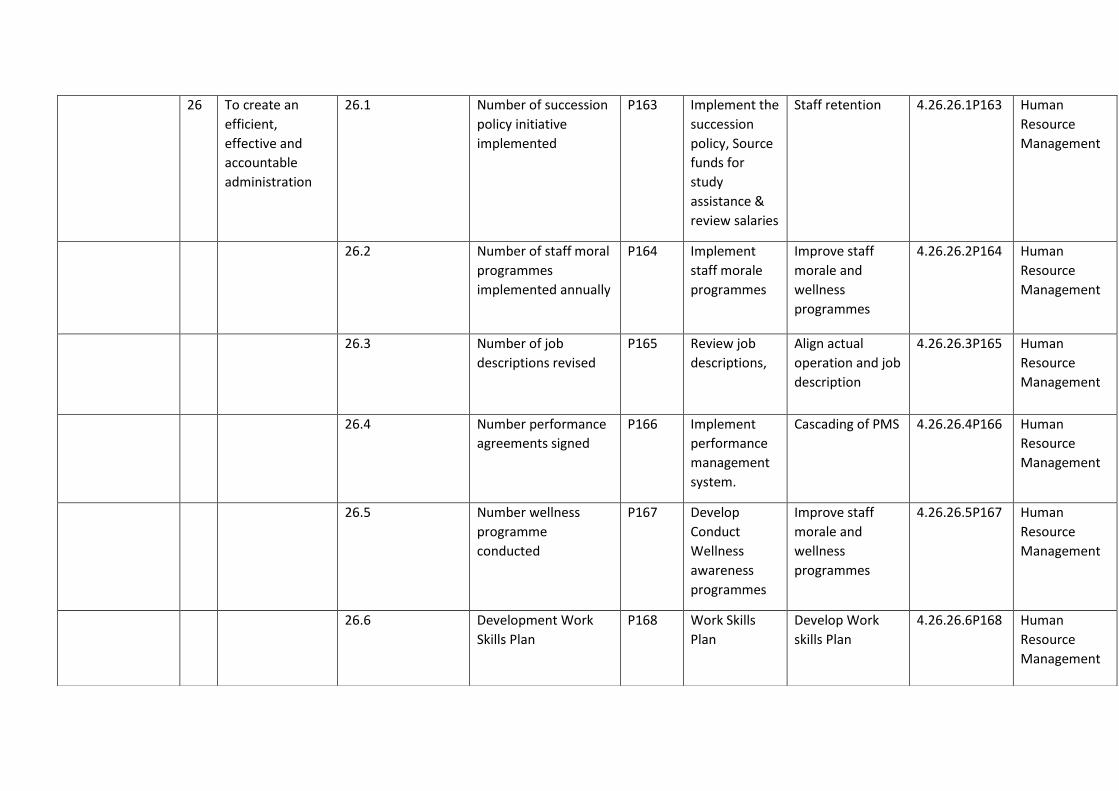
26 To create an
efficient,
effective and
accountable
administration
26.1 Number of succession
policy initiative
implemented
P163 Implement the
succession
policy, Source
funds for
study
assistance &
review salaries
Staff retention 4.26.26.1P163 Human
Resource
Management
26.2 Number of staff moral
programmes
implemented annually
P164 Implement
staff morale
programmes
Improve staff
morale and
wellness
programmes
4.26.26.2P164 Human
Resource
Management
26.3 Number of job
descriptions revised
P165 Review job
descriptions,
Align actual
operation and job
description
4.26.26.3P165 Human
Resource
Management
26.4 Number performance
agreements signed
P166 Implement
performance
management
system.
Cascading of PMS 4.26.26.4P166 Human
Resource
Management
26.5 Number wellness
programme
conducted
P167 Develop
Conduct
Wellness
awareness
programmes
Improve staff
morale and
wellness
programmes
4.26.26.5P167 Human
Resource
Management
26.6 Development Work
Skills Plan
P168 Work Skills
Plan
Develop Work
skills Plan
4.26.26.6P168 Human
Resource
Management

26.7 Conduct skill audit P169 Conduct skills
audit
Implementation
of the Workplace
Skills Plan
4.26.26.7P169 Human
Resource
Management
26.8 Number of employees
assisted
P170 Employee
assistance
Implementation
of the Workplace
Skills Plan
4.26.26.8P170 Human
Resource
Management
26.9 Number of Bursaries
issued annually
P171 Municipal
Bursaries
Issuing of
bursaries to need
student
4.26.26.9P171 Human
Resource
Management
26.10 Quarterly reports on
EE plan
implementation.
Submission of annual
report
P172 implementatio
n Employment
Equity Plan
To develop and
implement the
employment
equity plan as per
the set targets in
accordance with
the Employment
Equity Act
4.26.26.10P17
2
Human
Resource
Management
26.11 Fill vacant post with
three month
P173 Improve
recruitment
and selection
rate
Improve
recruitment and
selection
4.26.26.11P17
3
Human
Resource
Management
27 Effective
organisational
design and policy
development
27.1 Annual Review of
Organogram
P174 Review of
organogram
Review of
organisational
structure
Annually
4.27.27.12P17
4
Organisational
Design

27.2 Evaluate all job
description by June
2018
P175 Job Evaluation Job description
evaluation
4.27.27.2P175 Human
Resource
Management
27.3 Number of roadshows
conducted
P176 HR Policy Road
Shows
HR Policy
development and
revision
4.27.27.3P176 Human
Resource
Management
28 To ensure that all
Municipal
buildings and
staff adhere to
and implement
OHS
28.1 Number of OHS
meetings quarterly
P177 4 OHS
meetings.
Quarterly
reports on
adherence of
staff and
buildings to
OHS. Annual
OHS
awareness
campaign
Implementation
Occupational
Health and Safety
Plan
4.28.28.1P177 Human
Resource
Management
29 To ensure
effective
management of
staff through
internal controls
such as policies
29.1 Number of report
issued on adherence
with HR policies
P178 Quarterly
reports on
adherence to
HR policies
such as leave,
recruitment
etc.
Effective
implementation
of HR Policies
such leave
4.29.29.1P178 Human
Resource
Management
30 To ensure a
continually
secure, effective
30.1 Review of ICT Strategic
Plan annually
P179 Review of ICT
Strategic Plan
Implementation
of ICT Strategic
Plan
4.30.30.1P179 Information
Communicatio
n Technology
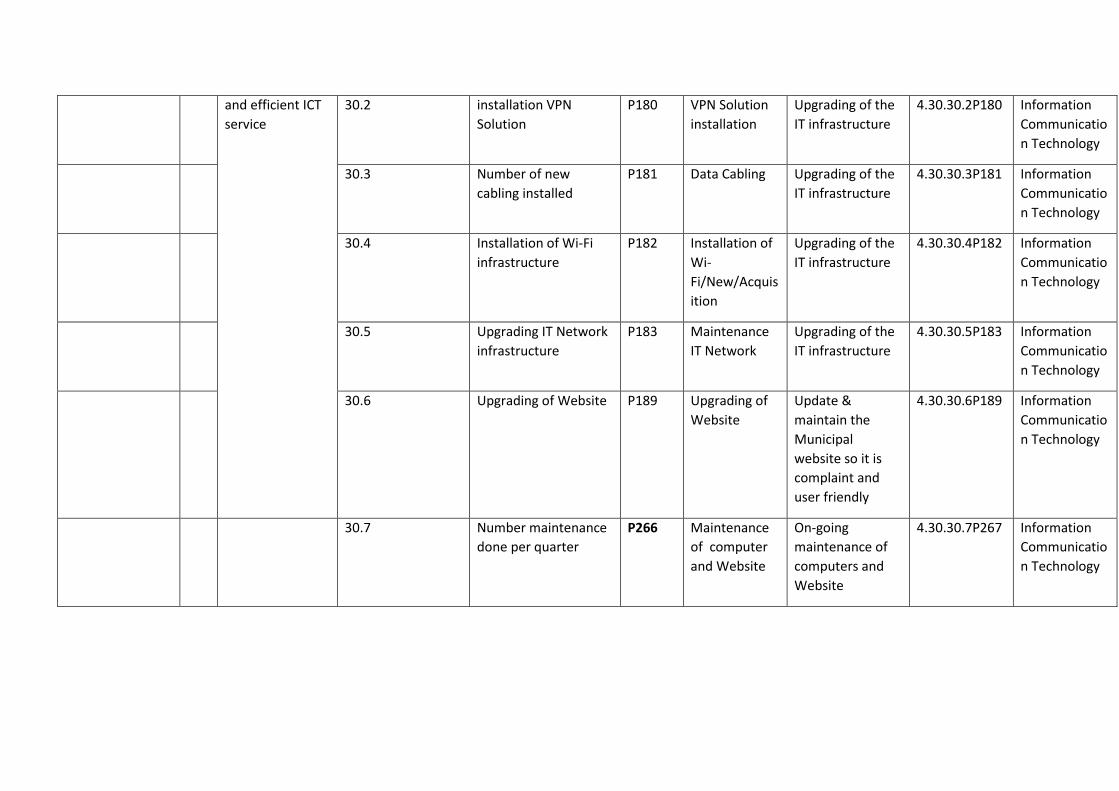
and efficient ICT
service
30.2 installation VPN
Solution
P180 VPN Solution
installation
Upgrading of the
IT infrastructure
4.30.30.2P180 Information
Communicatio
n Technology
30.3 Number of new
cabling installed
P181 Data Cabling Upgrading of the
IT infrastructure
4.30.30.3P181 Information
Communicatio
n Technology
30.4 Installation of Wi-Fi
infrastructure
P182 Installation of
Wi-
Fi/New/Acquis
ition
Upgrading of the
IT infrastructure
4.30.30.4P182 Information
Communicatio
n Technology
30.5 Upgrading IT Network
infrastructure
P183 Maintenance
IT Network
Upgrading of the
IT infrastructure
4.30.30.5P183 Information
Communicatio
n Technology
30.6 Upgrading of Website P189 Upgrading of
Website
Update &
maintain the
Municipal
website so it is
complaint and
user friendly
4.30.30.6P189 Information
Communicatio
n Technology
30.7 Number maintenance
done per quarter
P266 Maintenance
of computer
and Website
On-going
maintenance of
computers and
Website
4.30.30.7P267 Information
Communicatio
n Technology

31 To ensure that
disaster recovery
plans are fully
implemented
31.1 Review and Update
disaster recovery
plans
P190 Review and
Update
disaster
recovery plans
Secure ITC
Records and
information
4.31.31.1P190 Information
Communicatio
n Technology
32 To ensure that
the Municipality
moves towards e
governance -
32.1 Number of councillors
capacitated on use
computer
P191 Paper less
project
Capacitate
Councillor to
Computer for
meetings
4.32.32.1P191 Information
Communicatio
n Technology
33 Effective and
efficient
administration
33.1 Number of compliance
received and resolve
P192 Development
Customer care
management
system
Improve
Customer care
Client Services
4.33.33.1P192 Administration
33.2 Number of quarter
newsletter issued
annually
P193 Quarterly
news letter
Newsletter 4.33.33.2P193 Media and
communicatio
n
33.3 Number of corporate
branding implemented
P194 Corporate
Branding
Marketing of the
Municipality
4.33.33.3P194 Media and
communicatio
n
34 Ensure maximum
use of record
centre
34.1 Report quarterly on
the number of media
and communication
activities
P195 Review Policy
and Procedure
Media and
communication
4.34.34.1P195 Media and
communicatio
n

34.2 Review of Fillings
System
P196 Review and
approved
Fillings System
Establish a fully
functional unit
4.34.34.2P196 Records and
Archives
Management
34.3 Number staff
capacitated on record
management
P197 Capacity
Building and
Training
Capacity Building
and Training
4.34.34.3P197 Records and
Archives
Management
34.4 Number of
Terminated records
Disposed
P198 Disposal of
Terminated
Records
Disposal of
records
4.34.34.4P198 Records and
Archives
Management
34.5 Re-Introduce
electronic
management system
P199 Re- establish
Electronic
Records
Management
System
Fully functional
electronic
document system
4.34.34.5P199 Records and
Archives
Management
34.6 Establishment of off-
site Records storage
P200 Off-site
Records
storage
Establishment of
off-site Records
storage facility
4.34.34.6P200 Records and
Archives
Management
34.7 Reduce legal cost on
litigation against
Municipality
P201 Legal Charges:
Litigation
against
Makana
Litigation: Against
Makana
4.34.34.8P201 Legal Service
34.8 Reduce legal cost on
litigation by
Municipality
P202 Legal Charges:
Litigation by
Makana
Litigation: By
Makana
4.34.34.8P202 Legal Service

34.9 Reduce legal cost on
legal options
Municipality
P203 Legal Charges:
Legal options
by Makana
Legal Option 4.34.34.9P203 Legal Service
An open
transparent
corruption free
and responsive
Municipality
35 To ensure that a
system of
Institutional and
individual
performance
management
system is
implemented by
2022
35.1 Number of
performance report
P204 Quarterly/Ann
ual
Performance
Reporting
Quarter
performance
report
4.34.35.1P204 Performance
management
35.2 Number of validation
performance report
P205 Quarterly/Ann
ual
Performance
Validation
Performance
information audit
4.35.35.2P205 Performance
management
35.3 Review of the
Performance
Management Policy
annually
P206 Review of the
Performance
Management
Policy
Review of the
Performance
Management
Policy
4.35.35.3P206 Performance
management
35.4 Number of
performance
conducted
quarterly/Annually
P207 Quarterly/Ann
ual
Performance
evaluation
Quarterly/Annual
performance
evaluation
4.35.35.4P207 Performance
management
35.5 Re-Introduce
Automated electronic
PMS
P208 Automated
Performance
Management
System
Implementation
of Automated
electronic PMS
4.35.35.5P208 Performance
management

35.6 Cascading PMS to all
staff June 2019
P209 Implement
PMS all staff
Implemented
PMS policy with
quarterly
performance
reviews
4.35.35.6P209 Performance
management
35.7 Number of
stakeholder
engagement
P210 Stakeholders
Engagement
Alignment to
National
Provincial and
District initiatives
and plans
4.35.35.7P210 Integrated
Development
35.8 Number of Ward
Profile revised
annually
P211 IDP - Ward
Based
Planning
Ward Profiling 4.35.35.8P212 Integrated
Development
35.9 Annually review of IDP P212 IDP -Annually
Review
IDP Review 4.35.35.9P212 Integrated
Development
35.1 Score high in the IDP
assessment
P213 IDP
Assessment
IDP Quality
assessment
4.35.35.1P213 Integrated
Development
An effective
productive
administration
capable of
sustainable
service delivery
36 To ensure that all
municipal staff
are adequately
housed.
36.1 Number building
renovated and report
progress quarterly
P214 Renovation of
office
buildings
Renovation of the
Engineering LED
Building
4.36.36.1P214 Office Space
A financially
viable and
Enhance
Revenue strategy
36.1 90% Debt Collection P215 Debt
Collection
Improve revenue
debt collection
4.36.36.1P215 Financial
management:
Revenue
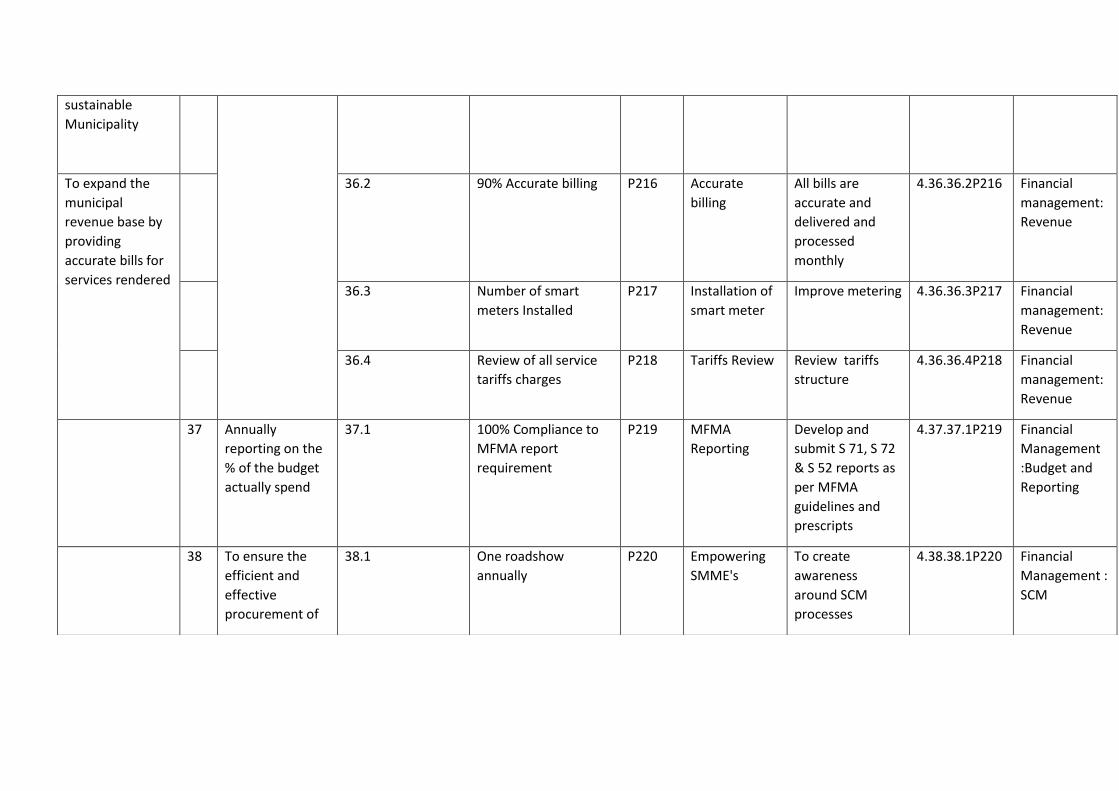
sustainable
Municipality
To expand the
municipal
revenue base by
providing
accurate bills for
services rendered
36.2 90% Accurate billing P216 Accurate
billing
All bills are
accurate and
delivered and
processed
monthly
4.36.36.2P216 Financial
management:
Revenue
36.3 Number of smart
meters Installed
P217 Installation of
smart meter
Improve metering 4.36.36.3P217 Financial
management:
Revenue
36.4 Review of all service
tariffs charges
P218 Tariffs Review Review tariffs
structure
4.36.36.4P218 Financial
management:
Revenue
37 Annually
reporting on the
% of the budget
actually spend
37.1 100% Compliance to
MFMA report
requirement
P219 MFMA
Reporting
Develop and
submit S 71, S 72
& S 52 reports as
per MFMA
guidelines and
prescripts
4.37.37.1P219 Financial
Management
:Budget and
Reporting
38 To ensure the
efficient and
effective
procurement of
38.1 One roadshow
annually
P220 Empowering
SMME's
To create
awareness
around SCM
processes
4.38.38.1P220 Financial
Management :
SCM
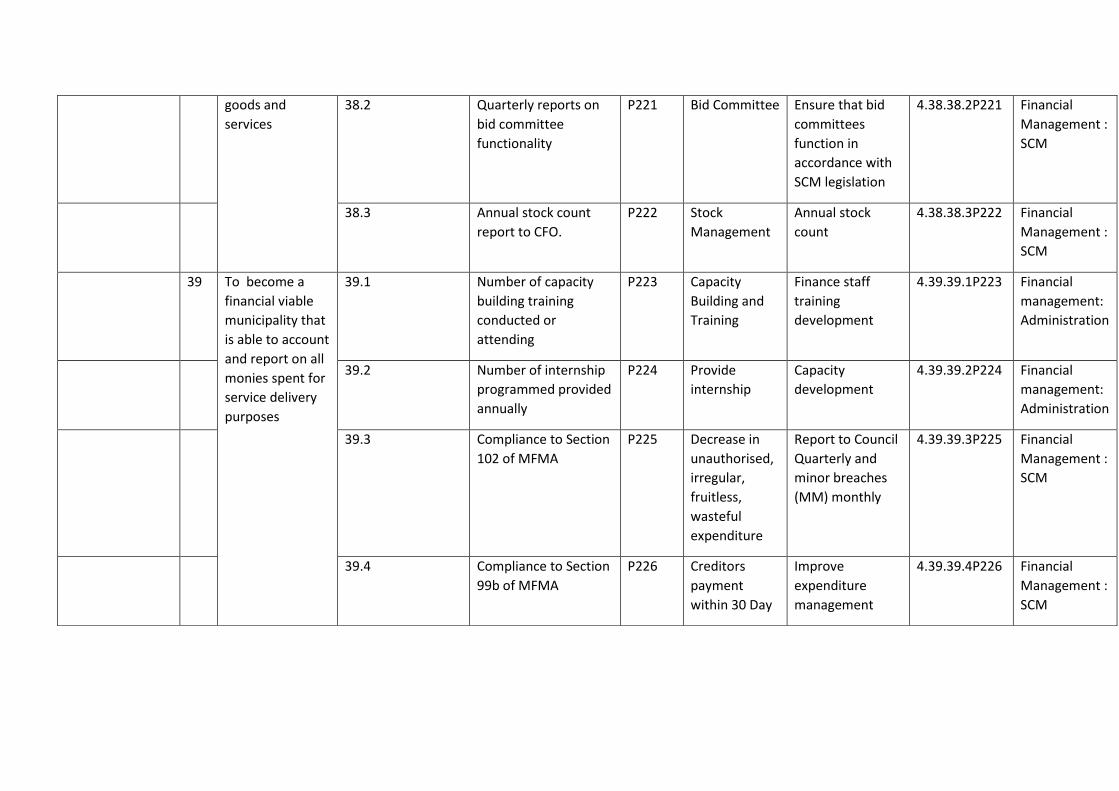
goods and
services
38.2 Quarterly reports on
bid committee
functionality
P221 Bid Committee Ensure that bid
committees
function in
accordance with
SCM legislation
4.38.38.2P221 Financial
Management :
SCM
38.3 Annual stock count
report to CFO.
P222 Stock
Management
Annual stock
count
4.38.38.3P222 Financial
Management :
SCM
39 To become a
financial viable
municipality that
is able to account
and report on all
monies spent for
service delivery
purposes
39.1 Number of capacity
building training
conducted or
attending
P223 Capacity
Building and
Training
Finance staff
training
development
4.39.39.1P223 Financial
management:
Administration
39.2 Number of internship
programmed provided
annually
P224 Provide
internship
Capacity
development
4.39.39.2P224 Financial
management:
Administration
39.3 Compliance to Section
102 of MFMA
P225 Decrease in
unauthorised,
irregular,
fruitless,
wasteful
expenditure
Report to Council
Quarterly and
minor breaches
(MM) monthly
4.39.39.3P225 Financial
Management :
SCM
39.4 Compliance to Section
99b of MFMA
P226 Creditors
payment
within 30 Day
Improve
expenditure
management
4.39.39.4P226 Financial
Management :
SCM
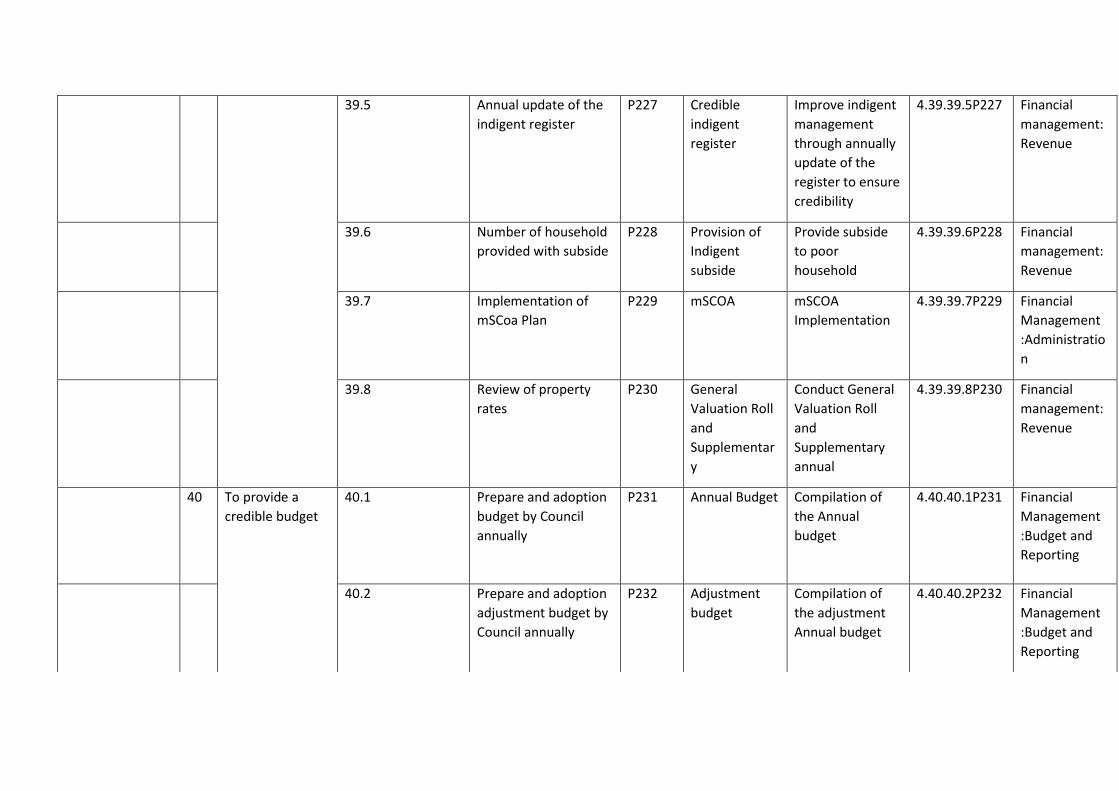
39.5 Annual update of the
indigent register
P227 Credible
indigent
register
Improve indigent
management
through annually
update of the
register to ensure
credibility
4.39.39.5P227 Financial
management:
Revenue
39.6 Number of household
provided with subside
P228 Provision of
Indigent
subside
Provide subside
to poor
household
4.39.39.6P228 Financial
management:
Revenue
39.7 Implementation of
mSCoa Plan
P229 mSCOA mSCOA
Implementation
4.39.39.7P229 Financial
Management
:Administratio
n
39.8 Review of property
rates
P230 General
Valuation Roll
and
Supplementar
y
Conduct General
Valuation Roll
and
Supplementary
annual
4.39.39.8P230 Financial
management:
Revenue
40 To provide a
credible budget
40.1 Prepare and adoption
budget by Council
annually
P231 Annual Budget Compilation of
the Annual
budget
4.40.40.1P231 Financial
Management
:Budget and
Reporting
40.2 Prepare and adoption
adjustment budget by
Council annually
P232 Adjustment
budget
Compilation of
the adjustment
Annual budget
4.40.40.2P232 Financial
Management
:Budget and
Reporting
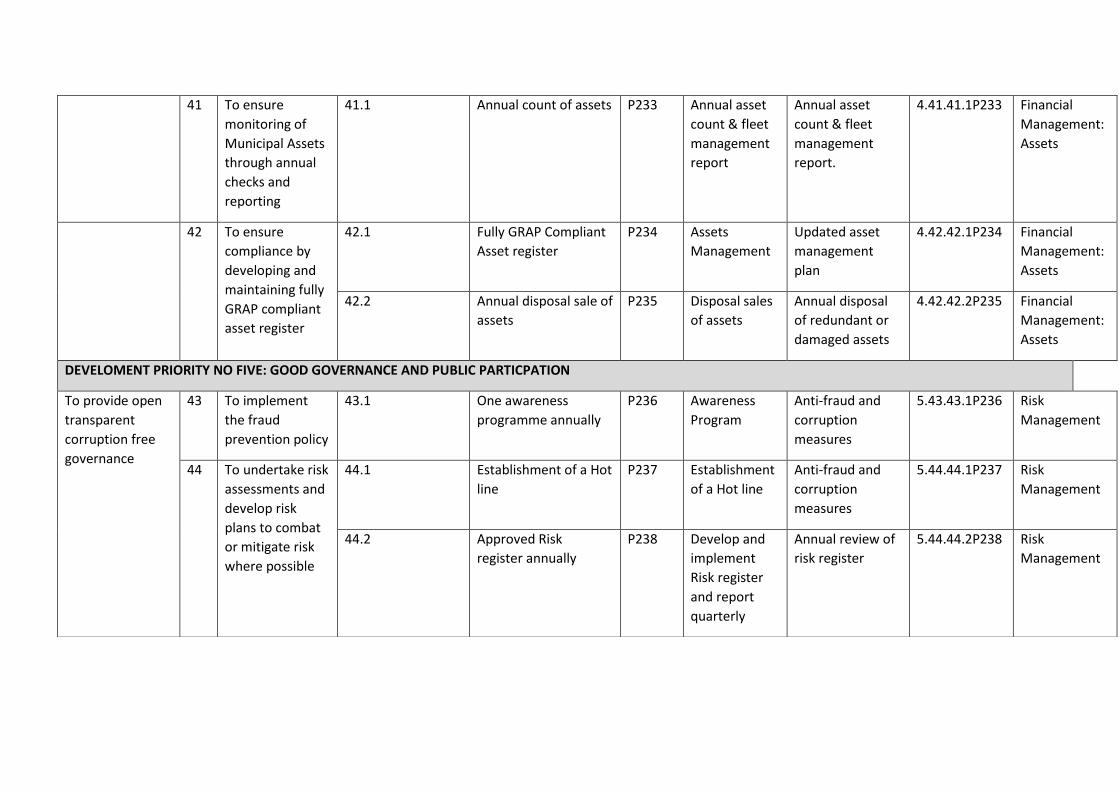
41 To ensure
monitoring of
Municipal Assets
through annual
checks and
reporting
41.1 Annual count of assets P233 Annual asset
count & fleet
management
report
Annual asset
count & fleet
management
report.
4.41.41.1P233 Financial
Management:
Assets
42 To ensure
compliance by
developing and
maintaining fully
GRAP compliant
asset register
42.1 Fully GRAP Compliant
Asset register
P234 Assets
Management
Updated asset
management
plan
4.42.42.1P234 Financial
Management:
Assets
42.2 Annual disposal sale of
assets
P235 Disposal sales
of assets
Annual disposal
of redundant or
damaged assets
4.42.42.2P235 Financial
Management:
Assets
DEVELOMENT PRIORITY NO FIVE: GOOD GOVERNANCE AND PUBLIC PARTICPATION
To provide open
transparent
corruption free
governance
43 To implement
the fraud
prevention policy
43.1 One awareness
programme annually
P236 Awareness
Program
Anti-fraud and
corruption
measures
5.43.43.1P236 Risk
Management
44 To undertake risk
assessments and
develop risk
plans to combat
or mitigate risk
where possible
44.1 Establishment of a Hot
line
P237 Establishment
of a Hot line
Anti-fraud and
corruption
measures
5.44.44.1P237 Risk
Management
44.2 Approved Risk
register annually
P238 Develop and
implement
Risk register
and report
quarterly
Annual review of
risk register
5.44.44.2P238 Risk
Management

45 Enhance
administration
and Council
oversight
45.1 Report on the
adherence to
compliance register
P239 Developed
annual
compliance
register
To ensure
compliance with
all legislated
deadlines such as
MFMA & MSA,
mSCOA
regulations, IDP
and budget date
5.45.45.1P239 Risk
Management
46 Enhance
administration
and Council
oversight
46.1 4 Audit Committee
Meetings Annually
P240 Number of
Audit
Committee
meeting held
annually
Ensure quarterly
sittings of Audit
Committee
5.46.46.1.P240 Municipal
Manager/Inter
nal Audit
47 Enhance
administration
and Council
oversight
47.1 Issue Quarterly Action
sheet and report
P241 Monitor
meeting
resolution
Council, ExCo and
Top Management
meetings are held
quarterly and to
track Council
resolutions take
5.47.47.1P241 Administration
and
Committee
Systems
48 Improve Audit
options outcome
48.1 Achieved qualified
audit options
P242 Audit Action
Plan
Annual
development ,
implementation
of the audit
action plan &
dashboard ND
Internal audit
plan
5.48.48.1P242 Municipal
Manager

49 Enhance Inter
governmental
Relation ships
49.1 Number of IGR forum
hosted
P243 Resuscitate
IGR Forum
Resuscitate and
Participate on IGR
forums
5.49.49.1P243 IGR
Foster
partnership with
external
stakeholders to
enhance Social
Cohesion
50 Support
vulnerable
groups
50.1 Number of social
cohesion programme
implemented annually
P244 Identification
social
cohesion plan
and
implementatio
n
Increase
community
cohesion through
activities such as
sport
5.50.50.1P244 Community
development
50.1 Number of CSI
initiated annually
P245 Identification
of CSI Initiative
Initiate Corporate
Social Investment
Programmes
5.50.50.2P245 Municipal
Manager
51 Support
vulnerable
groups
51.1 Number of Youth
programme
implemented and
report
P246 Youth
programme
Support youth
development
plan and report
implementation
5.51.51.1P246 Municipal
Manager
51.2 Number of HIV/Aid
Council meeting and
reports activities
quarterly
P247 Implementatio
n of HIV/AIDS
PLAN
Support People
with HIV/AIDS
initiative
5.51.51.2P247 Municipal
Manager
51.3 Number of Elderly,
Children and Women
programme
implemented
P248 Elderly,
Children and
Women
programme
Implementation
of elderly,
Children and
Women
5.51.51.3P248 Municipal
Manager
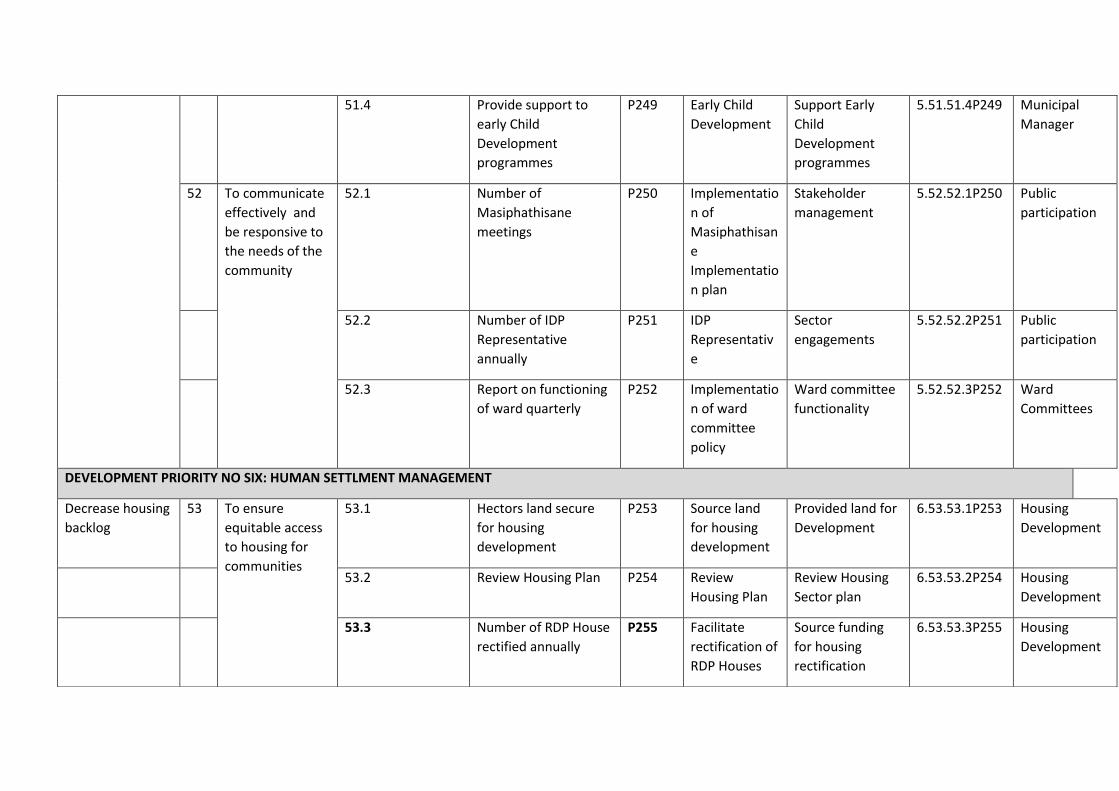
51.4 Provide support to
early Child
Development
programmes
P249 Early Child
Development
Support Early
Child
Development
programmes
5.51.51.4P249 Municipal
Manager
52 To communicate
effectively and
be responsive to
the needs of the
community
52.1 Number of
Masiphathisane
meetings
P250 Implementatio
n of
Masiphathisan
e
Implementatio
n plan
Stakeholder
management
5.52.52.1P250 Public
participation
52.2 Number of IDP
Representative
annually
P251 IDP
Representativ
e
Sector
engagements
5.52.52.2P251 Public
participation
52.3 Report on functioning
of ward quarterly
P252 Implementatio
n of ward
committee
policy
Ward committee
functionality
5.52.52.3P252 Ward
Committees
DEVELOPMENT PRIORITY NO SIX: HUMAN SETTLMENT MANAGEMENT
Decrease housing
backlog
53 To ensure
equitable access
to housing for
communities
53.1 Hectors land secure
for housing
development
P253 Source land
for housing
development
Provided land for
Development
6.53.53.1P253 Housing
Development
53.2 Review Housing Plan P254 Review
Housing Plan
Review Housing
Sector plan
6.53.53.2P254 Housing
Development
53.3 Number of RDP House
rectified annually
P255 Facilitate
rectification of
RDP Houses
Source funding
for housing
rectification
6.53.53.3P255 Housing
Development

53.4 Number of housed
built annually
P256 Facilitate
completion
Housing
Development
planned
projects
Reducing housing
backlog
6.53.53.4P256 Housing
Development
53.5 Review Housing
beneficiary list
annually
P257 Facilitate
Housing
beneficiary list
Reducing housing
backlog
6.53.53.5P257 Housing
Development
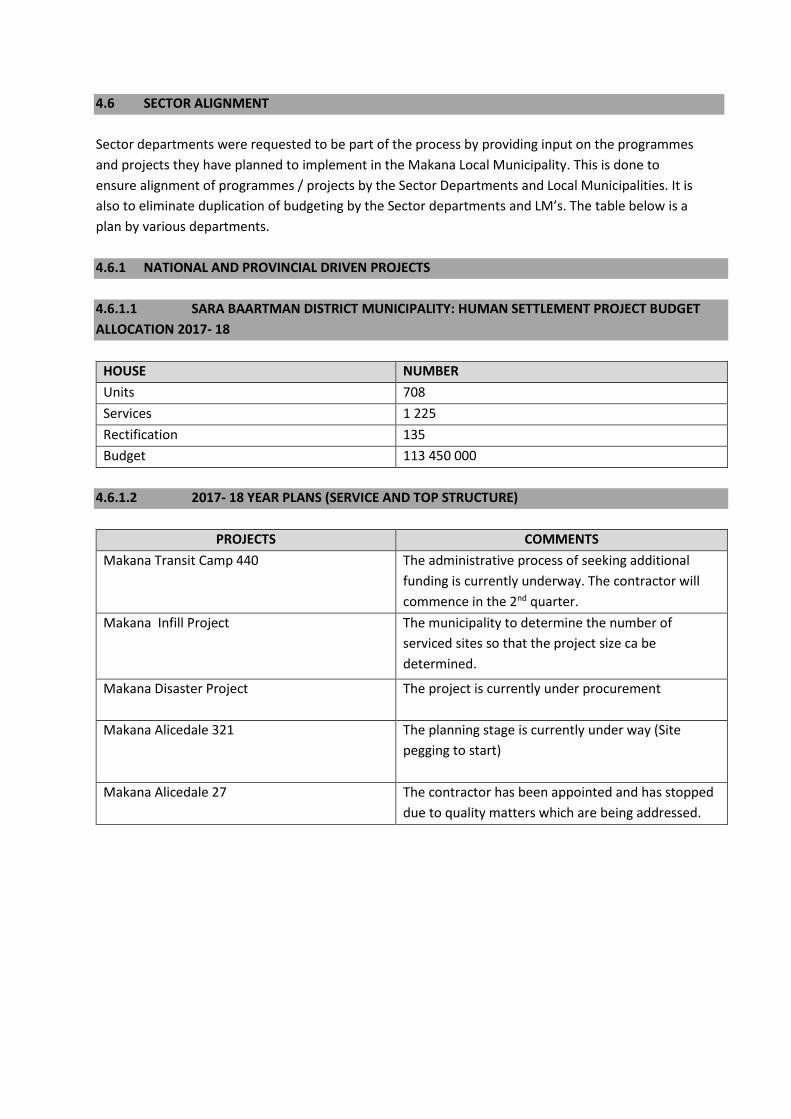
4.6 SECTOR ALIGNMENT
Sector departments were requested to be part of the process by providing input on the programmes
and projects they have planned to implement in the Makana Local Municipality. This is done to
ensure alignment of programmes / projects by the Sector Departments and Local Municipalities. It is
also to eliminate duplication of budgeting by the Sector departments and LM’s. The table below is a
plan by various departments.
4.6.1 NATIONAL AND PROVINCIAL DRIVEN PROJECTS
4.6.1.1 SARA BAARTMAN DISTRICT MUNICIPALITY: HUMAN SETTLEMENT PROJECT BUDGET
ALLOCATION 2017- 18
HOUSE NUMBER
Units 708
Services 1 225
Rectification 135
Budget 113 450 000
4.6.1.2 2017- 18 YEAR PLANS (SERVICE AND TOP STRUCTURE)
PROJECTS COMMENTS
Makana Transit Camp 440 The administrative process of seeking additional
funding is currently underway. The contractor will
commence in the 2nd quarter.
Makana Infill Project The municipality to determine the number of
serviced sites so that the project size ca be
determined.
Makana Disaster Project The project is currently under procurement
Makana Alicedale 321 The planning stage is currently under way (Site
pegging to start)
Makana Alicedale 27 The contractor has been appointed and has stopped
due to quality matters which are being addressed.
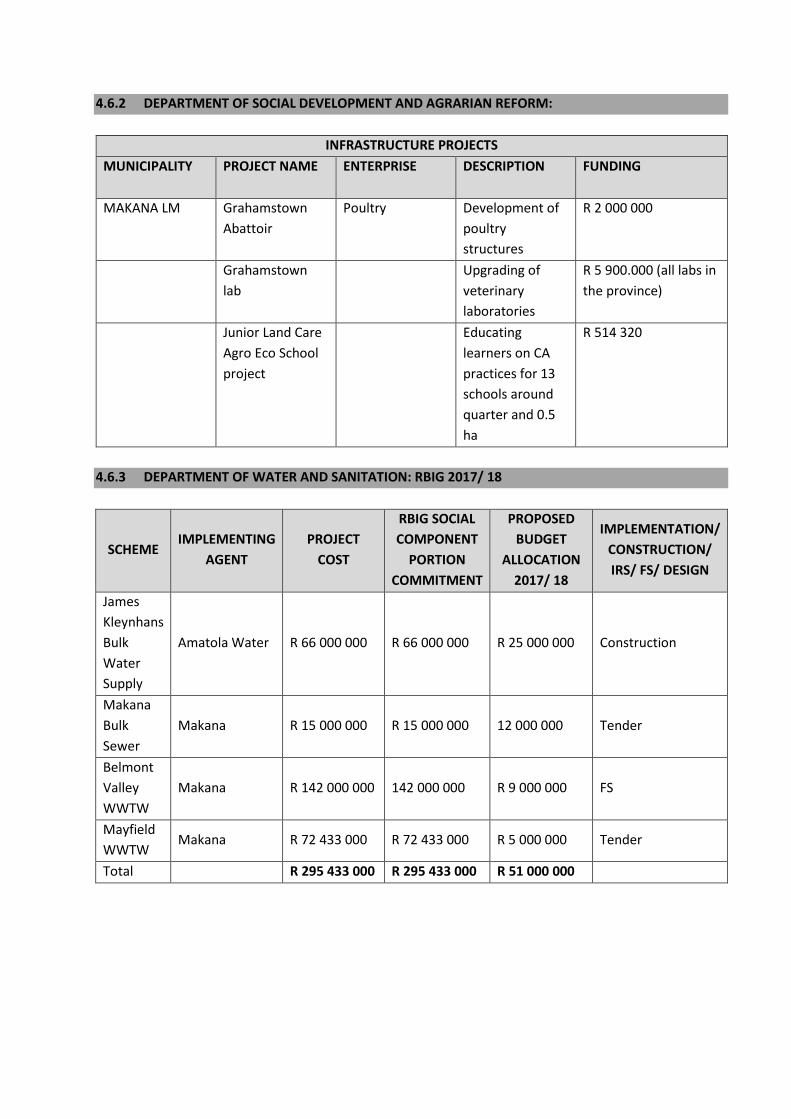
4.6.2 DEPARTMENT OF SOCIAL DEVELOPMENT AND AGRARIAN REFORM:
INFRASTRUCTURE PROJECTS
MUNICIPALITY PROJECT NAME ENTERPRISE DESCRIPTION FUNDING
MAKANA LM Grahamstown
Abattoir
Poultry Development of
poultry
structures
R 2 000 000
Grahamstown
lab
Upgrading of
veterinary
laboratories
R 5 900.000 (all labs in
the province)
Junior Land Care
Agro Eco School
project
Educating
learners on CA
practices for 13
schools around
quarter and 0.5
ha
R 514 320
4.6.3 DEPARTMENT OF WATER AND SANITATION: RBIG 2017/ 18
SCHEME IMPLEMENTING
AGENT
PROJECT
COST
RBIG SOCIAL
COMPONENT
PORTION
COMMITMENT
PROPOSED
BUDGET
ALLOCATION
2017/ 18
IMPLEMENTATION/
CONSTRUCTION/
IRS/ FS/ DESIGN
James
Kleynhans
Bulk
Water
Supply
Amatola Water R 66 000 000 R 66 000 000 R 25 000 000 Construction
Makana
Bulk
Sewer
Makana R 15 000 000 R 15 000 000 12 000 000 Tender
Belmont
Valley
WWTW
Makana R 142 000 000 142 000 000 R 9 000 000 FS
Mayfield
WWTW Makana R 72 433 000 R 72 433 000 R 5 000 000 Tender
Total R 295 433 000 R 295 433 000 R 51 000 000

4.6.2 STATE AGENCIES: ESKOM 2017- 18 PROJECTS
MUNICIPALITY PROJECT NAME CATEGORY Y-E PLAN CAPEX Y-E PLAN H/H
Makana LM Makana infill Infills R 1 730 179.00 359
Mayfield Housing
Development
Household R 15 588 816.00 1147
Total R 17 318 995.00 1506
CHAPTER FOUR: INTEGRATION
4.1 INTRODUCTION:
To ensure that the IDP address all strategic issues relevant to any effective municipality, the following
section offers a comprehensive list of issues discussed during the IDP process. The integration phase
represents the institutional readiness for implementation and to ensure integrated planning for the
provision of basic services. An analysis was conducted in respect of various sector plans for the Municipality.
Some of these sector plans were found to be still relevant and required minor changes. Others required a
review, whilst new ones need to be developed and this was based on benchmarked and IDP Assessment
with other local Municipal with our side.
5.2 SUMMARY OF SECTOR PLANS:
Table 93
STATUS SECTOR PLANS
EXISTING PLANS
Review Water Service Development Plan
Integrated Waste Management Plan
Area Based Plan
Comprehensive Infrastructure Plan
Disaster Management Plan
Housing Settlement Plan
Review of Transport Plan
Review Fire and rescue plan(CPS report )
Environmental strategy(LEAP)
Spatial Development Framework
NEW ONE TO BE DEVELOPED
Five Invest Financial plan
Development of Job creation sector plan
Poverty alleviation plan
Fleet management plan
Development of Electricity Master Plan
Asset Management Strategy
Supply chain Management Strategy

Cooperative strategy
Revenue enhancement strategy
CROSS CUTTING PLANS
Plans Action required
Local Economic
Development Plan
Strategy was approved and
due for review 2017
HIV/AIDS action plan t To be developed
Special Programs
sectorial plans
Youth plan need to be develop
People with Disability
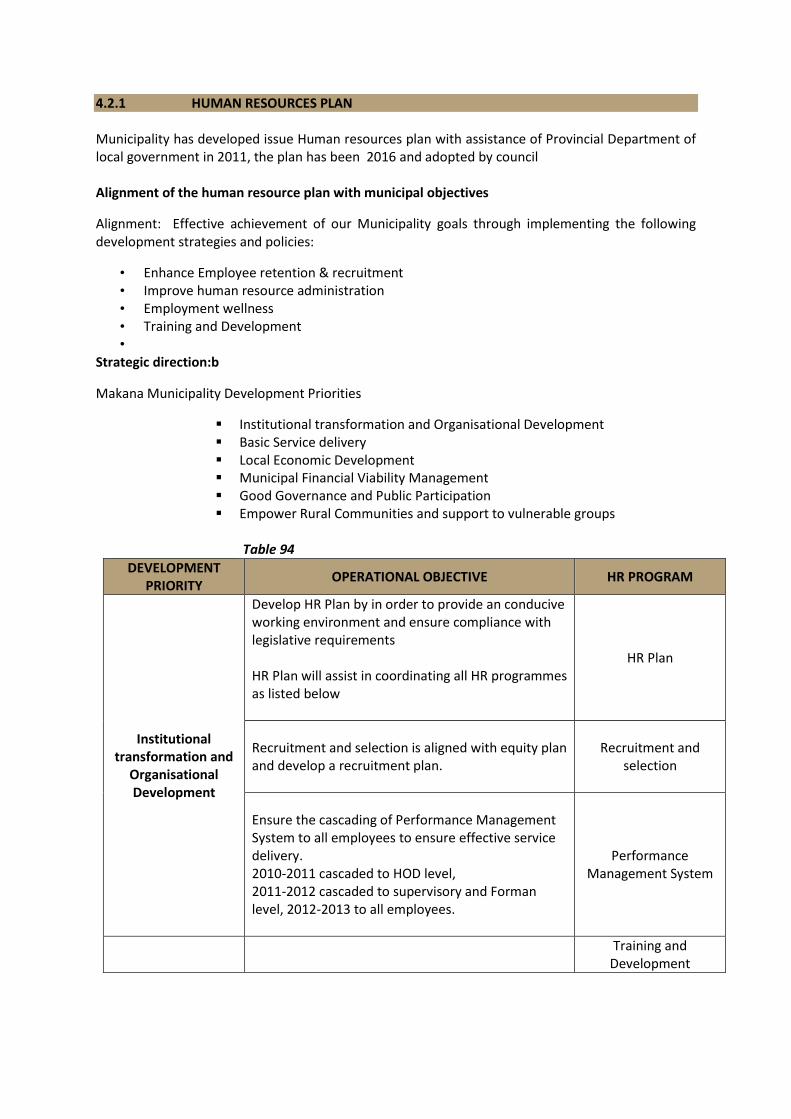
4.2.1 HUMAN RESOURCES PLAN Municipality has developed issue Human resources plan with assistance of Provincial Department of local government in 2011, the plan has been 2016 and adopted by council
Alignment of the human resource plan with municipal objectives
Alignment: Effective achievement of our Municipality goals through implementing the following development strategies and policies:
• Enhance Employee retention & recruitment • Improve human resource administration • Employment wellness • Training and Development •
Strategic direction:b
Makana Municipality Development Priorities
Institutional transformation and Organisational Development Basic Service delivery Local Economic Development Municipal Financial Viability Management Good Governance and Public Participation Empower Rural Communities and support to vulnerable groups
Table 94
DEVELOPMENT PRIORITY
OPERATIONAL OBJECTIVE HR PROGRAM
Institutional transformation and
Organisational Development
Develop HR Plan by in order to provide an conducive working environment and ensure compliance with legislative requirements HR Plan will assist in coordinating all HR programmes as listed below
HR Plan
Recruitment and selection is aligned with equity plan and develop a recruitment plan.
Recruitment and selection
Ensure the cascading of Performance Management System to all employees to ensure effective service delivery. 2010-2011 cascaded to HOD level, 2011-2012 cascaded to supervisory and Forman level, 2012-2013 to all employees.
Performance Management System
Training and Development

DEVELOPMENT PRIORITY
OPERATIONAL OBJECTIVE HR PROGRAM
Development of work skills plan that seeks to achieve organisational goal e.g. shortage of qualified electricians, accountants, etc. DTIS: Assessment shortage of skills by DBSA
Institutional transformation and Organisational Development
Operationalization of wellness policy to enforce health and safety regulations. There is vacant position in the organogram of Employment well facilitator.
Wellness(Health and safety)
Operationalization of career succession plan policy
Career planning
To ensure sound good working relations between the employer and employees. (LLF) To empower members of LLF –all stakeholders (training) i.e. ORA, Labour relations Act, Basic conditions Act, LLF constitution and other related courses
Labour relations
Ensure smooth exit procedure
1. Resignation 2. Retirement 3. Dismissal 4. Early retirement due to health
Exit management
4.2.2 COMMUNICATION STRATEGY
Chapter 4 of the Municipal Systems Act (Act 32 of 2000), equally, states that all Municipalities must strive to meet the following object, among others: -
foster meaningful dialogue and interface within the internal structures of Municipalities, external bodies and members of the public.
Likewise, the Promotion of Administrative Justice Act (Act 3 of 2000) and Promotion of Access to Information Act (Act 2 of 2000) charge Government Bodies to observe and adhere to the principles and practices of good governance,
It is within this context that this policy shall direct Makana Municipality on how to constructively engage the members of the public and external bodies in particular media institutions as instructed

by the Constitution of the Republic of South Africa and applicable pieces of legislation and the institutional policies.
Scope of the policy
This policy and strategy applies to the Councilors and Officials of Makana Municipality, be they casuals,
part time, full time, contract or consultants. The communication policy and strategy will be reviewed
and revised when the need arises by the Council. The last review was done in 2016 and adopted on
the 24 June 2016.
Aims of the policy
The aim of this policy is to ensure the streamlining of communication within the Makana jurisdiction
and to ensure a coherent and coordinated communication process.
To provide a framework within which internal and external communication of the Municipality will be
discharged with its stakeholders and to reduce the risk of damaging or ineffective communication,
and to ensure that staff and Councillors are aware of how communication is best conveyed externally
and internally, and who has responsibility for which aspects.
Objectives of the Policy The objectives of the Communication Policy of Makana Municipality are as follows:
(a) Ensuring that there is a clear and co-ordinated communication process within the
Municipality, to enhance and promote cooperative governance between its clientele, partners,
stakeholders and the media.
(b) Ensuring that there are clear roles of communication by the staff of Makana Municipality and
to foster meaningful dialogue and interface between and among the internal role players.
(c) Ensuring that the image of the Municipality is at all times upheld.
(d) Ensuring that the Municipality complies with the legislative requirements as far as
communication is concerned.
(e) Ensuring that resources are used in support of the achievement of the Municipality's strategic
goals.
(f) Ensuring effective coordination and coherent system of communication within Makana
Municipality.
Official Communicators All staff members (officials) as defined above and Councillors are communicators of the Council by
virtue of their work. All staff members and Councillors are representatives and messengers of the
Municipality.
Staff members and Councillors should always be mindful that when they communicate with a member
from the public, things they say are seen as official statements expressing the views of the
municipality. In instances where Councillors speak in their personal capacity or for their political
parties, they must make sure that point is clear.
However it is critical to note that for interview or research purposes, whether by institutions,
organisations, private companies, media, etc. consent to engage with such bodies must be sought
from the Municipal Manager by officials and from the Executive Mayor or Speaker by the Councillors.
Councillors do not need to seek the approval of the Speaker or the Executive Mayor when they speak
in their personal capacity or for their political parties.
The Media and Communications Officer (Municipal Spokesperson), the Municipal Manager and the
Executive Mayor are not only the official communicators of the Municipality but the primary
communicators. However, they can delegate their powers to whomever they see fit at times.
4. 2.3 INTEGRATED WASTE MANAGEMENT Purpose: Makana municipal integrated waste development consideration various service categories as well as evaluate the service delivery in each of the towns in the Municipality. The service categories that are taken into consideration can be summarised as follows:
Refuse Removal:
Residential
Commercial
Industrial
Garden Refuse
Builders’ Rubble and
Medical Waste
Street and ablution cleaning
Landfill Sites,
Transfer Stations and
Bulk Containers The Status Quo investigation of the waste management section considered each of these aspects, In addition to this existing structure, the status quo study also considered planned developments for service extensions and any planned projects that have been identified in the IDP. The Integrated Waste Management Plan was development in November 2008 and adopted by Council May 2009 is due for review. 4.2.4 DISASTER MANAGEMENT PLAN
Introduction:
The Makana Local Municipality Disaster Management Plan has been prepared in accordance with the provisions of the Disaster Management Act no 57 of 2002, and within Cacadu Disaster Management Framework and was adopted was by Council In May 2009, currently under review. The plan is aimed at ensuring an integrated and uniform approach to comprehensive disaster management in the Municipality.
This Plan has been documented by the Disaster Management Centre, Cacadu District Municipality, with the support of Makana Municipality.
Objectives:
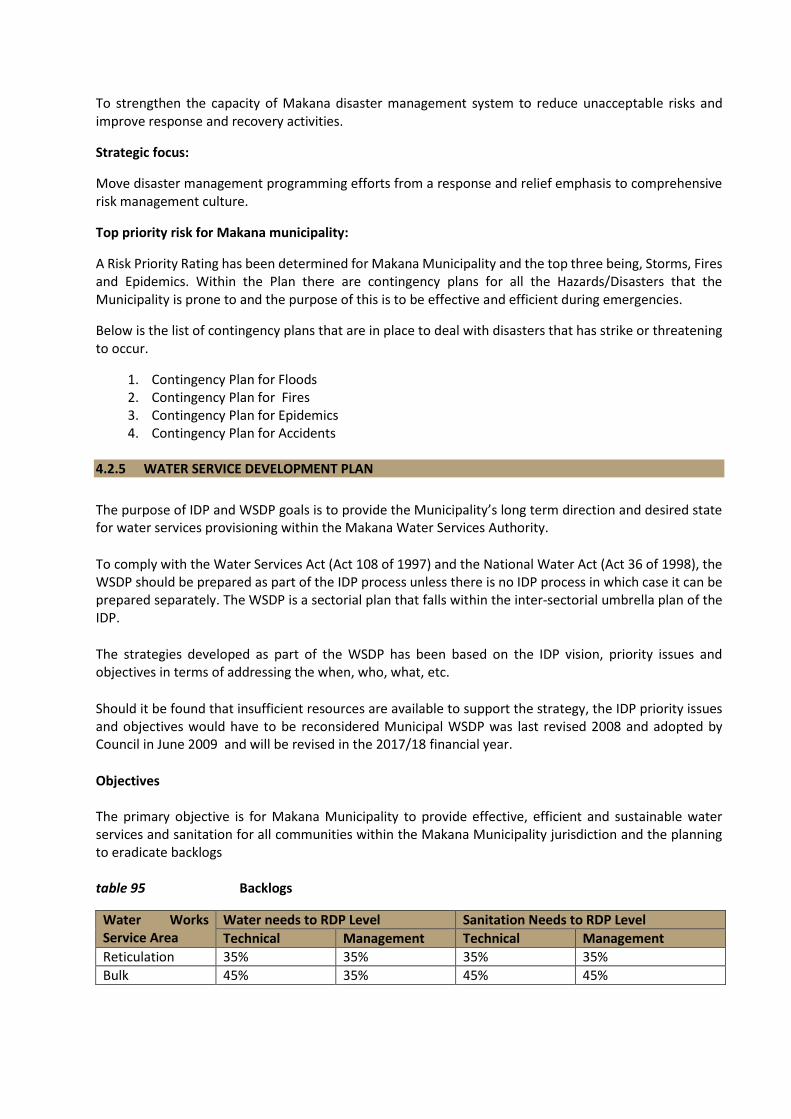
To strengthen the capacity of Makana disaster management system to reduce unacceptable risks and improve response and recovery activities.
Strategic focus:
Move disaster management programming efforts from a response and relief emphasis to comprehensive risk management culture.
Top priority risk for Makana municipality:
A Risk Priority Rating has been determined for Makana Municipality and the top three being, Storms, Fires and Epidemics. Within the Plan there are contingency plans for all the Hazards/Disasters that the Municipality is prone to and the purpose of this is to be effective and efficient during emergencies.
Below is the list of contingency plans that are in place to deal with disasters that has strike or threatening to occur.
1. Contingency Plan for Floods 2. Contingency Plan for Fires 3. Contingency Plan for Epidemics 4. Contingency Plan for Accidents
4.2.5 WATER SERVICE DEVELOPMENT PLAN
The purpose of IDP and WSDP goals is to provide the Municipality’s long term direction and desired state for water services provisioning within the Makana Water Services Authority.
To comply with the Water Services Act (Act 108 of 1997) and the National Water Act (Act 36 of 1998), the WSDP should be prepared as part of the IDP process unless there is no IDP process in which case it can be prepared separately. The WSDP is a sectorial plan that falls within the inter-sectorial umbrella plan of the IDP.
The strategies developed as part of the WSDP has been based on the IDP vision, priority issues and objectives in terms of addressing the when, who, what, etc.
Should it be found that insufficient resources are available to support the strategy, the IDP priority issues and objectives would have to be reconsidered Municipal WSDP was last revised 2008 and adopted by Council in June 2009 and will be revised in the 2017/18 financial year.
Objectives The primary objective is for Makana Municipality to provide effective, efficient and sustainable water services and sanitation for all communities within the Makana Municipality jurisdiction and the planning to eradicate backlogs table 95 Backlogs
Water Works Service Area
Water needs to RDP Level Sanitation Needs to RDP Level
Technical Management Technical Management
Reticulation 35% 35% 35% 35%
Bulk 45% 35% 45% 45%
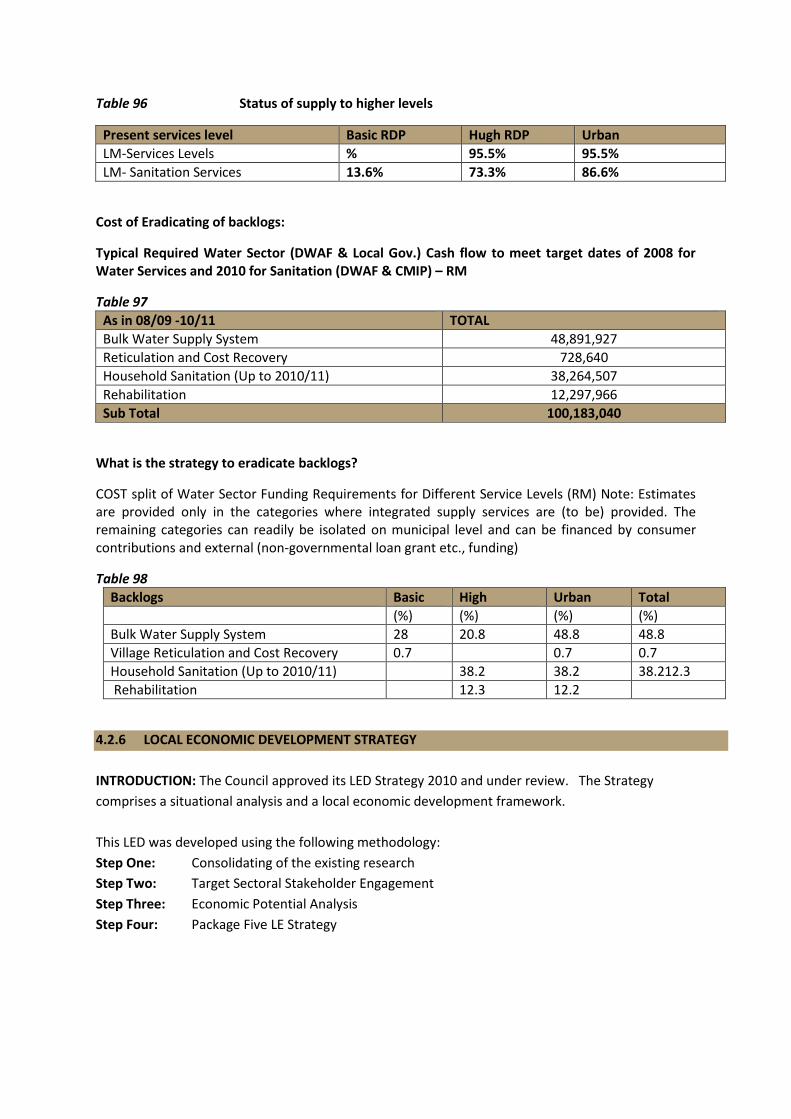
Table 96 Status of supply to higher levels
Present services level Basic RDP Hugh RDP Urban
LM-Services Levels % 95.5% 95.5%
LM- Sanitation Services 13.6% 73.3% 86.6%
Cost of Eradicating of backlogs:
Typical Required Water Sector (DWAF & Local Gov.) Cash flow to meet target dates of 2008 for Water Services and 2010 for Sanitation (DWAF & CMIP) – RM
Table 97
As in 08/09 -10/11 TOTAL
Bulk Water Supply System 48,891,927
Reticulation and Cost Recovery 728,640
Household Sanitation (Up to 2010/11) 38,264,507
Rehabilitation 12,297,966
Sub Total 100,183,040
What is the strategy to eradicate backlogs?
COST split of Water Sector Funding Requirements for Different Service Levels (RM) Note: Estimates are provided only in the categories where integrated supply services are (to be) provided. The remaining categories can readily be isolated on municipal level and can be financed by consumer contributions and external (non-governmental loan grant etc., funding)
Table 98
Backlogs Basic High Urban Total
(%) (%) (%) (%)
Bulk Water Supply System 28 20.8 48.8 48.8
Village Reticulation and Cost Recovery 0.7 0.7 0.7
Household Sanitation (Up to 2010/11) 38.2 38.2 38.212.3
Rehabilitation 12.3 12.2
4.2.6 LOCAL ECONOMIC DEVELOPMENT STRATEGY
INTRODUCTION: The Council approved its LED Strategy 2010 and under review. The Strategy
comprises a situational analysis and a local economic development framework.
This LED was developed using the following methodology:
Step One: Consolidating of the existing research
Step Two: Target Sectoral Stakeholder Engagement
Step Three: Economic Potential Analysis
Step Four: Package Five LE Strategy
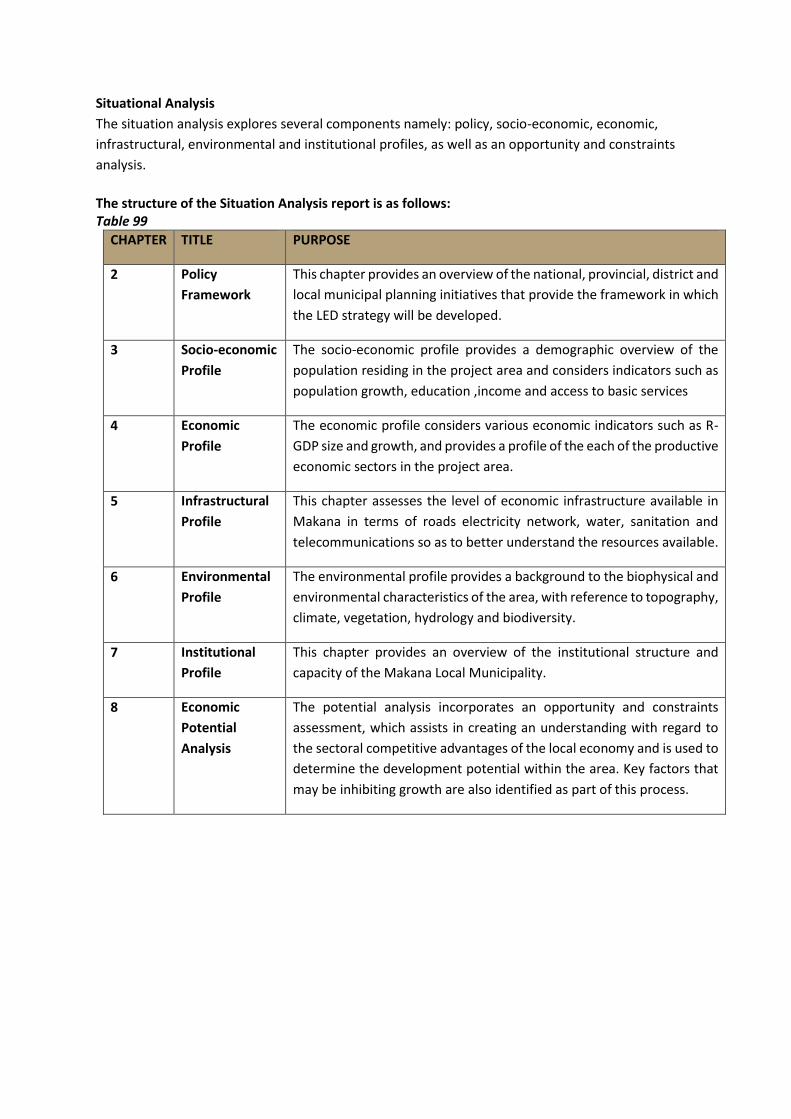
Situational Analysis
The situation analysis explores several components namely: policy, socio-economic, economic,
infrastructural, environmental and institutional profiles, as well as an opportunity and constraints
analysis.
The structure of the Situation Analysis report is as follows: Table 99
CHAPTER TITLE PURPOSE
2 Policy
Framework
This chapter provides an overview of the national, provincial, district and
local municipal planning initiatives that provide the framework in which
the LED strategy will be developed.
3 Socio-economic
Profile
The socio-economic profile provides a demographic overview of the
population residing in the project area and considers indicators such as
population growth, education ,income and access to basic services
4 Economic
Profile
The economic profile considers various economic indicators such as R-
GDP size and growth, and provides a profile of the each of the productive
economic sectors in the project area.
5 Infrastructural
Profile
This chapter assesses the level of economic infrastructure available in
Makana in terms of roads electricity network, water, sanitation and
telecommunications so as to better understand the resources available.
6 Environmental
Profile
The environmental profile provides a background to the biophysical and
environmental characteristics of the area, with reference to topography,
climate, vegetation, hydrology and biodiversity.
7 Institutional
Profile
This chapter provides an overview of the institutional structure and
capacity of the Makana Local Municipality.
8 Economic
Potential
Analysis
The potential analysis incorporates an opportunity and constraints
assessment, which assists in creating an understanding with regard to
the sectoral competitive advantages of the local economy and is used to
determine the development potential within the area. Key factors that
may be inhibiting growth are also identified as part of this process.

Strategic Development Framework Local Economic Development Framework considers the strategic development framework for LED, implementation plan, monitoring and evaluation framework and benchmarking of the LED strategy. The Report Outline
Chapter 2: Strategic Development Framework
This section presents the framework of the strategy and includes the vision, goals, programmes and strategic initiatives conceived.
Chapter 3: Implementation Plan
This section provides guidelines for the implementation of the strategic framework in terms of recommended actions, roles and responsibilities and associated timeframes.
Annexure 1: Support Agencies A compendium of support agencies and their contact details.
Annexure 2: Monitoring & Evaluation Framework
A monitoring and evaluation framework based on the SDBIP is provided for the 10 prioritised initiatives.
Annexure 3: Benchmarking for LED best practice
Provides criteria for successful LED strategies based on government guidelines.
Elements of the LED Framework
The strategic framework is developed in line with and adapted from World Bank LED principles, and is made up of the following elements:
Vision: The vision describes the stakeholders’ (community, private sector, municipality, non-governmental organisations) agreement on the preferred economic future of the economy.
Goals: Objectives are based on the overall vision and specify desired outcomes of the economic
planning process. They set performance standards and identify target activities for development.
Programmes: Programs are set out approaches to achieving realistic economic development goals. Strategic Initiatives: Allow the prioritised implementation of specific programme
components.
The vision sets out what the LED strategy seeks to achieve. All the other elements of the strategic framework thus cascade from the vision. The Makana LED strategy vision was developed after stakeholder engagement convened in the form of an Indaba. The Indaba allowed public participation and input into the vision. The other element that forms a central part of the LED vision is the Makana municipality’s vision, as set out in its IDP document.
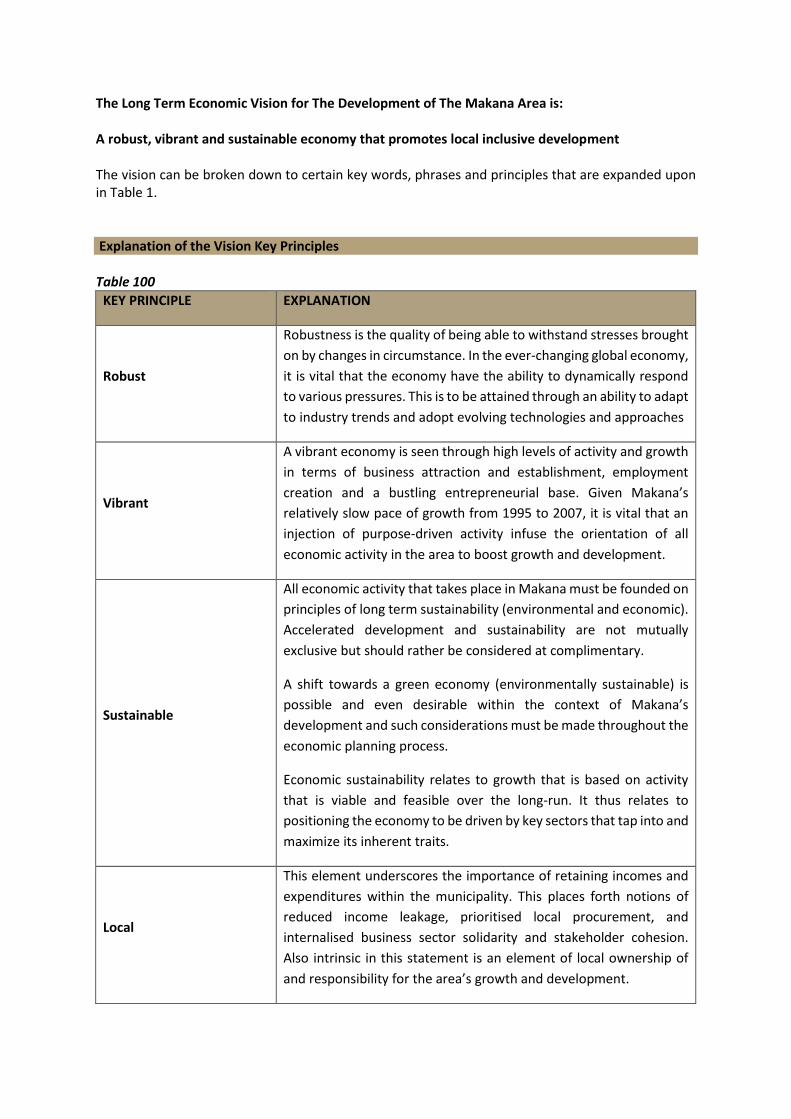
The Long Term Economic Vision for The Development of The Makana Area is: A robust, vibrant and sustainable economy that promotes local inclusive development The vision can be broken down to certain key words, phrases and principles that are expanded upon in Table 1. Explanation of the Vision Key Principles Table 100
KEY PRINCIPLE EXPLANATION
Robust
Robustness is the quality of being able to withstand stresses brought
on by changes in circumstance. In the ever-changing global economy,
it is vital that the economy have the ability to dynamically respond
to various pressures. This is to be attained through an ability to adapt
to industry trends and adopt evolving technologies and approaches
Vibrant
A vibrant economy is seen through high levels of activity and growth
in terms of business attraction and establishment, employment
creation and a bustling entrepreneurial base. Given Makana’s
relatively slow pace of growth from 1995 to 2007, it is vital that an
injection of purpose-driven activity infuse the orientation of all
economic activity in the area to boost growth and development.
Sustainable
All economic activity that takes place in Makana must be founded on
principles of long term sustainability (environmental and economic).
Accelerated development and sustainability are not mutually
exclusive but should rather be considered at complimentary.
A shift towards a green economy (environmentally sustainable) is
possible and even desirable within the context of Makana’s
development and such considerations must be made throughout the
economic planning process.
Economic sustainability relates to growth that is based on activity
that is viable and feasible over the long-run. It thus relates to
positioning the economy to be driven by key sectors that tap into and
maximize its inherent traits.
Local
This element underscores the importance of retaining incomes and
expenditures within the municipality. This places forth notions of
reduced income leakage, prioritised local procurement, and
internalised business sector solidarity and stakeholder cohesion.
Also intrinsic in this statement is an element of local ownership of
and responsibility for the area’s growth and development.
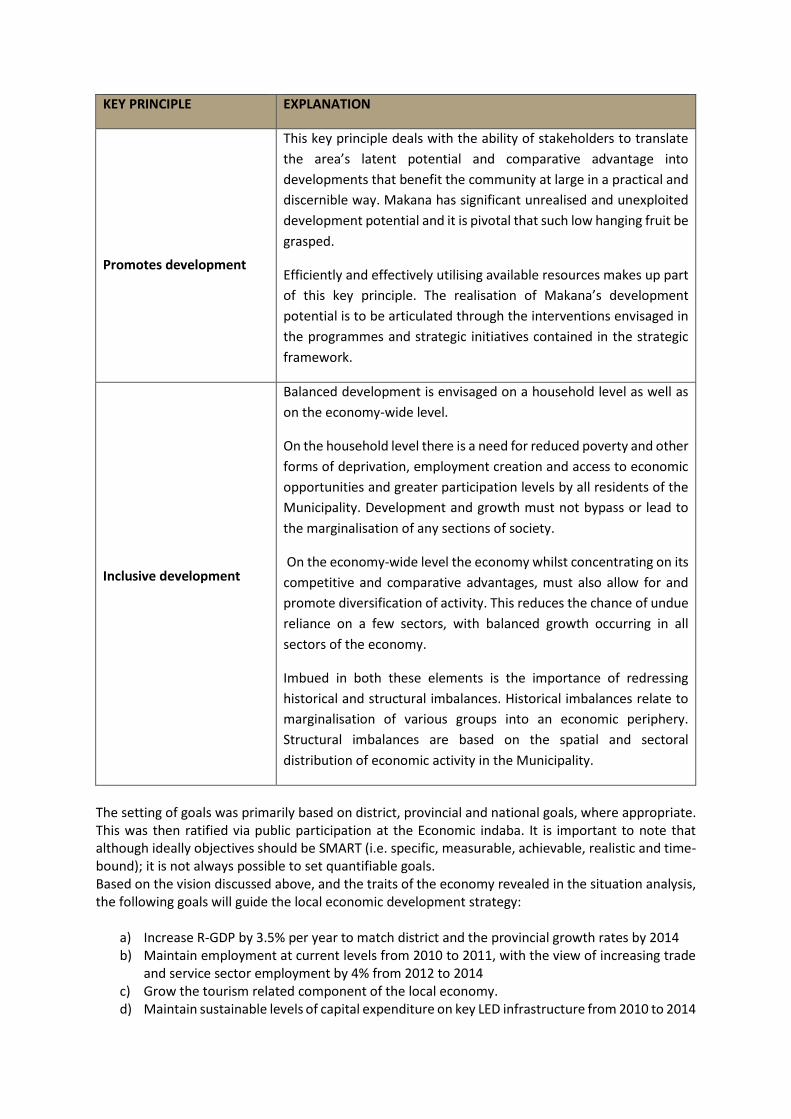
KEY PRINCIPLE EXPLANATION
Promotes development
This key principle deals with the ability of stakeholders to translate
the area’s latent potential and comparative advantage into
developments that benefit the community at large in a practical and
discernible way. Makana has significant unrealised and unexploited
development potential and it is pivotal that such low hanging fruit be
grasped.
Efficiently and effectively utilising available resources makes up part
of this key principle. The realisation of Makana’s development
potential is to be articulated through the interventions envisaged in
the programmes and strategic initiatives contained in the strategic
framework.
Inclusive development
Balanced development is envisaged on a household level as well as
on the economy-wide level.
On the household level there is a need for reduced poverty and other
forms of deprivation, employment creation and access to economic
opportunities and greater participation levels by all residents of the
Municipality. Development and growth must not bypass or lead to
the marginalisation of any sections of society.
On the economy-wide level the economy whilst concentrating on its
competitive and comparative advantages, must also allow for and
promote diversification of activity. This reduces the chance of undue
reliance on a few sectors, with balanced growth occurring in all
sectors of the economy.
Imbued in both these elements is the importance of redressing
historical and structural imbalances. Historical imbalances relate to
marginalisation of various groups into an economic periphery.
Structural imbalances are based on the spatial and sectoral
distribution of economic activity in the Municipality.
The setting of goals was primarily based on district, provincial and national goals, where appropriate. This was then ratified via public participation at the Economic indaba. It is important to note that although ideally objectives should be SMART (i.e. specific, measurable, achievable, realistic and time-bound); it is not always possible to set quantifiable goals. Based on the vision discussed above, and the traits of the economy revealed in the situation analysis, the following goals will guide the local economic development strategy:
a) Increase R-GDP by 3.5% per year to match district and the provincial growth rates by 2014 b) Maintain employment at current levels from 2010 to 2011, with the view of increasing trade
and service sector employment by 4% from 2012 to 2014 c) Grow the tourism related component of the local economy. d) Maintain sustainable levels of capital expenditure on key LED infrastructure from 2010 to 2014
e) Increase the role of formal and informal strategic partnerships in and between the public and private sectors as a catalyst for growth
f) Reduce income leakage and support SMME activity through increased local procurement and labour force support measures.
Programs and strategic initiatives In order for the goals discussed in the previous section to be achieved, the strategic framework contains key developmental thrusts packaged in the form of programs. The programs are based on the findings of the situational analysis, seeking to reduce identified constraints and maximise untapped economic potential. Each program is made up of several strategic initiatives, which fall in the public and private realms. The programs and strategic initiatives discussed in this section all seek to ensure that Makana maximises economic development based on its unique attributes and characteristics. The programs for the LED strategy are: a) Strategic Partnerships b) Infrastructure Provision And Services c) Investment Attraction d) SMME Promotion e) Tourism Development f) Leveraging of educational capital g) Agricultural sectoral development The first four programs deal with cross cutting issues that have been identified as requiring strategic interventions. Cross cutting issues relate to challenges and opportunities that transcend sectoral barriers. This can be seen by how the need for strategic partnerships applies across all economic sectors in Makana, how infrastructure promotes development across the economic spectrum, investment attraction is needed by all participants, and SMMEs operate across the board. Cross cutting programs thus apply for the general economic landscape of Makana and are vital for the creation of a conducive and enabling environment for growth and development.
The last three programs provide targeted actions in sectors deemed to be important in shaping the overall future of the economy (tourism, education and agriculture). These sectors were selected based on the following outcomes of the situation analysis:
Comparative advantage analysis
Sectorial performance classification
Opportunities and constraints analysis
The strategic initiatives in each of the sectorial programs zone in on critical success factors that will allow maximisation of their development potential.
Each programme is discussed in the proceeding sections, with elaborations on its motivation, rationale and strategic initiatives. The strategic initiatives are listed in descending order of prioritised, as voted for by stakeholders at the Makana Economic Indaba.
STRATEGIC PARTNERSHIPS The strategic initiatives that relate to strategic partnerships in Makana mainly involve the municipality as one of the partners and were developed in response to perceived gaps in intergovernmental and inter-organisational relations.
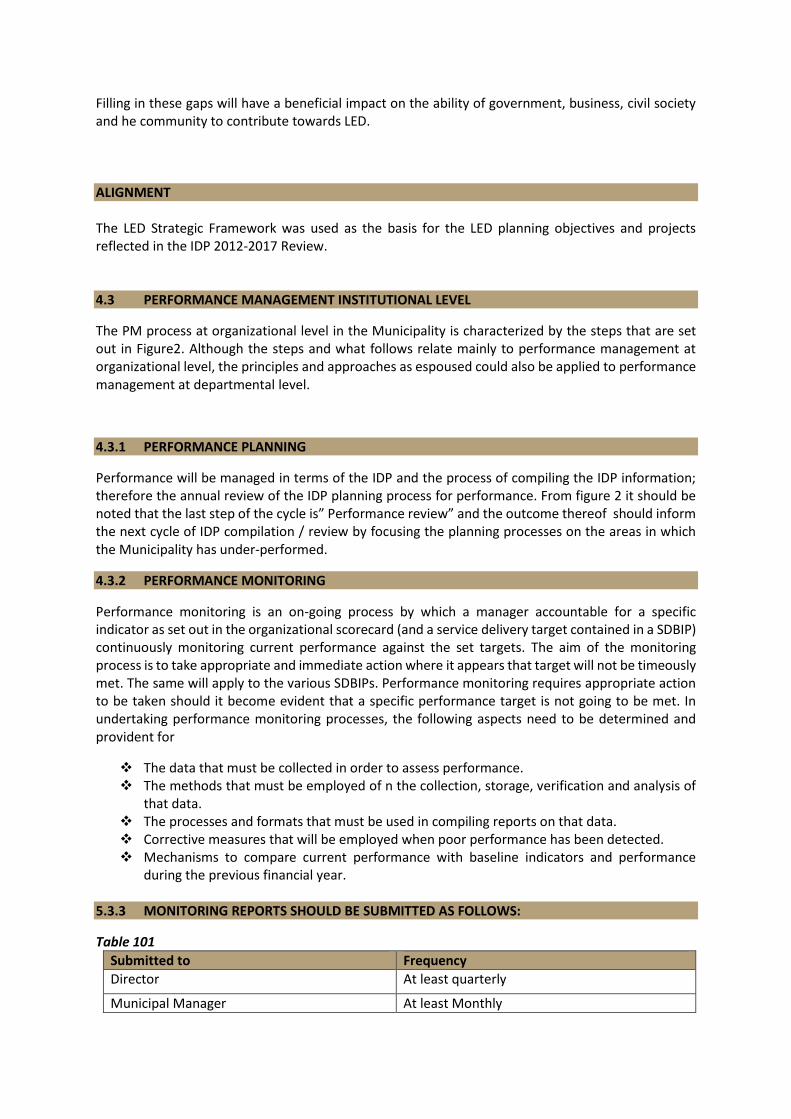
Filling in these gaps will have a beneficial impact on the ability of government, business, civil society and he community to contribute towards LED. ALIGNMENT The LED Strategic Framework was used as the basis for the LED planning objectives and projects reflected in the IDP 2012-2017 Review. 4.3 PERFORMANCE MANAGEMENT INSTITUTIONAL LEVEL
The PM process at organizational level in the Municipality is characterized by the steps that are set out in Figure2. Although the steps and what follows relate mainly to performance management at organizational level, the principles and approaches as espoused could also be applied to performance management at departmental level.
4.3.1 PERFORMANCE PLANNING
Performance will be managed in terms of the IDP and the process of compiling the IDP information; therefore the annual review of the IDP planning process for performance. From figure 2 it should be noted that the last step of the cycle is” Performance review” and the outcome thereof should inform the next cycle of IDP compilation / review by focusing the planning processes on the areas in which the Municipality has under-performed.
4.3.2 PERFORMANCE MONITORING
Performance monitoring is an on-going process by which a manager accountable for a specific indicator as set out in the organizational scorecard (and a service delivery target contained in a SDBIP) continuously monitoring current performance against the set targets. The aim of the monitoring process is to take appropriate and immediate action where it appears that target will not be timeously met. The same will apply to the various SDBIPs. Performance monitoring requires appropriate action to be taken should it become evident that a specific performance target is not going to be met. In undertaking performance monitoring processes, the following aspects need to be determined and provident for
The data that must be collected in order to assess performance. The methods that must be employed of n the collection, storage, verification and analysis of
that data. The processes and formats that must be used in compiling reports on that data. Corrective measures that will be employed when poor performance has been detected. Mechanisms to compare current performance with baseline indicators and performance
during the previous financial year. 5.3.3 MONITORING REPORTS SHOULD BE SUBMITTED AS FOLLOWS:
Table 101
Submitted to Frequency
Director At least quarterly
Municipal Manager At least Monthly
Managers should track performance trends against targets for those indicators that lie within their area of accountability at least once per month. That will allow them to identify performance related problems and take appropriate remedial action in time. In addition each senior manager should delegate to the direct line manager the responsibility to monitor the performance for his/ her sector.
4.3.4 PERFORMANCE MEASUREMENT
Performance measurement refers to the formal process of collecting and capturing performance data
to enable reporting to take place for each KPI and against the target set for such indicator. A manual
process will be used to measure performance at Makana Municipality. The municipality’s SDBIP
scorecards should spell out the name of an official who will be reporting on each indicator. The said
official will, when performance measurement is due, have to collect and collate the necessary
performance data or information and capture the result against the target for the period concerned.
As such, they need not be against the target for the period concerned. As such, they need not be
accountable for performance on the said performance indicator.
5.3.5 PERFORMANCE ANALYSIS
Performance analysis involves the process of making sense of measurements. It requires
interpretation of the performance measurements to determine whether targets have been met /
exceeded and to project whether future targets will be met or not. Where targets have not been met,
the reasons thereof should be examined and corrective action recommended. Where targets have
been met or corrective action recommended. Where targets have been met or exceeded, the key
factors that resulted in such success should be documented and shared so as to ensure organizational
learning.
4.3.6 THE MANAGER RESPONSIBLE FOR EACH INDICATOR SHOULD, THEREFORE
DO THE FOLLOWING:-
1. Capture the performance data against targets on the scorecard.
2. analyse reasons for meeting or not meeting a target
3. Capture a summary of findings on the scorecard.
4. Recommend remedial actions as appropriate.
The completed organizational and SDBIP scorecards should be submitted to a formal meeting of the
senior management team for further analysis and consideration of draft recommendations from the
relevant managers. This level of analysis should examine performance across the municipality in terms
of all its priorities with the aim to reveal and capture whether there are any broader organizational
factors that are limiting the ability to meet any performance targets.
Such analysis should also ensure that quality performance reports are submitted to the Executive
committee and that adequate response strategies are proposed in cases of poor performance. After

reaching agreement on the analyses the management team can take the scorecards to the executive
committee for consideration and review.
4.3.7 PERFORMANCE REPORTING AND REVIEW
The next two steps in the process of performance management (i.e. Performance reporting and
performance Review) will be dealt with at the same time.
This section is further divided into three sections dealing with the requirements for in –year versus
annual reporting and reviews respectively and lastly a summary is provided for the various reporting
requirements.
4.3.8 IN – YEAR PERFORMANCE REPORTING AND REVIEW
The submission of the scorecards to the executive committee for consideration and review of the
entire municipal performance is the next step in the process. The first such report is a major milestone
in the implementation of any PMS and it marks the beginning of what should become a regular event
(i.e. using the performance report as a tool to review the municipality’s performance and to make
important political and management decision on how to improve).
Performance Review is the process where the leadership of an organization reviews the results; and
decides on appropriate action, after the performance of the organization has been measured and
reported. In reviewing the organizational and departmental scorecards, the Executive Committee will
have to ensure that the committed targets have been met; and where they have not, that satisfactory
and sufficient reasons have been provided and that the proposed corrective action is adequate. If
satisfied with the proposed corrective action those should be adopted as formal resolution of Council,
minutes read and actioned accordingly.
As indicated earlier, the organizational and SDBIP scorecards should be submitted to the executive
committee for consideration and review on a quarterly basis. The reporting should therefore take
place as follows:-
Table 102
QUARTER PERIOD UNDER REVIEW MONTH OF REPORTING
1 July to end of September October
2 October to end December January
3 January to end March April
4 April to end June July
The review in January will coincide with the mid-year performance assessment as per section72 of the MFMA. The said section determines that the accounting officer must, by 25 January of each year, assess the performance of the municipality and report to council on inter alia, its service delivery performance during the first half of the financial year and service delivery targets and performance indicators as set out in the SDBIP
4.3.9 ANNUAL PERFORMANCE REPORTING AND REVIEW

On an annual basis a comprehensive report on the performance of the Municipality also needs to be compiled. The requirements for the compilation, consideration and review of such annual report are set out in chapter 12 of the MFMA. In summary it requires that:-
All Municipalities for each financial year compile an annual report. The annual report should be tabled within seven months after the end of the financial year. Soon after the annual report has been tabled it should be made public and local community
should be invited to submit representations thereon. The Municipal Council should consider the annual report within nine months after the end of
the financial year and adopt an oversight report containing the Council’s comments on the annual report.
The adopted oversight report should be made public. The annual report as tabled and council’s oversight report should be forwarded to Auditor-
General, the Provincial Treasury and the department responsible for local government in the Province.
The annual report as tabled and the council’s oversight report should be submitted to the provincial legislature.
The oversight report to be adopted provides the opportunity for full Council to review the
performance of the Municipality. The requirements that the annual report once tabled and oversight
report be made public similarly provides the mechanism for general public to review the performance
of the Municipality. However the Municipality will budget for the compilation of a user friendly
citizens’ report. The citizens’ report should be a simple, easily readable and attractive document that
translates the annual report for public consumption.
Over and above the legal requirements of the MSA and the MFMA, there should be an annual public
campaign that involves the community in the review of municipal performance. Such a campaign
could involve all or any combination of the following methodologies:-
Various forms of media should be used to convey the annual report e.g. radio newspapers,
notice boards (in shops and community halls) and billboards.
The public should be invited to submit comments on the annual report via physical visits to the
Municipality offices, telephone, fax and email.
Public hearings could be held in a variety of locations to obtain input of the annual report.
Making use of existing structures such as ward committees to disseminate the annual report
and invite comments.
Hosting a number of public meetings and roadshows at which the annual report could be
discussed and input invited.
Producing a special issue of the municipal newsletter in which the annual report is highlighted
and the public invited to comment.
The public review process should be concluded by formal review of the annual report by the IDP
representative Forum of the Municipality.
The annual performance report should be compiled and completed no later than two months after
financial – year end. That will ensure that its outcomes can timeously inform the next cycle of
performance planning.
4.3.10 SUMMARY OF VARIOUS PERFORMANCES REPORTING REQUIREMENT

Annual Performance Report
Section 121(3) A annul performance report would have to be Section 121 (3) (c) of the MFMA outlines the
requirements for Annual performance reporting. An assessment of municipal performance together with
recommendations for council by the audit committee, corrective actions undertaken arising from audit
report and competency compliance for inclusion in the annual report.
Table 103
Report Frequency Submitted for Consideration and or review to
Remarks
1. SDBIP Quarterly ExCo See MFMA Circular 13 of National Treasury for further information
2. Monthly Budget Statements
Monthly Mayor in consultation with ExCo
See sections 71 and 54 of the MFMA
3. Organisational Scorecard
Quarterly ExCo This PMS framework (see section 2.
4. SDBIP mid- year budget and performance assessment
Annually in Jan of each year
Mayor + ExCo Council
See section 72 and 54 of the MFMA
5. Performance Report
Annually Council See section 46 of the Municipal Systems Act as amended. Said report to form part of the annual report
6. Annual Report Annually Council See chapter 12 of the MFMA
Table104 PERFORMANCE MANAGEMENT PLAN
Reporting Structure
Reviewing Structure
Report Submission
Date Where When
Divisions Directorates Monthly performance reports
25th of each month
Directorate Monthly
Directorates Executive Management Committee
Monthly performance reports
27th of each month
Municipal Manager’s Office
Monthly
Directorates
IDP/PMS and Budget Steering Committee
Quarterly performance reports
10th the of next month after the end of each Quarter
IDP/PMS Unit
Quarterly

Reporting Structure
Reviewing Structure
Report Submission
Date Where When
Directorates
IDP/PMS and Budget Steering Committee
Mid-term performance reports
10th of January
IDP/PMS Unit
Mid-year
Portfolio Committee
Portfolio Committee
SDBIP Quarterly Report
First and second week next month after the end of each Quarter
IDP/PMS Unit
Quarterly
Directorates
Executive Mayoral Committee
Council
Mid-term performance reports
25th January Strategic Planning Session
Mid-year
IDP/PMS Unit
Audit Committee
Internal Audit Unit
Consolidated Directorates Quarterly performance reports audit
Quarterly Performance analysis report
14th of the next month after the end of the Quarter
Municipal Manager’s Office
Internal Audit Unit
Quarterly
Directorates
IDP/ PMS and Budget Steering Committee
Council
Annual Performance reports
10th July IDP/PMS Unit
Annually
IDP/PMS Unit
IDP/ PMS and Budget Steering Committee
Council
Consolidated Directorates Annual performance reports
Annual Performance analysis report
14th July
Municipal Manager’s Office
Internal Audit Unit
Annually
4.3.11 THE AUDITING OF PERFORMANCE MEASURES
THE ROLE OF INTERNAL AUDIT IN TERMS OF PERFORMANCE MANAGEMENT:

The MFMA requires that the Municipality must establish an internal audit section which could be
outsourced (depending on municipal resources and specific requirements)Section 45 of the MSA
stipulates that the results of the municipality’s performance measures should be audited by the said
internal audit sections as part of the internal auditing process and annually by the auditor- General.
For Makana, the internal audit function will be outsourced in liaison with the Cacadu District
Municipality.
The Municipal Planning and Performance management Regulations stipulates that the internal audit
section must, on a continuous basis, audit all performance and auditing must include an assessment
of the following:-
The functionality of the Municipality’s performance management system.
The internal audit section must therefore on a regular basis audit whether the PMS of the
Municipality is functioning as developed and described in this framework.
Whether the Municipality’s performance management systems complies with the act.
This compliance check would require that the Municipality’s internal audit unit, at least on an
annual basis verify that the Municipality’s PMS complies with the said legal requirements.
The extent to which the Municipality’s performance measurements are reliable in measuring
the performance of by making use of indicators.
The Municipality should have proper information that the internal audit function is able to
access information regularly and to verify its correctness.
The Municipality’s internal auditors must submit quarterly reports on the audits undertaken
to the Municipal Manager and the Audit Committee.
AUDIT COMMITTEE: The MFMA and the Municipal Planning and Performance Management
Regulations require that the Municipal Council Should establish an audit committee consisting of a
minimum of three members, where the majority of members are not employees of the Municipality.
No Councilor maybe a member of an audit committee. Council should also appoint a chairperson who
is not an employee of Makana Municipality.
The regulations give Municipalities the option to establish a separate performance audit committee
whereas the MFMA provides only for a single audit committee. The operation of Audit Committee
when dealing with performance management is governed by section 14 (2-3) of the regulations which
require the audit committee to do the following:-
Review the quarterly reports submitted to it by the internal audit unit.
Reviews the municipality PMS and make recommendations in this regard to the council of the
Municipality.
At least twice during a financial year submit an audit report to the Municipal Council.
In order to fulfil their function, a performance audit committee may according to the MFMA and the regulations:-
Communicate directly with the council, Municipal manager or the internal and external auditor of the Municipality concerned;

Access any municipal records containing information that is needed to perform its duties or exercise its powers;
Request any relevant person to attend ant of its meetings and if necessary to provide information requested by the committee, and
Investigate any matter it deems necessary for a performance of its duties and the exercise of its powers.
PERFORMANCE INVESTIGATIONS: The Audit Committee should also be able to commission in depth performance investigations where there is either continued poor performance or a lack of reliability in the information being provided. Those performance investigations should assess the following:-
The reliability of reported information. The extent of performance gaps from targets. The reasons for performance gaps. Corrective action and improvement strategies.
The outsourced internal audit section will be used to conduct these investigations and should ensure the involvement of people who are experts in this area. For each investigation, clear terms of reference will need to be adopted by council.
5.3.12 STAKEHOLDER ROLES AND RESPONSIBILITIES
Table 105
STAKEHOLDER ROLE
Council / ExCo
Adopt the PMS Framework & PMS Adopt the Municipal Scorecards Conduct Annual Review Commission Performance Audits Reports to the Public and Province
Management team
Plan for PM Adopt the PMS Framework & PMS Draft scorecards Approve Departmental Scorecards Conduct Performance Measurements Produce PM reports Commission Performance Audits
Audit committee
Assess Performance Management Reports & Make
recommendation
Internal audit Audit the results of performance Measurements
4.4 PERFORMANCE MANAGEMENT AT INDIVIDUAL LEVEL The reality is that the Municipality is an institution that employs people, thus its performance is highly dependent on employees. It therefore follows that performance needs to be managed at individual employee level. The individual performance management system is a vehicle for implementing the operational plans emanating from the linkages between individuals, functions and the broader Municipal objectives, The PMS is aimed at providing specific standards to assist the employer,
management and municipal staff to perform to the required standards. Makana will use the individual PMS to:-
Manage and measure behaviours’ that contribute to organisational and individual success. Recognise levels of actual performance in relation to agreed targets Encourage continuous improvement and efficiency Identify and act on areas for individual development. Provide a platform for communication on performance between superiors and employees.
This section discussed the structured process for managing performance of the municipal manager and the employees that are directly report to her separately discussed the process of managing performance for the rest of municipal staff.
4.4.1 PERFORMANCE MANAGEMENT FOR SECTION 57 MANAGERS
Performance management for municipal manager and the employees that directly report to him swill strictly adhere to the provisions of the Municipal performance regulations (2006). The key phases are, namely, Performance Contracting, Performance review, and Performance assessment. This section will also discuss dispute relating to PM.
4.4.2 PERFORMANCE CONTRACTING
Performance contracting is characterized by the consultation between the employer and the employee regarding specific performance standards that should be adhered to during the given financial year. Being the first of the three key phases, performance contracting entails the signing of the performance Agreement within one month after commencement of each financial year, with the purpose to:-
Comply with the contract of employment Comply with section 57 of the MSA; Specify the agreed objectives and targets, and communicate within municipality’s
performance expectations in line with the IDP, the SDBIP and the budget; Specify accountabilities that are drawn in the Performance Plan Serve as basis of the municipality’s commitment to a performance orientated relationship Provide a platform for monitoring, evaluating and measurement performance against
targeted outputs and subsequently rewarding good performance.
At this phase, the employee will commit to focusing on implementing the key objectives (i.e. KPA’s including any relevant special projects and the core Competency Requirements (CCR’s).
The KPA and CCRs are assigned a weight, respectively. Such weighting (as it is known) denotes the relative importance of the key objective to each other. The KPAs would cover the main areas of work and would account for 80% whereas the CCRs would account for 20% of the final performance assessment. For the MM the KPA’s are as follows:
Basic Service Delivery Municipal Institutional Development and Transformation
Local Economic development
Municipal Financial Viability and Management Good governance and Public Participation
For managers that directly account to the MM, the KPAs that are related to the functional areas of that manager’s position, should be negotiated between that manager and municipal manager. The CCR that is critical for the employee’s job should be selected from the following list and must also note the compulsory Core Managerial Competencies.
4.4.3 CORE MANAGERIAL COMPETENCIES
Strategic Capability and Leadership Programme and Project Management ( compulsory) Financial Management Change Management Knowledge Management Service Delivery Innovation Problem solving and analysis People Management and Empowerment ( Compulsory) Client orientation and customer focus ( Compulsory) Communication Honesty and Integrity
4.4.4 CORE OCCUPATIONAL COMPETENCIES
Competence in self –Management Interpretation of and implementation within the legislative and national policy frameworks Knowledge of development local government Knowledge of Performance Management and reporting Knowledge of global and South African specific political, social and economic context Competence in policy conceptualization, analysis and implementation Knowledge of more than one functional municipal field / discipline Skills in mediation Skills in governance Competence as required by other national line sector departments Exceptional and dynamic creativity to improve the functioning of the municipality
4.4.5 LIST OF CORE COMPETENCY REQUIREMENTS (CCRS) FOR EMPLOYEES
In order to address the development gaps that support the achievement of set performance targets, a personal development plan (PDP) will be developed and form part of the Performance Agreement i.e. In line with the MFMA the performance agreements will be made available to the public.
4.4.6 PERFORMANCE REVIEW
Performance review is aimed at checking and monitoring progress of the employee in satisfying the key objectives and their targets. Performance reviews will happen at the end of the first, second and third quarters of the year as noted below
Table 106
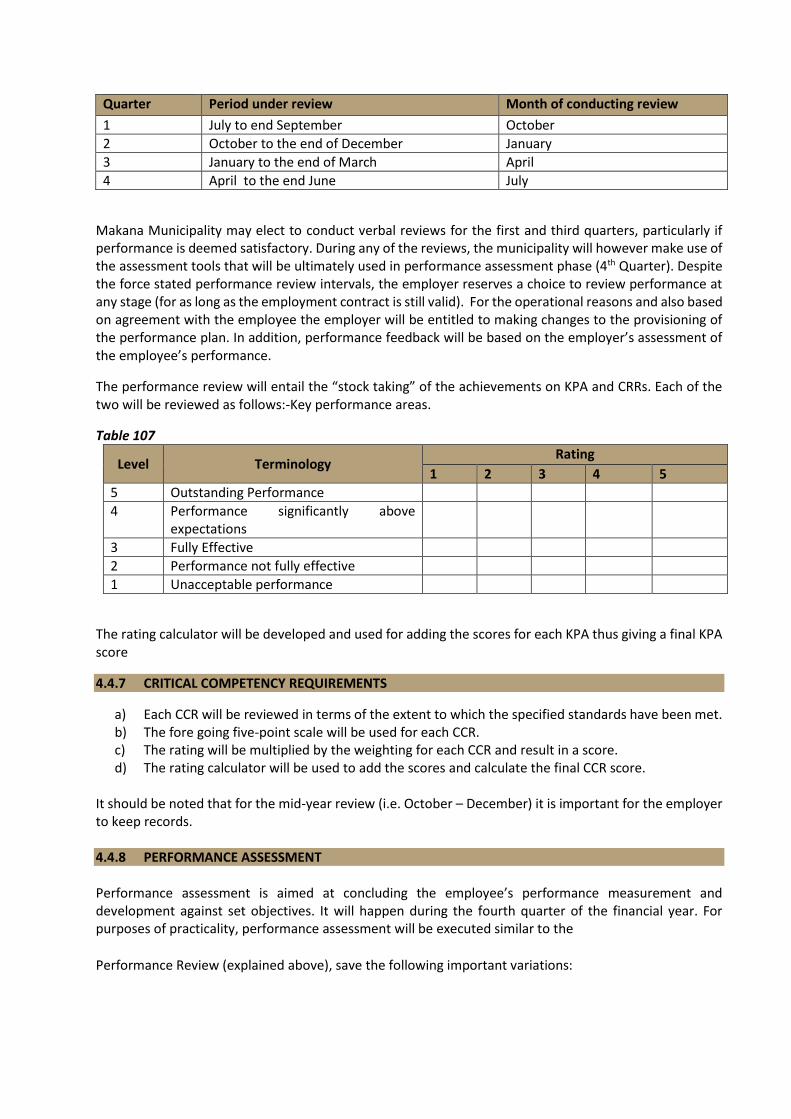
Quarter Period under review Month of conducting review
1 July to end September October
2 October to the end of December January
3 January to the end of March April
4 April to the end June July
Makana Municipality may elect to conduct verbal reviews for the first and third quarters, particularly if performance is deemed satisfactory. During any of the reviews, the municipality will however make use of the assessment tools that will be ultimately used in performance assessment phase (4th Quarter). Despite the force stated performance review intervals, the employer reserves a choice to review performance at any stage (for as long as the employment contract is still valid). For the operational reasons and also based on agreement with the employee the employer will be entitled to making changes to the provisioning of the performance plan. In addition, performance feedback will be based on the employer’s assessment of the employee’s performance.
The performance review will entail the “stock taking” of the achievements on KPA and CRRs. Each of the two will be reviewed as follows:-Key performance areas.
Table 107
Level Terminology Rating
1 2 3 4 5
5 Outstanding Performance
4 Performance significantly above expectations
3 Fully Effective
2 Performance not fully effective
1 Unacceptable performance
The rating calculator will be developed and used for adding the scores for each KPA thus giving a final KPA score
4.4.7 CRITICAL COMPETENCY REQUIREMENTS
a) Each CCR will be reviewed in terms of the extent to which the specified standards have been met. b) The fore going five-point scale will be used for each CCR. c) The rating will be multiplied by the weighting for each CCR and result in a score. d) The rating calculator will be used to add the scores and calculate the final CCR score.
It should be noted that for the mid-year review (i.e. October – December) it is important for the employer to keep records. 4.4.8 PERFORMANCE ASSESSMENT Performance assessment is aimed at concluding the employee’s performance measurement and development against set objectives. It will happen during the fourth quarter of the financial year. For purposes of practicality, performance assessment will be executed similar to the
Performance Review (explained above), save the following important variations:

a) It will not be ‘’stock take’’ but a ‘’final evaluation’’ exercise for the financial year. b) The minimum composition requirements of the evaluation panels will be as follows:
Table 108
EVALUATION OF THE MM EVALUATION OF MANAGERS ACCOUNTABLE
TO THE MM
Mayor MM
Chairperson of the audit committee Chairperson of the audit committee
Executive Committee Member Executive Mayoral Committee Member
Mayor or MM from another municipality MM from another municipality
Ward Committee Member nominated by Mayor HR Manager or Manager responsible PMS for
secretarial purposes HR Manager or Manager responsible PMS for
secretarial purposes
c) Performance assessment will form the basis of rewarding outstanding performance and
correcting unacceptable performance. d) Using the rating calculator, the range of performance bonus will allocated as follows, as a
percentage of the all-inclusive remuneration package. Table 109
Performance Score Performance Bonus
150% + 10% - 14%
130% to 149% 5% - 9%
e) Unacceptable performance will be handled through providing remedial support to improve the
employee’s performance for an agreed timeframe (with the employer). If such structured attempts
prove to be unsuccessful, the employer should take steps to terminate the contract on ground of
unfitness or incapacity. In the case, there should be adherence to the provisions of the Labour
Relations Act.
f) Within 14 days of concluding the assessment of the MM’s performance, the results thereof will be
submitted to the MED for Eastern Caper local government and the national Minister for local
government.
4.4.9 PERFORMANCE MANAGEMENT FOR ALL OTHER MUNICIPAL STAFF MEMBERS The Municipality will be focusing in the next following years in cascading Performance management to all employees. PMS has been cascade up HOD level but no review has been conducted yet. 4.4.10 GENERAL ISSUES RELATING TO PERFORMANCE MANAGEMENT

This section highlights some general issues related to performance management that need to be taken into account in implementing the PMS in the Municipality. 4.4.11 ANNUAL REVIEW OF THE PERFORMANCE MANAGEMENT SYSTEM After the full cycle of the annual review and reporting is complete and the audit committee has met as required, the internal audit function will compile a comprehensive assessment/ review report. The report will be on whether the Municipality’s PMS meets the system objectives and principles as set out in this framework and whether it complies with the MSA, PMS Regulations and the MFMA. The report will need to be considered by the audit committee who will then submit any recommendations to the Executive Committee. The review undertaken and recommendations made by the audit committee could serve as input into the wider municipal review of the PMS. After the full cycle of the annual review, the Municipal Manager should initiate an evaluation report that includes inputs from departments. The report will then be discussed by the management team and finally submitted to the Council for discussion and approval. All those steps will also fulfil the MSA’s requirement that the Municipality should annually evaluate its PMS. 4.4.12 AMENDMENTS TO KPI’S AND TARGETS The Municipality will need to adopt a policy on amendments to performance indicators and targets. As a policy area, such amendments may be proposed but will be subject to the approval of the Executive Committee in consultation with the Municipal Manager. 4.4.13 INTEGRATING PMS WITH THE COUNCIL’S EXISTING MANAGEMENT CYCLE International best practice indicates that PMS stands the chance to succeed if it is integrated with the current management cycle of the Municipality. The purpose of such a cycle would be to guide the integration of important process e.g. the strategic planning or development process in terms of the IDP methodology, the annual budget process and the formal process of evaluating and assessing Council’s performance in terms of the approved PMS and this framework. Makana Municipality will develop and adopt a similar cycle that is suitable to its own circumstances and requirements. 4.4.14 INSTITUTIONAL ARRANGEMENTS The implementation of the PMS in terms of this framework would require coordination at organisational level ad that will be the task of the IDP–PMS Manager’s position which will be acting on behalf of the Municipal Manager Performance Agreement. For PMS at an individual level, the responsibility for co-ordination, administration and record keeping will be the responsibility of the position that is responsible for human resource management. Likewise, such duties will form part of the Corporate Service Director Performance Agreement. The municipality will ensure that its outsourced internal audit section has expertise in dealing with performance management responsibilities which are practically over and above the traditional financial audit responsibilities.
4.4.15 CONCLUSION Performance Management System has been implemented for section 57 managers and plans are in place to cascade to lower levels starting form Head of Department level in the next financial year 2017/22.