Embed Size (px)
Citation preview

1
GENERAL FISHERIES COMMISSION FOR THE MEDITERRANEAN
COMMISSION GÉNÉRALE DES PÊCHES POUR LA MÉDITERRANÉE
DRAFT
ENHANCING SMALL-SCALE FISHERIES VALUE
CHAINS IN THE MEDITERRANEAN AND BLACK SEA
Thematic session IV – part 1
prepared by Mohamed Naji
The designations employed and the presentation of material in this information product do not imply the expression of any
opinion whatsoever on the part of the Food and Agriculture Organization of the United Nations (FAO) concerning the legal
or development status of any country, territory, city or area or of its authorities, or concerning the delimitation of its frontiers
or boundaries. Moreover, the designations employed and the presentations of material in this information product have been
provided for users' convenience without any representation when compiled and do not purport to represent reality truthfully.
The mention of specific companies or products of manufacturers, whether or not these have been patented, does not imply
that these have been endorsed or recommended by FAO in preference to others of a similar nature that are not mentioned.
The views expressed in this information product are those of the author(s) and do not necessarily reflect the views or policies
of FAO.
Countries/States
The words "countries" and “States” appearing in the text refers to countries, territories and areas without distinction.

2
CONTENTS
1 OUTLINE OF THE SMALL-SCALE FISHERIES SECTOR, ITS VALUE CHAINS
AND ECONOMIC ACCOUNTS IN LIGHT OF THE CURRENT ECONOMIC CRISIS
1.1 Trends in international production, trade and consumption
1.2 Figures of the small scale fisheries sector
1.3 Mediterranean fisheries sector
1.4 Global crisis and its impact on small scale fisheries
1.5 Sustainability issues in fish supply chains
2 MAIN COMPONENTS OF LOCAL, NATIONAL AND INTERNATIONAL VALUE
CHAINS RELATED TO SMALL-SCALE FISHERIES PRODUCTION 2.1 Global fishery value chains
2.2 Drivers and governors of change on fish demand and supply
2.3 Main components of small-scale fisheries value chain
3 COSTS AND EARNINGS ANALYSIS OF SMALL-SCALE FISHERIES AND
REASONS FOR DIFFERENCES
3.1 Value chain and cost earnings analysis
3.2 Price linkages in value-chains
3.3 Revenue distribution through the seafood value chain
3.4 Value addition opportunities in the small-scale seafood industry
4 ANALYSIS OF SMALL-SCALE FISHERIES PRODUCTION THROUGH THE
VALUE CHAIN METHOD
4.1 The value chain concept applied to fisheries and aquaculture
4.2 Main steps in value chain analysis
4.3 The Value chain upgrading strategy
3
1. OUTLINE OF THE SMALL-SCALE FISHERIES SECTOR, ITS VALUE CHAINS AND ECONOMIC ACCOUNTS IN LIGHT OF THE CURRENT ECONOMIC CRISIS
1.1 Trends in international production, trade and consumption
The important contribution of fisheries to human well-being is frequently underestimated. Not only do
fisheries generate employment for millions, but fish provides vital nutrition to billions and is often
essential to the diet of the poor (World Bank, 2010).
The last 15 years have been marked by significant changes (FAO, 2010):
− the rapid increase in global aquaculture production;
− which is, in turn, a response to the rising demand for fish and fishery products;
− a growth in world trade of fish and fisheries products, particularly in value terms; and,
− an overwhelming call for more responsible management, as global consciousness for the well-
being of our natural resources within their ecosystems.
Global fisheries and aquaculture production
According to the FAO Capture Database, for Inland and Marine fisheries, the total global capture
production in 2011 was the third ever, slightly after 1996 (93.8 million tons) and 2000 (93.5) (FAO,
2013b).
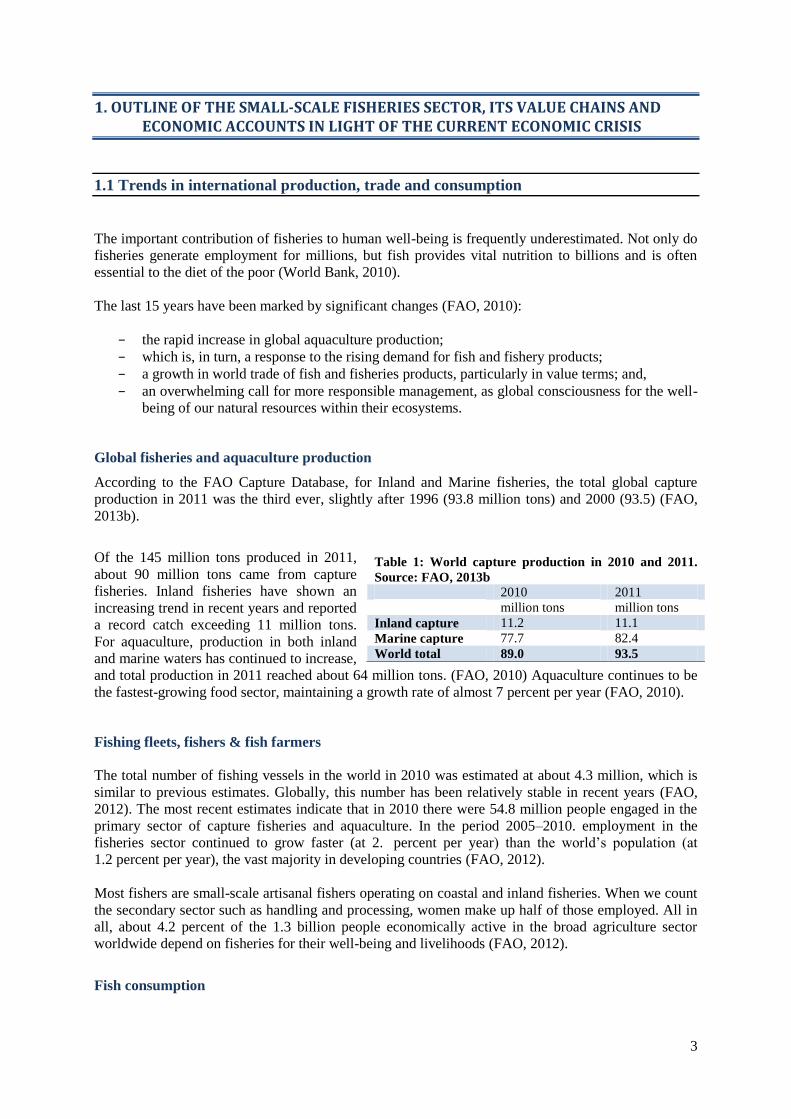
Of the 145 million tons produced in 2011,
about 90 million tons came from capture
fisheries. Inland fisheries have shown an
increasing trend in recent years and reported
a record catch exceeding 11 million tons.
For aquaculture, production in both inland
and marine waters has continued to increase,
and total production in 2011 reached about 64 million tons. (FAO, 2010) Aquaculture continues to be
the fastest-growing food sector, maintaining a growth rate of almost 7 percent per year (FAO, 2010).
Fishing fleets, fishers & fish farmers
The total number of fishing vessels in the world in 2010 was estimated at about 4.3 million, which is
similar to previous estimates. Globally, this number has been relatively stable in recent years (FAO,
2012). The most recent estimates indicate that in 2010 there were 54.8 million people engaged in the
primary sector of capture fisheries and aquaculture. In the period 2005–2010. employment in the
fisheries sector continued to grow faster (at 2. percent per year) than the world’s population (at
1.2 percent per year), the vast majority in developing countries (FAO, 2012).
Most fishers are small-scale artisanal fishers operating on coastal and inland fisheries. When we count
the secondary sector such as handling and processing, women make up half of those employed. All in
all, about 4.2 percent of the 1.3 billion people economically active in the broad agriculture sector
worldwide depend on fisheries for their well-being and livelihoods (FAO, 2012).
Fish consumption
Table 1: World capture production in 2010 and 2011.
Source: FAO, 2013b
2010 2011
million tons million tons
Inland capture 11.2 11.1
Marine capture 77.7 82.4
World total 89.0 93.5

4
Despite commitment to restore global fish stocks to sustainable levels by 2015 whenever possible,
consumption of fish is rising at increasingly unsustainable levels. The total food fish supply and hence
consumption has been growing at a rate of 3.6 percent per year since 1961, while the world’s
population has been expanding at 1.8 percent per year (FAO, 2012).
In 2011, capture fisheries and aquaculture supplied the world with 131 million tons of fish for human
consumption, an all-time-high average of 18.8 Kg per capita (FAO, 2012). Globally, fish provides
about 3.0 billion people with almost 20 percent of their intake of animal protein, and 4.3 billion people
with about 15 percent of such protein.
At present, the overall maximum potential from wild capture fisheries in the oceans has been reached.
Since it is foreseen that the global demand for fish will continue to increase, future growth will have to
come from aquaculture (FAO, 2010).
Market situation
The fish market is adjusting to recent supply and demand imbalances which have caused price
fluctuations. After a period of strong growth in 2011 and early 2012, the fish sector experienced a
slower expansion (Sapkota et al., 2012). Further strong growth is expected, despite slowed trading
from the current global economic crisis and food price volatility (FAO, 2010).
During 2012, the value of trade set a new record at more than USD 129.3 bn, but it was only a modest
increase over 2011 (+1.5 percent) as international prices of fish and fishery products for human
consumption have been under downward pressure in 2012. The price dip was the result of a reduced
consumer demand in many key markets. These tendencies were reflected in the FAO Fish Price Index,
which shows international fish prices sliding by almost 6 percent in 2012 compared to 2011 for total
fisheries products, but by more than 17 percent if taking into account only farmed fish (Sapkota et al.,
2012).
Fish has become among the most highly traded food commodities with nearly 40 percent of all
production now exported. This has particularly benefited developing countries who now account for
more than 50 percent of all fishery exports in value terms and more than 60 percent in quantity (live
weight) (FAO, 2012).
Projection highlights
Economists expect a continuing strong growth in fisheries, according to summaries published from the
upcoming OECD/FAO ten year food supply outlook (due June 26). Capture fisheries’ output is
projected to rise by only 5 percent by 2022 with aquaculture increasing by 35 percent. World fisheries
production is projected to reach 181 Million metric tons by 2022. Aquaculture is projected to surpass
capture fisheries as the main source for human consumption by 2015 (OCDE and FAO, 2013).
Fish product prices are projected to rise strongly over the coming decade as a result of strong demand,
rising production costs and slowing production growth with continuing price volatility associated with
supply swings. Rising prices are also projected for fish-meal and fish oil to 2022 with continuing rapid
growth in per capita consumption and slowing production trends (OCDE and FAO, 2013).
Table 2: Perspectives of fish supply (FAO, 2010)
Fish supply (mt) 2010 (baseline) 2030 (projection)
Aquaculture 59 123
Capture fisheries 88 88
Total supply 147 211
percent of aquaculture: 40 (48 for human
consumption)
58
Source: Estimation of FI Department
5
World per capita consumption (round weight) is expected to increase 8 percent over the decade, from
19 kg to 20.6 kg per person. Most of this growth will be supplied by aquaculture (OCDE and FAO,
2013).
1.2 Figures of the small scale fisheries sector
Introduction
Small-scale fishing is much more significant than most people realize. Like small-scale agriculture,
small-scale fishing is widespread and crucial to employment and food supply in innumerable
communities in developing nations, where some 95 percent of all fishers ply their trade (FAO 2002a)
quoted in (Yumiko, et al., 2004).
Raising awareness of the importance of small-scale fisheries is particularly relevant not only because
these livelihoods depend on sustainable use of the natural resource base, but also because these
fisheries provide vital local nutritious food and a safety net for many poor households in coastal
communities in developing countries (World Bank, 2010).
Because of their variety, dispersion and social complexity, small-scale fisheries are often poorly
documented, poorly regulated and many of the complex management issues remain largely
unresolved. At a time when fisheries resources are increasingly depleted and climate change poses a
growing threat, failure to effectively address the issues confronting small-scale fisheries places the
livelihoods of millions of people at risk (World Bank, 2010).
An accurate picture of small-scale fishing at the global level is also hard to assemble, because the
definitions of small-scale and artisanal fishing vary by country, and because the fish caught by small-
scale fishers frequently go unreported in official government statistics. This means that the economic
importance of the sector remains hidden from official view, and the implications for national fisheries
policy remain unclear (Yumiko, et al., 2004).
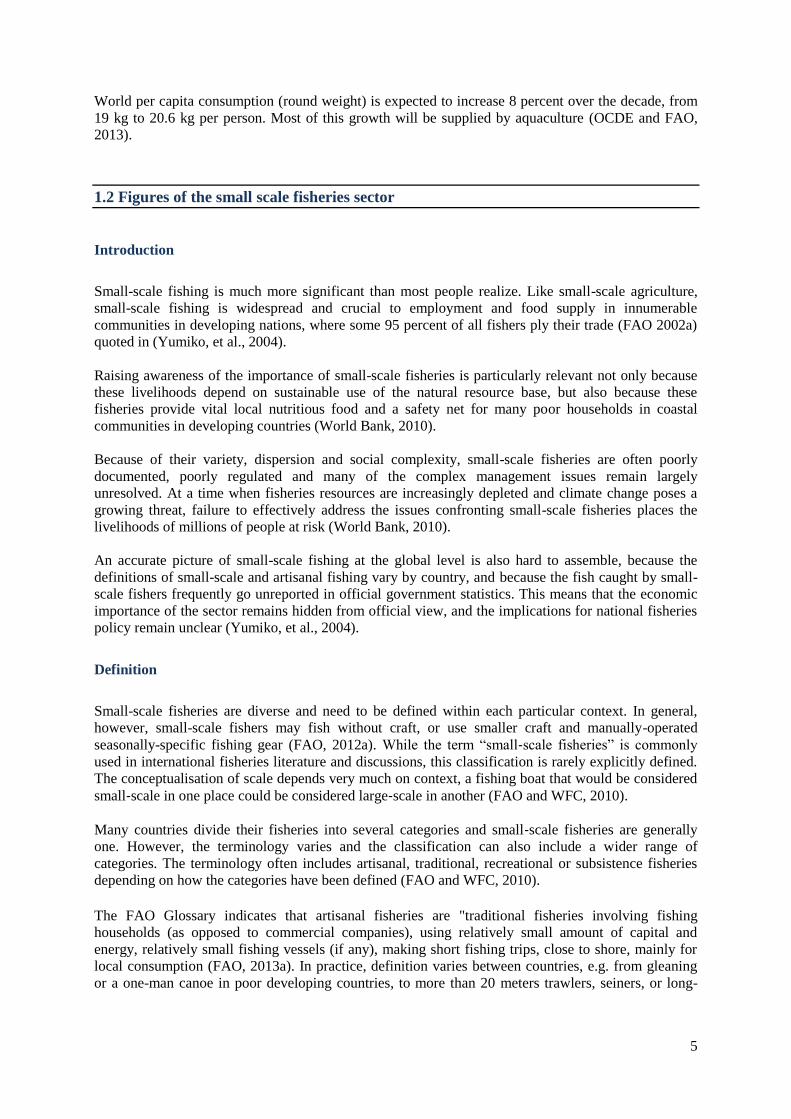
Definition
Small-scale fisheries are diverse and need to be defined within each particular context. In general,
however, small-scale fishers may fish without craft, or use smaller craft and manually-operated
seasonally-specific fishing gear (FAO, 2012a). While the term “small‐scale fisheries” is commonly
used in international fisheries literature and discussions, this classification is rarely explicitly defined.
The conceptualisation of scale depends very much on context, a fishing boat that would be considered
small‐scale in one place could be considered large‐scale in another (FAO and WFC, 2010).
Many countries divide their fisheries into several categories and small‐scale fisheries are generally
one. However, the terminology varies and the classification can also include a wider range of
categories. The terminology often includes artisanal, traditional, recreational or subsistence fisheries
depending on how the categories have been defined (FAO and WFC, 2010).
The FAO Glossary indicates that artisanal fisheries are "traditional fisheries involving fishing
households (as opposed to commercial companies), using relatively small amount of capital and
energy, relatively small fishing vessels (if any), making short fishing trips, close to shore, mainly for
local consumption (FAO, 2013a). In practice, definition varies between countries, e.g. from gleaning
or a one-man canoe in poor developing countries, to more than 20 meters trawlers, seiners, or long-

6
liners in developed ones. Artisanal fisheries can be subsistence or commercial fisheries, providing for
local consumption or export. They are sometimes referred to as small-scale fisheries" (FAO, 2013a).
While small-scale and artisanal fisheries clearly differ from industrial and recreational fisheries, the
subtle distinctions between them are hard to pin down. The FAO Glossary tends to equate "artisanal"
with "small-scale". From a technological point of view, however, these are connected but have
somewhat different concepts related, on the one hand, to the size of the fishing unit (the scale) and, on
the other hand, to the relative level of technology (or "artisanality") expressed as the capital
investment / man-on-board (FAO, 2013a).
The term "small-scale fisheries" is more frequently used by Anglophones. The term "artisanal
fisheries" is often used in French and Spanish-speaking areas to mean relatively low levels of
technology, sometimes paired with low levels of organization and industrialization, but with little
reference to size (FAO, 2013a).
"Relatively" is the key term to bear in mind when trying to determine if a given fishing operation is
small-scale, artisanal, or industrial. The best test is to graphically combine both the vessel size and
degree of technology. This is illustrated in the accompanying figure which plots two axes (FAO,
2013a):
1. relative scale (or vessel size), as measured by tons
of displacement; and,
2. relative technological complexity (the inverse of
"artisanality"), as measured by the relative capital
investment in boat and equipment per fisher on
board (FAO, 2013a).
Figure 1: Graphic definitions of small-scale,
artisanal and industrial fisheries as a function of
vessel size and relative technological investment
Source: FAO/Fisheries Department
Within a given region, with homogenous socio-economic
characteristics, all boats which fall somewhere within the
lower left-hand quadrant with smaller size and lower technological investment per fishers are usually
considered as being small-scale and/ or artisanal (FAO, 2013a).
In the Mediterranean context, the word métier corresponds to a combination of gear, target specie and
fishing geographic zone. It is a pragmatic definition to give answer to the need of study of the
management systems defined using the traditional knowledge. Temporal dimension is underlying
through the seasonal nature brought on by the couple target species x zone.
"Metier" notion enables to better define the effective effort implemented on a resource and it leads to a
fleets distribution bearing in mind the strategies, the usages and the fishermen knowledge. It allows to
identify more operational management units.
A comparative analysis of the definition of artisanal fisheries in each country shows that three criteria
are the most commonly used: length, gross tonnage and fishing gears/target species. In fact, this last
criterion helps the most to characterize what is not included in artisanal fisheries.
Employment

7
The FAO estimates that about 120 million people are directly dependent on commercial capture
fisheries for their livelihoods as fulltime or part time workers, including employment in the post-
harvest sector. Small-scale fishing is a labour intensive activity and it is estimated that each fisher’s
job creates at least two other jobs in processing and distribution (Le Sann, 1998). Ninety-seven percent
(116 million) of “fish workers” live in developing countries and over 90 percent are small-scale
operators—people who use small fishing vessels with a relatively low level of capital investment. That
number does not include the many millions of fish farmers also working at the small or artisanal level.
In the small-scale fisheries, about half (47 percent) are women, mainly engaged in the post-harvest
activities, handling the fish after it is caught and ensuring that this important source of nutrition
reaches more than 1 billion consumers for whom fish is a key component of their diets (World Bank,
2010). Estimates of women’s participation in the fisheries workforce in BNP case study countries
showed that there are almost as many women as men employed in the fisheries sector when also
including post-harvest activities. If excluding China, the average proportion of women fishers and fish
workers approaches 60 percent (FAO and WFC, 2010) Data on fisheries employment in Europe
shows that, also in developed countries, very few women work onboard vessels. Still, they represent a
third of the total sector workforce of some 400 000 people (fulltime and parttime) and they are mostly
employed in the fish processing industry (Salz et al, 2006) (FAO and WFC, 2010).
Inland water fisheries are particularly important in developing countries and over 48 percent (60
million) of those employed in fisheries in developing countries work in small-scale inland fisheries
(lakes, rivers, wetlands) (World Bank, 2010).
In addition to fulltime and part-time employment, the small‐scale sector – in particular in inland
waters – provides a source of food and income to millions of occasional fishers and fish workers. The
sector plays an important role in food security and poverty prevention, constituting a security net for
poorer populations both in inland water and coastal areas (FAO and WFC, 2010).
Based on the Big Number Project (BNP) case study information, it is estimated that the total number
of small‐scale fishers in all developing countries reaches some 25‐27 million. More than half of these
are found in inland waters. The large scale sector employs much fewer; only 1‐2 million people.
Therefore, in terms of employment, smallscale fishing is a bigger factor in many national economies
than large-scale industrial fishing, even though industrial fishers are usually responsible for a larger
share of the catch. In general, although industrial fleets are more efficient at catching fish, and
therefore more profitable, they generate much less employment than small-scale fishing. Globally, the
fisheries sector is likely to employ some 30 million fulltime and part-time fishers of which 90 percent
are in developing countries (FAO and WFC, 2010).
Although the growth in industrial fishing is clearly putting pressure on small-scale fishing in many
regions, the number of small-scale fishers continues to grow in many countries (Yumiko, et al., 2004).
According to FAO (2013c), the small-scale fisheries sector, including fishing and fish farming, is
estimated to employ some 37 million people, of whom around 90 percent are in Asia. An additional
100 million people are estimated to find employment in associated activities. Many more people are
involved in part-time or seasonal fisheries activities, and the benefits of fish consumption are much
more widely significant around the world (FAO, 2013c).
Production
The global aggregate capture fisheries GDP is slightly below 1 percent of global GDP. The total
commercial capture fisheries sector’s contribution to the global GDP (including marine and inland
harvest and post-harvest subsectors), is estimated at approximately US$274 billion in 2007 (World
Bank, 2010). In addition, fisheries also create upstream employment and economic activity in other
sectors such as boat building, gear manufacturing, port services, telecommunications, retailing and

8
restaurants. Upstream economic activities and recreational fisheries may add a further $160 billion to
the GDP estimate (World Bank, 2010).
In addition, subsistence fisheries constitute a vital but largely un-quantified economic activity and
livelihood component of rural communities and particularly of the poor. In some cases, the unrecorded
subsistence fish production is greater than the officially recorded production, particularly in inland
waters and for dispersed coastal communities (World Bank, 2010).
Global expenditures on recreational fisheries are some $190 billion to the global economy and provide
recreation and food for some 220 million anglers. Recreational fisheries can be of greater economic
importance than commercial fisheries in some countries and contributes in the order of $70 billion to
global GDP (World Bank, 2010).
Large-scale fisheries land more fish, but small-scale fisheries produce more fish for domestic human
consumption. Over half of the catch in developing countries is produced by the small-scale sector and
90-95 percent of the small-scale landings are destined for local human consumption (World Bank,
2010).
Like other primary production sectors, the fisheries sector tends to be more important in developing
economies than in developed economies. The catch per unit of fossil fuel is similar in motorized
small-scale and large-scale fisheries, but small-scale fisheries employ several times more fish people
per ton of harvest than large-scale fisheries and generate less wastage in the form of discards
(unwanted catch dumped at sea) (World Bank, 2010).
Some experts estimate that, as a whole, small scale fishers produce as many fish for direct human
consumption as industrial fishers (Berkes et al. 2001; Misund et al. 2002; World Bank et al. 1992). As
indicated earlier, fish harvested by small-scale fishers often go unreported, and there are no global
statistics on the size of the aggregate small-scale catch. Small-scale operators traditionally catch a
variety of fish species for domestic consumption, including small, low-valued pelagic species as well
as more valuable demersal species. Large industrial fleets tend to concentrate on the most profitable
species only, such as shrimp and demersal fish suitable for export (Horemans. 1998) quoted in
(Yumiko, et al., 2004).
Advantages of small-scale and artisanal fisheries
Several factors have contributed to the lack of attention to small-scale fishing. One of the most potent
is the dearth of information. Data on this sector are notoriously poor, with the number of small-scale
fishers—and especially subsistence level freshwater fishers—grossly underestimated by national
governments.
On the other hand, small-scale and artisanal fisheries often compete, and conflict, with industrial
fisheries. Some of the relative advantages of small-scale and artisanal fisheries in certain conditions
are (FAO, 2013a):
− Lower running costs and fuel consumption;
− Lower ecological impact because artisanal/small-scale fishers employ mainly passive gears;
− Higher employment opportunities: being more labour-intensive, artisanal/small-scale fisheries
are naturally suited in rural areas with high demographic growth, providing employment in
catching as well as processing and trade of fish and fishery products;
− Higher versatility:Small-scale fishing boats can operate from small ports and landing sites
relatively close to the fished resource;

9
− Lower construction costs: as small-scale boats do not usually stay out long, nor go far
offshore, they can be relatively lightly (and inexpensively) built and either stay ashore or else
run for nearby cover when the weather turns foul;
− Less expensive technology: artisanal fisheries require relatively low investment in technology
and equipment and are consequentially more competitive in most developing regions where
labour is cheaper than equipment.
However, many small‐scale fisheries in developing countries are vulnerable to both internal and
external threats. The current volatility of fuel prices constitutes a particular concern in this respect
since fuel typically constitutes a major part of overall costs in small‐scale fishing in developing
countries (FAO and WFC, 2010).
1.3 Mediterranean fisheries sector
The countries bordering Mediterranean host a population characterized by a wide gap in terms of
development. The presence of countries belonging to the EU with high levels of socio-economic
welfare and development, accentuates the differences between countries in the Mediterranean basin,
thus making it more difficult to give a unique profile of the Mediterranean area (Malvarosa and De
Young, 2010).
Marine fisheries are crucial, both socially and economically, to the Mediterranean region, providing
animal protein and supporting food security for over 452,000,000 people. An estimated 32 percent of
this population lives in close proximity to coastal areas, relying on fish resources not just for food but
also for their livelihoods – from fishing and induced activities, but also increasingly from fishing-
tourism (Sauzade and Rousset, 2013).
Small-scales fisheries play a particularly important role in Mediterranean fisheries, where they
represent more than 80 percent of the total vessel fleet (Sauzade and Rousset, 2013). In the Euro
Mediterranean area, artisanal fisheries represents 70 percent of European fishing vessels (30.000 of the
35.000 vessels operating in the Mediterranean).
The COPEMED project (Coppola, 2006) has tentatively identified the main technical and economic
features of the Mediterranean artisanal fisheries (Sauzade and Rousset, 2013):
− Fishing boat owners (or their family)also practice another professional activity;
− The crew is small (1 to 5 people);
− High employment in connection with investment;
− Direct sales to fish traders or restaurants;
− Individual catches of low tonnage but of relatively higher value;
− Low level of hierarchy in the work at sea.
Fishing fleet
Table 3: Estimated fishing feet of the Mediterranean countries operating in
the Mediterranean Sea in 2008
Group of countries Artisanal Total
Northern and Eastern
Mediterranean Countries
40.680 49.700
Southern Mediterranean
Countries
27.451 32.307

10
The status of the
Mediterranean fishing fleet has been assessed by Sacchi (2011) quoted in Sauzade and Rousset (2013):
The artisanal boats represented 83 percent of the total fleet, respectively 82 percent in the NEMC and
85 percent in the SMC. In 2008, the fishing fleet of the SMC countries represented approximately
40 percent of the total Mediterranean fleet (Sauzade and Rousset, 2013).
For the European Commission, the length of the vessel is generally the main criterion for the
application of relevant regulations, with thresholds of 10 meters or 12 meters most often used. For
instance, the recent project on the reform of the CFP provides that vessels under 12 meters will be
exempted from the application of ITQ (Individual Transferable Quotas) measures (Sauzade and
Rousset, 2013). Some Mediterranean countries have adopted their own definition.
Production
In 2007, the total fishery production (capture and aquaculture) of Mediterranean countries was 5.6
million tons (3.6 percent of the total world fishery production). The production from Mediterranean
waters, 2 million tons, amounted to 35 percent of the total (40 percent for capture and 23 percent for
aquaculture production) (Malvarosa and De Young, 2010). In recent years, aquaculture has been the
fastest growth activity in global food production, and this trend is also confirmed in the Mediterranean
basin (Malvarosa and De Young, 2010).
The total catch from the Mediterranean marine capture fisheries rose from 420,000 tonstons in 1950
to close 1,093,000 tonstons, reached in 1995. Ever since, the level of catches has been slowly
decreasing (Sauzade and Rousset, 2013).
Currently, Mediterranean fisheries deliver annual revenues that amount to around US$ 1.3 billion and
support directly and indirectly 458 000 jobs. When the total direct and indirect economic effects
arising from fish populations in the regional economy are accounted for, the total contribution of the
sector to national economic outputs is estimated at some US$ 3.1 billion a year (Sauzade and Rousset,
2013).
A significant difference in landed values between the SMC (Southern Mediterranean Countries) and
the NEMC (North and East Mediterranean Countries) can be explained by the very low level of value
added for catches sold locally in the SMC (Sauzade and Rousset, 2013).
Mediterranean marine fisheries, and more particularly the northern ones, are not only overexploited,
they also have been underperforming in both economic and social terms for decades (Sauzade and
Rousset, 2013).
(Malvarosa and De Young, 2010) by analysing the context of intra-Mediterranean trade, the
Mediterranean exchange matrix reveals that approximately 23 percent of the fishery products imported
by Mediterranean countries come from the Mediterranean basin (Malvarosa and De Young, 2010).
Employment
While employment in capture fisheries has declined since the 1990’s in countries on the northern
shore of the Mediterranean, figures are much higher on the southern shore, where 319,000 individuals
are still employed in the sector (Sauzade and Rousset, 2013). Over 55 percent of this workforce is
employed in small-scale fisheries.
Total 68.131 82.007
Source: Sacchi (2011)

11
In spite of the importance of this sector for so many coastal populations, most of these fisheries are
exploited at an unsustainable level, which directly threatens stocks with overexploitation and the
attendant long-term depletion of the whole sector, increasing economic costs and employment losses
(Sauzade and Rousset, 2013).
Fish consumption
Changes in fish consumption patterns in the Mediterranean basin (due mostly to a growing population,
urbanization and income level) is supported by FAO forecasts on total fish consumption (ISMEA,
2004) (Malvarosa and De Young, 2010). The model output shows that total consumption in the
Mediterranean basin is forecast to grow. In the case of continuous growth of the fish per capita
consumption, the total Mediterranean consumption of fish products will reach about 9.5 million
tonstons in 2030, showing an increase of 30 percent.
Sustainability
Most, if not all Mediterranean fisheries, now face serious challenges resulting from a series of
impacts: environmental degradation, overexploitation of the stocks targeted and poor managements of
these shared resources. In addition, the impacts of climate change are now starting to be felt,
exacerbating the impacts on both ecosystems and species (Sauzade and Rousset, 2013).
The situation is slightly less worrisome in the home fishing areas of southern countries, where the
number of their resources in overexploitation has only increased by a third, while it has more than
doubled in those of other Mediterranean countries during the same period (Sauzade and Rousset,
2013).
1.4 Global crisis and its impact on small scale fisheries
Global Fish Crisis
Fishing remains key to food security for millions of people, a bulwark of local employment, and a
significant factor in the global economy. The increase in the world’s population and the need
for economic development has brought a rapid expansion of commercial fishing and an
overwhelming upsurge in our capacity to exploit fish stocks. The result has been a rapid depletion of
key stocks, and serious disruption and degradation of the marine and freshwater ecosystems they live
in (Yumiko, et al., 2004). Since 1992, overfishing has become one of the major natural resource
concerns in the industrialized world, and increasingly in developing nations as well.
Seventy-five percent of commercially important marine, and most inland water fish stocks are either
currently overfished, or are being fished at their biological limit, putting them at risk if fishing
pressure increases or the habitat degrades (FAO; 2012). Unfortunately, pressure on fish stocks is
primed to increase even as stock conditions continue to worsen.
Demand for seafood products has doubled over the last 30 years and is projected to continue growing
at 1.5 percent per year through 2020 as global population grows and per capita fish consumption rises
(Yumiko, et al., 2004). As ocean catches have dwindled, aquaculture has burgeoned and diversified to
take up the slack to meet food and income needs in developing and developed countries. In fact, over
the past three decades, aquaculture has become the fastest growing food production sector in the
world. But the heavy dependence of intensive systems on human inputs—water, energy, chemicals—
and on wild fish for feed and seed, as well as the effects on ecosystems and species are
major constraints to the sustainability and future growth of this industry (Yumiko, et al.,
2004). Although much of the world’s aquaculture production comes from small- and medium-scale

12
operations, the tendency is toward intensification and higher reliance on wild fish for fishmeal and
seed fish.
Trade has become a driving force in the global fishing enterprise, influencing the species of fish
targeted and farmed, the intensity of fishing pressure, and, in many cases, the incentives for fishing
either sustainably or destructively. Whether trade encourages overfishing or is part of its solution can’t
be answered with certainty. However, it is likely that trade simply magnifies the environmental effects
of existing fishing practices (Yumiko, et al., 2004).
Another important and damaging feature of the growing international trade is the rise in
illegal, unreported, and unregulated (IUU) fishing, which is especially prevalent in fisheries of high
commercial value, such as sashimi-grade tuna (Yumiko, et al., 2004).
Impact of economic crisis on fisheries
In late 2007, a global financial crisis began. This crisis erupted into a full-blown economic recession in
September 2008, representing the greatest financial and economic challenge since the Second World
War. The global economic crisis started in United States of America mainly due to ‘sub-prime
mortgages’ where interest rate was slower down and there was a great demand for housing loans.
(FAO, 2010) Then, this mortgages crisis affected worldwide. Developed countries have so far been the
most affected, with a decline in Foreign direct investment (FDI) inflows in 2008, mainly due to
sluggish market prospects. Flows into developing economies continued to grow in 2008, but at a much
lower rate than the year before. (FAO, 2010)
The impact of economic crisis on developing countries fisheries were transmitted through three
distinct channels: financial sector, exports and exchange rates. The impact manifests itself in several
direct and indirect ways. Some of the impacts were decreased GDP growth rate, high inflation, FDI
inflows and international trade (FAO, 2010). Global gross domestic product (GDP) declined by 2.2
percent in 2009, and trade flows contracted sharply, with a drop of 14.4 percent in world merchandise
trade in 2009 (FAO, 2010).
Roughly speaking, the Economic Crisis gives negative impacts to fisheries and any fisheries-related
business. In domestic fish markets, demand for fisheries products was on decline. Wholesale and retail
prices fall down. Export of fisheries products mainly for european market declined. Exporters,
processing companies, and any type of fish dealers suffered from market slump. Their financial
positions get worse, which causes a decline in fish prices in production sites (FAO, 2010).
With the crisis, food prices fell dramatically. The FAO Fish Price Index reported a drastic drop from
128.0 in September 2008 to 112.6 in March 2009, after which it recovered to 119.5 in November
2009. Virtually no country has escaped the impact of the widening crisis, whose effects are likely to be
felt through to 2011 (FAO; 2010).
Estimates indicate that trade in fish and fishery products declined by 12 percent in 2009 compared
with 2008. Although the most acute phase of the global financial crisis seems to have passed and GDP
growth rates are starting to improve (FAO; 2010).
Today, the global community faces multiple and interlinked challenges ranging from the impacts of
the ongoing financial and economic crisis to greater climate change vulnerabilities and extreme
weather events (FAO; 2012). After the 12 percent drop experienced in 2009, world trade recovered
strongly in 2010 and, according to the World Trade Organization (WTO), merchandise exports
increased by 14.5 percent, sustained by a 3.6 percent growth in global output as measured by gross
domestic product. In 2010, economic conditions rebounded in both developed and developing
economies. However, since late 2011 and early 2012, the world economy has entered a difficult phase
characterized by significant downside risks and fragility, with great uncertainty on how markets will
evolve in the mediuterm. The financial turmoil generated by the intensification of the fiscal crisis in
Europe has expanded to both developing and high-income countries. As a result, and despite relatively

13
strong activity in the United States of America and Japan, key markets for fisheries trade, global
growth and world trade have slowed sharply (FAO, 2012).
Constraints faced by small-scale/artisanal fisheries
In many countries small-scale/artisanal fisheries are still developing rapidly, expanding markets (e.g.
export markets) and adopting new technologies. In many others, however, they are experiencing
difficulties. Except where these fisheries contribute substantially to exports (as in northwest Africa),
have strong ethnic links with the political leaders or involve most of the population (as in island
countries), it is generally not given priority consideration in a country's modernization and
development process (FAO, 2013a).
Artisanal fisheries are often thought to be backwards, sometimes because of a lack of data and
understanding on real trends and socio-economic impact. They are difficult to administer in the
conventional top-down mode because of their physical scattering along the edges of the aquatic
systems, rivers, lakes and marine shores, including in difficultly-accessible areas (FAO, 2013a). This
last characteristic explains the severe constraints faced by these fisheries in terms of management,
access to modern technology, capital, health care, markets, electricity, education, manpower, etc.
These constraints are furthermore compounded by the lack of mobility out of the sector and the area
(except perhaps through migrations) (FAO, 2013a).
The inexorable globalization - with its overriding political and economic consequences - is affecting
small-scale/artisanal fishers lives well beyond their control. Another set of constraints and threats is
added by the high pressures exerted by manifold coastal activities causing water pollution, destruction
of fish habitats, and increasing competition and high prices of coastal land (FAO, 2013a).
Moreover, with the constant pressure of continued population growth, migration from the hinterland
and development of industrial fishing, the "survival" of small-scale/artisanal fisheries depends to a
large extent on the recognition and protection of traditional or acquired fishing rights (FAO, 2013a).
The extent and nature of these rights (individual or communal, transferable or not) are still hotly
debated and there is a danger of exporting industrial-sector solutions aimed at maximizing individual
profits (FAO, 2013a). To develop and maintain the advantages of small-scale /artisanal fisheries, the
system of diversified family livelihoods characteristic of the sector should be protected and
strengthened through rights of access of the communities to a sustainable matrix of productive
activities (FAO, 2013a).
1.4 Sustainability issues in fish supply chains
Small scale fisheries receive less attention
The importance of fisheries, especially small‐scale fisheries, as a source of nutrition, employment and
income for many of the world’s coastal and rural poor can hardly be overestimated. Small‐scale
fishing is a key livelihood strategy for millions of households in coastal and rural communities in
developing countries and plays an important part in food security and poverty alleviation. The growing
threat to sustainable fisheries represented by overcapitalisation, overfishing and environmental
degradation is a global concern but even more so for the many small‐scale fishers and fish workers in
developing countries who are dependent on fishery resources as a key component of their livelihood
strategies (FAO and WFC, 2010).
Small‐scale fisheries in developing countries, which are often unregulated and suffering under the
pressure of rapid population growth, receive less attention with less interest being directed towards
their monitoring and management. Still, it is clear that overfishing, overcapitalisation and
environmental degradation are global problems and that the situation looks precarious both to small
and large‐ scale operators, often depending on the same or adjacent resources (Pauly, 2006; FAO,
2007) quoted in (FAO and WFC, 2010).

14
The depletion of fish stocks and a collapse of the economic activities based on these resources will
have far more severe consequences in small‐ scale fishing communities in developing countries,
where there are few livelihood alternatives and social security systems are generally non‐ existent,
than in more affluent areas of the world (FAO and WFC, 2010).
Small and large scale fisheries interaction
Small and large‐scale fisheries interact, with regard to the resource base but also at the level of
processing, marketing and other auxiliary activities, and there may be both synergies and competition
within and between the two sectors (FAO/RAP/FIPL, 2004; Jacquet & Pauly, 2008). Small‐scale
fisheries in developing countries are vulnerable to such competition as well as to other internal and
external threats (FAO and WFC, 2010).
As fishing technology advances and developing nations continue to support the growth of industrial
fishing, the face of small-scale fishing is changing. Marine fishing in Southeast Asia is gradually
becoming modernized, and industrial fleets are expanding rapidly(Yumiko, et al., 2004). Compared to
Southeast Asia, industrialization of the fisheries sector in West Africa seems slower (Yumiko, et al.,
2004).
Conflicts between industrial fleets and small-scale coastal fishers are becoming increasingly prevalent
in Asia and Africa alike, with small-scale fishers gradually losing ground. In response to increasing
competition from industrial operators, some small-scale operators are attempting to move toward more
profitable forms of fishing, targeting high-value species, such as crab, prawn, redfish, and molluscs
destined for export (SEAFDEC, 2001b) quoted in (Yumiko, et al., 2004).
Any shortfall in fish supplies due to competition with industrial fleets is bound to have a wide array of
negative effects on small-scale fishers, their families, and the communities that are highly dependent
on the local supply of fish for food and livelihood. Small-scale fishers are extremely vulnerable to
problems such as stock depletion, and local employment alternatives may be few if fishing becomes
unviable (Yumiko, et al., 2004)
Fisheries Co-management
Co-management offers an alternative. In small-scale fisheries, particularly in developing countries,
the idea of shared power and responsibilities between the government and fishing communities has
emerged as an alternative framework for managing fish stocks (Yumiko, et al., 2004).
What are the conditions that lead to good community management of common resources? Research
on thousands of cases of community-based management shows that key factors to success include a
community-wide understanding of the value and scarcity of the resource; good
communication among community members; an effort to monitor whether rules are being followed; a
credible system of sanctions (Yumiko, et al., 2004)
Factors undermining the sustainability of Mediterranean fisheries
The issue of factors that undermines the sustainability of Mediterranean fisheries has been the subject
of multiple analyses. Specifically, FAO organized a regional workshop focused on the southern
Mediterranean, the conclusions of which are still relevant (Bodiguel, 2009) quoted in (Sauzade and
Rousset, 2013):
− Strong demand for limited resources: almost all species in the Mediterranean are subject to strong
demand by national and regional markets. In addition to strong national and local demand, there is

15
also regional and international demand for some high commercial value species. This
strong demand, which is not controlled through appropriate management of fishing capacities,
leads to a generalized fleet overcapacity and then, inevitably, to overfishing (Sauzade and Rousset,
2013).
− Failure of institutions and policies: The policies and laws of many countries are out of date and
take insufficient account of the current approaches for sustainable fisheries management.
The management of the fisheries sector is sometimes undefined, or insufficiently formalized in
institutional, legal and operational terms. Mediterranean fisheries are also seriously affected by
failure to apply the rules and regulations (Sauzade and Rousset, 2013).
− Inappropriate incentives: Many incentives are inappropriate. Market-related incentives are often
wrongly interpreted and poorly regulated. Subsidies granted to the sector are too often still being
channeled, directly or indirectly, to the purchase of fisheries inputs, in a situation of generalized
fleet overcapacity. More generally, it has been noted that the management system does not
encourage fishermen to behave responsibly, even when they have rights to the resources or rights
of access to the resources, which should guarantee them continuity of their activity (Sauzade and
Rousset, 2013).
Suggestions for steering toward sustainable fisheries
Sauzade and Rousset (2013) has raised the existence of number of other management tools and
funding sources. The necessary downsizing of the fleet should be made whilst trying to protect the
small-scale fisheries and the associated fragile coastal communities, while not preventing larger fleets
from undergoing the necessary adaptations. A possible way could be to have differentiated
management regimes: one for large-scale fleets, where capacity adjustment and economic
efficiency are at the core, and another for small-scale fleets in coastal communities, with more focus
on social objectives (Sauzade and Rousset, 2013).
In line with the principles of the future European CFP, arrangements for the large-scale segment could
include economic incentives for fleet adaptation such as market-based allocation mechanisms, while
small-scale coastal fisheries would be managed through direct allocation of quotas or effort or through
collective schemes (Sauzade and Rousset, 2013).
The approach to public financial support could be different for the two segments: the large-scale fleet
would be expected to be economically self-reliant, while public funding may help the small-scale
segment adapt to changing conditions towards more sustainable fisheries, thereby strengthening its
economic viability, and maintain its contribution to the life of coastal communities (Sauzade and
Rousset, 2013).
For example, when looking at the value chain for the fisheries sector in Morocco, it quickly becomes
apparent that the largest marginal increase in value occurs very early on, at the so-called first sale
stage, where the fishermen sell and completely lose ownership of their catches. A small number of
fishing cooperatives have attempted to capture that increase in value, by grouping and purchasing all
the landings from their members and then re-selling to various intermediaries, thus cutting, to the
extent possible, the middlemen who traditionally take advantage of artisanal fishermen under pressure
(Sauzade and Rousset, 2013).
Although some of the initiatives described below are still at embryonic stages in Moroccan small scale
fisheries sector, Sauzade and Rousset (2013) suggested that some key lessons can already be learned:
− Reducing poverty, in the long run, can only be achieved by increasing the value of the catches,
rather than their quantity;
− Efforts cannot be applied to the targeted stocks alone, but rather an ecosystem approach is
called for, which also takes into account key and related ecosystems;
− Intervention should occur at all stages: when the resources are still in the water, when they are
landed, and as they enter the transformation and marketing cycle;
16
− Small-scale fishermen are almost always better off when they organize and form cooperatives.
These cooperatives in turn must be supported by local, regional and national authorities, and
be provided with significant capacity building;
− Regional lesson sharing is key, as illustrated in the case of the artificial reefs, where the
approach adopted in Morocco was initially piloted in Tunisia, for similar fisheries; and
− Because these initiatives are complex and interrelated, different donors are required to
cooperate in order to avoid overlap and gaps. The various activities described above were
funded by a combination of Government of Morocco, Japanese bilateral assistance (JICA), US
bilateral assistance (Millennium Challenge Corporation, or MCC) and the World Bank.
Guidelines for securing sustainable small-scale fisheries
The 29th Session of the FAO Committee on Fisheries (COFI) held in February 2011 recommended that
an international instrument on small-scale fisheries be developed. The Guidelines had to be developed
through a consultative process involving governments, regional organisations, civil society
organisations, and small-scale fishers, fish workers and their communities. The FAO Secretariat is
engaging in an extensive consultative process. A first preliminary draft of the Guidelines for Securing
Sustainable Small-Scale Fisheries is ready, taking account of the increased recognition of the
important role played by small-scale fisheries –particularly for developing countries in the context of
food security and poverty alleviation (FAO, 2012a)
The SSF Guidelines will be grounded in a number of basic principles (FAO, 2012a):
Resource governance, access regimes and enforcement: The SSF Guidelines need to recognize
the necessity for a sustainable use of aquatic and other natural resources and to fulfill the right to
development by meeting both developmental and environment needs of present and future
generations. This includes acknowledging the ecosystem approach to fisheries (EAF).
Safety at sea: The SSF Guidelines recommend that improved sea safety in small-scale fisheries
will best be achieved through the development and implementation of national strategies, with
elements of regional coordination.
Social and economic development: Fishing communities often have alternative livelihood
strategies complementing those based on aquatic resources, forming a web of cross-sectoral
linkages. There is a need for secure incomes and actions may be required that aim at improving
earnings from fisheries related activities or creating complementary or alternative income-
generating activities.
Disaster risks and climate change: Many small-scale fisheries communities are vulnerable to
natural disasters and climate change. They can also be subject to difficult circumstances in cases
of conflicts and wars.
Postharvest employment and value chains: The postharvest sector comprises all activities from
when the fish has been caught until it reaches the consumer. This integral part of the fishery
system employs more people than the primary production subsector and most of these are women.
In addition to its direct role in providing livelihoods and supporting food security, the sector plays
an important role at the national level, generating tax revenues and foreign exchange. Full
consideration and adequate integration of the postharvest sector and value chain aspects in small-
scale fisheries governance and development are prerequisites for the sustainability of sector as a
whole.
Social and gender equity: There are a number of aspects related to social and economic equality
and equity that need to be addressed by the Guidelines. These include the need for gender
mainstreaming, addressing child labour in fisheries, integration of migrants and avoiding
discrimination or marginalisation of certain stakeholder groups.

17
Policy coherence, institutional coordination and collaboration: In order to ensure policy
coherence and the integration of small-scale fisheries in broader policy frameworks, it would
appear essential to embrace holistic and integrated governance and development approaches as
well as to promote cross-sectoral linkages, fostering an environment that facilitates collaboration.
Moreover, many issues are trans-boundary and a combination of localregional-global linkages and
networks are needed.
Research and information needs, sources and exchange: For improved governance and
decision-making, a wide range of information may be required. At the same time, valuable
information is available but not always accessed. There is a need to promote the use of a
combination of scientific data and local, traditional or indigenous knowledge.
Capacity development: Capacity development – including organizational development, training
and information – in all areas and at all levels will be key to support the implementation of the
SSF Guidelines as well as for support to awareness-raising and empowerment.
Implementation support and monitoring: Together with broad support to capacity development,
specific support to and monitoring of the implementation of the SSF Guidelines will be required
for successful outcomes.

18
2. MAIN COMPONENTS OF LOCAL, NATIONAL AND INTERNATIONAL VALUE CHAINS RELATED TO SMALL-SCALE FISHERIES PRODUCTION
2.1 Global fishery value chains
A supply chain is a network of retailers, distributors, transporters, storage facilities and suppliers that
participate in the production, delivery and sale of a product to the consumer (Harland, 1996).
The supply chain is typically made up of multiple companies who coordinate activities to set
themselves apart from the competition (De Silva, 2011). A supply chain has three key parts, these are:
Supply focuses on the raw materials supplied to manufacturing units, including how, when
and from what location.
Manufacturing focuses on converting these raw materials into semi-finished or finished
products.
Distribution focuses on ensuring these products reach the consumers through an organized
network of distributors, warehouses and retailers.
Supply chains for most of the fish species start from oceans and end up with consumer
markets far from thousands of miles. It can involve a large number of stakeholders between
the fisherman/fish farmer and the final consumer. Most seafood is traded internationally;
particularly the high-valued species (De Silva, 2011).
Definition of Value Chain
Kaplinsky and Morris (2002) define a value chain as the full range of activities which are required to
bring a product or service from conception, through the different phases of production, transformation
and delivery to final consumers, and eventual disposal after use. In Kaplinsky and Morris’ approach,
value chain analysis seeks to characterize how chain activities are performed and to understand how
value is created and shared among chain participants.
Value chain analysis can be viewed in a narrow or broad sense (van den Berg et al 2009). In the
narrow meaning, a value chain focuses on a single firm and includes the conception and design stage,
the acquisition of inputs, production, marketing and distribution activities, and the performance of
aftersale services. The broad approach to value chains looks across enterprises at the range of activities
implemented by various actors to bring a raw material to the final product. It also includes linkages
with other actors engaged in activities such as trading, assembling, processing and providing business
development services such as credit and market information (van den Berg et al., 2009) quoted in
(Nang’ole et al., 2011).
The main approaches/concepts of value chain relevant for development policies are cited by CYE
Consult (2009):
The French ‘filière’ concept: a static model describing the linear flow of physical input and
services in the production of a final product .
Porter`s modern value chain analysis (VCA): an instrument for identifying the value created at
each step of the production.

19
Global Commodity Chains (GCC): a concept that is mainly focusing on the power relations in
the coordination of dispersed, but linked, production systems.
World Economic Triangle: a concept pointing out that the combination of strong local linkages
within global commodity chains might bring upgrading prospects for regions in developing
countries; and thus is an approach for showing the importance of linking vertical (chains) and
horizontal (clusters) integration.
Definition of Global Value Chain
Global value chain (GVC) analysis has emerged since the early 1990s as a novel methodological tool
for understanding the dynamics of economic globalization and international trade. GVC approach is
based on the analysis of discrete ‘value chains’ where input supply, production, trade and consumption
or disposal are explicitly and (at least to some extent) coherently linked (Ponte, 2008).
Much GVC discussion has revolved around two analytical issues: how GVC are governed (in the
context of a larger institutional framework); and how upgrading or downgrading takes place along
GVCs? Much of these discussions have been carried out with an interest in how power and rewards
are embodied and distributed along GVCs, what entry barriers characterise GVCs, and how unequal
distributions of rewards can be challenged in favour of labour and/or developing countries (Ponte,
2008).
Sustainability of GVC
A targeted effort is needed to integrate poor households into markets, through capacity building in
technical, organizational, managerial and financial areas. There is wide consensus that the private
sector has a crucial role to play in achieving pro-poor growth and reaching the ‘Millenium
Development Goals’. The key challenge is to integrate public objectives into private business
operations (CYE Consult, 2009).
2.2 Drivers and governors of change on fish demand and supply
Governance concept
Value chains imply repetitiveness of linkage interactions. Governance ensures that interactions
between firms along a value chain exhibit some reflection of organisation rather than being simply
random (Kaplinsky and Morris, 2001). Value chains are governed when parameters requiring product,
process, and logistic qualification are set which have consequences up or down the value chain
encompassing bundles of activities, actors, roles, and functions (Kaplinsky and Morris, 2001). In other
words, GVC governance is the process of organising activities with the purpose of achieving a certain
functional division of labour along a value chain – resulting in specific allocations of resources and
distributions of gains. From this perspective, governance involves the definition of the terms of chain
membership, incorporation/exclusion of other actors accordingly, and re-allocation of value adding
activities (Gereffi 1994; Kaplinsky 2000; Ponte and Gibbon 2005; Raikes et al 2000).
Governance implies that transactions between actors in the value chain are organized in a system that
allows firms to meet specific requirements in terms of products, processes, and logistics in serving
their markets. As such, it recognizes that power is not evenly distributed (Making value chains work
better for the poor, 2008).
According to Bui Nguyen (2011), governance refers to rules and regulations which are set up by actors
within the chains or by those who lie outside the chain like: governments, NGOs and ISO
organization. Governance refers to both “official” rules that address output and the commercial
imperatives of competition that influence how production is structured (Making value chains work
better for the poor, 2008). Humphrey (2006) further described it as the definition and enforcement of

20
instructions relating to what products are to be produced (product design), how they are to be
produced (process controls) and when (timing).
Governance is often interpreted as rules and regulation set up by the government. In fact, “These may
be as simple as the requirement imposed by wholesalers that agricultural products be correctly
harvested to prevent damage and degradation. Conversely, they may be as complex as a foreign
government’s enforcement of international standards regarding permissible levels of pesticide residues
on imported products (Bui Nguyen, 2011).
Kaplinsky and Morris, in their “A handbook for value chain research” (2001), proposed how rules and
regulation should be categorized. According to them, there are three forms of value chain governance
namely legislative governance, executive governance, and judicial governance.
The lead firm (s)
Ponte (2008) argued that GVC research attempts to identify a group of ‘lead firms’ that are
placed in one or more functional positions along a value chain which are able to ‘drive’ it — in
different ways and to a different degree. Thus, GVCs can be highly-driven, somewhat driven or not
driven at all.
In the GVC literature, lead firms are seen as not only dictating the terms of participation to their
immediate suppliers (and/or buyers, if applicable) (Gereffi et al., 2005), but also as managing to
transmit these demands upstream towards further layers of suppliers, sometimes all the way to primary
producers. Lead firms can drive GVCs through a hands-on approach (vertical integration, long-term
contracts, explicit control of suppliers, regular engagement with suppliers or buyers), a hands-off
approach (use of specifications that can be transmitted in codified, objective and measurable or
auditable ways; ability to set standards that are then followed along the GVCs; ability to transmit
information that is not easily codifiable in other ways), or a combination of the two (Ponte and
Gibbon, 2005 quoted in Ponte, 2008).
According to CYE Consult (2009), exercising power in relationships between firms in the value chain
shapes the incentives that drive behaviour and determines which and how much actors benefit from
participation in an industry. Relationships can range from highly dependent (where one party
dominates) to balanced, where all parties involved have some power that they can exercise. Power in
commercial relationships is primarily derived from owning the key determinants that drive sales.
Barriers to entry and rent
The value chain is an important construct for understanding the distribution of returns arising from
design, production, marketing, coordination and recycling. Essentially, the primary returns accrue to
those parties who are able to protect themselves from competition. This ability to insulate activities
can be encapsulated by the concept of rent, which arises from the possession of scarce attributes and
involves barriers to entry (Kaplinsky and Morris, 2001).
Buyer-driven Vs producer-driven value chains
Gereffi has made the distinction between two types of value chains:
“Buyer-driven chains refer to those industries in which large retailers, marketers, and branded
manufacturers play the pivotal roles in setting up decentralized production networks in a variety of
exporting countries, typically located in the third world. This pattern of trade-led industrialization
has become common in labor-intensive, consumer goods industries such as garments and a variety

21
of handicrafts. Production is generally carried out by tiered networks of third world contractors
that make finished goods for foreign buyers. The specifications are supplied by the large retailers
or marketers that order the goods (Gereffi, 1999).
Producer-driven chains describes a world where key producers in the chain, generally
commanding vital technologies, play the role of coordinating the various links – producer-driven
chains. This is characteristic of capital-and technology-intensive industries such as automobiles.
Here producers take responsibility for assisting the efficiency of both their suppliers and their
customers (Gereffi, 1999).
Table 4: Producer-driven and buyer-driven chains compared
Producer-Driven Commodity Chains Buyer-Driven Commodity
Chains
Drivers of Global Commodity
Chains
Industrial Capital Commercial Capital
Core Competencies Research & Development; Production Design; Marketing
Barriers to Entry Economies of Scale Economies of Scope
Economic Sectors Consumer Durables Intermediate Goods
Capital Goods
Consumer Non-durables
Typical Industries Automobiles; Computers; Aircraft Apparel; Footwear; Toys
Ownership of Manufacturing
Firms
Transnational Firms Local Firms, predominantly in
developing countries
Main Network Links Investment-based Trade-based
Predominant Network
Structure
Vertical Horizontal
Source: Gereffi, 1999
2.3 Main components of small-scale fisheries value chain
A systemic view of value chains
A systemic view of value chains integrates three important levels within a value chain network and
allows discovering potentials and bottlenecks within these levels and in the dynamic interactions
between them:
Value chain actors: The chain of actors who directly deal with the products, i.e. produce, process,
trade and own them. Value chain actors are those who deal directly with the production, processing,
packaging, trading etc. of a product. Usually they own the product for a certain time as it travels along
the chain (CYE Consult, 2009).
Value chain supporters: The services provided by various actors who never directly deal with the
product, but whose services add value to the product. Value Chain supporters are people/companies
who provide services to the value chain actors such as: improving capacities of producers and small
agro-businesses; ensuring access to information, knowledge and know-how and linking numerous, but
small producers with markets. However, public and private roles must be clearly defined.
Entrepreneurs are partners with a legitimate commercial interest (CYE Consult, 2009).
Value chain influencers: The regulatory framework, policies, infrastructures, etc. (at the local,
national and international level). The environment for value chain development is influenced by

22
people, organisations and institutions that are responsible for setting up and managing the regulatory
framework. A favourable and enabling business environment provides economic and political
stability, ensures low costs for business transactions, and allows for efficient business operations,
which lead to greater innovation and creativity (CYE Consult, 2009).
The market both provides for, and restricts, livelihood opportunities for small-scale fishers and market
traders. The constraints to market access include weak bargaining power and poor marketing
strategies, monopolies among traders, poor product-holding infrastructure, difficulties meeting quality
standards and lack of market information. With specialized traders, fishers often have little, if any,
control over marketing outlets and the prices that they receive.
Relations and potential inequalities between fishers and traders point to the need to find ways to
address these issues in order to increase the return received by fishers and to better sustain fisheries
resources (Jacinto and Pomeroy, 2011).
Any value chain operates in an environment which is formed by the macroeconomic landscape,
policies and regulations, institutional elements and facilitating services. These elements of the
environment, although not directly involving in the production and distribution, do influence the
performance of the value chain.
We can distinguish three categories of components in the value chain: End-markets, the business
enabling environment and supporting markets. All these components can interact in two different
directions: horizontally and vertically.
2.3.1 End-markets
End markets
Value chains are driven by end markets, and a product or service may have different market
channels within an industry. The structure of end markets refer to how end markets work, how
large is the buyer pool, how much power do buyers have over producers and whether
information exchange takes place within the channel.
Market channel can have various destinations: international wholesalers and retailers, national
and local buyers, as well as different markets within one location. End markets:
− inform on what buyers think about the country the value chain is being analyzed and the
position of value chain vis-à-vis the competition;
− They allowing us to understand how much work is needed to place the product into a more
competitive posture;
− They define the universe of opportunities for placing the product in those markets and they
define the attributes of the product;
− analysis is conducted for the industry within the present global market place whether the
product is exported or only sold domestically.
From the end markets, we learn about what it takes to compete in the chain from the
perspective of quality, size, design information product standards, frequency and speed of
delivery and possibly market trends. Chain Information gathered during the data collection is
analyzed in terms of the chain’s present and potential capacity to respond to end-market
specifications.
Stabilizing fish supply: a prerequisite for market development

23
Jacinto and Pomeroy (2011) argued that it is essential in fisheries to ensure a stable supply before one
can successfully engage in market development activities. Amidst this, stabilizing fish supply from
small-scale fisheries sufficiently to allow for favourable conditions under which to undertake market
development initiatives is a difficult task. Overfishing having being brought about by heavily
subsidized industrial fisheries and a largely fragmented small-scale fisheries sector, points to the
probability that future increases in fisheries production would come from aquaculture.
2.3.2 The business enabling environment
Institutional elements may fall into laws, finance, technologies, human development, standards,
property rights, research and development… Such elements influence the performance of the value
chain. For instance, research and development (R&D) institutions are important in coming up with
innovations in product development, packaging and other processes that will allow better handling,
storage and transport while financial institutions are conduits for capital loans and investments.
2.3.3 Supporting markets
Supporting markets are key to firm-level upgrading and include finance, business services, and input
markets that support the core product market. Supporting markets can be crosscutting or sector-
specific and involve embedded business services or value chain finance that flow up and down the
chain. They are referred to as markets to indicate that they are commercial and provided by the private
sector. Hence, supporting markets does not include government services, donor agencies and donor
funded projects that provide business support services unless there is a clear and time-specific exit
strategy (CYE Consult, 2009).
The demand for the goods and services that supporting markets provide is derived from the growth of
the core value chain. New technologies or technical services can have a substantial effect on the core
value chain’s competitiveness, even changing the competitive dynamic in certain markets.
2.4 Vertical and horizontal linkages
Inter-firm relationships
Chain analysis looks at how firms interact with each other and how power, learning and benefits are
distributed in value chain. Understanding the relationships helps to understand why there are
constraints and how and by whom they can be resolved. To understand and measure relationships we
look at:
− How market power is distributed within a value chain ?
− How information and learning flow; are there learning systems in place; are association
activities geared to knowledge transfer?
− How power, learning and benefits are distributed?
− To what extent are links established between MSEs and businesses at different levels of the
value chain and with support markets?
How information and learning takes place is crucial to create and sustain competitiveness. It is a pre-
condition for upgrading, and learning can effect benefit and incentives. Thus if small producers are to
compete and upgrade to respond to market opportunities, chain analysis must look to see if small
producers have access to new skills, know-how and learning on a continuous basis, rather than on a
one shot event such as a workshop or a training cycle.

24
Where do we look to see if learning and acquiring new skills take place on a continuous basis?
Initially, knowledge about alternative markets and market opportunities is acquired through horizontal
linkages among same line operators. Buyers generally are not the source of such information.
Where do we look to see if knowledge and skills are acquired about how to produce and deliver a
product according to the market standards and requirements? This usually comes from through vertical
linkages and usually from buyers.
Regarding relationships between members, it is important to be mindful that relationships between
members are not only characterized by transactions through which a product/service is transferred
from one member to another in return for payment; relationships in value chains are also characterized
by a vast exchange of information, knowledge, skills and various embedded services (e.g. loans
provided by input suppliers to small producers, training sessions conducted by lead firms, quality
control mechanisms, leasing arrangements, provision of equipment and manuals, marketing support,
etc.) (United Nations International Labor Organization, 2009). Understanding relationships between
members are crucial to understanding how entry barriers are created, and how gain and risks are
distributed (Bui Nguyen, 2011).
Vertical Linkages
CYE Consult (2009) indicated that vertical linkages in a value chain are defined as the linkages among
firms between input or raw material supply and final market distribution. Vertical linkages are critical
for getting a product from inception to the market, and for transferring learning and embedded
financial and business services from one firm to another along the chain. The efficiency of the
transactions between vertically related firms in a value chain affects the entire
industry’s competitiveness.
Vertical linkage analysis looks at the degree of cooperative relationships that exist among vertically
linked firms up and down the value chain. These relationships can be assessed as being strong, weak,
organized, and/or dynamic and can be analyzed in terms of the degree of knowledge sharing, skill
transfer and trust foster or hinder growth and expansion of the value chain.
If it is determined that in the studied value chain there is little or no knowledge sharing between
producer and collectors/first line traders, or if there is a lack of confidence between the two levels,
there are chances transaction costs will be high and the small producer, with little or no information of
what the raw product will be used for in the destination market might disregard quality standards. On
the other hand, the buyer of the raw product may have a vested interest in helping SME producers and
thus inform or provide training to the small producer in meeting production standards requiring new
skills. In conducting the analysis we look for signs of win-win or lose-win situations among functional
levels and firms.
Horizontal linkages
Horizontal linkages among producers are needed to reduce the transaction costs of working with
many small suppliers. For small fishers, they can generate external economies and improve bargaining
power. Horizontal linkages can help small firms to generate economies, for example, by buying in
bulk or by filling large orders, which can contribute to competitiveness and increase their bargaining
power. Horizontal linkages among MSEs can take the form of informal or formal groupings of MSEs,
as well as MSE networks that are managed through a third party (such as a lead firm, cooperative,
trader,…). Key to gaining value from horizontal cooperation is recognizing joint constraints that
require collective action.

25
3. COSTS AND EARNINGS ANALYSIS OF SMALL-SCALE FISHERIES AND REASONS FOR DIFFERENCES
3.1 Value chain and cost earnings analysis
Understanding the determinants of income distribution
Value chain analysis can help to explain the growing disjuncture between the global spread of
activities and incomes, particularly in a dynamic perspective.
First, by mapping the range of activities in the chain, it provides the capacity to decompose total value
chain earnings into the rewards which are achieved by different parties in the chain. In mapping the
distribution of income we focus on profits, The greater the barriers to entry, the higher the level of
profitability. So, profitability is an important window into understanding the pattern of returns in
global production networks (Kaplinsky and Morris, 2001).
Secondly, a value chain perspective analyses the way in which particular firms, regions and countries
are linked to the global economy. This mode of insertion will determine to a large extent the
distributional outcomes of global production systems and the capacity which individual producers
have to upgrade their operations and thus to launch themselves onto a path of sustainable income
growth. Understanding the determinants of income distribution requires a focus on rents and barriers
to entry. Where levels of competition are high, incomes are under threat. The only way in which
income growth can be sustained is through an enduring barrier to entry or by the firm, the region or the
country developing the dynamic capability to systematically move to activities in which high barriers
to entry prevail. The focus in value chain analysis on power relations and institutions explains whose
behaviour needs to change if different outcomes are to emerge (Kaplinsky and Morris, 2001).
And, thirdly, by focusing on the institutions which drive international specialisation, value chain
analysis identifies the normative levers which can be used to alter these distributional patterns. value
chain analysis does not stop at the level of the firm or groups of firms. It also draws attention to the
national system of innovation – the network of institutions which support economic actors. What they
do impinges on the competitive performance of firms and groups of firms, and is also subject to the
support and regulation provided by governments, whose actions, too, need to be located in value chain analysis (Kaplinsky and Morris, 2001).
Analysis on costs and earnings
After the value chain is mapped, the analysis on costs and earnings would be undertaken. This analysis
aims to provide a notion on costs incurred by different actors as well as revenues and profits they earn
in return.
Costs are classified into variable or fixed costs. Variable costs are costs that vary in proportion with
level of output. On the other hand, fixed costs are costs that are independent on the level of output. In
the analysis, shares of cost components are exhibited, by which activities causing exceptionally high
cost could be singled out. In addition, the analysis also presents fluctuations in cost components as
well as the total cost. As switching the focus to benefits, the analysis describes changes in revenues
over years as well as underlying causes. And by comparing revenues with costs, the analysis reveals
how much different actors earn from their businesses (Bui Nguyen, 2011).

26
The revenue (or retail price) is made up of marketing margins belonging to different actors in the value
chain. Marketing margin is the difference between selling price paid by the next stage and purchasing
price paid to the previous stage. Marketing margin must cover all costs needed to transfer the product
from one stage to the next and a reasonable return to those perform the job (Shepherd, 2007).
Therefore, the marketing margin, showed in percentage, reflects the distribution of revenue to different
chain actors.
Total cost of the final product sold to the final customer is constituted of added costs incurred by
different chain actors. Added costs computed by extracting from the total cost the purchasing price
paid from the previous level in the value chain. Added costs reflect efforts of different chain actors in
adding values to the final product (Bui Nguyen, 2011).
Finally, profit from selling the final product to the final customer comprises of profits accruing to
different chain actors.
3.2 Price linkages in value-chains
Price linkages analysis : an approach from Norad Project
The ex-vessel price of fish is ultimately set by the end-user/retail demand for the commodity. Given
that the ex-vessel price of fish defines the profits and welfare of fishermen and their communities, it is
of interest to enquire as to the link between retail and ex-vessel prices (Bjørndal and Gordon, 2010).
Much of the work in price linkage between producer and retailer is drawn from agricultural economic
studies. The standard approach to measuring retail/farm price linkage is based on work by Gardner
(1975), where demand and supply functions are specified for both farm and retail sectors, and the
equilibrium is solved under general competitive conditions (Bjørndal and Gordon, 2010).
Bjørndal and Gordon (2010) argued that the assumption of perfect competition seems appropriate
when applied to setting the ex-vessel price of fish but inappropriate for setting price at the processing-
distribution-retailing sector of the fish market. This is due to the fact that in many industrialised
countries a few supermarket chains account for more than 80 percent not only of retail sales in general
but of fish products in particular.
This notion of non-competitive pricing at the PDR sector of the market may therefore have important
welfare implications for fishermen. A study of fish price linkage should account for
monopoly/monopsony pricing power at the PDR sector of the market (Bjørndal and Gordon, 2010).
Some other alternative models of price linkage that may be useful for studying the price relationship
from the vessel to the retail sector exist. They were summarised by Bjørndal and Gordon in “Notes on
Prices and Margins in Fish Marketing” (2010) for NORAD Project.
The ultimate purposes of the price linkages approach is to analyse the factors that determine prices and
margins throughout the value-chain as well as the distribution of benefits among the various
stakeholders. A possible research strategy for investigating ex-vessel-retail price supply links might be
the following (Bjørndal and Gordon, 2010):
1. Identify value chains (countries) and relevant capture and/or farmed products of interest.
2. A value chain analysis to be carried out that identifies for the fisheries sector important
government regulations on marketing fish, the market structure from the vessel to either
domestic retail or to the export market, identification of ‘small scale’ fisheries within this
market structure and the fish species of interest.

27
3. An investigation to be carried out for each value chain that identifies for each segment of the
fish supply chain: the type, the quality, the quantity and the time period of data available for
analysis.
According to the data available for analysis, such data are used to undertake either a full Structural
Model or a Reduced Form analysis of ex-vessel-retail price links. It is likely that data would be limited
in a time series perspective but could provide a cross-section snap-shot of price links from ex-vessel to
export markets or domestic retail outlets (Bjørndal and Gordon, 2010).
The research strategy would proceed under normal research parameters: model development either
Structural or Reduced Form, data summary and presentation, econometric modelling, estimation and
evaluation, and policy analysis (Bjørndal and Gordon, 2010).
In the case of very limited or no data available to meet requirements of either the Structural or
Reduced Form models, it is recommended to collect primary data from source. It is likely that such
data would be limited in a time series perspective but could provide a cross-section snap-shot of price
links from ex-vessel to export markets or domestic retail outlets. This snap-shot of data and value
chain specific market structure would then be evaluated within the structural and/or reduced form
framework previously identified and estimated for other closely related countries/value chain. The idea
would be to combine general information on the links and parameter estimates in the fish supply chain
from other developing countries accounting for changes in the market structure for the country/value
chain of interest and available data. In this way, it could be possible to build a model describing the
fish supply chain for countries with limited data (Bjørndal and Gordon, 2010)
Some Norad Project findings
Project objective
The objective of the project is to achieve a better understanding of the dynamics of relevant value-
chains in international fish trade and arrive at policy recommendations. The project will analyse the
distribution of benefits in the value-chain and the linkages between the relative benefits obtained and
the design of the chain.
The purposes of the price linkages was to analyse the factors that determine prices and margins
throughout the value-chain as well as the distribution of benefits among the various stakeholders.
Particular attention had to be given to processing in order to compare the difference in value creation
from the export of unprocessed and processed fish.
Three country studies
Japan market :
According to Sakai et al.(2012), Japanese seafood value chain has typically three markets from
producers to consumers: Landing Market , Wholesale Market and Retail Market. This value chain has
developed to deal with various fish species and their flexibility of use.
Fisheries Agency conducted a research for the seafood value chain in Japan in 2009. The findings have
shown that Fishermen’s revenue is 24.7 percent of the retail price while retailers’ revenue is
38.5 percent. Indeed, retailers such as supermarkets are said to have a strong market power in the
Japanese seafood value chain.
A study was undertaken by NORAD Project in Japan (Sakai et al., 2012) in order to examine the
market structure of the Japanese seafood value chain using statistical methods. Results have stressed
that, in and before 1994, sellers had stronger power in some species and buyer had stronger power in
other species. After 1994, market power of buyers has apparently increased. The results are in

28
conformity with an market observation that retailors obtained stronger power in Japan after traditional
fishmongers were replaced by large supermarkets around 1994.
Spain market :
The ex-vessel price of fish defines the profits and welfare of fishermen and their communities and is
ultimately set by the end-user/retail demand for the commodity. The demand for fish from the
fisherman or fish farmer is derived from demand for the end-user/retail commodity. The impact of a
shock to fish landings on retail price will depend on the structure of the relationship between the two
sectors.
In the case of Spanish market, by Modelling Imperfect Competition in the processing-distribution-
retailing Sector, Bjorndal and Fernández-Polanco (2012) have demonstrated that perfect competitive
framework does not fit with observed data; prices and margins appear to be affected by other variables
than ex-vessel price, ex-farm price, retail price, marketing costs, retail demand shifter and supply.
These effects vary from one species to another. In addition, there is not a common pricing behavior
for all seafood products.
Price linkages are verified in aquaculture species even in markets dominated by far by local production
(mussels). Price transmission is more effective in aquaculture than in wild fisheries. Despite of
difference across species, all retail prices are affected at a larger or shorter extent by import prices
more than what they are by local supply. Imports improve price transmission along the value chain.
Imports prevent the rise of prices of wild fishery products. Products with a large ratio of imports
decrease or stabilize their price. This effect may benefit traders and consumers, but negatively affect
fishermen’s income.
Prices have shown to be less volatile for retailers than in any other stage of the chain for all species
observed. The consequences are improved returns when local an imported species decrease their price,
but reduced profits in species with increasing prices.
Bangladesh market :
Seafood value chains in Bangladesh are generally long and complex. There are many intermediaries
between producers and final consumers of seafood products in the country. The four main types of
domestic seafood markets are primary markets located near the source of production, secondary
markets located usually in the sub district (upazila) headquarters, higher secondary markets located in
big cities, and terminal markets.
The seafood market structure is not the same for all market levels in Bangladesh; the market appears to
be relatively more competitive at the higher secondary-terminal level than in the primary-secondary
level. There is a general concern among policy makers that seafood prices may not be proportional
along the value chains in Bangladesh.
The objectives of the study undertaken by Sapkota et al. (2012) was to examine the causal
relationships between wholesalers and retailers; and to compute elasticities of price transmission
between wholesale and retail markets, and investigate their asymmetries for five different fish species
in Bangladesh.
In most of the cases, we found that the direction of causal relationship was from the retail to the
wholesale market. This might be due to the fact that retailers are more organized than wholesalers in
the Bangladesh fish market. In such situations, retailers would set the price of the commodity and
wholesalers would have to follow the set price.

29
Unlike various previous studies on other agricultural crops, the direction of causal relationships was
observed from the retail to the wholesale market in most of the value chains analyzed indicating that
retailers are the price leaders. It further implies that these fish are demand driven as retail price leads
the wholesale price. That is basically due to less organized behaviour of the wholesale market as
compared to the retail one.
The asymmetric price transmission behavior was also analyzed. Results suggest that, in general, the
price transmission is mostly symmetric in the short-run while a mix of symmetric and asymmetric in
the long-run. But, usually, the characteristics of price asymmetries differ substantially across markets
and species.
The study found variation in price transmission behaviour between aquaculture and capture fisheries
products. For aquaculture products, elasticities of price transmission from retailer to wholesaler were
generally greater from increases in price than from decreases in price.
3.3 Revenue distribution through the seafood value chain
Study undertaken by Davidsson (2007) shown that the majority of benefits generated throughout the
value chain, are captured by the retail, the wholesale and the secondary processing sector of the fish
industry and that this trend is shown both in developing and developed countries
Figure 2:The seafood industry value chain. Source: Glitnir Bank
It is useful to compare some value chain analysis. In FAO study that deals with “revenue distribution
through the seafood value chain”, four value chains were compared. Results from four different
countries (i.e. Morocco, Iceland, Tanzania and Denmark) have been analysed. The objective of this
study was to demonstrate how the revenues from seafood trade are distributed over the entire seafood
value chain. The value chains were shown to have similar characteristics to value chains for
agricultural products where the primary sectors receive a relatively lower share of the retail value of
highly processed products and a higher share in less processed and fresh products (Gudmundsson et
al., 2006).
The study also revealed that the developing countries seemed to control a relatively lower share of the
overall value chain than developed countries. An example is the Icelandic case where Icelandic owned
companies control as much as 70 percent of the entire value-chain while Tanzanian and Moroccan
companies controlled less than 50 percent (Gudmundsson et al., 2006).
When looking at the value chain for the fisheries sector in Morocco (figure 3), it quickly becomes
apparent that the largest marginal increase in value occurs very early on, at the so-called first sale
stage, where the fishermen sell and completely lose ownership of their catches (Sauzade and Rousset,
2013). The Tanzanian fishermen receive about 15 percent of the retail value versus the 19 percent
which the Icelandic fishing companies receive (Gudmundsson et al., 2006).

30
In the Tanzanian case, the retailer absorbs about 60 percent of the overall value in the value chain
while in the Icelandic case the retail level represents about 36 percent. This reflects the different
structure of the two value chains. Icelandic companies control a bigger share of the value chain than
the Tanzanian companies. The Tanzanian processing sector adds about 18 percent of the overall retail
value while the Icelandic processing sector adds 28 percent (Gudmundsson et al., 2006).
Figure 3 shows all four value chains on one graph with two striking differences. First, the Danish
and Moroccan harvesting sectors (pelagic fisheries) receive a lower share of the value chain than
the Icelandic and the Tanzanian fisheries (demersal fisheries). The Danish harvesting sector receives
about 8 percent of the retail value while the Moroccan fishery receives about 4 percent (Gudmundsson
et al., 2006).
The Danish and Moroccan primary processing sectors receive 17 and 21 percent respectively. When
comparing the secondary processing and retail levels for each country an interesting fact is
revealed. In Denmark the retail level adds 38 percent and the secondary processing adds 37 percent of
total value to the overall value chain, while in Morocco the retail value adds up to 75 percent of the
total value chain. Hence, the Danish processing sector receives a considerably higher portion of the
value chain (Gudmundsson et al., 2006).
Another interesting comparison is that despite the low quality of some of the data from Morocco and
Tanzania the pelagic and demersal industries show similar characteristics in the value chain structure.
For pelagic fisheries, the retail and secondary processing sectors combined receive about 75 percent of
the retail value while in demersal fisheries this combination represents 55–60 percent of the total retail
value (Gudmundsson et al., 2006).
The study also show that the share in the value chain does not reflect the profitability of firms or well
being of fishermen. The Danish companies in this study seemed to control a larger share of the value
chain than their Moroccan counterparts, but this did not ensure profitability of the harvesting
sector(Gudmundsson et al., 2006).
3.4 Value addition opportunities in the small-scale seafood industry
The sum of the value chain should create a value that is greater than the sum of each individual
activity, in other words, it should create a profit margin. Local and regional networks enhance value
addition: different institutional end-markets are linked too different forms of coordination and control
of value chain.
Figure 3: Comparison of value chains in four countries. Source: (Gudmundsson et
al., 2006)

31
We first ask ourselves what the customer wants, how they want it, and at what price. Afterall,
consumers and producers remain connected along the value chain. Buyer requirements often send a
mixed message, due to pressures of management and problems in the work environment.
Some reasons for promoting value added production may consist in higher profits, more stable market
conditions, job creation, diversification of products and markets, and down-stream economic benefits
through industry support sectors.
Value chains are however not a magic word to solve all a company’s problems. An awareness of
common challenges that most fisheries businesses face up to at some stage, helps to position a
company to confront its own particular difficulties. Among these key challenges are (Russell and
Hanoomanjee, 2012):
− Different locations of fish resources and markets;
− Complex global trading links and patterns of exchange;
− Delivered quality levels and value adding options depend upon earlier chain activities;
− Diverse raw materials require transformation and allocation to specialised value chains;
− Satisfying varied market needs;
− Chains and activities are interdependent and have a mutual impact;
− Delivered quality levels and value adding options depend upon earlier chain activities;
− Vertical communication networks and chain management;
− Consumers are the ultimate determinant of value.
Value chain analysis can help maximise profits but it can also identify activities that are not profitable.
The main emphasis here is the need for good quality products which in turn promote realisation of a
better price at market. Quality assurance starts right from the time the fish is caught till it reaches the
consumer. The need for market information and market research are also very important.
Reducing value losses along the value chain may be a value addition approach which requires
anticipating and minimising problems, and planning ahead to maximise value. Some strategies include
(Russell and Hanoomanjee, 2012):
− Decrease product variability;
− Improve product quality;
− Streamline administration;
− Reduce handling and movement;
− Improve plant layout;
− Optimise the use of equipment and inputs;
− Improve staff productivity;
− Reduce damage and theft.
In general, good fisheries management is essential to ensure that fishermen will reap the benefits from
higher export prices. Without proper management in place, increased prices can lead to increased
fishing pressures and hence threaten the sustainability of the resource and profitability of fishing
companies (Russell and Hanoomanjee, 2012).

32
4. ANALYSIS OF SMALL-SCALE FISHERIES PRODUCTION THROUGH THE VALUE CHAIN METHOD
4.1 The value chain concept applied to fisheries and aquaculture
4.1.1 What does value chain mean?
Value chain definitions
Every enterprise is positioned in a value chain. Generally speaking, a value chain is defined as a
sequence of organisations that are involved in production/farming, processing, marketing, distribution,
sale, consumption and disposal off consecutive units and steps. As passing through the chain, the
product gains some value. The chain of activities as a whole gives the product more added value than
the sum of independent activities. The value chain exists if and only if all members in the chain
cooperate to deliver maximum value at the least possible total cost to the end customer.
CYE Consult (2009) stressed that current theories on value chains show that the discussion is centred
around the question of how to create and distribute gains from economic activities better, and how to
do so in developing countries. This includes questions of how enterprises or regions from developing
countries gain access to dynamic markets and to a higher share of value.
As opposed to the traditional exclusive focus on production, the concept stresses the importance of
value addition at each stage, thereby treating production as just one of several value-adding
components of the chain. Value chains can be restricted to local markets, but do also expand globally.
This is just as true for small and medium-sized enterprises in developing countries as it is for
enterprises in Europe and North America (United Nations International Labor Organization).
Using a definition of Kaplinsky and Morris (2001), the value chain describes the full range of
activities which are required to bring a product or service from conception, through the different
phases of production (involving a combination of physical transformation and the input of various
producer services), delivery to final consumer, and final disposal after use (CYE Consult, 2009). In
Kaplinsky and Morris’ approach, value chain analysis seeks to characterize how chain activities are
performed and to understand how value is created and shared among chain participants.
One question could arise: is the value chain and supply chain different? Hobbs et al. (2000) defines the
value chain as one particular form of the supply chain. In this approach, the supply chain refers to the
entire vertical chain of activities: from production on the site, through processing, distribution and
retailing to the consumer (Nang’ole et al., 2011). Value chain and supply chain they are physically the
same, because they both overlay the same network of members who are tied up with each other to
provide goods or services to the final customers. If we compare the definition of a supply chain with
that of a value chain, we may realize that they cover the same things. The idea behind, however, is
different. The supply chain, as the name implies, focuses mainly on the costs and efficiencies of
supply. The supply chain is meant to bring materials into manufacturing operation and finished
products to customers smoothly and economically (Bui Nguyen, 2011).
Nang’ole et al. (2011) stressed that more recently, the concept of value chain analysis seems to have
become synonymous to market analysis in general by also including aspects of the horizontal analysis
of a set of specific actors at one stage of the chain and the role of policies, institutions and laws in
shaping markets. Often, the terms ‘supply chain’ and ‘value chain’ are used interchangeably.

33
The competitiveness of firms not only depends on the functioning of suppliers and buyers within a
cluster, but also and often most importantly, on the entire chain at the national and global level (CYE
Consult, 2009).With the concept of value chain, enterprises are no more treated as a single entity but
as a part of an integrated chain of economic functions and linkages across geographic boundaries
(Gudmundsson et al., 2006).
Narrow sense Vs broad approach
The definition can be interpreted in a narrow or broad sense. In the narrow sense, a value chain refers
to all activities performed within a firm in order to transform raw materials into a desired product. This
definition is attributed to Porter (1985). In his work “Competitive Advantage: Creating and Sustaining
Superior Performance”, Porter (1985) developed the so-called modern value chain analysis (VCA) as
an instrument for identifying the value of each step of the production. Considering the production of
companies, Porter identified primary and support activities that form the chain. Porter also argued that
firm activities should be separated in order to identify source of competitiveness. And activities within
a firm are categorized into primary and supporting activities. Primary activities fall into inbound
logistics, production, outbound logistic, marketing & sales, and after sales services. On the other hand,
supporting activities include firm infrastructure of the company , human resource management ,
technology development and procurement. Porter’s value chain has served as a tool assisting
management decision and executive strategies (Bui Nguyen, 2011).
Figure 4: Porter’s generic value chain
Source: Roduner, 2004 quoted in Nang’ole et al., 2011.
The broad approach in contrast does not look at activities conducted by a single firm. Rather, it pays
attention to the participation of various members in the chain whose activities are meant to help bring
the raw materials to the sale of the final product. Value chain system coined by Porter (1985), which
comprises supplier’s value chain, firm’s value chain, distributor’s value chain and buyer’s value chain,
resembles this broad sense definition (Bui Nguyen, 2011).
Other related concepts
Various chain conceptualizations are mentioned in the literature. All of them deal with the flow of
products and services along the chain, relationships between firms and coordination of production
chains. There is a considerable overlap between the concept of a value chain and similar concepts used
in other contexts. The linkage approach and Porter’s value chain constitute the two most influential
chain conceptualizations.
The ‘Filière’ concept Another concept which is similar in some respects to the value chain is that of the ‘filière’. It is used to
describe the flow of physical inputs and services in the production of a final product (a good or a
service) and, in terms of its concern with quantitative technical relationships (Kaplinsky and Morris,
2001).The early ‘filière’ analysis emphasised local economic multiplier effects of input-output
relations between firms and focused on efficiency gains resulting from scale economies, transaction
and transport costs etc. The later work gave the modern version of ‘filière’ analysis an additional
political economy dimension insofar as it factored in the contributory role of public institutions.
However a filiere tended to be viewed as having a static character, reflecting relations at a certain
point in time. It does not indicate growing or shrinking flows either of commodity or knowledge, nor
the rise and fall of actors. Although there is no conceptual reason why this should have been the case,
Inbound
logistics
Operations
Outbound
logistics
Marketing and sales
Services
Margin

34
in general filiere analysis has been applied to the domestic value chain, thus stopping at national
boundaries (Kaplinsky and Morris, 2001).
Global commodity chain
Another concept which has been used to describe the value chain is that of global commodity chains,
introduced into the literature by Gereffi during the 1990s. As we shall see below, Gereffi’s
contribution has enabled important advances to be made in the analytical and normative usage of the
value chain concept, particularly because of its focus on the power relations which are imbedded in
value chain analysis. By explicitly focusing on the coordination of globally dispersed, but linked,
production systems, Gereffi has shown that many chains are characterised by a dominant party (or
sometimes parties) who determine the overall character of the chain, and as lead firm(s) becomes
responsible for upgrading activities within individual links and coordinating interaction between the
links. This is a role of ‘governance’, and here a distinction is made between two types of governance:
those cases where the coordination is undertaken by buyers (‘buyer-driven commodity chains’) and
those in which producers play the key role (‘producer-driven commodity chains’) (Kaplinsky and
Morris, 2001).
World Economic Triangle
Other authors (Messner 2002, Humprey/Schmitz 2002) are pointing out that the combination of strong
local linkages within global chains might bring upgrading prospects for regions in developing
countries. Messner developed the concept of the ‘world economic triangle’, where actors, governance
and regulation systems are determining the scopes of action open to regions in the global commodity
chains. He determined six critical aspects: actor constellations, interests, power structure, situational
mindsets, action orientation and trust (CYE Consult, 2009).
This approach is talking about upgrading of whole regions or clusters through their integration in
value chains, means the economic triangle theory links horizontal (cluster development) and vertical
approaches (value chain) (CYE Consult, 2009).
4.1.2 Fish value chain
Value chain describes a high-level model of how fishery businesses receive raw materials as input
(captures and culture fisheries), add value to the raw materials through various processes and sell
finished products to customers (De Silva, 2011).
The same author stressed that value chains for capture and culture fisheries differ from fish to fish and
from country to country, and frequently within regions. Value chains of economically important
species, such as tuna, salmon, skipjack, shrimp, tilapia, etc. composed of several nodes and products
that pass through longer chains to meet the consumer.
The nature of value chain activities differs greatly in accordance with the types of species and
companies. The value chains of companies have undergone many changes in the last two decades due
to advancements in technology facilitating change at a very rapid pace in the business
environment. Value chain analysis can help fish export of developing countries to be competitive in
the international market (De Silva, 2011).
A relatively new feature of the global supply chain is the emergence of a third country processor – a
country to which nations export unprocessed products simply to become processed, only to have those
products re-exported (Roheim, 2008). The principal countries serving this role are China and Thailand.
A growing and significant amount of fish is exported to China post-harvest, processed, then re-
exported around the globe (De Silva, 2011).
4.1.3 Value Chain Analysis

35
What is value chain analysis?
Value chain analysis (VCA) is a method for accounting and presenting the value that is created in a
product or service as it is transformed from raw inputs to a final product consumed by end
users. Value chain analysis is about identifying the full set of economic cost along the value chain, to
determine where how much value is added and what the relative importance of different actors is (i.e.
the formal and informal governance structure) (CYE Consult, 2009). Then have a good look also at the
available services and the supporting institutional framework.
In practice, it is important to define what you must know, what you don’t need to know and what
you can not know . Checking the reliability of data and filtering out the essential information will be
one of the main challenges of any practice-oriented value chain analysis. Perfectionism is
counterproductive. For value chain analysis, there are many mostly similar but different
methodologies/steps offered by authors throughout the globe (CYE Consult, 2009).
The value chain analysis process is a systematic approach to improve the growth potential of value
chains with large numbers of small firms, to enhance small firm contributions to value chain growth
and to insure benefits to small firms. The process allows us to identify end market opportunities,
constraints related to those opportunities, and to understand the factors and conditions under which
individual firms and the value chain as a whole can achieve higher levels of performance.
A value chain approach helps us understand the obstacles to accelerated growth and poverty reduction,
and it helps us to identify where the highest value opportunities for investment (human and capital
investments) are located to improve industry performance. It also identifies the constraints to the
success of those investments. Finally, an analysis can help donors target their resources to where they
will leverage the greatest impact on growth.
The value chain is an important construct for understanding the distribution of returns arising from
design, production, marketing, coordination and recycling. Essentially, the primary returns accrue to
those parties who are able to protect themselves from competition. This ability to insulate activities
can be encapsulated by the concept of rent, which arises from the possession of scarce attributes and
involves barriers to entry (Kaplinsky and Morris, 2001).
Another consideration which helps to transform the value chain from an heuristic to an analytical
concept is that the various activities in the chain – within firms and in the division of labour between
firms – are subject to what Gereffi has usefully termed ‘governance’ (Gereffi, 1994). Value chains are
governed when parameters requiring product, process, and logistic qualification are set which have
consequences up or down the value chain encompassing bundles of activities, actors, roles, and
functions (Kaplinsky and Morris, 2001).
A value chain perspective of the small-scale fisheries sector
Capture-fisheries feed into diverse and spatially extensive networks of supply and trade that connect
production with consumers, adding significant value and generating important levels of employment
(the value chain). To some extent, value chain analysis can be used to provide an important mediation
and buffering function to increasing variability in supply and source location, but direct impacts will
also affect its ability to do so. This approach can also be used to reduce vulnerability and increase
adaptive capacities of fishers and fishing households (Jacinto and Pomeroy, 2011).
The value chain encompasses many economic agents (individuals, companies, government). From the
perspective of the value chain, it is relatively unimportant how impacts are distributed among the
economic agents that comprise it. As a result, value chain analyses do not have to address many of the
difficult policy decisions that determine how impacts are distributed. The value chain perspective is
important because it offers insights that would not surface in studies focused on individual economic
agents or particular policy frameworks. A value chain analysis can also uncover insights into the
challenges that face the sector as a result of different drivers of change, such as climate change,

36
including small firms' and fishers' competitiveness in changing markets (Jacinto and Pomeroy, 2011).
A value chain perspective of the small-scale fisheries sector can reveal response strategies that
enhance the sustainability and competitiveness of the entire value chain and the economic agents that
comprise it. Value chain analysis helps effectively to isolate the binding constraints that affect the
sector in a systematic manner. The set of issues that emerge from such a detailed analysis at a sector
level has implications for both the public and private sectors alike. Some of the issues are sector-
specific, and others are relevant across an economy and apply to many sectors and firms in a country.
It also provides an opportunity to find policy positions that can be supported by the sector's different
economic agents and important stakeholders (Jacinto and Pomeroy, 2011).
Value chain approach
The value chain approach can apply to whole supply chains and distribution networks. By exploiting
the upstream and downstream information flowing along the value chain, the firms may try to bypass
the intermediaries creating new business models, or in other ways create improvements in its value
system (CYE Consult, 2009).
However, the world of production and exchange is complex and heterogeneous. Not only do value
chains differ (both within and between sectors), but so, too, do national and local contexts. There is
therefore no mechanistic way of applying value chain methodology; each chain will have particular
characteristics, whose distinctiveness and wider relevance can only be effectively captured and
analysed though an understanding of the broader issues involved (Jacinto and Pomeroy, 2011).
4.1.4 A model of a value chain analysis
A value chain is an analytical as well as an operational model. The model takes up the fact that a
product is rarely directly consumed at the place of its production. It is transformed, combined with
other products, transported, packaged, displayed etc. until it reaches the final consumer. In this process
the raw materials, intermediate products and final products are owned by various actors who are linked
by trade and services, and each add value to the product. Various types of public and private
servicesare as important as favourable framework conditions (CYE Consult, 2009).
The value chain model supposes that by understanding these interactions, it is possible for private and
public agencies (including development agencies) to identify points of intervention to:
- increase efficiency and thereby increase total generated value, and to
- improve the competence of intended actors to increase their share of the total generated
value (CYE Consult, 2009).
Value chains are complex, and particularly in the middle tiers, individual firms may feed into a variety
of chains. Which chains are the subject of enquiry therefore very much depends on the point of entry
for the research inquiry. In each case, the point of entry will define which links and which activities in
the chain are the subject of special enquiry. The entry point and the concentration of the value chain
analysis are directly related to the desired development outcome from supporting the value chain
(Jacinto and Pomeroy, 2011). For example, one key entry point that could be used is the impact of the
development and operation of the small-scale fisheries value chain on food security and poverty
resulting from climate change.
Jacinto and Pomeroy (2011) suggested that the methodology should address the following issues, and
begin with an understanding of the nature of final markets, which are increasingly the driver in many
value chains:
− the point of entry for value chain analysis;
− mapping value chains;
− product segments and critical success factors in final markets;
− how producers access final markets;

37
− benchmarking production efficiency;
− governance of value chains;
− upgrading in value chains; and
− distributional issues.
Kaplinsky and Morris (2001) stress that there is no 'correct' way to conduct a value chain analysis:
rather, the approach taken fundamentally rests upon the research question that is being answered.
None the less, four aspects of value chain analysis as applied to agricultue are particularly noteworthy
(Jacinto and Pomeroy, 2011):
1. At its most basic level, a value-chain analysis systematically maps the economic agents
participating in the production, distribution, marketing and sales of a particular product (or
products). This mapping assesses the characteristics of economic agents, profit and cost
structures, flows of goods throughout the chain, employment characteristics and the
destination and volumes of domestic and foreign sales (Kaplinsky and Morris, 2001).
2. Value chain analysis can play a key role in identifying the distribution of bentfits of
economic agents in the chain. That is, through the analysis of margins and profits within the
chain. This is particularly important in the context of developing countries (and fisheries in
particular), given concerns that the poor in particular are vulnerable to the process of
globalization (Kaplinsky and Morris, 2001).
3. Value chain analysis can be used to examine the role of upgrading within the chain. An
analysis of the upgrading process includes an assessment of the profitability of actors within
the chain, as well as information on constraints currently present. Governance issues play a
key role in defining how such upgrading occurs. In addition, the structure of regulations, entry
barriers, trade restrictions and standards can further shape and influence the environment in
which upgrading can take place (Jacinto and Pomeroy, 2011).
4. Value chain analysis can highlight the role of governance in the value chain. Governance in
a value chain refers the structure of relationships and coordination mechanisms that exist
between economic agents in that value chain. Governance is important from a policy
perspective through identification of the institutional arrangements that may need to be
targeted to improve capabilities in the value chain, remedy distributional distortions and
increase value added in the sector (Jacinto and Pomeroy, 2011).
Figure 5 : The value chain analysis
model

38
4.2 Main steps in value chain analysis
4.2.1 Methodology for undertaking Value Chain analysis
Kaplinsky and Morris (2001) stressed that the world of production and exchange which we are
observing is complex and heterogeneous. So there is no mechanistic way of applying value chain
methodology. Each chain will have particular characteristics. The methodology outlined in following
sections will address the following issues, and begins with understanding the nature of final markets,
which are increasingly the driver in many value chains (Kaplinsky and Morris, 2001):
1. The point of entry for value chain analysis ;
2. Data collection;
3. Mapping value chains ;
4. Product segments and Critical Success Factor’s in final markets ;
5. How producers access final markets ;
6. Benchmarking production efficiency ;
7. Governance of value chains ;
8. Upgrading in value chains ;
9. Distributional issues .
1. The point of entry for value chain analysis
Which chain – or chains – is/are the subject of enquiry therefore very much depends on the point of
entry for the research inquiry. Some possible points of entry, reflecting concerns with are: the global
distribution of income, small scale fishermen and firms, women, etc. In each case, the point of entry
will define which links and which activities in the chain are to be the subject of special enquiry
(Kaplinsky and Morris, 2001).
2. Data collection
Collecting data about a value chain includes gathering information from chain participants (firms,
individual, stakeholders); about their functions and the quality of their relations; about the factors that
affect the industry’s performance such as the business enabling environment, end markets, supporting
markets and inter-firm linkages; and about the presence or lack of investments to upgrading the value
chain’s product or service.
3. Mapping value chains
Having identified, the value chain in question, the task is then to put numbers and values to the
variables under investigation. It is crucial to choose which dimensions are to be mapped, based on
available resources, the scope and objectives of the value chain analysis and the mandate of the
organization” (Making value chains work better for the poor, 2008). Regardless of what choices are
made, the following dimensions are of necessity and therefore should be mapped to provide an
overview of the studied value chain (Bui Nguyen, 2011):
What are core processes through which the product has to pass in order to reach the final
customers?
Who are actors directly involved in such processes?
The product flow has to be identified. The product flow will tell the story of the product’s life.
In addition to internal actors directly involved in the core processes, there exists external,
although indirectly involved, do have effects on the performance of the chain in one way or
another.

39
When mapping services feeding into the value chain, it is worthwhile to keep in mind that
services could be classified into transactional services and embedded services. The value chain
map will include the initial identification of difficulties faced by different actors in the value
chain while they are performing their functions (Bui Nguyen, 2011).
Constructing a value chain map is started with a rough map. Then during the value chain analysis,
more information will be gathered and added to the map to make it more detailed. Mapping a chain
means creating a visual representation of the connections between businesses in value chains as well
as other market players (United Nations International Labor Organization, 2009). Value chains can
become complex when they reflect multi-stage production systems with multiple types of
firms operating in different locations in one country or multiple countries around the world (CYE
Consult, 2009).
4. Product segments and critical success factor’s in final markets
It will almost always be important to decompose the final market in the value chain into different
market segments. Contemporary global markets comprise a number of segments and key
characteristics which will need to be analysed to understand value chain dynamics. These market
characteristics are referred to as Critical Success Factors (CSFs). Not only are markets increasingly
segmented, with each segment having distinctive combinations of CSFs, but they are also increasingly
volatile. The Critical Success Factors in each market can be readily grouped into those factors which
are “order qualifying” (that is, producers need to achieve these in order to participate in these
markets), and those which are “order winning” (that is, these are the critical factors which lead
particular firms to succeed, perhaps by selling at a price premium) (Kaplinsky and Morris, 2001).
5. How producers access final markets
From the perspective of value chain analysis, the key issues to analyse are:
- The identification of the key buyers in a particular chain;
- The dynamics of the buying function;
- The critical success factor’s which these buyers exercise;
- The strategic judgements buyers will often have about specific sources of supply;
- The supply chain management policies ;
- The supply chain upgrading policies.
6. Benchmarking production efficiency
Having charted the dynamic nature of final markets, and the ways in which producers are inserted into
these markets, it is then necessary to analyse the productive efficiency of different parties in the value
chain. This is referred to as “benchmarking”. The key drivers which this chain faces are cost
competitiveness, quality, lead times to satisfy customer orders , the capacity to make changes, etc.
Meeting each of these market drivers requires operational practices, and will be reflected in
performance outcomes; both these performance outcomes and practices can be benchmarked
(Kaplinsky and Morris, 2001).
7. Governance of value chains
The extent of chain power may be related in complicated ways to the relative size of a particular firm
in the chain. In general, the larger the firm, the more influential its role. There are a number of
possibilities, of which the most important are the share of sales, of value added, of profits, of relative
rate of profit and of buying power; the control over a key technology and distinctive competence, the
holder of chain “market identity” (Kaplinsky and Morris, 2001). Which of these indicators is

40
important will be contingent on the characteristics of a particular chain and the question being
pursued. But it will also be important to distinguish the territory of enquiry, that is whether the
relevant size is indicated by the firm’s share of global, national or local activities (Kaplinsky and
Morris, 2001).
8. Upgrading in value chains
Value chain analysis is essential for developing an upgrading strategy. It includes an assessment of the
factors that affect value chain performance, including tangible constraints such as access to finance,
technology and markets, and less tangible dynamics that involve the nature of relationships and
incentives that can equally constrain competitiveness. Understanding how industries in which MSEs
participate can become more competitive requires a systemic view of the markets, industries, and
firms. The value chain framework ensures both systematic and systemic analysis of the value chain
and the factors and relation-ships affecting its competitiveness (CYE Consult, 2009).
The four forms of upgrading are with regard to :
− Improvements in process, either within a firm, or as a result of a series of linked actions in the
relationships between firms ;
− Improvements in product, either within a firm, or as a result of a series of linked actions in the
relationships between firms ;
− Changing functional positions, by adjusting activities undertaken within a particular link, or
moving to activities taking place in other links ;
− Moving out of the value chain, into a new value chain.
9. Distributional issues
Distribution has both power and income components. The former concerns the balance of leverage
which different parties have in determining the distribution of who does what in the chain and the
returns which accrue to different parties. It is necessary to work through the following components of
value chain analysis (Kaplinsky and Morris, 2001):
− What are the different forms of rents and barriers to entry which are the underlying
determinants of the distribution of the returns from global production chains?
− In what circumstances value added and turnover data illuminate the analysis?
− How is profitability to be measured, and are profits an appropriate measure of distributional
outcomes?
− The locational dimensions of global value chain distribution - global, national and local
− decomposing income streams - class, income groups, gender and ethnicity .
− How a knowledge focus can be incorporated into the analysis, opening up the distribution
between skills .
− How do SMEs fit into global value chains.
4.2.2 Information to be collected in fish and aquaculture value chain analysis : NORAD Project
approach
A value chain analysis, providing both qualitative and quantitative background information, is to be
undertaken for all products included in the project before an econometric analysis is undertaken.
Sources of information for this analysis may include secondary data, published or unpublished
literature, surveys, focus groups, and rapid appraisal. The value chain analysis will include the
following stages (Bjørndal, 2010):
1. Production: capture fishery or aquaculture. This will include information on whether it is
capture fishery or aquaculture, freshwater or marine, production quantity, price and technology /
technologies used in the harvest process. How many people are directly employed in the production
sector? What information is available on relative incomes of fishermen / fish farmers and the non-

41
fishing sector and how has this changed overtime? Are there fishermen’s associations to support
fishermen/fish farmers in discussions with government, regulators and buyers? What is the structure of
fisheries management? Is it open access, licenses, net size regulations, etc.? How are regulations
enforced? For capture fisheries, stock information must be included (Bjørndal, 2010).
2. Processing. This will include information about products produced (e.g. fresh, salted, dried,
canned, refrigerated or frozen), technology / technologies used, major inputs and costs. How many
people work in the processing sector? What proportion of catch is processed in the region and what
proportion is sold out of the region or exported for processing? (Bjørndal, 2010).
3. Transportation. This will include pre and post processing transportation, where applicable. Two
things here, first, how important is transportation in the fish supply chain and second, what is the cost
of transportation and how has this changed over time. Is transportation a public or private business
matter (Bjørndal, 2010)?
4. Final consumption. What portion of the product is sold domestically versus exported? This
includes information about what kind of products are sold in the different markets (Bjørndal, 2010).
5. Regulations. This would include fisheries management regulations for capture fisheries, entry /
environmental regulations for fish farms, sanitary/health regulations, tariffs and non-tariff barriers to
trade etc. Also what regulations are imposed on sale of fish? Are there restrictions on who can buy and
sell fish? (Bjørndal, 2010).
6. Market structure. The product will be traded at each stage of the value chain (first hand market,
intermediate market, export market, retail market etc.). It is important to learn about market structure
at different stages, in particular, how many buyers and sellers there are. How are prices determined?
Are fish sold under contract or in auction or what? In addition, information about substitutes is
required (Bjørndal, 2010).
7. Data availability. This must give an overview of data availability (variables, length of time series
etc.) at the different stages of the value chain. For this section, follow the data requirements of both the
structural and reduced form models as set out in Bjørndal and Gordon (2010). Some products will go
through different types of processing. An example is given by tuna from the Maldives. This product
will involve limited processing in the Maldives before export to Sri Lanka or Thailand, where it is
canned prior to export to overseas markets. Where this is the case, the product must be followed
throughout its lifecycle (Bjørndal, 2010).
As pointed out, this background analysis will partly be qualitative and partly quantitative. The
purpose is to give the reader a good understanding of the relevant value chain. It will also be
important for interpreting the results from the econometric price analyses (Bjørndal, 2010).
4.2.3 Dynamics Analyzing
Value chains constantly evolve and can rapidly change. Therefore any value chain analysis faces the
limitation of providing a static picture, a snapshot at one moment in time. Development practitioners
must learn to use analytical tools that help them understand the dynamics and tendencies (CYE
Consult, 2009).
The dynamics of the value chain comprises the determinant elements based on the individual’s and the
firm’s behavior and functioning within the chain; of how power, learning and benefits are distributed.
They include VC governance, inter-firm relationships, upgrading and information exchange.
Value Chain Governance
A distinguishing dimension of value chain analysis is the emphasis not only on the dynamics of end
markets but also on the importance of understanding the dynamics and shifts in relationships. How a
value chain is managed or coordinated and what is the degree of power between buyers and sellers
defines the “governance structure” of a chain. When conducting a value chain analysis, we must

42
identify and understand the type of “governance structures,” as it will significantly determine the
nature of interventions selected to increase competitiveness.
The Figure below illustrates at least four different governance types, followed by a description of
each:
1) The example 1 describes market-based relationships, which are characterized by transactions
in which there is little power difference between buyer and seller. Exchange of goods and
services are negotiated daily on the basis of the market price. There is little information
exchange and learning from the interaction. It is an “arm’s length” transaction. There is little
or no formal cooperation among participants.
2) The example 2 describes a more balanced governance in which decision making is fairly equal
among the participants. The relationships usually create mutual dependence. There is
cooperation among buyers and sellers and no one dominates over the other.
3) In the example 3, a “directed” relationship is typical where small suppliers (in this case craft
products) are transactional-dependent on much larger buyers. The supplier is “controlled” by
one or several lead firm who determine product specifications and trade rules. We should
determine whether the supplier is “captive” to the buyer by the his/her cost of shifting to
another firm.
4) The governance on the right (Example 4) is when the value chain has a dominant player who
sets or controls various functions along the chain and has a tendency to want to govern the
chain. The lead firm determines the overall character of the chain and can be a vertically
integrated enterprise.
In conducting the value chain analysis, we must understand the relationships between lead firms
and local producers and the opportunities and constraints that result from SME or even MSE
entering such a relationship.
Inter-firm relationships – embedded in Vertical and Horizontal linkages
To understand and measure relationships we look at: how market power is distributed within a value
chain and how information and learning flow.
- How power, learning and benefits are distributed? To what extent are links established
between MSEs and businesses at different levels of the value chain and with support markets?
1 2 3 4
IntegratedFirm
VALUE CHAIN GOVERNANCE
Price
Suppliers
Buyers
Suppliers
Buyers
Market Balanced Directed Hierarchy
MajorBuyer
Suppliers
(Tomatoes) (Organic Coffee) (Export Crafts) (Cut Flowers)

43
- How information and learning takes place is crucial to create and sustain competitiveness. It
is a pre-condition for upgrading, and learning can effect benefit and incentives. Thus if small
producers are to compete and upgrade to respond to market opportunities, chain analysis must
look to see if small producers have access to new skills, know-how and learning on a
continuous basis, rather than on a one shot event such as a workshop or a training cycle.
- Where do we look to see if learning and acquiring new skills take place on a continuous basis?
Initially, knowledge about alternative markets and market opportunities is acquired through
horizontal linkages among same line operators. Buyers generally are not the source of such
information.
- Where do we look to see if knowledge and skills are acquired about how to produce and
deliver a product according to the market standards and requirements? This usually comes
from through vertical linkages and usually from buyers.
Upgrading – Incentives, risks and benefits
Upgrading is the process sought for firms and value chains to increase their competitiveness as well to
impact in a positive manner social development. In value chain analysis, we must find if there are
catalysts to firm and chain upgrading. The starting points are where learning takes place, and if it takes
place, are there indicators that learning is continuous?
Learning is a pre-condition to upgrading at the firm level, and continuous learning comes from
fostering improved vertical and horizontal relationships between buyers and sellers. We need to know
if improvement in these inter-firm relations is taking place within the chain.
Learning can improve benefits, and benefits over time can change power. Benefits create incentives
(or disincentives) for upgrading and thus affect competitiveness.
Information exchange
Value chain analysis must determine where learning comes from over time. If buyers are the catalysts
for change and learning, is there evidence that some buyers are pushing for change and learning? What
drives them to push and can it be replicated?
If input suppliers are the sources of information, is there evidence that they are providing reliable and
transparent. What would drive them to become agents for product information dissemination?
If traders are to be disseminators of innovation and new products, is there evidence from interviews
that they are fulfilling these tasks? What incentives would entice traders to share product and technical
innovation?
If service providers are to be contributions to learning at different levels of the chain, is there evidence
that value chain firms are hiring them as trainers or consultants, and have the firms become repeat
customers of the service provider? In a market system, what is missing to increase sector specific or
cross-cutting presence of service providers in the value chain?
In summary, relationships among actors in a value chain are important because relationships can be
improved without creating market distortions, and can be modified through effective leadership,
incentives, increased knowledge sharing and trust building that increase benefits not only to SMEs
trying to participate and gain more from the value chain, but will drive enterprises to move into higher
value added activities.
4.3 Value chain upgrading
44
Definition
Value chain analysis examines activities and services required to bring a product or service from
inception to end markets. It helps design interventions to increase competitiveness while ensuring
equitable distribution of the benefits from growth. It is particularly useful in creating a private sector
driven vision for change, and a plan to reach that vision. (60)
In value chain analysis, upgrading is used to identify the possibilities for producers to ‘move up the
value chain’, either by shifting to more rewarding functional positions, or by making products that
have more value-added invested in them, and that can provide better returns to producers. In the value
chain approach, the upgrading process is examined through the lenses of how knowledge and
information flow within value chains from ‘lead firms’ to their suppliers (or buyers) (Gereffi, 1999).
Value chain development is a multiple and participatory process that leads to coordinated
interventions. It has the enormous advantage to bring together stakeholders from different production
stages and sectors, to create a productive and innovative dialogue and to draw the attention to
‘Collective Competitiveness’ (CYE Consult, 2009). Upgrading is the process sought for firms and
value chains to increase their competitiveness as well to impact in a positive manner social
development.
Different types of upgrading
Firm-level upgrading refers to changes made by firms to improve their competitiveness through
product development and improvements in production techniques or processes. Firm-level upgrading
requires access to information, technology and capital or finance. Product development and
improvements in production processes are integral to sustained competitiveness through enabling
firms to meet the market’s constant demand for innovation (CYE Consult, 2009).
However, we need to view the upgrading challenge in a wider perspective, capturing the central idea
that it may involve changes in the nature and mix of activities, both within each link in the chain, and
in the distribution of intra-chain activities. This relates both to the achievement of new product and
process development, and in the functional reconfiguration of who does what in the chain as a whole.
Hence, upgrading is about acquiring capabilities and accessing new market segments through
participating in particular chains (Humphrey and Schmitz, 2002b). Humphrey and Schmitz (2002a)
have developed a typology of upgrading based on four categories, which are less conspicuous
improvements that may in fact be the most common forms of upgrading among poorer producers
(Ponte, 2008):
1. Process upgrading: achieving a more efficient transformation of inputs into outputs
through the reorganisation of productive activities (Ponte, 2008).
2. Product upgrading: introducing new products or improving old products faster than rivals.
This involves changing new product development processes both within individual links in the
value chain and in the relationship between different chain links;
3. Functional upgrading: increasing value added by changing the mix of activities conducted
within the firm or moving the locus of activities to different links in the value chain;
4. inter-chain upgrading: applying competences acquired in one function of a chain and
using them in a different sector/chain.
Although functional upgrading continues to be regarded by global value chain analysts as the optimal
form that developing country farms and firms can achieve, attention has also been being paid to the
practical difficulties lying in its path (Gibbon 2001; Gibbon and Ponte 2005; Schmitz and Knorriga,

45
1999) and to the fact that functional downgrading, combined with economies of scale, can also be
successfully employed to maximise returns or to remain in an increasingly demanding GVC (Ponte,
2008).
The role of learning and innovation
Learning and innovation are key to creating and sustaining an industry’s competitive advantage since
industry upgrading is dependent on knowledge of what the market requires and the potential returns on
investments in upgrading. It is essential that learning and innovation flow through the value chain in
order to optimize these returns. The most competitive industries are those that institutionalize learning
mechanisms. However, even with strong incentives to limit learning and innovation, fostering access
to a new market (typically requiring a change in product or process) or new support markets that
deliver new technology can substantially shift the learning dynamic (CYE Consult, 2009).
Benefits are closely related to power relationships and learning. In the context of MSEs development,
benefits are much broader than just increases in income, although that is an important part of the
equation. The distribution of benefits depends also on the strength of a value chain’s infrastructure,
means the quality of the business enabling environment, the number and nature of vertical linkages,
the effectiveness of cooperation to address joint constraints, and the depth and robustness of
support markets (CYE Consult, 2009).
Fish value chain upgrading policies
In fish production, capture fisheries as well as fish farming, a large share is carried out by the small-
scale sector. It is therefore of crucial importance to arrive at polices that safeguard the interests of the
small-scale producers not only by enabling them to access national, regional and/or international
markets but also to obtain prices and margins that let them achieve long-term sustainability from an
economic, social and biological resource perspective.
In fisheries sector, the value chain approach in relatively young. It targets one chain, often starting
with one project or enterprise in one location. The value chain approach can be well suited to
contribute to local economic development. It enhances the analysis of specific constraints encountered
by fishers, processors, cooperatives, etc. and solutions not merely focus on business development, but
in recent years also address networking, social, institutional and environment issues and/or micro
finance (CYE Consult, 2009).
According to Jacinto and Pomeroy (2011), small-scale fishers need to strengthen their organizations
for resource management and market development, they also need to identify and examine the types of
markets with which they can engage and benefit from.
Value chains can offer the poorer segments of the population the opportunities of creating new
markets if supported and managed in a targeted manner. Moreover, the value chain approach takes into
consideration that the SMMEs often have a different (less empowered) position in the value chains
than the other actors. Through value chain analysis this position can be analyzed and opportunities for
strengthening their position in the chain can be explored and hence contribute to improved livelihoods
and local economic development (CYE Consult, 2009).
Developing countries face tremendous challenges and competition for economic growth given
economic liberalization worldwide. The effects of globalization and liberalization are creating
exclusive supply chains between preferred business partners, with serious effects on local economies
in developing countries. A holistic approach is therefore needed to protect and include smallholder
producers in integrated supply chains to support poverty reduction, food security and sustainable
livelihoods (CYE Consult, 2009). Hence, a strong business environment based on sound institutions
and policies is a necessary basis for enhanced competitiveness of private firms.
Building mutually beneficial relations among the various actors in the value chain while maintaining
priority on improving the livelihoods of small-scale fishers can start from the hypothesis, on the part

46
of smallscale fishers and their support organizations, that traders can be potential partners rather than
being the adversaries in a zerosum game (Jacinto and Pomeroy, 2011).
Traders play necessary roles in the functioning of value chains, such as helping to develop consumer
markets, providing financial services and adding value to fishery products. On occasion they bear risks
even more so than do primary producers spoilage, low prices in consumer markers, non-payment of
loans -and in the course of trading operations devise means to manage and mitigate such events. The
margins that they obtain in the markets should be appraised in the light of these risks, as well as the
costs they incur and the services they provide (Jacinto and Pomeroy, 2011).
BIBLIOGRAPHY
Ardjosoediro, I. and Neven, D. (2008). The Kenya capture fisheries value chain: an AMAP-FSKG
value chain finance case study. USAID.
Bjørndal, T. (2010). Value Chain Analysis Template. FAO Norad Project.
Bjørndal, T. And Gordon, D.V. (2010). Notes on Prices and Margins in Fish Marketing. FAO Norad
Project. Rome.
Bjorndal,T., Fernández-Polanco, J.(2012). Price linkages in value chains: methodology. FAO Norad
Project.
BUI NGUYEN, P.T. (2011). The value chain of white leg shrimp exported to the U.S market in
Khanh Hoa province, Vietnam. Master Thesis in Fisheries and Aquaculture Management and
Economics. University of Tromso, Norway.
CYE Consult. (2009). Value chain analysis of selected commodities-Institutional development across
the Agri‐Food Sector (IDAF) – 9 ACP Mai 19. Final report.
D. Russell and S. Hanoomanjee (2012). Regional training on value chain analysis - manual on value
chain analysis and promotion. ACP FISH II Programme. European Union.
Davidsson, K. (2007). The Seafood Industry –An Investors Perspective. Glintir Bank. Iceland.
De Silva, D.A.M. (2011). Value chain of fish and fishery products: origin, functions and application in
developed and developing country markets. Food and Agriculture Organization. Rome
Edakkandi, M. R. (2012). Value Chains and Small Enterprise Development: Theory and Praxis.
American Journal of Industrial and Business Management, 2013, 3, 28-35.
FAO Fisheries and Aquaculture Organization. (2013b). Global Capture Fisheries Production Statistics
for the year 2011 [online]. ftp://ftp.fao.org/FI/news/GlobalCaptureProductionStatistics2011.pdf
FAO 2007-2013. Small-scale fisheries - Web Site. Small-scale fisheries. FI Institutional Websites.
In: FAO Fisheries and Aquaculture Department [online]. Rome. Updated . [Cited 10 November
2013]. http://www.fao.org/fishery/ssf/155791/en
Fisheries and Aquaculture Organization (2010). The state of world fisheries and aquaculture. Rome.
Fisheries and Aquaculture Organization (2012). The state of world fisheries and aquaculture. Rome.
Food and Agriculture Organization and World Fish Center (2010). Small scale capture fisheries – a
global overview with emphasis on developing countries. A preliminary report of the Big Numbers
Project
47
Food and Agriculture Organization. (2012a). FAO workshop on international guidelines for securing
sustainable small-scale fisheries. Workshop report. Rome: 2012.
Gudmundsson, E., Asche, F. and Nielsen, M. (2006). Revenue distribution through the seafood value
chain. FAO Fisheries Circular No. 1019. Rome.
http://www.undercurrentnews.com/2013/06/20/oecd-expects-fish-demand-prices-to-rise-more-than-
most-commodities/
Jacinto, F.R. and Pomeroy, R.S. (2011). Developing Markets for Sma.lI-scale Fisheries: Utilizing the
Value Chain Approach. In: Small-scale fisheries management: frameworks and approaches for the
developing world.
Kalikoski, D. and De Graaf,. G. (2005). Approaches to small scale fisheries assesment: A review.
Workshop on interdisciplinary approaches to the assessment of small-scale fisheries. FAO FishCode
STF Project and WorldFish Center. Rome.
Kaplinsky, R. and Morris, M. (2001) . A handbook for value chain Research. Ottawa: International
Development Research Centre.
Malvarosa, L. and De Young, C. (2010). Fish trade among Mediterranean countries: Intraregional
trade and import–export with the European Union. FAO-CGPM. Studies and Reviews. Rome.
Nang’ole, E.M., Mithöfer, D. and Franzel, S. (2011). Review of guidelines and manuals for value
chain analysis for agricultural and forest products. ICRAF Occasional Paper No. 17. Nairobi: World
Agroforestry Centre.
Ponte, S. (2008). Developing a ‘vertical’ dimension to chronic poverty research: Some lessons from
global value chain analysis. Working Paper. Chronic Poverty Research Centre.
Sakai, Y. et al. (2012). Asymmetric price transmission in the Japanese seafood value chain -Analyses
focusing on six fish species. IIFET 2012, Tanzania.
Sapkota, P. et al. (2012). Price transmission relationships along the seafood value chains in
Bangladesh: aquaculture and capture fishery species. FAO Norad Project.
Sauzade, D., Rousset, N. (2013). Greening the Mediterranean fisheries: tentative assessment of the
economic leeway. Plan Bleu, Valbonne.
Small-scale fisheries - Web Site. Small-scale fisheries around the world. FI Institutional
Websites. In: FAO Fisheries and Aquaculture Department [online]. Rome. Updated . [Cited 11
November 2013].http://www.fao.org/fishery/ssf/world/en
United Nations Environment Programme (2009). The Role of Supply Chainsin Addressing the Global
Seafood Crisis.
World Bank, Food and Agriculture Organization and World Fish Center (2010). The Hidden Harvests
- The global contribution of capture fisheries. Conference Edition. Washington DC.
Yumiko, K. et al. (2004), Fishing for Answers: Making Sense of the Global Fish Crisis,
WASHINGTON, DC: World Resources Institute.