Embed Size (px)
Citation preview
Draft of presentation
To be given byAjit K. Ghose
EMPLOYMENTTHE FAULTLINE IN INDIA’S EMERGING
ECONOMY
1
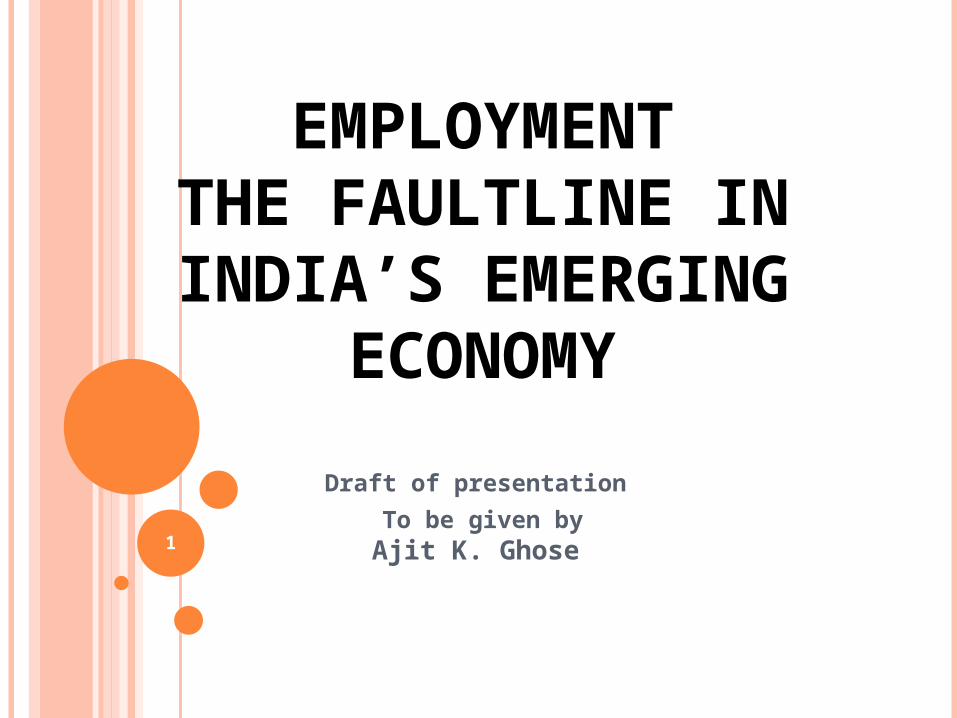
The problem: •Since the beginning of the 1980s, India’s economy has grown at a rapid and accelerating rate. For the 30-year period of 1950-80, it had grown at the so-called “Hindu” rate of growth of around 3 per cent per annum. But then the “East Asian” rate of growth replaced the “Hindu” rate; the elephant transformed itself into a tiger. Today, India’s economy is the second fastest growing economy in the world and one of the most important emerging economies. •The rapid economic growth, however, has not brought about transformative change in employment conditions in the country. Not that employment conditions have deteriorated; they have in fact improved. But the improvement has been rather insubstantial. The structure of employment, for example, has changed much too little; traditional low-productivity employment remains overwhelmingly dominant in the economy.
2

• The rapid economic growth has also been associated with opening-up of the economy and it is rather intriguing that the opening-up had little effect on the growth-employment relationship. Contrary to expectation, the opening-up actually stimulated skill-intensive manufacturing and services rather than labour-intensive manufacturing.
• In short, there has been a serious disconnect between
economic growth and employment over the long run. Economic growth has been non-inclusive as a result. This much is widely accepted, if not adequately understood. It is also widely recognised that if growth continues to be non-inclusive, sustainability of the growth process itself will be seriously threatened by social tensions and political instability.
• In my presentation, I propose to do three things: (a)
examine the nature of disconnect between economic growth and employment, (b) look for some explanations, and (c) consider policy options.
3
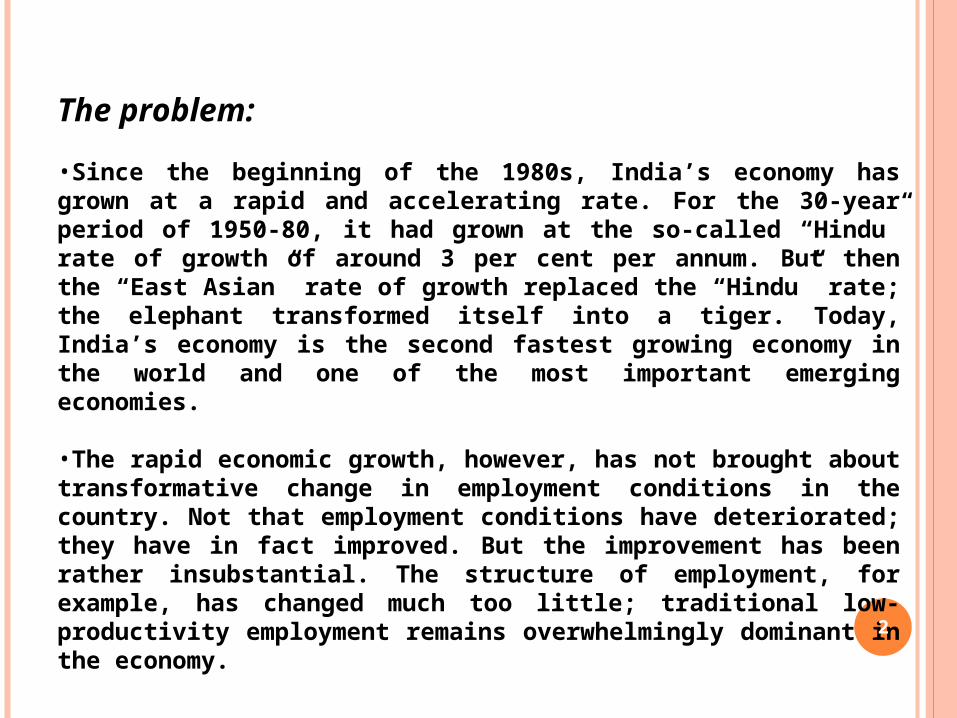
Four points to be noted: (a) since 1983, the economy has grown at a rate of more than 5 per cent per annum; (b) growth has been accelerating over the 27-year period 1983-2010; (c) in the most recent period (2005-2010), growth exceeded 8 per cent; and (d) relatively high and accelerating growth occurred in both organised and unorganised parts of the economy.
1983-1993/94
1993/94-2004/05
1999/00-2009/10
2004/05-2009/10
GDP at factor cost 5.2 6.3 7.3 8.6
NDP at factor cost 5.0 5.8 6.9 8.4
Organised sector 6.0 7.3 7.8 10.3
Unorganised sector 4.5 4.9 5.7 7.0
Table 1: Economic growth, 1983-2009/10 (average annual rate, %)
4
What happened to employment in this period? The question is not in fact easy to answer. Normally, we would look at trends in unemployment, employment and wage rates. But, in the context of India’s economy, these standard indicators do not tell us much about the trends in employment conditions.
The reason is that India’s economy has been and remains a Lewis-type “dual economy with surplus labour” par excellence, with two sectors - organised and unorganised – and a large volume of surplus labour in the unorganised sector.
5
Employment and labour market: (A schematic description)
In the organised sector, which employs a very small proportion of the workers in the economy, employment is much like that in developed countries. Jobs are regular and full-time. Government regulations influence wages, non-wage benefits and job security. And there are trade unions that engage in collective bargaining with the employers over all these. The wage in this sector is much higher than the average labour-income in the unorganised sector.
In the unorganised sector, there are neither government regulations nor collective bargaining. Most of the workers in the sector are in self-employment and some are in casual wage employment.
6
Systems of self-employment and casual wage employment
easily accommodate work sharing. If there are more workers than are needed, the result is underemployment of all and not unemployment of some. It is through work sharing that surplus labour is accumulated and held.
Self-employment and casual wage employment are also closely linked. Self-employed also work as casual labourers just as casual labourers also work as self-employed. A single household often has both self-employed and casual labourer.
Institutionalised social security is available to only a tiny proportion of the workers employed in the organised sector.
7

Implications:
Since most people do not have access to institutionalised social security, they must work to survive. Given the high wage and non-wage benefits associated with jobs in the organised sector, most people look for jobs there in the first instance. Those who do not find work in the organised sector can find it in the unorganised sector where additional workers can always be accommodated through work sharing.
So, first, unemployment is a luxury good that only persons from well-off households can afford. These persons are really waiting in the queue for jobs in the organised sector. Thus the unemployment rate shows the size of the queue for jobs in the organised sector but says nothing about the excess supply of labour in the economy. Not surprisingly, the rate is generally low and remains quite stable over time.
8
Second, this also means that the employment rate simply follows the labour force participation rate; a change in the employment rate is a mere reflection of a change in the participation rate. So the employment rate indicates the state of labour supply rather than the state of labour demand. Similarly, rate of job growth is simply the rate of labour force growth. It is not very useful to ask if the rate of job growth has accelerated or decelerated.
Third, the observed number of persons in employment is a poor indicator of the actual volume of labour employed because there is substantial underemployment.
9
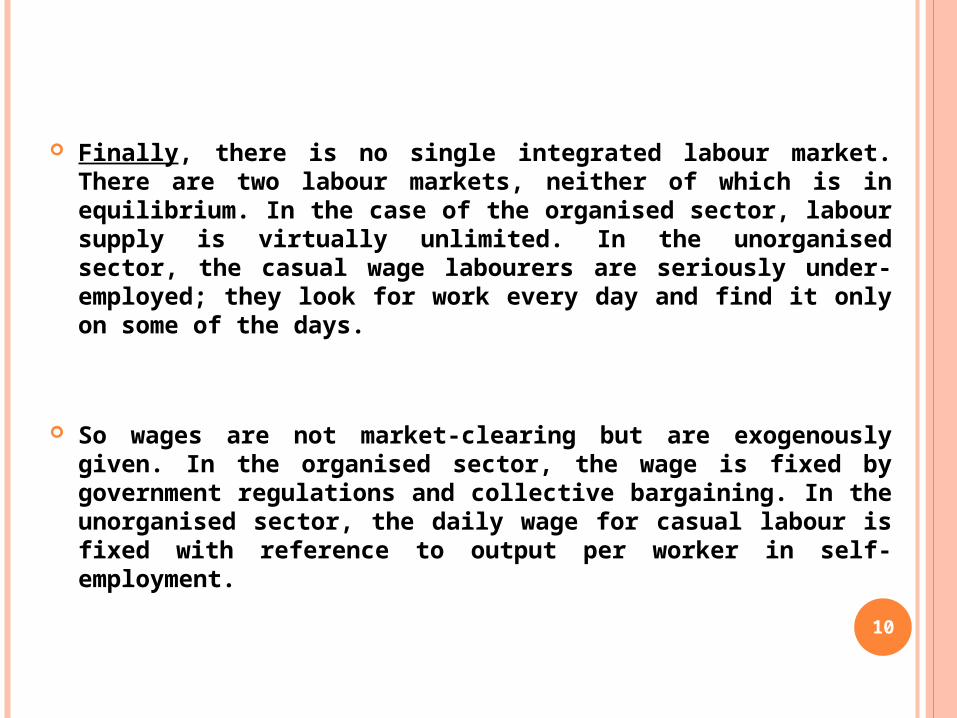
Finally, there is no single integrated labour market. There are two labour markets, neither of which is in equilibrium. In the case of the organised sector, labour supply is virtually unlimited. In the unorganised sector, the casual wage labourers are seriously under-employed; they look for work every day and find it only on some of the days.
So wages are not market-clearing but are exogenously given. In the organised sector, the wage is fixed by government regulations and collective bargaining. In the unorganised sector, the daily wage for casual labour is fixed with reference to output per worker in self-employment.
10

[Self-employment is the fall-back position for the casual labourers and casual labour is the fall-back position for the self-employed. In self-employment, a notional output per worker per day can be constructed as the output in a production period divided by the number of days in the production period. This is notional because self-employed persons are also under-employed, i.e., do not find work to do on all days of the production period. Let q be the output per worker in self-employment, d the number of days in the production period, d’ the number of days of actual employment of a casual labourer and w the casual wage rate. Then q/d = (d'/d). w = π. w. This still leaves w undetermined. But any arbitrary value will do because π will adjust to ensure equality. If w is too high, some of the self-employed will want to work as casual wage labourers, thereby lowering the value of π. Similarly, if w is too low, some casual wage labourers will withdraw into self-employment, thereby increasing the value of π.]
Thus change in wage does not give any useful information about tightness of labour markets.
11
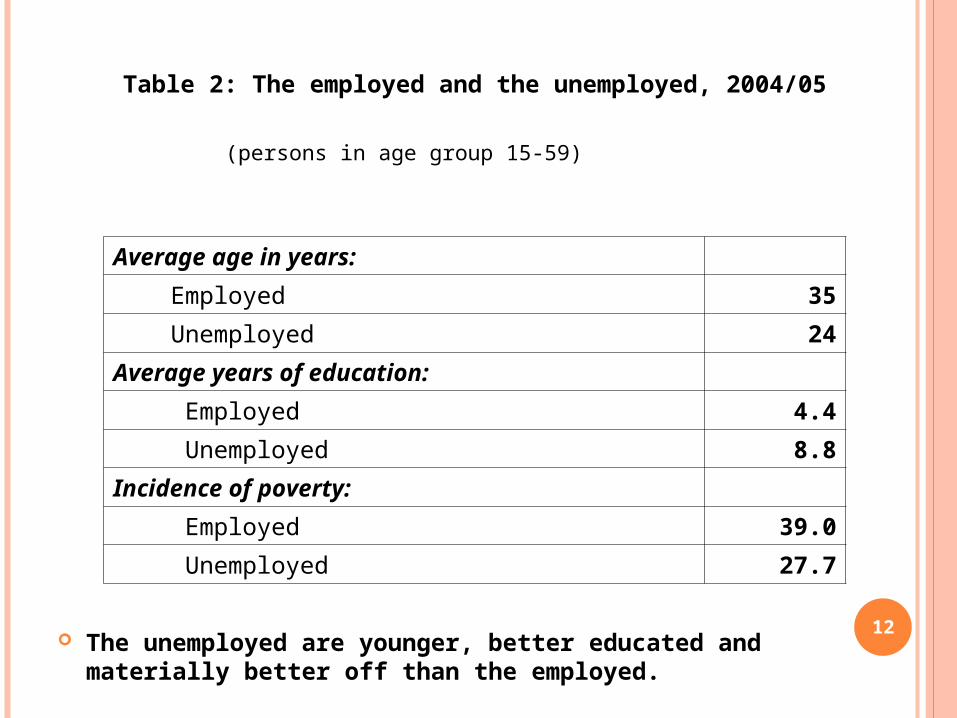
The unemployed are younger, better educated and materially better off than the employed.
Table 2: The employed and the unemployed, 2004/05
(persons in age group 15-59)
Average age in years:
Employed 35
Unemployed 24
Average years of education:
Employed 4.4
Unemployed 8.8
Incidence of poverty:
Employed 39.0
Unemployed 27.7
12

The rate of unemployment rises steadily with the level of education. This is the exact opposite of what is observed in developed countries.
Table 3: Education and unemployment, 2004/05
(persons in age-group 15-59 years)
Rate of unem-
ployment (%)
Level of education
No schooling 0.8
Up to primary (1-5 years) 1.9
Up to middle (6-8 years) 3.8
Up to lower secondary (9-10 years) 6.3
Up to higher secondary (11-12 years) 9.6
Tertiary (12+ years) 10.3
Overall 3.5
13
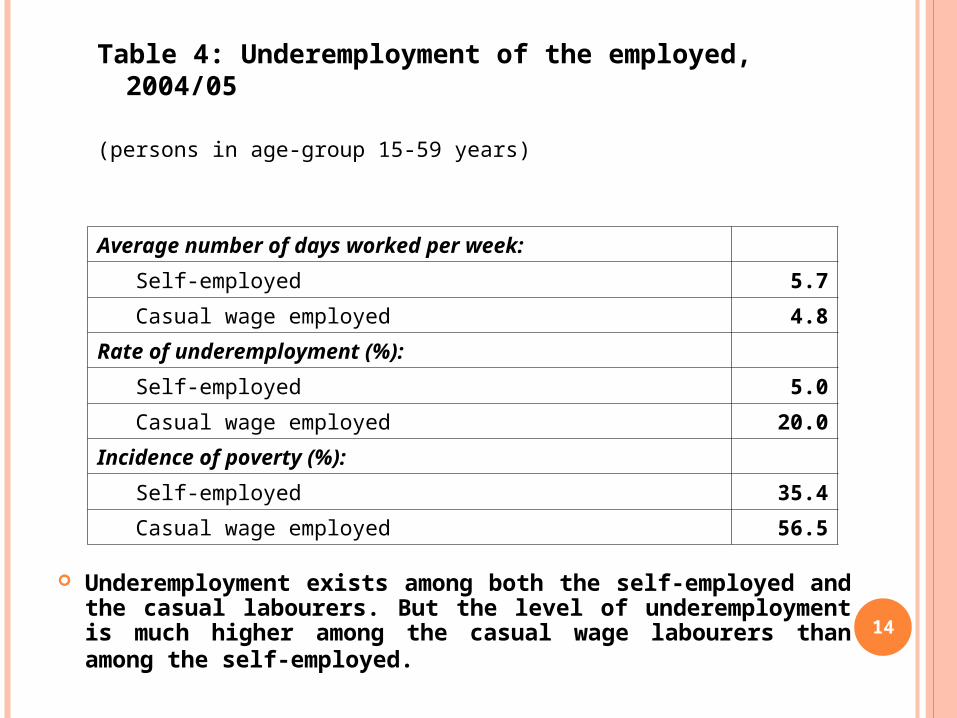
Underemployment exists among both the self-employed and the casual labourers. But the level of underemployment is much higher among the casual wage labourers than among the self-employed.
Table 4: Underemployment of the employed, 2004/05
(persons in age-group 15-59 years)
Average number of days worked per week:
Self-employed 5.7
Casual wage employed 4.8
Rate of underemployment (%):
Self-employed 5.0
Casual wage employed 20.0
Incidence of poverty (%):
Self-employed 35.4
Casual wage employed 56.5
14
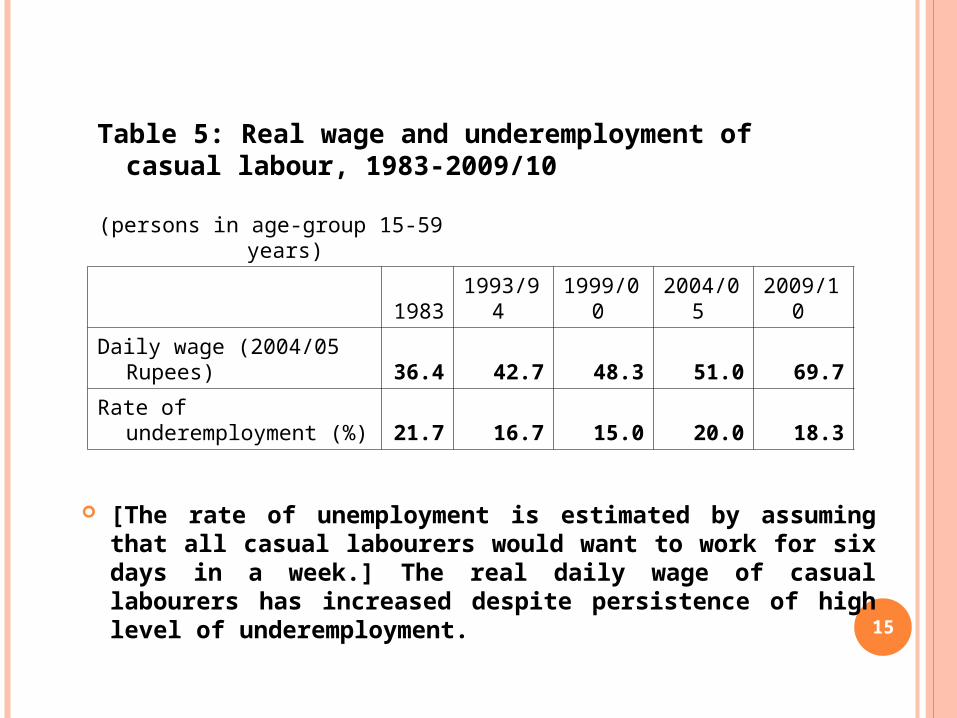
[The rate of unemployment is estimated by assuming that all casual labourers would want to work for six days in a week.] The real daily wage of casual labourers has increased despite persistence of high level of underemployment.
Table 5: Real wage and underemployment of casual labour, 1983-2009/10
(persons in age-group 15-59 years)
1983 1993/94 1999/00 2004/05 2009/10
Daily wage (2004/05 Rupees) 36.4 42.7 48.3 51.0 69.7
Rate of underemployment (%) 21.7 16.7 15.0 20.0 18.3
15
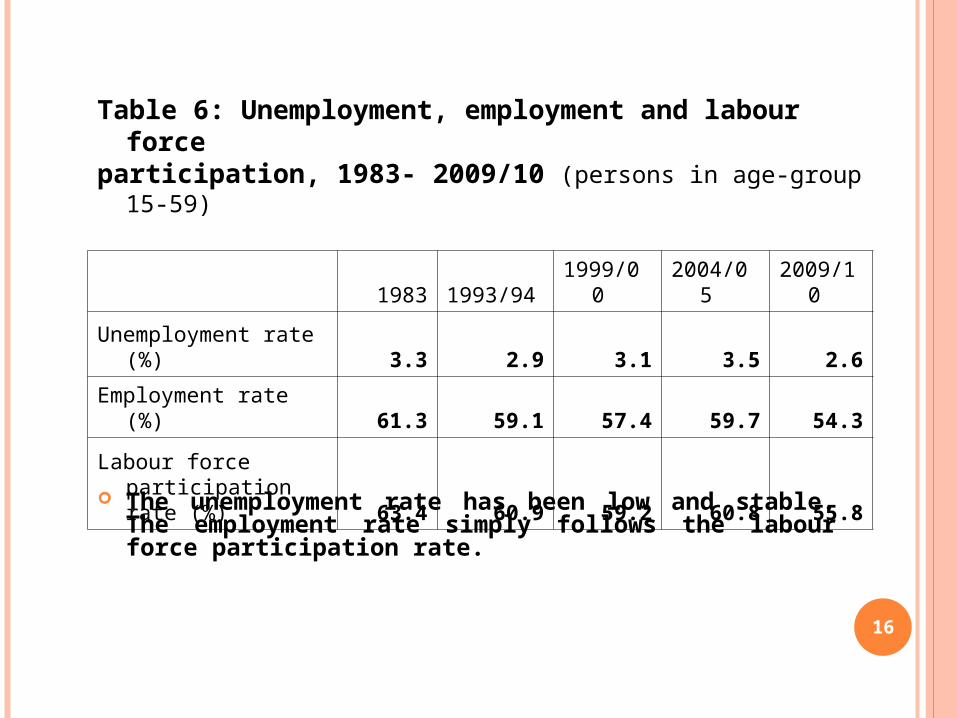
The unemployment rate has been low and stable. The employment rate simply follows the labour force participation rate.
Table 6: Unemployment, employment and labour force participation, 1983- 2009/10 (persons in age-group 15-59)
1983 1993/94 1999/00 2004/05 2009/10
Unemployment rate (%) 3.3 2.9 3.1 3.5 2.6
Employment rate (%) 61.3 59.1 57.4 59.7 54.3
Labour force participation rate (%) 63.4 60.9 59.2 60.8 55.8
16
Relevant indicators:
What then are the indicators that can tell us if the employment conditions have been improving or deteriorating? There are two such indicators.
The first is the rate of growth of formal employment, i.e., regular, full-time employment with institutionalised social security found in the organised sector. When this is higher than the rate of growth of labour force in the economy, there is movement of workers from informal to formal employment, which unambiguously improves employment conditions.
The second is output per worker in the unorganised sector. Growth of this implies either a decline in underemployment or a rise in labour productivity (output per unit of labour used) or both. In all cases, there is an unambiguous improvement in employment conditions.
17

Table 7: Structure of employment, 1983-2009/10
(persons in age group 15-59) 1983 1993/94 1999/00 2004/05 2009/10
Share (%) in total employment of:
Regular wage employment 16.1 15.7 16.1 16.5 17.7
Regular-formal 10.2 9.3 6.9 6.7 7.4
Regular-informal 5.9 6.4 9.2 9.8 10.3
Casual wage employment 31.6 34.3 35.4 31.1 34.9
Self-employment 52.3 50.0 48.5 52.4 47.4
Casual and self employment 83.9 84.3 83.9 83.5 82.3
Organised sector 13.6 12.4 11.6 10.9 14.2
Unorganised sector 86.4 87.6 88.4 89.1 85.8
18
(a) Self-employment and casual wage employment have been and remain overwhelmingly dominant. (b) The organised sector employs only a small proportion of the workers. (c) An even smaller proportion is in formal employment. (d) So not all of the workers employed in the organised sector are in good jobs. Nevertheless, even the workers who do not have good jobs in the organised sector have better jobs than those in the unorganised sector.
For much of the period, growth of formal employment as also of organised sector employment fell short of the growth of labour force in the economy. So the share of good jobs in all jobs became progressively smaller. Only in the last period – 2005-2010 – is a process of labour transfer from informal to formal employment and from unorganised to organised sector observed. The extent to which this is a new trend rather than a random event is difficult to judge.
19
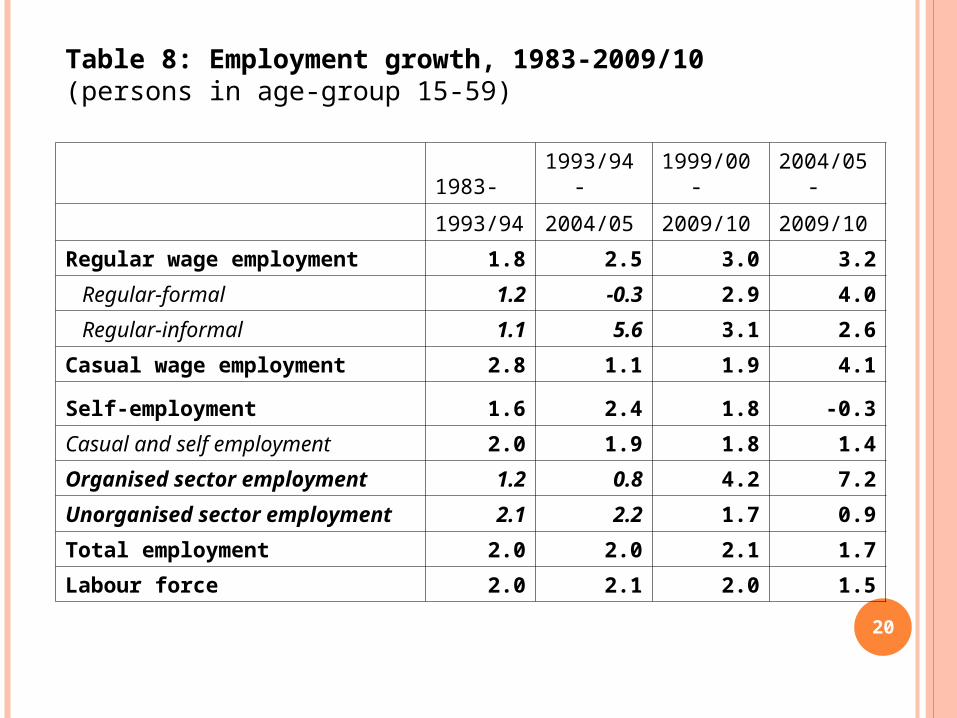
Table 8: Employment growth, 1983-2009/10 (persons in age-group 15-59)
1983- 1993/94- 1999/00- 2004/05-
1993/94 2004/05 2009/10 2009/10
Regular wage employment 1.8 2.5 3.0 3.2
Regular-formal 1.2 -0.3 2.9 4.0
Regular-informal 1.1 5.6 3.1 2.6
Casual wage employment 2.8 1.1 1.9 4.1
Self-employment 1.6 2.4 1.8 -0.3
Casual and self employment 2.0 1.9 1.8 1.4
Organised sector employment 1.2 0.8 4.2 7.2
Unorganised sector employment 2.1 2.2 1.7 0.9
Total employment 2.0 2.0 2.1 1.7
Labour force 2.0 2.1 2.0 1.5
20
1983- 1993/94- 1999/00- 2004/05-
1993/94 2004/05 2009/10 2009/10
NDP per worker
Organised sector 4.8 6.5 3.6 3.1
Unorganised sector 2.4 2.7 4.0 6.1
The economy 3.0 3.8 4.8 6.7
Real wage per day:
Regular wage employment 2.8 2.2 2.0 6.4
Regular-formal 2.6 5.0
Regular-informal 0.0 5.9
Casual wage employment 1.5 1.6 3.7 6.4
Organised sector 1.5 3.1
Unorganised sector 2.8 5.9
The economy 2.0 2.3 2.7 5.7
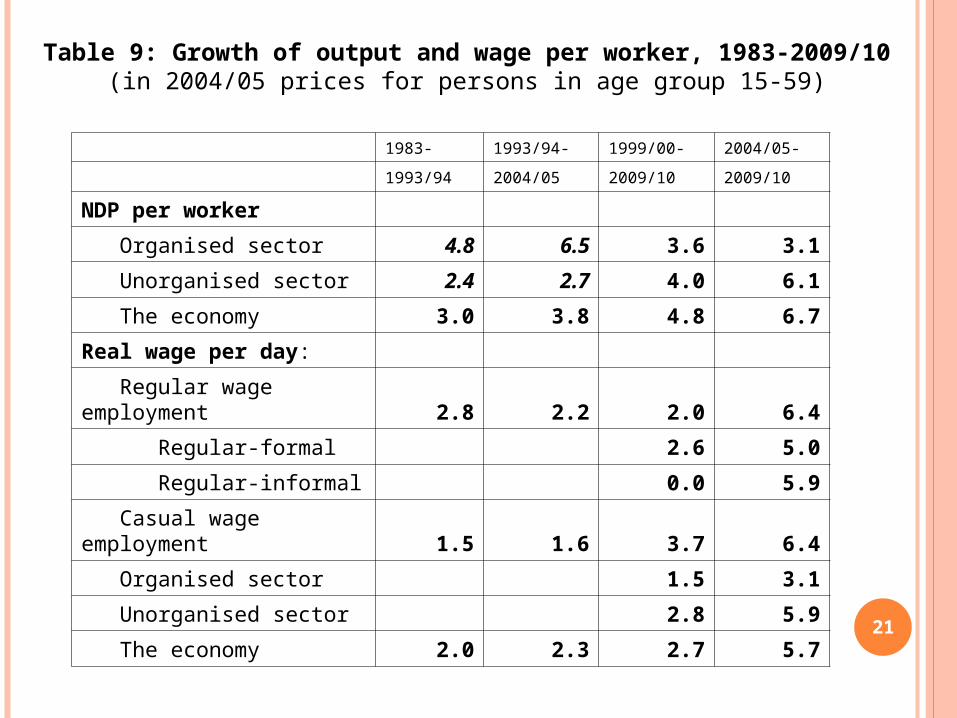
Table 9: Growth of output and wage per worker, 1983-2009/10(in 2004/05 prices for persons in age group 15-59)
21

• Output per worker in the unorganised sector increased at an increasing rate.
• Real wage grew in both sectors. But growth was faster in the unorganised sector. Noticeably, wage growth was linked to growth of output per worker in the unorganised sector, but no such linkage is observed in the organised sector. The strong wage-productivity linkage in the unorganised sector is easily explained in terms of the linkage between self-employment and casual wage employment. In the case of the organised sector, we do not have reasons to expect a wage-productivity linkage. Both the government regulations and the system of collective bargaining make wage growth wholly exogenous. 22
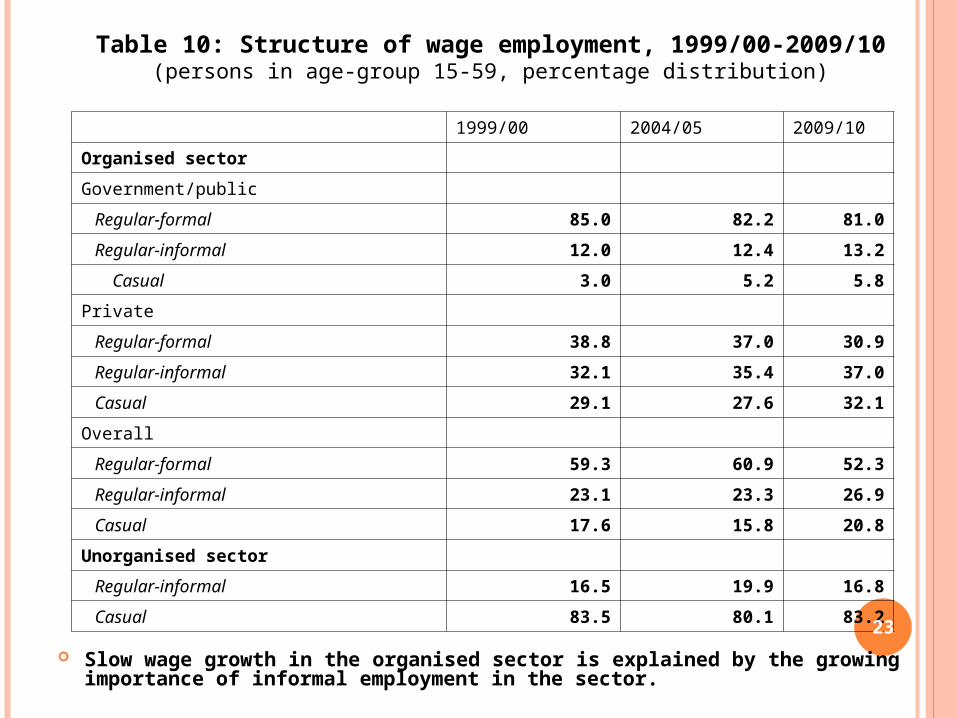
Slow wage growth in the organised sector is explained by the growing importance of informal employment in the sector.
1999/00 2004/05 2009/10
Organised sector
Government/public
Regular-formal 85.0 82.2 81.0
Regular-informal 12.0 12.4 13.2
Casual 3.0 5.2 5.8
Private
Regular-formal 38.8 37.0 30.9
Regular-informal 32.1 35.4 37.0
Casual 29.1 27.6 32.1
Overall
Regular-formal 59.3 60.9 52.3
Regular-informal 23.1 23.3 26.9
Casual 17.6 15.8 20.8
Unorganised sector
Regular-informal 16.5 19.9 16.8
Casual 83.5 80.1 83.2
Table 10: Structure of wage employment, 1999/00-2009/10(persons in age-group 15-59, percentage distribution)
23
Summary:
Employment conditions improved somewhat basically because there was decent growth of labour productivity in the unorganised sector, which increased labour-incomes. There was no labour transfer – from informal to formal employment and from unorganised to organised sector – except in the most recent 5-year period. Hence the persistence of the overwhelming predominance of traditional forms of employment as also of serious underemployment.
So, very low employment intensity of growth in the organised sector has been the central problem. This hovered around 0.2 except during 2004/05-2009/10 when it was as high as 0.7 (it is hard not to feel that this might be an aberration). The “formal employment elasticity”, of course, was even lower.
24
Explanation:
What explains the low employment elasticity in the organised sector? A popular explanation points to “labour market rigidities”. There are government regulations that make dismissal or even redeployment of workers difficult. These difficulties allegedly act as strong disincentive to hiring and focus employers’ mind on substitution of machines for workers.
There are studies which appear to support this view. But there are other studies, including one of my own, that do not support it.
25
The main problem with this explanation is that private enterprises in the organised sector do not face much rigidity in practice. And these enterprises dominate manufacturing. The evidence: the share of formal employment in these enterprises was only 39 per cent even in 1983 and fell to 31 per cent by 2010. [Look back at Table 10] Much of the formal employment in the economy (59 per cent in 2009/10) is in services in government/public sector, where rigidities are important but would have existed even without the labour regulations. [Rigidities in government/public sector would be found in most countries and are not particular to India.]
26
My own view is that there is more than one factor involved.
The first is that the relative price of unskilled labour vis-à-vis skilled labour is too high (or the relative price of skilled vis-à-vis unskilled labour is too low) in the organised sector. While government regulations and collective bargaining make the price of unskilled labour relatively high, massive subsidisation of higher education makes the price of skilled labour relatively low.
Admittedly this is a hypothesis rather than an empirically substantiated proposition at this point. But some sketchy evidence can be cited. In 2004/05, an illiterate person who happened to have a job in the organised sector earned a wage that was 2.6 times that earned by an illiterate person in the unorganised sector. On the other hand, within the organised sector, a person with tertiary education earned 2.5 times the wage earned by a person with no schooling.
27
The high relative price of unskilled vis-à-vis skilled labour explains well the fact that the opening-up of the economy has stimulated growth of skill-intensive manufacturing and services rather than growth of labour-intensive manufacturing. It is the organised sector that trades with the rest of the world. Thus the comparative advantage that matters is the comparative advantage of the organised sector and not the comparative advantage of the economy as a whole. And the comparative advantage of the organised sector actually lies in skill-intensive activities.
28

A second factor is the absence of a wage-productivity linkage in the organised sector. Regulations and collective bargaining make wage growth exogenous rather than link it to productivity growth. Employers, therefore, have everything to gain by focusing on growth of labour productivity, which always increases the share of profit in value added.
A third factor is the infrastructure bottleneck. This imposes a serious constraint on growth of labour-intensive manufacturing, which needs to be undertaken on large scale and requires availability of reliable and low-cost transport services and electricity to be competitive.
29
Policy options:
It is clear that “business as usual” will not do. India faces a formidable employment challenge and this must be met.
Apart from the huge challenge of shifting a large part of the labour force from bad to decent jobs, there looms a “demographic challenge”. A surge in prime-age population is expected. In all probability, this will mean a large growth in labour force.
What, then, are the policy options? One: Leave the growth process in the organised sector
alone and use the growing fiscal resources to finance special employment schemes and social protection measures for workers in the unorganised sector. These measures, together with economic growth in the sector, which hopefully will continue, will sustain the growth of labour-incomes in the unorganised sector. If labour transfer does not occur, employment conditions in the unorganised sector must be substantially improved.
30
Two: Leave the unorganised sector alone and undertake reforms in the organised sector with a view to increasing the employment intensity of growth. The reforms would include not just reduction or elimination of rigidities but also reduction/elimination of subsidies on higher education and increased attention to primary and secondary education. Such reforms, by altering the relative price of unskilled vis-à-vis skilled labour, will increase the employment intensity of growth in the organised sector and result in labour transfers from the unorganised to the organised sector.
Whichever of these two options is chosen, large-scale investment in agriculture and in physical infrastructure must be organised. This simply is not optional. 31
On political economy grounds, the first option is more feasible (the second would be fiercely resisted by the middle class) and the government has in fact already adopted it. And the observed trends during 2005-2010 suggest some movement in a desirable direction.
What remains unorganised as yet is large-scale investment in agriculture and physical infrastructure though there has been much talk of this. Without this, the recent trends will not be sustained. Food price inflation, it is to be noted, is already a major problem. This has already rendered the special employment schemes rather ineffective. And a wage-price spiral is most likely to emerge.
32