Embed Size (px)
Citation preview
DRAFT ONONDAGA LAKEDREDGING, SEDIMENT MANAGEMENT, &
WATER TREATMENT INITIAL DESIGN SUBMITTAL
Parsons p:\honeywell -syr\444546 - operations\09 reports\initial design submittal\dredging ids.docm 2/3/2009
4-1
SECTION 4
ENGINEERING ANALYSIS AND DESIGN
As discussed in Section 2, this document presents a summary of the initial design assumptions and associated engineering basis and calculations for the operations of the dredging, sediment dewatering, and water treatment aspects of the Onondaga Lake remedy. The operational processes associated with these remedial elements are summarized below, followed by detailed discussion in Sections 4.1 through 4.8. For the purposes of this IDS Report, the operational process steps have been incorporated into a baseline operational scenario. In this context, the baseline operational scenario is considered to be a reasonable and straight-forward approach that meets the design performance requirements outlined in this IDS Report, and is operationally implementable and efficient based on the evaluations performed to date. This baseline operational scenario is presented as a process flow diagram in Figure 4.1. The operational process described in this document provides several steps to enhance the sediment dewatering process. Not all of the steps shown in this process flow diagram are intended to be specified as requirements, but rather as an example process which could be employed on this project to effectively accomplish the remedial goals. The final design will optimize the sediment and water management processes based on further analysis, bench-scale testing, and identification of optimal means and methods in concert with personnel that will implement the operations. This optimization will define such elements as number of dredges, sediment transport pipeline, pumping size, and the sediment dewatering process.
Based on evaluation provided in this IDS Report, dredging of sediments will be conducted hydraulically. This form of dredging will minimize the exposure of sediments to the environment during dredging and transport to the SCA, thus reducing potential odor emissions and impacts of truck traffic on the community. The dredged sediment will be transported hydraulically as a slurry from the lake to the dewatering area on Settling Basin 13, utilizing a series of booster pumps. Based on preliminary analysis, a preferable route has been selected for routing of the slurry pipeline. Although finalization of the route will require further analysis and coordination with existing property owners, the preferred route would direct the slurry pipeline up the Settling Basins 1-8 site adjacent to the I-690 corridor to its intersection with Ninemile Creek. The route would then follow Ninemile Creek, to the dewatering area located on Settling Basin 13.
Several sediment pre-processing steps will be incorporated into the operation prior to geotextile tube dewatering. These steps could include, but are not necessarily limited to, coarse gravel, stone and debris screening, removal of sand-sized particles, and gravity thickening. Following applicable pre-processing steps, the dredged sediment will be discharged into geotextile tubes as a slurry for final dewatering. The geotextile tubes will be managed within the lined SCA, which will collect and manage water discharged from the geotextile tubes.
Once excess water generated by hydraulic dredging has passed through the geotextile tubes, it will flow into the underlying gravel drainage layer. The SCA drainage layer will be sloped to
DRAFT ONONDAGA LAKEDREDGING, SEDIMENT MANAGEMENT, &
WATER TREATMENT INITIAL DESIGN SUBMITTAL
Parsons p:\honeywell -syr\444546 - operations\09 reports\initial design submittal\dredging ids.docm 2/3/2009
4-2
direct water to a collection point(s), where it will be routed to the dewatering effluent equalization/storage basin. All construction water, including effluent from the geotextile tube or preprocessing steps, decontamination water (water used for decontamination of tools, equipment, etc.), and water collected from the management and/or cleaning of debris management will be treated. Water treatment will include pH adjustment, metals precipitation, filtration, and carbon adsorption. Based on discussions and evaluations completed to date, it is anticipated that the WTP effluent will be discharged to Metro, located on the southern shore of Onondaga Lake, for ammonia removal.
The engineering analysis included in this section has been divided into eight subsections: sediment dredging; in-lake debris and utility management; management of ambient water quality impacts; slurry transport and operations; dredged sediment dewatering; water treatment; upland facilities and locations; and emissions and odor control.
As mentioned previously, the basic design approach for the dredging, SCA, and water treatment operations will be performance-based specifications. However, due to the complexities and interactions between the various components of the overall design, certain aspects of each of the design criteria will be established.
4.1 SEDIMENT DREDGING
Dredging is a significant element of the selected remedy. Dredging will have a direct impact on the operations of other project components, including dredged sediment transport and dewatering, SCA operation, and water treatment. It will also influence the balance between daily dredge material production, dredged material processing, and effluent water treatment.
This section describes design and performance criteria, nearshore dredging and integration with shoreline areas, sequencing requirements, dredging methodology evaluation, dredge volumes, dredging production rate, and data gaps.
4.1.1 Design and Performance Criteria
Project requirements applicable to many aspects of the operational design, including dredging, are detailed in Section 2.2. This description includes a best effort to complete dredging within four years. The objectives specific to dredging are set forth in the ROD (NYSDEC and EPA 2005), ESD and Statement of Work (United States District Court 2007 – appendices to the Consent Decree). In summary, dredging will be completed to a depth that will prevent the loss of lake surface area, ensure cap effectiveness, reduce contaminant mass, allow for erosion protection, address ILWD hot-spots, ensure stability of the cap, and allow re-establishment the littoral zone habitat.
All of these dredging goals and approaches will require dredging to a predetermined elevation. However, the dredging strategy will be slightly different for areas that are capped versus those that are not capped following dredging, as detailed in Sections 4.1.1.1 and 4.1.1.2. In addition, dredging will need to meet the odor and emission goals discussed in Section 4.8.
DRAFT ONONDAGA LAKEDREDGING, SEDIMENT MANAGEMENT, &
WATER TREATMENT INITIAL DESIGN SUBMITTAL
Parsons p:\honeywell -syr\444546 - operations\09 reports\initial design submittal\dredging ids.docm 2/3/2009
4-3
Vertical accuracies specified for elevation-based dredging can average plus or minus 6 inches depending on equipment and site conditions. The exact goal, vertical accuracy, and method for specifying habitat-based dredging (i.e., whether the specified depth is a minimum, a maximum, or an average) will need to be established and may vary for different remedial areas. Confirmation that elevation based dredging has been completed as intended will be provided through bathymetric surveys comparing pre- and post-dredge elevations within dredge areas, taking into account vertical accuracies.
4.1.1.1 Dredging in Areas Which will be Capped
In these areas, which represent the majority of the area to be dredged, removal of sediment will be completed to a pre-determined depth to achieve a specific dredge depth and post-capping water depth. The dredge area, volume, and depth (herein referred to as the dredge prism) in these locations will be developed as part of the Sediment Capping and Dredge Area & Depth IDS. An example of this type of dredging based on habitat considerations is shown as Dredge Area 2 on Figure 3.4. It is anticipated that this type of dredging will be required in portions of Remediation Areas A through E.
4.1.1.2 Dredging in Areas Which will not be Capped
In nearshore areas where no shoreline barrier wall is present and groundwater upwelling rates are relatively higher, dredging, without the use of an isolation cap, will be used to ensure remedial goals are met. Therefore, dredging will be set to a specific elevation based on sediment chemistry results from core data and numeric performance criteria, plus an overdredge of 6 inches, followed by placement of a nominal 6 inches of clean imported backfill material. The backfill layer is intended to provide a clean post restoration substrate for accelerated habitat recovery. The numeric cleanup criteria will be determined as part of the Sediment Capping and Dredge Area & Depth IDS.
An example of this type of dredging, referred to as targeted dredging in the ROD, is shown as Dredge Area 1 on Figure 3.4. It is anticipated that targeted dredging will occur in nearshore areas of Remediation Areas A through C and E, as shown in Figures 3.2 and 3.3.
4.1.2 Nearshore Dredging and Interaction With Shoreline Areas
As discussed in Section 1, there are potential Honeywell and non-Honeywell sources of contamination to the lake, and addressing these is necessary to help ensure the long-term effectiveness of the remedy. In addition, the lake remedy design and implementation will address how remedial actions in nearshore areas, and actions associated with onshore support zones, will be integrated with shoreline conditions and remediation activities.
Several of the upland sites subject to potential remediation activities are directly adjacent to those in the lake. The integration of the on-shore and in-lake remedies, as it pertains to habitat restoration, is being addressed in the document Remedial Design Elements for Habitat Restoration Plan, which was referred to in the ROD (NYSDEC, 2005) as the Lakewide Habitat Plan, and which is currently under development. The overall objective of this effort is to develop and implement a habitat restoration plan for remedial actions associated with the Onondaga Lake Bottom remedy and with remedies and IRMs for adjacent Honeywell sites that provides
DRAFT ONONDAGA LAKEDREDGING, SEDIMENT MANAGEMENT, &
WATER TREATMENT INITIAL DESIGN SUBMITTAL
Parsons p:\honeywell -syr\444546 - operations\09 reports\initial design submittal\dredging ids.docm 2/3/2009
4-4
ecological, recreational, and/or aesthetic benefits as well as complies with applicable state and federal laws and regulations, executive orders, and policies for floodplains, wetlands and surface waters.
The scopes and schedules for upland remedial activities are being developed as part of the remedial programs for the individual sites, and as part of the Lakewide Habitat Plan. As these programs are advanced and additional details become available, the information will be used to further define the approach for integrating these on-shore activities with the lake remediation in future lake-related design submittals. A preliminary discussion of integration considerations for each remediation area is provided below. The average lake surface elevation is 362.8 ft NAVD88, and that boundary represents the division between upland areas and lake area for remedial design purposes.
Remediation Area A
Remediation Area A lies at the mouth of Ninemile Creek, which will necessitate the completion of the Ninemile Creek remediation prior to remediation of this area. This may include removal and/or capping of sediments within the creek and associated wetlands and floodplain along the lakeshore; therefore, future design submittals will include transitions between the lake and Ninemile Creek remedies. Nearshore sediment contamination in this area is relatively shallow, generally a meter or less; therefore, shoreline stability considerations during dredging in nearshore areas are expected to be minor.
Remediation Area B
Remediation Area B is the area offshore of Settling Basins 1-8. The shoreline in this area is a relatively low-lying plateau of exposed Solvay waste. Remediation of Settling Basins 1-8 to the extent necessary to prevent recontamination will be required prior to remediation of this area. The potential scope for the Settling Basin 1-8 remedy is still under development, but may include control of shallow groundwater discharging to the lake from this area as well as the potential placement of a cover system. In addition, as part of the Settling Basins 1-8 remedy, or to off-set potential loss of lake surface area or wetlands elsewhere, wetlands may be created on Settling Basins 1-8 adjacent to Remediation Area B. Future design submittals will include transitions between the lake and Settling Basins 1-8, if this remedy is adopted. This transition will also incorporate the shoreline stabilization required by the ROD to address erosion of Solvay waste material along the shoreline of Settling Basins 1-8. Future design submittals related to this dredging will also consider potential shoreline stability concerns.
Remediation Area C
No remedial activities beyond the already-installed Semet portion of the shoreline barrier wall are required for the area adjacent to Remediation Area C. However, Tributary 5A will require remediation prior to remediation of this area.
Shoreline stability concerns associated with nearshore dredging will depend on the required dredge depth, which will be determined pending evaluation of recent design-related investigation data from this area. Shoreline stability in this area is of particular concern due to the proximity
DRAFT ONONDAGA LAKEDREDGING, SEDIMENT MANAGEMENT, &
WATER TREATMENT INITIAL DESIGN SUBMITTAL
Parsons p:\honeywell -syr\444546 - operations\09 reports\initial design submittal\dredging ids.docm 2/3/2009
4-5
of shoreline utilities and the adjacent interstate highway and will be addressed as part of future design submittals.
Dredging design and operations will also take into consideration that the western sub-area surrounds a boat launch frequently used for small boats as well as shoreline fishing. The boat launch area is located on top of hard slag waste material which was deposited in the lake by industrial processes not associated with Honeywell or its predecessors. The remainder of the shoreline in this area consists of rip-rap leading up to a gravel access road leading to Settling Basin B that is located between the lake and the highway.
Remediation Area D
The shoreline of the western third of Remediation Area D consists of the exposed sheet pile barrier wall installed in 2008 as part of the Willis/Semet IRM. Dredging design and implementation in this area will consider potential stability issues associated with the wall, as well as ensuring dredging operations and shoreline support activities do not subject the sheet pile wall to excessive stress and compromise structural integrity that could lead to potential damage and safety risks.
The remainder of the shoreline in this area consists of the low-lying area of the Settling Basin B/Harbor Brook site, some of which consists of delineated wetlands (Figure 1.2). Remedial action in the area between the Settling Basin B/Harbor Brook Willis-Semet IRM Barrier Wall and the lake will likely be required. This may include removal of material and construction of an isolation cap to allow for replacement and creation of wetlands in this area, as well as remediation and relocation of Harbor Brook south of its current discharge. An integrated approach to design and implementation of remedial actions in Remediation Area D and this area of Settling Basin B/Harbor Brook will be developed as part of future design submittals.
The Settling Basin B/Harbor Brook site is a source of contamination to Remediation Area D. Remediation of Settling Basin B/Harbor Brook to the extent necessary to prevent recontamination will be required prior to completion of remediation of this area. Dredge depths in nearshore areas of Remediation Area D have not been determined, but will take into consideration shoreline stability considerations.
Remediation Area E
Consistent with the area adjacent to Remedial Area D, remediation and wetland replacement may be required in the area of the Settling Basin B / Harbor Brook site designated as AOS 1 which is adjacent to the southern end of Remediation Area E, as well as in wetland SYW-12 adjacent to the northern end. An integrated approach to design and implementation of remedial actions in the lake and these shoreline areas will be developed as part of future design submittals.
The shoreline adjacent to the remainder of Remediation Area E is dominated by an active rail line which is directly adjacent to the shoreline. The contamination in Remediation Area E is primarily due to migration from Remediation Area D and adjacent areas, and thus, nearshore contamination and the resulting dredging required is relatively shallow. Nevertheless, design
DRAFT ONONDAGA LAKEDREDGING, SEDIMENT MANAGEMENT, &
WATER TREATMENT INITIAL DESIGN SUBMITTAL
Parsons p:\honeywell -syr\444546 - operations\09 reports\initial design submittal\dredging ids.docm 2/3/2009
4-6
and implementation of dredging in this area will consider potential stability and other limitations associated with the presence of the rail line.
4.1.3 Sequencing Requirements
Preventing contamination of clean areas or recontamination of previously dredged and/or capped areas from adjacent dredging activities is a significant consideration when developing a dredge sequencing plan. Within the context of the lake setting, this means that dredging should generally be sequenced from up-current to down-current, considering the predominant circulation patterns in those areas of the lake requiring dredging. Furthermore, in general, dredging should be sequenced from upslope to downslope, to avoid excessive sloughing of the cut face and to help maintain overall stability.
Dredging within the lake is anticipated to be accomplished in four years (2012 through 2015) and will take place in several discrete Remediation Areas (Figures 3.2 and 3.3). The sequencing requirements for dredging and capping will be integrated and will take into consideration factors such as dredging and capping production rates, circulation patterns within the lake, control measures such as silt curtains, seasonal shut-down periods, and upland source area remedial schedules. Sequencing will also take into consideration the potential for recontamination due to in-lake operations such as debris management and dredging, as well as naturally occurring processes such as tributary inflow and wind/wave action.
The sequencing requirements will depend on the ultimate dredge prism and cap design; therefore, these requirements will be advanced as part of the Sediment Capping and Dredge Area & Depth IDS and Final Design. A preliminary discussion is provided below.
The dredging sequence for Remediation Areas C, D, and E will be strongly influenced by the predominant currents within the lake. As described in Section 3.10, general current direction in Onondaga Lake is counter-clockwise. Therefore, Remediation Areas C, D, and E will be dredged in order of the prevailing counter clockwise current direction (i.e., starting in Remediation Area C and proceeding through Areas D and E). It is anticipated that final isolation capping operations will lag dredging operations by approximately one year to reduce the potential for contamination of the cap due to dredging operations.
Remediation Areas A and B are relatively independent from the standpoint of recontaminating other remediation areas, primarily due to the large distance between these and other remediation areas. Therefore, the remediation schedules for these areas may be a function of the remediation schedule for the contaminant sources to these areas. For example, it is anticipated that the Ninemile Creek project may be completed after the 2013 dredging season; therefore, remediation of this area will be later in the overall four-year lake remediation schedule.
In general, sequencing will consider the potential for recontamination (i.e., dredging of habitat-based areas first), accessibility needs (i.e., where nearshore areas are depth limited, dredging of offshore areas may be needed first to provide dredge access), and the interactions between dredging and backfill operations. These and other considerations will be evaluated further during final design.
DRAFT ONONDAGA LAKEDREDGING, SEDIMENT MANAGEMENT, &
WATER TREATMENT INITIAL DESIGN SUBMITTAL
Parsons p:\honeywell -syr\444546 - operations\09 reports\initial design submittal\dredging ids.docm 2/3/2009
4-7
4.1.4 Dredging Methodology Evaluation
Dredging involves the removal of sediment using a range of possible construction techniques, including the broad categories of mechanical and hydraulic dredges. The overall process presented below to evaluate dredge equipment is based on the approach presented in both Palermo et al. (2004) and Palermo et al. (2008), and is focused on evaluating the site-specific characteristics of Onondaga Lake, the operational attributes of dredge equipment, and a number of selection factors relating to the design requirements.
The major considerations in selecting equipment for environmental dredging include the following (Palermo et al., 2008):
• removal efficiency;
• production rate;
• resuspension of sediment and contaminant release during the dredging process;
• residual sediment left in place following dredging;
• compatibility with transport, treatment, and disposal options;
• odor management; and
• costs.
4.1.4.1 Mechanical Dredging
Common mechanical dredge types include dragline, clamshell, dipper, and bucket ladder. Mechanical dredges are typically crane- or excavator-operated and located on a barge or pontoons. They can be operated from land to remove sediment that is close to the shoreline, or dredge buckets can be mounted on traditional excavators that can be operated from either the shoreline or a barge. Bucket sizes of 1 to 10 CY are common; however, buckets up to 40 CY are available.
To remove sediment, the dredge bucket is lowered through the water column with its jaws in the open position, and the bucket is allowed to sink into the sediment. The jaws are then closed around the sediment, the bucket is raised through the water column, and the sediment is typically offloaded to a barge for transport. Hydraulic transport using positive displacement pumps can also be used to transport mechanically dredged sediment. Mechanical dredges are designed to remove sediment at or near in situ density and; therefore, results in less water at the transport, staging, and disposal end than for hydraulic dredging. The following are potential advantages and disadvantages of mechanical dredging:
Potential Advantages of Mechanical Dredging Relevant to Onondaga Lake:
• rugged; and can likely remove hard-packed materials;
• can remove debris within sediments;
• can remove sediments at nearly in situ density, with minimal requirements for managing excess water; and
DRAFT ONONDAGA LAKEDREDGING, SEDIMENT MANAGEMENT, &
WATER TREATMENT INITIAL DESIGN SUBMITTAL
Parsons p:\honeywell -syr\444546 - operations\09 reports\initial design submittal\dredging ids.docm 2/3/2009
4-8
• can operate in deep water.
Potential Disadvantages of Mechanical Dredging Relevant to Onondaga Lake:
• normally require barges for transport of the dredged sediments;
• would require trucking to the SCA, or re-slurry of sediment prior to transport, thus offsetting the potential advantage of reduced water generation;
• dredged material is exposed to the environment during transportation, presenting potential odor and VOC emission issues;
• debris can prevent jaws from sealing, resulting in significant resuspended sediment; and
• water quality impacts may be higher than with hydraulic dredging.
4.1.4.2 Hydraulic Dredging
An alternative to mechanical dredging is hydraulic dredging. Hydraulic dredges use centrifugal pumps to remove and transport sediment in a slurry form to a local management area where the slurry is dewatered. Hydraulic dredges are typically barge- or float-mounted and have a suction device fixed to a moveable arm (or ladder) that is raised or lowered to facilitate sediment removal. The suction end of the dredge is often equipped with a mechanical or hydraulic device to loosen the sediment prior to being drawn into the dredge suction line. The most common types of hydraulic dredges used in environmental projects include a cutterhead and horizontal auger.
A cutterhead suction dredge is a type of hydraulic dredge that uses a large centrifugal pump to remove dredged material from the bottom of a water body and pump it as a sediment-water slurry through a pipeline to a management area (such as the SCA). At the end of the ladder is the cutter, which cuts into the sediment in a rotary fashion in order to free up the sediment to be taken into the suction line. The suction line is attached to the main dredge pump located on the barge. The sediment-water slurry is then transported through the main pump and into the discharge pipeline that delivers the slurry to the disposal area (SCA).
Cutterhead dredges with suction diameters ranging from 6 to 24 inches are applicable for this type of environment. Production rates for these dredge sizes range considerably due to site conditions. While cutterhead dredges are capable of generating slurry with solids concentrations of 10 to 20% on a dry-weight basis, using this equipment for environmental dredging typically lowers solids concentration. This is in part due to the additional water that may be intentionally drawn into the dredge in an effort to minimize resuspension during thin cleanup passes and/or when dredging thin cuts. As a result, the slurry can be as low as 5 to 15% solids concentration by weight.
On non-self-propelled dredges, two long, vertical poles, called “spuds,” are mounted on the stern of the dredge (fixed spud system). The dredge swings itself forward by anchoring one spud and pivoting around it to a certain angle, at which point the other spud is dropped and becomes the anchor and pivot point. The ladder is lowered down to the lake bottom and a swath is cut
DRAFT ONONDAGA LAKEDREDGING, SEDIMENT MANAGEMENT, &
WATER TREATMENT INITIAL DESIGN SUBMITTAL
Parsons p:\honeywell -syr\444546 - operations\09 reports\initial design submittal\dredging ids.docm 2/3/2009
4-9
through the sediment as the dredge swings on one of the spuds. On swinging ladder dredges, the barge remains stationary while dredging and the ladder swings back and forth hydraulically, pivoting at the front of the dredge. Swinging ladder dredges can be self-positioning with the use of a rear kicking (walking) spud.
Horizontal auger dredges are operated differently than cutterhead dredges. The auger dredge is typically 8 ft wide, and the auger head is a rotating pipe 1 to 2 ft in diameter, and 6 to 10 ft long. An auger blade is attached to the rotating pipe, with the blades moving the sediment to the center of the auger where the suction pipe is located. Typically, the slurry solids content collected by a horizontal auger dredge is equivalent to that of a cutterhead dredge, due to the similar pumping technique and environmental conditions. Horizontal auger dredges are advanced in a straight ahead fashion, along the length of a cable anchored forward and aft of the dredge. No spuds are used with the auger dredge.
Potential Advantages of Hydraulic Dredging Relevant to Onondaga Lake:
• capable of pumping material directly by pipeline to the SCA; and
• reduced potential for odors and emissions due to limited dredge slurry atmospheric exposure during dredging and transport.
Potential Disadvantages of Hydraulic Dredging Relevant to Onondaga Lake:
• a large quantity of water is generated, with potentially high cost of sediment dewatering and water treatment.
4.1.4.3 Selected Dredging Methodology
Hydraulic dredging, allows for the direct transport of the dredged material to the SCA without excessive trucking, and allows for control of volatilization during transport. Based on the evaluation of dredge equipment provided above, and site conditions, the cutterhead dredge is the selected hydraulic equipment type for removing the majority of sediments from Onondaga Lake for purposes of the design. The cutterhead dredge has several advantages over the auger dredge, including:
• the horizontally orientated auger is not designed to readily remove material located along a sloping surface;
• the auger dredge is not considered an optimal piece of dredging equipment where there is an abundance of debris, harder underlying material, and sloping bottom conditions; and
• The auger dredge is also more susceptible to shut down from winds than the cutterhead dredge.
The hydraulic cutterhead dredge is available in configurations which allow for “contour dredging” which will minimize overdredging and step cuts, and allow for a more uniform thickness of removal over large areas of sloping bathymetry.
DRAFT ONONDAGA LAKEDREDGING, SEDIMENT MANAGEMENT, &
WATER TREATMENT INITIAL DESIGN SUBMITTAL
Parsons p:\honeywell -syr\444546 - operations\09 reports\initial design submittal\dredging ids.docm 2/3/2009
4-10
While the dredging in Onondaga Lake will primarily be accomplished through hydraulic dredging techniques, it is anticipated that mechanical dredging techniques may be used in specific locations to a lesser extent, such as in nearshore areas or if future evaluation indicate the crusty ILWD material may not amenable to hydraulic dredging.
Based on the water depths, the types of materials to be dredged, and the dredging schedule, a 12-inch swinging ladder cutter head dredge was considered to be the minimum sized equipment capable of meeting the various project requirements. Two manufacturers of hydraulic cutter dredges were evaluated taking into consideration environmental project criteria to determine the stock model and size potentially applicable to meet the required Onondaga Lake dredging production. Dredges used in this evaluation are shown in Figure 4.2. These are intended to be only examples of potentially appropriate dredges.
Both hydraulic cutter suction dredges are similar in design and efficiency and will have similar effectiveness in ensuring workers’ health and safety and environmental protection. The Barracuda and the 670 Dragon dredges are 12-inch systems that are completely enclosed, resulting in minimal potential for odor or VOC emissions during dredging. Final selection of specific equipment will be determined by the contractor, and subject to NYSDEC approval. The discussion of the dredging equipment as described here is made solely for the purposes of the preliminary design, and for developing process designs.
4.1.5 Dredge Volume
As specified in the ROD, dredging of up to 2,653,000 CY of impacted sediments will be completed as part of the remedy. Several conservative assumptions pertaining to the extent and depth of impacted material were made during the development of the recommended remedy, in areas where insufficient data was available to provide full characterization. As described in Section 3, several rounds of design-related investigations have been conducted which have provided further characterization, where previous data gaps existed. In some locations, the results of these investigations have indicated that the extent and depth of impacted material is less than was previously assumed. As a result, the actual volume of sediment dredging needed to accomplish the remedial goals may range from an estimated 1,600,000 CY to the maximum 2,653,000 CY estimated in the ROD. Based on a preliminary analysis of these investigation results, a dredge volume of 1,900,000 CY has been assumed for the purposes of this IDS Report. Further details pertaining to the basis for this assumed dredge volume are presented in Appendix C. The actual dredge volume will be developed as part of the Sediment Capping and Dredge Area & Depth IDS. The Final Design will incorporate the revised dredge volumes as appropriate.
4.1.6 Hydraulic Dredging Production Rate
Production rate is defined as the volume of dredged material removed as a function of time (cubic yards per hour [CY/hr]). Hydraulic dredging production is not only a function of operational speed and solids content of the dredged slurry, but also how fast the material can be supplied to the dredge head. There are many factors that can influence the production rate, such as:
DRAFT ONONDAGA LAKEDREDGING, SEDIMENT MANAGEMENT, &
WATER TREATMENT INITIAL DESIGN SUBMITTAL
Parsons p:\honeywell -syr\444546 - operations\09 reports\initial design submittal\dredging ids.docm 2/3/2009
4-11
• In situ solids content (e.g. higher solids content typically results in a higher production rate.
• Specific gravity of dredged material – A higher specific gravity results in higher weight by volume (i.e. higher density). An efficient dredging operation results in higher concentration because more sediment and less water are dredged.
• Slurry solids concentration – This is the percentage of solids that comprises the slurry by weight expressed in relation to the water that is conveyed by the slurry. Water is the transport media used to remove a volume of solids from the area to be dredged. The production rate is directly related to the quantity of solids transported in the slurry.
• Dredged material grain size – The critical velocity (pipeline velocity at which the solids in the slurry will begin depositing in the pipe) depends on sediment grain size. Specific sized particles require higher velocities to keep the material suspended in the hydraulic pipeline during sediment transport pumping. The higher the velocity of sediment through the pipe, the greater the friction head loss.
• Elevation difference – This factor describes the difference in elevation between the dredge and the SCA. The elevation grade line for the pipeline routes being considered is presented in Section 4.4. The elevation difference is estimated to be approximately 77 ft (the difference between the average Onondaga Lake level of 362.8 ft and the top of the berm of the SCA at an elevation of approximately 440 ft).
• Length of discharge pipe - The longer the pipeline, the higher head loss from friction and sediment characteristics. Therefore, additional booster pumps may be used to increase distance and maintain critical velocity. The proposed pipeline length for the Onondaga Lake dredging is approximately 25,000 ft.
• Thickness of cut – This depth, sometimes called “bank height,” will vary in thickness, which affects the production rate. The optimal dredge cut thickness for cutter suction dredges is typically defined as approximately two-thirds of the cutter diameter. The thinner the cut, the more water is pumped and less sediment is removed. For either the 670 Dragon or the Barracuda dredge, the approximate optimal cuts are between 2.0 to 2.3 ft. The average thickness of dredge material throughout all of the SMUs is approximately 4 to 6 ft, with a minimum thickness of 1 foot and a maximum thickness of 10 ft, most likely occurring along the nearshore areas.
• Hydraulic dredge cycle efficiency – This efficiency depends on the type of spud system employed on the dredge. A spud carriage dredge is considered more efficient than a fixed-spud dredge because the spud carriage dredge can advance forward. The range in overall efficiency for a hydraulic dredge can vary between 50-80% depending on a variety of factors (e.g., dredge moves, production rate, maintenance, weather, operator experience).
• Dredgeability – Dredgeability refers to that part of the production rate and energy required for removal by a given dredge type that is directly influenced by the properties of the sediment (Spigolon 1993). Dredgeability denotes the ease at which sediments can be removed by a given dredge type and is closely related to the shear
DRAFT ONONDAGA LAKEDREDGING, SEDIMENT MANAGEMENT, &
WATER TREATMENT INITIAL DESIGN SUBMITTAL
Parsons p:\honeywell -syr\444546 - operations\09 reports\initial design submittal\dredging ids.docm 2/3/2009
4-12
strength of the sediments. For example, unconsolidated sediments such as recently deposited clays, silts, and sands are highly dredgeable, while highly consolidated clays, cemented materials, rock, or crusty ILWD material are more difficult to dredge. The production rate and efficiency of removal of sediment is a function of site conditions, sediment properties, and thickness, as well as equipment type (Palermo et al., 2008).
As described above, the production rate is defined as the volume of dredged material removed as a function of time (CY/hr). The evaluation of production rates included discussions with manufacturers, a review of dredging equipment specification sheets as to equipment production rates, and a review of the available geotechnical characteristics. To evaluate the dredging production, the following steps were taken:
• evaluation of the available geotechnical properties of each of the remediation areas to determine the range of in situ properties as it pertains to production calculations;
• evaluation of the potential range of solids concentrations (by weight) that could be conveyed;
• evaluation of flow characteristics required to convey the dredged slurry hydraulically through the pipeline based on the particle size being dredged as well as slurry solids content; and
• estimation of the production rate.
The steps in the computation involved:
• computing the dry mass of in situ sediment to be dredged in each remediation area;
• estimating the concentration by weight in the slurry achievable by a hydraulic dredge;
• computing the required velocity and flow rate in slurry pipeline; and
• computing the resulting production rate
Details on each of these evaluations are provided below. The calculations are presented in Appendix D. As additional data pertaining to the geotechnical characteristics of the material to be dredged become available, these evaluations may be revised as part of Final Design.
Geotechnical Properties
The in situ geotechnical properties were used to compute the in situ production rate and the specific gravity of the slurry. Table 3.1 presents the statistical evaluation of the physical characteristics of the top 2 meters of material for each remediation area. A review of the available data indicates that the particle size of the materials to be dredged consists primarily of silt and clay sizes and fine sands, with some gravel in Remediation Area E. These sediments have average water contents ranging between 64.2 and 148.5%.
The average specific gravity and water content values used to calculate the production rate are the arithmetic means of sample test data collected from each of the remediation areas. A volume- and area-weighted average for each of the remediation areas will be evaluated in the
DRAFT ONONDAGA LAKEDREDGING, SEDIMENT MANAGEMENT, &
WATER TREATMENT INITIAL DESIGN SUBMITTAL
Parsons p:\honeywell -syr\444546 - operations\09 reports\initial design submittal\dredging ids.docm 2/3/2009
4-13
next design phase, when the dredge prism is more precisely known, to present a better representation of geotechnical characteristics within the dredge prism for each of the remediation areas. Only two samples within Remediation Area B were measured for geotechnical properties. Therefore, the geotechnical properties for Remediation Area C were used in the calculation of production rates for Remediation Area B. Remediation Area B represents a small amount of dredged material (75,000 CY based on ROD estimate) compared to the total project. In Remediation Area D, the quantity of the crusty ILWD material in the dredge prism has not been identified, nor have the geotechnical properties of the crusty ILWD material been measured. These characteristics represent a critical data gap which will be addressed as part of future design-related investigations.
Solids Concentration
Solids concentration by weight (Cw) is defined as the ratio of weight of dry solids in slurry to total wet weight of the slurry, expressed as a percentage. The percent solids in the material in situ, as it is removed and transported by the dredge, will have a major impact on the production rate. Most environmental dredging projects involve predominantly fine-grained sediments, and the in situ sediments often have low solids content. Thus, there is a substantial volume of water in the removed sediments, even with a dredging process capable of removal at near the in situ solids content.
The geotechnical properties of the sediment (density, particle size distribution, cohesiveness, etc.) influence the slurry solids content achievable by a hydraulic dredge. Conventional hydraulic dredges, such as cutterhead dredges, add a volume of water equivalent to about four times the volume of in situ sediment removed. The available data for environmental dredging indicate lower slurry solids content for many projects, with a wide range of solids concentrations by weight for hydraulic dredges reported, but approximately 5 to 15% solids by weight can be expected for production cuts for most environmental dredging projects. As described above, the sediments to be dredged in Onondaga Lake are comprised primarily of particle sizes in the fine sand to silt and clay range with low in situ solid contents. Therefore, an average solids concentration by weight of 10% was used to evaluate production estimates. Based on these sediment characteristics, it is anticipated that the solids concentration by weight for short durations could average as low as 5% and as high as 15%.
The design of the dredge prism could affect the solids concentration within each remediation area. The shape of the dredge prism, the thickness of the cut, and the variation of the thickness of cut within a dredge prism can reduce the solids concentration. The estimated solids concentration by weight will be reevaluated once the dredge prism is determined.
Flow Characteristics
Section 4.4.4 describes the slurry velocity and flow rate necessary to pump the dredged sediment from Onondaga Lake to the SCA. This flow rate is used with the solids concentration by weight to calculate the production rate. Cross sectional area of the pipe and the velocity of the slurry are used to calculate the flow (gallons per minute - gpm) though the slurry pipeline. Using a slurry pipeline inside diameter (ID) of 12 inches and the preliminary estimated velocity
DRAFT ONONDAGA LAKEDREDGING, SEDIMENT MANAGEMENT, &
WATER TREATMENT INITIAL DESIGN SUBMITTAL
Parsons p:\honeywell -syr\444546 - operations\09 reports\initial design submittal\dredging ids.docm 2/3/2009
4-14
to maintain the sediment portion of the slurry in suspension of 13 ft per second (fps) (Section 4.4.4), the flow is calculated to be approximately 4,800 gpm. Details of this calculation are presented in Section 4.4.4 and Appendix D.
Production Rate
Table 4.1 presents the estimated production rates for each remediation area based on the variable solids concentration ranging from 5%, 10%, and 15%, the flow rate provided above (approximately 4,800 gpm), as well as other variables presented in the previous section. Depending on the estimated solids concentration, the production rate for Remediation Areas A, B, and C ranges from 75 to 270 CY/hr; for Remediation Area D ranges from 135 to 435 CY/hr; and for Remediation Area E ranges from 75 to 240 CY/hr.
Given a 10% solids concentration by weight, the production rate for Remediation Areas A, B, and C is 175 CY/hr; for Remediation Area D is 280 CY/hr and for Remediation Area E is 155CY/hr. The elevated estimated production rates in Remediation Area D are primarily a function of lower in situ solids concentrations. Details of these calculations are presented in Appendix D.
Project Dredging Duration
As described above, the final dredge volume will be established as part of the Sediment Capping and Dredge Area & Depth IDS, and may range from an estimated 1,600,000 CY to the maximum 2,635,000 CY specified in the ROD. However, for the purposes of this IDS Report, the dredge volume of 1,900,000 CY has been assumed, and would thereby be required to be dredged in four years. This equates to an average rate of approximately 475,000 CY per dredging season. To calculate the required daily production rate, the total number of days available during a dredging season was calculated. Table 4.2 presents the Onondaga Lake dredging schedule working assumptions used to calculate required production rates. This estimate assumes that in-water dredging occurs between April 15 and November 15 and that the dredging will not occur on Sundays (i.e. a six day work week), although routine maintenance and service of pumps and equipment may be scheduled for Sundays. The schedule also includes an estimated 3 days off for holidays and 32 days when dredging cannot occur due to the wet weather shutdown of the water treatment system. Using these parameters, there is a total of 148 work days available for dredging during one dredging season. It was assumed that dredging could be performed 24 hours per day.
Based on the total dry solids, a 10% solids concentration in the slurry by weight, flow through the pipe and a 70% dredge up-time, the number of days to dredge the remediation area is identified in Table 4.2. The total estimated number of dredging days required is 495, based on 10% solids concentration by weight for all the remediation areas. This equates to 3.34 dredge seasons assuming 148 annual work days. The assumed dredge up-time of 70% will be refined during the dredge prism development depending on cut thickness and dredge template shape. To maintain dredge efficiency, avoidance or minimization of downtime to the extent practicable will be necessary. In the event an excessive drop in efficiency incurs the ability for makeup dredging on Sundays will be available. For the dredge, an inventory of known wear and susceptible spare
DRAFT ONONDAGA LAKEDREDGING, SEDIMENT MANAGEMENT, &
WATER TREATMENT INITIAL DESIGN SUBMITTAL
Parsons p:\honeywell -syr\444546 - operations\09 reports\initial design submittal\dredging ids.docm 2/3/2009
4-15
parts and long lead time items and necessary tools to make dredge repairs will be available on site. In addition, trained mechanics will be available on site to monitor, maintain, and implement timely repairs. Additional project operations and maintenance (O&M) aspects to minimize downtime are further addressed in Section 4.4.6. If dredge efficiency and downtime become serious schedule issues, the dredging contractor may be required to maintain a ready backup dredge on site.
The first year of dredging is expected to start at a reduced production rate because the first few months in the field will be used to confirm, adjust, and troubleshoot (if necessary) dredging operations, the slurry transportation system, dewatering activities, and water treatment activities; and to optimize the overall process. Thus, production should be expected to start at a reduced rate and gradually be increased to meet necessary project specific production rates to complete dredging within four years.
The calculated production rates are estimated for a range of materials encountered at Onondaga Lake, and are included in Appendix D. These production rates will be refined in the Final Design based on additional site-specific information.
Technical information, including production curves for the representative dredges evaluated, indicates that a single 12-inch dredge can meet these production flow rates. Once the dredge volumes and prisms have been established, dredge production rates will be re-evaluated taking into consideration more specific sediment geotechnical characteristics per dredge prism.
Water and Sediment Transported to the SCA
As described above, the volume of water and the amount of dredged sediments transported to the SCA during dredging may vary on a daily basis as the slurry solids concentration by weight varies between 5 to 15%. Using a slurry flow rate provided above (4,800 gpm), the volume of water pumped to the SCA may vary between approximately 4,400 to 4,600 gallons of water per minute. Assuming pumping for 70% of the day, this equates to a range of 4.5 to 4.7 mgd. The amount of dredged sediment transported to the SCA may vary between approximately 2,000 and 6,500 pounds per minute, or 1,000 to 3,300 tons per day.
4.1.7 Dredging-Related Data Gaps
The production rates described in the previous section contain two potential data gaps relating to dredging, which have been identified as:
• location, quantity, and geotechnical properties (e.g. blow counts) of crusty ILWD material in the dredge prism; and
• physical properties (i.e. stability, behavior) of crusty ILWD material in the slurry pipeline.
The location, amount, and in situ properties of the crusty ILWD material may affect the dredge production rate, and will be considered further the Final Design.
DRAFT ONONDAGA LAKEDREDGING, SEDIMENT MANAGEMENT, &
WATER TREATMENT INITIAL DESIGN SUBMITTAL
Parsons p:\honeywell -syr\444546 - operations\09 reports\initial design submittal\dredging ids.docm 2/3/2009
4-16
If the crusty ILWD material breaks down during and following cutterhead dredging, a large portion of material in the medium-sand to fine-gravel particle size range could enter the slurry pipe. The presence of sands, gravels, and similar sized pieces of crusty ILWD material in the slurry affects several aspects of the slurry transport system, including:
• minimum velocity of slurry necessary to maintain suspension of medium-sand-to-fine-gravel particle size in the slurry pipeline;
• frictional loss in the pipe;
• wear and maintenance of the booster pumps; and
• wear and maintenance of the slurry pipeline.
Approaches on how to fill these data gaps are under consideration and would be presented in a future work plan in the event additional field data collection is deemed necessary.
4.2 IN-LAKE DEBRIS AND UTILITIES MANAGEMENT
This section provides an evaluation of debris and utilities management within the areas of Onondaga Lake to be dredged. Additional consideration of debris and utilities management will be required in areas to be capped without prior dredging and will be provided in the Sediment Capping and Dredge Area & Depth IDS.
Debris is a term used in this IDS Report to refer to wood, concrete, plastics, glass, metal, cable, tires, rocks, and other objects within lake sediment that may impact dredge operations. Utilities, for purposes of this IDS Report, consist of active and inactive pipelines, culverts, outfalls, water intakes, and undefined magnetic anomalies on the sediment surface or buried on the lake bottom. This section includes design and performance criteria, a summary evaluation of debris characteristics, a summary evaluation of existing utilities, an overview of potential impacts of debris and utilities on dredging operations, a description of how debris will be addressed and how it will be handled after removal, and a description of how utilities will be addressed.
4.2.1 Design and Performance Criteria
Project requirements applicable to many aspects of the operational design, including dredging, are detailed in Section 2.2. The primary goal for debris and utility management is to facilitate accomplishing the remedial objectives, and to minimize dredging downtime. Dredge and dredged material transport systems must provide reliable and safe transport of the dredged material from Onondaga Lake to the SCA for the duration of the dredging operations. Transport of dredged material slurry by pipeline is a proven and reliable technology; however, dredging and slurry pipeline transport can not provide reliable removal or transport of dredged material that contains debris. Debris staging, management and disposal will be completed in accordance with the requirements of 6 NYCRR Part 360. Debris and utilities management will also comply with the odor and emissions requirements discussed in Section 4.8.
DRAFT ONONDAGA LAKEDREDGING, SEDIMENT MANAGEMENT, &
WATER TREATMENT INITIAL DESIGN SUBMITTAL
Parsons p:\honeywell -syr\444546 - operations\09 reports\initial design submittal\dredging ids.docm 2/3/2009
4-17
4.2.2 Debris Characterization
The primary source of information that documents in-lake dredge area debris is the Phase I PDI geophysical survey work conducted during the fall of 2005 for Honeywell (CR Environmental, 2007). As described in Section 3.11, the two types of geophysical surveys conducted in 2005 that provide documentation of possible debris are side-scan sonar and magnetometer surveys.
Side-scan sonar equipment can detect debris and obstructions (hereafter referred to as contacts) as small as 1 to 2 ft that are located on the sediment surface (or mudline). Detecting contacts below the mudline depends on the use of a magnetometer survey. Magnetometer surveys detect contacts containing iron or items that have been fired (such as bricks) that are located either at or below the mudline. Unlike side-scan sonar data, the magnetometer data do not reveal information about size or depth of those materials. Because no one single survey technology is known to be routinely applied to characterize size, shape, or depth of debris (or other obstructions) submerged below the mudline, a combination of the two methods provides the most comprehensive view of debris on the lake bottom.
Figure 4.3 presents the locations of utilities and debris that were identified during the geophysical survey work. As stated above, the side-scan sonar output is capable of identifying contacts as small as 1 to 2 ft in size. For the purposes of evaluation, initial processing of the geophysical data focused on identification of debris pieces at least 5 ft in size. These larger debris contacts are presented on Figure 4.3. While these contacts are large enough to potentially interfere with dredging operations, the 5 ft size is not necessarily the minimum size that must be addressed. During related phases of the design, as dredging depths, areas, and methodologies are more clearly defined, further analysis of the geophysical data to delineate debris contacts of smaller dimensions may be performed.
2005 Phase I PDI Side-Scan Sonar Survey Results
The side-scan sonar output for Onondaga Lake presented in the Geophysical Survey Report (CR Environmental, 2007) includes descriptions of contacts that are evident at the mudline and have one dimension at least 5 ft in size. Results from the 2005 side-scan sonar data are as follows:
• Within the littoral zone remediation areas, there are over 120 side-scan sonar contacts that are at least 5 ft in size. Most are characterized in the Geophysical Survey Report (CR Environmental, 2007) as debris, while some are characterized as man-made debris, structures or wrecks. Widespread irregularly-shaped debris contacts were encountered.
• Twenty-one side-scan sonar contacts that are over 50 ft in size were observed within or adjacent to the remediation areas. Some of these contacts are associated with utilities, as discussed in Section 4.2.4. Eight of those 21 contacts are over 100 ft in size.
• The largest concentration of side-scan sonar contacts over 5 ft in size within the dredging areas was observed near the outer edges of Remediation Areas D and E over
DRAFT ONONDAGA LAKEDREDGING, SEDIMENT MANAGEMENT, &
WATER TREATMENT INITIAL DESIGN SUBMITTAL
Parsons p:\honeywell -syr\444546 - operations\09 reports\initial design submittal\dredging ids.docm 2/3/2009
4-18
the middle to lower portions of slopes. Many of these contacts do not appear to contain iron nor do they appear to contained any fired material, because they were not observed as part of the magnetometer survey.
2005 Phase I PDI Magnetometer Survey Results
The 2005 magnetometer survey recorded iron-containing outfalls, pipelines, wrecks, and other fired materials. Observations from processing the magnetometer data include the following:
• Most of the nearshore magnetic targets observed within Remediation Area D did not appear to be associated with contacts observed using side-scan sonar which suggests that iron-containing or fired debris may be buried beneath the Remediation Area D mudline.
• Dense distributions of magnetic materials were observed throughout Remediation Area A and in nearshore areas within Remediation Area E.
Graphical output of these survey results are presented in greater detail in the Geophysical Survey Report (CR Environmental, 2007).
4.2.3 Debris Management
Based on experience at other dredging projects, proper debris management is critical to ensuring the operational efficiency of the dredging operation is maintained at a high level. Based on the results of the geophysical surveys described above, there is likely to be a significant amount of surface and subsurface debris which may require management to minimize any impact to the operational efficiency of the dredge. It may be necessary to take debris management steps to ensure that the dredging and capping operations are implemented efficiently to meet project schedules. Management steps could include adjusting dredging and/or capping plans to work around large debris fields or targets, or cutting off select debris at the surface and implementing other management actions such as capping in those areas, or moving aside debris, and/or potentially conducting a debris removal operation prior to dredging an area.
Pre-dredging debris removal is typically accomplished with barge-mounted cranes and excavators using various types of attachments such as grapples, clam shells, and rakes. Following development of the dredge prism, further evaluation will be required to assess debris targets within the prism, and to determine the appropriate management strategy. It is not anticipated that there will be a general effort to rake all sediments prior to dredging; however, there may be some areas which require a debris removal effort. For example, aerial photograph reconnaissance has revealed a large area of discarded tires near the discharge of Harbor Brook. Depending on the finalized dredging plans for this area, removal of these tires may be necessary.
In several areas of the lake, particularly at the mouth of Onondaga Creek, old wooden pilings remain imbedded in the sediment. Timber piles firmly in place within sediment to be dredged can be pulled or cut at the final dredge depth. The decision to leave in place, pull, or cut in-place timber piles will be made with agency concurrence based on location and estimated extent below the dredge depth.
DRAFT ONONDAGA LAKEDREDGING, SEDIMENT MANAGEMENT, &
WATER TREATMENT INITIAL DESIGN SUBMITTAL
Parsons p:\honeywell -syr\444546 - operations\09 reports\initial design submittal\dredging ids.docm 2/3/2009
4-19
Debris removal may also be required during sediment dredge operations if the dredging operation encounters debris with the cutterhead. Debris that can be pushed aside by the cutterhead and will not impact the placement or functionality of the sediment cap may be left in place. Based on previous project experiences, debris entanglement on the cutterhead dredge is likely even with a debris removal step prior to dredging, so to minimize any downtime of the dredging operation, procedures will be developed to clear cutterheads, pumps, and lines which may become clogged with debris. Debris and utilities that are to be separated from sediment will either be cleaned and recycled/reused, contained within the SCA, placed in a separate debris disposal area at Settling Basin 13, or placed in a permitted landfill.
The design approach for debris and utility removal and management will be based on performance specifications. In general, the contractor will be allowed to decide which debris to remove prior to dredging and which can be handled during dredging. However, in areas of concentrated debris or large debris (such as former pier locations or abandoned in-lake utilities), debris that is determined to have cultural resource significance, or debris which will significantly impact cap performance, the design may require removal prior to dredging. Additionally, specific requirements pertaining to the management and disposition of specific debris, and debris types, may be developed during later phases of the design. Debris and utilities removed prior to dredging will be placed into a debris barge, transported to shore, and moved to an onshore area for further processing.
Debris separated from dredge slurry will be taken to an upland processing area and placed into various stockpiles. Potential types of debris stockpiles and management options include:
• Porous debris and utility remnants, such as such as concrete, bricks, timber, railroad ties, rubber, and other porous materials. This material could be crushed or otherwise reduced in size as appropriate and transported to the SCA.
• Non-porous debris and utility remnants, such as metal, large rocks, and possibly fiberglass, ceramic, glass, plastics or similar non-porous materials. This material could be cleaned and recycled. For example, large rocks could be washed and possibly reused for armoring as appropriate. Large metal or other non-porous objects could possibly be sold for reuse or recycling. Small pieces of non-porous debris will likely need to be managed with the porous debris.
• Debris requiring special handling (e.g., compressed gas cylinders, chemical containers with unknown contents, etc), if encountered, may require handling by specialty sub-contractors and/or be transported offsite for disposal.
Debris and utility processing and temporary stockpile areas will be constructed prior to initiation of debris/utility removal or dredging operations. In addition to obtaining land area access, construction requirements will include developing the processing and stockpile areas in accordance with applicable local development requirements such as any applicable floodplain development controls. Wash water and rainfall coming in contact with contaminated debris will be collected and managed with other contaminated water from dredging and SCA operations.
Some of the debris may be of historical significance and may be considered Underwater Archeological Resources. As described in Section 3.12, a Phase IB Cultural Resources
DRAFT ONONDAGA LAKEDREDGING, SEDIMENT MANAGEMENT, &
WATER TREATMENT INITIAL DESIGN SUBMITTAL
Parsons p:\honeywell -syr\444546 - operations\09 reports\initial design submittal\dredging ids.docm 2/3/2009
4-20
Investigation will be completed for Onondaga Lake. Underwater archeological resources identified during implementation of the Investigation will be addressed prior to any debris removal operations. Details pertaining to the management of archeological resources will be further developed in the Final Design Submittal following implementation of the Phase IB Investigation.
4.2.4 Utility Management
As part of the geophysical survey conducted during the PDI, and described in Section 4.2.2, linear features corresponding to known utilities were identified. There are several in-lake utilities within the areas of dredging and capping that exist at a depth that may interfere with the dredging and/or capping operations. Some of these utilities will be removed from the lake or protected prior to and after the remedial activities, dependant on location, depth, and status of use. Utilities that are in continuous or intermittent use may need to be protected during the dredging and capping operations, and the ensuing cap design may need to account for any potential discharge from the utility. A list of in-lake utilities that could be impacted and the potential mitigation for each utility is described below, and is presented on Table 4.3. Figure 4.3 presents the locations of these utilities, as determined by the analysis of the geophysical surveys and available historical records.
As some of these utilities are owned by non-Honeywell entities, discussions with the utility owners will be required before any management steps are taken. In some instances, the utility owners themselves may be required to take management steps for their utilities prior to initiation of dredging and/or capping.
4.2.4.1 Remediation Area A Linear Features
Two linear features within Remediation Area A were identified during evaluation of the data collected during the 2005 geophysical survey (Figure 4.3). The western feature was initially detected as a cluster of magnetic anomalies. Side-scan contacts for the feature could not be established, as the feature is located in a shallow area where limited resolution of the side-scan sonar image is available. Aerial photographs at the location of the anomaly showed the presence of the feature above sediment surface. Based on visual reconnaissance conducted during the Phase III PDI investigations, the feature was identified to be a cast iron pipeline.
The eastern linear feature was also identified from a cluster of magnetometer anomalies. Side-scan contacts for this feature were also limited due to shallow water depths. Aerial photographs taken at this location indicate a linear feature on the sediment surface. The feature is yet to be identified.
Additional data and record review may be required to provide further details regarding the nature of these features. If, upon further investigation, it is determined that the features can be left in place without impacting the future integrity of the sediment cap, they will not be removed. Should specific segments of these pipelines pose implementation problems on the dredging operation, or future pipe deterioration threaten the integrity of the sediment cap, removal may be required.
DRAFT ONONDAGA LAKEDREDGING, SEDIMENT MANAGEMENT, &
WATER TREATMENT INITIAL DESIGN SUBMITTAL
Parsons p:\honeywell -syr\444546 - operations\09 reports\initial design submittal\dredging ids.docm 2/3/2009
4-21
4.2.4.2 Remediation Area C Culverts
Two culverts are located in Remediation Area C before the peninsular area (Figure 4.3). These culverts open out into the dredge and cap area of Remediation Area C. The 60-inch diameter culvert is the Tributary 5A outlet flowing under Interstate Route 690. The 42-inch diameter culvert is an outlet from the adjoining pump house. These culverts are both currently in use, and actively discharge to the lake.
Two additional culverts located in Remediation Area C north of the causeway structure, also discharge to the lake. These culverts, an 18-inch and a 24-inch, discharge collected stormwater runoff from I-690. Both culverts intersect and penetrate the northern portion of the Willis-Semet IRM Barrier Wall, to allow for continued discharge.
Once dredged areas/depths and cap areas are more clearly delineated, further evaluation may be required to assess the flow from these culverts. This assessment will determine the potential impact on the dredging and capping operations, including the potential scour effect on a sediment cap placed directly in front of the discharge. Management options for these could include relocation of the discharge, or a revision of the dredging and capping strategy to accommodate the existing location and discharge of these culverts.
4.2.4.3 Cooling Water Intake Lines
Two cooling water intake lines were identified in the border area between Remediation Areas C and D (Figure 4.3). One pipeline is an 84-inch diameter corrugated pipe supported on wooden pilings which runs approximately 1,240 ft into the lake and approximately 1,200 ft from the edge of the causeway structure. The other pipeline is a 72-inch diameter cast iron pipeline which does not have any supporting structures, and runs approximately 1,000 ft into the lake and approximately 1,194 ft from the edge of the causeway structure. The pipelines extend from the land into the lake from a sump 65 ft from the edge of the causeway. Upland of this sump is a 72-inch diameter concrete pipe. The pipelines were formerly owned by the Solvay Process Company and are now property of Honeywell. These pipes are currently out of service.
The Willis-Semet IRM Barrier Wall project encountered these pipelines in 2008 during the sheet pile driving operation. The bathymetry along the barrier wall at the intersection point is at an elevation of approximately 360 ft, and both pipelines are buried approximately 5 ft into the sediment. As part of the Willis Semet IRM construction, the intake pipelines were plugged inboard and outboard of the barrier wall alignment. Additionally, portions of the pipes intersecting the barrier wall alignment were demolished to allow for installation of the sheet piling in this area. Flowable grout was pumped into the upland portion of the intake pipelines to eliminate the pipelines as a flow path for NAPL and impacted groundwater.
Additional data and record review may be required to provide further details regarding the exact depths of these pipelines within the lake. If, upon further investigation, it is determined that the pipelines can be left in place without impacting the future integrity of the sediment cap, they will be left in place. Should specific segments of these pipelines pose implementation problems on the dredging operation, or future pipe deterioration threaten the integrity of the sediment cap, removal may be required.
DRAFT ONONDAGA LAKEDREDGING, SEDIMENT MANAGEMENT, &
WATER TREATMENT INITIAL DESIGN SUBMITTAL
Parsons p:\honeywell -syr\444546 - operations\09 reports\initial design submittal\dredging ids.docm 2/3/2009
4-22
4.2.4.4 Water Inlet Pipes
The 42-, 30-, and 16-inch diameter inlet pipes lie near the western boundary of Remediation Area D (Figure 4.3). The three pipelines were laid by the Solvay Process Company and are currently owned by Honeywell. The pipelines have been abandoned from service. The three pipelines were detected as magnetic targets during the geophysical investigations but were not identified during the 2005 side-scan sonar survey, indicating the three pipelines are buried. Results from the 2005 magnetometer survey indicate that the 42-inch diameter pipeline extends 1230 ft, the 30-inch diameter pipeline extends 1145 ft, and the 16-inch diameter line extends 890 ft into the lake. The terminus of all three pipelines was recorded as part of the 2005 side-scan sonar survey.
During the Phase III PDI investigation, drilling was consistently obstructed at two locations at a depth of 16 to 18 ft below the sediment surface over the location of the 30-inch pipeline. These locations were at a distance of 25 to 35 ft from the shore and within the alignment of the barrier wall. During the 2008 construction of the southern portion of the wall, two of the water inlet pipes were intersected by the sheet pile driving operation, most likely the 30- and 42-inch. No removal of these pipelines was conducted, so no verification of the sizing could be achieved. The 30-inch pipe was encountered approximately 17 ft below the surface of the sediment, and the 42-inch pipe was encountered approximately 8 ft below the surface of the sediment. As part of the installation of the Willis-Semet IRM Barrier Wall, the sheet piles were driven through the pipes, and no portions of the pipelines were removed. The 16-inch pipeline is not known to have been encountered during the installation of the barrier wall.
Based on information currently available, it appears that most portions of these pipelines would be beneath the anticipated ranges of dredge depths. Additional data and record review may be required to provide further details regarding the exact depths of these pipelines within the lake. If, upon further investigation, it is determined that the pipelines can be left in place without impacting the future integrity of the sediment cap, they will be left in place. Should specific segments of these pipelines pose implementation problems on the dredging operation, or future pipe deterioration threaten the integrity of the sediment cap, plugging, filling, or removal may be required.
4.2.4.5 Diffuser Pipeline
A 60-inch diameter diffuser pipeline runs perpendicular to the shore and terminates in Remediation Area D close to the SMU 8 boundary (Figure 4.3). It runs from the pump station centrally located along the shore of Remediation Area D to a distance of approximately 790 ft into the lake (CR Environmental, 2007). The pipeline was previously owned by Allied Chemical and is now owned by Honeywell. Design drawings indicate a length of 740 ft from the shore line. The terminus of the pipeline is a 60-inch diffuser pipeline 130 ft wide and supported on a pile bent. The pipeline has been abandoned from service. From the drawings, the pipeline appears to have been placed in a trench of varying depths from 3 to 10 ft below the mudline along its entire length during its initial construction. However, side-scan sonar shows images of the pipeline currently exposed along the entire length.
DRAFT ONONDAGA LAKEDREDGING, SEDIMENT MANAGEMENT, &
WATER TREATMENT INITIAL DESIGN SUBMITTAL
Parsons p:\honeywell -syr\444546 - operations\09 reports\initial design submittal\dredging ids.docm 2/3/2009
4-23
Additional data and record review may be required to provide further details regarding the exact depths of this pipeline within the lake. If, upon further investigation, it is determined that the pipeline can be left in place without impacting the future integrity of the sediment cap, it will be left in place. Should specific segments of this pipeline pose implementation problems on the dredging operation, or future pipe deterioration threaten the integrity of the sediment cap, plugging, filling, or removal may be required.
4.2.4.6 Sun Oil Pipeline
The Sun Oil pipeline runs along the shore of Remediation Area C up to the southern end of Remediation Area D where it enters the lake. The pipeline then extends through Remediation Area E (Figure 4.3). The elevation of the Sun Oil line is currently unknown and must be determined. The pipeline has been abandoned; however, record drawings indicate a ¼” wire connected from the abandoned oil line to the active Mobil Oil pipeline running over the land. The old abandoned line offers cathodic protection against corrosion to the inactive Mobil Oil line located on land. The connection is made to a 6-inch diameter Sun Oil line near the southern shore of Remediation Area A at a location to be identified. The location of the cathodic protection line, based on record drawings, is indicated on Figure 4.3. Sonar contacts of the pipeline were made in Remediation Area E (CR Environmental, 2007) indicating that these pipelines are not buried deep.
Given the relatively shallow burial depths, it appears likely that most sections of the pipeline will need to be removed prior to dredging. Based on previous experience with decommissioning of sections of this pipeline, Sun Oil would likely be responsible for the execution of this decommissioning. The cathodic protection line, if situated below the dredge prism, can be capped in place though it would likely require deactivation during dredging as a safety measure. Additional measures to accommodate the potentially functional cathodic protection system may need to be incorporated into this decommissioning.
4.2.4.7 Metro Outfall Pipes
There are two active NPDES outfalls on the edge of the lake owned by Onondaga County which discharge water from Metro to Remediation Area E (Figure 4.3). Both outfalls open out at the water surface level and extend a short distance from the shoreline. These outfalls discharge to an area where only dredging and no capping are prescribed by the ROD (NYSDEC and EPA, 2005)
Additionally, there are two 60-inch discharge pipelines which run from the shore at Metro and discharge into Remediation Area E. The pipelines were detected as magnetic targets in the geophysical investigation but no images were seen on the side-scan sonar. These pipelines run beneath sediment surface throughout its length with only its terminus exposed in side-scan sonar images in the northeast portions of the Remediation Area. The terminus of the two outfalls is at an elevation of 339 ft and lies 1700 ft into the lake. The outfall is not currently active.
Due to the nature and location of these outfall pipes, it is unlikely that removal or relocation would be viable. Disruption of flow from these outfalls and pipes would not be easily accomplished given the continuous treatment and discharge from Metro. The final design of
DRAFT ONONDAGA LAKEDREDGING, SEDIMENT MANAGEMENT, &
WATER TREATMENT INITIAL DESIGN SUBMITTAL
Parsons p:\honeywell -syr\444546 - operations\09 reports\initial design submittal\dredging ids.docm 2/3/2009
4-24
dredging depths and cap areas will take into consideration the location and outflow from these discharges, and will account for the erosive forces that these discharges would have. Execution of the debris removal, dredging, and capping operations will be designed to avoid interference with the functionality of these outfall pipes. Honeywell has begun discussions with Onondaga County to discuss any additional steps that will have to be taken as part of the effort within Remediation Area E.
4.2.4.8 Other Remediation Area E Features
An outfall was identified near the northern boundary of Remediation Area E (Figure 4.3). Additionally, the 2005 geophysical investigation located a line of magnetic anomalies to the north of Ley Creek. There is no information currently on the outfall and no correlation has been established between the apparent outfall and the linear structure. The geophysical survey indicated that the anomalies extend 790 ft into the lake from the shoreline. The side-scan sonar images appear to show a lattice-like arrangement of structures 27 ft wide, likely with coarser substrate within the central region. Side-scan sonar data suggest that the features rise approximately 9 ft above the sediment surface. A reconnaissance diver’s inspection in 2005 reported that the features appeared to consist of submerged pilings and cribs.
Depending on the final areas and depths associated with the sediment dredging and cap placement operation, these features may not need to be removed. Further evaluation of these features will be required once these areas are finalized. Additional evaluations associated with the cultural resource aspect of these features may also impact the recommended management action.
4.3 MANAGEMENT OF AMBIENT WATER QUALITY IMPACTS
As described in Section 4.1, sediment removal through dredging is a significant portion of the remedy for Onondaga Lake. One of the potential short-term impacts resulting from dredging and pre-dredging debris removal is resuspension of sediment. Resuspension is the dislodgment and dispersal of sediment into the water column where the finer sediment particles and flocs are subject to transport and dispersion by currents (Palermo et al., 2008). Release of dissolved phase contaminants to the water column from porewater and by desorption from suspended sediment particles during dredging is not uncommon (Palermo et al., 2008), but many contaminants in Onondaga Lake sediments tend to remain tightly bound to fine-grained sediment particles; therefore, control of sediment resuspension will help in control of contaminant release. Resuspension controls, both physical (e.g., silt curtains) and operational (e.g., minimize cutterhead rotation speed), are used to mitigate resuspension from dredging.
The logic for managing ambient water quality impacts is presented in this section by describing the design and performance criteria, presenting a review of silt curtains and other operational controls to mitigate resuspension, and outlining necessary support areas.
4.3.1 Design and Performance Criteria
Per the ROD (NYSDEC and EPA, 2005), silt barriers (or silt curtains) will be used as resuspension control devices within each dredging work zone. The resuspension control design will utilize the water quality criteria as key constraints and as a basis to reduce the potential for
DRAFT ONONDAGA LAKEDREDGING, SEDIMENT MANAGEMENT, &
WATER TREATMENT INITIAL DESIGN SUBMITTAL
Parsons p:\honeywell -syr\444546 - operations\09 reports\initial design submittal\dredging ids.docm 2/3/2009
4-25
resuspension, either by the deployment of resuspension control systems, or through operational modifications of the dredge equipment or operations.
Project requirements applicable to multiple aspects of the operational design, including dredging, are detailed in Section 2.2. In-lake operations will be required to meet the substantive requirements of applicable water quality standards that are set forth in the ROD (NYSDEC and EPA 2005) and RDWP (Parsons 2008). Applicable water quality criteria will be specified as part of a 401 Water Quality Certification for the project. Operational Best Management Practices (BMPs) and controls will be implemented, as necessary, to minimize the potential for deviations from water quality criteria.
Water quality criteria for in-lake activities will be established during later phases of the design. The development of these criteria will consider the ambient water quality of the lake and potential dredging impacts as well as incorporate spatial (e.g., distance from dredge/resuspension control device) and temporal (e.g., daily average) components. A proposed water quality criteria consists of two tiers: 1) alert levels; and 2) action levels. Alert levels would be developed to identify and correct dredging-related impacts before the action level (more protective level) is reached, so that early warning is available to refine the dredging process. Failure to be in compliance with the alert level may warrant additional monitoring and engineering improvements (see proposed BMPs in Section 4.3.3). Action levels would be developed to assure environmental protectiveness.
The water quality criteria will be developed such that an efficient and environmentally protective program can be implemented. Given the tight schedule constraints for implementation of the lake remedy, it will be the goal of this program to utilize turbidity as the primary indicator for assessing impacts due to dredging. Turbidity is often used to monitor the impacts of dredging, as turbidity data can be collected in real time which provides for rapid implementation of corrective actions, if warranted. A review of relevant environmental dredging projects revealed water quality criteria typically ranging from 25 to 50 Nephelometric turbidity units (NTU) above background were proven to be practical limits. These same programs had “alert” and “action” levels at distances ranging from 300 to 600 ft, typically outside the resuspension containment systems (i.e., silt curtains, in most cases). Details pertaining to the established water quality criteria and monitoring requirements will be included in the Final Design.
Following establishment of the water quality criteria, a construction monitoring plan will be developed and subsequently submitted, which will present further details of the monitoring plan and contingency and response action levels that will be undertaken to assure environmental protectiveness during the project. A flow chart depicting the alert and action level stations and the associated monitoring and response protocols will also be included as part of final design.
4.3.2 Silt Curtains
4.3.2.1 Overview
Silt curtains are designed to control suspended solids and turbidity generated in the water column as a result of navigation or environmental dredging (Francingues and Palermo, 2005). Silt curtains are vertical, flexible structures that extend downward from the water surface to a
DRAFT ONONDAGA LAKEDREDGING, SEDIMENT MANAGEMENT, &
WATER TREATMENT INITIAL DESIGN SUBMITTAL
Parsons p:\honeywell -syr\444546 - operations\09 reports\initial design submittal\dredging ids.docm 2/3/2009
4-26
specified water depth. They are typically constructed of filter fabrics or impervious polyethylene sheets combined with floatation and anchoring devices. Figure 4.4 shows the general schematic of the silt curtain system, and illustrates its primary components (including the boom system that provides sheen containment and flotation, the silt curtain, and the anchoring system).
4.3.2.2 Effectiveness
As summarized in Francingues and Palermo (2005), silt curtain effectiveness depends on the following factors:
• nature of the operation;
• quantity and type of material in suspension within or upstream of the curtain (including debris, oils, and chemicals);
• characteristics, construction, and condition of the curtain, as well as the area and configuration of the barrier enclosure (e.g., partial or full depth containment, and solid or permeable fabric);
• method of deployment; and
• hydrodynamic conditions
− strong currents (e.g., greater than 1 knot or 1.5 ft per second)
− high winds (especially with long fetch areas)
− fluctuating water levels
− excessive wave height
− drifting ice and debris.
For utilization in Onondaga Lake, the design of the silt curtains will consider how the hydrodynamic conditions may impact the effectiveness of a silt curtain. The orientation of the lake (northwest to southeast) provides a long fetch in the direction of prevailing winds, which has the capability to produce sizable wind-generated waves in the southern basin. Wave heights on the order of 0.5 ft have been measured in SMU 1 (Remediation Area D) (Owens et al., In Review). Additionally, annual wind-generated wave heights of approximately 1 to 2 ft were predicted to occur in the southern basin based on historic average wind speeds as part of the cap erosion protection layer design evaluation. Preliminary analysis indicates silt curtains can be successfully deployed, and the detailed design for the silt curtains will be included in the intermediate design. Per USACE guidance, the silt curtain design will include a minimum 1- to 2-ft gap between the bottom of the curtain and the sediments to prevent stirring up the sediments from wave action (USACE, 1997). Silt curtains which are installed deeper than 10 to 12 ft will be subject to large loads causing strain to the curtain materials and mooring system (USACE, 1997). The appropriate maximum length for Onondaga Lake deployment will be determined as part the Final Design submittal.
During implementation of the remedy, silt curtain effectiveness will be assured through the construction monitoring program by measuring turbidity at specific locations.
DRAFT ONONDAGA LAKEDREDGING, SEDIMENT MANAGEMENT, &
WATER TREATMENT INITIAL DESIGN SUBMITTAL
Parsons p:\honeywell -syr\444546 - operations\09 reports\initial design submittal\dredging ids.docm 2/3/2009
4-27
4.3.2.3 Configuration
The silt curtain may be deployed using two types of configurations, depending upon the location of dredging and hydrodynamic conditions (e.g., currents and waves). During nearshore dredging, silt curtains may be deployed in a semicircle or “U” pattern. In the “U” configuration, the silt curtain encloses the dredging activities in a semicircular shape that is anchored to the shoreline at both ends. During dredging that is “detached” from the shoreline, silt curtains may be deployed in a circle or ellipse configuration that surrounds the dredging activities. Figure 4.5 shows typical silt curtain configurations. In general, large remediation areas will be enclosed with a “U” configuration in Remediation Areas A, B, C, D, and E, avoiding inclusion of tributaries where possible. A circle or ellipse configuration may be used where dredging occurs away from the shoreline.
The final configurations and requirements for silt curtain placement will be determined following development of the dredge prism.
4.3.3 Other Best Management Practices (BMPs)
In addition to silt curtains, BMPs (i.e., operational controls) will be employed to minimize resuspension of sediments during dredging. Typically, two tiers of BMPs are employed. The first tier will be required as part of the contract. The second tier will be employed only if water quality monitoring results indicate a need. Example “Tier 1” BMPs include:
• the contractor will begin dredging at the highest elevation and work towards the lowest; and
• the contractor will be limited to single cut depths at 80% of the cutterhead diameter.
Examples of “Tier 2” BMPs include:
• limiting operations to specific hydrodynamic conditions (such as wave heights);
• optimizing specific operations (such as ladder swing speed, cutter rotation speed, depth of cut, or speed of advance of the dredge) which could reduce sediment concentration within the slurry and reduce the dredge production rate; and
• optimizing the sequence of dredging (upcurrent to downcurrent, offshore to onshore, or with respect to number of vertical cuts).
BMPs will be further developed as part of the Final Design Submittal.
4.3.4 Support Areas
Resuspension controls deployment and monitoring will occur on or near the lake; therefore, a support zone will be located at the shoreline. The support zone for resuspension controls deployment and monitoring can be co-located with support zones for other aspects of the project (e.g., dredging). Support zone requirements include:
• staging area for silt curtains and equipment used to deploy silt curtains;
• docking location for vessel(s) used to deploy silt curtain;
DRAFT ONONDAGA LAKEDREDGING, SEDIMENT MANAGEMENT, &
WATER TREATMENT INITIAL DESIGN SUBMITTAL
Parsons p:\honeywell -syr\444546 - operations\09 reports\initial design submittal\dredging ids.docm 2/3/2009
4-28
• docking location for sampling vessel(s) that will measure water quality parameters (e.g., turbidity) and collect water column samples; and
• onsite laboratory to analyze total suspended solids (TSS) and CPOI samples, if required.
4.4 SLURRY TRANSPORT & OPERATIONS
This IDS Report provides for hydraulic dredging of sediments dredged from Onondaga Lake followed by hydraulic conveyance through a pipeline to the SCA for dewatering. Due to the long distance and elevation difference between Onondaga Lake and the SCA, the dredge will not be able to pump in one stage to the SCA; therefore, several booster pumps will be required to pump the slurry to the SCA. Booster pumps are supplements to the dredge pump and increase the distance the slurry can be pumped. This section describes the baseline operational scenario defining potential pipeline sizes, routes, materials of construction, and booster pump types and locations.
The baseline operation scenario considered in this IDS Report provides for hydraulically pumping the dredged sediments from the dredge in the lake to an equalization tank at an onshore facility located on Settling Basin B. The maximum estimated distance from the dredge to the onshore facility is 4,000 ft. From Settling Basin B, the dredged sediments will then be pumped as slurry in a 12-inch ID pipe to the dewatering area on Settling Basin 13. The slurry will pass through a series of four 500 HP booster pumps.
The route of the slurry pipeline will be along the I-690 corridor, a portion of Ninemile Creek, along the south side of Settling Basins 9-11, and to the dewatering area located on Settling Basin 13. The length of this pipeline route is approximately 21,000 ft.
4.4.1 Design and Performance Criteria
Design and performance criteria for dredged sediment conveyance include:
• secondary containment will be provided along the length of the slurry pipeline to ensure containment of liquids in the event of a pipe leak;
• the dredged slurry will be transported as a slurry via pipeline at sufficient velocity to minimize clogging in the slurry pipeline;
• the slurry transport system will be designed to transport the range of material sizes that are expected in the sediments in Onondaga Lake;
• the pipeline will be designed for the flow rates and velocities necessary to transport the materials from the bottom of Onondaga Lake to the SCA at required production rates;
• provisions to prevent the dredge slurry from flowing back into Onondaga Lake in the event of a dredging shut-down or other maintenance event will be employed; and
• noise restrictions per applicable local ordinances will be followed, additionally noise generation potential with respect to potential nearby sensitive receptors will be considered.
DRAFT ONONDAGA LAKEDREDGING, SEDIMENT MANAGEMENT, &
WATER TREATMENT INITIAL DESIGN SUBMITTAL
Parsons p:\honeywell -syr\444546 - operations\09 reports\initial design submittal\dredging ids.docm 2/3/2009
4-29
4.4.2 Secondary Containment
The slurry line will require secondary containment in its entirety to ensure protection of the local community and the environment. It is anticipated that secondary containment will be achieved through containment of the pipeline within a lined trench, or utilization of a secondary pipe. Transition details for these containment details and a slurry pipe lay schedule shall be provided in the final design. Additional details pertaining to liner type, UV exposure, joint treatment (liner or secondary stormwater containment pipe), and sumps for collection of rain water in open trenches will be developed in the Final Design Submittal. As described in Section 4.4.6, routing O&M will be performed to verify the functionality and integrity of the pipeline, and at a minimum, will include daily visual inspection of the entire length of the pipeline.
4.4.3 Pipeline Route
Hydraulically-dredged sediment is expected to be initially pumped a maximum estimated distance of 4,000 ft as slurry from the dredge to an onshore facility. This section of the slurry pipeline (often referred to as the dredge tail pipe) will be a floating pipeline (which will be clearly marked with navigation lights). In the event other commercial or navigational needs require crossing over the tail pipe route then this segment of the pipeline may be submerged. Under these circumstances the tail pipe segment would be floated in place, submerged, and anchored to the bottom of the lake. The submerged pipeline would also be marked at predetermined intervals with navigational buoys.
Upon reaching shore, pumped dredge slurry may be screened and material not collected on the screen(s) may be discharged into an equalization tank (Figure 4.1). When dredging in Remediation Areas C, D, or E, it is anticipated that this screening operation and equalization tank, if required, will be located at Settling Basin B, which is ideally located for dredging from the southern end of the lake. From the equalization tank, the slurry would be pumped up the western shore of the lake, cross onto the western portion of the Settling Basins 1-8 site, and follow the I-690 corridor toward mouth of Ninemile Creek (a distance of approximately 9,000 ft). The slurry would then be pumped up the Ninemile Creek corridor to the southeast corner of the Settling Basins 9-11 site.
From this location, the pipeline would run along the south side of Settling Basins 9-11, along Ninemile Creek (Figure 4.6). Crossing over or under Ninemile Creek will be necessary, likely by means of a pipe bridge or buried casing. In addition, the location considers the future need to upgrade and/or create new access roads for construction, operation, and maintenance of the slurry pipeline and potentially for booster pump facilities
The total slurry pipeline distance for either of these two options is approximately 25,000 ft with a rise in elevation of approximately 77 ft from the lake to the SCA. Additional information on alternative pipeline routes considered and the benefits of the route options is contained in Appendix E, “Pipelines Route Evaluation Memorandum” (Honeywell 2007).
4.4.4 Pipeline & Booster Pumps
To evaluate the slurry transport system, the following steps were taken:
DRAFT ONONDAGA LAKEDREDGING, SEDIMENT MANAGEMENT, &
WATER TREATMENT INITIAL DESIGN SUBMITTAL
Parsons p:\honeywell -syr\444546 - operations\09 reports\initial design submittal\dredging ids.docm 2/3/2009
4-30
• the slurry velocity in the pipeline was computed;
• the friction losses in the slurry pipeline were estimated;
• the potential number of booster pumps required was determined based on the friction losses and elevation lift required; and
• the required slurry pipeline wall thickness was determined.
Detail on each of these evaluations is provided below.
Slurry Velocity
Table 3.1 presents a statistical evaluation of the geotechnical properties of the materials to be dredged in each remediation area. As described in Section 3.3, the material to be dredged from Onondaga Lake consists primarily of fines (in the fine sand and clay and silt particle size). Based on the size and specific gravity of the material being conveyed in the slurry, there is a minimum velocity required to keep the sediment portion of the slurry in suspension and prevent deposition and subsequent clogging of the slurry pipeline. In a pipe with slurry at rest, all solids are settled at the bottom of the pipe and the liquid is at the top. As pumping starts and water velocity increases, water picks up progressively more solids until, at a certain velocity (Vc), the last solids at the bottom of the pipe are on the point between moving and staying put.
The critical velocity is also the velocity at which the solids in the slurry will begin depositing in the pipe and eventually lead to plugging the pipeline. Therefore, it is desirable to operate above the critical velocity (Herbich, 2000). For heterogeneous slurry (i.e. a portion of the solid particles are carried as suspended load and the remainder is moved as bed load along the bottom of the pipe) with centrifugal booster pumps as the prime movers, the slurry velocity is normally well above the critical velocity to keep the material in suspension (GIW Industries 2001). For the purposes of the conceptual design, it is assumed that the dredging contractor would pump the slurry at a velocity 20% above the critical velocity.
As described in Section 4.1.4, a 12-inch hydraulic cutterhead dredge is being evaluated for the project. A 12-inch ID pipeline was selected for this IDS Report as the slurry conveyance line to the SCA as it meets design criteria including production rates, as discussed in Section 4.1.4, based on the estimated critical velocity. Appendix D presents the estimates of critical and potential operating velocities based on Durand and Condolios (1952) and Wilson et al. (1997) for various sized particles that may be dredged from Onondaga Lake. The critical velocity is sensitive to the size of the particles being conveyed. Since the size of a majority of the sediments are in the fine sand to silt and clay size range, a particle size of 0.2 mm was used to compute the critical velocity. While there will be particles larger than 0.2 mm contained within the slurry, for the purposes of this IDS Report it is not anticipated that they will be present in sufficient quantity in any location to cause pipeline blockage. The critical velocity for a 0.2 mm particle size was computed to be 9 fps using Wilson et al. (1997) and 11 fps using Durand and Condolios (1952). The corresponding pipeline velocity at 20% above critical velocity is 11 to 13 fps. Therefore, the slurry velocity may range from 11 to 13 fps. A slurry velocity of 13 fps was used for the purposes of this IDS Report and equates to a volumetric flow rate in a 12-inch
DRAFT ONONDAGA LAKEDREDGING, SEDIMENT MANAGEMENT, &
WATER TREATMENT INITIAL DESIGN SUBMITTAL
Parsons p:\honeywell -syr\444546 - operations\09 reports\initial design submittal\dredging ids.docm 2/3/2009
4-31
ID pipe of approximately 4,800 gpm. The slurry velocity will be evaluated in more detail and optimized as the design progresses.
Friction Head Loss in Slurry Pipeline
When pumping the dredged material over long distances, the dredge pump may not have enough “head” (pressure) to transport the slurry to the disposal area. The horizontal and vertical distance that the dredged material can be transported is therefore, a function of the pump head. The friction effects on the slurry in the pipeline are quantified as frictional head losses (pressure drop). Head losses in the line were evaluated to estimate the potential number of booster pumps.
For the purposes of the conceptual design and the development of the baseline operational scenario, the Hazen-Williams Equation was used to evaluate the amount of frictional head loss in the slurry pipeline (Herbich 2000). Using the equation for the conceptual design, for a slurry consisting of finer materials (in the fine sand and silt and clay sizes particle range) and a specific gravity of 1.1 traveling at 13 fps in a 12-inch ID pipe (approximately 4,800 gpm), the friction losses are approximately 4 ft per 100 ft of pipeline. Appendix D presents the estimates of the friction losses.
Booster Pump Locations and Types
As described in Section 4.4.3, the total length of the slurry pipeline route is approximately 25,000 ft. Using a friction head loss of 4 ft per 100 ft of pipeline, this equates to 1,000 ft of friction loss. Additionally, a static head of approximately 77 ft associated with the elevation difference between the lakeshore and SCA must be overcome. The pumps on the 12-inch dredges described in Section 4.1 cannot generate this amount of head; therefore, booster pumps are required. When a booster pump is added in the discharge line, the head of the booster pump is simply added to the head of the main pump to obtain the total system head. When a sufficient number of booster pumps is added to the system, the total system head will be greater than the head losses, and the slurry will be able to reach the SCA.
An example of the estimated number, type, and location of booster pumps needed to transport the dredged material to the SCA is described below. Figure 4.7 shows an example hydraulic grade line along the slurry pipeline from the dredging areas in Onondaga Lake to the SCA to estimate the potential location of booster pumps. The hydraulic grade line uses a frictional loss of 4 ft per 100 ft of pipeline and four booster pumps capable of developing 240 ft of head at flow rates of 5,000 gpm. The hydraulic grade line does not address losses due to valves and appurtenances. As shown on Figure 4.1, this hydraulic grade line assumes that a floating pipeline will run from the dredges to a debris screening and free water surface equalization tank at Settling Basin B, before being routed to the booster pumps.
Based on criteria described above, four 500 horsepower (hp) booster pumps could be used to transport the slurry to the SCA. An example of the type of booster pump that can meet these requirements is the GIW Industries, Inc., LSA slurry. The pumps can develop 240 ft of total dynamic head at 4,800 gpm. LSA S slurry pumps are low-speed, horizontal, end-suction,
DRAFT ONONDAGA LAKEDREDGING, SEDIMENT MANAGEMENT, &
WATER TREATMENT INITIAL DESIGN SUBMITTAL
Parsons p:\honeywell -syr\444546 - operations\09 reports\initial design submittal\dredging ids.docm 2/3/2009
4-32
modified volute casing pumps. They are primarily for heavy-duty service in a wide variety of slurry applications. The manufacturer’s literature and pump curves are included in Appendix F.
These pumps range in horsepower from 500 to 800 hp. The pumps can be driven by either electric or diesel motors. Electric motors require either running commercial power to each booster pump station, or, if commercial power is not available, a central power station would need to be established and power supplied to each location. The electric motors could be either constant- or variable-speed drives. The variable-speed electric motor would allow for added power if coarser material is encountered and there would not be a need to store large amounts of diesel fuel at each pump location. Subsequent design evaluations will assess the energy requirements associated the pumping of the slurry, and opportunities to employ renewable energy sources where feasible will be a priority. Noise generation potential of the booster pumps with respect to proximity to nearby sensitive receptors will also be a consideration in the selection of the pump type.
It is anticipated that the four booster pumps can be placed at the following locations:
• one at the onshore facility at Settling Basin B;
• one along the I-690 corridor;
• one on Settling Basin 1-8; and
• one in the vicinity of Settling Basins 9 and 10.
Figure 4.6 shows the proposed slurry transport pipeline routes and potential locations of booster pumps. As the design progresses, the size (horsepower) and number of the booster pumps will be further evaluated and optimized.
A concrete equipment pad is recommended for booster pump and motor operations. Because the booster pumps would remain for four dredging seasons, they should be enclosed (with a structure such as a pole building) to protect them during the non-dredging winter season. Each booster pump location would require an access road suitable for a pick-up truck to access and maintain the pumps. If electric motors are used, power would need to be supplied to each pump. The type of seal packing (mechanical or water) will also be evaluated as the design progresses
Dredge Slurry Pipeline Considerations
A booster pump that generates 240 ft of head adds approximately 115 pounds per square inch (psi) to the pipeline. The pressure in the slurry pipeline varies based on proximity to the booster pumps. For example, for the locations of the booster pumps shown in Figure 4.6, the maximum pressure at the outlet of each booster pump can range from approximately 115 psi (after the first booster pump) to 150 psi (after the third booster pump). The pressure in the pipeline decreases away from each booster pump due to friction losses. Appendix D presents the pipeline pressure calculation.
Two types of pipeline materials may be used for use to transport the slurry:
DRAFT ONONDAGA LAKEDREDGING, SEDIMENT MANAGEMENT, &
WATER TREATMENT INITIAL DESIGN SUBMITTAL
Parsons p:\honeywell -syr\444546 - operations\09 reports\initial design submittal\dredging ids.docm 2/3/2009
4-33
• high density polyethylene (HDPE); and
• carbon steel.
HDPE can provide cost savings in installation, maintenance, freedom of design, and extended life of the piping system. This pipe will not rot, rust, corrode, conduct electricity, or support the growth of or be affected by algae, bacteria, or fungi (Herbich 2000). Steel pipe is capable of handling higher pressures with smaller wall thicknesses but is subject to corrosion. The following criteria will be evaluated as the pipeline design progresses, as part of final design:
• operating pressure throughout the pipeline;
• properties (particle size and chemical constituents) of the dredged sediments in the slurry;
• wear potential;
• ease of installation and maintenance; and
• above and below ground properties for installation environments and compatibility.
Further pipeline evaluations may include analytical and laboratory based studies of pipeline efficiencies and performance, as well as discussions with vendors. The results of the pipeline design refinements (and specifics of pipeline material of construction and wall thickness) will be included in the Final Design Submittal.
4.4.5 Debris/Oversize Screening
This section addresses management of slurry, dredged debris, and oversize screenings at the Settling Basin B dredge staging area.
Pumping into an equalization tank (or tanks) offers several potential advantages for the Onondaga Lake project and provides an opportunity to screen out oversize particles and debris collected by the dredge that could cause potential slurry line and booster pump malfunctions. The slurry line is approximately 25,000 ft in length, and blockage in any segment between booster pumps may shut the project down until the blockage is found and the situation rectified. Also, the booster pumps, working in series, although designed to handle coarse mining consistency slurry flows, have limited tolerances on particle size that will pass through them and are subject to impeller and volute tolerance wear. To avoid sustained down time and to maintain an approximate 70% average dredge time efficiency, contingencies measures will be outlined, as described in the Operations & Management Plan addressed below.
Sediment received from the hydraulic dredge at the Settling Basin B dredge staging area, in the context of this IDS Report, is being screened coming off the dredge tail pipe. Material not collected and passing through the screen(s) would be discharged into an equalization tank and pumped through a series of booster pumps to the SCA. Material collected on the screen(s) would be sorted, decontaminated if applicable, and recycled. Material not suitable for decontamination would be dewatered through passive means, collected, and transported to the SCA for beneficial use or disposal.
DRAFT ONONDAGA LAKEDREDGING, SEDIMENT MANAGEMENT, &
WATER TREATMENT INITIAL DESIGN SUBMITTAL
Parsons p:\honeywell -syr\444546 - operations\09 reports\initial design submittal\dredging ids.docm 2/3/2009
4-34
By screening and providing an equalization tank(s) at Settling Basin B, the system may provide for:
• opportunity to control slurry density for pumping to SCA (and reduction in slurry line chances of clogging);
• Settling Basin B equalization tank acceptance of a portion of slurry line backflow during shut-downs;
• minimization of dredge tail pipe purging during shut-downs by pumping limited slurry contained in tail pump length; and
• opportunity for control of volatile emissions and odor before slurry dewatering at the SCA.
4.4.6 Operations & Maintenance
O&M of the slurry conveyance system is critical to project performance. As an example, one important consideration in the evaluation of a booster slurry transport system is the potential for water-hammer. The rapid changes that can occur in the velocity of flow in force mains and pressure pipe can be caused by pump startup, pump shutdown, or power failure, and can result in a considerable change in pressure. The change in pressure can be accompanied by a hammering-type noise. This transient pressure and flow condition in pressure pipes is known as water-hammer (Metcalf & Eddy, Inc. 1981). Turner (1996) notes that a flap valve (a swinging check valve) can potentially cause water-hammer conditions in a slurry transport system. If the dredge is pumping against a high terminal elevation (such as the last booster pump before the SCA) and the pump loses its prime or otherwise shuts down, the slurry tries to flow backwards in the pipeline (i.e., towards the dredge). When this occurs, the flap valve closes abruptly and water-hammer conditions are induced.
Further engineering analysis and discussions with equipment suppliers, contractors and past experience will be used to assess these scenarios. Preliminary evaluations suggest that the concentration of slurry being transported in the slurry line may allow for soft shut downs and startups of the system by simply shutting down the pumps and dredge in a controlled sequence to be determined, and allowing the slurry to remain in the line. Under this scenario, the need and strategic placement of valves will require analysis to prevent unwanted backflow conditions, and the ability of the pumping system to re-suspend settled solids will be considered.
Conversely, if it is determined that purging of the line is necessary for each controlled slurry line shut down, then the dredge and booster pumps will be required to pump a sufficient capacity of lake water through the dredge slurry line to the SCA to purge sediment solids. A means for confirmation that the line has been purged would be required and could consist of timed pumping at a known rate to vacate the line, visual confirmation that the flow is clear at the SCA, or a combination of alternatives. Minimizing the need to purge the dredge slurry line is desirable as this additional water would require treatment. Dredge slurry line purging and draining O&M procedures will also be necessary for dredge season shut down.
To monitor dredge slurry line wear, an O&M procedure may be adopted whereby sacrificial sections of the conveyance system line are cut out and inspected during the dredging off-season.
DRAFT ONONDAGA LAKEDREDGING, SEDIMENT MANAGEMENT, &
WATER TREATMENT INITIAL DESIGN SUBMITTAL
Parsons p:\honeywell -syr\444546 - operations\09 reports\initial design submittal\dredging ids.docm 2/3/2009
4-35
If significant wear is noted, additional investigations would be implemented. Collecting wear patterns information would also assist in predicting preventive O&M pipe replacement.
In order to maintain an approximate 70% average dredge time efficiency, avoidance or minimization of down time will be necessary for all phases of sediment dredging and dredge slurry transport to the SCA for dewatering and water treatment. In addition to a thorough written O&M Plan and scheduled implementation for routine maintenance, additional safeguards will be in place. For the dredge, booster pumps and other mechanical system apparatus, an inventory of known wear and susceptible spare parts and long lead time items and necessary tools will be identified, and readily available. In some instances, it may be beneficial to maintain an extra process component (e.g., booster pump) onsite to minimize downtime associated with down equipment. The need for such redundancies will be assessed further as part of the final design. In addition, trained mechanics will be available during all dredging operations to monitor, maintain, and implement these repairs.
For the slurry pipe line, routine visual inspection will be maintained throughout the project. Valves and appurtenances, lengths of replacement pipe, pipe fittings, spare valves and installation equipment will be held in inventory on site during dredging operations and covered under the O&M Plan. Again, trained personnel and equipment necessary to replace and install these items will be on site during dredging operations. Items to be addressed in the O&M Plan and built into the dredge slurry line to trouble shoot and prevent prolonged down time and invasive repairs for potential line blockage will include the provision of line cleanouts. These cleanouts will be installed at specified distances between one another or a booster pump to allow line access through a flanged wye connection for the insertion of a sewer jet to breakup any obstructions. Some noted and additional examples of O&M considerations include:
• dredge slurry line access for planned and unplanned maintenance (e.g. access wyes at specified distances for jetting out obstructions);
• pressure gauges along the slurry line for monitoring flow conditions (e.g. unexpected drop in a downstream gauge could indicate line blockage);
• dredge slurry line isolation valves;
• booster pump (bypass) piping and valve placements (e.g. for pump maintenance, replacement in active line);
• pressure gauges at booster pump intakes and discharges for monitoring performance and wear;
• booster pump power needs (diesel, electric);
• booster pump mechanical or seal water requirements;
• spill containment plan at booster locations;
• dredge slurry line and booster pump access road(s); and
• remote control requirements.

DRAFT ONONDAGA LAKEDREDGING, SEDIMENT MANAGEMENT, &
WATER TREATMENT INITIAL DESIGN SUBMITTAL
Parsons p:\honeywell -syr\444546 - operations\09 reports\initial design submittal\dredging ids.docm 2/3/2009
4-36
Additional O&M criteria and considerations, in addition to those listed above, will be addressed in the Final Design Submittal.
4.5 DREDGED SEDIMENT DEWATERING
The dredged sediment will be pumped as a slurry via pipeline to the SCA located at Settling Basin 13. The dredged sediment will undergo dewatering processes, and the recovered water will be captured and directed to the Honeywell Water Treatment Plant (WTP). The selection of geotextile tubes as the overall dewatering approach is documented in the SCA Dewatering Evaluation (Parsons, 2008).
4.5.1 Design and Performance Criteria
Project requirements applicable to many aspects of the operational design, including dewatering, are detailed in Section 2.2. Design and performance criteria specific to dredged sediment dewatering include:
• The slurry conditioning and dewatering system will handle the anticipated flow from the dredge. For preliminary evaluation purposes, this was estimated in Section 4.1.6 to be 4,800 gpm during flowing conditions based on the assumed dredge volume of 1,900,000 CY. For an assumed 70% average up time over 24 hours, the estimated average daily slurry flow is 4.8 mgd. For an assumed 100% up time over 24 hours, the estimated daily slurry flow is 6.9 mgd.
• The dewatering system will provide effluent to the WTP at a rate not greater than 6.5 mgd.
• The dewatering system will retain the dredged sediment within geotextile tubes and dewater the retained sediment to a solids content that will allow the tubes to be stacked and covered in place within the SCA.
• The dewatering operational area (i.e., working footprint) will be optimized and controlled to minimize the amount of contact water generated through precipitation.
• The potential for odors and emissions from the dewatering system will be controlled by minimizing the open area of active geotextile tubes and the volume of free water, and by implementing other measures, as detailed in Section 4.8.
4.5.2 Completed Design-Related Investigation Activities
Bench-scale and laboratory geotechnical testing were performed as part of the Phase I, II, and III PDIs to obtain information required for design of the dredged sediment dewatering processes. The detailed procedures used in these testing efforts are provided in the Phase I PDI Work Plan (Parsons, 2005), Phase II PDI Work Plan (Parsons and O’Brien & Gere, 2006), and Phase III PDI Work Plan – Addendum 1 (Parsons, 2007).
During the Phase I and II PDIs, column settling tests and column consolidation tests were performed by Geotesting Express in Boxborough, Massachusetts, on multiple sediment samples to assess the feasibility of using open settling basins to dewater the Onondaga lake sediment slurry. Specifically, these tests were performed to evaluate the sedimentation and consolidation
DRAFT ONONDAGA LAKEDREDGING, SEDIMENT MANAGEMENT, &
WATER TREATMENT INITIAL DESIGN SUBMITTAL
Parsons p:\honeywell -syr\444546 - operations\09 reports\initial design submittal\dredging ids.docm 2/3/2009
4-37
behaviors of the slurry. In most of the column settling tests, a distinct interface formed between the settled slurry and the supernatant water indicating zone settling behavior. In addition, the supernatant appeared to be relatively clear. The detailed test results are provided in the Phase I and II Summary Reports (Parsons, 2007; Parsons, 2008).
During the Phase III PDI, hanging bag geotextile tube dewatering tests were performed on sediment samples from Remediation Areas D and E by Waste Stream Technology, Inc. (WST) in Buffalo, New York. The detailed test results are provided in the Phase III Summary Report (Parsons, 2008). In general, the test results indicated that the use of geotextile tubes is feasible for dewatering the Onondaga Lake sediment. Because of filtrate quality, dewatering rates, and dewatered sediment solids content and consistency observed during testing, injection of a coagulant into the slurry prior to discharge into the tubes will likely be required to enhance dewatering.
In addition to the above, during the first three PDI phases, index testing (including grain-size analysis) was performed on samples representative of the sediment to be dredged. These results are summarized in Section 3.3 and indicated that 14-39% of the dredged sediment would consist of sand-sized particles. Appropriate standards were followed during this index testing, which likely resulted in the breaking up of some of the agglomerations of the crusty ILWD material, though not necessarily all. The percentage of these agglomerations broken up by the dredging process would likely be different, which could slightly alter the percentages of sand-sized particles realized during the dredging process. Further evaluations of the sand-sized particle content and the fate of the crusty agglomerations will be further evaluated during later stages of the design.
4.5.3 Dewatering Baseline Operational Scenario Description
A process flow diagram showing the dewatering baseline operational scenario is provided in Figure 4.1 and discussed in more detail in the following subsections. Based on physical characteristics of the sediment described in Section 3.3, PDI results described in the previous section, and information from similar dredging projects, it is anticipated that dredged sediment received at the SCA will be, on average, approximately 10% solids by weight and will require conditioning prior to discharge into the geotextile tubes for final dewatering. The baseline operational scenario presented herein was developed with a potential dredged slurry conditioning system that includes gravel and sand-size particle removal, flocculant addition, gravity thickening, and coagulant addition prior to geotextile tube dewatering. Additional bench-scale testing is currently in progress as part of the Phase IV PDI Work Plan – Addendum 6 (Parsons, 2008) to obtain additional data for design. The actual conditioning process utilized during the remedy implementation will be developed using these bench-scale test results. Details of the finalized dewatering system will be provided in the Operations Final Design.
4.5.3.1 Gravel-Size Particle Removal
Due to the distance and hydraulic conditions of the dredged slurry transport from the lake to the SCA, the baseline operational scenario assumes that the dredged slurry will be screened at the shoreline to remove oversize materials (i.e., particles greater than 2 to 4 inches) prior to transport. It was also assumed that as part of the baseline dewatering system a second screening
DRAFT ONONDAGA LAKEDREDGING, SEDIMENT MANAGEMENT, &
WATER TREATMENT INITIAL DESIGN SUBMITTAL
Parsons p:\honeywell -syr\444546 - operations\09 reports\initial design submittal\dredging ids.docm 2/3/2009
4-38
process will occur at the SCA prior to sand-size particle removal to remove gravel-size particles (i.e., particles between 0.25 and 2 to 4 inches) through the use of vibrating screens.
4.5.3.2 Sand-Size Particle Removal
To facilitate even distribution of sediment within the geotextile tubes and reduce the overall amount of flocculant/coagulant addition and number of geotextile tubes required for dewatering, the baseline operational scenario assumed that sand-sized particles (i.e., particles greater than the #200 sieve) would be removed from the slurry prior to thickening and discharge into the geotextile tubes, and this removal would be achieved through the use of a hydrocyclone system. Currently, the hydrocyclone is anticipated to be located at the SCA. The hydrocyclone system was assumed due to its effectiveness in sand separation, its general acceptance in the dewatering industry, and the availability of equipment to handle the anticipated flows.
In the dewatering baseline operational scenario assumed herein, the dredged slurry (after gravel-size particle removal) would be pumped at a constant rate to an inlet port in the hydrocyclone(s). The hydrocyclone, which uses centrifugal forces to remove solid particles from the slurry based on particle size and/or density, would be designed to effectively remove sand-sized particles (i.e., particles greater than #200 sieve) from the slurry. The reject material (i.e., sand-sized particles removed from the slurry) would be discharged from the bottom of the cone and would drop directly onto a linear motion vibrating #200 screen to further separate the solids from any remaining free liquid. The fine-grained slurry containing less than #200 sieve material would be discharged from the system into a post-hydrocyclone equalization tank (if needed), as indicated on Figure 4.1.
The solids removed by the hydrocyclone process would be stockpiled in a designated containment area within the SCA. This material will be considered for potential beneficial reuse as cover for the geotextile tubes prior to placement of the SCA final cover. The SCA closure, including potential incorporation of this material, will be discussed in the SCA Civil Design.
Based on experience with similar applications, it is anticipated that a hydrocyclone system could remove in the range of 75% to 85% of the sand-sized particles from the dredged slurry. Hydrocyclone testing will be conducted during the Phase IV PDI to determine the efficiency of this type of separation with actual lake sediments. Based on the results of these bench tests, the use of hydrocyclones will be evaluated during subsequent design activities to determine if they are an efficient and viable method for removing sand-sized particles. Since the operational efficiency of the hydrocyclone system depends on cone diameter and an adjustable aperture size, future design activities would focus on these parameters.
4.5.3.3 Gravity Thickening
To increase the solids concentration in the slurry, which will reduce the volume of dredge water entering the tubes, gravity thickening has been included in the dewatering baseline operational scenario. As discussed in Section 4.8, minimizing the amount of water draining from the geotextile tubes is an important consideration in odor mitigation for the SCA operations. In addition, increasing the solids concentration of the slurry would also potentially enhance the dewatering process by decreasing the amount of time required for geotextile tube dewatering.
DRAFT ONONDAGA LAKEDREDGING, SEDIMENT MANAGEMENT, &
WATER TREATMENT INITIAL DESIGN SUBMITTAL
Parsons p:\honeywell -syr\444546 - operations\09 reports\initial design submittal\dredging ids.docm 2/3/2009
4-39
As discussed previously, the CST results from the Phase I and II PDI testing indicate the slurry exhibits zone settling behavior and produces a relatively clear supernatant. Also, during the Phase III PDI jar testing, flocculant addition appeared to improve the settling characteristics of the slurry solids, which indicates that addition of flocculant to the fine-grained slurry would likely enhance thickening (i.e., allow for optimization of gravity thickener size and retention time). Therefore, the baseline operational scenario includes flocculant addition, as shown in Figure 4.1.
An automated flocculant injection control system will adjust the dosage based on flow rate, density, and streaming current (i.e., charge) measurements of the slurry. Adding a flocculant dosage that would achieve a zero charge slurry would likely be a goal of the injection system in an effort to prevent overdosing or underdosing. After in-line mixing, the fine-grained slurry (with flocculant) would be discharged into a gravity thickener of the type typically used in high solids content slurry applications. If necessary, the thickened slurry (i.e., underflow) could then be directed to an equalization tank prior to discharge to the geotextile tubes for final dewatering. The supernatant from the gravity thickening process would be pumped through an oil/water separator and directly to the dewatering effluent holding/equalization basin prior to discharge to the Honeywell WTP. Details regarding the dewatering system effluent are provided in Section 4.5.4.
To evaluate the effectiveness of gravity thickening and to determine whether or not gravity thickening will be included in the final process design, bench-scale testing, as detailed in the Phase IV PDI Work Plan – Addendum 6 (Parsons, 2008), will be performed. The bench-scale testing will also identify a potential flocculant (if needed) and flocculant dosage rate, as well as provide a range of anticipated solids concentrations for the slurry following the thickening process. Results from the test, if appropriate, may also be used to size the gravity thickeners. An assessment will be completed on the practicality of the sized thickeners determined necessary. If determined to be practical, future design activities would focus on the sizing of the inlet and thickened slurry removal components.
4.5.3.4 Geotextile Tubes
Geotextile tubes were selected as the preferred method for dewatering the 1,900,000 CY of dredged sediment based on the SCA Dewatering Evaluation (Parsons, 2009) that compared settling basins and geotextile tubes. Since both methods were considered feasible based on bench-scale testing performed during Phases I, II, and III of the PDI (as described in Section 4.5.2), case study reviews, a comparative analysis of each technology’s ability to meet established objectives, and a cost comparison were also performed as part of the evaluation. The following ten site-specific dewatering objectives were developed as a basis for the comparative analysis of the methods:
• Objective 1 - protect the public and wildlife during SCA operations;
• Objective 2 - facilitate efficient emissions and odor management;
• Objective 3 - protect workers during SCA operations;
• Objective 4 - maintain geotechnical stability and SCA liner system integrity;
DRAFT ONONDAGA LAKEDREDGING, SEDIMENT MANAGEMENT, &
WATER TREATMENT INITIAL DESIGN SUBMITTAL
Parsons p:\honeywell -syr\444546 - operations\09 reports\initial design submittal\dredging ids.docm 2/3/2009
4-40
• Objective 5 - meet operations requirements;
• Objective 6 - select a method acceptable to the public;
• Objective 7 - meet cell closure requirements;
• Objective 8 - minimize dewatering area;
• Objective 9 - enhance the water treatment process; and
• Objective 10 - minimize imported material quantities.
This evaluation indicated that, although higher in cost, geotextile tubes were considered to be more effective than settling basins at meeting Objectives 1, 2, 4, 6, and 10, particularly in their ability to mitigate offsite odor potential (i.e., Objective 2). Based on these results, geotextile tubes were selected as the preferred dewatering method.
Based on Phase III PDI test results, it is anticipated that coagulant would be injected into the thickened slurry prior to entering the geotextile tubes; therefore, it is included as part of the baseline operational scenario, as shown in Figure 4.1. The purpose of the coagulant would be to enhance liquid/solid separation and to increase the capture rate of the solids in the geotextile tubes. As with the flocculant, the coagulant injection control system would use flow rate, density, and streaming current (i.e., charge) measurements of the slurry to adjust the coagulant dosage. After coagulant addition and mixing, the thickened slurry would be pumped into the geotextile tubes via a header system. The header system will be designed to simultaneously fill multiple tubes. More design details regarding the header system will be provided in the Final Design Submittal.
Based on the required dredge rate, total sediment volume, and experience with similar applications, it is anticipated that geotextile tubes approximately 80 to 90 ft in circumference with a maximum length of 300 ft will be used. The tubes will be arranged in a series of rows and columns to most effectively use the SCA and meet loading restrictions. As stated in the performance criteria, the open area will be minimized to reduce contact water generation. For stability, stacked geotextile tubes will be approximately 30 ft shorter in total length than the tubes in the layer below. Stacked tubes will be deployed in the same direction as the underlying tubes and will straddle two tubes beneath it to increase stability. It is anticipated that the SCA will be less than 100 acres with a maximum height of approximately 30 ft.
The filtrate from the tubes, along with precipitation contacting the active dewatering area, will be conveyed from the gravel underdrain within the lined SCA through an oil/water separator to the dewatering effluent holding/equalization basin. As necessary during operations, the tubes will be covered to mitigate potential odors and volatile emissions. The design of the SCA gravel underdrain system and loading restrictions associated with filling and stacking the tubes will be presented in the SCA Civil and Geotechnical IDS.
The results of jar testing combined with bench-scale geotextile tube tests to be performed as part of the Phase IV PDI will be used to further evaluate a potential coagulant and coagulant dosage rate. The results of this testing will also provide an indication of the appropriate loading rate for the geotextile tubes.
DRAFT ONONDAGA LAKEDREDGING, SEDIMENT MANAGEMENT, &
WATER TREATMENT INITIAL DESIGN SUBMITTAL
Parsons p:\honeywell -syr\444546 - operations\09 reports\initial design submittal\dredging ids.docm 2/3/2009
4-41
4.5.4 Dewatering Effluent Holding/Equalization Basin
Supernatant from the gravity thickener, filtrate from the geotextile tubes, and precipitation/ stormwater runon that enters the gravel underdrain of the active dewatering area will be conveyed through an oil/water separator to a dewatering effluent holding/equalization basin prior to discharge to the WTP. Appendix G provides assumptions and preliminary calculations of the anticipated maximum flows from each of these components. Per these calculations, it is estimated that approximately half of the water volume in the slurry is removed in the thickener, with an additional 25% removed during initial dewatering in the geotextile tubes (i.e., within 24 hours). Although the flow rate reduces dramatically after 24 hours, it is conservatively assumed that filtrate will continue to be released for up to 60 days. Therefore, even when the dredge is shut down, the flow of filtrate to the dewatering effluent holding/equalization basin will continue.
As stated previously, the maximum amount of effluent (i.e., supernatant and filtrate, including precipitation and stormwater runon) that will be sent to the WTP is 6.5 mgd. As discussed in Section 4.6, during normal operations, it is anticipated that the WTP treated effluent will be discharged to Metro. However, during storm events, discharge to Metro may be shut down for a couple of hours to as much as a week. Therefore, a WTP may be directed to the effluent holding basin for water storage to provide dredge operation flexibility.
The combined water storage requirement for the dewatering effluent holding/equalization basin and WTP effluent basin was evaluated first. To evaluate this requirement, a design case water storage scenario was developed and analyzed.
This preliminary evaluation is presented in Appendix G and indicates that approximately 12 million gallons of storage capacity is required to meet this potential design case. For purposes of the preliminary basin sizing presented herein, it was assumed that this storage capacity would be split evenly between downstream and upstream of the WTP. Under this assumption, the dewatering effluent holding/equalization basin and the WTP effluent basin would each be 6 million gallons. The actual size of each basin will be determined as part of the Final Design. Additional details regarding the WTP effluent basin are provided in Section 4.6.
In addition to meeting the above requirement, the 6 million gallon dewatering effluent holding/equalization basin would provide flexibility in terms of dredging operations during WTP scheduled and unscheduled maintenance. Specifically, this basin would be able to hold approximately one day of dewatering system effluent (i.e., approximately 5.9 mgd) and a yet-to-be determined minimum water volume that is required in the basin during operations to provide flow normalization prior to water treatment.
The dewatering effluent holding/equalization basin would also provide sufficient capacity to normalize flows during the winter shutdown period.
Preliminary sizing indicates the average flow during winter shutdown would be approximately 115 gpm. The details of this calculation are provided in Appendix G. Based on this preliminary analysis, 150 gpm is considered a reasonable maximum flow rate for the winter pre-treatment system.
DRAFT ONONDAGA LAKEDREDGING, SEDIMENT MANAGEMENT, &
WATER TREATMENT INITIAL DESIGN SUBMITTAL
Parsons p:\honeywell -syr\444546 - operations\09 reports\initial design submittal\dredging ids.docm 2/3/2009
4-42
Currently, it is anticipated that the dewatering effluent holding/equalization basin would consist of one or two cells. Because of potential odors, the basin would be covered, if necessary. The Final Design Submittal will further refine the required storage capacity of the dewatering effluent holding/equalization basin based on revised flow rates and siting considerations for both this basin and the WTP effluent basin.
4.5.5 Data Gaps
As indicated above, bench-scale testing is currently in progress as part of the Phase IV PDI Work Plan – Addendum 6 (Parsons, 2008) to address data gaps associated with the information required for sediment dewatering system design. The objectives of this testing are as follows:
• Obtain data to facilitate evaluation and potential design of sand-size particle removal.
• Obtain data on slurry settling behavior from settling columns that can be used to evaluate and potentially design full-scale gravity thickener operations. This will include evaluation of the effectiveness of flocculants to enhance thickening and settlement.
• Obtain data to facilitate the design of the geotextile tube dewatering process. This will include testing of several coagulants.
4.5.6 Operations and Maintenance
O&M of the dewatering system will be required throughout project performance. More specific design O&M requirements will be provided in the Final Design Submittal as the system components are defined, the equipment layout is developed, and power and ancillary support needs are established. For example, it is anticipated that startup, shutdown, winterization, and quality assurance/quality control procedures will be developed for each dewatering system component.
4.6 WATER TREATMENT
The WTP will provide treatment of the SCA effluent. The ROD (NYSDEC and USEPA, 2005) specified treatment of the SCA effluent to meet NYSDEC permitted levels including compliance with the existing ammonia and phosphorus total maximum daily loads (TMDL) prior to being returned to the Lake. Compliance with the TMDL for ammonia is a critical driver for the water treatment system.
The TMDLs have also driven significant investments in Metro, including the construction of enhanced ammonia and phosphorus removal systems. These new facilities have been in service since 2004/2005, have demonstrated excellent performance, and have capacity to accept additional loads. As a result, the technical feasibility of treating the SCA effluent and discharging to Metro for enhanced ammonia removal was evaluated. The results of the evaluation indicate that it is feasible to discharge the treated SCA effluent to Metro for ammonia removal without disrupting the current and projected operations. This option will be pursued during subsequent design activities.
DRAFT ONONDAGA LAKEDREDGING, SEDIMENT MANAGEMENT, &
WATER TREATMENT INITIAL DESIGN SUBMITTAL
Parsons p:\honeywell -syr\444546 - operations\09 reports\initial design submittal\dredging ids.docm 2/3/2009
4-43
For purposes of this IDS, it is anticipated that the WTP effluent will be discharged to Metro for ammonia removal. The proposed treatment system will incorporate the Available Treatment Technologies identified in the ROD. With the exception of ammonia, the WTP effluent will be capable of meeting the draft surface water discharge limits specified by NYSDEC. This section summarizes the performance criteria for the WTP, presents the interpretation of the bench scale water treatability testing, and identifies a technically feasible water treatment system.
4.6.1 Design and Performance Criteria
High-level project requirements applicable to multiple aspects of the operational design, including water treatment, are detailed in Section 2.2. Design and performance criteria specific to water treatment include:
• Treatment of the SCA effluent (i.e. thickener supernatant, geotextile tube filtrate, and precipitation/stormwater runon) will include pH adjustment and removal of metals, solids, and VOCs.
• The WTP will have capacity to operate at a rate of 6.5 MGD during dredge operations. The water treatment system must also include provisions to manage significantly lower flow rates that will occur in the off-season when the dredge operations are discontinued due to weather.
• The potential for odors and emissions from the water treatment system will be managed as detailed in Section 4.8.
Design flow rates, projected influent characteristics and Metro permitted effluent criteria are discussed below.
4.6.1.1 Design Flow Rates
As discussed in Section 4.5.4, the combined influent flow rate is expected to range from a minimum flow of 0.22 mgd (150 gpm) during winter shutdown to a maximum flow of 6.5 mgd during dredging operations during the months of April through November. Once the dredging has ultimately been completed and the SCA capped, there will be a long-term low flow of leachate generated by the SCA. This flow will be estimated as part of the Final Design Submittal following additional geotextile tube bench tests.
Additional information is required to further refine these flow rate estimates and will be developed during future design activities and actual operating experience. To this end, the WTP will be designed with modularity to accommodate expansion and contraction as the influent flow increases and decreases.
4.6.1.2 Projected WTP Influent/Effluent Characteristics
Projected influent and effluent water quality characteristics for the proposed WTP, included as Table 4.5, are based on the sampling and analytical characterization completed during the Honeywell Phase II PDI – SCA Supernatant Treatability Testing (OBG, 2008). The influent characteristics presented in Table 4.5 represent the range of concentrations expected based on effluent elutriate testing (EET) of settled supernatant from blended lake water and sediment from
DRAFT ONONDAGA LAKEDREDGING, SEDIMENT MANAGEMENT, &
WATER TREATMENT INITIAL DESIGN SUBMITTAL
Parsons p:\honeywell -syr\444546 - operations\09 reports\initial design submittal\dredging ids.docm 2/3/2009
4-44
SMUs 1, 4, 6, and 7. The influent concentrations may be modified based on the results of the supplemental treatability testing to be performed.
Supplemental treatability testing is being performed to more accurately simulate the anticipated dredge treatment and dewatering processes and the resulting influent sources to the WTP. As this data becomes available, the influent criteria may be revised to reflect the results of the additional characterization and testing.
A mass balance will be developed as part of the Final Design Submittal. The mass balance will track the projected concentrations and loadings through the treatment process for the constituents identified in Table 4.5. The mass balance will be developed using results of the supplemental treatability testing, general engineering design guidelines, and typical removal efficiencies for given unit operations.
4.6.2 Design Approach
The WTP will operate over a large influent flow range for four years, from 2012 through 2015, when actively dredging the lake. To accommodate expansion/contraction as the influent flow rate increases/decreases over these four years, the WTP will be designed using commercially available skid-mounted treatment units that will be brought on and offline as required by the influent flow rate. The number of skids and size of treatment units will be dictated by what is commercially available.
The WTP, with a maximum capacity of 6.5 mgd, will be installed outside since it is anticipated that this system would only operate during the spring, summer, and fall months. Details regarding management of the low winter influent flow will be addressed in subsequent design submittals.
Similar to winter operation, once the dredging is completed in 2015, the influent flow will decrease to an ongoing low flow comprised of leachate. Management of this long-term leachate will be addressed in subsequent design submittals.
Since the WTP will only be required for four years, while actively dredging, a field office trailer will be considered for use as office and control room facilities for the WTP. Similarly, temporary modular units such as Mod-u-Tanks will be considered for the tankage. Rental of treatment units is also an option. Performance-based specifications will be used to specify the treatment system allowing consideration of these options.
4.6.3 Water Treatability Testing
The following sections summarize the water treatability testing completed, interpret the results to develop a recommended treatment train and identify data gaps, and present the proposed supplemental treatability testing.
4.6.3.1 Treatability Testing Completed
As part of the overall testing, O’Brien & Gere conducted the following preliminary treatability testing on the settled supernatant. Testing was conducted in two phases. Phase I

DRAFT ONONDAGA LAKEDREDGING, SEDIMENT MANAGEMENT, &
WATER TREATMENT INITIAL DESIGN SUBMITTAL
Parsons p:\honeywell -syr\444546 - operations\09 reports\initial design submittal\dredging ids.docm 2/3/2009
4-45
testing was conducted to provide screening-level evaluations of treatment technologies to select technically and economically feasible options. Phase I treatability testing utilized SMU 1 because it was identified as ‘worst case’ and heavily impacted with a majority of constituents of concern.
The details of the Phase I testing are provided in the Honeywell SCA Supernatant Testing Report (Parsons, 2007). For the primary constituents of concern (mercury, organic compounds, and ammonia), the following unit operations were identified as potentially applicable:
• pH adjustment and chemical co-precipitation for mercury;
• activated carbon for organics; and
• air stripping and break-point chlorination for ammonia.
Phase II testing was conducted in order to confirm the findings of the Phase I SCA supernatant screening test, as applied to the other SMUs (1A and B, 4, 6, and 7), fill in data gaps, and evaluate additional technologies identified to be potentially more technical or cost effective. Based on concern regarding potential elevated carbon usage, biological removal of organic compounds was evaluated. Likewise, biological treatment was also considered ammonia, since elevated chemical usage was predicted for break-point chlorination during Phase I testing.
In addition, the testing developed EET procedures to develop a better understanding of potential treatment system influent characterization.
The details of the Phase II testing are provided in the Honeywell Phase II Pre-Design Investigation – SCA Supernatant Treatability Testing (O’Brien & Gere, 2008). For the primary constituents of concerns (mercury, organic compounds, and ammonia), the following conclusions were developed:
• Co-precipitation of mercury to below 200 ng/L was demonstrated.
• Multi-media filtration was recommended downstream of precipitation for full-scale operations, but was not required to meet the mercury discharge objective.
• Granular activated carbon (GAC) adsorption removed identified VOCs and SVOCs to below treatment objectives. Breakthrough of organics was not observed for the operating duration of 450 bed volumes. Therefore, longer duration bench-scale bed operations were recommended to confirm estimated carbon life and associated operating costs.
• Breakpoint chlorination was effective in meeting treatment objectives but may not be economically feasible.
The trickling filter testing reduced ammonia, but not to the treatment objectives. The results of the trickling filter were not believed to be a technology limitation, rather, there were issues with establishing and acclimating the nitrifying bacteria to optimum levels during bench-scale testing.
DRAFT ONONDAGA LAKEDREDGING, SEDIMENT MANAGEMENT, &
WATER TREATMENT INITIAL DESIGN SUBMITTAL
Parsons p:\honeywell -syr\444546 - operations\09 reports\initial design submittal\dredging ids.docm 2/3/2009
4-46
4.6.3.2 Testing Conclusions
Phase I and II testing demonstrated that mercury and other metals of concern could be removed to below treatment objectives with chemical co-precipitation using alum at a pH of 8.5 standard unites (S.U.) Due to the high affinity of mercury to particulate, subsequent to precipitation, macro-filtration (multimedia filtration) is suggested to remove any clarifier suspended solids carryover. As such, the following treatment strategy is recommended to address the metals/solids:
• pH adjustment to 8.5 S.U.;
• chemical co-precipitation with alum and polymer;
• gravity settling; and
• multimedia filtration.
Organics removal should be placed downstream of the metals/solids treatment. It is recommended that GAC adsorption be utilized for organics removal. Additionally, the GAC testing demonstrated dissolved-phase mercury removal capabilities. Therefore, the GAC will provide an additional level of treatment redundancy to remove dissolved-phase mercury, if necessary.
Based on the results of the Phase II testing, cost-benefit analysis of ammonia removal suggested that biological nitrification would be much more cost effective than chemical oxidation. This led the project team to explore other means of biological nitrification, and eventually identified an option to utilize the Biological Aerated Filters (BAFs) located at Metro for ammonia treatment.
4.6.3.3 Data Gaps
Since the completion of Phase II testing, the preferred method of sediment management was modified from an open-basin, gravity settling concept to collection and dewatering within geotextile tubes. As such, it has been assumed that the solids and organic constituents concentrations may be different than what was predicted for the open basin concept; therefore, different than the water used to conduct Phase I and II testing. Therefore, additional solids settling and GAC column testing will be performed to better characterize the influent concentrations to the WTP. This additional testing will be completed along with other supplemental testing described below, and results will be incorporated into the Final Design Submittal.
Additionally, since the geotextile tube will potentially utilize chemical additives (inorganic or polymeric flocculants), additional jar testing will be conducted to verify that selected chemical precipitation chemicals and the upstream geotextile tube dewatering additives do not impact dosages or chemical selection.
Therefore, based on these modifications and/or enhancements to the remediation program, it was decided to conduct additional supplemental testing to:
• complete data gaps related to nickel, molybdenum and silver (per Metro requests);
DRAFT ONONDAGA LAKEDREDGING, SEDIMENT MANAGEMENT, &
WATER TREATMENT INITIAL DESIGN SUBMITTAL
Parsons p:\honeywell -syr\444546 - operations\09 reports\initial design submittal\dredging ids.docm 2/3/2009
4-47
• quantify adsorptive capacity of GAC on removal of VOCs and SVOCs via long-term GAC column testing for both the settled supernatant and the geotextile tube filtrate; and
• quantify the settling velocity of the settled supernatant and geotextile tube filtrate.
This testing is ongoing. Results will be incorporated into the Final Design Submittal.
4.6.4 Conceptual Process Unit Description Based on the results of treatability testing conducted to date, the WTP may consist of the
following major unit operations, as shown on Figure 4.8:
• 2-stage pH adjustment;
• metals precipitation;
• filtration;
• granular activated carbon adsorption;
• effluent holding; and
• chemical storage/feed.
These unit operations have been identified based on demonstrated performance with respect to removal of the constituents of concern and the need for operational flexibility to manage variations in influent flow/characteristics. Commercially available process equipment will be selected for each of these major unit operations using performance-based specifications.
The following subsections summarize the unit operations proposed for the WTP.
pH Adjustment
Equalized water from the SCA will be conveyed to the pH adjust tanks using the influent feed pumps. Flow meters will monitor the influent flow rate and control the working influent feed pumps in order to maintain a continuous system flow rate. Shut down of the influent feed pumps will occur in the event of a low level in the SCA effluent EQ basin.
Each pH adjust tank will be provided with a constant-speed mixer and a level monitoring device. In the event of a low-low tank level condition, a redundant level switch will shut down the mixer. In the event of a high-high tank level condition, a redundant high-high level switch will shut down the influent feed pumps.
The pH adjust tanks will be monitored and controlled to maintain a pH setpoint of 8.5 via control of sulfuric acid and sodium hydroxide feed pumps. Treatability testing has indicated that the influent waters exhibit a pH of approximately 12.5 S.U. The tanks will be sized to provide approximately 15 to 30 minutes of contact time.
A constant level will be maintained within the pH adjust tanks via gravity flow to the flash mix tanks. The tanks will be covered to control odors.
DRAFT ONONDAGA LAKEDREDGING, SEDIMENT MANAGEMENT, &
WATER TREATMENT INITIAL DESIGN SUBMITTAL
Parsons p:\honeywell -syr\444546 - operations\09 reports\initial design submittal\dredging ids.docm 2/3/2009
4-48
Metals Precipitation
Following pH adjustment, the water will flow via gravity to the flash mix tanks. Solutions of aluminum sulfate (alum) and polymer will be added to the flash mix tanks. Each flash mix tank will be furnished with a constant speed mixer and will be sized to provide approximately 2 to 5 minutes of reaction time.
The water will enter a flocculation chamber via an underflow baffle. The flocculation chamber will be provided with a variable-speed mixer. A low-level condition will shut down both the flash mixer and the flocculating mixer.
After flocculation, the water will flow via gravity to the inclined plate clarifiers. Solids will settle to the bottom of a sloped chamber, provided with a sludge thickener. Thickened sludge will discharge to the sludge/backwash holding tank. Clarified effluent will discharge to the filter feed tank via gravity. A high-level device will be located within each clarifier and upon activation will de-energize the influent feed pumps.
The flash mix/flocculation chambers and the clarifiers will be covered to control odors.
Multimedia Filtration
The filter feed tank will be sized to provide approximately 15 minutes retention time. The tank will be provided with a level monitoring device. The filter feed pumps will discharge to the multimedia vessels and will be controlled to maintain a constant level in the filter feed tank. A redundant low-level switch will shut down the filter feed pumps. A redundant high-level switch will disable the influent feed pumps.
Multimedia filters will be used to remove residual suspended solids and will be sized to provide a filtration rate of approximately 4 to 6 gpm/sf. Differential pressure across the filter media will be monitored. The differential pressure will increase as the removed solids accumulate on filter media. Backwashing with treated effluent will be used to remove accumulated solids. Automatic backwashing of the filters will be initiated at predetermined runtime intervals. Spent backwash waters will discharge to the sludge/backwash holding tank.
Granular Activated Carbon System
Multiple GAC vessels will be provided for removal of VOCs. Each pair of GAC vessels will be operated in series. A piping/valving manifold will allow for either vessel to serve as the “lead” or “lag” unit. Manual sample valves will be installed at the discharge of each vessel. Once exhaustion of the carbon is observed at the discharge of the lead unit, the flow will be diverted to a pair of standby GAC vessels. An outside contractor will replace the spent carbon in the lead unit. Manual valving will be arranged to switch the lead and lag vessels.
Differential pressure across the GAC media will be monitored. The differential pressure will increase as solids accumulate in the GAC media. Backwashing with treated effluent will be used to remove the accumulated solids. Automatic backwashing of the GACs will be initiated at
DRAFT ONONDAGA LAKEDREDGING, SEDIMENT MANAGEMENT, &
WATER TREATMENT INITIAL DESIGN SUBMITTAL
Parsons p:\honeywell -syr\444546 - operations\09 reports\initial design submittal\dredging ids.docm 2/3/2009
4-49
predetermined runtime intervals. Spent backwash waters will discharge to the sludge/backwash holding tank.
Effluent Monitoring Tank
Treated effluent will discharge to an effluent monitoring tank. The effluent monitoring tank will be sized to provide sufficient volume to simultaneously backwash one multimedia filter and two GACs while still allowing forward flow of treated effluent. Effluent in the tank will be monitored weekly for total toxic organics (TTO), ammonia, and total Kjeldahl nitrogen (TKN) in accordance with the County Industrial Waste Discharge Permit. The level of metals, 5-day biochemical oxygen demand (BOD5), TSS, phosphorus, and total phenolic compounds in the effluent will be monitored monthly in accordance with the IWD permit. Out-of-spec water will be recycled back to the SCA effluent equalization basins by the effluent recycle pump.
A portion of the treated effluent in the tank will be reused for backwashing the multimedia filters and the GACs. Backwash water will be transferred from the effluent monitoring tank to the multimedia filters and GACs by dedicated backwash supply pumps. Timers will automatically control the backwash supply pumps. Backwashing operations are described above.
A portion of the treated effluent will also be reused as polymer makedown water for the sediment preconditioning/dewatering system and the WTP. Polymer makedown water will be transferred from the effluent monitoring tank to the sediment preconditioning/dewatering system and the WTP flocculant system by dedicated pumps.
A level-monitoring device will be installed in the effluent monitoring tank. In the event of a low-low tank level condition, a redundant level switch will shut down the multimedia and GAC backwash pumps, polymer makedown water pumps, and the effluent recycle pump. A redundant high-high level switch will disable the influent feed pumps. The tank will not be covered.
Effluent Holding Basin
An effluent holding basin will be provided to facilitate short term shutdown of the effluent discharge. Assuming the WTP effluent is discharged to Metro for ammonia removal, the discharge will need to be discontinued during periods when Metro is experiencing wet weather, high flow conditions. High flow periods are events that could trigger a bypass of Metro’s secondary treatment system that occurs when Metro flow exceeds 126.3 mgd.
A statistical analysis was performed to evaluate the frequency and duration of wet weather events that result in Metro flow exceeding 126.3 mgd and is included as Appendix H. Based on the analysis, an average of 32 events are expected each dredge season, April through November, with a typical event lasting an average of two days. A 95% confidence level indicated that no more than 37 events are expected each dredge season. Of these 37 events, 22 events are expected to last less than one day. Therefore, only 15 events are expected to last one day or more.
DRAFT ONONDAGA LAKEDREDGING, SEDIMENT MANAGEMENT, &
WATER TREATMENT INITIAL DESIGN SUBMITTAL
Parsons p:\honeywell -syr\444546 - operations\09 reports\initial design submittal\dredging ids.docm 2/3/2009
4-50
Providing an effluent holding capacity of one day, it is estimated that the dredge will need to shutdown for approximately 15 events that will exceed the one-day effluent holding capacity. The shutdown duration will range from 1 to 6 days, resulting in an estimated 17 to 32 days of dredge shutdown during the April - November period.
As discussed in Section 4.5.4, for preliminary evaluation purposes, it is assumed that the effluent holding basin for the WTP will have a capacity of approximately 6 MG that is consistent with the estimated maximum influent flow of 6.5 mgd. Providing a holding capacity of one day of flow will reduce the incident of shutdown of dredging operations. After one day, the dredging operations will need to be curtailed until Metro flow is reduced below 126 mgd.
During normal operation the effluent holding basin will be off-line and empty. During shutdown of the effluent discharge, treated effluent will be diverted to the holding basin. A level-monitoring device will be installed in the effluent holding basin. A redundant high-high level switch will disable the influent feed pumps. The basin will not be covered.
Chemical Storage/Feed
A shared bulk chemical delivery area will be provided. The delivery area will include a truck parking area with secondary containment. Dedicated fill lines will be provided for each chemical (sodium hydroxide, sulfuric acid, and aluminum sulfate). Fill panels will indicate tank levels. Tank high level alarms and/or lights will be provided. Tanks will be installed to provide a one-week storage capacity for each chemical.
Sulfuric Acid
Two 6,000-gallon bulk storage tanks will be provided for 93 to 95% sulfuric acid (H2SO4). The tanks will be vented to the atmosphere through a desiccant filter. Tank level will be continuously monitored. A redundant high-high level switch will be provided.
Chemical feed pumps will discharge H2SO4 to the pH adjust tanks. The pumps will be turned on/off and speed controlled by a pH controller to an approximate pH of 8.5 S.U. Flush valves will be provided at the suction and discharge of each pump. Each pump will be provided with backpressure and pressure relief valves.
One shared calibration cylinder will be provided for the H2SO4 pumps. The operator will fill the calibration cylinder via gravity. Manual valving will be arranged to allow the selected pump to draw from the calibration cylinder. The operator will use a stopwatch to determine the pump flow rate.
The tanks and chemical feed pumps will be located within a secondary containment area. A collection sump with a high level switch will be provided within the containment area. In the event of a spill, the operator will use a portable sump pump to evacuate the containment area.
The containment area will be covered with a roof to protect the tank from UV radiation and to limit rainwater accumulation within the area. The roof system will be constructed of non-
DRAFT ONONDAGA LAKEDREDGING, SEDIMENT MANAGEMENT, &
WATER TREATMENT INITIAL DESIGN SUBMITTAL
Parsons p:\honeywell -syr\444546 - operations\09 reports\initial design submittal\dredging ids.docm 2/3/2009
4-51
combustible materials in accordance with international fire codes. Appropriate setbacks to maintain the required distance to exposure will also be maintained in accordance with fire codes.
Sodium Hydroxide
Two 6,000-gallon bulk storage tanks will be provided for 50% sodium hydroxide (NaOH). The tanks will be vented to the atmosphere. Tank level will be continuously monitored. A redundant high-high level switch will be provided.
Chemical feed pumps will discharge NaOH to the pH adjust tanks. The pumps will be turned on/off and speed controlled by a pH controller. Flush valves will be provided at the suction and discharge of each pump. Each pump will be provided with backpressure and pressure relief valves. It is anticipated that these pumps will normally be idle. Typically, H2SO4 will be added to the pH adjust tanks to decrease the pH from approximately 12.5 to 8.5 S.U. The pump will be available to supply NaOH, in the event of a pH overshoot.
One shared calibration cylinder will be provided for the NaOH pumps. The operator will fill the calibration cylinder via gravity. Manual valving will be arranged to allow the selected pump to draw from the calibration cylinder. The operator will use a stopwatch to determine the pump flow rate.
The tanks and chemical feed pumps will be located within a secondary containment area. A collection sump with high level switch will be provided within the containment area. In the event of a spill, the operator will use a portable sump pump to evacuate the containment area.
Aluminum Sulfate
Two 4,000-gallon bulk storage tanks will be provided for 20% aluminum sulfate (alum). The tanks will be vented to the atmosphere. Tank level will be continuously monitored. A redundant high-high level switch will be provided.
Chemical feed pumps will discharge alum to the flash mix tanks, preceding the inclined plate clarifiers. The pumps will be turned on/off and speed controlled based on influent flow to the WTP. Flush valves will be provided at the suction and discharge of each pump. Each pump will be provided with backpressure and pressure relief valves.
One shared calibration cylinder will be provided for the alum pumps. The operator will fill the calibration cylinder via gravity. Manual valving will be arranged to allow the pump to draw from the calibration cylinder. The operator will use a stopwatch to determine the pump flow rate.
The tanks and chemical feed pumps will be located within a secondary containment area. A collection sump with high level switch will be provided within the containment area. In the event of a spill, the operator will use a portable sump pump to evacuate the containment area.
DRAFT ONONDAGA LAKEDREDGING, SEDIMENT MANAGEMENT, &
WATER TREATMENT INITIAL DESIGN SUBMITTAL
Parsons p:\honeywell -syr\444546 - operations\09 reports\initial design submittal\dredging ids.docm 2/3/2009
4-52
Anionic Polymer
Neat anionic polymer will be stored in 55-gallon drums. Polymer makedown systems will blend neat polymer with treatment plant effluent. Blended polymer solution will be discharged to the flash mix tanks of the inclined plate clarifiers. Polymer flow rate will be controlled as a function of the WTP influent flow rate. The neat polymer drum will be provided with a low-level switch/alarm. All polymer storage/feed equipment will be located within a curbed area for housekeeping purposes.
Residual Solids Handling
Thickened sludge from the inclined plate clarifiers and spent backwash water from the multimedia filters and GACs will discharge to the slurry preconditioning area as shown on Figure 4.8. The sludge and spent backwash water will be combined with the slurry and will be dewatered in the geotextile tubes. The dewatered solids will be retained in the geotextile tubes and will be covered in place within the SCA.
4.6.5 Infrastructure Requirements The following sections present the site development and utility requirements for the WTP.
Also discussed below are the requirements for the Operation, Maintenance and Monitoring and Contingency Plans that are to be developed at a later date.
4.6.5.1 Site Selection
The WTP is expected to encompass approximately 8 acres. Three sites were evaluated for the location of the WTP as shown on Figure 4.9. Site 1 is located south of the Leachate Retention Pond. Site 2 is located up on the settling basins adjacent to Settling Basin 13 where the SCA will be constructed and Site 3 is north of Settling Basin 13, just down the hill from the SCA.
Several criteria were considered during the evaluation of the 3 sites, including:
• ownership;
• available site area;
• access;
• site grades (and in relation to the SCA);
• distance from protected/regulated streams;
• distance from floodplains;
• distance from wetlands; and
• availability of utilities.
Site 1 is located on property owned exclusively by Honeywell. It is the largest site, 26 acres, and is adequate size to accommodate the WTP. The site is hydraulically downgradient of
DRAFT ONONDAGA LAKEDREDGING, SEDIMENT MANAGEMENT, &
WATER TREATMENT INITIAL DESIGN SUBMITTAL
Parsons p:\honeywell -syr\444546 - operations\09 reports\initial design submittal\dredging ids.docm 2/3/2009
4-53
the SCA, facilitating gravity flow to the WTP. It is easily accessible via Gerelock Road for deliveries of chemicals and carbon change outs. Utilities are available at Site 1.
Site 2 includes 19 acres of property owned by Honeywell, and is also sufficient size to accommodate the WTP. The site is accessible from the settling basin perimeter road and utilities will be available at the site when the SCA is constructed. While the location of Site 2 may exclude gravity flow from the SCA to the WTP, this site is directly adjacent to the SCA minimizing the length of piping required to convey influent to the WTP and to return solids generated by the WTP to the SCA.
Site 3 is comprised of three parcels with separate owners. The site is accessible from the settling basin perimeter road and facilitates gravity flow of water from the SCA to the WTP. Utilities are available at Site 3. However, the site is adjacent to a regulated trout stream, which may result in storm water management and permitting issues not present at Sites 1 and 2. Additionally, it is the smallest site, approximately 6 acres, and is not large enough to accommodate the WTP.
Floodplain boundaries, wetlands, and utilities do not appear to be discriminators between the sites. Based on the evaluation, Site 2 is the preferred site. However, subsurface soil investigations require further consideration.
4.6.5.2 Site Development
Anticipated site improvements for the WTP include the following:
• exterior process tanks, process equipment, and appurtenances on concrete foundation mats;
• chemical storage areas with secondary containment;
• containment area for truck unloading and loading;
• bituminous concrete access road;
• incoming potable and fire protection services;
• site grading;
• storm water management;
• telephone and electric service; and
• a new backflow preventer system for potable water.
4.6.5.3 Electrical Requirements
The anticipated electrical requirements for the WTP are summarized below.
• Power to the WTP will be supplied at 480 volts, 3 phase, 60 Hertz from a new electrical service. Service capacity is estimated to be 600 amps.
• Distribution equipment will consist of a motor control center, panelboards and low voltage transformers as necessary to power WTP loads. Equipment will be exterior
DRAFT ONONDAGA LAKEDREDGING, SEDIMENT MANAGEMENT, &
WATER TREATMENT INITIAL DESIGN SUBMITTAL
Parsons p:\honeywell -syr\444546 - operations\09 reports\initial design submittal\dredging ids.docm 2/3/2009
4-54
mounted in NEMA 3R or NEMA 4 enclosures. The power distribution system will be designed and constructed in accordance with the most current edition of the National Electrical Code.
• Hazardous areas in, and surrounding, process equipment will be classified in accordance with the National Electrical Code and NFPA 497.
• It is anticipated that cold weather operation of the process facilities will not be required. Electrical heat tracing of piping and equipment is, therefore, not included.
• Lighting will be pole mounted, photocell controlled metal halide type to provide general illumination throughout the site. Receptacles will be provided in the vicinity of all equipment to permit the use of portable task lighting in the event nighttime maintenance is required.
4.6.6 Operation, Maintenance and Monitoring Plan
An OM&M Plan will be prepared for the WTP. Assuming performance-based specifications will be used to specify the treatment system, the OM&M Plan may be developed and submitted by the selected contractor.
The OM&M Plan will provide instruction and guidance to the operator of the WTP. The Plan will include descriptions of the individual treatment processes and equipment associated with each process. The OM&M Plan will
• acquaint personnel with the capabilities of the treatment system;
• provide personnel with instructions for operation of the treatment system;
• provide details for routine maintenance of the process equipment; and
• serve as a guide for monitoring, recognizing problems and troubleshooting.
It is envisioned the OM&M Plan will include five sections: Introduction, Administration, Treatment Processes, Equipment, and Maintenance & Troubleshooting. The Introduction section will present the history, plan format, and purpose. The Administration section will provide information on topics other than the treatment processes and equipment such as health & safety, regulatory compliance, and record keeping. The Treatment Processes section will present process theory, basis of design, process operation, and equipment associated with process. The Equipment section will present each type of equipment and how it operates, start-up & commissioning information, and materials of construction. The Maintenance & Troubleshooting section will present the maintenance schedule and data collection procedure along with steps to be followed for troubleshooting each process and equipment. The OM&M Plan will be used along with the O&M manuals supplied by the various equipment manufacturers for the equipment and controls.
4.6.7 Contingency Plan
A Contingency Plan for the WTP will be prepared for the WTP. Assuming performance-based specifications will be used to specify the treatment system, the OM&M Plan may be developed and submitted by the selected contractor.
DRAFT ONONDAGA LAKEDREDGING, SEDIMENT MANAGEMENT, &
WATER TREATMENT INITIAL DESIGN SUBMITTAL
Parsons p:\honeywell -syr\444546 - operations\09 reports\initial design submittal\dredging ids.docm 2/3/2009
4-55
The Contingency Plan will provide instruction for operation/shut down of the WTP in the event of an emergency. In an emergency, the WTP can be temporarily shut down. It is anticipated that the dewatering effluent equalization basins will normally be operated at a relatively low liquid level. As such, substantial hydraulic capacity should be available. If the WTP train is temporarily idled, the lake dredging and dewatering system may continue to operate and discharge to the dewatering effluent equalization basins. Should the equalization capacity be exhausted, the dredging will be shut down for a temporary time period.
Examples of scenarios that may result in the WTP being temporarily shut down include:
• power failure;
• equipment failure;
• out-of-spec effluent; and
• no effluent discharge (full effluent holding basin).
4.7 UPLAND FACILITIES & LOCATIONS
4.7.1 Pipeline Route
4.7.1.1 Summary & Description
Following an evaluation of two main route options, which considered feasibility, protection of local community, potential impacts on worker health and safety, potential environment impacts, and use of non-Honeywell owned property, it was determined that a pipeline generally following Ninemile Creek would be the most viable, as discussed in Section 4.4. Additional information on alternative pipeline routes considered and the benefits of the preferred route is contained in Appendix E, “Pipelines Route Evaluation Memorandum”. Figure 4.6 presents the likely preferred slurry pipeline route.
During dredging from areas in the southeast part of the lake (Remediation Areas C, D, and E), the pipeline would run up the western shore of the lake, cross onto the western portion of the Settling Basins 1-8 site, and follow the I-690 corridor to mouth of Ninemile Creek. During dredging of areas A and B, the slurry may be routed directly to this point, as opposed to being pumped to Settling Basin B. For this stretch, the pipeline would be located on land. This portion of the pipeline route will require measures to cross beneath the 695 exit ramp off of the westbound I-690, and beneath the parking access road connecting the Fairgrounds parking area on Settling Basins 1-8 to the westbound lane of I-690. The final pipeline alignment for this stretch will be determined in conjunction with remedial plans and efforts being conducted at Settling Basins 1-8, and based on negotiations and agreements with property owners.
Once at Ninemile Creek, several creek crossings in this vicinity, including a rail bridge, State Fair Boulevard Bridge, and the State Fair Boulevard exit ramp off I-695, may complicate the placement of the pipeline onshore. For the purposes of this IDS Report, it is assumed that the pipeline would be installed as a floating pipeline along this stretch of Ninemile Creek. Coordination with the Ninemile Creek remediation will be necessary to ensure the location of the pipeline would not interfere with remedial activities associated with the cleanup of the creek.
DRAFT ONONDAGA LAKEDREDGING, SEDIMENT MANAGEMENT, &
WATER TREATMENT INITIAL DESIGN SUBMITTAL
Parsons p:\honeywell -syr\444546 - operations\09 reports\initial design submittal\dredging ids.docm 2/3/2009
4-56
Once past the State Fair Boulevard exit ramp off Route 695, the pipeline route crosses the creek, and follows along the Creek’s northern bank, adjacent to Settling Basins 9-11. Vegetation in this area is limited to shrubs and sporadic trees. The pipeline would be built along an existing gravel roadway between Settling Basins 9-11 and Ninemile Creek, or potentially along an existing bench which is cut into the bank of the settling basin.
At the southwest corner of Settling Basin 9, the pipeline would once again cross Ninemile Creek beneath an existing railroad bridge, and climb the hill up to Settling Basin 13. The length from the mouth of Ninemile Creek into Onondaga Lake at Settling Basins 1-8 to the SCA is approximately 15,000 ft (2.8 miles).
4.7.1.2 Property Ownership / Remedial Status
The remediation of Ninemile Creek will most likely be ongoing during the installation, and at least a portion of the operation, of the slurry pipeline. This interaction will require careful planning and coordination between the two remediation projects to take advantage of potential synergies, and to avoid potential conflicting efforts. Critical coordination points include bridge crossings, creek crossing points, and areas where the pipeline may need to be floated in the creek. Coordination between the Honeywell, NYSDEC, the design engineers, and the remedial contractors for these, and any other similar situations identified during the design process, will be critical to ensure both projects achieve their remedial objectives in an environmentally protective and cost effective manner.
The pipeline route as described above would cross the property of several non-Honeywell entities. Figure 4.6 presents the pipeline route, and the owners of the various properties over which the pipeline crosses. Approximately 10,000 ft of pipeline would pass through Honeywell owned property. Access would be needed to construct and operate the pipelines on a total of about 5,000 linear ft of property owned by the following entities:
• County of Onondaga;
• New York State Department of Transportation;
• Geddes Right of Way (ROW);
• Camillus ROW (minor); and
• Belle Isle Property (minor).
This distance does not include portions of the route prior to the mouth of Ninemile Creek. It would be anticipated that any planned use of the Settling Basins 1-8 site would be done so with access agreements in place from Onondaga County.
In anticipation of utilizing this route, Honeywell has begun discussions and negotiations to arrange access to the necessary properties.
4.7.1.3 Accessibility & Other Considerations
The Ninemile Creek pipeline route is generally very accessible along most stretches. Existing gravel access roads along the portions of the shoreline of Settling Basins 1-8, and
DRAFT ONONDAGA LAKEDREDGING, SEDIMENT MANAGEMENT, &
WATER TREATMENT INITIAL DESIGN SUBMITTAL
Parsons p:\honeywell -syr\444546 - operations\09 reports\initial design submittal\dredging ids.docm 2/3/2009
4-57
around the perimeter of Settling Basins 9-11 would provide access to significant stretches of the route. Some of these roads, however, would require upgrading prior to use. New access roads would be needed along portions of the route on Settling Basins 1-8. The construction of new and upgraded access roads represents opportunity for some potential synergies between the Onondaga Lake and Ninemile Creek remediations.
The infrastructure associated with the two Ninemile Creek crossings will need to be constructed. Access to these crossing points for necessary installation equipment appears to be available for traditional construction equipment. Further evaluation will be required to determine the exact number and required locations of the booster pumps, to determine if accessibility concerns would preclude positioning a pump at a specific point in the line. Details pertaining to secondary containment and spill avoidance planning will be developed in the Final Design Submittal, as discussed in Section 4.4.
4.7.2 Settling Basin B
Currently, minimal support zone facilities exist at or near the lake. Facilities and supporting infrastructure will need to be constructed and in place before dredging and debris removal and management can occur. Specific needs at the shoreline to support project activities may include:
• barge wharfs sufficient to accommodate the dredge and debris barges for staging and off-loading;
• work boat dock(s) to accommodate tugboat(s), crew boats, survey vessels, and sampling boats;
• wharf or mooring dolphin accommodations for securing floating vessels simultaneously in the event of severe weather conditions or downtime; and
• repair area with crane or ability to support truck crane for vessel repair.
Specific upland support areas at the lake may include:
• sediment screening/equalization tank area;
• booster pump area;
• debris staging area;
• debris decontamination area;
• agency, owner, and contractor field offices;
• work crew break and decontamination trailers;
• storage for equipment during winter shut-downs; and
• repair and spare parts area.
It is anticipated that the barge wharf, boat docks, sediment screening and equalization tanks, debris stockpiles, dredge contractor field offices and supply storage, and other related facilities would be located at the Settling Basin B / Harbor Brook site. This area provides the following advantages:
DRAFT ONONDAGA LAKEDREDGING, SEDIMENT MANAGEMENT, &
WATER TREATMENT INITIAL DESIGN SUBMITTAL
Parsons p:\honeywell -syr\444546 - operations\09 reports\initial design submittal\dredging ids.docm 2/3/2009
4-58
• Existing water depths along the Willis hydraulic barrier IRM should provide sufficient draft (plus 12 ft) for water-based vessels, and if additional navigational dredging is required, it would be minimal.
• Settling Basin B is located adjacent to the lake and the dredge area within the lake where most of the target dredge volume will be removed along with debris removal and cap placement.
• Existing grades at this site are favorable and will require minimal grading.
• There is sufficient room to accommodate the required operations support requirements, as well as capping support area requirements (which will be addressed as part of the Sediment Capping and Dredge Area & Depth IDS).
• This site property is predominantly owned by Honeywell and the area can be a available for this purpose.
Figure 4.10 presents the areas anticipated to be available for support operations. Existing and anticipated road access is also presented on this figure.
4.7.2.1 Summary & Description
Settling Basin B consists of the shoreline area along the southwest portion of the lake, adjacent to the ILWD area (SMU 1). Settling Basin B, along with two former Dredge Spoils Areas (DSAs) (#1 and 2), the Route I-690 Drainage Ditch, and the East Flume, makeup an area known as the Lakeshore Area, which compromise the largest component of the Settling Basin B / Harbor Brook Site.
Historical use of Settling Basin B was for the deposition of Solvay waste, consisting primarily of calcium carbonate, calcium silicate, and magnesium hydroxide with lesser amounts of carbonates, sulfates, salts, and metal oxides. Settling Basin B received Solvay waste from approximately 1898 to 1926 (B&B, 1989). Settling Basin B was engineered to receive waste by construction of a bulkhead into Onondaga Lake. The bed covers approximately 28 acres, including the relatively flat area between the lake water’s edge and the raised, bermed portion of the Settling Basin (B&B, 1989). Large areas of the Settling Basin are thickly vegetated with trees, shrubs, and other vegetation, while other areas are limited to grassy vegetation. Shoreline areas of Settling Basin B are vegetated with trees and shrubs in some areas, and with Phragmites australis in other areas.
The East Flume was originally an excavated drainage ditch that primarily received process cooling waters from the former Main and Willis Avenue Plants. In addition to cooling waters, the East Flume also carried a combined (Solvay, sanitary, mercury, and organic) waste stream from the Main and Willis Avenue Plants to Onondaga Lake. The East Flume currently receives stormwater from Solvay Paperboard, General Chemical Corporation, Landis Plastics, and the Village of Solvay. It also receives process waters from the Trigen Syracuse Energy Corporation. Water depths within the flume typically range from 2 ft and 6 ft and channel width varies approximately from a minimum of 20 ft to a maximum of 150 ft. The banks of the flume are vegetated primarily with Phragmites australis (OBG, 2007).
DRAFT ONONDAGA LAKEDREDGING, SEDIMENT MANAGEMENT, &
WATER TREATMENT INITIAL DESIGN SUBMITTAL
Parsons p:\honeywell -syr\444546 - operations\09 reports\initial design submittal\dredging ids.docm 2/3/2009
4-59
The DSAs #1 and #2 are located in the northwest portion of the lakeshore area. The areas received dredge spoils from the Upper East Flume (UEF) and from Onondaga Lake, respectively. DSA #1 is situated to the south of the UEF and is approximately 300 ft by 300 ft at its widest points. This area was created in 1979 to hold sediments removed from the UEF that had been deposited within the UEF subsequent its re-construction in 1977. A berm was created around the perimeter of the area and sediments were pumped into the bermed area. The average depth of these sediments is 2 ft. Beneath the dredged material, a layer approximately 1 to 2 ft thick of ash and cinders has been observed. DSA #2 is located to the east of the UEF and south of the Lower East Flume (LEF). The area is approximately 350 ft by 350 ft and bermed to the north and east. This area received sediments from the lake, which were removed during the installation of the thermal diffuser pipeline in 1977. The spoils in this area are approximately 3 to 5 ft thick and are underlain by Solvay waste (OBG, 2007). Vegetation of the DSAs is consistent with that of Settling Basin B.
Harbor Brook is a Class C stream, which originates southeast of the city of Syracuse, in the Town of Onondaga, and flows to the southwest corner of Onondaga Lake adjacent to the eastern end of Settling Basin B. Harbor Brook drains a watershed of approximately 13.2 square miles and has an average flow rate of 14.3 cubic fps (B&B, 1989).
Several wetland areas have been delineated on the Settling Basin B site, including SYW-19. To ensure that remedial and/or support activities associated with the cleanup of Onondaga Lake do not impact these wetland areas, no sediment conditioning steps, material storage, or other activities will be conducted in a delineated wetland area. Furthermore, requirements associated with diversion of stormwater, erosion protection, and other protective measures to minimize impacts on nearby sensitive areas will be developed during later stages of the design.
4.7.2.2 Property Ownership / Remedial Status
The Settling Basin B site is currently owned by Honeywell. The site is currently going through the RI/FS process, to evaluate potential remedial alternatives. Concurrently, there are also several IRM measures which are currently in the design phase. It is anticipated that most of these IRM measures would be completed prior to the commencement of dredging activities, however, other portions of the Settling Basin B remedy could overlap lake construction activities, particularly if any support zone construction is required in advance of the 2012 dredging-start date. Coordination with in-lake activities and any onshore remedial activities taking place on Settling Basin B will require careful coordination during both the design and execution phases.
4.7.2.3 Accessibility & Other Considerations
The Settling Basin B site is generally easily accessible, and has been used as a support zone / laydown area for several investigations and remedial activities. The main access point to the site is through the northern gate, adjacent to the Onondaga County Pump Station Building. Road access to this gate is available from State Fair Boulevard from the northwest, and from I-690 West exit 7 from the southeast. Currently, access into the site is limited, due to the ongoing construction of the Willis-Semet IRM Barrier Wall, and the future demolition of the existing causeway structure. These activities will be completed, however, prior to the start of any
DRAFT ONONDAGA LAKEDREDGING, SEDIMENT MANAGEMENT, &
WATER TREATMENT INITIAL DESIGN SUBMITTAL
Parsons p:\honeywell -syr\444546 - operations\09 reports\initial design submittal\dredging ids.docm 2/3/2009
4-60
construction activities related to Onondaga Lake remediation. There are several gravel access roads leading to key features on the Settling Basin, including the diffuser building, which is located adjacent to the UEF and DSA #2. Additionally, following causeway demolition, and site restoration, a gravel road will be installed, providing improved access to Settling Basin B from the main entrance.
As part of the Willis-Semet IRM Barrier Wall construction, a second construction entrance was created on the south end of the site, passing beneath the I-690 overpass. This access was negotiated with New York State Department of Transportation (NYSDOT) and CSX, and permits were issued allowing access. This permit was issued for the Willis-Semet IRM Barrier Wall construction project; however, it remains a potential option for alternative site access for future needs associated with the lake remedy.
The Willis-Semet IRM Barrier Wall was designed with specific loading limitations in areas immediately behind the wall. In most areas of the wall, this loading is limited to 100 psf within 15 ft of the wall, and 600 psf between 15 and 40 ft of the wall, corresponding to the 40-ft wide gravel roadway to be installed following site restoration. In one area, which is designated as Design Section 3, additional support in the form of a tie-back anchor wall, may be required to allow the wall to accommodate additional loading. This area corresponds to an area of deeper water nearshore, which may be utilized for the installation of a docking facility for dredge/debris/cap support purposes. If the anchor wall is constructed in this area, the wall loading limitations will be adjusted to 600 psf within 25 ft of the wall, and 1,000 psf between 15 and 40 ft of the wall. Any planned use and loading in close proximity (within 40 ft) to the barrier wall will be required to be reviewed and approved by the barrier wall design engineer.
Due to the physical nature of the Solvay waste material, there may be significant geotechnical limitations on the use of certain areas of Settling Basin B. Limited geotechnical information has been collected to date in the areas of this site which have been identified as potential support zone areas. As more detailed support area configurations are developed, additional data collection may be necessary to ensure that site conditions can support the planned use.
Electrical power on Settling Basin B currently extends to the diffuser building and the NAPL collection building. Electrical power has also been extended southeast, to the support areas associated with the design-related investigations and Willis-Semet IRM Barrier Wall construction. Any support zone operations requiring electrical power on this site may require the installation of necessary infrastructure, depending on the exact location of the operation.
4.7.3 Settling Basin 13
It is anticipated that the Settling Basin 13 area would be utilized for siting of the slurry preconditioning operations, geotextile tube dewatering area, WTP facility, water storage facilities, and necessary support facilities needed for these operation. Figure 4.9 presents the areas anticipated to be available for these operations. Existing and anticipated road access is also presented on this figure.
DRAFT ONONDAGA LAKEDREDGING, SEDIMENT MANAGEMENT, &
WATER TREATMENT INITIAL DESIGN SUBMITTAL
Parsons p:\honeywell -syr\444546 - operations\09 reports\initial design submittal\dredging ids.docm 2/3/2009
4-61
4.7.3.1 Summary & Description
Settling Basin 13 was originally designed as a settling basin for the disposal of Solvay waste. It is located in the Town of Camillus, and encompasses approximately 163 acres. It is bordered to the north by Ninemile Creek and the CSX Railroad tracks; to the west by an Onondaga County Garage property, a former gravel excavation owned by Honeywell, and a few residential properties; and to the east and south by Settling Basins 12 and 14, respectively.
Historical information indicates that prior to construction of the Settling Basin 13 exterior dikes, three pits approximately 30 ft deep were excavated in the area. The excavated soils, mainly sands and gravels with some clay, were used for construction of the Settling Basin 12 and 14 dikes. The native materials in non-excavated areas consist of up to 2 ft of topsoil (brown clayey silt), up to 10 ft of interlayered silt, silty fine sand, silty clay and varved clay, and a layer of brown coarse to fine gravel, with small amounts of coarse to medium sand, occasional cobbles and boulders, and an occasional trace of silty clay.
Although original site documents indicate that the Settling Basin dikes were originally designed to be 100 ft high, the current dikes are only approximately 40 to 50 ft high; however, they do have approximately 10 ft of freeboard in some areas, as estimated from the crest of the dike to the waste surface. Based on the design documents and observations during previous investigations, it appears that native material from underneath the footprint of Settling Basin 13 was used for dike construction. This borrow material included gravel, sand, silt, and stiff clay (Parsons and Geosyntec, 2005)
Recent use of Settling Basin 13 includes planting test plots, conducted by SUNY ESF. These plots have been used to evaluate the ability of various plants to grow in Solvay waste material, potentially for use as a living component of a final cover system, and for biomass grown in the production of biofuels. Existing plots currently occupy several acres along the southern border of Settling Basin 13.
4.7.3.2 Property Ownership / Remedial Status
Settling Basin 13 is currently owned by Honeywell. Although final closure of Settling Basin 13 is anticipated to be conducted, such actions would not be conducted until completion of the Onondaga Lake remediation. Measures and improvements taken in support of the lake remediation, however, may be able to be incorporated into the final closure of the Settling Basins. As details pertaining to the use of Settling Basin 13 for support zone purposes, and pertaining to the final closure of the basins are further developed, future coordination will be necessary to determine if overlapping efforts can be avoided, and/or cost savings can be realized.
4.7.3.3 Accessibility & Other Considerations
Settling Basin 13 is generally accessible. Access to the site is through the main gate at Gerelock Road. Access roads enter the Settling Basins either from the southeast, crossing between Settling Basins 12 and 15, or from the northeast between Settling Basins 12 and 13. Gravel roads sitting atop the former Settling Basin dikes provide access to the perimeter of each Settling Basin. Access roads are in generally good condition, however, improvements would likely be necessary for activities which may require heavy construction traffic.
DRAFT ONONDAGA LAKEDREDGING, SEDIMENT MANAGEMENT, &
WATER TREATMENT INITIAL DESIGN SUBMITTAL
Parsons p:\honeywell -syr\444546 - operations\09 reports\initial design submittal\dredging ids.docm 2/3/2009
4-62
Due to the physical nature of the Solvay waste material, there may be significant geotechnical limitations on the use of certain areas of Settling basin 13. Limited geotechnical information has been collected to date in the areas of this site which have been identified as potential support zone areas. As potential laydown area configurations are developed, additional data collection would likely be necessary, to ensure that site conditions can support the planned use. Further evaluation of any potential limitations of this area, including the identification of any data gaps, will be included in the SCA IDS Report.
Electrical power service currently stops near the existing leachate collection pond, along eastern border of Settling Basin 12. Any remedial operations requiring an electrical power source would have to run power from this location to the desired area on Settling Basin 13.
4.8 EMISSIONS & ODOR CONTROL
A primary objective for Honeywell is protection of public safety and minimizing disruptions to the surrounding community during the dredging. Data collected from bench studies and evaluation by air quality experts indicates that activities described in this IDS Report, under worse case conditions, can be completed without producing human health risks from air quality impacts.
In addition to this determination, engineering controls have been incorporated into the current design to further reduce risk of air quality impacts. These controls include:
• the use of hydraulic dredging and transportation, allowing for sediment management in an enclosed system;
• the siting of the SCA and pipeline routing to avoid public disruption; and
• the use of geotextile tubes for dewatering at the SCA, reducing the overall active dewatering area, providing added buffer areas between the active dewatering area and the site boundaries, and allowing for control of the open water area.
Additional engineering controls have been identified and will be considered during final design to determine those that will be specified and incorporated into the process and those that could be used for back-up or contingency measures if needed. The remedial process components identified for continued evaluation and controls considered are presented in Table 4.6.
Further air quality protection will be provided by a monitoring and mitigation program to be implemented during the remedial activities. The Volatile and Odor Emissions Monitoring and Mitigation Plan discussed in Section 2, will outline the procedures and measures that will be taken in the unlikely event that onsite monitoring indicates that the remedial activities may lead to unacceptable off-site impacts.
The analysis and control measures taken to understand and control air quality health risks also provide positive management of odors from the operations. A summary of the design-related investigations, the engineering controls, and mitigation strategies that utilized to protect air quality and manage odor are further described in the subsections below.
DRAFT ONONDAGA LAKEDREDGING, SEDIMENT MANAGEMENT, &
WATER TREATMENT INITIAL DESIGN SUBMITTAL
Parsons p:\honeywell -syr\444546 - operations\09 reports\initial design submittal\dredging ids.docm 2/3/2009
4-63
4.8.1 Completed Design-Related Investigation Activities
To assess the potential for volatile and odor emissions from the remedial processes anticipated for the lake remedy, bench-scale testing was completed as part of the initial design-related investigations. Most of the initial investigations were focused on evaluation of potential volatile and odor emissions from an open settling basin. The use of an open basin was subsequently eliminated as the primary dewatering method, and replaced with geotextile tubes to significantly reduce the emissions potential during dewatering.
Design-related investigation activities consisted of wind-tunnel and flux chamber testing, odor characterization studies, and collection of site specific meteorological data.
Wind tunnel testing was conducted on various sediment and slurry mixtures from Remediation Areas D and E as part of Phases I and III of the PDI. The detailed results from this testing are provided in the Phase I Wind Tunnel Testing Report (Service Engineering, 2008), and the Phase III Addendum 7 Air Emissions and Odors Summary Report (OBG, 2009), currently being finalized based on initial comments from NYSDEC. This testing represented various stages of dewatering using an open settling basin. Samples collected from the wind tunnel testing were sent to off-site laboratories for chemical analysis, and to a specialized odor laboratory, where samples were tested by a certified odor panel to assess the odor levels of the samples. The results of the wind tunnel testing provided estimated emission rates for both specific volatile and semi-volatile chemicals, as well as odors. Several mitigation alternatives were evaluated to control these emissions. These controls are discussed in Section 4.8.2 below.
To fill data gaps from the Phase I PDI wind tunnel testing, odor characterization testing was conducted as part of the Phase II PDI. The objective of this testing was to identify representative characteristics of the odors, and attempt to identify the primary odor-causing compounds which were potential contributors to the odor emitted from the sediment and water. Based on correlations drawn between sample odor levels and chemical concentrations, specific volatile organic and sulfur compounds had the biggest impact on the strength of the odors. Specific compounds detected in the headspace samples, including dimethyl disulfide, chlorobenzene, 1,4-dichlorobenzene, and naphthalene, and demonstrated a strong correlation to the odor results. Aldehyde and amine compounds were found to have minimal correlation to odors (Parsons et al, 2008). As part of the Phase I PDI studies, mercaptans and hydrogen sulfide were not detected in any of the air samples analyzed.
Analysis of data collected from bench studies completed to date has indicated that the remedial activities described in this IDS Report can be completed without leading to off-site impacts associated with volatile emissions.
Two meteorological monitoring stations were installed in the vicinity of the lakeshore and the SCA. As described in Section 3.8, data collection of key weather parameters has been ongoing for several years. Specifications on data collection, including required parameters and collection frequency, were designed in accordance with EPA requirements for the AERMOD dispersion model. This data is being collected in anticipation of potential dispersion modeling related to remedial activities.
DRAFT ONONDAGA LAKEDREDGING, SEDIMENT MANAGEMENT, &
WATER TREATMENT INITIAL DESIGN SUBMITTAL
Parsons p:\honeywell -syr\444546 - operations\09 reports\initial design submittal\dredging ids.docm 2/3/2009
4-64
4.8.2 Engineering Controls
A thorough evaluation was completed on the various remedial components described in this IDS Report related to air quality. The remedial process components and emissions engineering controls that have been identified to date are presented in Table 4.6. These controls are in addition to those already incorporated into the design. Controls presented in this table may or may not require implementation during the dredging operation but, would be applied on an as-needed basis. Evaluations conducted during the remedial design may indicate that some of these additional controls will be specified in the final design.
4.8.3 Air Quality Monitoring
To provide assurance and protection to the surrounding community and environment, ambient air quality criteria will be established for this project. These criteria will represent air concentrations of specific chemicals which must not be exceeded. Compliance with these established criteria will be verified by air quality monitoring, which will be conducted while remedial activities are ongoing. As described in Section 2, a Volatile and Odor Emissions Monitoring and Mitigation Plan will be prepared, which will describe monitoring procedures, targeted parameters, and monitoring locations.
Development of the air quality criteria for the project and the design of the air quality monitoring approach will take into consideration any existing background concentrations of odors and/or chemicals. To characterize these background conditions, baseline monitoring will be conducted prior to the initiation of remedial construction activities. To ensure the remedial activities do not lead to off-site odor impacts, air quality monitoring will include monitoring odors in the vicinity of remedial activities.
The Volatile and Odor Emissions Monitoring and Mitigation Plan will identify actions that will be taken in the unlikely event that on-site monitoring indicates that the remedial activities may lead to unacceptable off-site impacts. The plan will provide specific measures to be taken to identify emission sources, mitigate the sources to prevent further emissions, and follow up actions to be taken to validate the effectiveness of the mitigative approach. The measures outlined in this plan may consist of measures identified in Table 4.6, or other measures that may be identified during later phases of the design process.
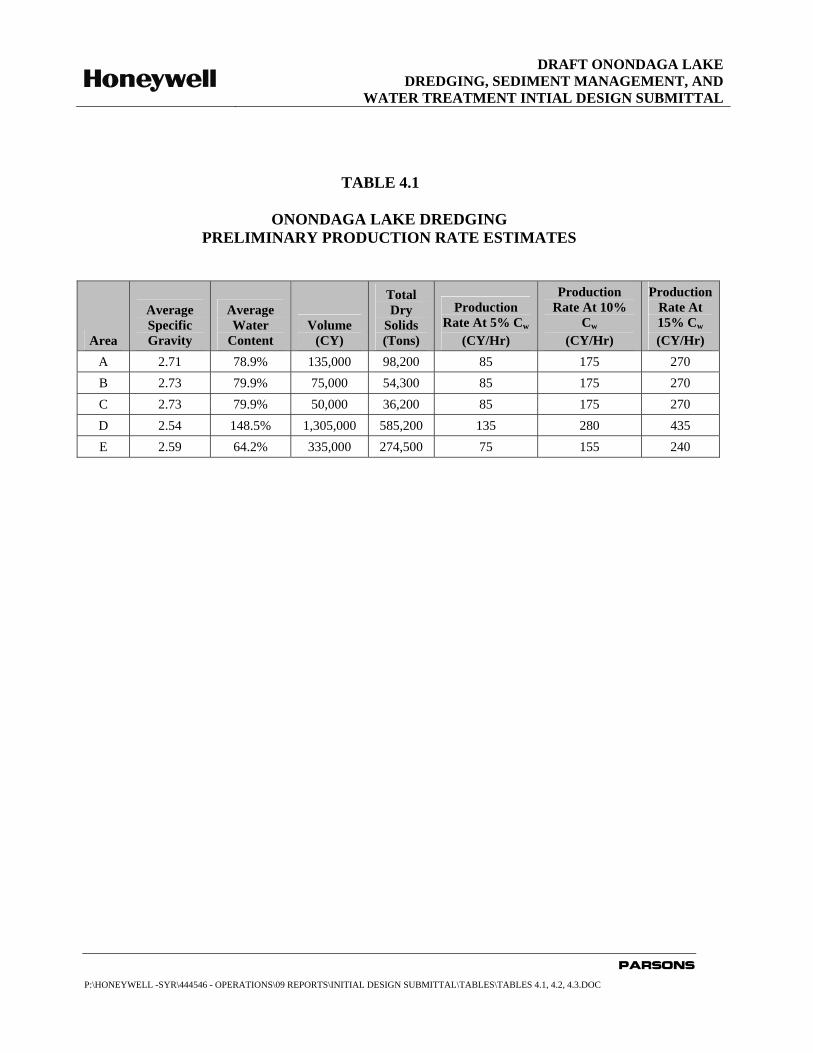
DRAFT ONONDAGA LAKEDREDGING, SEDIMENT MANAGEMENT, AND
WATER TREATMENT INTIAL DESIGN SUBMITTAL
PARSONS
P:\HONEYWELL -SYR\444546 - OPERATIONS\09 REPORTS\INITIAL DESIGN SUBMITTAL\TABLES\TABLES 4.1, 4.2, 4.3.DOC
TABLE 4.1
ONONDAGA LAKE DREDGING PRELIMINARY PRODUCTION RATE ESTIMATES
Area
Average Specific Gravity
Average Water
Content Volume
(CY)
Total Dry
Solids (Tons)
Production Rate At 5% Cw
(CY/Hr)
Production Rate At 10%
Cw
(CY/Hr)
Production Rate At 15% Cw
(CY/Hr) A 2.71 78.9% 135,000 98,200 85 175 270 B 2.73 79.9% 75,000 54,300 85 175 270 C 2.73 79.9% 50,000 36,200 85 175 270 D 2.54 148.5% 1,305,000 585,200 135 280 435 E 2.59 64.2% 335,000 274,500 75 155 240
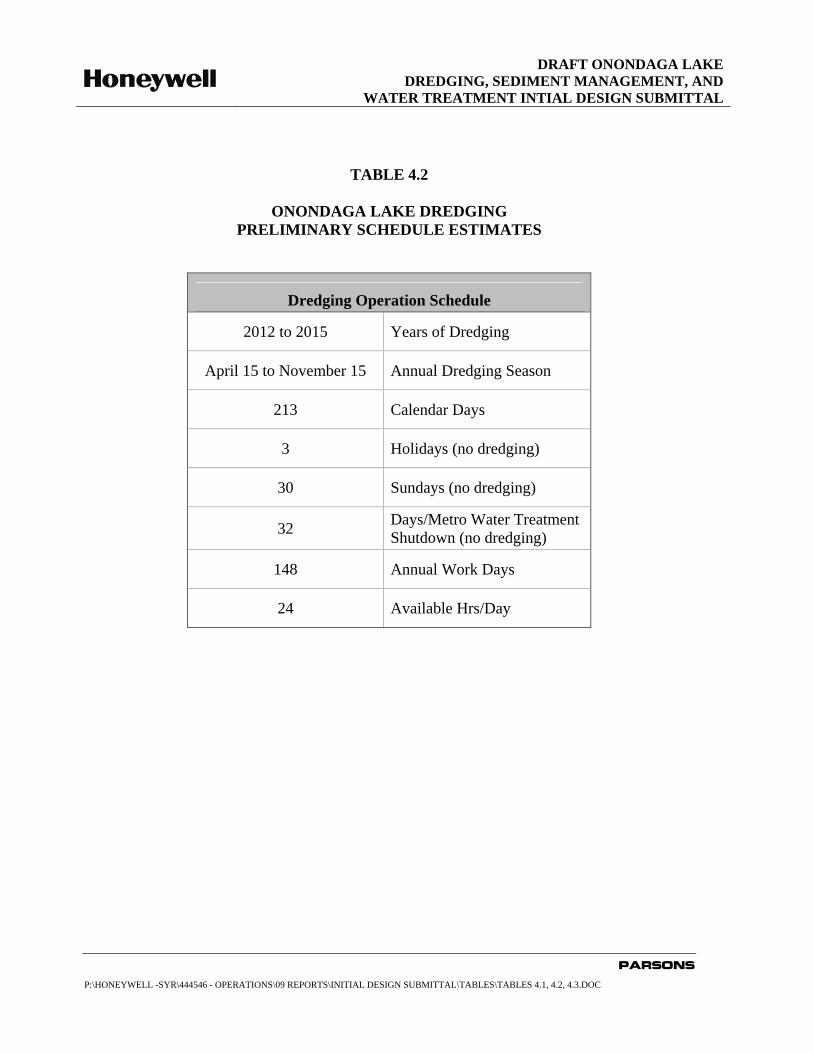
DRAFT ONONDAGA LAKEDREDGING, SEDIMENT MANAGEMENT, AND
WATER TREATMENT INTIAL DESIGN SUBMITTAL
PARSONS
P:\HONEYWELL -SYR\444546 - OPERATIONS\09 REPORTS\INITIAL DESIGN SUBMITTAL\TABLES\TABLES 4.1, 4.2, 4.3.DOC
TABLE 4.2
ONONDAGA LAKE DREDGING PRELIMINARY SCHEDULE ESTIMATES
Dredging Operation Schedule
2012 to 2015 Years of Dredging
April 15 to November 15 Annual Dredging Season
213 Calendar Days
3 Holidays (no dredging)
30 Sundays (no dredging)
32 Days/Metro Water Treatment Shutdown (no dredging)
148 Annual Work Days
24 Available Hrs/Day
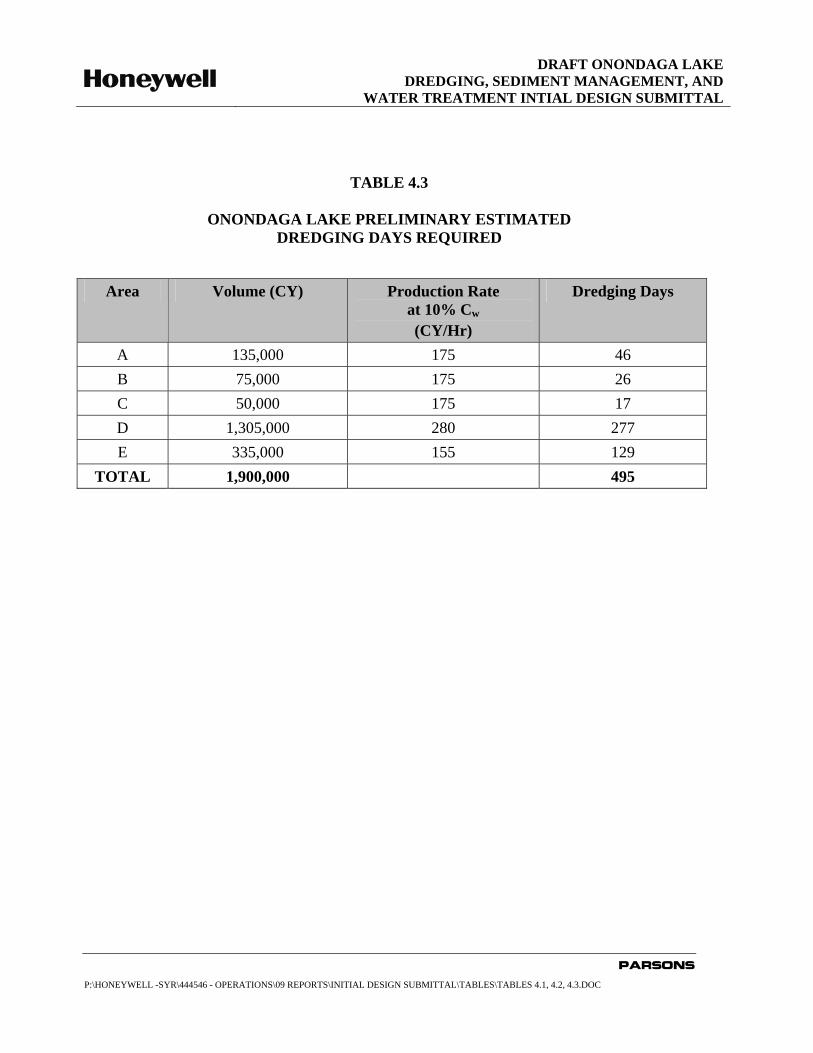
DRAFT ONONDAGA LAKEDREDGING, SEDIMENT MANAGEMENT, AND
WATER TREATMENT INTIAL DESIGN SUBMITTAL
PARSONS
P:\HONEYWELL -SYR\444546 - OPERATIONS\09 REPORTS\INITIAL DESIGN SUBMITTAL\TABLES\TABLES 4.1, 4.2, 4.3.DOC
TABLE 4.3
ONONDAGA LAKE PRELIMINARY ESTIMATED DREDGING DAYS REQUIRED
Area Volume (CY) Production Rate at 10% Cw
(CY/Hr)
Dredging Days
A 135,000 175 46 B 75,000 175 26 C 50,000 175 17 D 1,305,000 280 277 E 335,000 155 129
TOTAL 1,900,000 495
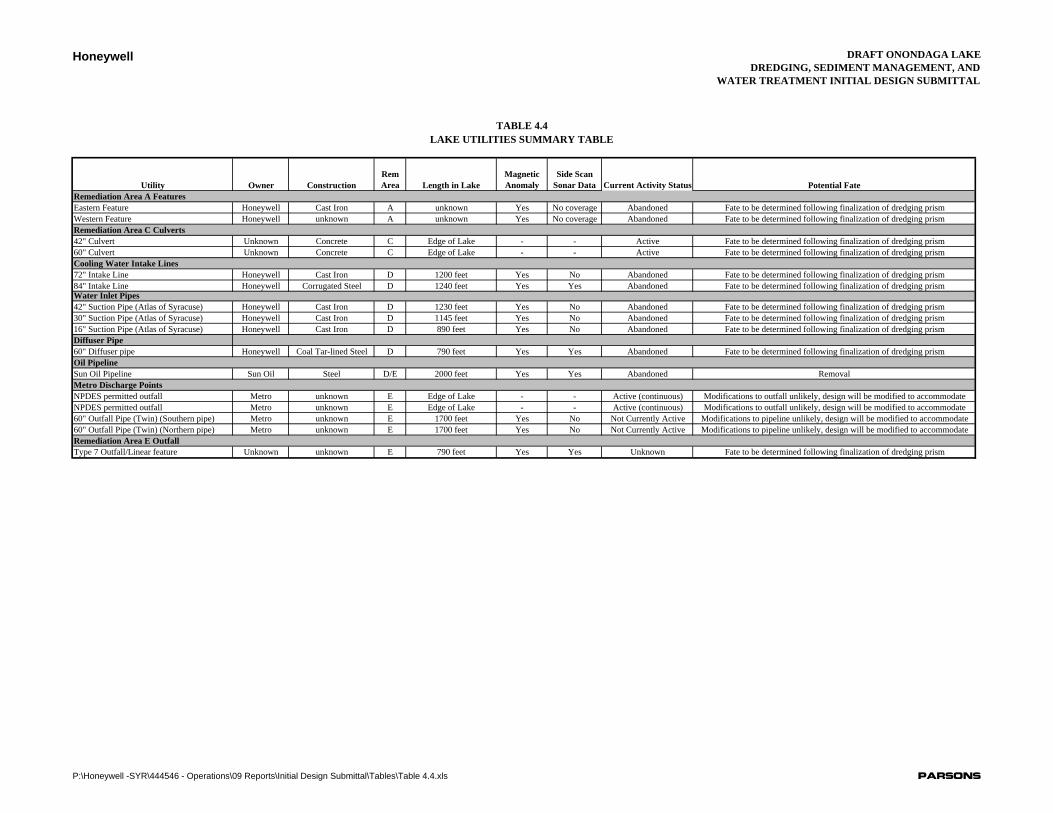
Honeywell DRAFT ONONDAGA LAKEDREDGING, SEDIMENT MANAGEMENT, AND
WATER TREATMENT INITIAL DESIGN SUBMITTAL
TABLE 4.4LAKE UTILITIES SUMMARY TABLE
Utility Owner ConstructionRem Area Length in Lake
Magnetic Anomaly
Side Scan Sonar Data Current Activity Status Potential Fate
Remediation Area A FeaturesEastern Feature Honeywell Cast Iron A unknown Yes No coverage Abandoned Fate to be determined following finalization of dredging prismWestern Feature Honeywell unknown A unknown Yes No coverage Abandoned Fate to be determined following finalization of dredging prismRemediation Area C Culverts42" Culvert Unknown Concrete C Edge of Lake - - Active Fate to be determined following finalization of dredging prism60" Culvert Unknown Concrete C Edge of Lake - - Active Fate to be determined following finalization of dredging prismCooling Water Intake Lines72" Intake Line Honeywell Cast Iron D 1200 feet Yes No Abandoned Fate to be determined following finalization of dredging prism84" Intake Line Honeywell Corrugated Steel D 1240 feet Yes Yes Abandoned Fate to be determined following finalization of dredging prismWater Inlet Pipes42" Suction Pipe (Atlas of Syracuse) Honeywell Cast Iron D 1230 feet Yes No Abandoned Fate to be determined following finalization of dredging prism30" Suction Pipe (Atlas of Syracuse) Honeywell Cast Iron D 1145 feet Yes No Abandoned Fate to be determined following finalization of dredging prism16" Suction Pipe (Atlas of Syracuse) Honeywell Cast Iron D 890 feet Yes No Abandoned Fate to be determined following finalization of dredging prismDiffuser Pipe60" Diffuser pipe Honeywell Coal Tar-lined Steel D 790 feet Yes Yes Abandoned Fate to be determined following finalization of dredging prismOil PipelineSun Oil Pipeline Sun Oil Steel D/E 2000 feet Yes Yes Abandoned RemovalMetro Discharge PointsNPDES permitted outfall Metro unknown E Edge of Lake - - Active (continuous) Modifications to outfall unlikely, design will be modified to accommodateNPDES permitted outfall Metro unknown E Edge of Lake - - Active (continuous) Modifications to outfall unlikely, design will be modified to accommodate60" Outfall Pipe (Twin) (Southern pipe) Metro unknown E 1700 feet Yes No Not Currently Active Modifications to pipeline unlikely, design will be modified to accommodate60" Outfall Pipe (Twin) (Northern pipe) Metro unknown E 1700 feet Yes No Not Currently Active Modifications to pipeline unlikely, design will be modified to accommodateRemediation Area E OutfallType 7 Outfall/Linear feature Unknown unknown E 790 feet Yes Yes Unknown Fate to be determined following finalization of dredging prism
P:\Honeywell -SYR\444546 - Operations\09 Reports\Initial Design Submittal\Tables\Table 4.4.xls Parsons
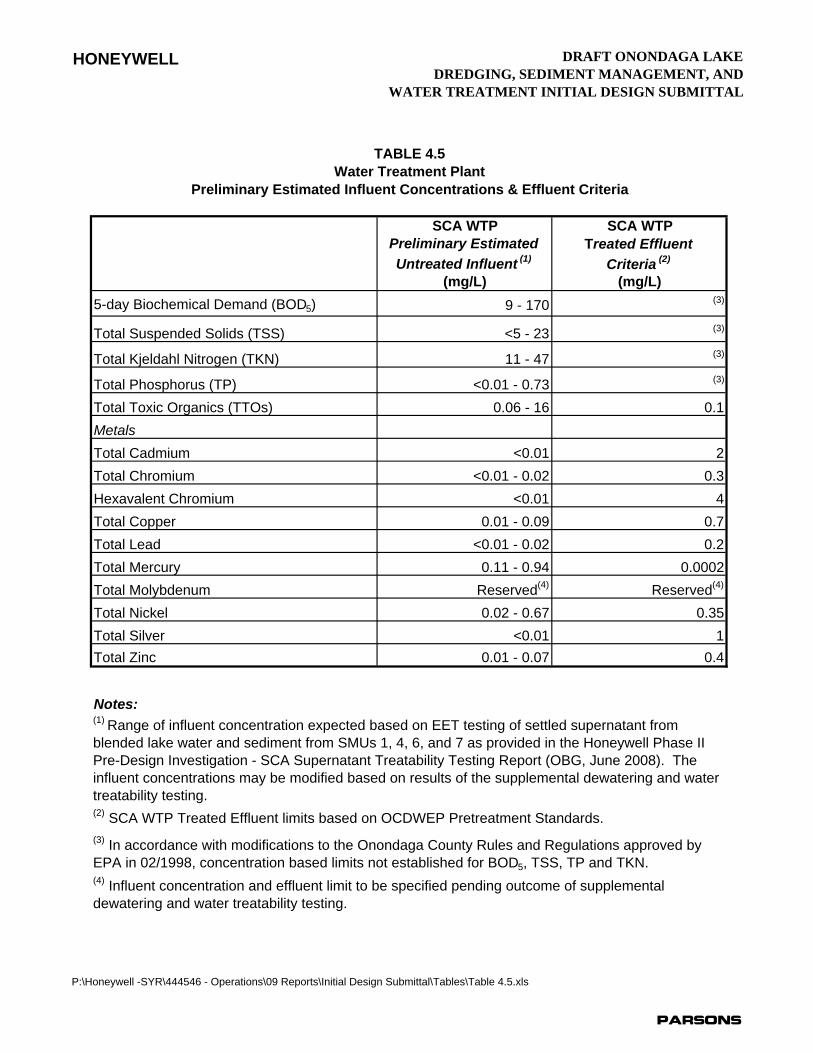
HONEYWELL DRAFT ONONDAGA LAKEDREDGING, SEDIMENT MANAGEMENT, AND
WATER TREATMENT INITIAL DESIGN SUBMITTAL
SCA WTPPreliminary EstimatedUntreated Influent (1)
SCA WTPTreated Effluent
Criteria (2)
(mg/L) (mg/L)5-day Biochemical Demand (BOD5) 9 - 170 (3)
Total Suspended Solids (TSS) <5 - 23 (3)
Total Kjeldahl Nitrogen (TKN) 11 - 47 (3)
Total Phosphorus (TP) <0.01 - 0.73 (3)
Total Toxic Organics (TTOs) 0.06 - 16 0.1MetalsTotal Cadmium <0.01 2Total Chromium <0.01 - 0.02 0.3Hexavalent Chromium <0.01 4Total Copper 0.01 - 0.09 0.7Total Lead <0.01 - 0.02 0.2Total Mercury 0.11 - 0.94 0.0002Total Molybdenum Reserved(4) Reserved(4)
Total Nickel 0.02 - 0.67 0.35Total Silver <0.01 1Total Zinc 0.01 - 0.07 0.4
Notes:
TABLE 4.5Water Treatment Plant
Preliminary Estimated Influent Concentrations & Effluent Criteria
(2) SCA WTP Treated Effluent limits based on OCDWEP Pretreatment Standards.
(4) Influent concentration and effluent limit to be specified pending outcome of supplemental dewatering and water treatability testing.
(1) Range of influent concentration expected based on EET testing of settled supernatant from blended lake water and sediment from SMUs 1, 4, 6, and 7 as provided in the Honeywell Phase II Pre-Design Investigation - SCA Supernatant Treatability Testing Report (OBG, June 2008). The influent concentrations may be modified based on results of the supplemental dewatering and water treatability testing.
(3) In accordance with modifications to the Onondaga County Rules and Regulations approved by EPA in 02/1998, concentration based limits not established for BOD5, TSS, TP and TKN.
P:\Honeywell -SYR\444546 - Operations\09 Reports\Initial Design Submittal\Tables\Table 4.5.xls
Parsons
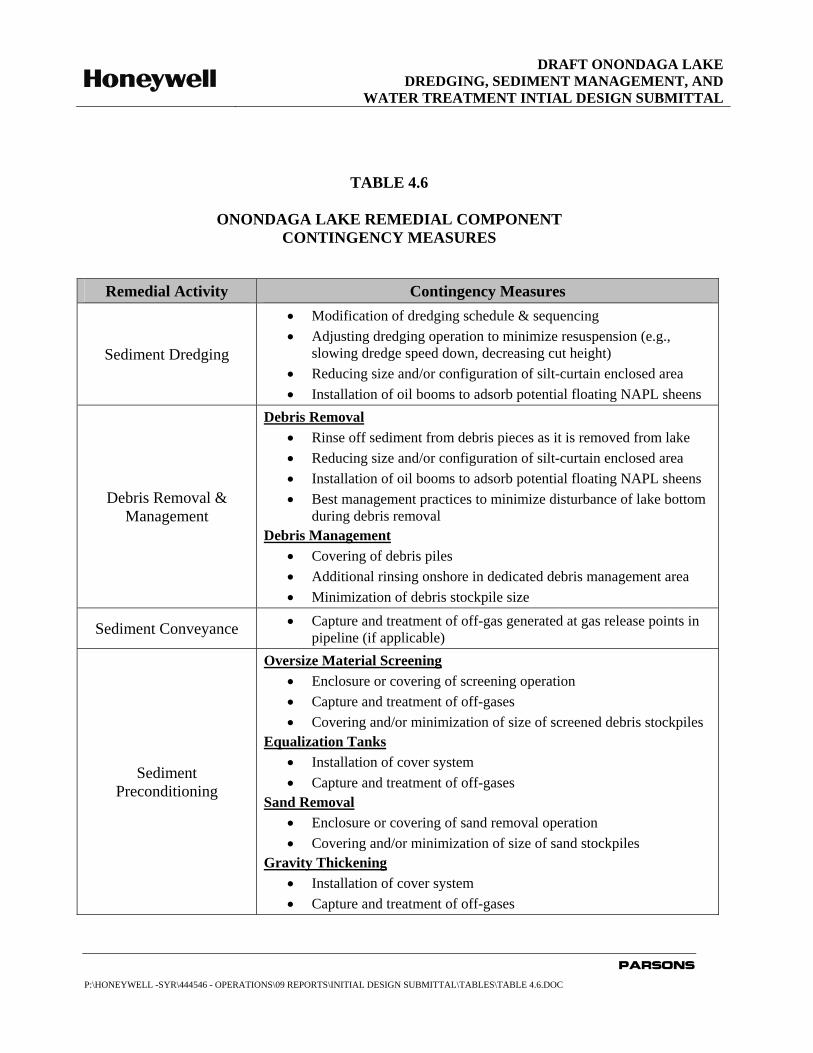
DRAFT ONONDAGA LAKEDREDGING, SEDIMENT MANAGEMENT, AND
WATER TREATMENT INTIAL DESIGN SUBMITTAL
PARSONS
P:\HONEYWELL -SYR\444546 - OPERATIONS\09 REPORTS\INITIAL DESIGN SUBMITTAL\TABLES\TABLE 4.6.DOC
TABLE 4.6
ONONDAGA LAKE REMEDIAL COMPONENT CONTINGENCY MEASURES
Remedial Activity Contingency Measures
Sediment Dredging
• Modification of dredging schedule & sequencing • Adjusting dredging operation to minimize resuspension (e.g.,
slowing dredge speed down, decreasing cut height) • Reducing size and/or configuration of silt-curtain enclosed area • Installation of oil booms to adsorb potential floating NAPL sheens
Debris Removal & Management
Debris Removal • Rinse off sediment from debris pieces as it is removed from lake • Reducing size and/or configuration of silt-curtain enclosed area • Installation of oil booms to adsorb potential floating NAPL sheens • Best management practices to minimize disturbance of lake bottom
during debris removal Debris Management
• Covering of debris piles • Additional rinsing onshore in dedicated debris management area • Minimization of debris stockpile size
Sediment Conveyance • Capture and treatment of off-gas generated at gas release points in pipeline (if applicable)
Sediment Preconditioning
Oversize Material Screening • Enclosure or covering of screening operation • Capture and treatment of off-gases • Covering and/or minimization of size of screened debris stockpiles
Equalization Tanks • Installation of cover system • Capture and treatment of off-gases
Sand Removal • Enclosure or covering of sand removal operation • Covering and/or minimization of size of sand stockpiles
Gravity Thickening • Installation of cover system • Capture and treatment of off-gases
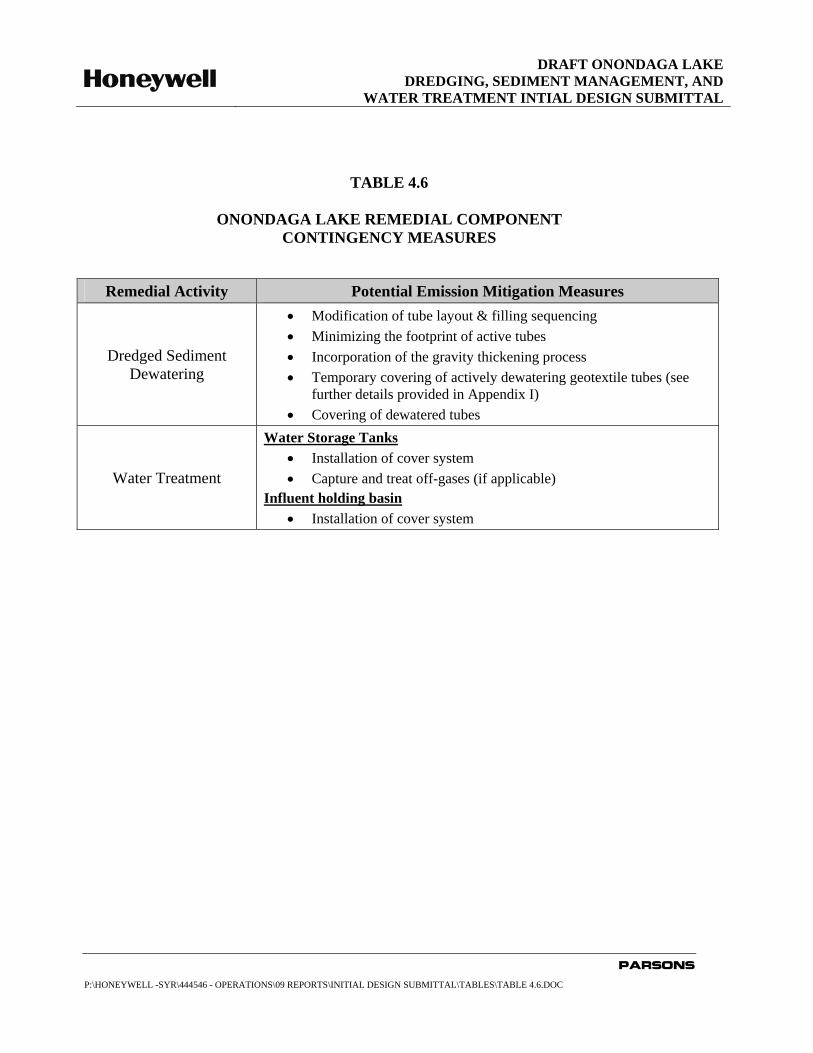
DRAFT ONONDAGA LAKEDREDGING, SEDIMENT MANAGEMENT, AND
WATER TREATMENT INTIAL DESIGN SUBMITTAL
PARSONS
P:\HONEYWELL -SYR\444546 - OPERATIONS\09 REPORTS\INITIAL DESIGN SUBMITTAL\TABLES\TABLE 4.6.DOC
TABLE 4.6
ONONDAGA LAKE REMEDIAL COMPONENT CONTINGENCY MEASURES
Remedial Activity Potential Emission Mitigation Measures
Dredged Sediment Dewatering
• Modification of tube layout & filling sequencing • Minimizing the footprint of active tubes • Incorporation of the gravity thickening process • Temporary covering of actively dewatering geotextile tubes (see
further details provided in Appendix I) • Covering of dewatered tubes
Water Treatment
Water Storage Tanks • Installation of cover system • Capture and treat off-gases (if applicable)
Influent holding basin • Installation of cover system
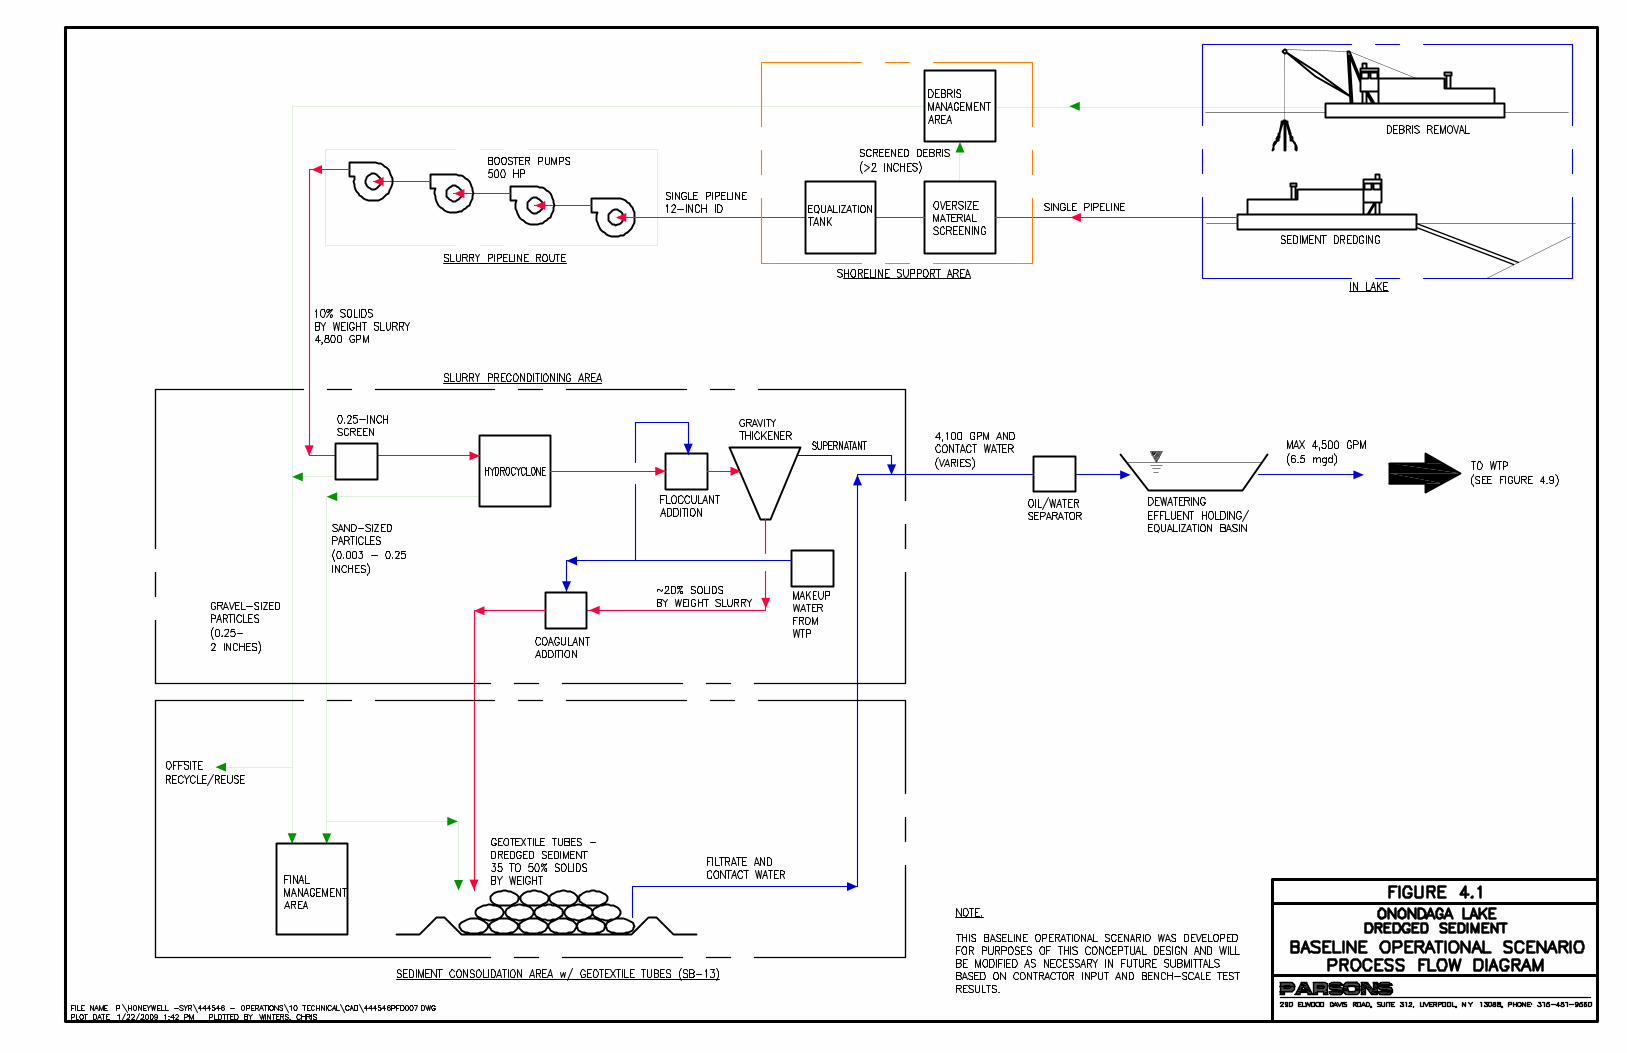
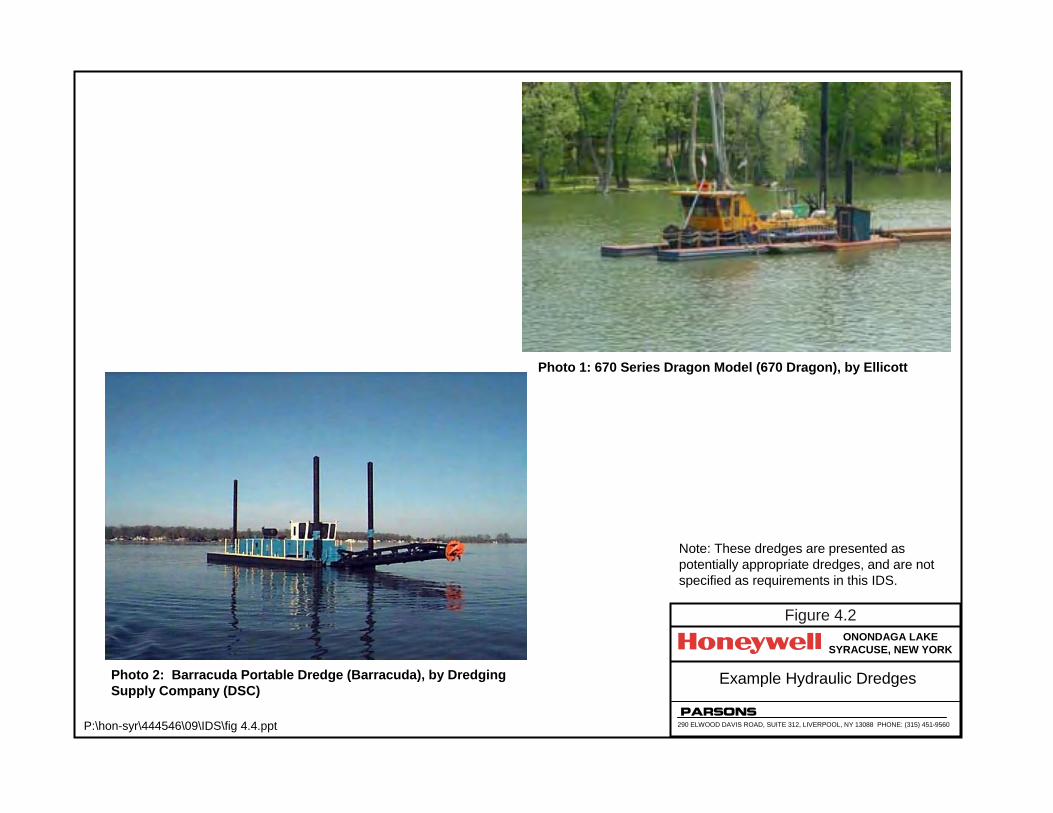
ONONDAGA LAKESYRACUSE, NEW YORK
Example Hydraulic Dredges
290 ELWOOD DAVIS ROAD, SUITE 312, LIVERPOOL, NY 13088 PHONE: (315) 451-9560
PARSONS
Figure 4.2
P:\hon-syr\444546\09\IDS\fig 4.4.ppt
Photo 1: 670 Series Dragon Model (670 Dragon), by Ellicott
Photo 2: Barracuda Portable Dredge (Barracuda), by Dredging Supply Company (DSC)
Note: These dredges are presented as potentially appropriate dredges, and are not specified as requirements in this IDS.