Embed Size (px)
Citation preview
OREGON STATE HOSPITAL – NORTH CAMPUS
PRELIMINARY CAMPUS VISION, STRATEGY,
AND DEVELOPMENT PROGRAM
LELAND CONSULTING GROUP
PREPARED FOR PREPARED BY
January 2013
State of Oregon
Department of
Administrative
Services
Real Estate
Services
DRAFT
1 PRELIMINARY NORTH CAMPUS VISION, STRATEGY, AND DEVELOPMENT PROGRAM – DRAFT
LELAND CONSULTING GROUP
People Places Prosperity
Revitalizing Downtowns Creating Partnerships
Targeting Real Estate Success Shaping Financial Strategies
Strengthening Community Enabling Sustainability & Livability
Making Cities Work
610 SW Alder Street Suite 1008
Portland Oregon 97205-3611
p 503.222.1600 f 503.222.5078
New York New York
Los Angeles California Bend Oregon
Abilene Texas San Miguel de Allende Mexico
www.lelandconsulting.com
Campus Vision, Strategy, and Development Program
Memorandum
Date 31 January 2013
To Real Estate Services
Department of Administrative Services
STATE OF OREGON
From Leland Consulting Group
Cushman & Wakefield
Subject Oregon State Hospital—North Campus
Preliminary Vision, Strategy, and Development Program
The consulting team supporting the State of Oregon Department of
Administrative Services (DAS) Real Estate Services Division has been
examining the now largely vacant Oregon State Hospital – North Campus.
Formerly the home of Oregon’s psychiatric hospital, this 48-acre site was
closed following consolidation of the entire hospital needs onto the South
Campus where all patients are now located in appropriate contemporary
facilities.
EXISTING SITUATION
As a vacant campus near the heart of Salem, the North Campus as
currently developed no longer serves a useful purpose with the exception
of the Dome Building, occupied by staff of the Oregon Department of
Corrections, and Yaquina Hall, approximately one-third occupied by
Department of Human Services (DHS) staff. The other buildings are
vacant, not being used, and yet DAS estimates that annual operating
costs (for security, maintenance, insurance, landscaping, heating,
cooling, and other expenses) range between $500,000 and $1,000,000
for the entire campus. The State (as property owner) is required by law
to provide maintenance to any structures and the site to ensure that it
does not fall into dereliction and disrepair, even though the site is barely
utilized.
Further, because these buildings were designed for a specific purpose
in the late 1940s and 1950s (to house patients and staff, along with
related facilities), the structures are poorly suited to serve purposes
other than housing patients. The Dome Building has served as an
administrative space since its construction in 1912 and is in the
estimation of this team the most attractive and functional building. It is
the exception to the other functionally and economically obsolete
structures. The remaining five “mid-century” buildings were designed to
serve and house patients and staff until the new South Campus facilities
were completed.
Compounding the problem is that to put any of these buildings back into
service will require a significant amount of environmental, structural, and
functional improvements. Research reveals that renovation, were it
pursued, would include but not be limited to seismic structural upgrades;
upgrades to mechanical systems such as heating, cooling, and
plumbing; removal and remediation of lead paint and asbestos;
significant interior remodels in order to address small, narrow rooms,
large hallways, and other design irregularities; window replacement; the
potential addition of parking (depending on use); considerable deferred
maintenance; potential on and off-site utility work; and the design and
2 PRELIMINARY NORTH CAMPUS VISION, STRATEGY, AND DEVELOPMENT PROGRAM – DRAFT
LELAND CONSULTING GROUP
People Places Prosperity
Revitalizing Downtowns Creating Partnerships
Targeting Real Estate Success Shaping Financial Strategies
Strengthening Community Enabling Sustainability & Livability
Making Cities Work
610 SW Alder Street Suite 1008
Portland Oregon 97205-3611
p 503.222.1600 f 503.222.5078
New York New York
Los Angeles California Bend Oregon
Abilene Texas San Miguel de Allende Mexico
www.lelandconsulting.com
Campus Vision, Strategy, and Development Program
not been on a comprehensive understanding of the regulatory
environment but, rather, on the most realistic and market-based reuse
alternatives.
A final and critical consideration is the State’s overall financial situation.
According to the 2012 10-Year Plan for Oregon, “Oregon is in a fiscal
crisis that will persist.” The State recently directed all administrative
functions within the Executive Branch to cut expenditures by 10 percent.
A key part of the State’s strategy going forward is to cut costs and divest
itself of unneeded assets in order to provide high value in its core
service areas—education, healthcare, economic development, and
others.
RECOMMENDED REUSE STRATEGY
The team collectively evaluated a number of different options, including
the potential renovation of the buildings into offices for State employees,
which initially appeared viable for several reasons. However, because of
the State’s policy of gathering key functions together near the Capitol
Mall (per the Capitol Mall Area Plan and other documents), the
availability of State-owned land and significant transportation
improvements near the Mall, the building and site issues described
above, and other considerations, this option was eliminated. The State
has no intention of reoccupying these structures.
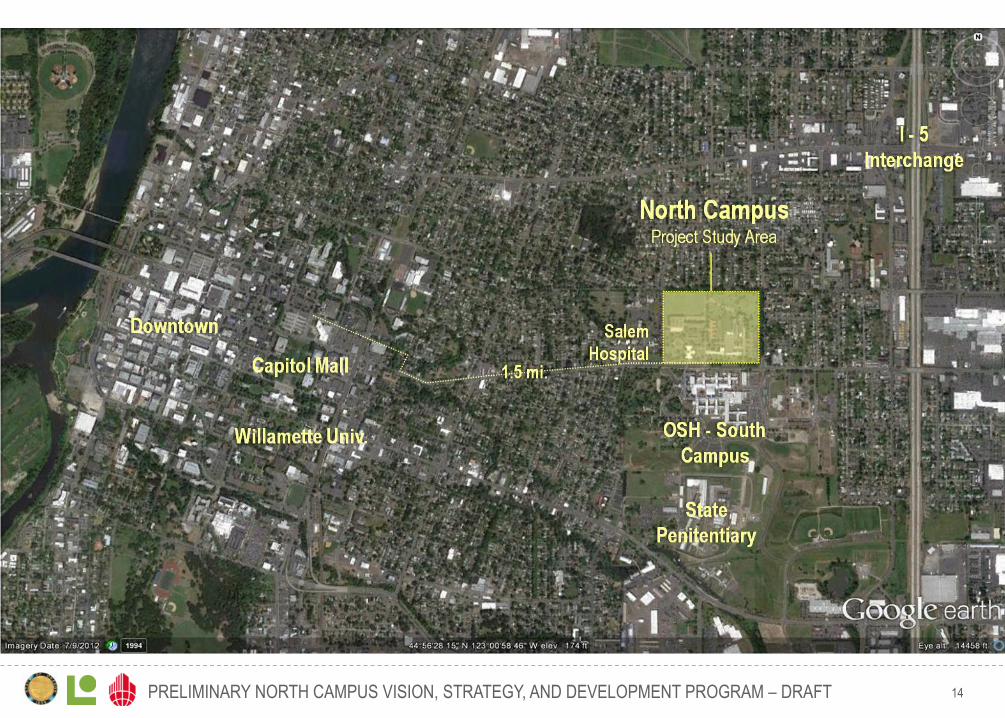
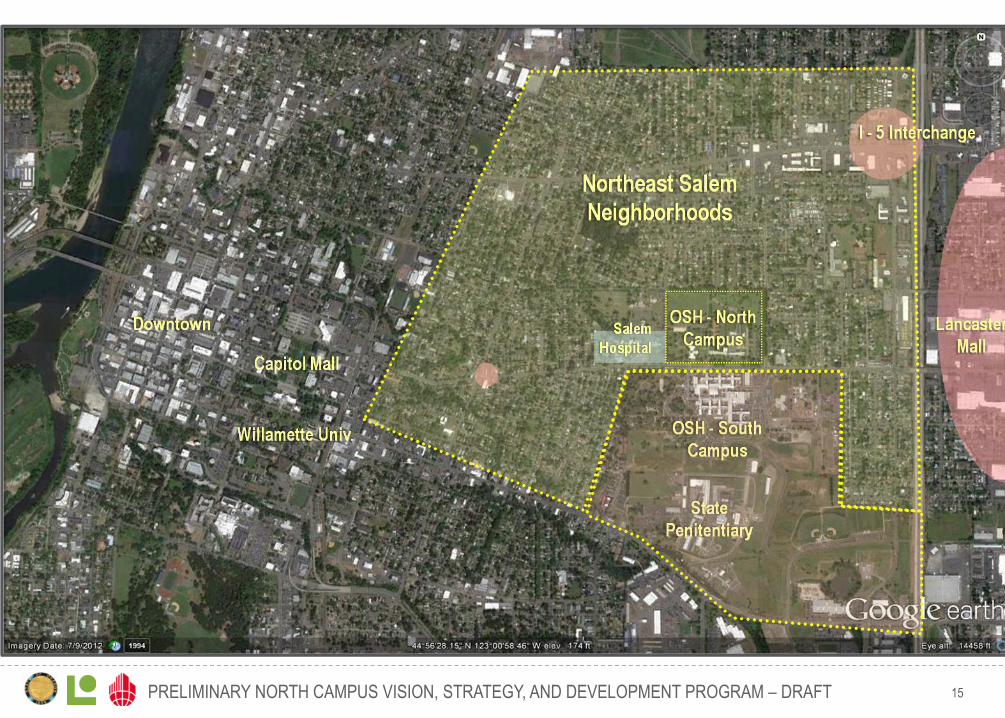
The North Campus is located within several older Northeast Salem
neighborhoods and with good proximity to concentrated employment at
State, County, and City offices, as well as a significant nearby medical
community. The property also has reasonably high visibility, particularly
engineering professional fees required to plan and manage changes.
The cost of upgrading the five mid-century buildings to modern office
standards has been estimated at $74 to $92 million based on the State’s
recent renovation of the Eugene State Office Building and other
comparable projects.
Even if the mid-century buildings could be rehabilitated, their former use
would likely result in structures inefficient for traditional market rate
housing, office use, or other purposes. In effect, these buildings no
longer represent assets but, rather, are considered to be liabilities—
liabilities with a significant ongoing maintenance responsibility and cost.
The current regulations governing the site do not allow most reasonable
reuse options and, therefore, will almost certainly require significant
changes. The current City of Salem Comprehensive Plan and zoning
designation is Public and Private Health Services, which allows
healthcare and public administration, but few other activities, to take
place on the site. There are also several layers of historic designations.
The North and South Campuses are both listed on the National Register
of Historic Places, which conveys both some potential tax benefits but,
more importantly, significant restrictions on building modifications,
particularly in the event that the State remains as owner of the site. This
team’s understanding is that private owners of the site will enjoy
significantly greater flexibility in reusing and redeveloping the site than
either the State or City. A City-designated Oregon State Hospital
Historic District overlays the site in addition to the Comprehensive Plan
and zoning designations; and the Salem Historic Landmarks
Commission continues to evaluate individual buildings for inclusion on a
local list of historic landmarks. The emphasis of this team, however, has
3 PRELIMINARY NORTH CAMPUS VISION, STRATEGY, AND DEVELOPMENT PROGRAM – DRAFT
LELAND CONSULTING GROUP
People Places Prosperity
Revitalizing Downtowns Creating Partnerships
Targeting Real Estate Success Shaping Financial Strategies
Strengthening Community Enabling Sustainability & Livability
Making Cities Work
610 SW Alder Street Suite 1008
Portland Oregon 97205-3611
p 503.222.1600 f 503.222.5078
New York New York
Los Angeles California Bend Oregon
Abilene Texas San Miguel de Allende Mexico
www.lelandconsulting.com
Campus Vision, Strategy, and Development Program
The overall goal is to develop a variety of uses to establish a true mixed-
use community. A key component of the vision is a mix of housing that
will serve different demographic segments that will be addressed
simultaneously, from individuals and couples, active families, and the
senior population. Residential neighborhood development has also
changed dramatically in recent years, and the focus now is on creating
an engaging and multifaceted community, rather than a “homogenous”
suburban environment. This trend can benefit this site, nearby residents,
and the City.
The housing element of the program is fundamental, since it will provide
the vast majority of capital needed to achieve reuse of the site. Housing
has the potential to deliver revenue to the State via a land sale, tax base
to the City, and value and motivation to quality private sector
development teams. Therefore, a key focus of this report and the
recommended vision is on the viability and type of housing markets
(future residents) to be served. Some portion of revenues resulting from
sale of the housing portion of the property may be needed on-site (for
demolition, cleanup, etc.); however, most revenue should be returned to
the State to relieve the State and Oregon’s citizens with the on-going
annual maintenance burden.
ACTIONS NEEDED TO ACHIEVE THE VISION
In order to realize such a community, a number of regulatory changes
will be required. The changes, outlined below, represent the what this
team believes is the best method to return the North Campus to active
uses that benefit the community, preserve and enhance the district’s
from Center Street, and can serve the nearby neighborhoods and
workforce with a modest amount of retail space within walking distance.
For the project to be successful, it will require an initial cooperative effort
between the City of Salem and the State of Oregon to entitle the
property. Following this effort, a public-private partnership between the
State and private developers is the team’s recommendation in order to
realize redevelopment of the property.
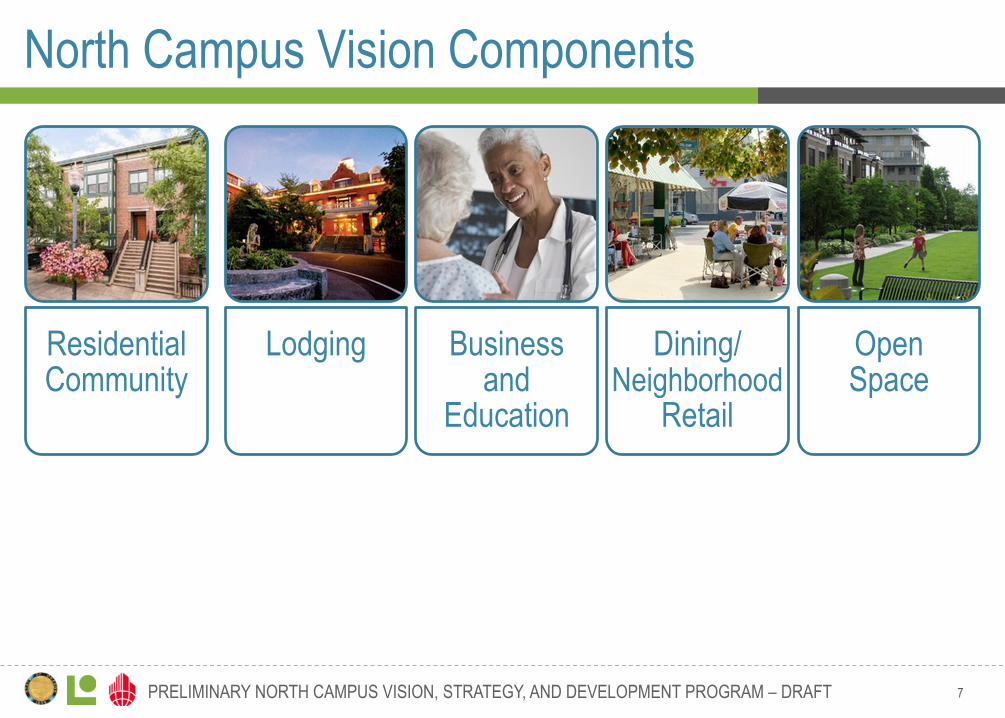
Given this situation, the team is recommending a North Campus reuse
vision and strategy that includes the following components and is further
explained below:
• A varied and attractive residential community that provides a range
of housing options and connects with surrounding neighborhoods;
• Lodging, particularly within the Dome Building and surrounding
grounds;
• Opportunity for small business and/or education space (potentially
within Breitenbush Hall or a new structure);
• A small dining and neighborhood retail node serving the future
residents, employees, and businesses on site as well as those from
surrounding areas;
• Open space that connects to the existing network of open space
extending from the South Campus to Geer Community Park; and
• Interpretive signage that commemorates the history of the district
and connects it to the Oregon State Hospital Museum, Kirkbride
Building, and other historical assets to the south.
4 PRELIMINARY NORTH CAMPUS VISION, STRATEGY, AND DEVELOPMENT PROGRAM – DRAFT
LELAND CONSULTING GROUP
People Places Prosperity
Revitalizing Downtowns Creating Partnerships
Targeting Real Estate Success Shaping Financial Strategies
Strengthening Community Enabling Sustainability & Livability
Making Cities Work
610 SW Alder Street Suite 1008
Portland Oregon 97205-3611
p 503.222.1600 f 503.222.5078
New York New York
Los Angeles California Bend Oregon
Abilene Texas San Miguel de Allende Mexico
www.lelandconsulting.com
Campus Vision, Strategy, and Development Program
the nearby neighborhood. The initial forecast of private capital
investment to achieve the vision is $100 million, which when completed
within a five-year time forecast, would bring $500,000 to the City of
Salem through property taxes. Estimates have not been fully analyzed
at this time regarding employment; however, a preliminary estimate is
that the construction efforts on site would create 700 to 900
construction-related jobs, and ongoing operation would create
approximately 75 to 150 permanent jobs.
In our experience, having served over 250 cities across the country, and
served as strategic development advisor for over 90 downtowns
including work in downtown Salem on behalf of the City of Salem, this
mixed-use community solution is likely the only realistic way to turn this
liability into a meaningful asset for the State, City, and Salem
community. In order to fit within the character of the existing
neighborhood and to offer housing choice at an achievable price to
people living in or wishing to move to Salem, our view is that the price
point within this community should accommodate both first and second
move-up housing as well as households that are looking to downsize to
a quality, well-planned, and designed environment. We urge
consideration and discussion about the merits of this revitalized North
Campus community, its contribution to the greater Salem community,
the establishment of additional tax base to the City, and relief to the
State of Oregon to remove a costly and unused set of buildings that
have outlived their former purpose. These recommendations are based
on our research, analysis, and professional opinion as consultants and
advisors to the public and private sectors of the real estate industry.
Thank you.
most valuable historic features (Dome Building), and relieve the State
from significant operating and maintenance costs at a time when such
costs are unsustainable, as well as putting the property onto the City of
Salem tax rolls.
With its former use as a publicly-owned hospital facility, a mixed-use
Comprehensive Plan designation and appropriate mixed-use zone will
be necessary. We recommend that the geographic boundaries and
regulations pertaining to the national and local historic district
boundaries be modified and applied specifically to the Dome Building
and immediate site serving the Dome Building. The historic nature of the
site and its role in treating psychiatric patients over the past 130 years
should be memorialized in the Oregon State Hospital Museum now
operating at the South Campus. As stated above, the Dome Building
and Breitenbush Hall are believed to have the greatest potential for
reuse. We recommend that the other buildings be de-listed.
In order to convey to both the State and the City that this project has a
realistic basis, we carried out a preliminary housing reconnaissance to
be able to understand the scale of the market and how multiple products
serving multiple segments of the market would have to be
simultaneously pursued. This implies a master developer with a sale to
multiple product-specific (housing, lodging, education, and commercial)
developers who would initiate development simultaneously or as close
thereto as possible. Some roads will be necessary in the interior of the
site, though much of the circulation is either already present or will be
within the private confines of the different projects that contribute to the
overall community. One or more areas should be set aside for public
open space and integrated in a way that is both attractive and
accessible to residents of this new community along with residents of
5 PRELIMINARY NORTH CAMPUS VISION, STRATEGY, AND DEVELOPMENT PROGRAM – DRAFT
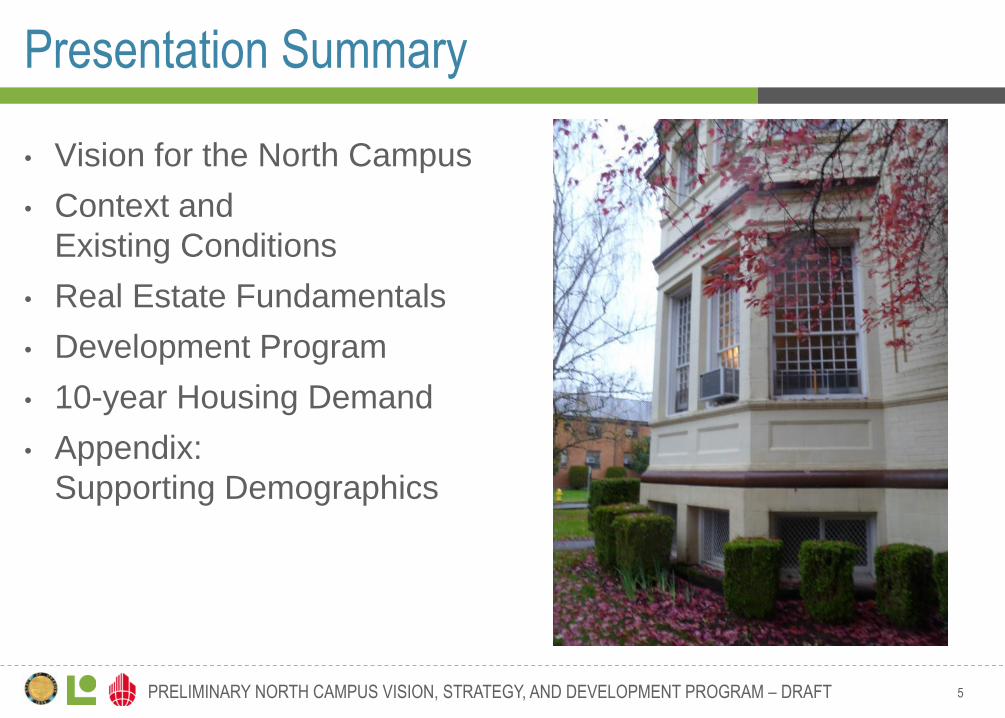
Presentation Summary
• Vision for the North Campus
• Context and
Existing Conditions
• Real Estate Fundamentals
• Development Program
• 10-year Housing Demand
• Appendix:
Supporting Demographics
The Vision
7 PRELIMINARY NORTH CAMPUS VISION, STRATEGY, AND DEVELOPMENT PROGRAM – DRAFT
North Campus Vision Components
Residential Community
Lodging Business and
Education
Dining/ Neighborhood
Retail
Open Space
8 PRELIMINARY NORTH CAMPUS VISION, STRATEGY, AND DEVELOPMENT PROGRAM – DRAFT
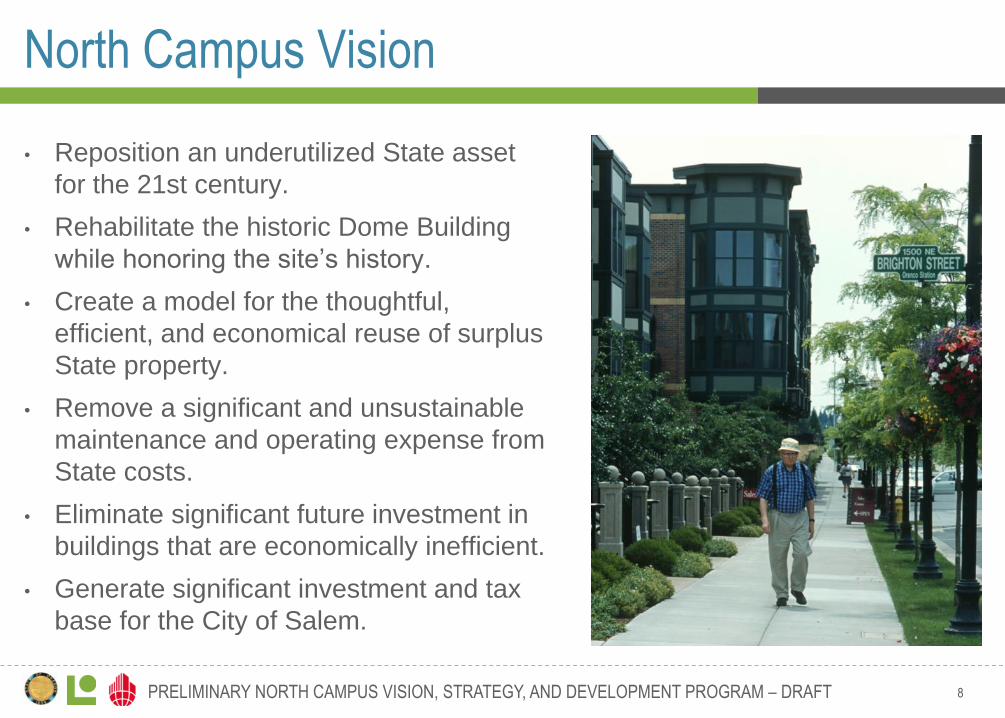
North Campus Vision
• Reposition an underutilized State asset
for the 21st century.
• Rehabilitate the historic Dome Building
while honoring the site’s history.
• Create a model for the thoughtful,
efficient, and economical reuse of surplus
State property.
• Remove a significant and unsustainable
maintenance and operating expense from
State costs.
• Eliminate significant future investment in
buildings that are economically inefficient.
• Generate significant investment and tax
base for the City of Salem.
9 PRELIMINARY NORTH CAMPUS VISION, STRATEGY, AND DEVELOPMENT PROGRAM – DRAFT
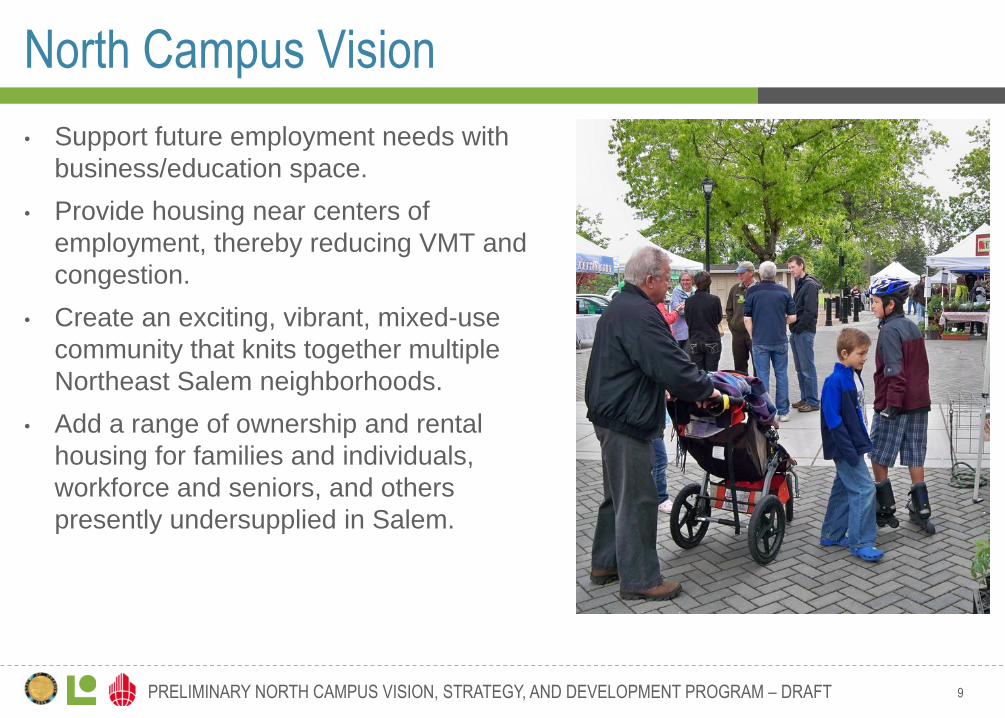
North Campus Vision
• Support future employment needs with
business/education space.
• Provide housing near centers of
employment, thereby reducing VMT and
congestion.
• Create an exciting, vibrant, mixed-use
community that knits together multiple
Northeast Salem neighborhoods.
• Add a range of ownership and rental
housing for families and individuals,
workforce and seniors, and others
presently undersupplied in Salem.
Context and
Existing Conditions
11 PRELIMINARY NORTH CAMPUS VISION, STRATEGY, AND DEVELOPMENT PROGRAM – DRAFT
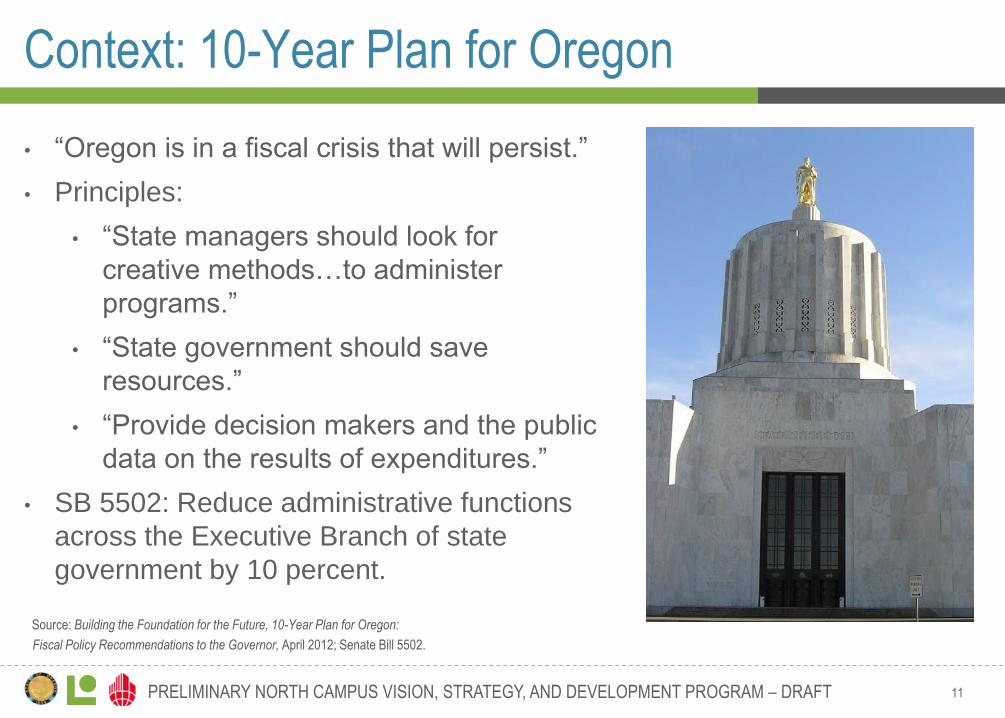
Context: 10-Year Plan for Oregon
• “Oregon is in a fiscal crisis that will persist.”
• Principles:
• “State managers should look for
creative methods…to administer
programs.”
• “State government should save
resources.”
• “Provide decision makers and the public
data on the results of expenditures.”
• SB 5502: Reduce administrative functions
across the Executive Branch of state
government by 10 percent.
Source: Building the Foundation for the Future, 10-Year Plan for Oregon:
Fiscal Policy Recommendations to the Governor, April 2012; Senate Bill 5502.
12 PRELIMINARY NORTH CAMPUS VISION, STRATEGY, AND DEVELOPMENT PROGRAM – DRAFT
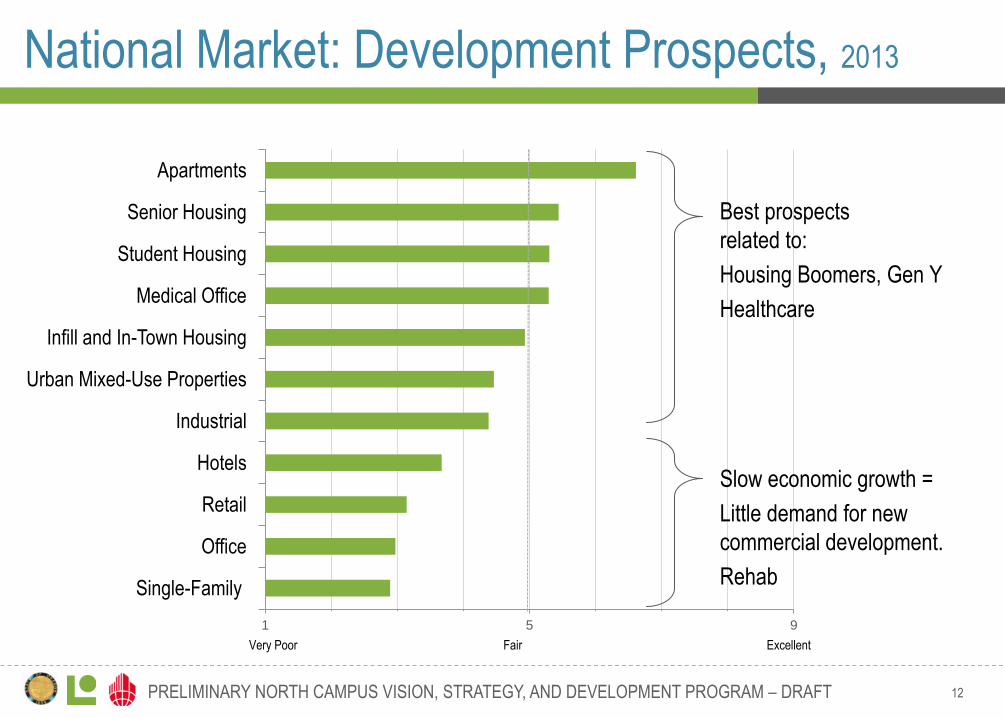
National Market: Development Prospects, 2013
1 2 3 4 5 6 7 8 9
Apartments
Senior Housing
Student Housing
Medical Office
Infill and In-Town Housing
Urban Mixed-Use Properties
Industrial
Hotels
Retail
Office
Single-Family
Very Poor Fair Excellent
Best prospects
related to:
Housing Boomers, Gen Y
Healthcare
Slow economic growth =
Little demand for new
commercial development.
Rehab
13 PRELIMINARY NORTH CAMPUS VISION, STRATEGY, AND DEVELOPMENT PROGRAM – DRAFT
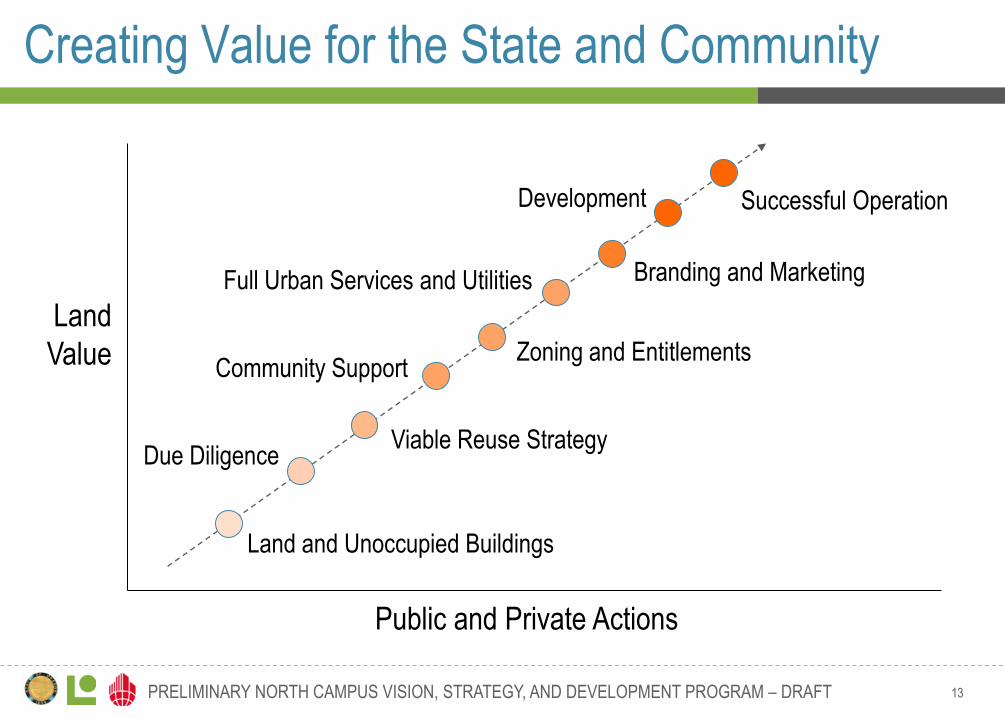
Creating Value for the State and Community
Land
Value
Public and Private Actions
Land and Unoccupied Buildings
Branding and Marketing
Due Diligence
Full Urban Services and Utilities
Development Successful Operation
Community Support
Viable Reuse Strategy
Zoning and Entitlements
14 PRELIMINARY NORTH CAMPUS VISION, STRATEGY, AND DEVELOPMENT PROGRAM – DRAFT
15 PRELIMINARY NORTH CAMPUS VISION, STRATEGY, AND DEVELOPMENT PROGRAM – DRAFT
16 PRELIMINARY NORTH CAMPUS VISION, STRATEGY, AND DEVELOPMENT PROGRAM – DRAFT
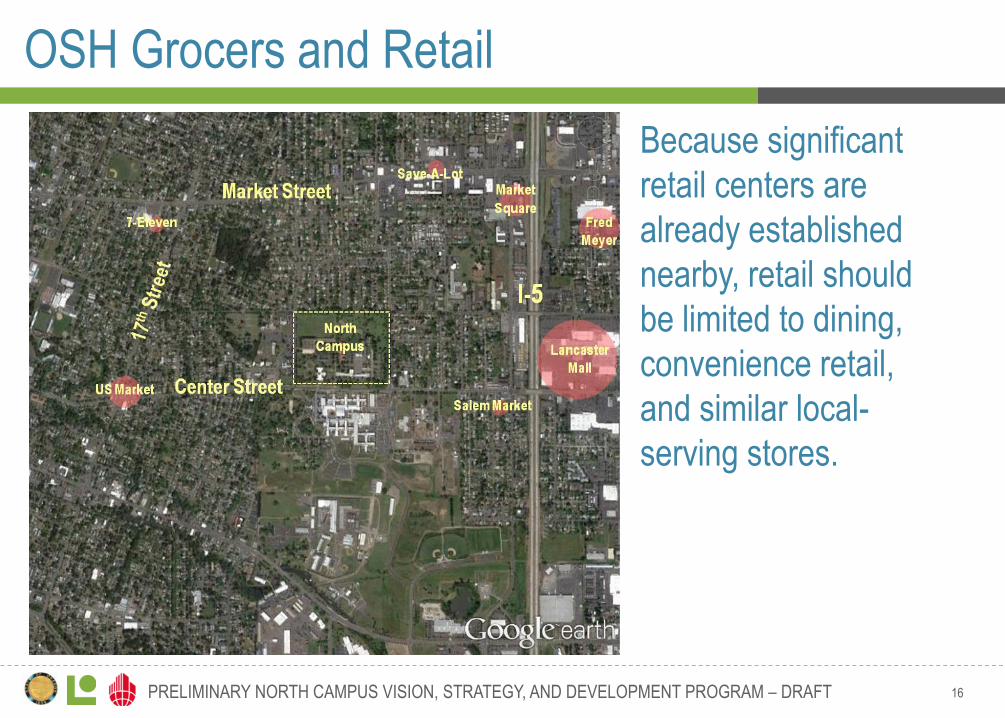
OSH Grocers and Retail
Because significant
retail centers are
already established
nearby, retail should
be limited to dining,
convenience retail,
and similar local-
serving stores.
Grocery slide:
Parks/Open space
Traffic slide
17 PRELIMINARY NORTH CAMPUS VISION, STRATEGY, AND DEVELOPMENT PROGRAM – DRAFT
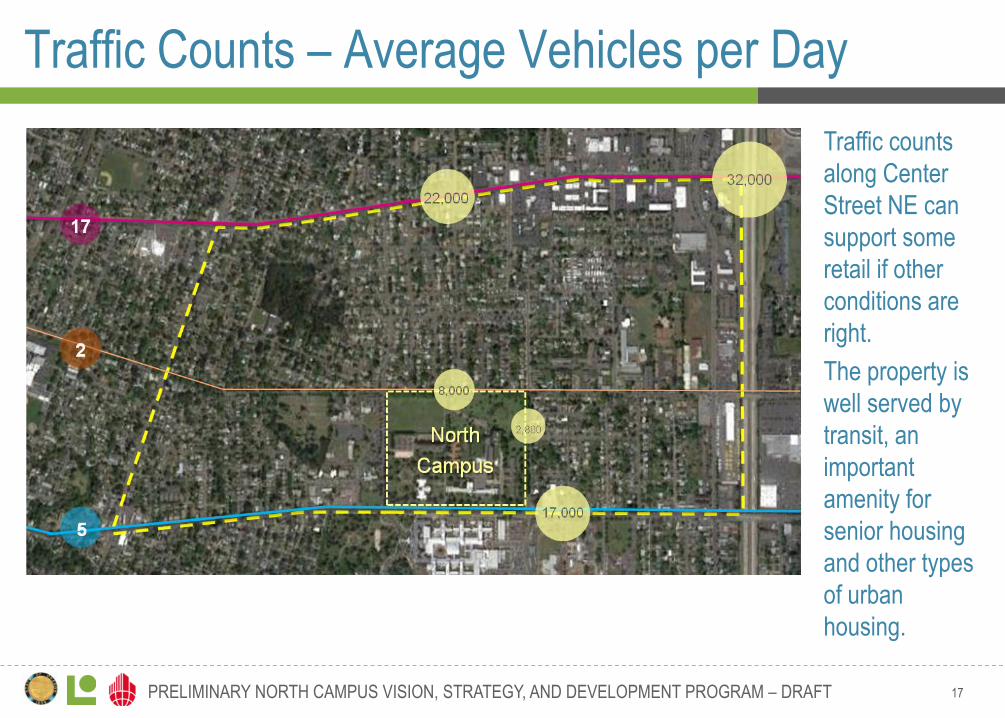
Traffic Counts – Average Vehicles per Day •
every 15 minutes
•
30 minutes
•
into downtown
•
Traffic counts
along Center
Street NE can
support some
retail if other
conditions are
right.
The property is
well served by
transit, an
important
amenity for
senior housing
and other types
of urban
housing.
18 PRELIMINARY NORTH CAMPUS VISION, STRATEGY, AND DEVELOPMENT PROGRAM – DRAFT
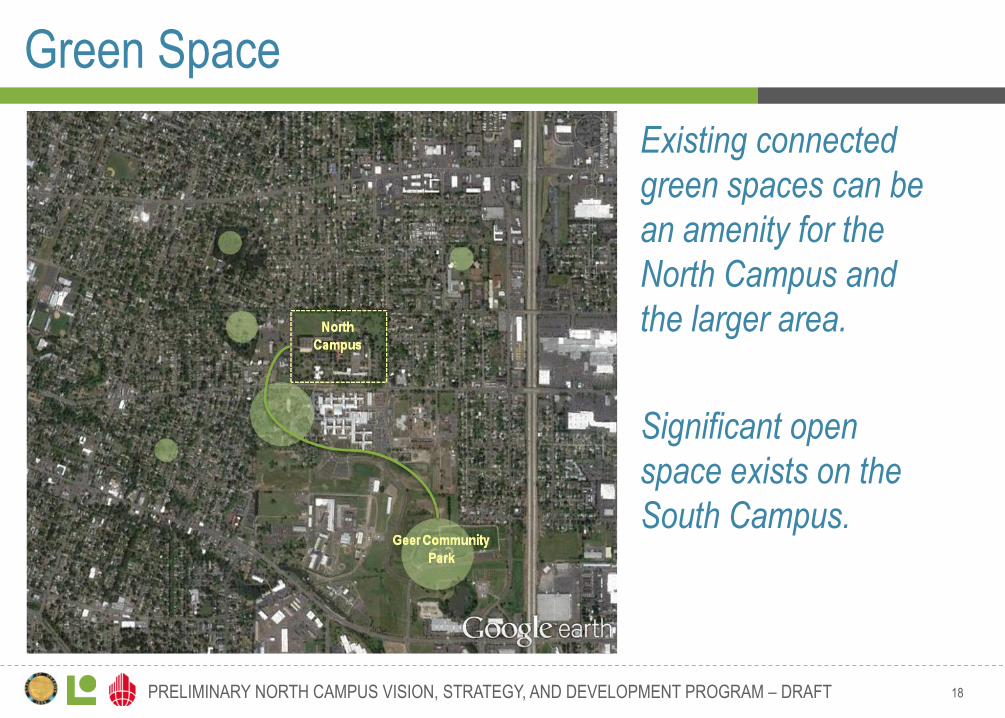
Green Space Oregon State Forestry Department
Headquarters: located at Oregon
State Penitentiary
Grocery slide:
Parks/Open space
Traffic slide
Existing connected
green spaces can be
an amenity for the
North Campus and
the larger area.
Significant open
space exists on the
South Campus.
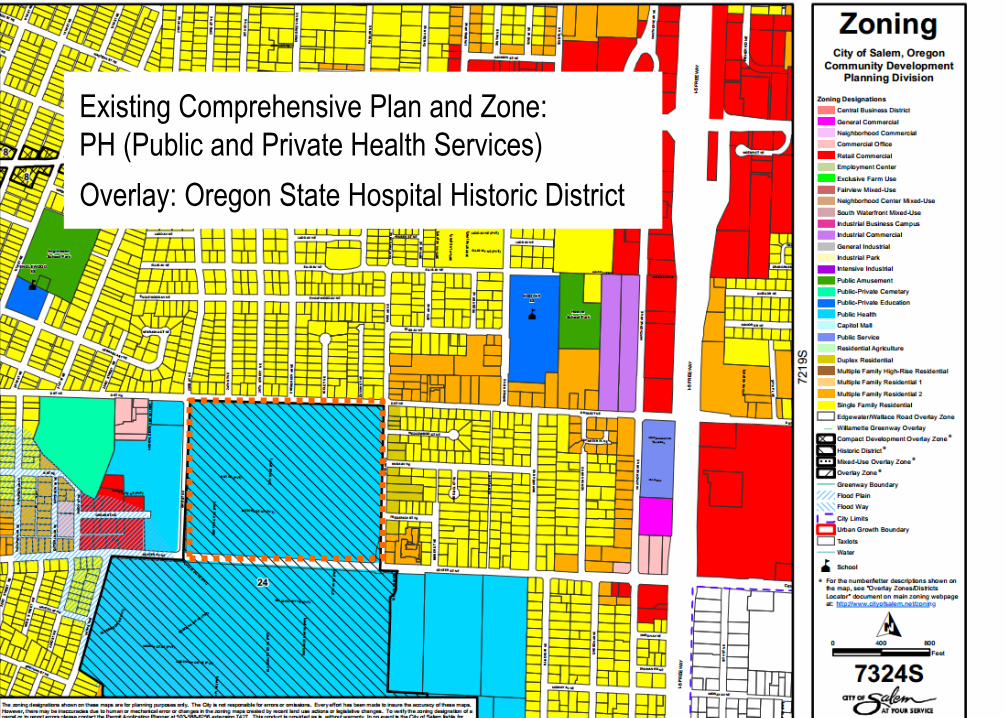
Zoning Map
Existing Comprehensive Plan and Zone:
PH (Public and Private Health Services)
Overlay: Oregon State Hospital Historic District
20 PRELIMINARY NORTH CAMPUS VISION, STRATEGY, AND DEVELOPMENT PROGRAM – DRAFT
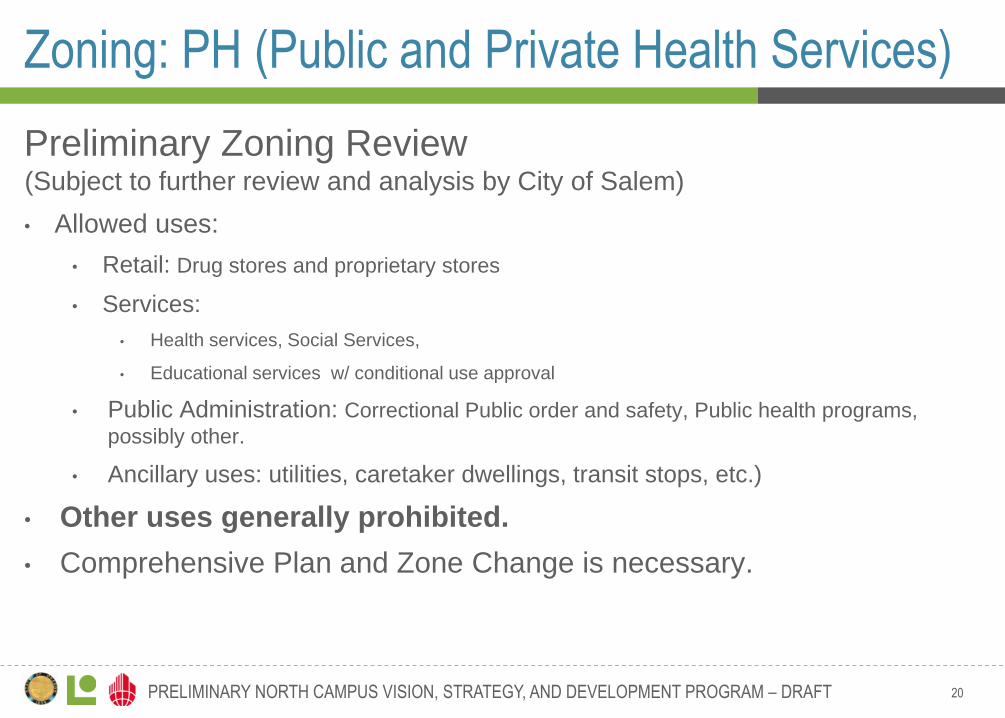
Zoning: PH (Public and Private Health Services)
Preliminary Zoning Review (Subject to further review and analysis by City of Salem)
• Allowed uses:
• Retail: Drug stores and proprietary stores
• Services:
• Health services, Social Services,
• Educational services w/ conditional use approval
• Public Administration: Correctional Public order and safety, Public health programs,
possibly other.
• Ancillary uses: utilities, caretaker dwellings, transit stops, etc.)
• Other uses generally prohibited.
• Comprehensive Plan and Zone Change is necessary.
21 PRELIMINARY NORTH CAMPUS VISION, STRATEGY, AND DEVELOPMENT PROGRAM – DRAFT
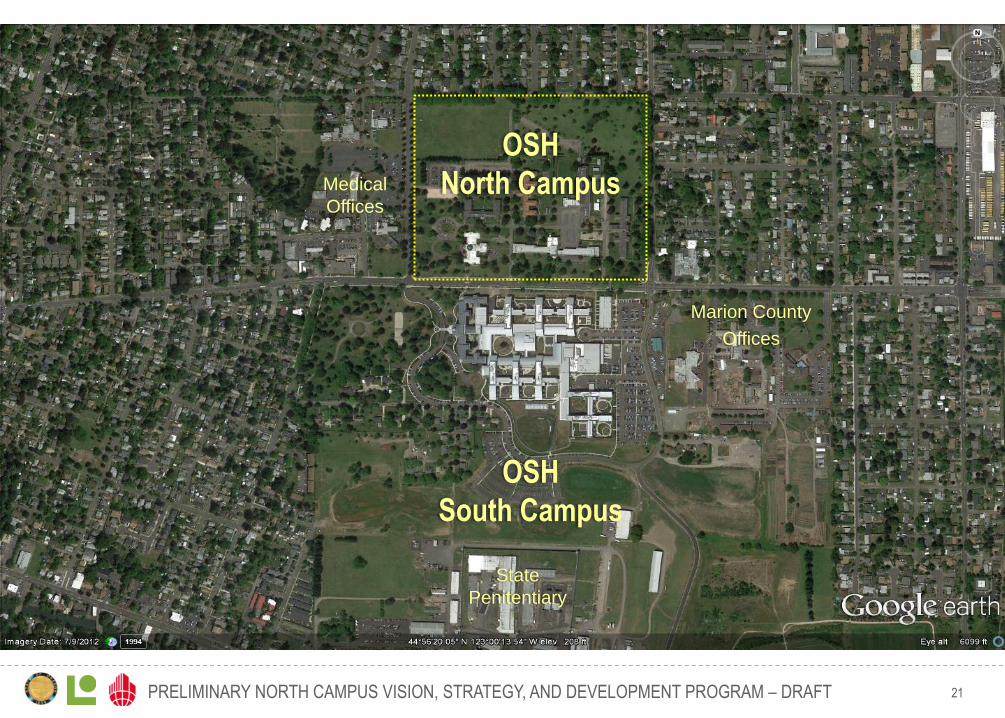
Marion County
Offices
Medical
Offices
OSH
North Campus
OSH
South Campus
State
Penitentiary
22 PRELIMINARY NORTH CAMPUS VISION, STRATEGY, AND DEVELOPMENT PROGRAM – DRAFT
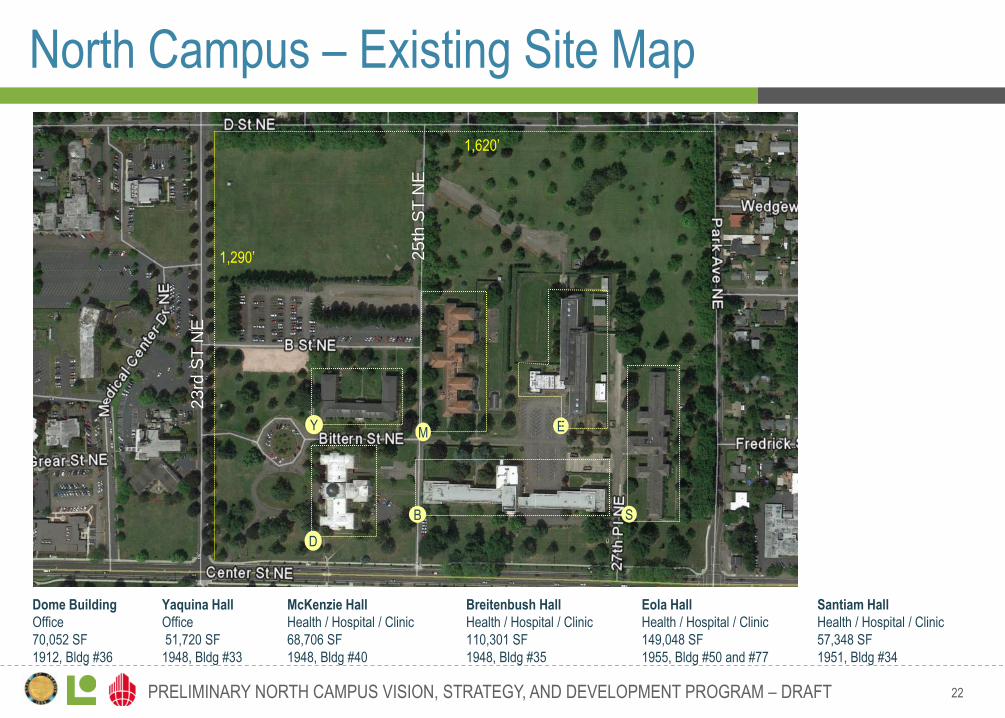
Dome Building
Office
70,052 SF
1912, Bldg #36
Breitenbush Hall
Health / Hospital / Clinic
110,301 SF
1948, Bldg #35
Eola Hall
Health / Hospital / Clinic
149,048 SF
1955, Bldg #50 and #77
McKenzie Hall
Health / Hospital / Clinic
68,706 SF
1948, Bldg #40
Yaquina Hall
Office
51,720 SF
1948, Bldg #33
Santiam Hall
Health / Hospital / Clinic
57,348 SF
1951, Bldg #34
North Campus – Existing Site Map
M
Y
D
B
E
S
1,290’
1,620’
23
rd S
T N
E
25
th S
T N
E
23 PRELIMINARY NORTH CAMPUS VISION, STRATEGY, AND DEVELOPMENT PROGRAM – DRAFT
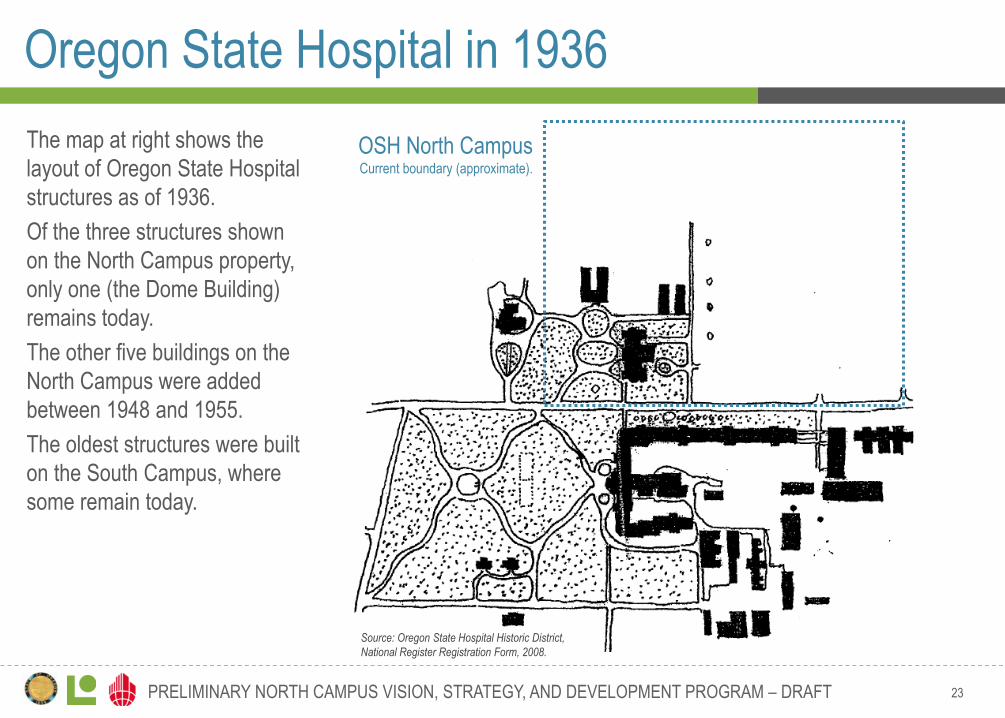
Oregon State Hospital in 1936
OSH North Campus Current boundary (approximate).
The map at right shows the
layout of Oregon State Hospital
structures as of 1936.
Of the three structures shown
on the North Campus property,
only one (the Dome Building)
remains today.
The other five buildings on the
North Campus were added
between 1948 and 1955.
The oldest structures were built
on the South Campus, where
some remain today.
Source: Oregon State Hospital Historic District,
National Register Registration Form, 2008.
24 PRELIMINARY NORTH CAMPUS VISION, STRATEGY, AND DEVELOPMENT PROGRAM – DRAFT
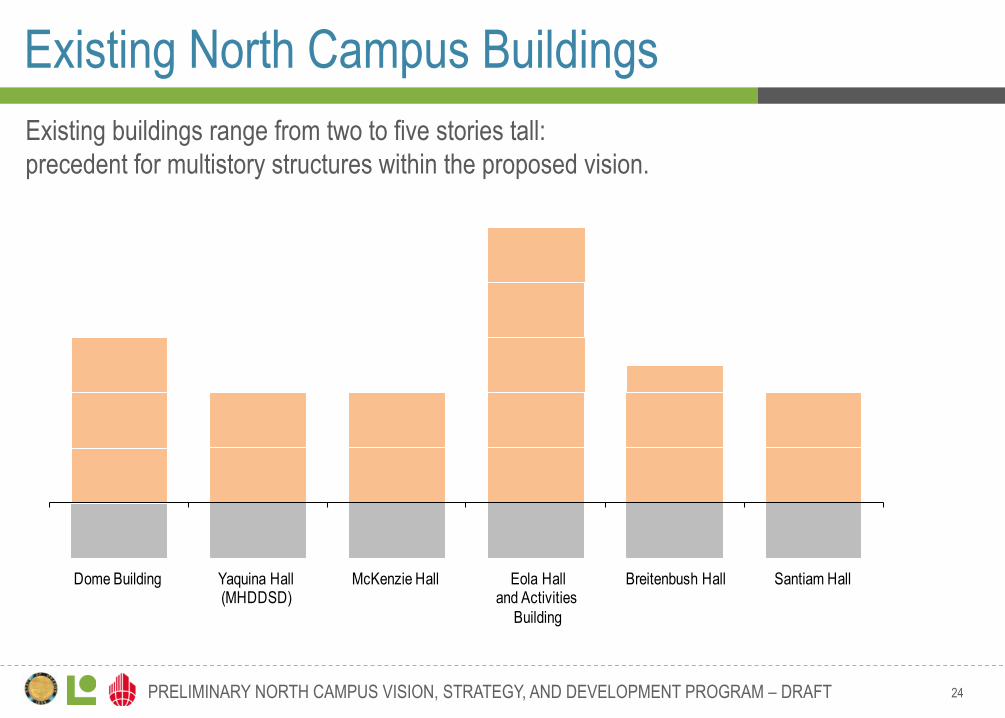
Existing North Campus Buildings
Existing buildings range from two to five stories tall:
precedent for multistory structures within the proposed vision.
-1
0
1
2
3
4
5
Dome Building Yaquina Hall (MHDDSD)
McKenzie Hall Eola Hall and Activities
Building
Breitenbush Hall Santiam Hall
25 PRELIMINARY NORTH CAMPUS VISION, STRATEGY, AND DEVELOPMENT PROGRAM – DRAFT
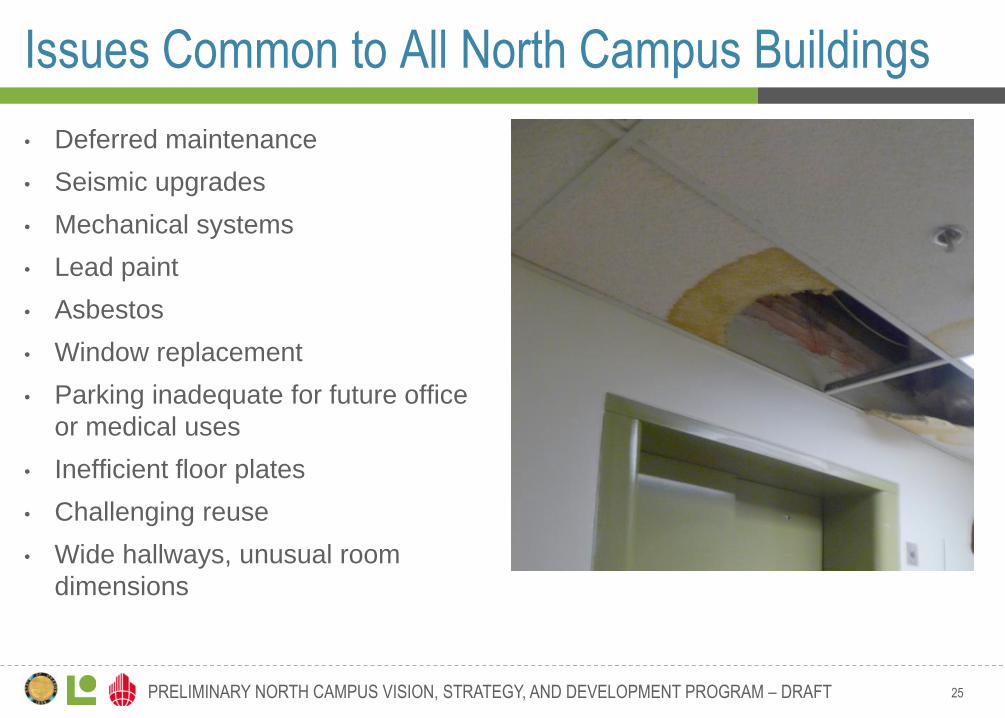
Issues Common to All North Campus Buildings
• Deferred maintenance
• Seismic upgrades
• Mechanical systems
• Lead paint
• Asbestos
• Window replacement
• Parking inadequate for future office
or medical uses
• Inefficient floor plates
• Challenging reuse
• Wide hallways, unusual room
dimensions
26 PRELIMINARY NORTH CAMPUS VISION, STRATEGY, AND DEVELOPMENT PROGRAM – DRAFT
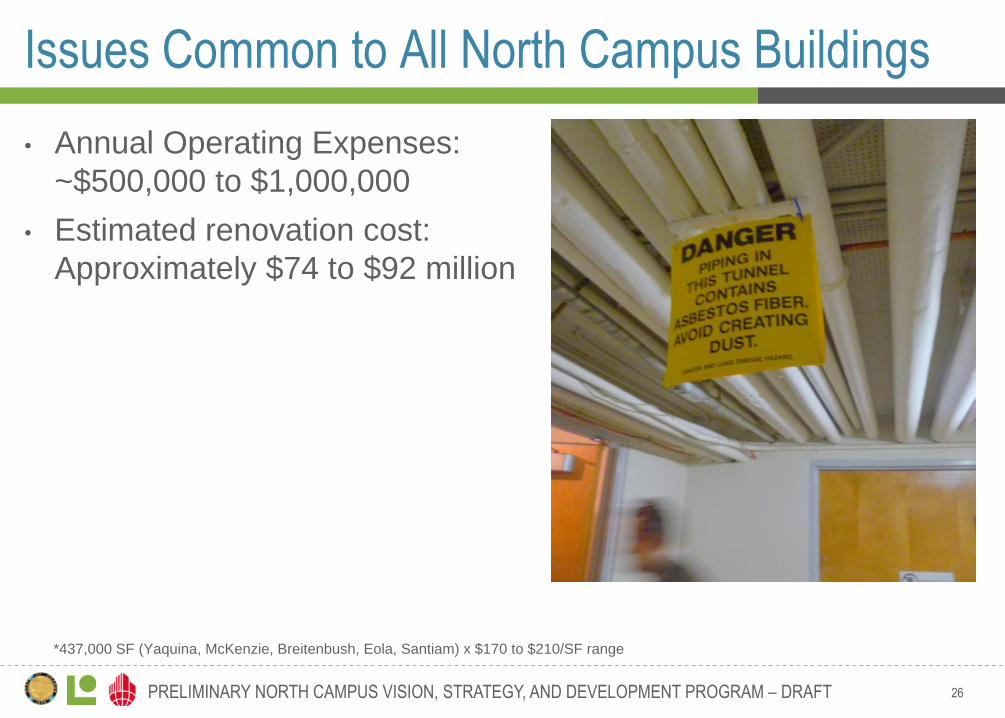
Issues Common to All North Campus Buildings
• Annual Operating Expenses:
~$500,000 to $1,000,000
• Estimated renovation cost:
Approximately $74 to $92 million
*437,000 SF (Yaquina, McKenzie, Breitenbush, Eola, Santiam) x $170 to $210/SF range
Real Estate Fundamentals
28 PRELIMINARY NORTH CAMPUS VISION, STRATEGY, AND DEVELOPMENT PROGRAM – DRAFT
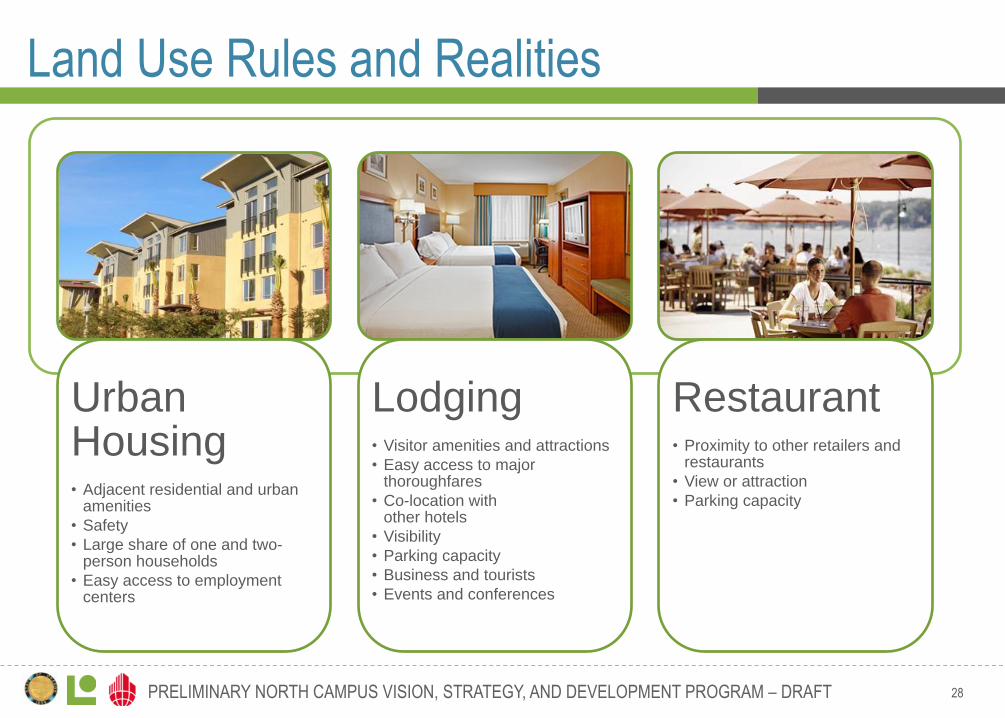
Urban Housing • Adjacent residential and urban
amenities
• Safety
• Large share of one and two-person households
• Easy access to employment centers
Lodging • Visitor amenities and attractions
• Easy access to major thoroughfares
• Co-location with other hotels
• Visibility
• Parking capacity
• Business and tourists
• Events and conferences
Restaurant • Proximity to other retailers and
restaurants
• View or attraction
• Parking capacity
Land Use Rules and Realities
29 PRELIMINARY NORTH CAMPUS VISION, STRATEGY, AND DEVELOPMENT PROGRAM – DRAFT
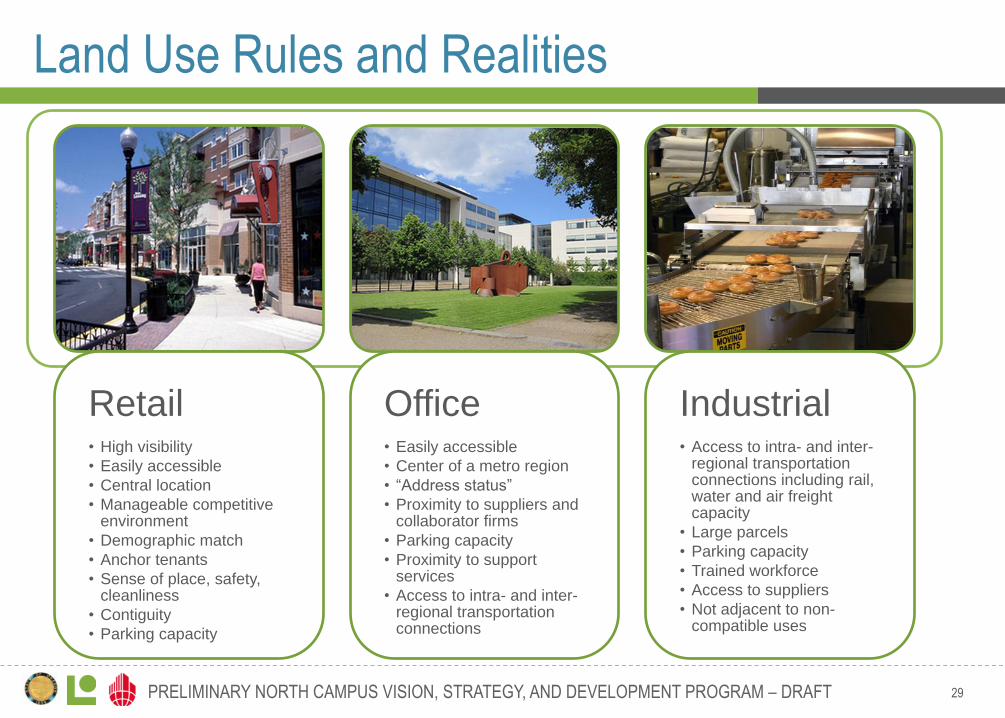
Land Use Rules and Realities
Retail • High visibility
• Easily accessible
• Central location
• Manageable competitive environment
• Demographic match
• Anchor tenants
• Sense of place, safety, cleanliness
• Contiguity
• Parking capacity
Office • Easily accessible
• Center of a metro region
• “Address status”
• Proximity to suppliers and collaborator firms
• Parking capacity
• Proximity to support services
• Access to intra- and inter-regional transportation connections
Industrial • Access to intra- and inter-
regional transportation connections including rail, water and air freight capacity
• Large parcels
• Parking capacity
• Trained workforce
• Access to suppliers
• Not adjacent to non-compatible uses
30 PRELIMINARY NORTH CAMPUS VISION, STRATEGY, AND DEVELOPMENT PROGRAM – DRAFT
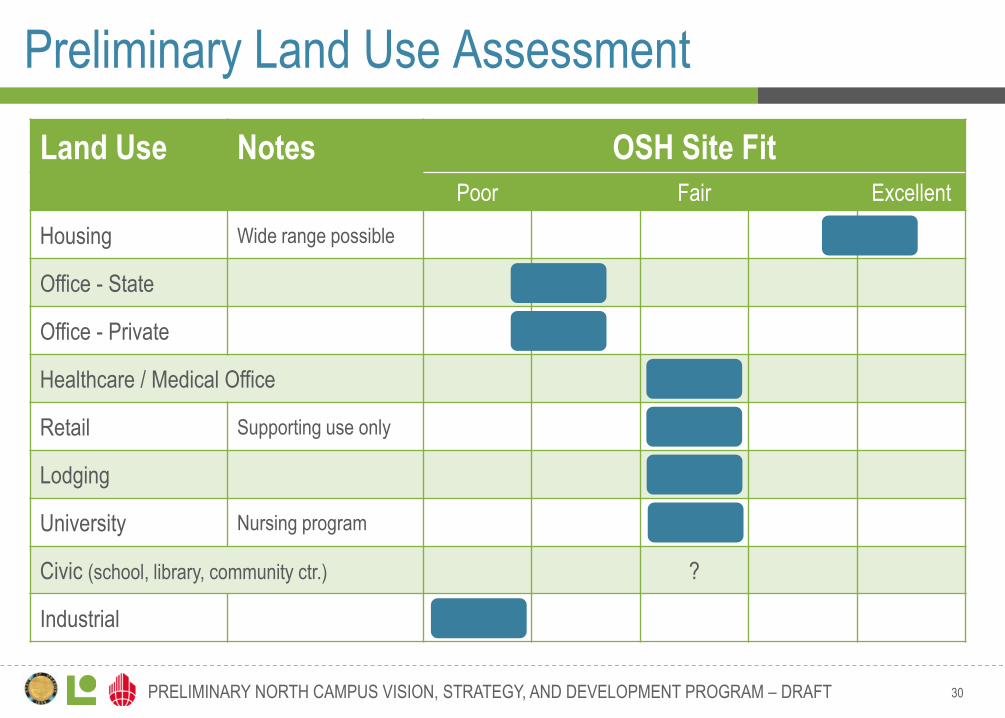
Preliminary Land Use Assessment
Land Use Notes OSH Site Fit
Poor Fair Excellent
Housing Wide range possible
Office - State
Office - Private
Healthcare / Medical Office
Retail Supporting use only
Lodging
University Nursing program
Civic (school, library, community ctr.) ?
Industrial
The Development Program
32 PRELIMINARY NORTH CAMPUS VISION, STRATEGY, AND DEVELOPMENT PROGRAM – DRAFT
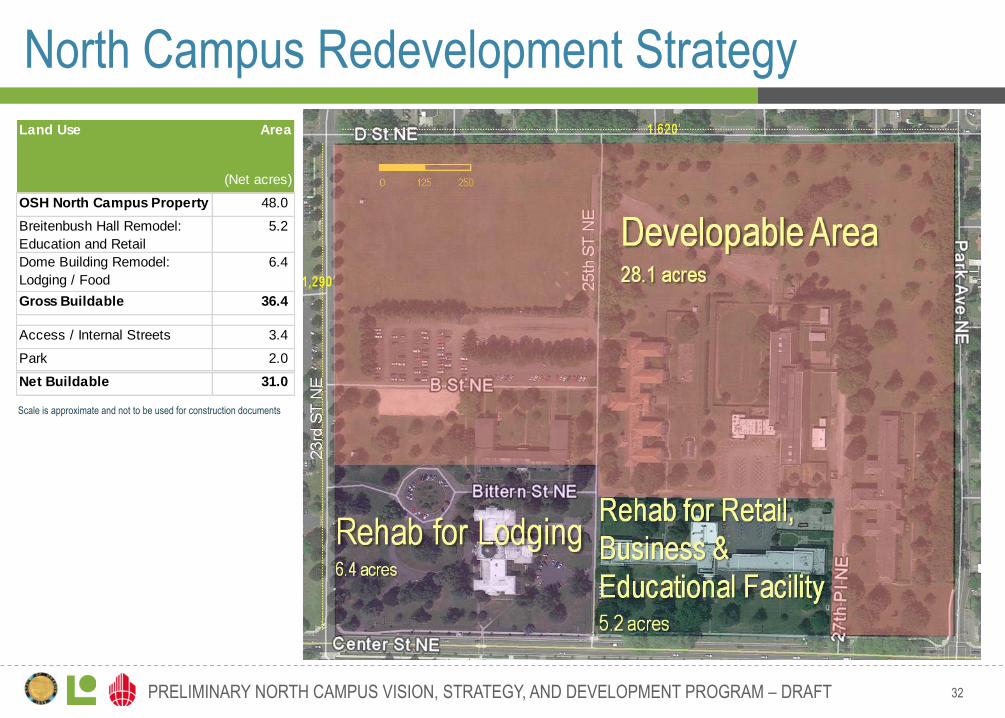
Scale is approximate and not to be used for construction documents
North Campus Redevelopment Strategy
Land Use Area
(Net acres)
OSH North Campus Property 48.0
Breitenbush Hall Remodel:
Education and Retail
5.2
Dome Building Remodel:
Lodging / Food
6.4
Gross Buildable 36.4
Access / Internal Streets 3.4
Park 2.0
Net Buildable 31.0
33 PRELIMINARY NORTH CAMPUS VISION, STRATEGY, AND DEVELOPMENT PROGRAM – DRAFT
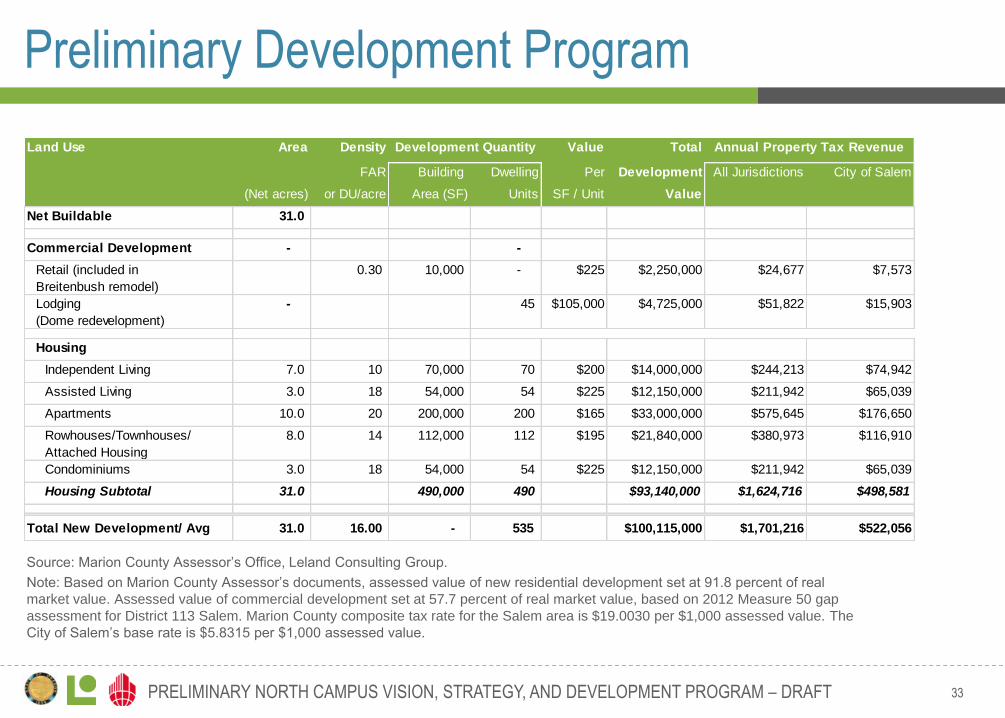
Preliminary Development Program
Source: Marion County Assessor’s Office, Leland Consulting Group.
Note: Based on Marion County Assessor’s documents, assessed value of new residential development set at 91.8 percent of real
market value. Assessed value of commercial development set at 57.7 percent of real market value, based on 2012 Measure 50 gap
assessment for District 113 Salem. Marion County composite tax rate for the Salem area is $19.0030 per $1,000 assessed value. The
City of Salem’s base rate is $5.8315 per $1,000 assessed value.
Land Use Area Density Value Total
FAR Building Dwelling Per Development All Jurisdictions City of Salem
(Net acres) or DU/acre Area (SF) Units SF / Unit Value
Net Buildable 31.0
Commercial Development - -
Retail (included in
Breitenbush remodel)
0.30 10,000 - $225 $2,250,000 $24,677 $7,573
Lodging
(Dome redevelopment)
- 45 $105,000 $4,725,000 $51,822 $15,903
Housing
Independent Living 7.0 10 70,000 70 $200 $14,000,000 $244,213 $74,942
Assisted Living 3.0 18 54,000 54 $225 $12,150,000 $211,942 $65,039
Apartments 10.0 20 200,000 200 $165 $33,000,000 $575,645 $176,650
Rowhouses/Townhouses/
Attached Housing
8.0 14 112,000 112 $195 $21,840,000 $380,973 $116,910
Condominiums 3.0 18 54,000 54 $225 $12,150,000 $211,942 $65,039
Housing Subtotal 31.0 490,000 490 $93,140,000 $1,624,716 $498,581
Total New Development/ Avg 31.0 16.00 - 535 $100,115,000 $1,701,216 $522,056
Development Quantity Annual Property Tax Revenue
Housing Projections
35 PRELIMINARY NORTH CAMPUS VISION, STRATEGY, AND DEVELOPMENT PROGRAM – DRAFT
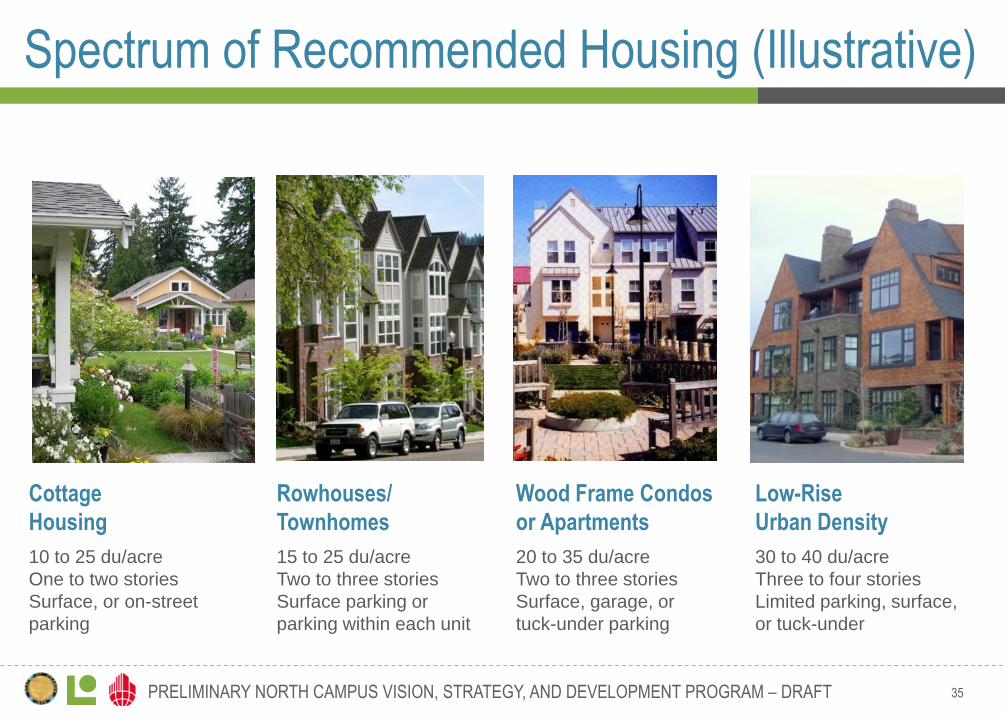
Spectrum of Recommended Housing (Illustrative)
Cottage
Housing
Rowhouses/
Townhomes
Wood Frame Condos
or Apartments
Low-Rise
Urban Density
10 to 25 du/acre
One to two stories
Surface, or on-street
parking
15 to 25 du/acre
Two to three stories
Surface parking or
parking within each unit
20 to 35 du/acre
Two to three stories
Surface, garage, or
tuck-under parking
30 to 40 du/acre
Three to four stories
Limited parking, surface,
or tuck-under
36 PRELIMINARY NORTH CAMPUS VISION, STRATEGY, AND DEVELOPMENT PROGRAM – DRAFT
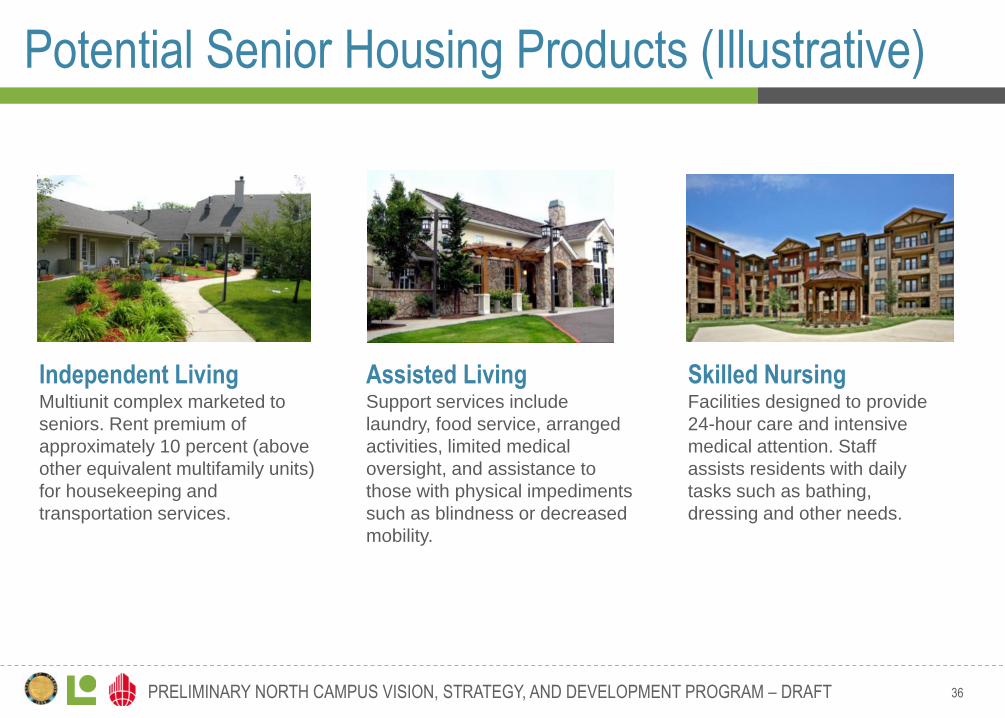
Potential Senior Housing Products (Illustrative)
Independent Living Assisted Living Skilled Nursing Multiunit complex marketed to
seniors. Rent premium of
approximately 10 percent (above
other equivalent multifamily units)
for housekeeping and
transportation services.
Support services include
laundry, food service, arranged
activities, limited medical
oversight, and assistance to
those with physical impediments
such as blindness or decreased
mobility.
Facilities designed to provide
24-hour care and intensive
medical attention. Staff
assists residents with daily
tasks such as bathing,
dressing and other needs.
37 PRELIMINARY NORTH CAMPUS VISION, STRATEGY, AND DEVELOPMENT PROGRAM – DRAFT
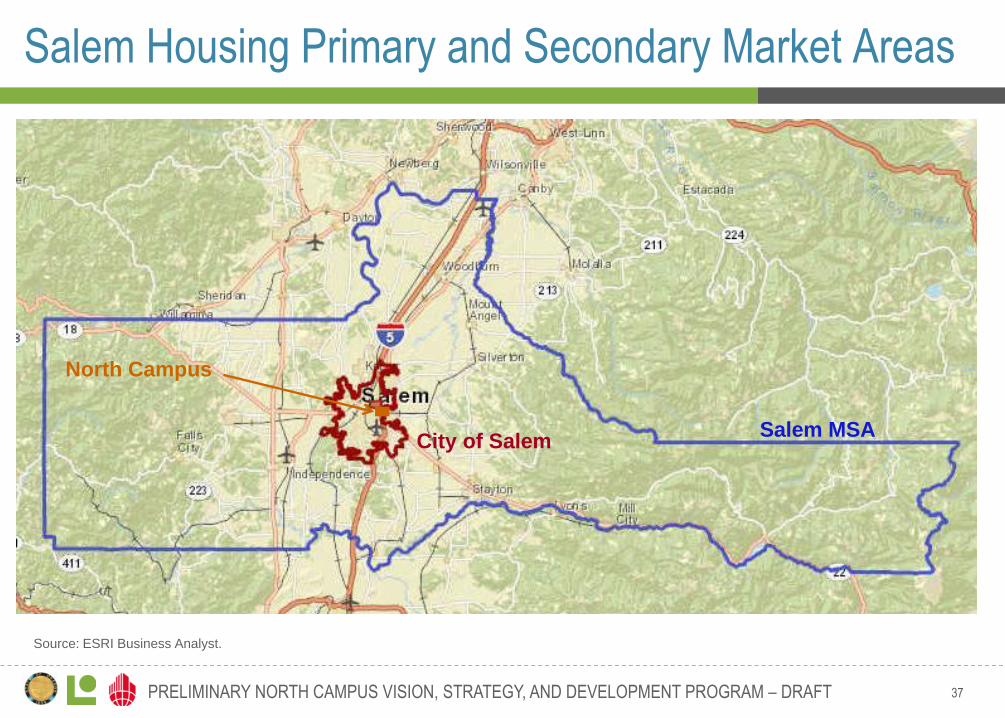
Salem Housing Primary and Secondary Market Areas
Source: ESRI Business Analyst.
Salem MSA City of Salem
North Campus
38 PRELIMINARY NORTH CAMPUS VISION, STRATEGY, AND DEVELOPMENT PROGRAM – DRAFT
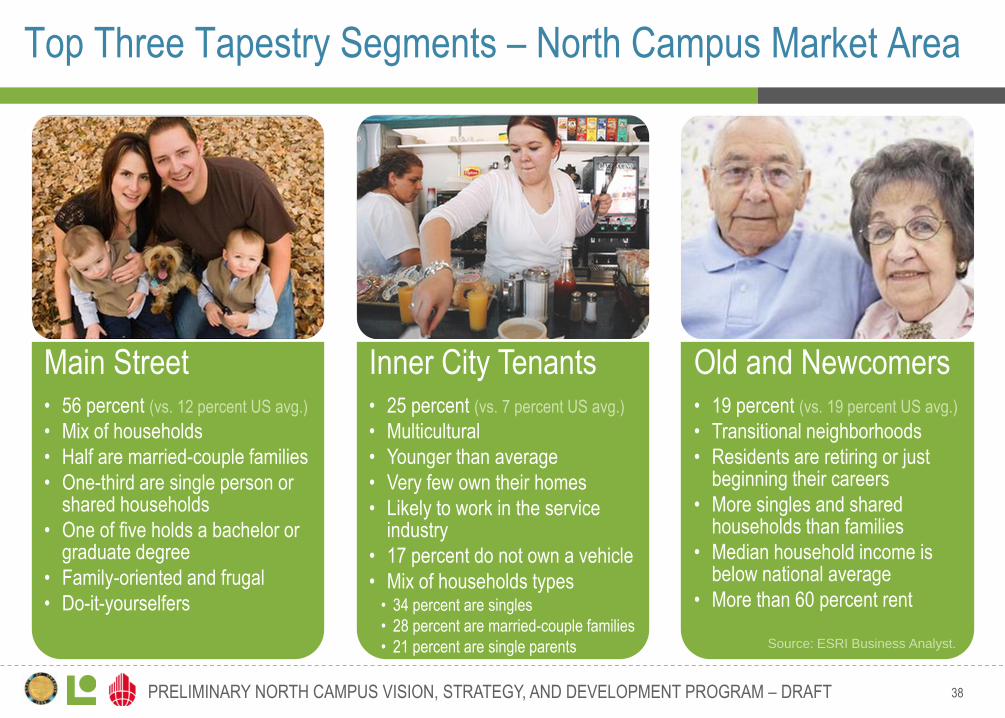
Main Street • 56 percent (vs. 12 percent US avg.)
• Mix of households
• Half are married-couple families
• One-third are single person or shared households
• One of five holds a bachelor or graduate degree
• Family-oriented and frugal
• Do-it-yourselfers
Inner City Tenants • 25 percent (vs. 7 percent US avg.)
• Multicultural
• Younger than average
• Very few own their homes
• Likely to work in the service industry
• 17 percent do not own a vehicle
• Mix of households types • 34 percent are singles
• 28 percent are married-couple families
• 21 percent are single parents
Old and Newcomers • 19 percent (vs. 19 percent US avg.)
• Transitional neighborhoods
• Residents are retiring or just beginning their careers
• More singles and shared households than families
• Median household income is below national average
• More than 60 percent rent
Source: ESRI Business Analyst.
Top Three Tapestry Segments – North Campus Market Area
39 PRELIMINARY NORTH CAMPUS VISION, STRATEGY, AND DEVELOPMENT PROGRAM – DRAFT
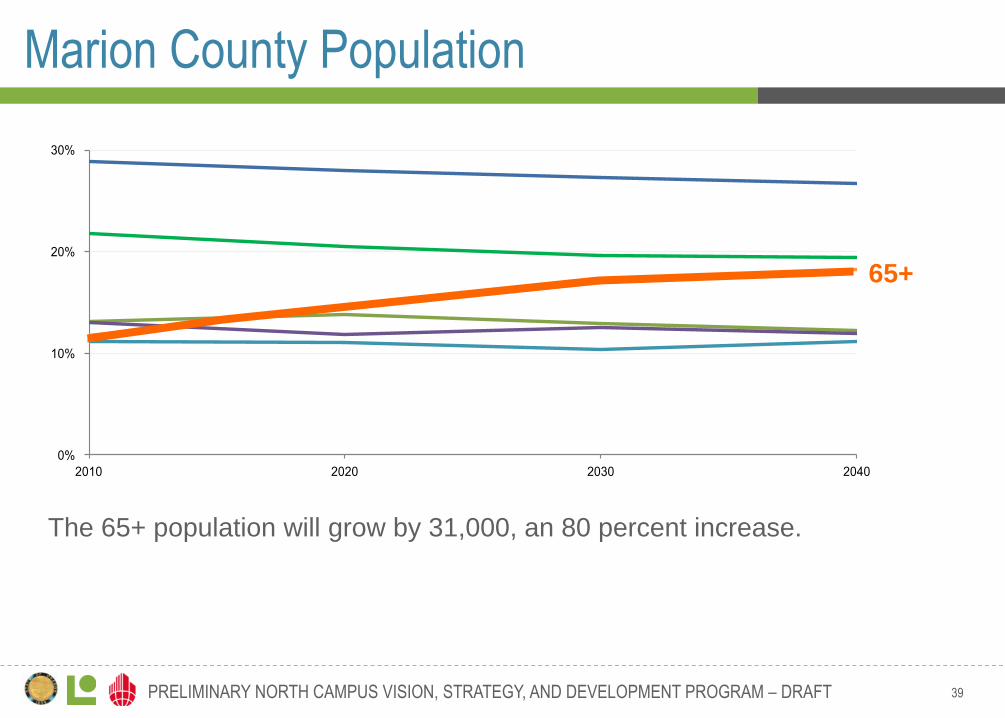
Marion County Population
The 65+ population will grow by 31,000, an 80 percent increase.
0%
10%
20%
30%
2010 2020 2030 2040
0-19
20-34
35-44
45-54
55-64
65+
65+
40 PRELIMINARY NORTH CAMPUS VISION, STRATEGY, AND DEVELOPMENT PROGRAM – DRAFT
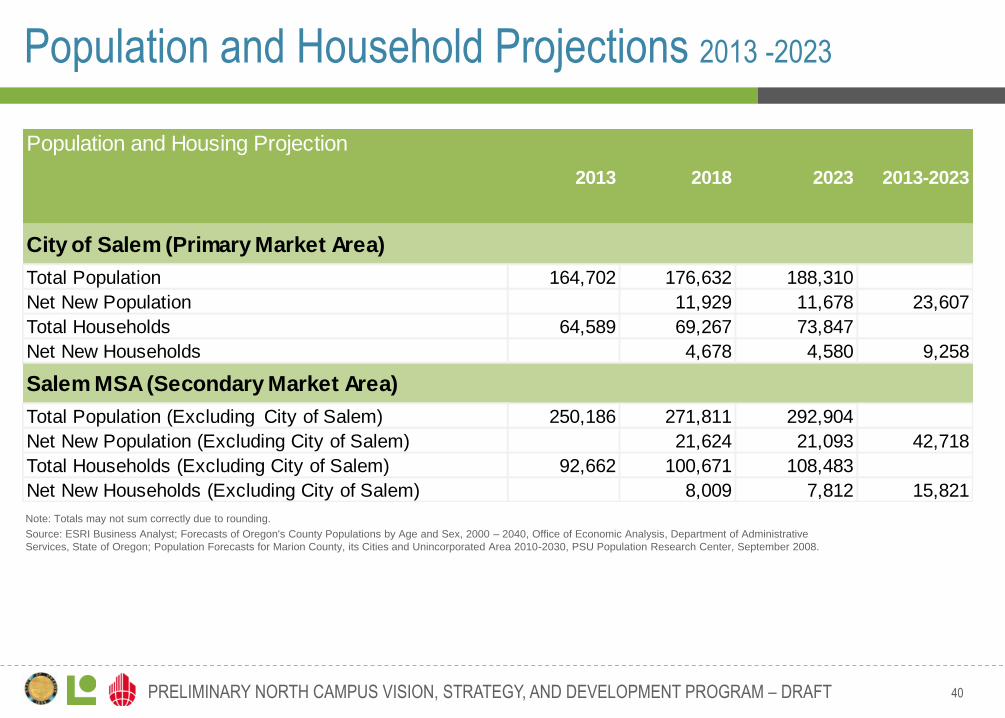
Population and Household Projections 2013 -2023
Note: Totals may not sum correctly due to rounding.
Source: ESRI Business Analyst; Forecasts of Oregon's County Populations by Age and Sex, 2000 – 2040, Office of Economic Analysis, Department of Administrative
Services, State of Oregon; Population Forecasts for Marion County, its Cities and Unincorporated Area 2010-2030, PSU Population Research Center, September 2008.
Population and Housing Projection
2013 2018 2023 2013-2023
City of Salem (Primary Market Area)
Total Population 164,702 176,632 188,310
Net New Population 11,929 11,678 23,607
Total Households 64,589 69,267 73,847
Net New Households 4,678 4,580 9,258
Salem MSA (Secondary Market Area)
Total Population (Excluding City of Salem) 250,186 271,811 292,904
Net New Population (Excluding City of Salem) 21,624 21,093 42,718
Total Households (Excluding City of Salem) 92,662 100,671 108,483
Net New Households (Excluding City of Salem) 8,009 7,812 15,821
41 PRELIMINARY NORTH CAMPUS VISION, STRATEGY, AND DEVELOPMENT PROGRAM – DRAFT
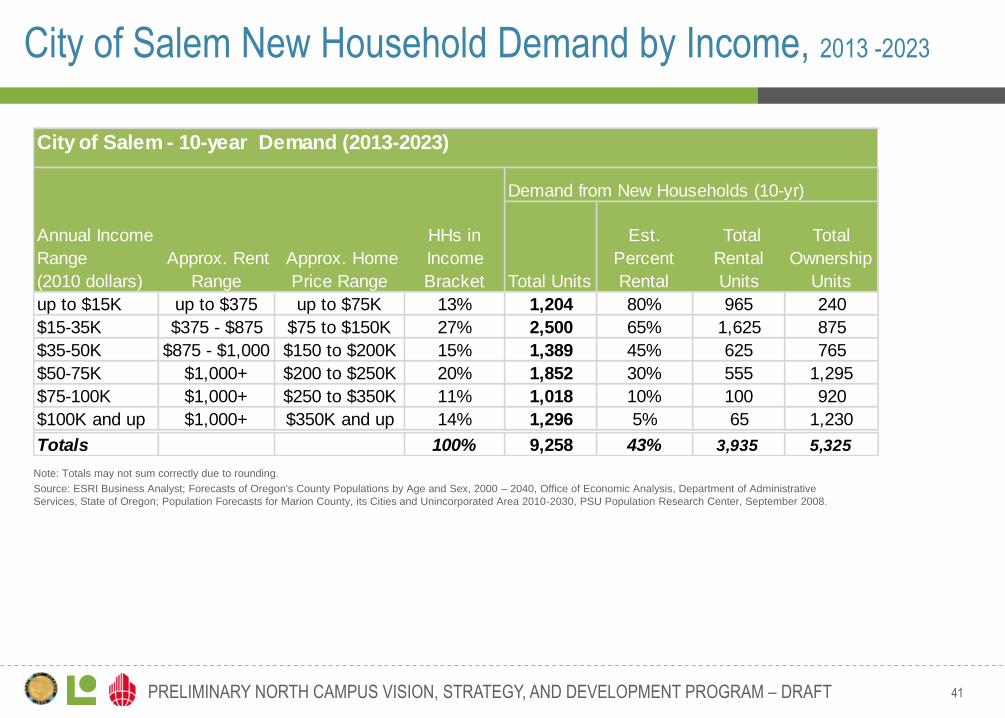
City of Salem New Household Demand by Income, 2013 -2023
Note: Totals may not sum correctly due to rounding.
Source: ESRI Business Analyst; Forecasts of Oregon's County Populations by Age and Sex, 2000 – 2040, Office of Economic Analysis, Department of Administrative
Services, State of Oregon; Population Forecasts for Marion County, its Cities and Unincorporated Area 2010-2030, PSU Population Research Center, September 2008.
City of Salem - 10-year Demand (2013-2023)
Demand from New Households (10-yr)
Annual Income
Range
(2010 dollars)
Approx. Rent
Range
Approx. Home
Price Range
HHs in
Income
Bracket Total Units
Est.
Percent
Rental
Total
Rental
Units
Total
Ownership
Units
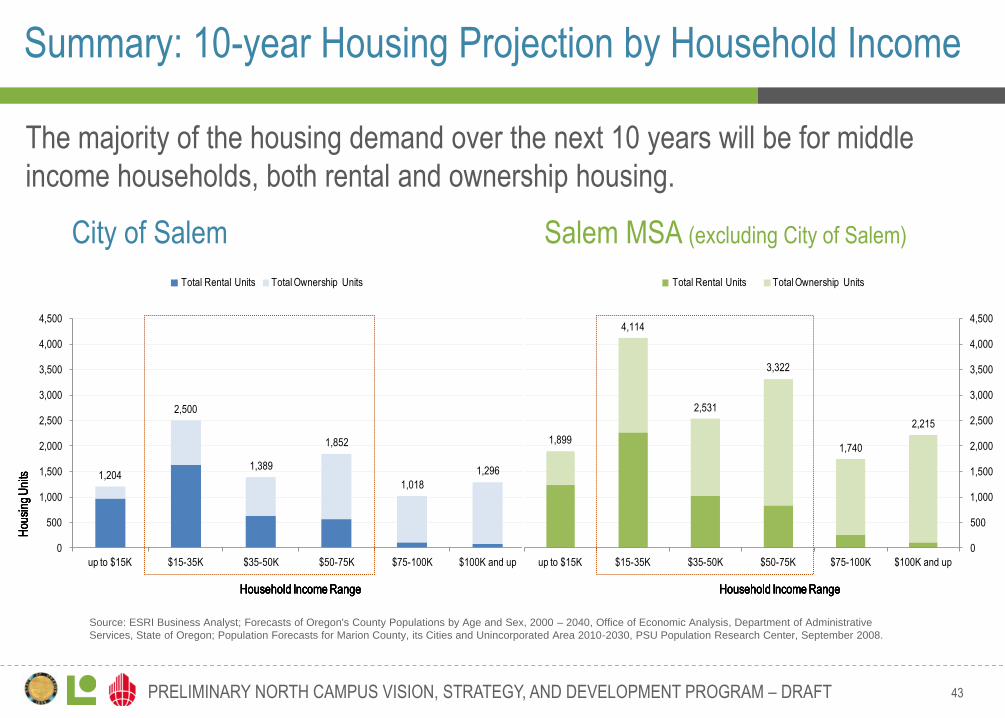
up to $15K up to $375 up to $75K 13% 1,204 80% 965 240
$15-35K $375 - $875 $75 to $150K 27% 2,500 65% 1,625 875
$35-50K $875 - $1,000 $150 to $200K 15% 1,389 45% 625 765
$50-75K $1,000+ $200 to $250K 20% 1,852 30% 555 1,295
$75-100K $1,000+ $250 to $350K 11% 1,018 10% 100 920
$100K and up $1,000+ $350K and up 14% 1,296 5% 65 1,230
Totals 100% 9,258 43% 3,935 5,325
42 PRELIMINARY NORTH CAMPUS VISION, STRATEGY, AND DEVELOPMENT PROGRAM – DRAFT
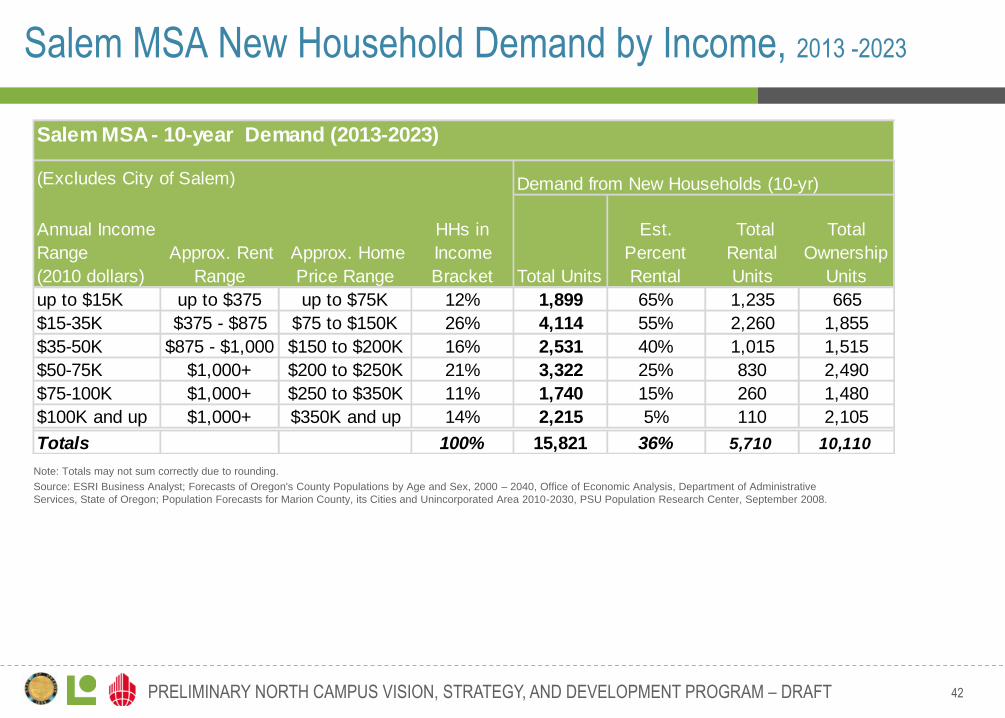
Salem MSA New Household Demand by Income, 2013 -2023
Note: Totals may not sum correctly due to rounding.
Source: ESRI Business Analyst; Forecasts of Oregon's County Populations by Age and Sex, 2000 – 2040, Office of Economic Analysis, Department of Administrative
Services, State of Oregon; Population Forecasts for Marion County, its Cities and Unincorporated Area 2010-2030, PSU Population Research Center, September 2008.
Salem MSA - 10-year Demand (2013-2023)
(Excludes City of Salem) Demand from New Households (10-yr)
Annual Income
Range
(2010 dollars)
Approx. Rent
Range
Approx. Home
Price Range
HHs in
Income
Bracket Total Units
Est.
Percent
Rental
Total
Rental
Units
Total
Ownership
Units
up to $15K up to $375 up to $75K 12% 1,899 65% 1,235 665
$15-35K $375 - $875 $75 to $150K 26% 4,114 55% 2,260 1,855
$35-50K $875 - $1,000 $150 to $200K 16% 2,531 40% 1,015 1,515
$50-75K $1,000+ $200 to $250K 21% 3,322 25% 830 2,490
$75-100K $1,000+ $250 to $350K 11% 1,740 15% 260 1,480
$100K and up $1,000+ $350K and up 14% 2,215 5% 110 2,105
Totals 100% 15,821 36% 5,710 10,110
43 PRELIMINARY NORTH CAMPUS VISION, STRATEGY, AND DEVELOPMENT PROGRAM – DRAFT
Summary: 10-year Housing Projection by Household Income
Source: ESRI Business Analyst; Forecasts of Oregon's County Populations by Age and Sex, 2000 – 2040, Office of Economic Analysis, Department of Administrative
Services, State of Oregon; Population Forecasts for Marion County, its Cities and Unincorporated Area 2010-2030, PSU Population Research Center, September 2008.
Salem MSA (excluding City of Salem) City of Salem
The majority of the housing demand over the next 10 years will be for middle
income households, both rental and ownership housing.
1,204
2,500
1,389
1,852
1,018
1,296
0
500
1,000
1,500
2,000
2,500
3,000
3,500
4,000
4,500
up to $15K $15-35K $35-50K $50-75K $75-100K $100K and up
10-year Housing Unit Projection by Household Income
Total Rental Units Total Ownership Units
Household Income Range
Hou
sing
Uni
ts
Household Income Range
Hou
sing
Uni
ts
Household Income Range
Hou
sing
Uni
ts
Household Income Range
Hou
sing
Uni
ts
1,899
4,114
2,531
3,322
1,740
2,215
0
500
1,000
1,500
2,000
2,500
3,000
3,500
4,000
4,500
up to $15K $15-35K $35-50K $50-75K $75-100K $100K and up
10-year Housing Unit Projection by Household Income
Total Rental Units Total Ownership Units
Household Income Range
Hou
sing
Uni
ts
Household Income Range
Hou
sing
Uni
ts
Household Income Range
Hou
sing
Uni
ts
Household Income Range
Hou
sing
Uni
ts
44 PRELIMINARY NORTH CAMPUS VISION, STRATEGY, AND DEVELOPMENT PROGRAM – DRAFT
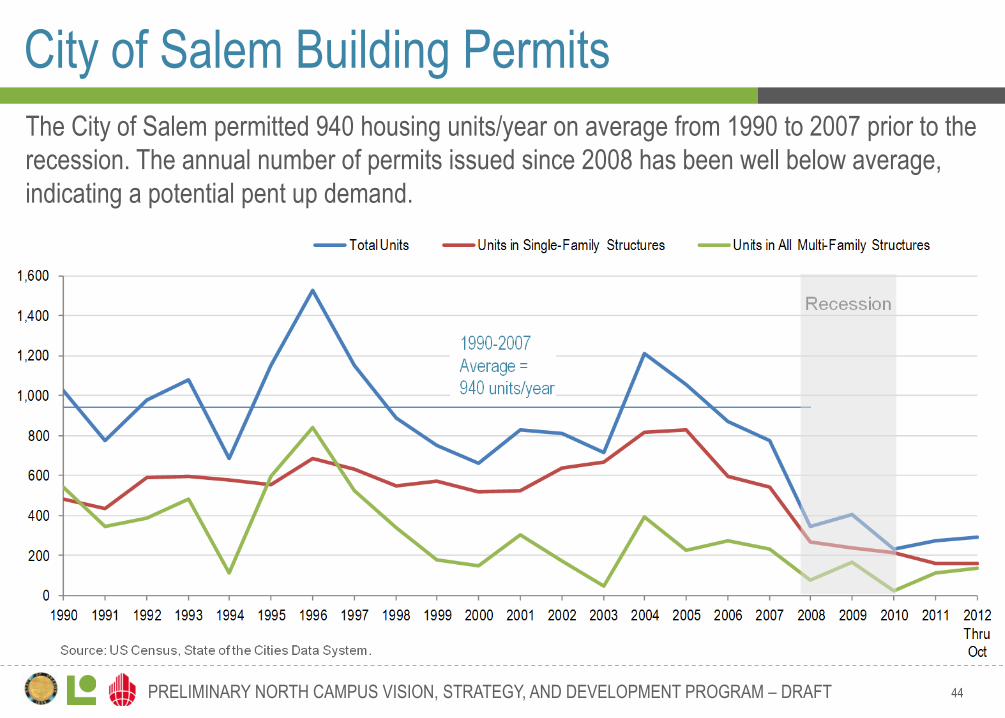
City of Salem Building Permits
The City of Salem permitted 940 housing units/year on average from 1990 to 2007 prior to the
recession. The annual number of permits issued since 2008 has been well below average,
indicating a potential pent up demand.
0
200
400
600
800
1,000
1,200
1,400
1,600
1990 1991 1992 1993 1994 1995 1996 1997 1998 1999 2000 2001 2002 2003 2004 2005 2006 2007 2008 2009 2010 2011 2012
Thru Oct
Building Permits
Annual Average 1980-2011 Total Units Units in Single-Family Structures Units in All Multi-Family Structures
45 PRELIMINARY NORTH CAMPUS VISION, STRATEGY, AND DEVELOPMENT PROGRAM – DRAFT
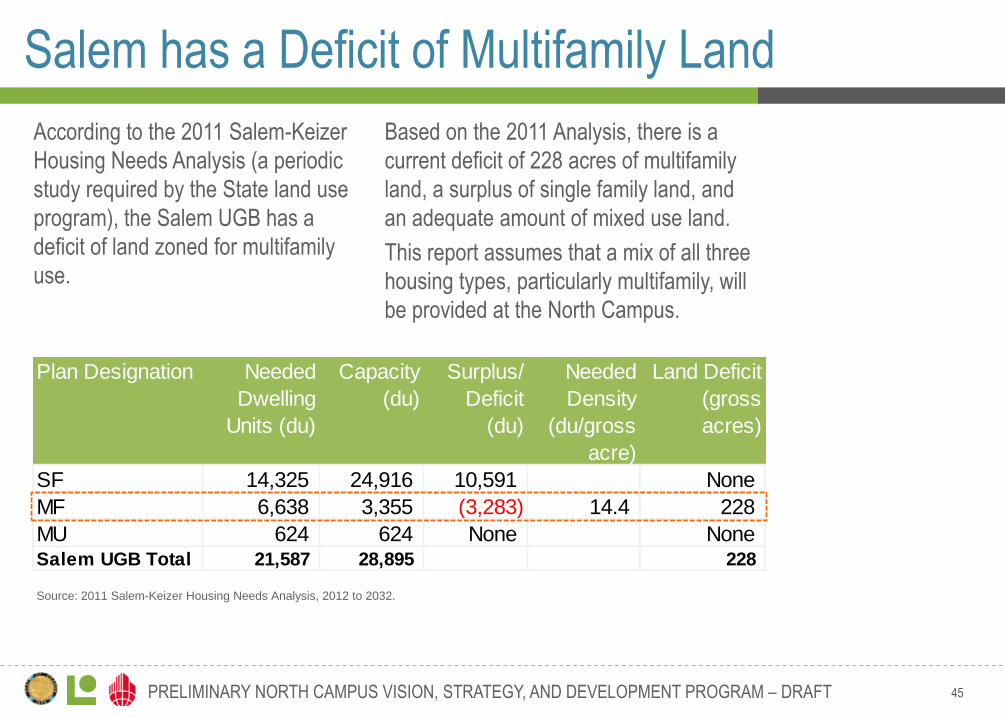
Salem has a Deficit of Multifamily Land
Source: 2011 Salem-Keizer Housing Needs Analysis, 2012 to 2032.
According to the 2011 Salem-Keizer
Housing Needs Analysis (a periodic
study required by the State land use
program), the Salem UGB has a
deficit of land zoned for multifamily
use.
Plan Designation Needed
Dwelling
Units (du)
Capacity
(du)
Surplus/
Deficit
(du)
Needed
Density
(du/gross
acre)
Land Deficit
(gross
acres)
SF 14,325 24,916 10,591 None
MF 6,638 3,355 (3,283) 14.4 228
MU 624 624 None NoneSalem UGB Total 21,587 28,895 228
Based on the 2011 Analysis, there is a
current deficit of 228 acres of multifamily
land, a surplus of single family land, and
an adequate amount of mixed use land.
This report assumes that a mix of all three
housing types, particularly multifamily, will
be provided at the North Campus.
46 PRELIMINARY NORTH CAMPUS VISION, STRATEGY, AND DEVELOPMENT PROGRAM – DRAFT
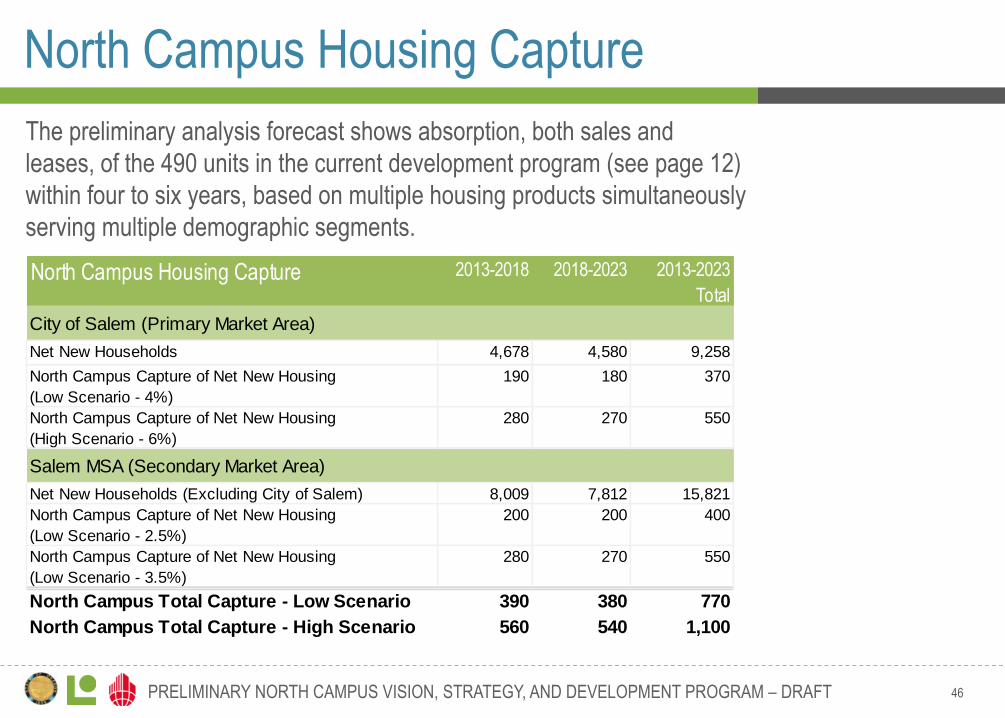
North Campus Housing Capture
The preliminary analysis forecast shows absorption, both sales and
leases, of the 490 units in the current development program (see page 12)
within four to six years, based on multiple housing products simultaneously
serving multiple demographic segments.
North Campus Housing Capture 2013-2018 2018-2023 2013-2023
Total
City of Salem (Primary Market Area)
Net New Households 4,678 4,580 9,258
North Campus Capture of Net New Housing
(Low Scenario - 4%)
190 180 370
North Campus Capture of Net New Housing
(High Scenario - 6%)
280 270 550
Salem MSA (Secondary Market Area)
Net New Households (Excluding City of Salem) 8,009 7,812 15,821
North Campus Capture of Net New Housing
(Low Scenario - 2.5%)
200 200 400
North Campus Capture of Net New Housing
(Low Scenario - 3.5%)
280 270 550
North Campus Total Capture - Low Scenario 390 380 770
North Campus Total Capture - High Scenario 560 540 1,100
LELAND CONSULTING GROUP People Places Prosperity
www.lelandconsulting.com
www.cushwake.com
APPENDIX ADDITIONAL HOUSING AND DEMOGRAPHIC INFORMATION
49 PRELIMINARY NORTH CAMPUS VISION, STRATEGY, AND DEVELOPMENT PROGRAM – DRAFT
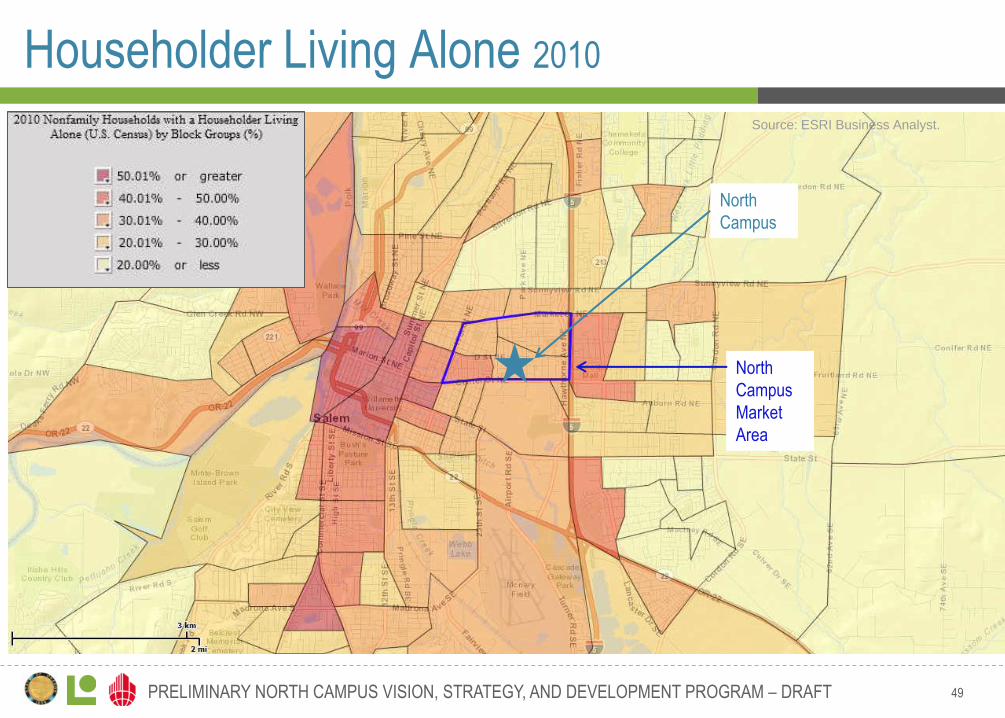
Householder Living Alone 2010
North
Campus
North
Campus
Market
Area
Source: ESRI Business Analyst.
50 PRELIMINARY NORTH CAMPUS VISION, STRATEGY, AND DEVELOPMENT PROGRAM – DRAFT
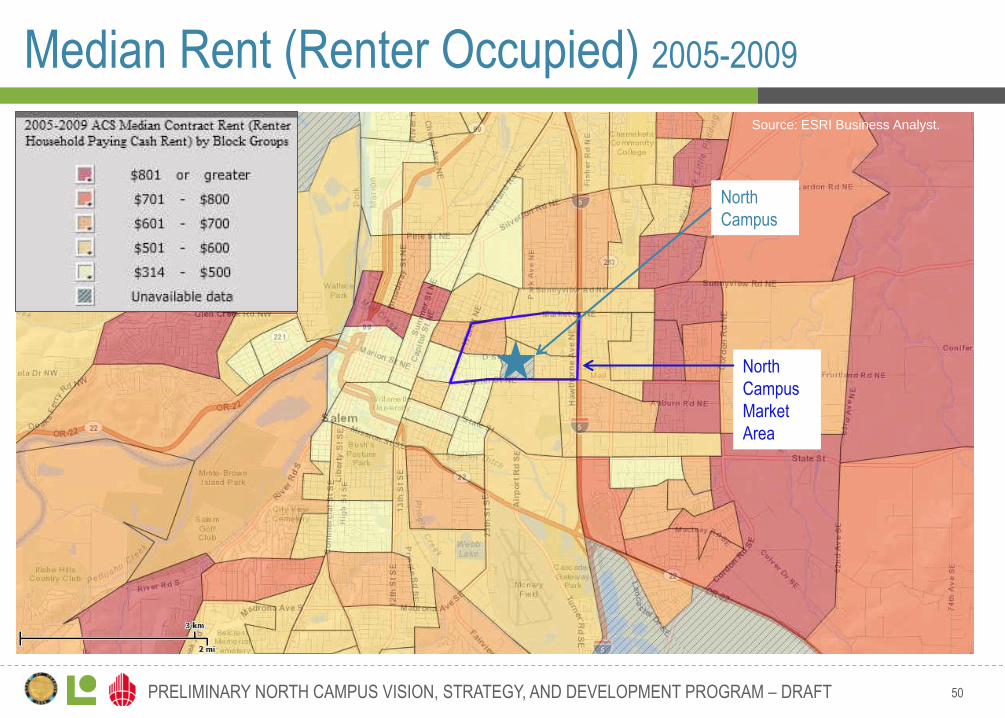
Median Rent (Renter Occupied) 2005-2009
North
Campus
North
Campus
Market
Area
Source: ESRI Business Analyst.
51 PRELIMINARY NORTH CAMPUS VISION, STRATEGY, AND DEVELOPMENT PROGRAM – DRAFT
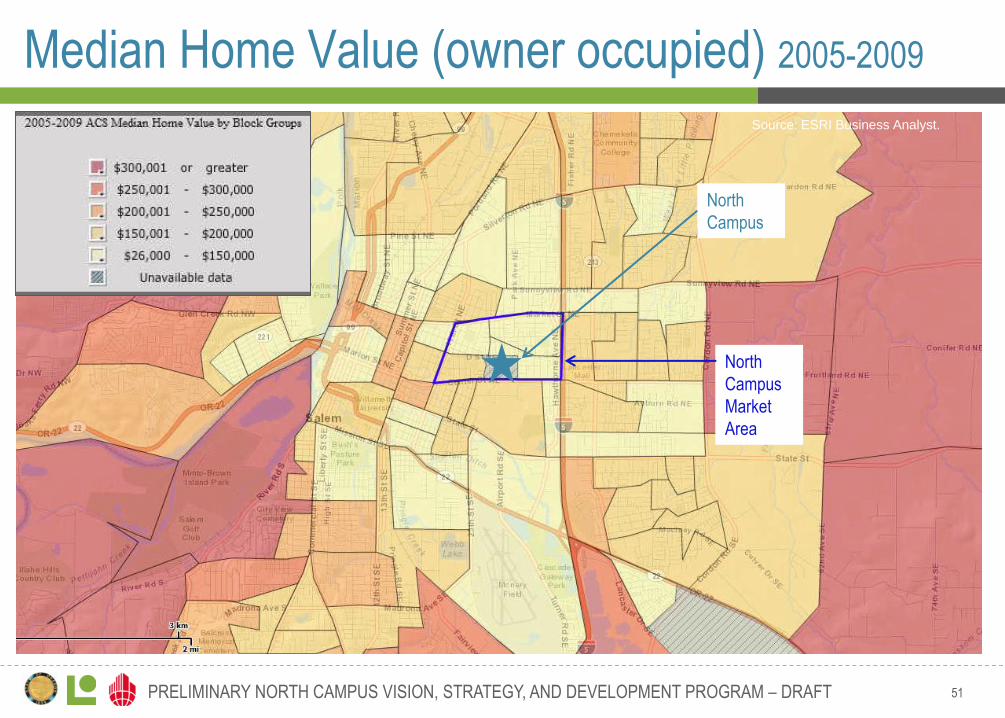
Median Home Value (owner occupied) 2005-2009
Source: ESRI Business Analyst.
North
Campus
North
Campus
Market
Area
52 PRELIMINARY NORTH CAMPUS VISION, STRATEGY, AND DEVELOPMENT PROGRAM – DRAFT
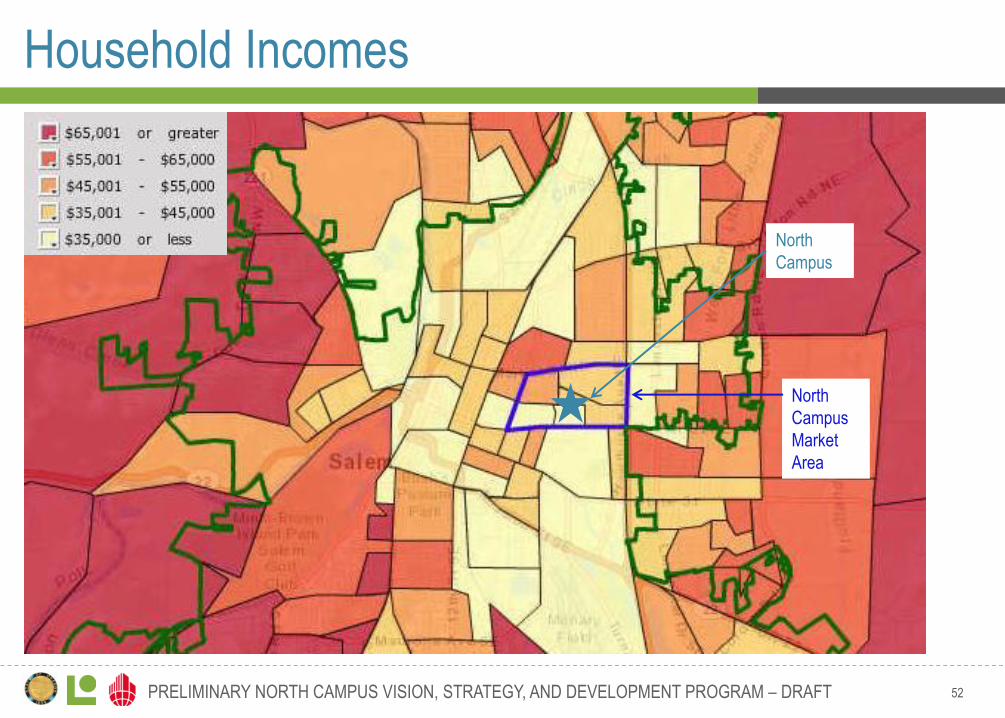
Household Incomes
North
Campus
North
Campus
Market
Area
53 PRELIMINARY NORTH CAMPUS VISION, STRATEGY, AND DEVELOPMENT PROGRAM – DRAFT
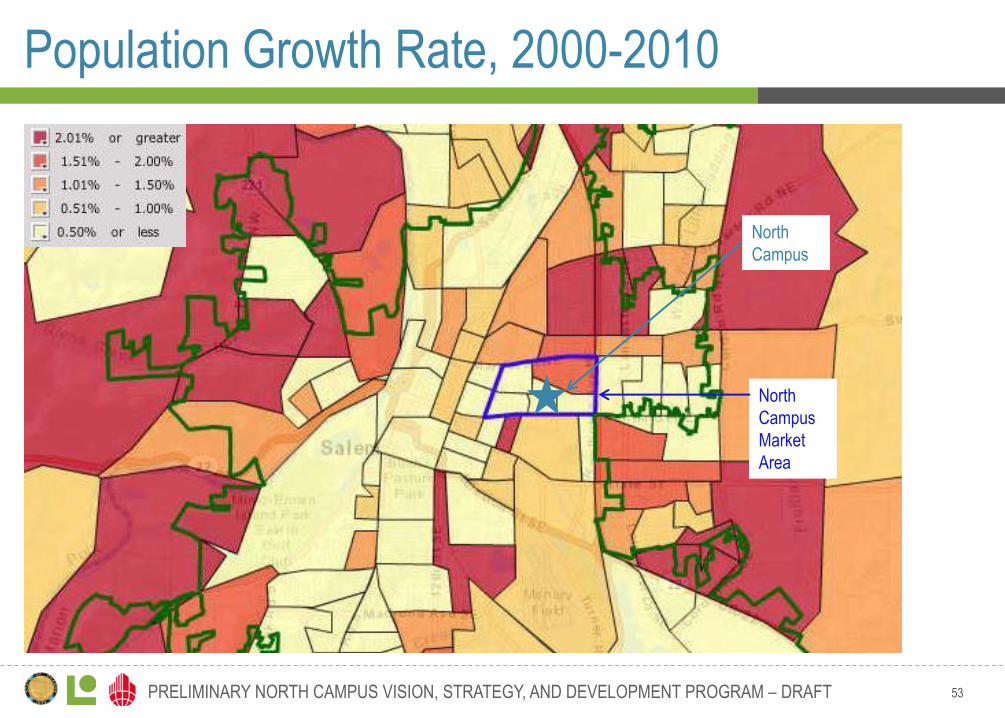
Population Growth Rate, 2000-2010
North
Campus
North
Campus
Market
Area
54 PRELIMINARY NORTH CAMPUS VISION, STRATEGY, AND DEVELOPMENT PROGRAM – DRAFT
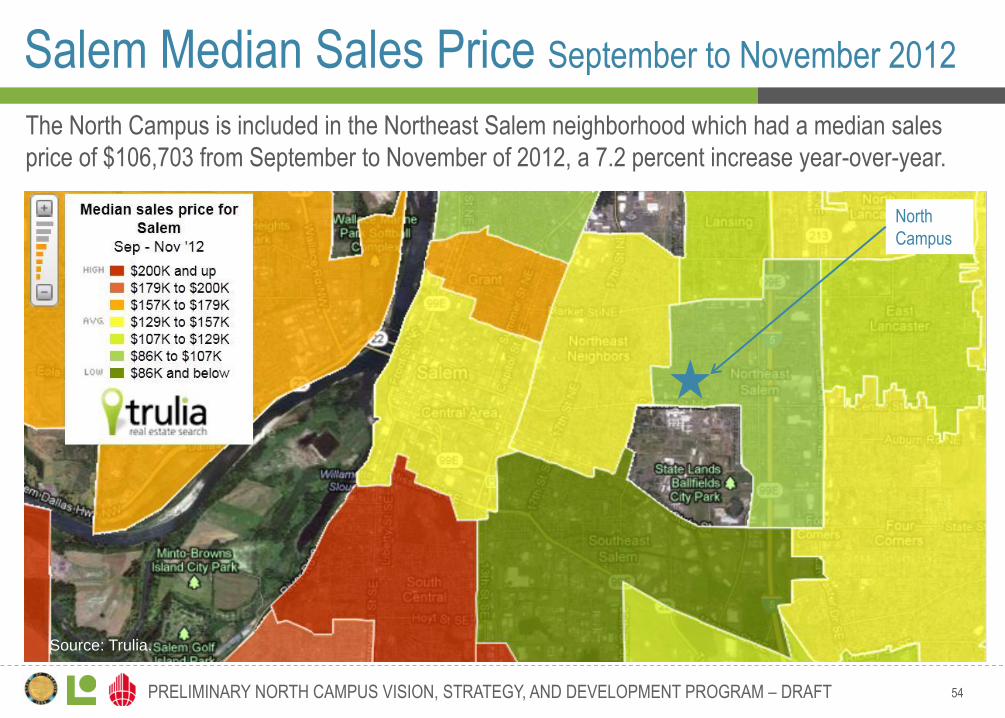
Source: Trulia.
Salem Median Sales Price September to November 2012
North
Campus
The North Campus is included in the Northeast Salem neighborhood which had a median sales
price of $106,703 from September to November of 2012, a 7.2 percent increase year-over-year.
55 PRELIMINARY NORTH CAMPUS VISION, STRATEGY, AND DEVELOPMENT PROGRAM – DRAFT
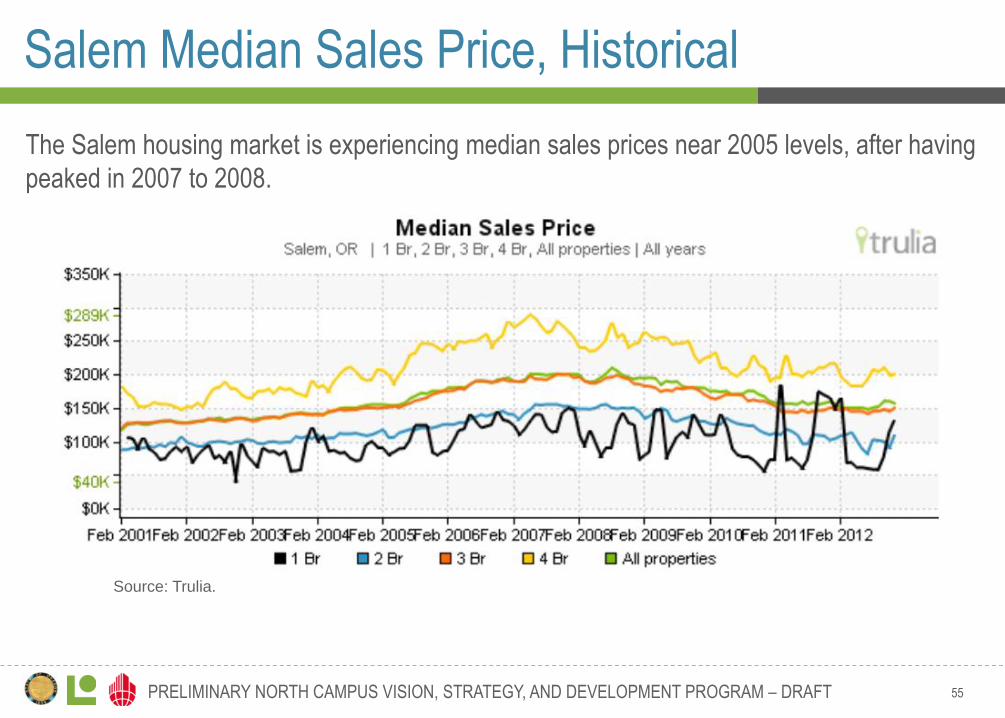
Salem Median Sales Price, Historical
Source: Trulia.
The Salem housing market is experiencing median sales prices near 2005 levels, after having
peaked in 2007 to 2008.