Embed Size (px)
Citation preview
Draft
Performance of carbon nanotubes/cement composites using
different surfactants
Journal: Canadian Journal of Civil Engineering
Manuscript ID cjce-2016-0570.R1
Manuscript Type: Article
Date Submitted by the Author: 21-Feb-2017
Complete List of Authors: ElKashef, Mohamed; The American University In Cairo, Department of Construction Engineering Abou-Zeid, Mohamed Nagib; The American University in Cairo, Department of Construction Engineering
Is the invited manuscript for consideration in a Special
Issue? :
N/A
Keyword: Carbon nanotubes, Concrete, UV-Vis, Dispersion, Raman
https://mc06.manuscriptcentral.com/cjce-pubs
Canadian Journal of Civil Engineering
Draft
1
Performance of carbon nanotubes/cement composites using different
surfactants
M. Elkashefa*
, M.N. Abou-Zeida
a Construction Engineering Department, The American University in Cairo, Egypt.
*Corresponding author. Email: [email protected]
Abstract
The performance of Carbon Nanotubes (CNTs) in cement-based composites relies to a great
extent on its degree of dispersion. In this work, the performance of two commonly used
surfactants; Sodium dodecyl sulfate (SDS) and Triton X-100, is being compared. The effect of
surfactant-to-CNT ratio on dispersion efficiency is studied using UV-Vis spectrometry, to
determine the optimum surfactant dosage. For the optimum ultra-sonication energy, Raman
spectroscopy is used to assess the degree of imperfections on CNTs. CNTs-reinforced mortar
specimens prepared using Triton X-100 and SDS are tested for compressive and flexural
strength. Triton X-100 is shown to exhibit better dispersion efficiency than SDS, leading to more
improvement in flexural and compressive strength. An ultra-sonication time of 60 minutes (19.4
KJ/ml) is shown to be sufficient to achieve proper dispersion, however notable degradation of
CNTs was noted beyond 30 minutes (9.7 KJ/ml) of dispersion leading to a strength reduction.
Keywords: Carbon nanotubes, cement, concrete, dispersion, UV-Vis, Raman.
Introduction
Since its discovery in 1991, CNTs have been under extensive study by researchers (Iijima 1991).
CNTs are tubular in shape with a diameter that is typically in the nanoscale range. They are
entirely made of carbon atoms which are bonded together in a hexagonal pattern to form the
walls and a pentagonal ring structure to form the end caps. They can be made up of single walls
(Single-walled CNTs), double walls (Double-walled CNTs) or multiple-wall (Multi-walled
CNTs) and are characterized by a very high aspect ratio that can go up to 2,500,000 (Kumar et
Page 1 of 34
https://mc06.manuscriptcentral.com/cjce-pubs
Canadian Journal of Civil Engineering
Draft
2
al. 2011) and possess superior mechanical and electrical properties. CNTs-reinforced cement
composites have shown enhanced mechanical properties (Konsta-Gdoutos et al. 2010b; Li et al.
2005), exceptional electromagnetic shielding (Singh et al. 2013) and self-sensing characteristics
(Han et al. 2009). To ensure utmost improvement in properties, CNTs need to be properly
dispersed in the cement-based matrix. Dispersion of CNTs is a difficult task since they tend to
agglomerate due the van der Waals attraction, caused by the π-electron clouds on their surface,
which is considerable owning to their large surface area.
The various methods to achieve CNTs dispersion generally fall under a mechanical and/or
chemical approach. The mechanical approach utilizes a physical technique such as ultrosnication
whereas the chemical approach involves altering the outer structure of the CNTs, by covalent or
non-covalent interaction with other chemical moieties. Ultrasonication is a frequently used
mechanical method which involves applying ultrasonic energy. The ultrasonic energy generates
cavitation bubbles which when collapsed results in high pressure and temperature. Such high
pressure, which could be in excess of 500 atm, is sufficient to debundle the CNTs agglomerates
(Hilding et al. 2003). Ultrasonication is used to disperse CNTs in low viscosity liquids such as
water. Ultrasonication can be done using a water bath sonicator or a tip sonicator, which is
limited to small specimens as the ultrasonic energy is provided through a tip with a narrow
diameter. The degree of dispersion of CNTs depend primarily on the sonication energy (Yu et al.
2007). The sonication energy depends on the sonicator power, sonication time and volume of
liquid being dispersed. The role of sonication energy using an anionic surfactant SDBS was
studied by Yang et al. (2013) and it was concluded that the optimum sonication energy is
independent of the surfactant-to-CNT ratio and is only dependent on the diameter of the CNTs
due to the interrelation between the van der Waals attraction forces and nanotubes diameter,
Page 2 of 34
https://mc06.manuscriptcentral.com/cjce-pubs
Canadian Journal of Civil Engineering
Draft
3
where lower forces are associated with larger diameters. A number of other mechanical
dispersion techniques include agitator discs, colloid mills, high-pressure homogenizers, triple
roller mills, and bead mills (Inkyo et al. 2006). These techniques were used to disperse different
type of nanoparticles, specifically bead mills were used with titanium dioxide nanoparticles
(Inkyo et al. 2006).
Chemical methods include covalent or non-covalent attachment of molecules onto the CNTs
surface. Using surfactants or polymers is an example of non-covalent bonding which do not
disturb the chemical structure of the CNTs. Surfactants have both a hydrophilic part which is
mainly the head group and a hydrophobic part which consists of a chain of hydrocarbons.
Surfactants can be classified into cationic, anionic, and nonionic or zwitterionic based on the
charge on their head group (Vaisman et al. 2006). The mechanism of adsorption of surfactant
molecules onto the CNTs surfaces can be through coulomb attraction in case of ionic surfactants
or through π- π interaction in nonionic surfactants (Rastogi et al. 2008). The ionic and steric
repulsion between the surfactant molecules adsorbing onto the CNTs walls prevent them from
agglomerating.
The use of surfactants is usually accompanied by ultrasonication. Ultrasonication separates the
CNTs and creates gaps which are penetrated by the surfactant to wrap individual CNTs. CNTs
dispersed by ultrasonication alone tend to reagglomerate , hence the use of surfactants to provide
a stable CNTs suspension (Kumar et al. 2011). It is noted that surfactants increase air void
content which could potentially reduce concrete strength and delay cement hydration hence a
defoaming agent is sometimes used (Gopalakrishnan et al. 2011). Alternatively, the fresh paste
could be placed inside a vacuum chamber to remove large air voids (Al-Rub et al. 2011; Tyson et
al. 2011).
Page 3 of 34
https://mc06.manuscriptcentral.com/cjce-pubs
Canadian Journal of Civil Engineering
Draft
4
Earlier research on surfactants showed that there exists an optimum surfactant-to-CNTs ratio at
which maximum dispersion is achieved (Rastogi et al. 2008). Higher surfactant concentrations
beyond this optimum ratio leads to CNTs flocculation and a reduction in dispersion efficiency.
This behavior was explained in terms of the theory of micelle formation, as with increasing
surfactant concentrations multilayers of the surfactant molecules build up around the CNTs
walls. In this arrangement, the outermost surfactant molecules have their hydrophilic tails in
contact with water, which is not favorable in terms of energy, hence interaction between the
surfactant molecules on neighboring CNTs take place to reduce the surface energy which
eventually leads to CNTs flocculation.
Another chemical approach involves covalent attachment of functional groups onto the walls of
CNTs which could be done by acid treatment (Tchoul et al. 2007). A solution of sulfuric and
nitric acid is usually used for this treatment (Hilding et al. 2003). The acids induce oxidation of
the CNTs leading to attachment of hydroxylic and carboxylic functional groups which renders
the nanotubes readily dispersible. It is also believed that theses functional groups bond with
hydration products, mainly calcium silicate hydrate, providing a strong interaction which
improves load transfer efficiency between the CNTs and the surrounding cement matrix
(Yazdanbakhsh et al. 2009). Excessive acid treatment may lead to a degradation of the CNTs
which could potentially result in a drop in the mortar strength (Elkashef et al. 2016)
Extensive research has been conducted to investigate dispersion in cement-based materials. The
rheological properties and nanostructure of cement paste was shown to rely heavily on the
dispersion efficiency of CNTs. It was shown that a considerable improvement in properties can
be achieved even at low CNTs concentration of 0.08% by weight of cement, when a surfactant-
to-CNT ratio of 4 accompanied by ultrasonication was used (Konsta-Gdoutos et al. 2010a). A
Page 4 of 34
https://mc06.manuscriptcentral.com/cjce-pubs
Canadian Journal of Civil Engineering
Draft
5
recent study compared the performance of two different surfactants; polyoxyethylene laurylether
(Brij 35) and SDS and concluded that both behaved similarly and an ultrasonication time of 120
minutes was required to ensure proper dispersion of CNTs with either of the two surfactants
(Sobolkina et al. 2012). However, using the dispersed CNTs in mortar led to no improvement in
strength, which was attributed to a possible degradation of the CNTs as a result of long
ultrasonication times. In another study, gum arabic was used as a dispersing agent and a slight
increase in strength was noted (Saez de Ibarra et al. 2006). Methylcellulose and polycarboxylate
superplasticizer were also used successfully to disperse CNTs as verified by AC impedance
spectroscopy (Wansom et al. 2006).
CNTs have been added to cement-based materials at different loading ratios up to 2% by weight
of cement (Cwirzen et al. 2008; Konsta-Gdoutos et al. 2010a; Li et al. 2005; Makar et al. 2005).
It is currently established that low additions of CNTs can be very effective when properly
dispersed. CNT concentrations ranging from 0.025% to 0.08% were used to reinforce cement
paste (Konsta-Gdoutos et al. 2010a). CNTs with lower aspect ratios require higher
concentrations to be able to bridge nano-cracks. An increase in compressive strength of up to
40% was noted with CNTs added at 0.25% by weight of cement (Sobolkina et al. 2012). CNT-
modified cement composites prepared using CNTs at 0.2% by weight of cement, showed an
increase in flexural strength of about 35% (Al-Rub et al. 2011).
In this work, CNTs are added at 0.2% by weight of cement and dispersed using both an anionic,
SDS, and a nonionic, Triton X-100, surfactants and ultrasonicated for a duration of 30, 60 and 90
minutes. A quantitative analysis of the dispersion efficiency of CNTs, at different surfactant-to-
CNT ratios of 1, 2.5 and 5, is done using UV-Vis spectrometry. The damage caused by
ultrasonication is assessed using Raman spectrometry. The dispersed CNTs are used to prepare
Page 5 of 34
https://mc06.manuscriptcentral.com/cjce-pubs
Canadian Journal of Civil Engineering
Draft
6
mortar mixes and tested for compressive and flexural strength. The percentage of improvement
in strength is correlated with the dispersion efficiency and degree of damage results from UV-
Vis and Raman.
Materials and methods
Materials
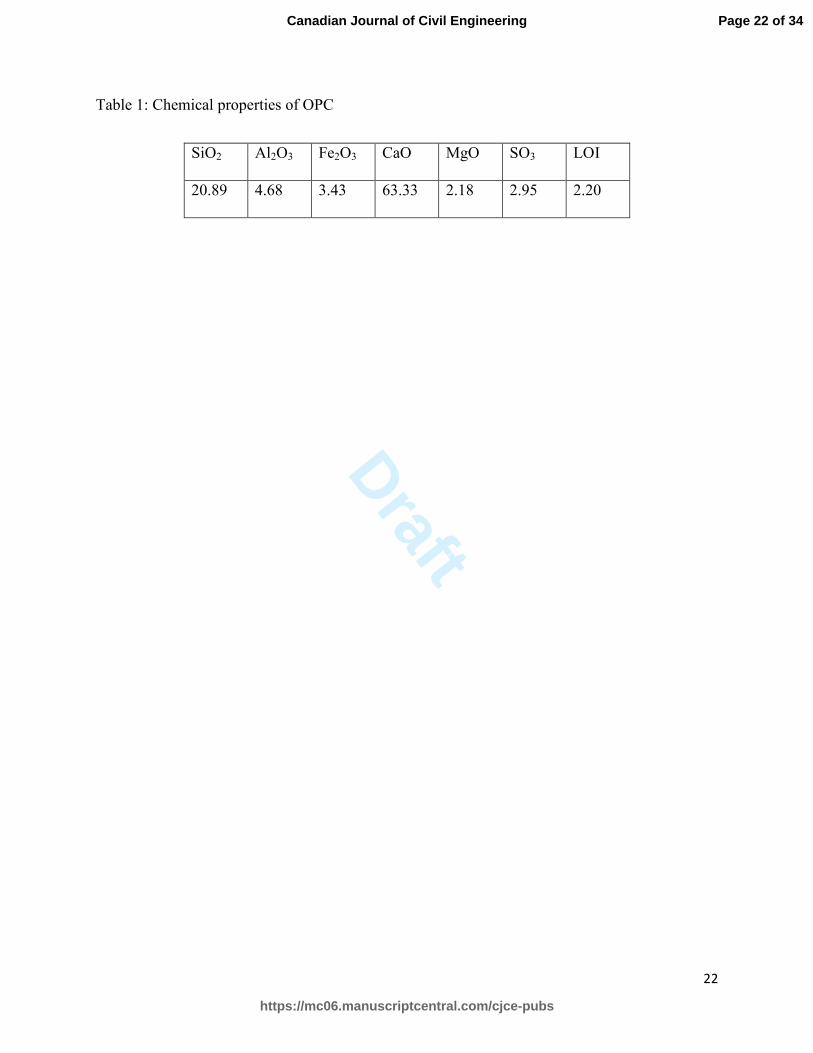
Ordinary Portland Cement (OPC) Type 1 that meets ASTM C150 requirements was used for this
study. The specific gravity of the cement is 3.15 and its Blaine fineness is 330 m2/kg. The
chemical composition of the cement is listed in Table 1.
Table 1: Chemical properties of OPC
Fine sand graded as per ASTM C109 was used having a specific gravity of 2.63, absorption of
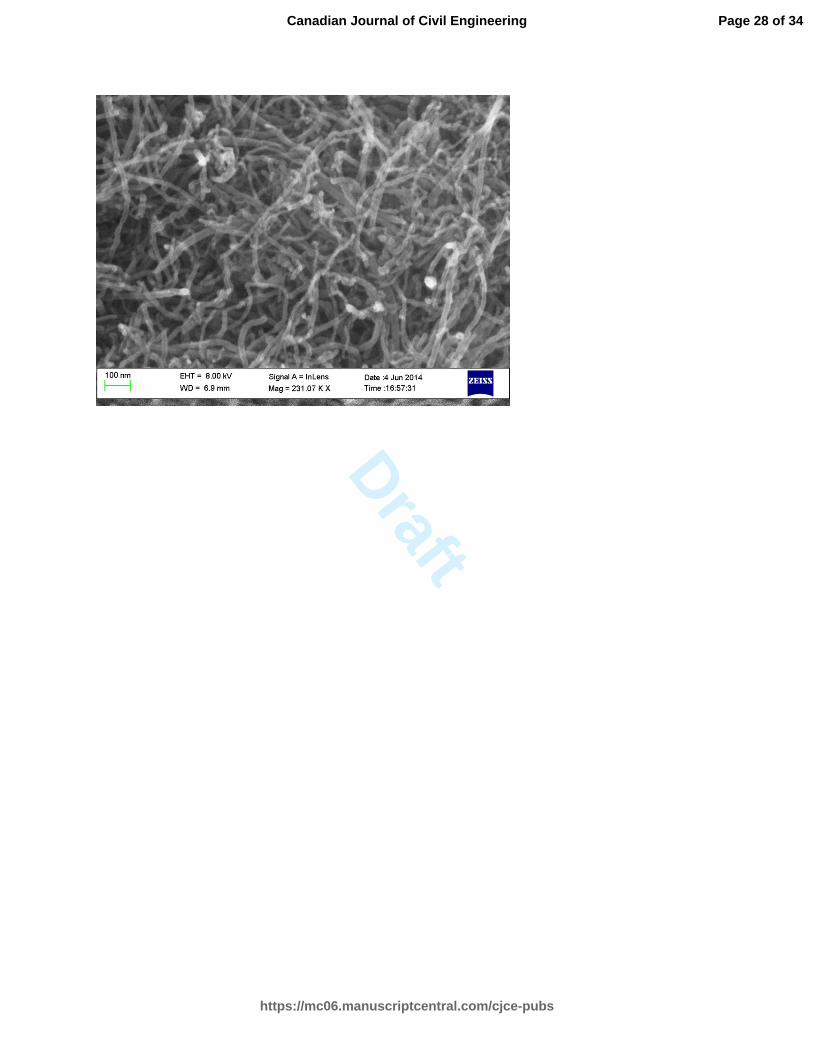
0.3%, and a fineness modulus of 2.36. The CNTs were multi-walled with a diameter between 20-
50 nm as shown in Figure 1, which provides an SEM image of the as-received CNTs. Deionized
water was used for mixing to prevent any ion interference from the water with the CNTs
chemistry.
Figure 1: SEM image of pristine CNTs
CNTs dispersion
In order to select a surfactant-to-CNT ratio for this study, dispersion of CNTs were prepared
using different surfactant-to-CNT ratios. A solution of CNTs in deionized water was prepared
using 0.08g of CNTs in 20ml of water resulting in a concentration of 0.4g/100mL, which is the
Page 6 of 34
https://mc06.manuscriptcentral.com/cjce-pubs
Canadian Journal of Civil Engineering
Draft
7
same concentration of CNTs in mortar. An amount of 0.08, 0.2 and 0.4g of either SDS or Triton
X-100 was added to the solution resulting in a surfactant-to-CNT ratio of 1, 2.5 and 5
respectively. The prepared suspensions were then utlrasonicated for 30, 60 and 90 minutes using
an ultrasonic water bath from VWR International LLC, model no. 150 HT with an average
power of 135W and a temperature control thermostat to maintain the temperature at 21oC. The
ultrasonicated suspension was then diluted with deionized water at a ratio of 1:40 before
analyzing them using UV-Vis. The reason for dilution was to provide low concentration of CNTs
since Lambert-Beer law is only well-obeyed at lower concentrations (Rance et al. 2010). The
resulting diluted solution had a CNT concentration of 0.1mg/mL. The dispersion efficiency of
the surfactant and the ultrasonication process was then assessed using UV-Vis spectrometry. The
UV-Vis spectra for the different surfactant-to-CNT ratios and ultrasonication times were then
analyzed to select the appropriate surfactant-to-CNT ratio and optimum ultrasonication time
required for casting the mortar specimens.
UV-Vis
The significance of using UV-Vis to study the dispersion of CNTs stem from the fact that only
individual CNTs are active in the UV-vis region. Entangled CNTs do not show absorbance in
this E/M region, between 200 to 1200 nm (Yu et al. 2007). Accordingly, the detected absorbance
is entirely related to the individual CNTs dispersed in the solution. The intensity of the
absorption spectrum is linearly proportional to the concentration of dispersed individual CNTs.
The peak absorption intensity for CNTs has been reported by several researchers to be between
200 and 300 nm (Grossiord et al. 2005; Jiang et al. 2003; Yu et al. 2007). This absorbance peak
is associated with Plasmon resonance of the π-electron cloud on the CNTs.
Page 7 of 34
https://mc06.manuscriptcentral.com/cjce-pubs
Canadian Journal of Civil Engineering
Draft
8
The linear relation between absorbance and concentration, as given by the Lambert-Beer law, is
not applicable at higher concentrations. Accordingly, the CNT solution in water had to be diluted
to lower concentrations for the purpose of the UV-Vis analysis.
The analysis was done using a UV-vis-NIR spectrometer (UV-Vis-NIR, Cary 5000-UV BROP,
Agilent Technologies, Australia), in 1 cm quartz cuvettes over the range 200 to 600 nm. An
absorbance spectrum, covering this wavelength range, was obtained for each sonication time for
each of the two surfactants, at different surfactant-to-CNT ratios. For each tested sample, a blank
containing water and the same amount of surfactant as in the tested sample but no CNTs, was
used as a baseline and subtracted from the obtained absorbance spectrum.
Beer-Lambert’s law correlates the concentration of CNTs in suspension with the absorbance
measurement as given by the following equation:
A = ε C l (1)
where A is absorbance, ε is the extinction coefficient, C is the CNTs concentration, and l is the
cuvette dimension.
The extinction coefficient, ε, varies with wavelength and CNTs dimensions. An extensive study
done on both single-walled and multi-walled carbon nanotubes produced by different methods
including arc discharge and chemical vapor deposition, showed that the absorbance peak
appeared between 206.1 and 251.2 nm with a corresponding extinction coefficient in the narrow
range of 44.8 to 54.5 mL mg-1
cm-1
(Rance et al. 2010). Other studies reported different values of
extinction coefficients at other wavelengths, such as 30.3±-0.2 mL mg-1
cm-1
at a wavelength of
1035.3 nm (Jeong et al. 2007) for single-walled carbon nanotubes and 16.9 mL mg-1
cm-1
at a
wavelength of 530 nm (Ikeda et al. 2006; Marsh et al. 2007). The study done by Rance,
Page 8 of 34
https://mc06.manuscriptcentral.com/cjce-pubs
Canadian Journal of Civil Engineering
Draft
9
however, covered different types of carbon nanotubes and reported the extinction coefficient
within the range at which the maximum absorbance peak would occur (Rance et al. 2010). For
this reason, a value of 54.5 mL mg-1
cm-1
was used in this study, as the extinction coefficient for
multi-walled CNTs, as reported by Rance (Rance et al. 2010).
Raman Spectroscopy
Previous studies have shown that ultrasonication cause shortening, curling and fracturing of the
CNTs (Hilding et al. 2003; Lu et al. 1996). Raman spectroscopy was used to characterize the
ultrasonicated CNTs in order to assess the degree of defects caused by ultrasonication. A Raman
device with laser excitation of wavelength of 532 nm was used. A comparison was made
between the as-received CNTs, CNTs ultrasonicated for 30 minutes and CNTs ultrasonicated for
60 minutes. The CNTs ultrasonicated for 90 minutes were not analyzed since the UV-Vis results
showed no considerable improvement in dispersion beyond 60 minutes.
Specimen Preparation and Strength Testing
Mortar cubes of size 50 mm and prisms measuring 40*40*160 mm were casted for compressive
and flexural strength testing respectively. The mix used had a water/cement/sand ratio of
0.5:1:2.5. The mix was designed to provide good workability to ease the CNTs dispersion. CNTs
were added at 0.2% by weight of cement. CNTs were dispersed with both Triton X-100 and SDS
using a surfactant-to-CNT ratio of 2.5, as determined from the UV-Vis analysis. The
ultrasonication time was limited to 30 and 60 minutes only as the UV-Vis results showed no
notable improvement in dispersion above 60 minutes. Mortar specimens without CNTs, and
containing the same amount of surfactant as the CNTs-reinforced specimens, were used as the
control. The mixing procedure was done according to ASTM C305 using a Hobart mixer with
flat beater. Following mixing, the fresh mortar was placed in a vacuum chamber for 5 minutes to
Page 9 of 34
https://mc06.manuscriptcentral.com/cjce-pubs
Canadian Journal of Civil Engineering
Draft
10
eliminate the air voids caused by the surfactant. The air content of the fresh mortar was measured
before and after vacuum application as per ASTM C185.
The mortar was then filled in oiled molds and covered with wet burlap and de-molded after 1
day. The samples were cured in a moist curing room for 28 days before testing. Compressive
testing was performed according to ASTM C109 using a 400,000 lbs capacity compression
testing machine. Flexural testing was conducted according to ASTM C348 using an INSTRON
type universal testing machine with 22,000 lbs capacity testing machine. The compressive and
flexural strength results reported, at each test condition, are the average of three test specimens.
Results and discussion
Effect of different surfactant-to-CNT ratios
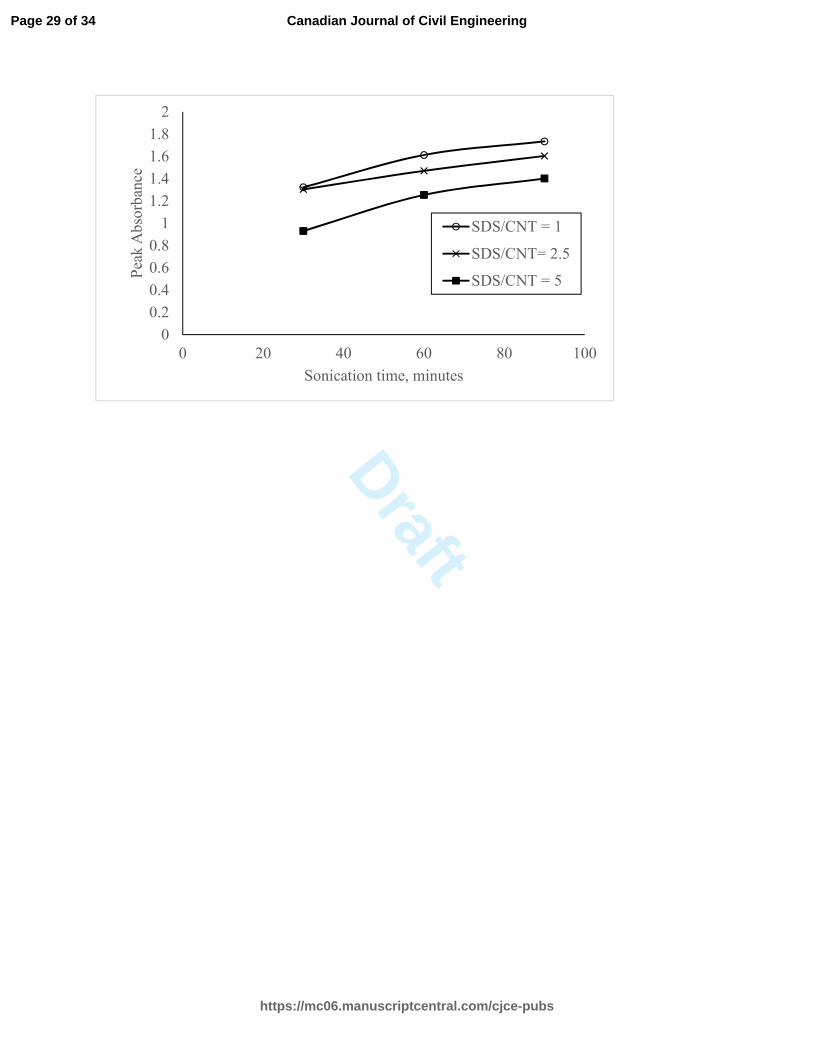
The intensity of the peak absorbance in the UV-vis spectra for the CNTs aqueous suspensions
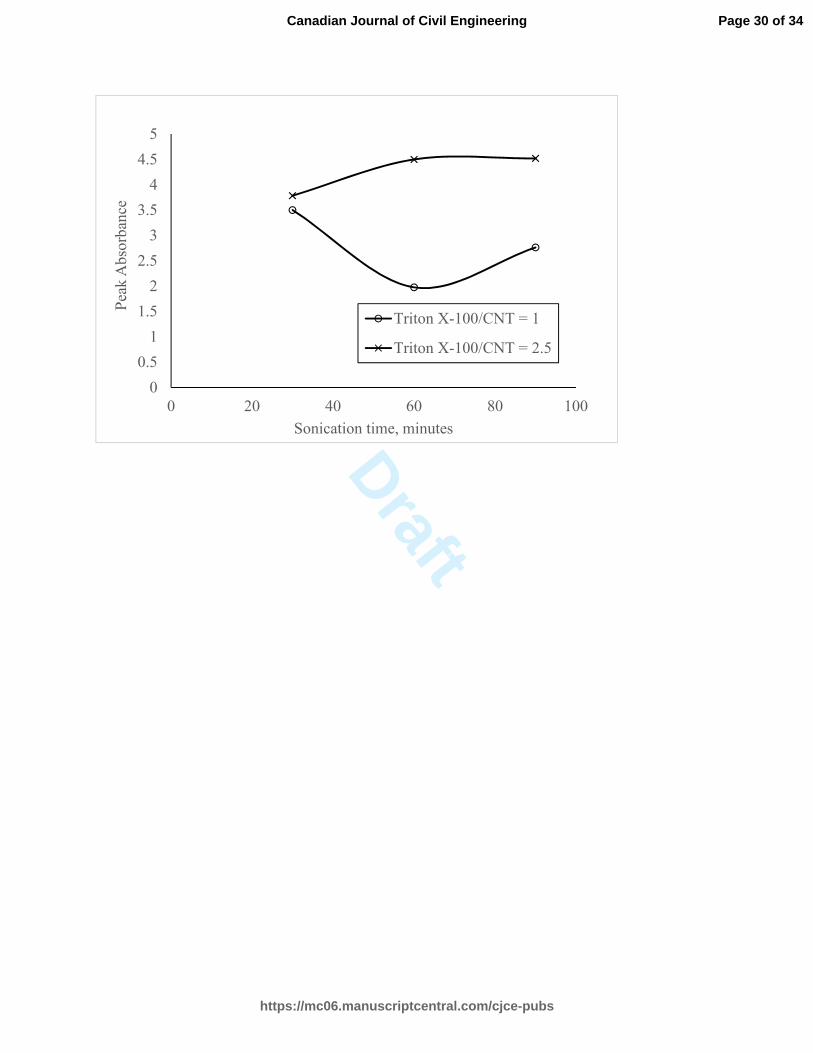
prepared with different surfactant-to-CNT ratios and sonication durations was recorded. Figure 2
and 3, shows the variation of the peak intensity with varying surfactant-to-CNT ratios for SDS
and Triton X-100 respectively. It can be seen that the absorbance increases with an increasing
sonication time denoting better dispersion with time regardless of the type of surfactant used. For
SDS, the highest absorbance and hence maximum dispersion, was obtained at SDS-to-CNT ratio
of 1 indicating that the optimum concentration for SDS is achieved at SDS-to-CNT ratio of 1 or
less. As for Triton X-100, increasing the ratio from 1 to 5 led to an increase in dispersion. Note
that in Figure 3, the results of Triton X-100/CNT ratio of 5 is not shown because the absorbance
was higher than the limit of detection of the device. It was thus be concluded that the optimum
concentration of Triton X-100 is above the concentrations used in this study. Nevertheless, the
concentrations of Triton X-100 used in this study were very efficient at achieving dispersion as
indicated by the high absorbance values compared to SDS.
Page 10 of 34
https://mc06.manuscriptcentral.com/cjce-pubs
Canadian Journal of Civil Engineering
Draft
11
Based on the above analysis, a surfactant-to-CNT ratio of 2.5 was selected for the two
surfactants. At this concentration, the efficiency of SDS was very much close to the maximum
efficiency noted at a ratio of 1. Also, the efficiency of Triton X-100 was reasonably high. Using
a higher Surfactant-to-CNT ratio, above 2.5, would have decreased the efficiency of SDS
notably. In the same way, using a lower Surfactant-to-CNT ratio, less than 2.5, would lower the
efficiency of Triton X-100.
Figure 2: UV-vis peak absorbance for CNTs aqueous suspension using SDS
Figure 3: UV-vis peak absorbance for CNTs aqueous suspension using Triton X-100
Analysis of dispersion efficiency
The dispersion efficiency of both SDS and Triton X-100 was quantitatively assessed using Beer-
lambert law and an extinction coefficient of 54.5 mL mg-1
cm-1
(Rance et al. 2010). The
calculations were done for the CNTs suspensions prepared using the selected surfactant-to-CNT
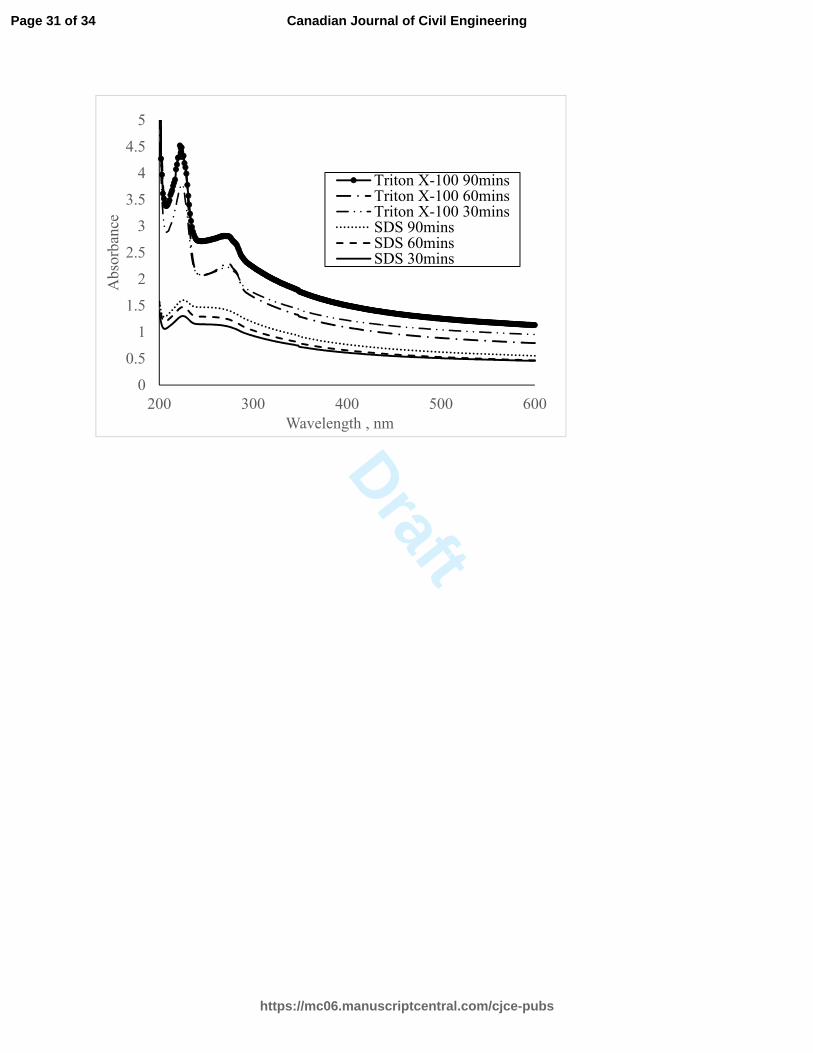
ratio of 2.5 only. The complete UV-vis spectra is shown in Figure 4.
Figure 4: UV-vis spectra for CNT in water dispersions using Triton X-100 and SDS for different
sonication times
The maximum peak absorbance occurred at a wavelength range between 210 to 226 nm.
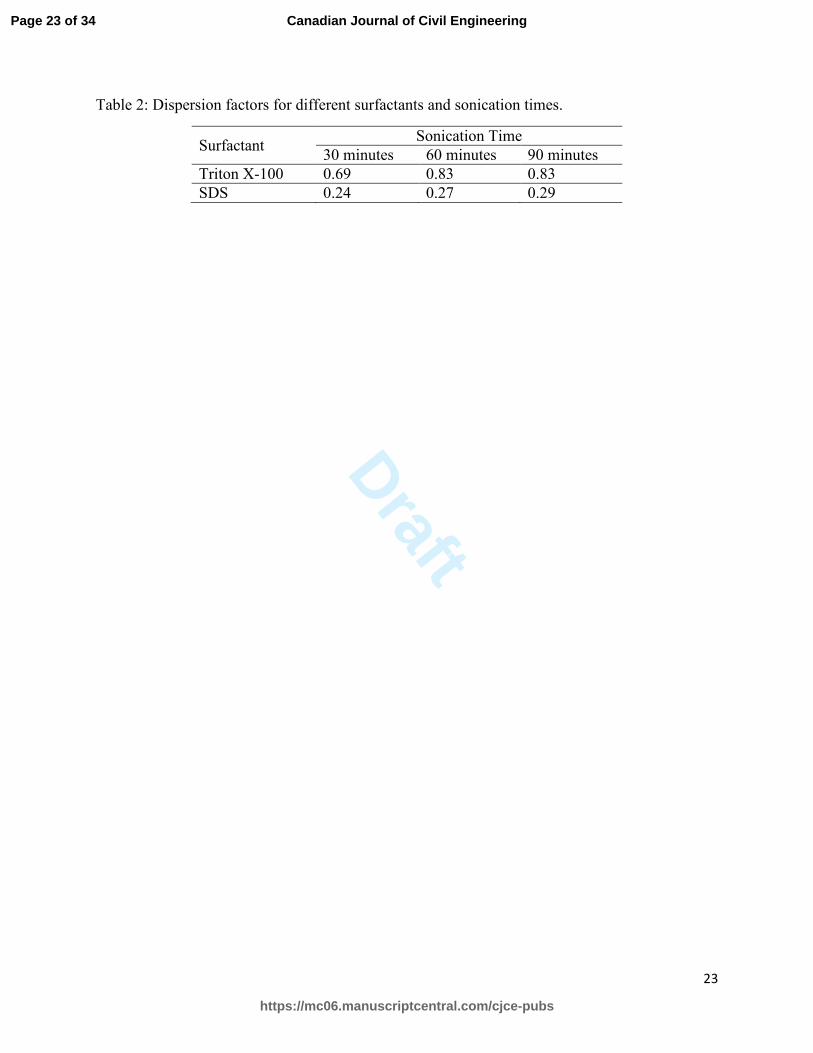
Lambert-Beer’s law was used to compute the CNTs concentration. A dispersion factor was
calculated as the ratio between the computed concentration and the initial CNT concentration,
which was equal to 0.1mg/mL. This dispersion factor is representative of the dispersion
effectiveness of the surfactant used and the sonication process. Table 2 lists the dispersion
factors for each of the different combination of surfactant and sonication time. The factors given
Page 11 of 34
https://mc06.manuscriptcentral.com/cjce-pubs
Canadian Journal of Civil Engineering
Draft
12
in Table 1 show that Triton X-100 exhibited significant dispersion power compared to SDS. The
dispersion factor did not increase considerably from a sonication time of 60 to 90 mins.
Table 2: Dispersion factors for different surfactants and sonication times.
SDS is an anionic surfactant with a sulfate hydrophilic head group and a long organic
hydrophobic tail group. The existence of long chains improve dispersion because they provide
larger steric hindrance which results in greater repulsion between the CNTs preventing them
from agglomerating (Islam et al. 2003). On the other side, Triton X-100 is a nonionic surfactant
with a hydrophilic group of polyethylene oxide and an alkyl-phenol hydrophobic group. The
benzene structure of the hydrophobic part of Triton X-100 provides better adhesion to the surface
of the CNTs due to the π-π interaction (Cyr et al. 1996). The superior dispersion power of Triton
X-100, as noted in this work, can thus be attributed to the presence of the benzene ring which
drastically increase the binding and surface coverage of the surfactant onto the CNTs.
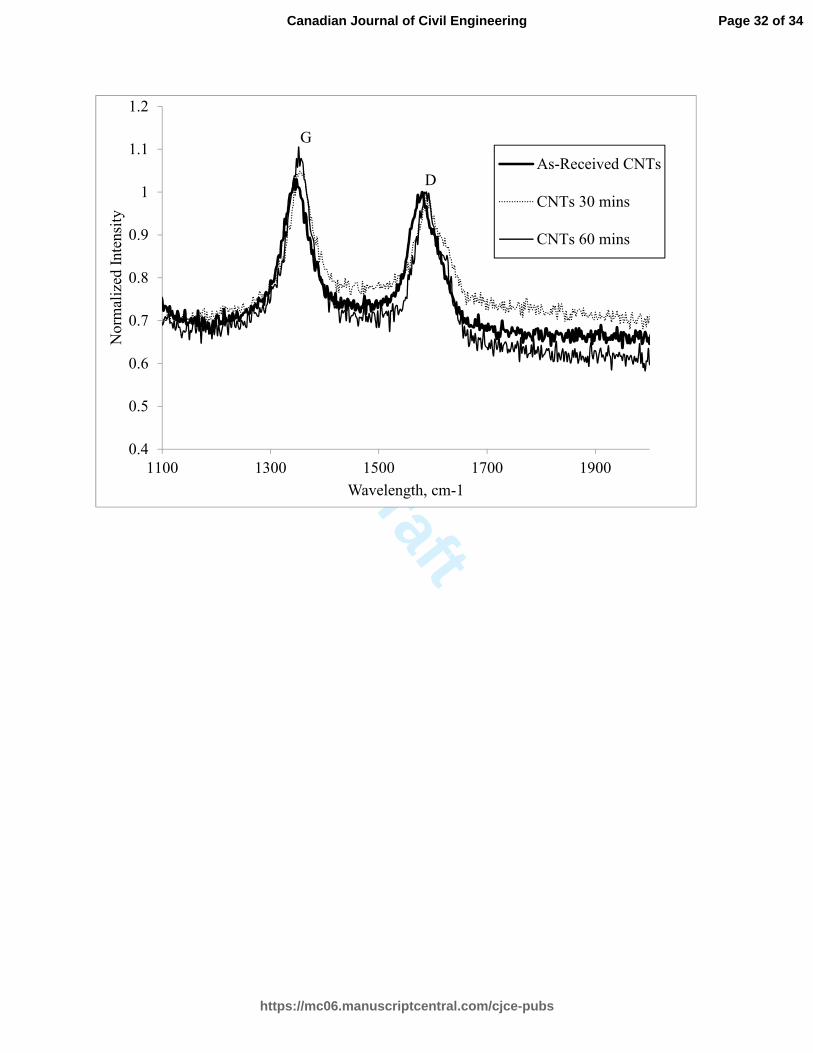
Raman Spectroscopy
As seen in Figure 5, Raman spectrum of the CNTs showed two main peaks, namely D and G
bands. The G band, noted at 1500-1600 cm-1
, is a characteristic mode of graphene-like ordered
structures which is attributed to the tangential stretching of the C-C bonds. The D band, seen at
1350 cm-1
, is an indication of the defects and disorder in the structure. It is mainly linked to the
disruptions in the planar sheet graphene structure at the edges and amount of amorphous carbon
(Natsuki et al. 2013). The ratio of D-band to G-band is of particular significance as it relates
directly to the imperfections in the CNTs. In Figure 5, the peak at the D-band was normalized to
1 so that the normalized intensity of the peak at the G-band is used for comparison. The value of
the normalized intensity at the G-band, which equals to the ratio of D-band to G-band, was
Page 12 of 34
https://mc06.manuscriptcentral.com/cjce-pubs
Canadian Journal of Civil Engineering
Draft
13
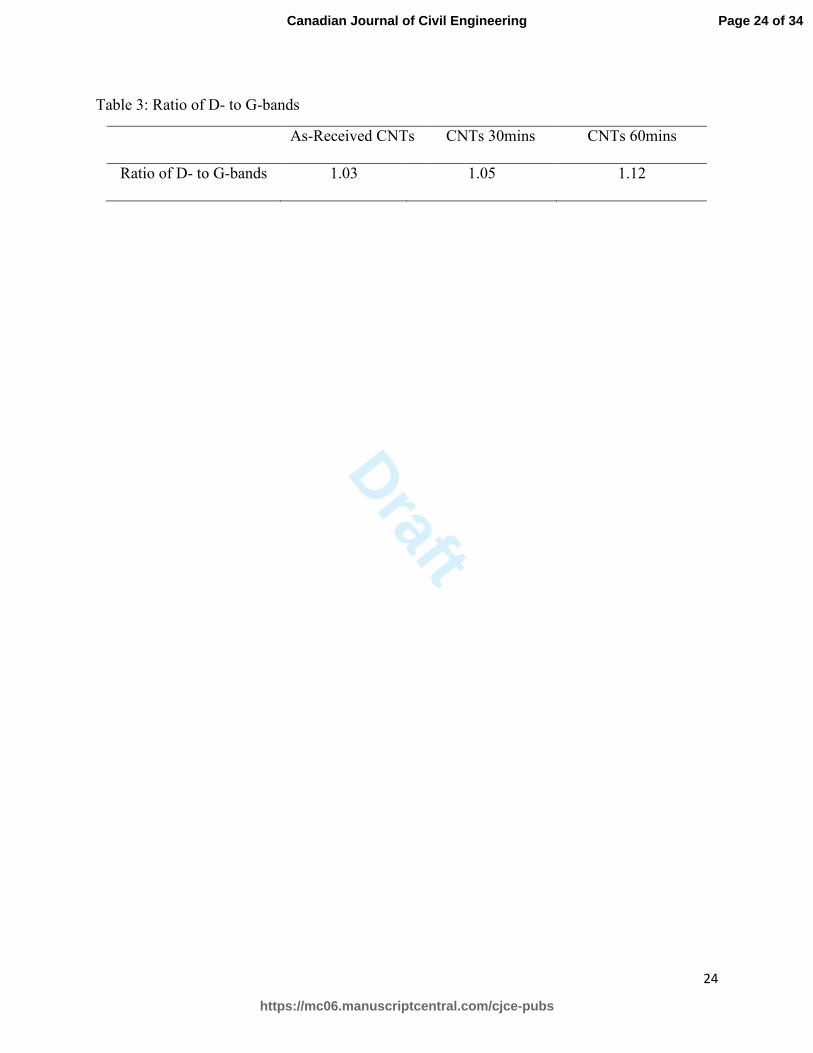
tabulated in Table 3 below. It can be concluded that the degree of defects, as indicated by this
ratio, increased with the increase of ultrasonication. The change of this ratio with 30-minutes
ultrasonication was insignificant, however a noticeable increase was noted as the ultrasonication
time increased to 60 minutes.
Figure 5: Raman Spectra for as-received and ultrasonicated CNTs
Table 3: Ratio of D- to G-bands
Air content
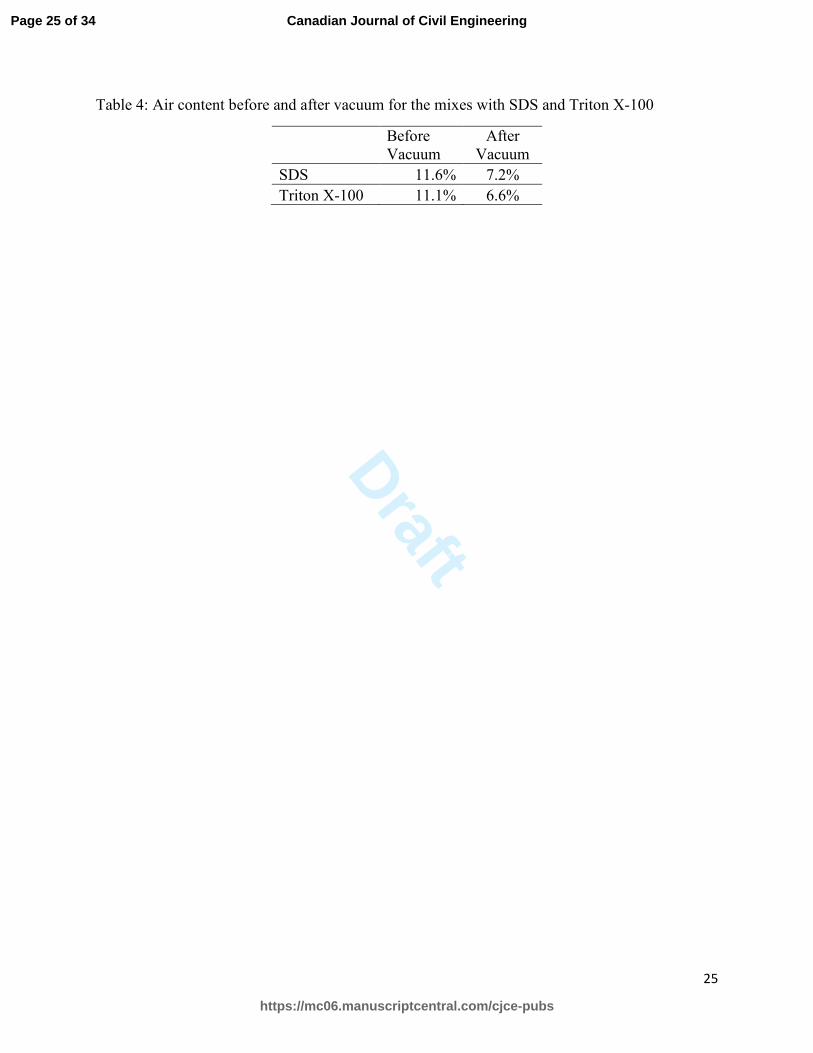
The results of the air content before and after vacuum application is shown in Table 4. The
determined air content was 7.2% and 6.6%, following vacuum application, compared to an air
content of 11.6% and 11.1% before vacuum application, for SDS and Triton X-100 respectively.
These results also indicate that the entrapped air was not completely removed by vacuum suction
however the use of vacuum resulted in a considerable elimination of the air voids. Earlier
research has showed that anionic surfactants like SDS generate more stable air voids (Dodson
1990), compared to nonionic surfactants such as Triton X-100, which agrees with the finding of
this study.
Table 4: Air content before and after vacuum for the mixes with SDS and Triton X-100
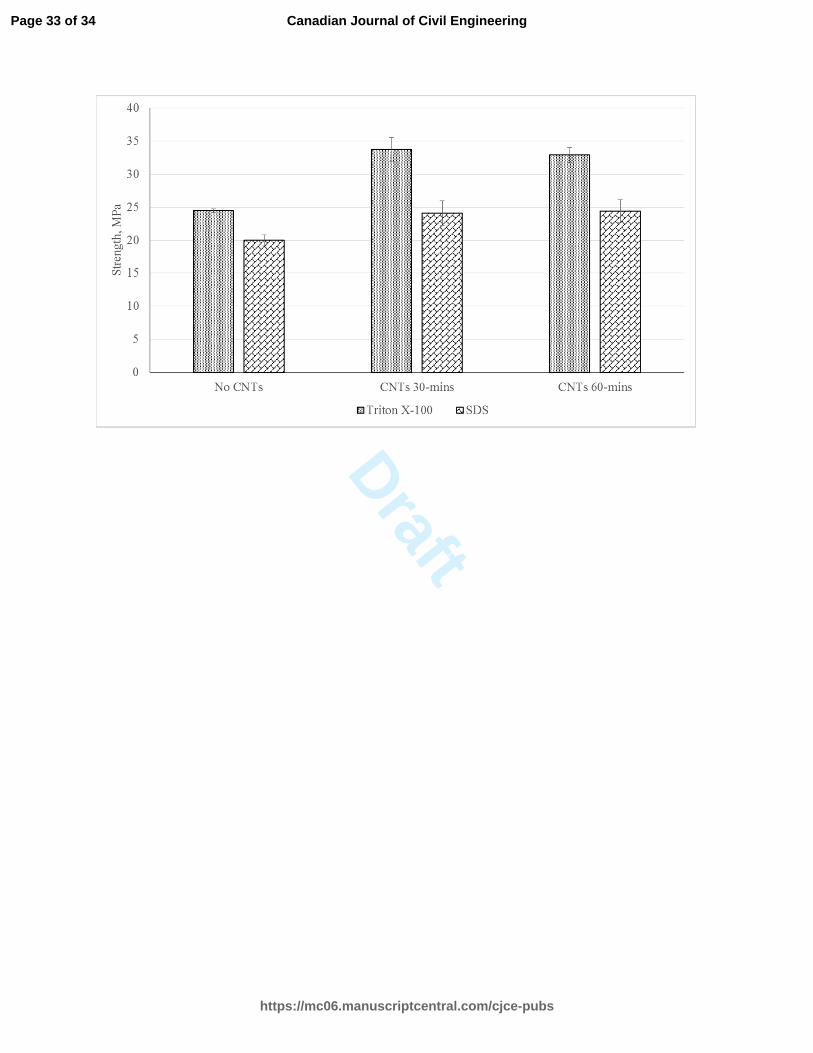
Compressive Strength
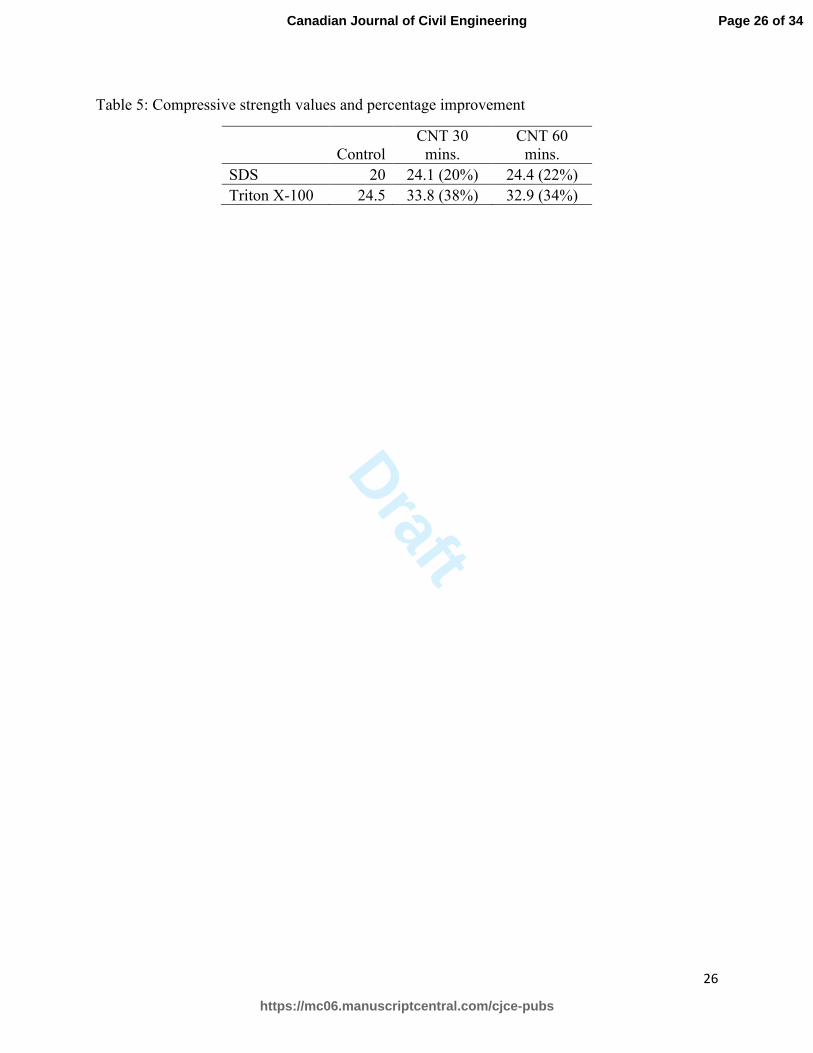
A summary of the compressive strength for all specimens is shown in Figure 6 and Table 5,
along with the percentage improvement in strength with CNTs. It was noted that the strength of
the control specimens made with SDS was lower than that made with Triton X-100 which could
Page 13 of 34
https://mc06.manuscriptcentral.com/cjce-pubs
Canadian Journal of Civil Engineering
Draft
14
possibly be due to more air voids being trapped in the case of SDS as evidenced by the air
content measurements. The percentage improvement in strength, shown in Table 5, indicate that
using Triton X-100 resulted in a higher percentage increase in strength amounting to 38% as
compared to an increase of 20% in the case of SDS, at 30-minute ultranosication. These results
agree with the UV-Vis analysis earlier which revealed that Triton X-100 is more efficient than
SDS in dispersing the CNTs. With better dispersion, the strength improvement due to CNTs is
more pronounced. The strength obtained at an ultrasonication time of 60 minutes did not further
improve the strength. According to UV-Vis analysis, when ultrasonication time increased from
30 to 60 minutes, the dispersion efficiency factors slightly increased by about 10-15%. However,
this increase in dispersion efficiency did not cause further improvement in strength as evidenced
by the compressive strength results. This can be explained in terms of defects introduced by the
ultrasonication process which disrupts the integrity of the CNTs and reduce their mechanical
properties.
Figure 6: Compressive Strength of tested mortar specimens
Table 5: Compressive strength values and percentage improvement
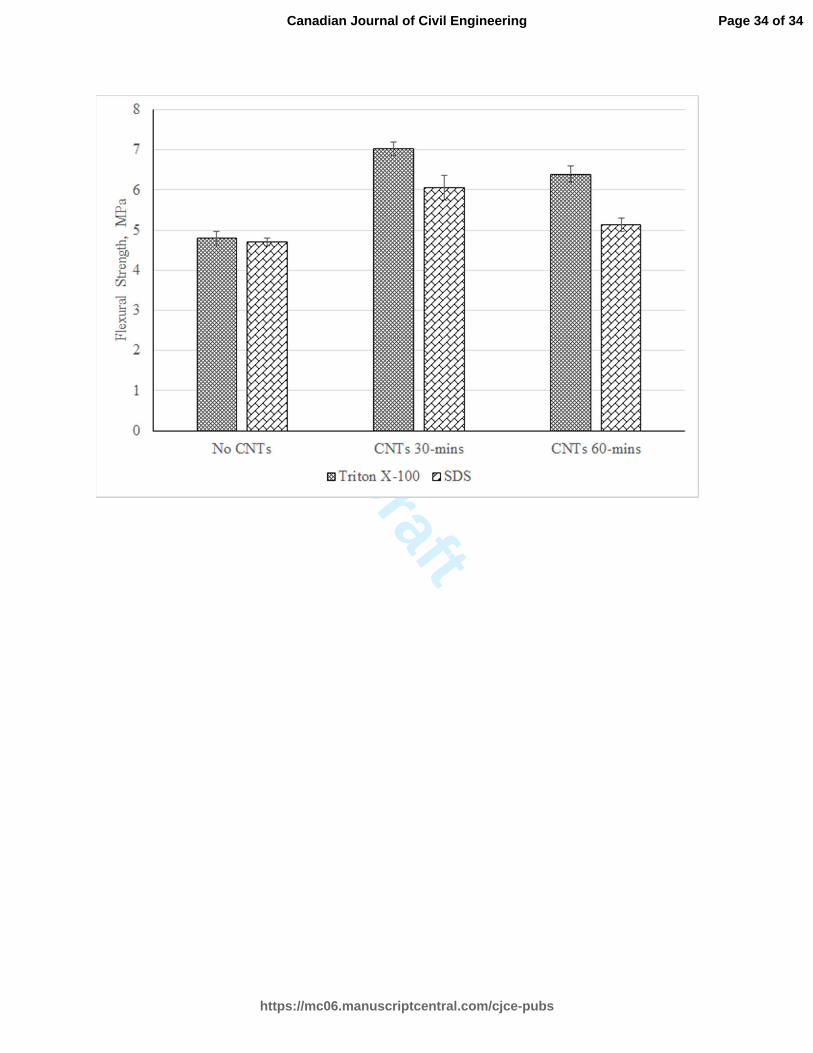
Flexural Strength
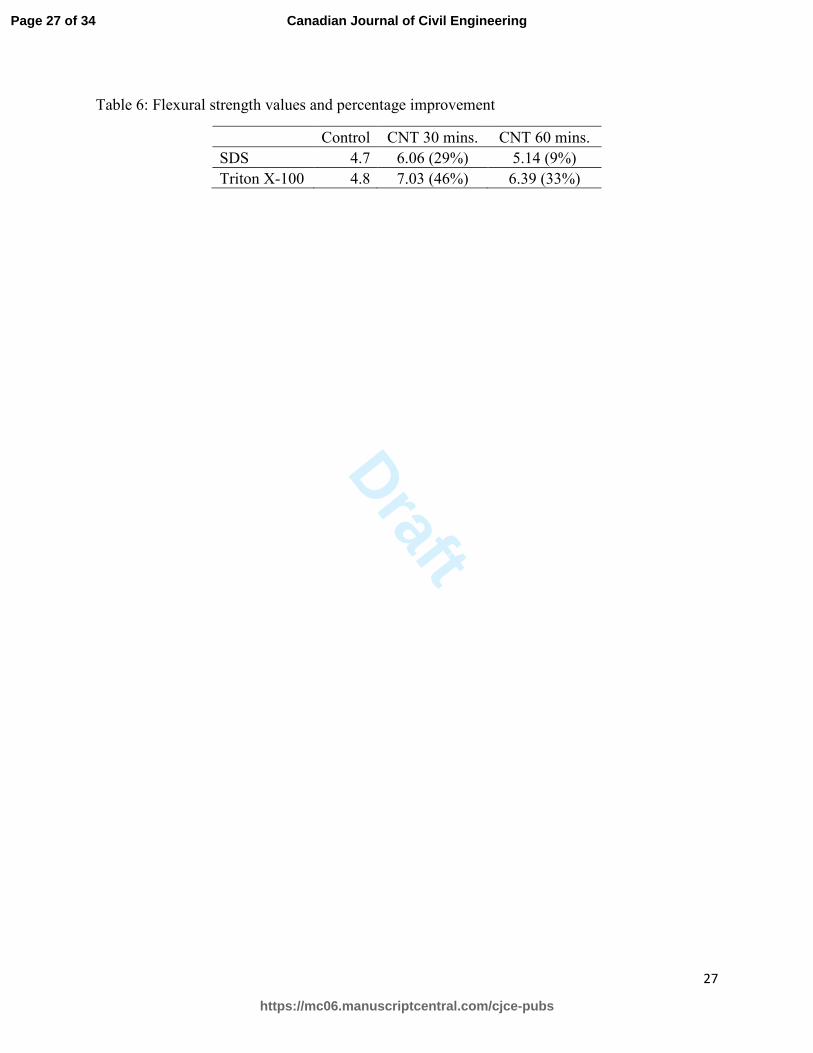
The flexural strength results are shown in Figure 7 and Table 6, along with percentage
improvement with CNTs. The control specimens, without CNTs, showed similar strengths for
both SDS and Triton X-100 with the latter being slightly higher. Using CNTs ultrasonicated for
30 minutes, the improvement in strength was 46% and 29% for Triton X-100 and SDS
Page 14 of 34
https://mc06.manuscriptcentral.com/cjce-pubs
Canadian Journal of Civil Engineering
Draft
15
respectively. The percentage improvement in flexural strength dropped considerably to 33% and
9% for Triton X-100 and SDS respectively, when CNTs ultrasonicated for 60 minutes were used.
Clearly the defects introduced by ultrasonication primarily affected the tensile strength of the
CNTs which determines its ability to bridge cracks and enhances the flexural strength of the
composite.
Figure 7: Flexural strength of tested mortar specimens
Table 6: Flexural strength values and percentage improvement
Summary and conclusions
In this study, two commonly used surfactant, namely SDS and Triton X-100 were used to
disperse CNTs in water. The performance of the two surfactants were investigated using UV-Vis
spectrometry and it was shown that Triton X-100 proved to be more efficient due to the presence
of the benzene ring in their structure which improves its ability to bond to the CNTs. This
finding agrees with previous research which also pointed out to the effectiveness of Triton X-100
as compared to SDS (Rastogi et al. 2008). The dispersion factor, which is an indication of the
dispersion efficiency, for Triton X-100 at a surfactant-to-CNT ratio of 2.5 and an ultrasonication
time of 30 minutes reached up to 0.69 compared to a dispersion factor of 0.24 for SDS. An
analysis of the ultrasonicated CNTs using Raman showed that the CNTs degraded notably
beyond an ultrasonication time of 30 minutes.
Mortar specimens containing 0.2% of CNTs by weight of cement showed an improvement in
both compressive and flexural strength. The improvement was higher in case of Triton X-100,
compared to SDS, due to their better dispersion capabilities. With Triton X-100, an increase of
Page 15 of 34
https://mc06.manuscriptcentral.com/cjce-pubs
Canadian Journal of Civil Engineering
Draft
16
38% and 51% in compressive and flexural strength respectively was obtained at a surfactant-to-
CNT ratio of 2.5 and an ultrasonication time of 30 minutes. Mortar specimens using CNTs
ultrasonicated for 60 minutes showed no improvement in compressive strength and a significant
reduction in flexural strength, which is believed to be related to the damage in CNTs due to
ultrasonication. Obviously, the damage in CNTs has affected its ability to bridge cracks and
improve flexural strength. In this regard, additional work might be necessary to further
understand the difference in response between compressive and flexural specimens with
increasing sonication times. In conclusion, an ultrasonication time of 30 minutes, providing an
energy of 9.7 KJ/ml, was considered optimal, for both types of surfactants used in this study,
since it provided satisfactory level of dispersion without considerably degrading the CNTs as
evidenced by Raman spectroscopy, leading to higher improvement in strength.
Acknowledgements
This work was funded by the American University in Cairo (AUC), Egypt.
References
Al-Rub, R. K. A., Tyson, B. M., Yazdanbakhsh, A., and Grasley, Z. 2011. Mechanical properties of
nanocomposite cement incorporating surface-treated and untreated carbon nanotubes and carbon
nanofibers. Journal of Nanomechanics and Micromechanics. 2(1): 1-6. doi:10.1061/(ASCE)NM.2153-
5477.0000041.
Cwirzen, A., Habermehl-Cwirzen, K., and Penttala, V. 2008. Surface decoration of carbon nanotubes and
mechanical properties of cement/carbon nanotube composites. Advances in cement research. 20(2): 65-
73, doi:10.1680/adcr.2008.20.2.65.
Cyr, D. M., Venkataraman, B., and Flynn, G. W. 1996. STM investigations of organic molecules
physisorbed at the liquid-solid interface. Chemistry of materials. 8(8): 1600-1615,
doi:10.1021/cm960113a.
Page 16 of 34
https://mc06.manuscriptcentral.com/cjce-pubs
Canadian Journal of Civil Engineering
Draft
17
Dodson, V. H. 1990. Concrete admixtures. Kluwer Academic Publishers.
Elkashef, M., Wang, K., and Abou-Zeid, M. 2016. Acid-treated carbon nanotubes and their effects on
mortar strength. Frontiers of Structural and Civil Engineering. 10(2): 180-188, doi:10.1007/s11709-015-
0325-7.
Gopalakrishnan, K., Birgisson, B., Taylor, P., and Attoh-Okine, N. O. 2011. Nanotechnology in civil
infrastructure. Springer.
Grossiord, N., Regev, O., Loos, J., Meuldijk, J., and Koning, C. E. 2005. Time-dependent study of the
exfoliation process of carbon nanotubes in aqueous dispersions by using UV− visible spectroscopy.
Analytical chemistry. 77(16): 5135-5139. doi:10.1021/ac050358j.
Han, B., Yu, X., and Kwon, E. 2009. A self-sensing carbon nanotube/cement composite for traffic
monitoring. Nanotechnology. 20(44): 445501-445505. doi:10.1088/0957-4484/20/44/445501.
Hilding, J., Grulke, E. A., George Zhang, Z., and Lockwood, F. 2003. Dispersion of carbon nanotubes in
liquids. Journal of dispersion science and technology. 24(1): 1-41. doi:10.1081/DIS-120017941.
Iijima, S. 1991. Helical microtubules of graphitic carbon. Nature. 354(6348): 56-58.
doi:10.1038/354056a0.
Ikeda, A., Hamano, T., Hayashi, K., and Kikuchi, J.-i. 2006. Water-solubilization of nucleotides-coated
single-walled carbon nanotubes using a high-speed vibration milling technique. Organic letters. 8(6):
1153-1156. doi:10.1021/ol053089s.
Inkyo, M., Tahara, T., Iwaki, T., Iskandar, F., Hogan, C. J., and Okuyama, K. 2006. Experimental
investigation of nanoparticle dispersion by beads milling with centrifugal bead separation. Journal of
colloid and interface science. 304(2): 535-540. doi:10.1016/j.jcis.2006.09.021.
Islam, M., Rojas, E., Bergey, D., Johnson, A., and Yodh, A. 2003. High weight fraction surfactant
solubilization of single-wall carbon nanotubes in water. Nano Letters. 3(2): 269-273.
doi:10.1021/nl025924u.
Page 17 of 34
https://mc06.manuscriptcentral.com/cjce-pubs
Canadian Journal of Civil Engineering
Draft
18
Jeong, S. H., Kim, K. K., Jeong, S. J., An, K. H., Lee, S. H., and Lee, Y. H. 2007. Optical absorption
spectroscopy for determining carbon nanotube concentration in solution. Synthetic Metals. 157(13):
570-574. doi:10.1016/j.synthmet.2007.06.012.
Jiang, L., Gao, L., and Sun, J. 2003. Production of aqueous colloidal dispersions of carbon nanotubes.
Journal of Colloid and Interface Science. 260(1): 89-94. doi:10.1016/S0021-9797(02)00176-5.
Konsta-Gdoutos, M. S., Metaxa, Z. S., and Shah, S. P. 2010. Highly dispersed carbon nanotube reinforced
cement based materials. Cement and Concrete Research. 40(7): 1052-1059.
doi:10.1016/j.cemconres.2010.02.015.
Konsta-Gdoutos, M. S., Metaxa, Z. S., and Shah, S. P. 2010. Multi-scale mechanical and fracture
characteristics and early-age strain capacity of high performance carbon nanotube/cement
nanocomposites. Cement and Concrete Composites. 32(2): 110-115.
doi:10.1016/j.cemconcomp.2009.10.007.
Kumar, S., Kolay, P., Malla, S., and Mishra, S. 2011. Effect of multiwalled carbon nanotubes on
mechanical strength of cement paste. Journal of Materials in Civil Engineering. 24(1): 84-91.
doi:10.1061/(ASCE)MT.1943-5533.0000350.
Li, G. Y., Wang, P. M., and Zhao, X. 2005. Mechanical behavior and microstructure of cement composites
incorporating surface-treated multi-walled carbon nanotubes. Carbon. 43(6): 1239-1245.
doi:10.1016/j.carbon.2004.12.017.
Lu, K., Lago, R., Chen, Y., Green, M., Harris, P., and Tsang, S. 1996. Mechanical damage of carbon
nanotubes by ultrasound. Carbon. 34(6): 814-816. doi:10.1016/0008-6223(96)89470-X.
Makar, J., Margeson, J., and Luh, J. 2005. Carbon nanotube/cement composites-early results and
potential applications. Proceedings of 3rd
International Conference on Construction materials:
performance, innovations and structural implications, Vancouver, BC, 22 Aug – 24 Aug. pp 1-10.
Page 18 of 34
https://mc06.manuscriptcentral.com/cjce-pubs
Canadian Journal of Civil Engineering
Draft
19
Marsh, D. H., Rance, G. A., Zaka, M. H., Whitby, R. J., and Khlobystov, A. N. 2007. Comparison of the
stability of multiwalled carbon nanotube dispersions in water. Physical Chemistry Chemical Physics.
9(40): 5490-5496. doi:10.1039/b708460a.
Natsuki, T., Melvin, G. J. H., and Ni, Q.-Q. 2013. Vibrational Frequencies and Raman Radial Breathing
Modes of Multi-Walled Carbon Nanotubes Based on Continuum Mechanics. Journal of Materials Science
Research, 2(4): 1-11, doi:10.5539/jmsr.v2n4p1.
Rance, G. A., Marsh, D. H., Nicholas, R. J., and Khlobystov, A. N. 2010. UV–vis absorption spectroscopy of
carbon nanotubes: Relationship between the π-electron plasmon and nanotube diameter. Chemical
Physics Letters. 493(1): 19-23. doi:10.1016/j.cplett.2010.05.012.
Rastogi, R., Kaushal, R., Tripathi, S., Sharma, A. L., Kaur, I., and Bharadwaj, L. M. 2008. Comparative study
of carbon nanotube dispersion using surfactants. Journal of colloid and interface science. 328(2): 421-
428. doi:10.1016/j.jcis.2008.09.015.
Saez de Ibarra, Y., Gaitero, J., Erkizia, E., and Campillo, I. 2006. Atomic force microscopy and
nanoindentation of cement pastes with nanotube dispersions. Physica status solidi (a). 203(6): 1076-
1081. doi:10.1002/pssa.200566166.
Singh, A. P., Gupta, B. K., Mishra, M., Chandra, A., Mathur, R., and Dhawan, S. 2013. Multiwalled carbon
nanotube/cement composites with exceptional electromagnetic interference shielding properties.
Carbon. 56: 86-96. doi:10.1016/j.carbon.2012.12.081
Sobolkina, A., Mechtcherine, V., Khavrus, V., Maier, D., Mende, M., Ritschel, M., and Leonhardt, A. 2012.
Dispersion of carbon nanotubes and its influence on the mechanical properties of the cement matrix.
Cement and Concrete Composites. 34(10): 1104-1113. doi:10.1016/j.cemconcomp.2012.07.008.
Tchoul, M. N., Ford, W. T., Lolli, G., Resasco, D. E., and Arepalli, S. 2007. Effect of mild nitric acid
oxidation on dispersability, size, and structure of single-walled carbon nanotubes. Chemistry of
Materials. 19(23): 5765-5772. doi:10.1021/cm0717581.
Page 19 of 34
https://mc06.manuscriptcentral.com/cjce-pubs
Canadian Journal of Civil Engineering
Draft
20
Tyson, B. M., Abu Al-Rub, R. K., Yazdanbakhsh, A., and Grasley, Z. 2011. Carbon nanotubes and carbon
nanofibers for enhancing the mechanical properties of nanocomposite cementitious materials. Journal
of Materials in Civil Engineering. 23(7): 1028-1035.
Vaisman, L., Wagner, H. D., and Marom, G. 2006. The role of surfactants in dispersion of carbon
nanotubes. Advances in colloid and interface science. 128: 37-46. doi:10.106/j.cis.2006.11.007.
Wansom, S., Kidner, N., Woo, L., and Mason, T. 2006. AC-impedance response of multi-walled carbon
nanotube/cement composites. Cement and Concrete Composites, 28(6): 509-519.
doi:10.1016/j.cemconcomp.2006.01.014.
Yang, K., Yi, Z., Jing, Q., Yue, R., Jiang, W., and Lin, D. 2013. Sonication-assisted dispersion of carbon
nanotubes in aqueous solutions of the anionic surfactant SDBS: The role of sonication energy. Chinese
Science Bulletin. 58(17): 2082-2090. doi:10.1007/s11434-013-5697-2.
Yazdanbakhsh, A., Grasley, Z., Tyson, B., and Al-Rub, R. A. 2009. Carbon nano filaments in cementitious
materials: some issues on dispersion and interfacial bond. ACI Special Publication. 267. 21-34.
Yu, J., Grossiord, N., Koning, C. E., and Loos, J. 2007. Controlling the dispersion of multi-wall carbon
nanotubes in aqueous surfactant solution. Carbon. 45(3): 618-623. doi:10.1016/j.carbon.2006.10.010
Page 20 of 34
https://mc06.manuscriptcentral.com/cjce-pubs
Canadian Journal of Civil Engineering
Draft
21
Figure 1: SEM image of pristine CNTs
Figure 2: UV-vis peak absorbance for CNTs aqueous suspension using SDS
Figure 3: UV-vis peak absorbance for CNTs aqueous suspension using Triton X-100
Figure 4: UV-vis spectra for CNT in water dispersions using Triton X-100 and SDS for different
sonication times
Figure 5: Raman Spectra for as-received and ultrasonicated CNTs
Figure 6: Compressive Strength of tested mortar specimens
Figure 7: Flexural strength of tested mortar specimens
Page 21 of 34
https://mc06.manuscriptcentral.com/cjce-pubs
Canadian Journal of Civil Engineering
Draft
22
Table 1: Chemical properties of OPC
SiO2 Al2O3 Fe2O3 CaO MgO SO3 LOI
20.89 4.68 3.43 63.33 2.18 2.95 2.20
Page 22 of 34
https://mc06.manuscriptcentral.com/cjce-pubs
Canadian Journal of Civil Engineering
Draft
23
Table 2: Dispersion factors for different surfactants and sonication times.
Surfactant Sonication Time
30 minutes 60 minutes 90 minutes
Triton X-100 0.69 0.83 0.83
SDS 0.24 0.27 0.29
Page 23 of 34
https://mc06.manuscriptcentral.com/cjce-pubs
Canadian Journal of Civil Engineering
Draft
24
Table 3: Ratio of D- to G-bands
As-Received CNTs CNTs 30mins CNTs 60mins
Ratio of D- to G-bands 1.03 1.05 1.12
Page 24 of 34
https://mc06.manuscriptcentral.com/cjce-pubs
Canadian Journal of Civil Engineering
Draft
25
Table 4: Air content before and after vacuum for the mixes with SDS and Triton X-100
Before
Vacuum
After
Vacuum
SDS 11.6% 7.2%
Triton X-100 11.1% 6.6%
Page 25 of 34
https://mc06.manuscriptcentral.com/cjce-pubs
Canadian Journal of Civil Engineering
Draft
26
Table 5: Compressive strength values and percentage improvement
Control
CNT 30
mins.
CNT 60
mins.
SDS 20 24.1 (20%) 24.4 (22%)
Triton X-100 24.5 33.8 (38%) 32.9 (34%)
Page 26 of 34
https://mc06.manuscriptcentral.com/cjce-pubs
Canadian Journal of Civil Engineering
Draft
27
Table 6: Flexural strength values and percentage improvement
Control CNT 30 mins. CNT 60 mins.
SDS 4.7 6.06 (29%) 5.14 (9%)
Triton X-100 4.8 7.03 (46%) 6.39 (33%)
Page 27 of 34
https://mc06.manuscriptcentral.com/cjce-pubs
Canadian Journal of Civil Engineering
Draft
Page 28 of 34
https://mc06.manuscriptcentral.com/cjce-pubs
Canadian Journal of Civil Engineering
Draft
0
0.2
0.4
0.6
0.8
1
1.2
1.4
1.6
1.8
2
0 20 40 60 80 100
Peak Absorbance
Sonication time, minutes
SDS/CNT = 1
SDS/CNT= 2.5
SDS/CNT = 5
Page 29 of 34
https://mc06.manuscriptcentral.com/cjce-pubs
Canadian Journal of Civil Engineering
Draft
0
0.5
1
1.5
2
2.5
3
3.5
4
4.5
5
0 20 40 60 80 100
Peak Absorbance
Sonication time, minutes
Triton X-100/CNT = 1
Triton X-100/CNT = 2.5
Page 30 of 34
https://mc06.manuscriptcentral.com/cjce-pubs
Canadian Journal of Civil Engineering
Draft
0
0.5
1
1.5
2
2.5
3
3.5
4
4.5
5
200 300 400 500 600
Absorbance
Wavelength , nm
Triton X-100 90minsTriton X-100 60minsTriton X-100 30minsSDS 90minsSDS 60minsSDS 30mins
Page 31 of 34
https://mc06.manuscriptcentral.com/cjce-pubs
Canadian Journal of Civil Engineering
Draft
0.4
0.5
0.6
0.7
0.8
0.9
1
1.1
1.2
1100 1300 1500 1700 1900
Norm
aliz
ed I
nte
nsi
ty
Wavelength, cm-1
As-Received CNTs
CNTs 30 mins
CNTs 60 mins
G
D
Page 32 of 34
https://mc06.manuscriptcentral.com/cjce-pubs
Canadian Journal of Civil Engineering
Draft
Page 33 of 34
https://mc06.manuscriptcentral.com/cjce-pubs
Canadian Journal of Civil Engineering
Draft
Page 34 of 34
https://mc06.manuscriptcentral.com/cjce-pubs
Canadian Journal of Civil Engineering