Embed Size (px)
Citation preview

1
Draft Report: Costs and Earnings Survey, Inshore and Onshore Fishing Sector, SWNB
Report to the Fundy North Fishermen’s Association DRAFT 2: June 2009
Melanie G. Wiber, Murray Rudd and Maria Recchia
Introduction
Over ten years ago, the Social Sciences and Humanities Research Council of Canada
(SSHRC) established innovative Community-University Research Alliance (CURA) funding that
combines both local and academic knowledge to address social, cultural and economic issues
confronting Canadian communities. The focus of this funding is capacity building, sharing of
information and knowledge, and development of strategies for decision-making and for the
enrichment of academic curricula.
The Coastal CURA is a five-year project that takes a regional focus on livelihood
problems facing coastal communities in the Canadian Maritimes. This CURA is an alliance of
First Nations communities, fishermen’s associations, civil society, government, non-
governmental organizations, and university participants from the Maritime Provinces (New
Brunswick, Nova Scotia and Prince Edward Island). Specific goals for Coastal CURA include:
examining the current effectiveness of coastal resource governance; increasing community
capacity to participate in the integrated management of the coast; establishing a maritime
network for community-level governance; and contributing to coastal and oceans research
innovation and knowledge generation (see www.coastalcura.ca).
This paper reports on one project undertaken as part of the Coastal CURA research
agenda. It focuses on coastal Southwest New Brunswick (SWNB), including coastal areas of
Saint John and Charlotte Counties (see Map 1). According to the 2006 census data of Statistics
Canada, Saint John County has a population of 74,621, of which 10,622 lives in small coastal
towns. Charlotte County, with no large city center, has a population of 26,8981. Much of this
population base outside the city of Saint John lives in small coastal towns and villages. The
project examined the contribution of the inshore fishing sector (with boats under 45 feet in
length) to the economy of such coastal communities.
1 http://www12.statcan.ca/english/census06/data/popdwell/Table.cfm?T=703&PR=13&S=0&O=A&RPP=25

2
SWNB is an area that is undergoing rapid expansion with numerous competing users of
the coastal zone. Traditional users such as the capture fishery, tourism, shipping and transport are
experiencing the difficulties of making room for new entrants, including aquaculture, industrial
and petrochemical development, and tidal power. Management regimes for coastal areas are not
keeping pace with such new developments, or with the management challenges they generate.
The objective of this project was to provide the information needed to further integrated
management of coastal activities, to facilitate better management and planning, and to better
weight the costs and benefits of competing claims on coastal resources.
The project used both quantitative and qualitative data gathering methods, including a
questionnaire that collected information from license holders on their costs and earnings, and a
set of semi-structured interviews that explored the experiences of the onshore harvesters of dulse,
periwinkles, clams, and gaspereau. Project partners were drawn from the University of New
Brunswick, Sir Wilfred Grenville College of Memorial University Newfoundland, and Fundy
North Fishermen’s Association. Two other organizations, the Fundy Weir Fishermen’s
Association, and Eastern Charlotte Waterways Incorporated (a non-profit community
organization) also assisted with the study. This paper begins with a brief discussion of the
management challenges in SWNB, turns next to the need for the project, describes the
methodology utilized, and then reports on the findings. We conclude with a short discussion
section that assesses the impact of the inshore sector on the economy of coastal communities.

3
Map 1: The Province of New Brunswick

4
Integrated Management In SWNB
In the seventeen years since the Rio Declaration (1992), coastal nations around the globe
have adopted policy utilizing the language of integrated management (IM)2 (Olsen 2003;
Christie 2005, Christie et al. 2005, Stojanovic 2004). IM advocates a multi-disciplinary
approach to address the often conflicting requirements of maintaining the sustainability of the
biophysical environment and of the livelihoods of those who depend on that environment (Olsen
2003). It promotes a planning collaboration that is adaptive and ongoing in order to address
social, economic, institutional, environmental and legal interests of multiple stakeholders and of
the resources being managed (Christie 2005). The Coastal CURA research has examined the
Canadian process of building IM for coastal zones with a particular focus on the Canadian
Maritimes (see Kearney et. al. 2007). given the literature on deliberative democratic theory, has
particularly focused on “the factors that fuel public discussion and debate and how those
deliberations are both enhanced and or inhibited” (Parkins and Mitchell 2005: 537).
The area of coastal SWNB that lies along the Bay of Fundy is a complex marine
environment, with unique tidal waters and estuaries hosting several important commercial
species (lobster, scallop, herring, groundfish) as well as species that attract tourism (right whales,
migatory birds). It is currently viewed as a potential economic growth area in a province that has
been struggling economically. Historically, fisheries resources have provided a significant
contribution to the local economy; the fisheries sector has often been the sole or one of the few
contributors, followed closely by tourism. The area still relies to a large extent on the fishery,
with approximately 325 lobster licenses, 200 ground fishing licenses and 217 weir licenses
currently held by local fishermen (Southwest New Brunswick Marine Resources Planning Board
2008). There are also 97 aquaculture site locations within the SWNB portion of the Bay of
Fundy, including licenses for finfish species (Atlantic salmon, cod, halibut) as well as bivalves
(mussels) and aquatic plants (Anderson 2007). In addition, 10 tourism operations (e.g. whale
watching, boating, sea kayaking) contribute to the economy of SWNB coastal communities, as
does significant coastal gentrification, particularly in the Fundy Islands.
Many more recent users of the SWNB marine space also exist. Shipping traffic into the
international port of Saint John is on the rise. The potential development of a second oil refinery
2 Although the terms Integrated Coastal Management (ICM), or Integrated Coastal Zone Management (ICZM) are widely used, we conform to the current practice in Canadian legislation and policies of using Integrated Management (IM).

5
in that city to address the eastern Canadian and US demand for an additional 150,000 to 300,000
barrels per day (Irving Oil 2008) will add to shipping complexity. A liquid natural gas (LNG)
plant has also just been completed in Saint John Harbour. The development of a provincial
“energy hub” is proposed for the area, linking wind and tidal installations to the more traditional
petrochemical and nuclear sources. The management and coordination of these burgeoning
activities has both stretched government capacity and challenged traditional users.
Need for the project
Increasingly, civil society organizations or industry groups underwrite the public
consultation vital to the integrated management of Canada’s coastal zone. Fundy North
Fishermen’s Association (FNFA) is a good example of this tendency. The organization was
established in the mid 1980’s, and is a not-for-profit fishermen’s organization that
represents license holders (e.g. lobster, scallop, eel and gasperau) as well as crew members.
The association has approximately 75 members3. FNFA participates as a stakeholder
advocate regarding all matters affecting the capture fishery from Saint John to St. Stephen,
including Deer Island, but excluding Grand Manan and Campobello islands (see Map 1).
This organization is called upon to represent the interests of the inshore sector in
management and planning for the coastal zone. They serve on Department of Fisheries and
Oceans (DFO) stock management committees for all commercial stock utilized by their
membership, organize ad hoc committees to address marine traffic lanes and post-9-11
security issues in Saint John harbour, collaborate on environmental impact assessments
(EIAs) and on “harmful alteration, disruption or destruction” (HADD) remediation,
participate in academic research, including the Coastal CURA, cooperate in development of
school curriculum on coastal issues, and provide stakeholder input on consultation issues
ranging from LNG proposals to tidal power to aquaculture site licensing.
However, FNFA receives no support for their involvement in such activities, and do not
have easy access to the information needed to make their participation meaningful. We argue
that any integrated management approach requires a full spectrum of information and knowledge
be gathered and disseminated to those involved in planning and in resource use, in order to
3 Some regional fishermen choose to remain independent and do not join fishing organizations, although they benefit from negotiations and agreements between FNFA and DFO/provincial regulators. Fishermen with multi-species licenses may also hold membership with other organizations such as the Fundy Weir Fishermen’s Association.

6
provide common ground for discussion and to ensure informed decisions and choices are made.
Before FNFA could meaningfully participate in various stakeholder consultations, they
recognized a need to identify current information and to address existing gaps in knowledge. One
information gap they identified involved the relative contributions of the many competing
industries to the healthy economy of coastal communities. How many local jobs does the inshore
fisheries sector create and how much of the wealth generated stays in coastal communities?
Having the answer to such questions available through mechanisms that all find easy to consult
will empower stakeholders to enter discussions as informed participants. This project addressed
this lack of information through a costs and earnings study on the inshore fishing sector, as well
as some research into the relatively invisible “onshore” harvesting of clam, periwinkle, dulse and
other coastal resources. It provides information useful to government, the inshore sector and
other stakeholders involved in the management and planning of coastal resource use.
Methodology
The project involved a two-pronged approach to data gathering, both of which are described in
this section. First, as a great deal of small scale fishing activity in the region operates “below the
radar” of government statistical information systems (see also Whitmarsh et al. 2000, Bradshaw
et al. 2000), we wanted to better understand who was participating in onshore harvesting and
what contribution such activities were making to livelihoods in coastal communities. Qualitative
information on these activities was obtained through twenty-four semi-structured interviews.
Second, as government statistics are out of date on the costs and earnings of the inshore sector,
and as these statistics are aggregated to the regional level, we wanted to better understand the
local community level of contribution of the inshore sector. This quantitative information was
sought through a mail-out questionnaire.
Onshore Harvesters Semi-Structured Interviews
On-shore harvesters work along coastal zones and rely on species such as clam, periwinkle,
dulse, and rockweed, as well as river and lake species such as eel, gaspereau, and shad. Some
onshore harvesters are licensed by the DFO (clam, gaspereau, eel and shad), while others were
not (periwinkle, dulse). As there are no good statistics available on the total population of such
onshore harvesters, or of their economic contribution to coastal communities, our objective in the
qualitative component of our project was to get a preliminary assessment of how important these

7
activities are. What numbers are involved? What is their demographic profile? What do they
perceive as risks to their industry?
A total of 24 semi-structured interviews were conducted in the coastal communities of
southwest New Brunswick during the summer of 2008. Several different types of respondents
were sought using snowball sampling. The main focus was harvesters of onshore species. The
local processors in the region for these species were also contacted for interviews. One processor
operates a holding operation only (local clams were purchased and shipped to northern New
Brunswick for processing) and another had recently exited the industry. When individuals from
some harvesting sectors proved difficult to track down (as with periwinkle harvesters), persons
who were identified as knowledgeable about their community were also interviewed about the
onshore sector of their local economy. Most of these key informants are active licensed
fishermen from the inshore sector.
For onshore harvesters, interview questions were divided into four general categories:
their personal background, fishing activities and household livelihood, sales and consumption,
and numbers involved in the industry. Processors were asked about their background, their
processing activities (including relations with the regulators), pricing and market information,
and numbers in the industry. Key informants were asked background information about their
community, about fishing activities in their community, sales and consumption patterns, and
numbers in the industry. All were asked about the health of the stocks the onshore harvesters
relied upon, as well as factors affecting stock health. Of those interviewed, ten were harvesters
(six clammers and/or periwinklers, three gaspereau/shad and/or eels, one dulse/periwinkles);
three were processors (one with an inactive license) and eleven were key informants. Some
respondents fit into multiple categories, as was the case for one processor who was also a
harvester, and two key informants who were occasional harvesters of onshore species.
The responses from each interview question were transcribed into a data record sheet.
Data from these record sheets were then entered into a master spreadsheet so that responses from
each category could be analyzed as a unit. A preliminary analysis of the data was prepared and
circulated to a few key individuals in the region who work with onshore harvesters for feedback
and critical comment.
8
Questionnaire Design, Delivery and Response Rate
The second data gathering approach involved a ten page mail-out costs and earnings
questionnaire that focused primarily on quantitative data from the under 45 foot (14 meters) boat
sector of the inshore fishery. The questionnaire began with an introduction page, explaining the
purpose of the study and methods that would be taken to ensure confidentiality. This page also
provided contact information for those conducting the study. This was followed by ten pages of
questions, divided into several sections covering the following topic areas: threats to fishing
livelihoods, threats to coastal communities, information on home port and residence, vessel
characteristics and crew employment, a summary of 2007 licensing and landings, marketing
locations, 2007 expenditures and a final section on background information on the respondent.
In addition, the survey left space for comments on other potential threats to the industry, on
marketing concerns, and for any other remarks. It also included a help-line phone number on
every page for anyone who had trouble filling out any section of the questionnaire.
This questionnaire was developed in collaboration with FNFA, and a first draft of the
questionnaire was discussed with a small focus group of fishermen before being amended and
submitted through the ethical review process at the University of New Brunswick. Once the
final survey was developed, the Fundy Weir Fishermen’s Association was asked if they would
also endorse the survey with their members (weir herring fishermen in the LFA 36 area) who are
among the license holders in SWNB. They supported the survey and helped to advertise it
among their membership. The costs and earnings survey was advertised on a local radio program
and talk mail announcements from both fishing organizations also explained the purpose of the
survey.
Fundy North Fishermen’s Association staff prepared the questionnaires mailout and
included a self-addressed and stamped envelope with which to return the completed forms. The
Department of Fisheries and Oceans prepared a set of address labels and facilitated mailing to all
license holders. After the initial mail out, several reminders were distributed both in the form of
additional talk mail announcements and through a complete mailing of reminder post cards.
A total of 176 questionnaires were distributed to holders of inshore commercial fishing
licenses in Lobster Fishing Area 37, which represents the main fishing area for such license
holders in SWNB. This is the total population of all commercial license holders in the under 45
foot boat sector. The response rate was 56 respondents or 31.8%. However, not all questions
9
were completed in all questionnaires, so the response rates on some questions vary. The
responses were mailed to the Department of Anthropology at the University of New Brunswick,
where the data was coded and entered into an Excel spreadsheet.
{What do we want to say about analysis of the data….???}
Results
Onshore Harvester Interviews
Background of Respondents:
With the exception of two harvesters, all respondents came from families with a history of
involvement in the fisheries, and all but two respondents had other fishers in their households.
Most harvesters had been involved in fishing multiple species in the past, including lobster,
groundfish, scallops, and sea urchin. Many fished with other family members with core licenses
(sons, fathers, uncles). A few continued to serve as boat crew in addition to their independent
harvesting activities. The oldest informant was 73 years of age; the youngest was 37. Most
respondents fell between 55-65 years of age. Most respondents were male (21 of 24). This is
unfortunate, since it is apparent that at least the periwinkle industry has significant numbers of
female harvesters involved. All respondents were residents of small coastal communities
between Saint John and St. Andrews (including Campobello and Deer Islands), with the
exception of two gaspereau/eel fishermen who resided in the Grand Lakes and Ripples areas.
The majority of onshore harvesters had multiple sources of income, many relying for part
of the year on Employment Insurance. When asked to choose between characterizing their
household incomes as “doing well”, “losing ground” or “in difficulty”, 13 out of 24 harvesters
characterized their household income levels as “doing well”. However, a few mentioned that
they had had to increase the intensity of their harvesting activities in order to maintain income
levels, and three others reported that due to shellfish beach closures their incomes had
significantly declined in the current year.
Fishing Activities:
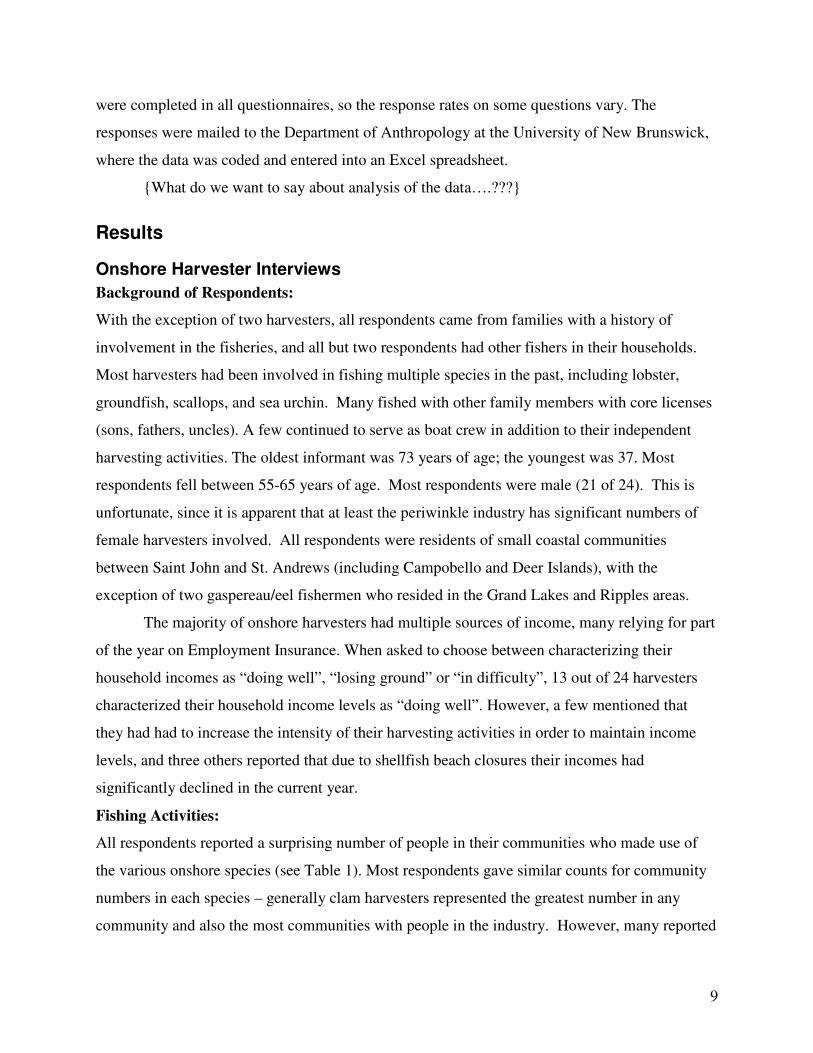
All respondents reported a surprising number of people in their communities who made use of
the various onshore species (see Table 1). Most respondents gave similar counts for community
numbers in each species – generally clam harvesters represented the greatest number in any
community and also the most communities with people in the industry. However, many reported

10
that the numbers in the clam industry were dropping. Periwinkle harvesting is said to be on the
increase, with many communities having upwards of 30 people involved. Gaspereau and eel had
the least number involved in general (6 to 8 individuals), although Saint John was reported to
have upwards of 100 license holders for gaspereau. In a few communities, specialized seaweed
harvesting (rockweed) provided steady employment in both harvesting and processing.
The pattern of harvesting activity was variable according to species. Periwinkle
harvesting can be done all year but is most intensive during the winter; clams are harvested in
two seasons to avoid the summer months when red tide (and thus the danger of paralytic shellfish
poisoning) is more common; gaspereau is harvested in the spring, shad in May and June, and eels
are harvested in the summer. Many harvesters of clams or dulse will also harvest periwinkles, as
there is no license required and periwinkles can be harvested when clam flats are closed due to
red tide or pollution. Clam and periwinkle harvesters cover a wider geographical range than
other harvesters, perhaps as a result of the relative scarcity of beaches that are open for harvest at
any one time. Most harvesters do not consume significant amounts of their own product; instead,
the catch is sold to local wholesalers. Gaspereau harvesters in the Saint John Harbour area tend
to use their own catch as bait for lobster fishing, although any surplus may be sold. The
gaspereau fishery on the river system tends to be a much larger fishery and the catch is nearly all
sold.
Numbers in the Industry
Respondents were asked to comment on the numbers in their particular industry for their
community, and were also asked questions about the role of harvester organizations and
cooperatives. Clam harvesters generally noted that their numbers were down. Many attributed
this to the fact that they were losing areas where they were allowed to dig. A number of clam
harvesters noted that the recently formed clam cooperative could assist them with this problem.
The cooperative was formed not as a marketing strategy, but rather as a mechanism to facilitate
the water and meat testing that must be done on a regular basis to keep information accurate on
shellfish conditions on specific beaches4. The cooperative charges a small fee for water and meat
testing and facilitates more regular testing than is currently available in other jurisdictions (as on
4 The regional ACAP, Eastern Charlotte Waterways Inc., has been assisting clam harvester associations to organize the cooperative (see http://www.ecwinc.org/main.htm).
11
the Nova Scotia side of the Bay of Fundy). Clam harvesters are also hopeful that this cooperative
will get access to beaches for research into stock enhancement and habitat reconstruction.
Processors reported being largely supportive of the cooperative, as it facilitates their supply of
clams. However, they have some concerns that the cooperative should not be allowed to
unilaterally restrict harvester access to beaches.
Periwinkle harvesters, on the other hand, are uniformly reported to be increasing in all
those communities for which we had information. Many attributed this to the fact that periwinkle
harvesting is not licensed, so individuals can enter or exit that fishery very easily. In some
communities, a high proportion of periwinkle harvesters are women and children. It would be
interesting to know to what extent this activity is supporting single parent households.
In terms of recruitment to a number of these industries, many respondents reported that young
people are leaving the fishing communities because they find it too difficult to enter the fishery
or are unwilling to undertake the difficulties involved in the lifestyle.
Gaspereau and eel harvesters, for example, report that their numbers are declining, and
current license holders may not be able to sell their licenses when they retire as very few young
people are showing an interest in the fishery. One reason for this is that there is not enough profit
in the business to support the cost of buying into the fishery. Older fishermen who have paid off
their licenses can earn a living, but new entry costs would undercut any profits. Also, a change in
regulations has reduced the number of gaspereau sets5 allowed per license, which will affect the
pay off when retiring fishermen sell their licenses.
Estimated numbers in each industry and for each community are listed in Table 1 below.
According to most respondents, these numbers are only rough estimates.
Shad Eels Gaspereau Clams Periwinkles Dulse Rockweed
Saint John area
20 15-20 30
Black River 5-6
Dipper Harbour
20-25 20-30 30
5 Gaspereau are harvested by gill, trap, and dip nets depending upon the river and location within the river system, e.g., gill net in the river mouth, dip net in the lower river, and trap net in lake areas. Sets refer to gill net assemblies – according to informants, currently 12 sets are allowed to a license.

12
L’Etang 3-4 8-10
Pennfield 100 40-50 40-50 100
Maces Bay 8 8
Campobello 16-20 12-20
Deer Island 3-4 15-18 8
Grand Lake 6 12
Point Lepreau
15-18
Bocabec 40-50
Ripples 8
Table 1: Estimated numbers in shore based harvesting, SWNB Stock Health
There was some discrepancy in answers with respect to the health of the various stocks involved.
Most respondents indicated that stocks were under stress, but two respondents felt that the
species they relied on tended to go through cycles, with a few stocks currently improving or
about the same (gaspereau, shad, periwinkles, dulse), and others in decline (clams, eels). Five
harvesters noted that the average size of individual clams, periwinkles and eels were smaller
even though some stocks in specific areas appeared healthy in numbers. When asked what
factors were affecting the stocks, most respondents expressed concern about specific issues.
For example, while clam numbers were steady in some areas, harvesters could not make use of
those stocks due to fecal contamination or paralytic shellfish poisoning. Some harvesters
reported having contacted various government departments to address land-based pollution on
beaches (aging or poorly constructed septic systems, other sewage or discharge problems) with
very little success. A number of respondents attributed this problem to poor government
regulation. Eight respondents also mentioned various forms of pollution from aquaculture
operations as a concern. Several respondents noted that beaches were littered with old cages,
feed bags and other garbage from the salmon aquaculture industry. Some respondents reported
that eel grass was taking over and driving some species out of prime habitat; they felt that this
was related to deteriorating water quality linked in turn to aquaculture feed. Rockweed
harvesting was also said to reduce nursery habitat for periwinkles and clams.
A number of harvesters were concerned about over-harvesting. Eel harvesters noted that
licensing the harvesting of immature eels for raising in pens was impacting the stock; two clam
harvesters argued that lack of effective monitoring of recreational diggers allowed commercial

13
harvesters to mask their activities; three clam harvesters mentioned that dock side monitoring
didn’t seem to be effective (this was also a concern for processors).
On the other hand, processors reported that harvester numbers were severely down
compared to former years. One processor reported that in the past she could count on over 123
clam harvesters, whereas today she relies on less than 6. Nevertheless, this same processor also
expressed concern about over-harvesting of specific beaches.
Relationship with Regulators
Questions were asked about the relationship between harvesters, processors and the federal
regulatory agencies involved in fisheries regulation and food inspection and safety, including the
Department of Fisheries and Oceans, the Canadian Food Inspection Agency and Environment
Canada. All respondents expressed frustration with these agencies. Some respondents reported
that any complaints about these agencies or to these agencies, however, could result in
“repercussions” such as harassment masked as monitoring. Other respondents noted that “they
have their job to do and we get along fine”, but would then go on to comment that regulations are
not effective, there is little monitoring or enforcement, and in particular, these agencies act
without regard for fairness and transparency. A few respondents felt that the aquaculture industry
received far too much support and assistance from the government, while the capture fishery
sectors languished without any effective support. Other respondents had very specific concerns
about fish habitat and the “destructive practices” of the regulators. The management of the
Mactaquac Dam was mentioned as a site of concern, as was the lack of “point of source”
assessment of pollutants on shellfish harvesting beaches.
Sales and Consumption
The majority of harvesters reported marketing their product to local processors (one gaspereau
fishermen reported selling into PEI). For clam harvesters, the increasing likelihood that beaches
are contaminated and thus that clams must be depurated before marketing appears to have a
mixed impact. Depuration does allow them to continue harvesting and earning an income, but
they cannot shuck the meats when depuration is required, and thus they earn less for each bushel
of clams they harvest (shucking is done by plant workers after the clams have gone through the
depuration process).
Local processors report that their main markets are in the United States (especially for
clams) and Europe (for eels and periwinkles). Lesser markets are in the Maritime Provinces, or

14
in Toronto. Both processors and harvesters report that prices have been falling for clams, and
holding steady or slightly improving for periwinkles. However, many also note that the rise in
the Canadian dollar and inflation from rising fuel prices had squeezed their profit margin in the
past year. Prices for gaspereau and shad have remained steady. Some prices go through seasonal
adjustments; in the winter, clam prices go down, but periwinkle prices go up. Eel harvesters
reported that their prices are being driven down by competition from growers in the Far East who
buy the immature eels from Canada and grow them out for market. Some harvesters are
concerned by the reduction of buyers and local processors. This makes it more difficult to find
competitive pricing. Very few harvesters reported consuming the species that they harvested
with any regularity, many cited regulations that prohibit this. Most reported that less than five
percent of their harvest was consumed in their own or related households. Gaspereau fishermen
may be the exception, as some use the catch as bait in their own lobster fishery.
Relative Importance of Onshore Harvesting
Several questions were asked about the relative importance of these onshore harvesting activities
in coastal community economies. Most respondents felt that regulators did not recognize the
importance of these activities. Some harvesters reported that even in “elite” (i.e. core fishermen)
households, any downturn in their earnings might result in their falling back on some level of
supplementary harvesting of onshore species. Other harvesters noted that these species allow
young people to earn money for school or other expenses, and allow semi-retired fishermen to
earn extra income. Furthermore, the processing plants often hire many people in the community
(the processor who had recently ceased operation had formerly hired 45 employees).
Some respondents talked of the cultural importance of these activities. Access to these
species taught the youth in the community a good work ethic – if they needed money for school
or an activity, they could earn it through their own efforts. Several respondents pointed out that if
their communities “were not fishing communities, then they were nothing at all”. Young people
were moving away and former fishing villages were becoming “retirement communities”.
Several respondents mentioned that most people in their communities had lost the right to fish
and that this was as a key problem in community survival.

15
Inshore Sector Questionnaire Results
General Demographics
The results from the questionnaire support other findings that fishermen in the inshore sector
(boats under 45 feet) are an aging population (see Figure 1). Nevertheless, a surprising number
of respondents intend to remain in the fishery for the next 10 to 20 years (see Figure 2). Given
the age distribution, many of the respondents had twenty or more years experience in the
industry (see Figure 3). Over 83% (46 of 55) of respondents were raised in a fishing family and
42 of 55 (76.4%) have other family members that fish commercially. Among the 42 respondents,
the most common relative in the industry was a son (n =15), followed by father (n = 10) and
brother (n = 9). When asked about succession, 20 of 45 fishermen indicated that one of their
relatives would take over their fishing operation when the respondent retires; slightly more (25
respondents) indicated that one of their relatives would not take over (10 respondents did not
answer the question).
0
5
10
15
20
<= 29 yrs 30 - 39 yrs 40 - 49 yrs 50 - 59 yrs 60 - 69 yrs 70+ yrs
Age Category(n = 55 respondents)
Nu
mb
er
of
Res
po
nd
en
ts
Figure 1

16
0
5
10
15
5 yrs 6 - 10 yrs 11 - 15 yrs 16 - 20 yrs 21 - 25 yrs 26 - 30 yrs 30+ yrs
Years to Retirement(n = 43 respondents)
Nu
mb
er
of
Re
sp
on
den
ts
Figure 2
0
5
10
15
20
25
<= 9 yrs 10 - 19 yrs 20 - 29 yrs 30 - 39 yrs 40+ yrs
Years Fishing(n = 55 respondents)
Nu
mb
er
of
Resp
on
den
ts
Figure 3
Household Income
Of 54 fishermen answering the question, 48 (87.3%) indicated that fishing was the most
important source of revenue for their family. A breakdown of household dependency on fishing
income is shown in Figure 4. Of 54 fishermen answering the question, 24 (43.6%) indicated that
no other members of their household earned wages from non-fishing jobs. Of the 30 respondents

17
who did indicate other household members earned wages from non-fishing jobs, wives were by
far the most likely to be working outside the fishery (26 of 54, or 47.3% of households).
0
10
20
30
40
50
0% to 25% 25% to 50% 50% to 75% 75% to 100%
Proportion of Household Income Derived from Fishing(n = 55 respondents)
Nu
mb
er
of
Res
po
nd
en
ts
Figure 4
Threat Perceptions
Fishing Livelihoods
Figure 5 shows the results of the first threat perception question, which focused on potential
threats to fishing livelihoods. The exact wording of the question was: “Do you think the
following factors pose a threat to your ability to earn a livelihood from fishing in the Bay of
Fundy?” The potential threats included in this question included:
• DFO fishery management regulations
• Declining fish stocks
• Difficulties in finding crew and labour
• Expansion of aquaculture in the Bay of Fundy
• Too few seafood buyers
• Low market prices
• Access to wharves
• Aging workforce
• Operational regulations (e.g., Transport)
• Challenges in selling enterprise at retirement
• Industrial developments

18
• Inflation and the rising costs of fishing In Figure 5, the potential threats are sorted based on the number of survey respondents
classifying the threat as ‘very important’. Threats seen as being either ‘medium’ or ‘quite high’
importance are shown to the right of the centre line, while those threats seen as being ‘quite low’
importance or ‘not at all’ important are shown to the left of the center line. The number of ‘no
opinion’ and non-responses is shown to the right of the chart.
Most fishermen saw inflation and the rising costs of fishing as a very important threat.
Moving down the list, one can see that there is some divergence in opinion on some threats. For
example, about half of fishermen see access to wharves as being relatively unimportant. It was
the single issue with the highest number of ‘quite low’ or ‘not at all’ ratings. However, note that
this issue garners a higher number of ‘very high’ importance ratings than the aging workforce
issue (which has far fewer ‘not at all’ important ratings and a higher number of ‘medium’ and
‘quite high’ ratings).
Figure 5 – Perceived importance of various potential threats to fishing livelihoods

19
Fishing Communities
Figure 6 shows the results of the second threat perception question, which focused on potential
threats to fishing communities. The wording of the question was: “Do you think the following
factors pose a threat to the overall health and viability of fishing communities in the Bay of
Fundy?” The emphasis in this question was on threats to the overall fishing community rather
than personal livelihood. A number of the same factors from the first question were retained and
some additional factors added. They included:
• Government regulation
• Declining fish stocks
• Industrial development
• Difficulties in finding crew and labour
• Expansion of aquaculture in the Bay of Fundy
• Too few seafood buyers
• Low market prices
• Rising costs of coastal land
• Access to wharves
• Lack of regulation on non-fishing industries
• Lack of access to shore/beaches
• People leaving the regions
• Inflation and the rising costs of fishing

20
Figure 6 – Perceived importance of various potential threats to fishing communities
Again, inflation and rising fishing costs were seen as the most serious threat to the viability of
rural fishing communities (in addition to being the primary threat to personal capacity to earn a
livelihood from fishing). A group of non-fishing factors – regulatory factors, aquaculture
expansion, industrial development and land prices – were viewed relatively similarly as
important threats. Wharf access was again seen as either very important or of low importance.
Latent Class Cluster Analysis
While providing relatively simple insights into perceived threats, the responses to ratings
questions can provide additional information about how particular groups of people perceive
threats in similar or different ways.
In this section, we use a technique known as latent class (LC) cluster analysis to determine which
threat ratings really define overall threat perceptions and to assess whether those general
perceptions vary amongst fishermen with different demographic characteristics (e.g., age,
experience, etc…).

21
The LC clustering process consists of several steps:
1. Determine which, if any, of the threat factors provide redundant information and can be
eliminated from the analysis. Each survey respondent provided ratings for 12 potential
livelihood threats and 13 potential community threats. This is likely more information
than really needed to identify core threat perceptions. To identify factors that can be
dropped from the threat perception model, we examine the number of significant
bivariate residuals (BVRs) in each cluster analysis, starting with an analysis with all
factors included. A significant BVR indicates that there are interactions between two
threat factors. We tally total significant BVRs for each threat factor and sequentially drop
those factors from the analysis with the highest number of significant BVRs (i.e., the
factors with the most redundancy). When two or more factors had the same number of
significant BVRs, we eliminated the one with the largest BVR first.
2. Once there were no more significant BVRs, we then examined whether the fishermen
respondents could be cleaved into two or more different sub-segments that varied
statistically in their threat perceptions. We did this using latent class analysis. Latent
means underlying or unobserved; LC cluster analysis looks at the response patterns of the
fishermen and determines if there are significant differences between some sub-segments
of the sample. Usually we would use a series of statistical diagnostic tests to identify the
single best breakdown into sub-segments. Given the very small sample size (n=54
completed surveys), we had to relax our clustering criteria somewhat. We first identified
those potential threats that, while having no significant BVRs, did not contribute any to
the identification of sub-segments. When we ran each LC cluster analysis, we identified
any threat factors that were not significant in three models of 2, 3, and 4 sub-segments
each. We then eliminated factors, one at a time, which were least significant.
3. Finally, once an LC model was identified in which a number of sub-segments could be
cleaved apart, we ran a Chi-square Automatic Interaction Detection (CHAID) test to see
if any of the fishermen’s demographic characteristics acted as predictors of the different
sub-segments.

22
Threats to Personal Fishing Livelihoods
In the first step of the analysis, industrial development exhibited the single most redundancy of
all the threat factors, with 6 significant BVRs and was eliminated from the analysis first. After
that, finding crew and labour (4 significant BVRs), aging workforce (3 significant BVRs), low
market prices (2 significant BVRs), and challenges in selling enterprise at retirement (1
significant BVR) were dropped from the analysis in order.
In the second step of the analysis, we found that wharf access was insignificant in all
model configurations with multiple latent classes, so dropped it from the analysis. We
subsequently found that aquaculture development, too few seafood buyers, and declining fish
stocks were threat factors that did not help in discriminating between fishermen sub-segments, so
they were all dropped from the model in order.
This left us with three key threat factors – DFO fishery management regulations,
operational regulations (e.g., Transport), and inflation and rising costs of fishing – in an LC
cluster model that broke down into two distinct sub-segments. Statistically, the two segments
exhibited significantly different opinions on both operational regulations and fishing costs (at the
10% significance level, p < 0.10), while their differences on DFO regulations were not quite
significant (p = 0.15).
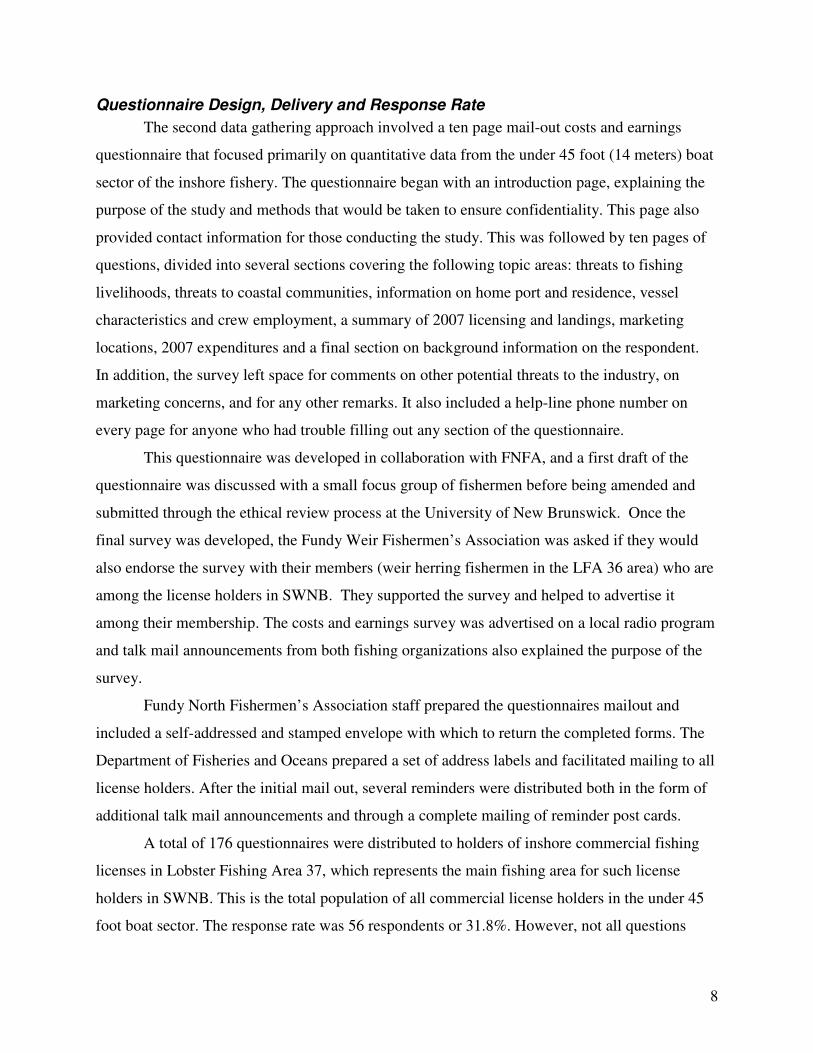
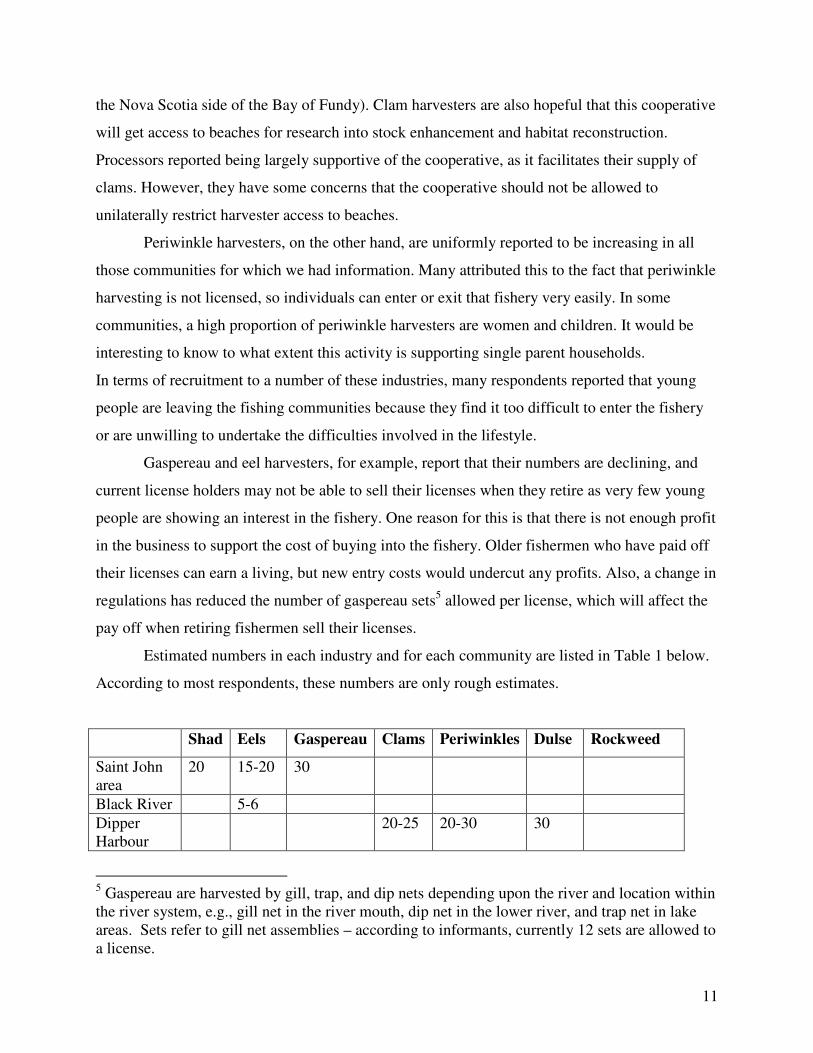
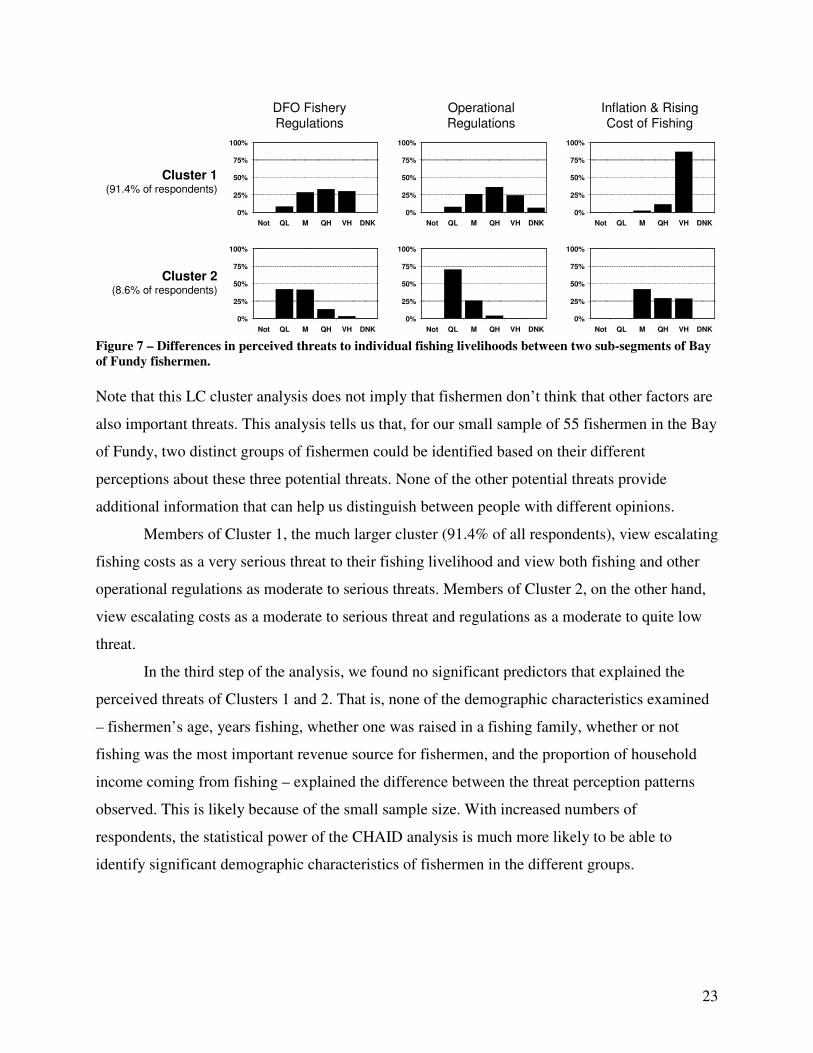
The first sub-segment consisted of 91.4% of all respondents (49 fishermen), while the
second sub-segment consisted of the remaining 8.6% (6 fishermen). As can be seen in Figure 7,
the large group of fishermen in Cluster 1 thought almost uniformly that rising costs were a very
important threat and that fishery and operational regulations were moderate to high threats. A
much smaller group of fishermen in Cluster 2 thought that regulations were generally of low to
moderate importance and that costs were of moderate to high importance.
23
0%
25%
50%
75%
100%
Not QL M QH VH DNK
0%
25%
50%
75%
100%
Not QL M QH VH DNK
DFO Fishery Regulations
0%
25%
50%
75%
100%
Not QL M QH VH DNK
0%
25%
50%
75%
100%
Not QL M QH VH DNK
Cluster 1(91.4% of respondents)
Operational Regulations
Inflation & Rising Cost of Fishing
0%
25%
50%
75%
100%
Not QL M QH VH DNK
0%
25%
50%
75%
100%
Not QL M QH VH DNK
Cluster 2(8.6% of respondents)
Figure 7 – Differences in perceived threats to individual fishing livelihoods between two sub-segments of Bay
of Fundy fishermen.
Note that this LC cluster analysis does not imply that fishermen don’t think that other factors are
also important threats. This analysis tells us that, for our small sample of 55 fishermen in the Bay
of Fundy, two distinct groups of fishermen could be identified based on their different
perceptions about these three potential threats. None of the other potential threats provide
additional information that can help us distinguish between people with different opinions.
Members of Cluster 1, the much larger cluster (91.4% of all respondents), view escalating
fishing costs as a very serious threat to their fishing livelihood and view both fishing and other
operational regulations as moderate to serious threats. Members of Cluster 2, on the other hand,
view escalating costs as a moderate to serious threat and regulations as a moderate to quite low
threat.
In the third step of the analysis, we found no significant predictors that explained the
perceived threats of Clusters 1 and 2. That is, none of the demographic characteristics examined
– fishermen’s age, years fishing, whether one was raised in a fishing family, whether or not
fishing was the most important revenue source for fishermen, and the proportion of household
income coming from fishing – explained the difference between the threat perception patterns
observed. This is likely because of the small sample size. With increased numbers of
respondents, the statistical power of the CHAID analysis is much more likely to be able to
identify significant demographic characteristics of fishermen in the different groups.

24
Threats to Rural Fishing Communities
In the first step of the second analysis, out-migration (people leaving the region) first exhibited
the most redundancy of all the threat factors, with 6 significant BVRs; it was eliminated from the
analysis first. After that, access to shores and beaches (which now bumped up to 7 significant
BVRs), industrial development (5 significant BVRs), government regulation (4 significant
BVRs), lack of regulation of non-fishing industries (3 significant BVRs), fishing costs (3
significant BVRs), and crew availability (2 significant BVRs) were dropped from the analysis in
order.
In the second step of the analysis, we found that fish stock abundance was insignificant in
all model configurations with multiple latent classes, so dropped it from the analysis. We
subsequently found that too few seafood buyers and low market prices were threat factors that
did not help in discriminating between fishermen sub-segments, so they were also dropped from
the model in order.
This again left us with three key (but different) threat factors – expansion of aquaculture,
rising coastal land prices, and wharf access – in an LC cluster model that broke down into three
distinct sub-segments. Statistically, the three segments exhibited significantly different opinions
on the threats posed by aquaculture (significant at the 10% significance level, p = 0.094) and by
land prices and wharf access (both significant at the 5% level, p = 0.036 and p = 0.042,
respectively).
The first sub-segment consisted of 52.5% of all respondents (28 fishermen), the second
sub-segment consisted of 42.5% of respondents (22 fishermen), and the third smaller group
consisted of the remaining 5.0% (3 fishermen). Fishermen in Cluster 1 tended to have moderate
views on the threats posed by aquaculture expansion and rising coastal land prices, and thought
that access to wharves was a relatively low threat. Fishermen in Cluster 2, on the other hand,
viewed both aquaculture and rising land prices as very high threats to communities. They also
thought that lack of access to wharves was a much more serious problem than respondents in the
other two sub-segments did. The small group in Cluster 3 viewed wharf access as a very low
threat and they thought rising land prices were either very important or they had no opinion on
that factor.

25
Aquaculture Expansion
Cluster 1(52.5% of respondents)
Rising Coastal Land Prices
Access to Wharves
Cluster 2(42.5% of respondents)
Cluster 3(5.0% of respondents)
0%
25%
50%
75%
100%
Not QL M QH VH DNK
0%
25%
50%
75%
100%
Not QL M QH VH DNK
0%
25%
50%
75%
100%
Not QL M QH VH DNK
0%
25%
50%
75%
100%
Not QL M QH VH DNK
0%
25%
50%
75%
100%
Not QL M QH VH DNK
0%
25%
50%
75%
100%
Not QL M QH VH DNK
0%
25%
50%
75%
100%
Not QL M QH VH DNK
0%
25%
50%
75%
100%
Not QL M QH VH DNK
0%
25%
50%
75%
100%
Not QL M QH VH DNK Figure 8 – Differences in perceived threats to fishing communities between three sub-segments of Bay of
Fundy fishermen.
Again, these results do not imply that other threats are not important. Rather, there is some
divergence in opinion amongst fishermen as to how important these three factors are and that
divergence can help us explain how our sample breaks down into distinct sub-segments based on
threat perceptions. We need only these three factors to explain those differences, not all the other
factors that we also asked about.
Members of Cluster 1 (52.5% of all respondents) tended to view aquaculture expansion
as a moderate to serious threat to community well-being, while they were relatively neutral on
the issue of rising land costs, and tended to view wharf access as being moderately to not at all
important. Members of Cluster 2 (42.5% of the sample) viewed all three factors as serious threats
to community viability. Members of the smaller Cluster 3 (5.0% of respondents) were, on the
other hand, quite neutral on aquaculture, viewed wharf access as a non-issue, and either viewed
increasing coastal land prices as very serious or did not have an opinion (either way, they did not
take the view that rising land prices were a low to quite high threat).
Again we ran a CHAID analysis to test if any demographic factors could explain the
differences between threat perceptions. While the small sample made it impossible to
differentiate amongst statistically significant predictors, we did see some indication (albeit

26
insignificant) that household fishing income might play a role in explaining differences in
community-level threat perceptions.
Figure 9 below shows that the whole sample breaks into three sub-segments comprising
52.5%, 42.5%. and 5.0% of the whole sample. The second level of the ‘tree’ shows how
membership in the three sub-segments varies across sub-segments that have different levels of
dependency on fishing as a source of livelihood. Fishermen that had lower dependence on
fishing (the branch on the left, with 0% to 74% of total household income derived from fishing)
had much lower membership in sub-segment 2 and much higher membership in sub-segment 3.
That is, fishers that had other sources of income tended to be less likely to view aquaculture
expansion, rising coastal land prices, and wharf access as serious threats to coastal communities
relative to full-time fishers that derived most of their household income from fishing. Similarly,
fishermen who had a high level of dependence on fishing for their household livelihood were far
less likely to be members of sub-segment 3, who viewed wharf access as unimportant and rising
coastal land prices as very important.
52.5442.484.98
Sub-segment 1 (%)Sub-segment 2 (%)Sub-segment 3 (%)
Sample
n=53
χ2=6.30, 2 d.f.p=0.20 (adj)
57.6922.3819.93
0-74%
n=11
51.2047.741.06
75-100%
n=42
Sub-segment 1 (%)Sub-segment 2 (%)Sub-segment 3 (%)
% of Total Household Income from Fishing
Figure 9– Influence of total household income from fishing (i.e., dependency on fishing income for personal
livelihood) on perceived threats to coastal communities.
The differences in the second level of the CHAID tree are not statistically different even
though it looks like there are differences to the naked eye. Again, this is because of the small
sample. While we cannot be sure, we suspect that these differences between fishermen highly
dependent on fishing income versus those less dependent on fishing would become statistically
significant with a slightly larger sample size. As sample sizes grow larger and larger, the power

27
of the CHAID analysis to discriminate amongst respondents and identify significant predictors or
threat perception patterns becomes stronger.
Home Port
The vast majority of respondents live within 25 km of their home fishing port (Figure 10).
0
10
20
30
40
<= 5 kms 6 to 25 kms 26 to 50 kms 51 to 150 kms
Distance from Residence to Home Port(n = 53 respondents)
Nu
mb
er
of
Res
po
nd
en
ts
Figure 10
Vessel Characteristics
The average length and tonnage of fishing vessels for survey respondents is shown in Figure 11
and 12. Engine horsepower ranged from 11 to 3,208 hp (average = 460 hp) and engine age
ranged from 1 to 38 years (average = 8.1 years). Fuel capacity ranged from 182 to 9,092 l
(average = 1,922 l) and fuel consumption from 20 to 454 l/day (average = 208 l/day) or 500 to
600,000 l/yr (average = 15,919 l/yr). Note that some respondents reported both measures while
some reported one only (and 5 reported neither). 54 respondents provided their vessel age, which
ranged from 1 to 26 years (average = 11.3 years).

28
0
10
20
30
<35 ft 35-40 ft 40-45 ft 45+ ft
Fishing Vessel Length(n = 55 respondents)
Nu
mb
er
of
Resp
on
den
ts
Figure 11
0
10
20
30
40
0 to 9 tons 10 to 24 tons 25 to 49 tons 50 to 74 tons
Fishing Tonnage(n = 44 respondents)
Nu
mb
er
of
Resp
on
den
ts
Figure 12

29
Crew Employment
Few respondents hire full time year-round help (see Figure 13). Many more hired part time year
round crew or seasonal help (see Figures 14-16). In total, the 55 fishermen responding to this
survey were responsible for generating an additional 30 full time year-round jobs, 61 seasonal
fulltime jobs, 51 seasonal part-time jobs, and 567 days per year in casual employment.
0
10
20
30
40
0 jobs 1 job 2 jobs
Full-time Year Round Crew Members(n = 55 respondents)
Nu
mb
er
of
Resp
on
den
ts
Figure 13
0
10
20
30
0 1 job 2 jobs 3 or more
Full-time Seasonal Crew Members(n = 55 respondents)
Nu
mb
er
of
Re
sp
on
den
ts

30
Figure 14
0
10
20
30
0 1 job 2 jobs 3 jobs
Part-time Seasonal Crew Members(n = 55 respondents)
Nu
mb
er
of
Re
sp
on
den
ts
Figure 15
0
10
20
30
0 days 1-10 days 11-20 days Over 20 days
Casual Crew Member Employment (days per year)(n = 55 respondents)
Nu
mb
er
of
Resp
on
den
ts
Figure 16
31
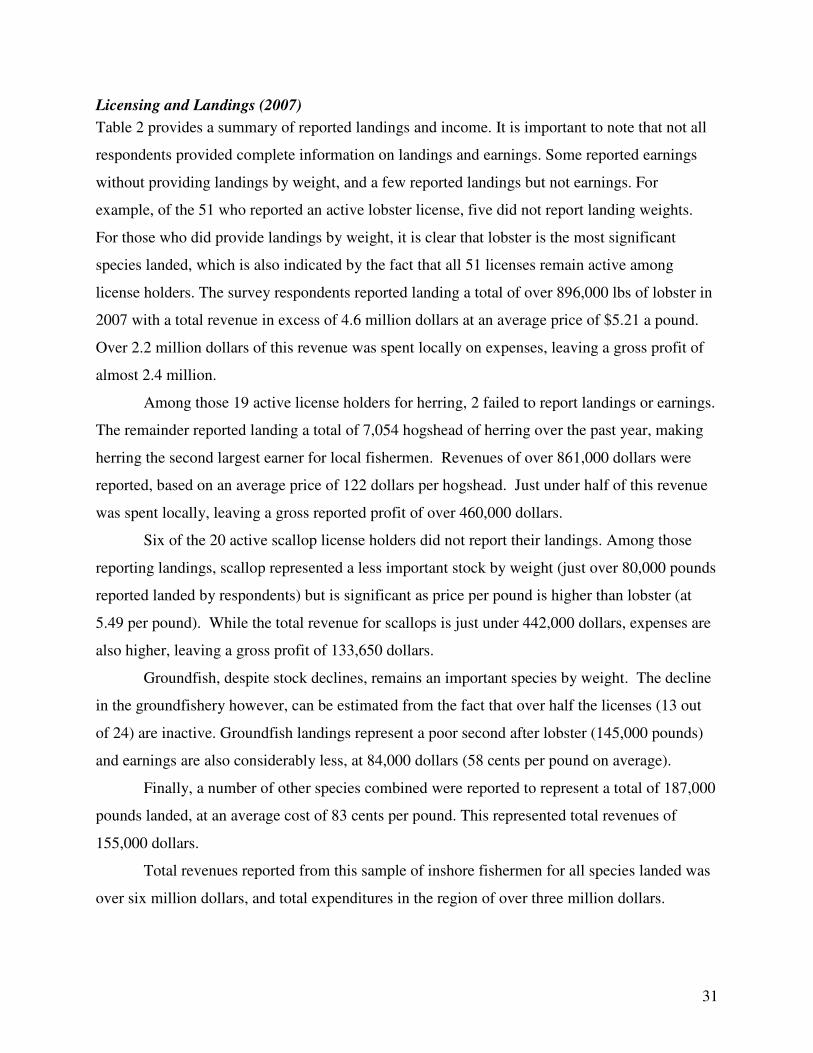
Licensing and Landings (2007)
Table 2 provides a summary of reported landings and income. It is important to note that not all
respondents provided complete information on landings and earnings. Some reported earnings
without providing landings by weight, and a few reported landings but not earnings. For
example, of the 51 who reported an active lobster license, five did not report landing weights.
For those who did provide landings by weight, it is clear that lobster is the most significant
species landed, which is also indicated by the fact that all 51 licenses remain active among
license holders. The survey respondents reported landing a total of over 896,000 lbs of lobster in
2007 with a total revenue in excess of 4.6 million dollars at an average price of $5.21 a pound.
Over 2.2 million dollars of this revenue was spent locally on expenses, leaving a gross profit of
almost 2.4 million.
Among those 19 active license holders for herring, 2 failed to report landings or earnings.
The remainder reported landing a total of 7,054 hogshead of herring over the past year, making
herring the second largest earner for local fishermen. Revenues of over 861,000 dollars were
reported, based on an average price of 122 dollars per hogshead. Just under half of this revenue
was spent locally, leaving a gross reported profit of over 460,000 dollars.
Six of the 20 active scallop license holders did not report their landings. Among those
reporting landings, scallop represented a less important stock by weight (just over 80,000 pounds
reported landed by respondents) but is significant as price per pound is higher than lobster (at
5.49 per pound). While the total revenue for scallops is just under 442,000 dollars, expenses are
also higher, leaving a gross profit of 133,650 dollars.
Groundfish, despite stock declines, remains an important species by weight. The decline
in the groundfishery however, can be estimated from the fact that over half the licenses (13 out
of 24) are inactive. Groundfish landings represent a poor second after lobster (145,000 pounds)
and earnings are also considerably less, at 84,000 dollars (58 cents per pound on average).
Finally, a number of other species combined were reported to represent a total of 187,000
pounds landed, at an average cost of 83 cents per pound. This represented total revenues of
155,000 dollars.
Total revenues reported from this sample of inshore fishermen for all species landed was
over six million dollars, and total expenditures in the region of over three million dollars.

32
Table 2 – Summary of reported 2007 licensing, landings, and financial performance
Lobster Scallop Groundfish Herring
Other
Speciesa Total
Licenses Active 51 20 11 19 13 114 Inactive 0 11 13 10 12 46 Total 51 31 24 29 25 160 Landings 896,693 lbs 80,422 lbs 145,000 lbs 7,054 hogshead 187,000 lbs Revenue ($) 4,670,250 441,850 84,000 861,137 155,000 6,212,237 Average Price $5.21/lb $5.49/lb $0.58/lb $122.08/hogshead $0.83/lb Expenses ($) 2,274,483 308,200 45,100 400,218 51,000 3,079,001
Gross Profit ($) 2,395,767 133,650 38,900 460,919 Gross Margin 51.3% 30.2% 46.3% 53.5%
a other species include dogfish, gaspereau, eel, shad, shad/bait, clam, mackerel, and sea urchin
Marketing
The inshore sector also provides revenues to a wholesale sector, as is indicated by the local sales.
Only a small percentage of herring landed were sold outside of the region. 81.8% of seafood
sales were in Charlotte and Saint John counties (not including herring, which were mainly in
Charlotte county) (Table 3). Several fishermen used the comments section to provide feedback
on marketing issues. Some report that there were too few buyers locally: “I find that price is too
unpredictable, not enough buyers. The market is controlled by two few. We as fisher persons
should have holding facilities available for us to maximize our profit.” Other fishermen reported
too many middlemen in the marketing chain or that middlemen were making too much of the
profit: “There are far way too many middlemen. When we are getting 4.50$/lb and they are
getting 9.99$/lb a half hour away. Expenses are killing fishermen. We need to organize and have
a marketing manager to distribute our catch.” Another fishermen reported that: “The buyers
don’t seem to be trying to develop new markets! My concern is that “big” guys can set a price
and we have no recourse. For those who have been developing a market directly to the public,
they now force the possibility of legislation brought on by lobbyists from big buyers, who are
trying to have provincial legislation passed forbidding fishermen from selling their own
products. Are we experiencing the erosion of our free market rights?” Another fisherman
commented that: “fisheries all need an independent negotiator before season starts to agree upon
a price that is fair for everyone involved”. Other options were mentioned: “I believe that the
fishermen should form a co-op and market their product.” One fisherman commented on the

33
relationship between seasons and prices: “It is a buyers market. If everyone was catching fish at
the same time, there is no market to sell to. You are left holding fish until you lose them. The
same is true of lobster sales. Our season is too late in the fall and when Nova Scotia comes on
line, our price drops. The seasons really need to be looked at and adjusted.”
Table 3 – Location of fish sales
Charlotte
County
Saint John
County NB (other) Nova Scotia Other Total
Lobster (lbs) 481,340 311,158 46,737 57,458 0 896,693
Scallop (lbs) 36,000 26,711 17,711 0 0 80,422
Groundfish (lbs) 29,800 0 0 115,200 0 145,000
Herring (hogshead) 6,829 0 0 0 225 7,054 Other Seafood (lbs) 186,000 0 0 1,000 0 187,000
Total 733,140 337,869 64,448 173,658 0 1,309,115
Some fishermen in our sample did retail directly to the public on occasion, although volumes
tended to be small; 22 of 55 fishermen reported selling some lobster directly to the public, for
example, with direct sales ranging from 1% up to 30% of their overall landings (average = 6.9%
for those who did sell directly). For scallops, 7 fishermen reported selling 2% to 35% of their
landings directly to the public (average = 9.6%). For groundfish, the numbers were slightly
lower, with 3 fishermen selling between 1% and 20% of their landings to the public (7.5%
average). Finally, for other species, only 1 herring fishermen reported selling a small amount
(1% of landings) to the public; no other species landed were sold directly to the public.
Fishing Expenses
Table 4 – Index of equipment and supply purchase location
a
Charlotte
County
Saint John
County
NB (other) Nova Scotia Other # Reporting
Purchases
New Boat 7.9 1.0 - 6.0 0.1 15 Electronics 3.5 2.2 1.0 19.3 3.0 29 Gear 29.4 2.4 1.5 7.6 2.2 43 Truck 19.2 12.8 1.1 0.1 0.9 34 Boat Repairs 28.1 9.1 2.8 1.1 1.0 42 Science & Monitoring 22.0 3.0 1.0 - - 26 Fuel 24.6 19.2 0.1 0.2 2.0 46 Wharfage 26.5 14.0 0.1 0.4 1.0 42 Association Dues 26.0 7.7 2.0 0.3 1.0 37 Insurance 9.0 7.5 2.5 21.0 1.0 41 Quota 3.0 2.0 - - - 5 Crew 25.9 13.2 - 1.2 1.2 41
34
Loan Payments 19.6 11.6 2.0 1.8 - 35 a Index calculated using weightings for each purchase and location of purchase. For example, 7 people reported buying a new boat (100% of purchase) in Charlotte County, 1 in Saint John County, and 6 in Nova Scotia. In addition, 1 person reported buying a boat with 90% of the cost attributed to Charlotte County and 10% to elsewhere (perhaps an engine from the U.S., for instance).
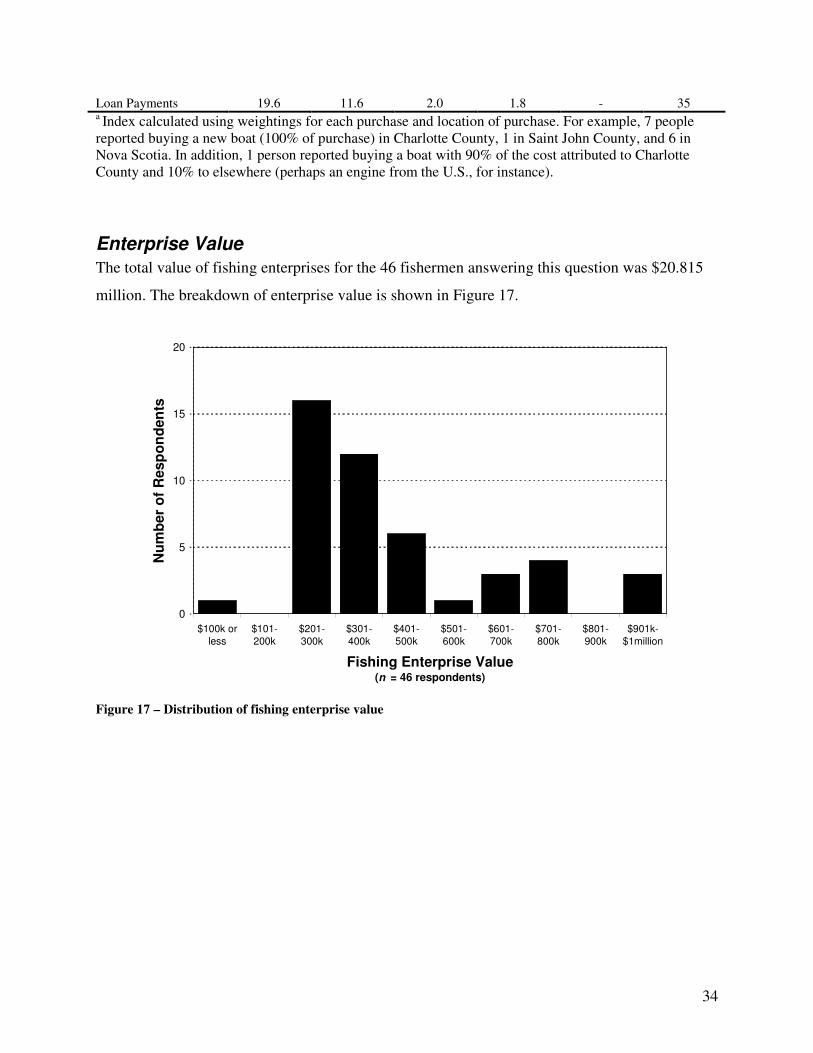
Enterprise Value
The total value of fishing enterprises for the 46 fishermen answering this question was $20.815
million. The breakdown of enterprise value is shown in Figure 17.
0
5
10
15
20
$100k orless
$101-200k
$201-300k
$301-400k
$401-500k
$501-600k
$601-700k
$701-800k
$801-900k
$901k-$1million
Fishing Enterprise Value(n = 46 respondents)
Nu
mb
er
of
Resp
on
den
ts
Figure 17 – Distribution of fishing enterprise value

35
Discussion
Some things to think about from the email discussions: In 2009, there are 178 fishing boats in SWNB, if roughly 50 boats bring in $6m, then 178 boats would bring in 21.36 mil Which is $53.4m industry in the Fundy North region alone Grand Manan has another 125 licenses and they stock more $ per year then we do (in 2008 LFA 36 landed 1433 tons, Grand Manan landed 1805 tons) - that means that an average GM lobster boats lands 11.464 tons per year, a fundy North boat 8.05 tons per year, so each GM fisherman makes on average 142% of what a Fundy North fisherman makes (FN average value per boat $120,000, GM average per boat $170,000) A guesstimate of the value of Grand Manan fishery in landings is $26.9m (they fish all the same species we do and do a little better across the board, I based this on the lobster landings - I looked at a few years and the ratio was about the same so I chose 2007-2008). The Grand Manan Industry then would be worth about $67.25m So all of SWNB fisheries are worth roughly $120.65m per year - does that sound right – $120 m in gross output on roughly $50 m in sales might be a bit high, but not too much out of line. Generally, you lump 4 p/t jobs into 1 f/t as rule of thumb. Casuals would be added up by days I suppose but that might not capture the full importance of casual work (these studies never do when you're dealing with economic impacts). I'll attach a tourism study with multiplier numbers in it. Tourism seems to be doubling up the number of jobs - basically one out of the sector for each job within. I saw an older report on oceans industry (which was total junk) that for some reason had a zero multiplier for wild fisheries - not sure what the rationale for that was, but I wouldn't see why you couldn't use the tourism 2:1 figure as an estimate. All of this work is really subjective and easy to poke holes in.
Sample Adequacy

36
Employment and Economic Impact Implications
Key Messages?

37
References Boncoeur, Jean, Louisa Coglan, Bertrand Le Gallic and Sean Pascoe 2000 On the (ir)relevance of
rates of return measures of economic performance to small boats. Fisheries Research 49(2):105-115.
Bradshaw, Matt, Les Wood and Sandra Williamson 2001Applying qualitative and quantitative research: a social impact assessment of a fishery. Applied Geography 21(1):69-85
Christie, Patrick. 2005 Is Integrated Coastal Management Sustainable? Ocean and Coastal
Management 48:208-232.
Christie, P., Lowry, K., White, A., Oracion, E., Sievanen, L., Pomeroy, R., Pollnac, R., Patlis, R., and Eisma, V. 2005 Key findings from a multidisciplinary examination of integrated coastal management process sustainability. Ocean & Coastal Management 48 468–483.
Farquarson, Susan. 2008 SWNB Marine Resources Planning: Phase II - Plan Development: Summary: Community Consultation Forums February -April 2008. Southwest New Brunswick Marine Resources Planning Committee.
Kearney, John and Fikret Berkes, Anthony Charles, Evelyn Pinkerton, Melanie Wiber 2007 The Role of Participatory Governance and Community-Based Management in Integrated Coastal and Ocean Management in Canada. Coastal Management Journal 35(1):79-104.
Leschine, Thomas M., Bridget E. Ferriss, Kathleen P. Bell, Krista K. Bartz, Sarah Macwilliams, Michelle Pico, and Andrew K. Bennett 2003 Challenges and Strategies for Better Use of Scientific Information in the Management of Coastal Estuaries. Estuaries 26:1189-1204.
Nichols, K. 1999 Coming to terms with “integrated coastal management”: Problems of meaning and method in a new arena of resource regulation. Professional Geographer 51 (3): 388-399.
Olsen, S. 2003 Frameworks and indicators for assessing progress in integrated coastal management initiatives. Ocean and Coastal Management 46: 347-361.
Ricketts, Peter and Peter Harrison. 2007 Coastal and Ocean Management in Canada: Moving In the 21st Century. Coastal Management 35:5-22.
Stojanovic, T., R. C. Ballinger, C.S. Lalwani 2004 Successful integrated coastal management: measuring it with research and contributing to wise practice. Ocean &
Coastal Management 47:273-298. Tobey, J. and R. Volk 2002 Learning frontiers in the practice of integrated coastal
management. Coastal Management 30:285-298. David Whitmarsh, Carl James, Helen Pickering and Arthur Neiland 2000 The profitability of
marine commercial fisheries: a review of economic information needs with particular reference to the UK. Marine Policy 24(3):257-263.

38
Appendices