Embed Size (px)
Citation preview
1
DRAFT REPORT
Responses to the joint survey
on New approaches to
Capacity Development and
Future priorities
2
1. Background
This survey, designed by PARIS21 in consultation with the High-level Group for Partnership,
Coordination and Capacity-Building for Statistics for the 2030 Agenda for Sustainable Development
(HLG-PCCB) and the support of the United Nations Statistics Division (UNSD), aimed at providing a
better understanding of the current state of capacity development in National Statistical Offices, and
more broadly across National Statistical Systems and the challenges, priorities and plans they have
for the short and medium term.
For the purposes of this survey, capacity development refers to “the process through which
individuals, organisations and societies obtain, strengthen and maintain the capabilities to set and
achieve their own development objectives over time” (UNDP, 2009). In the context of NSOs, it
involves improving processes, products and business models for the generation and utilisation of
data and statistics.
This effort builds on previous surveys (both regional and international) on national capacities to
monitor the Sustainable Development Goals, such as the ones from ECLAC (2017), UNECE (2017),
OIC (2017), FAO (2017), UNSD (2016), as well as the Voluntary National Reviews submitted by
countries (compiled by UN DESA, 2018). These exercises aimed at assessing, from different
perspectives, national capacities for reporting and monitoring of the 2030 Agenda. While they
provide a comprehensive overview on countries’ technical and financial challenges for SDG
production, this survey sought to detect entry points for developing national capacities, by delving
deeper into the needs and priorities of NSOs both related to SDGs and specific to their national
context. These included the strengthening non-technical skills in staff, improving organisational
practices and coordination between national agencies and mainstreaming of SDGs in national
policies and reporting mechanisms.
Preliminary findings point out to the need of strengthening coordination within national statistical
systems (NSS), and with providers of administrative data. Integrating new data sources is of utmost
importance for NSOs, and the majority of them need to improve their capacity for doing so. Several
NSOs reported being interested in establishing partnerships with the private sector to access big
data and geospatial data, but not having the knowledge on how to do so.
Management skills are crucial for improving planning and reporting systems between producers of
official statistics, as well as within the NSO itself (especially human resources management and
strategic planning). Beyond the need for technical skills, respondents reported the need of
cultivating leadership and strategic planning in their employees. Almost a quarter of them indicated
having prioritisation issues at the time of deciding about which capacity development programmes
to implement.
Finally, respondents conveyed needing communication skills to reach a better understanding within
the NSS, with producers of administrative data and with users of statistics. Associated with this,
teamwork and collaboration within the NSO itself are relevant soft skills needed to succeed in
achieving national goals and producing the remaining SDG indicators.
3
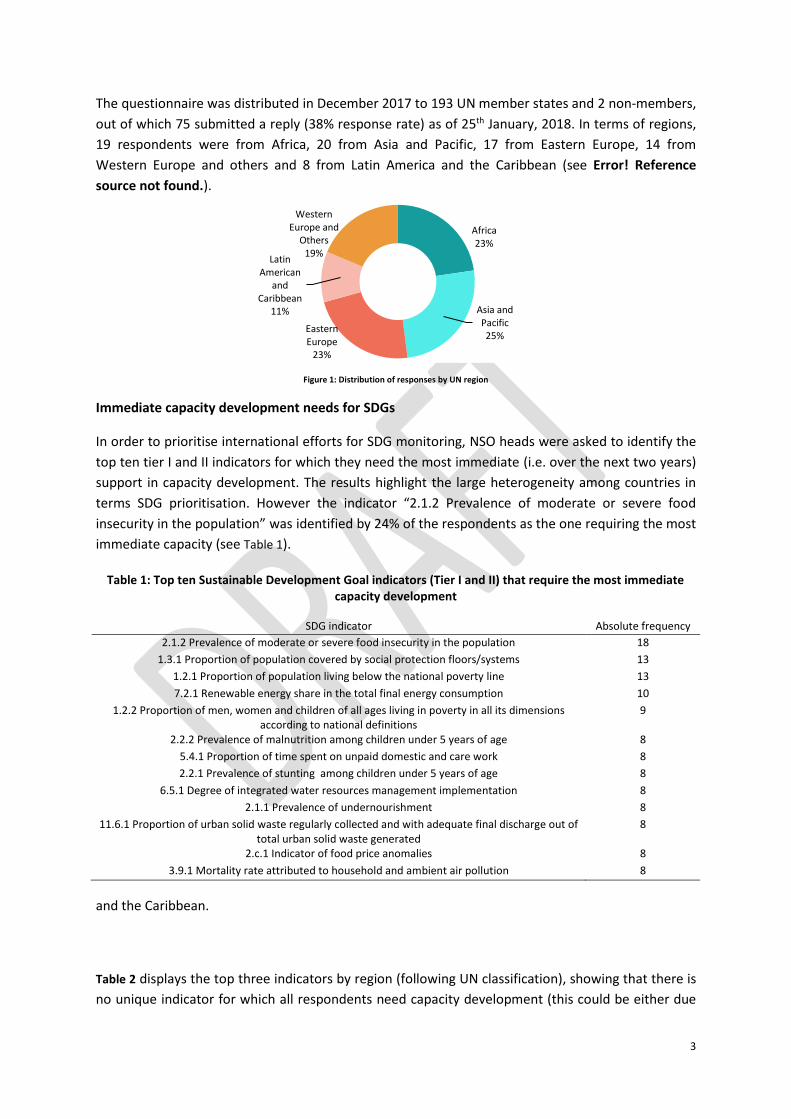
The questionnaire was distributed in December 2017 to 193 UN member states and 2 non-members,
out of which 75 submitted a reply (38% response rate) as of 25th January, 2018. In terms of regions,
19 respondents were from Africa, 20 from Asia and Pacific, 17 from Eastern Europe, 14 from
Western Europe and others and 8 from Latin America and the Caribbean (see Error! Reference
source not found.).
Figure 1: Distribution of responses by UN region
Immediate capacity development needs for SDGs
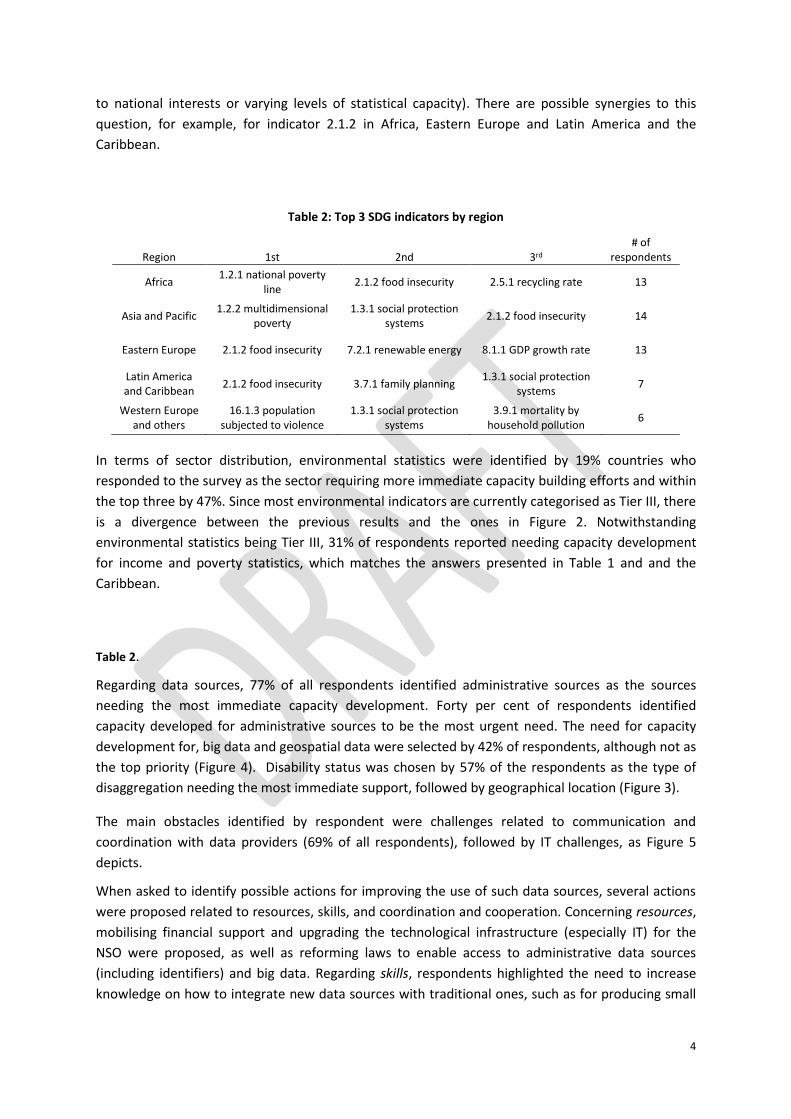
In order to prioritise international efforts for SDG monitoring, NSO heads were asked to identify the
top ten tier I and II indicators for which they need the most immediate (i.e. over the next two years)
support in capacity development. The results highlight the large heterogeneity among countries in
terms SDG prioritisation. However the indicator “2.1.2 Prevalence of moderate or severe food
insecurity in the population” was identified by 24% of the respondents as the one requiring the most
immediate capacity (see Table 1).
Table 1: Top ten Sustainable Development Goal indicators (Tier I and II) that require the most immediate capacity development
SDG indicator Absolute frequency
2.1.2 Prevalence of moderate or severe food insecurity in the population 18
1.3.1 Proportion of population covered by social protection floors/systems 13
1.2.1 Proportion of population living below the national poverty line 13
7.2.1 Renewable energy share in the total final energy consumption 10
1.2.2 Proportion of men, women and children of all ages living in poverty in all its dimensions according to national definitions
9
2.2.2 Prevalence of malnutrition among children under 5 years of age 8
5.4.1 Proportion of time spent on unpaid domestic and care work 8
2.2.1 Prevalence of stunting among children under 5 years of age 8
6.5.1 Degree of integrated water resources management implementation 8
2.1.1 Prevalence of undernourishment 8
11.6.1 Proportion of urban solid waste regularly collected and with adequate final discharge out of total urban solid waste generated
8
2.c.1 Indicator of food price anomalies 8
3.9.1 Mortality rate attributed to household and ambient air pollution 8
and the Caribbean.
Table 2 displays the top three indicators by region (following UN classification), showing that there is
no unique indicator for which all respondents need capacity development (this could be either due
Africa23%
Asia and Pacific25%
Eastern Europe
23%
Latin American
and Caribbean
11%
Western Europe and
Others19%
4
to national interests or varying levels of statistical capacity). There are possible synergies to this
question, for example, for indicator 2.1.2 in Africa, Eastern Europe and Latin America and the
Caribbean.
Table 2: Top 3 SDG indicators by region
Region 1st 2nd 3rd # of
respondents
Africa 1.2.1 national poverty
line 2.1.2 food insecurity 2.5.1 recycling rate 13
Asia and Pacific 1.2.2 multidimensional
poverty 1.3.1 social protection
systems 2.1.2 food insecurity 14
Eastern Europe 2.1.2 food insecurity 7.2.1 renewable energy 8.1.1 GDP growth rate 13
Latin America and Caribbean
2.1.2 food insecurity 3.7.1 family planning 1.3.1 social protection
systems 7
Western Europe and others
16.1.3 population subjected to violence
1.3.1 social protection systems
3.9.1 mortality by household pollution
6
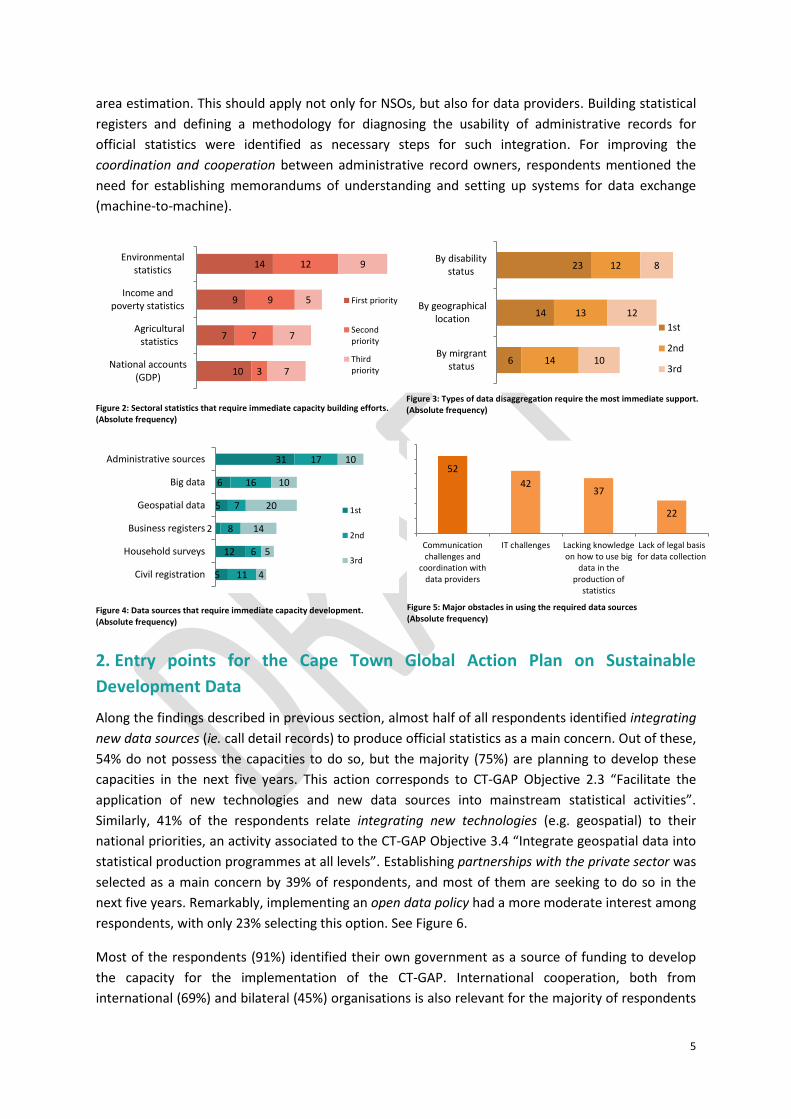
In terms of sector distribution, environmental statistics were identified by 19% countries who
responded to the survey as the sector requiring more immediate capacity building efforts and within
the top three by 47%. Since most environmental indicators are currently categorised as Tier III, there
is a divergence between the previous results and the ones in Figure 2. Notwithstanding
environmental statistics being Tier III, 31% of respondents reported needing capacity development
for income and poverty statistics, which matches the answers presented in Table 1 and and the
Caribbean.
Table 2.
Regarding data sources, 77% of all respondents identified administrative sources as the sources
needing the most immediate capacity development. Forty per cent of respondents identified
capacity developed for administrative sources to be the most urgent need. The need for capacity
development for, big data and geospatial data were selected by 42% of respondents, although not as
the top priority (Figure 4). Disability status was chosen by 57% of the respondents as the type of
disaggregation needing the most immediate support, followed by geographical location (Figure 3).
The main obstacles identified by respondent were challenges related to communication and
coordination with data providers (69% of all respondents), followed by IT challenges, as Figure 5
depicts.
When asked to identify possible actions for improving the use of such data sources, several actions
were proposed related to resources, skills, and coordination and cooperation. Concerning resources,
mobilising financial support and upgrading the technological infrastructure (especially IT) for the
NSO were proposed, as well as reforming laws to enable access to administrative data sources
(including identifiers) and big data. Regarding skills, respondents highlighted the need to increase
knowledge on how to integrate new data sources with traditional ones, such as for producing small
5
area estimation. This should apply not only for NSOs, but also for data providers. Building statistical
registers and defining a methodology for diagnosing the usability of administrative records for
official statistics were identified as necessary steps for such integration. For improving the
coordination and cooperation between administrative record owners, respondents mentioned the
need for establishing memorandums of understanding and setting up systems for data exchange
(machine-to-machine).
Figure 2: Sectoral statistics that require immediate capacity building efforts. (Absolute frequency)
Figure 3: Types of data disaggregation require the most immediate support. (Absolute frequency)
Figure 4: Data sources that require immediate capacity development. (Absolute frequency)
Figure 5: Major obstacles in using the required data sources (Absolute frequency)
2. Entry points for the Cape Town Global Action Plan on Sustainable
Development Data
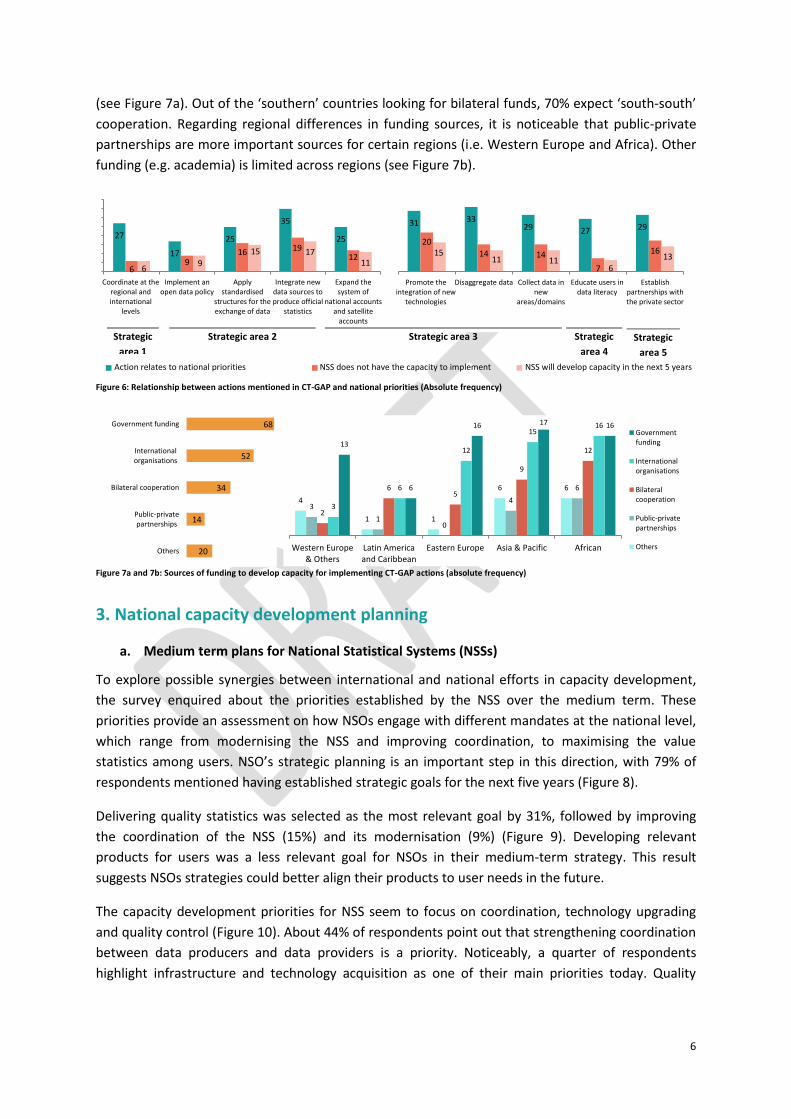
Along the findings described in previous section, almost half of all respondents identified integrating
new data sources (ie. call detail records) to produce official statistics as a main concern. Out of these,
54% do not possess the capacities to do so, but the majority (75%) are planning to develop these
capacities in the next five years. This action corresponds to CT-GAP Objective 2.3 “Facilitate the
application of new technologies and new data sources into mainstream statistical activities”.
Similarly, 41% of the respondents relate integrating new technologies (e.g. geospatial) to their
national priorities, an activity associated to the CT-GAP Objective 3.4 “Integrate geospatial data into
statistical production programmes at all levels”. Establishing partnerships with the private sector was
selected as a main concern by 39% of respondents, and most of them are seeking to do so in the
next five years. Remarkably, implementing an open data policy had a more moderate interest among
respondents, with only 23% selecting this option. See Figure 6.
Most of the respondents (91%) identified their own government as a source of funding to develop
the capacity for the implementation of the CT-GAP. International cooperation, both from
international (69%) and bilateral (45%) organisations is also relevant for the majority of respondents
10
7
9
14
3
7
9
12
7
7
5
9
National accounts(GDP)
Agriculturalstatistics
Income andpoverty statistics
Environmentalstatistics
First priority
Secondpriority
Thirdpriority
6
14
23
14
13
12
10
12
8
By mirgrantstatus
By geographicallocation
By disabilitystatus
1st
2nd
3rd
5
12
2
5
6
31
11
6
8
7
16
17
4
5
14
20
10
10
Civil registration
Household surveys
Business registers
Geospatial data
Big data
Administrative sources
1st
2nd
3rd
52
4237
22
Communicationchallenges and
coordination withdata providers
IT challenges Lacking knowledgeon how to use big
data in theproduction of
statistics
Lack of legal basisfor data collection
6
31 3329 27 29
20
14 14
7
161511 11
6
13
Promote theintegration of new
technologies
Disaggregate data Collect data innew
areas/domains
Educate users indata literacy
Establishpartnerships withthe private sector
Strategic
area 1
Strategic area 2 Strategic area 3 Strategic
area 4
Strategic
area 5
(see Figure 7a). Out of the ‘southern’ countries looking for bilateral funds, 70% expect ‘south-south’
cooperation. Regarding regional differences in funding sources, it is noticeable that public-private
partnerships are more important sources for certain regions (i.e. Western Europe and Africa). Other
funding (e.g. academia) is limited across regions (see Figure 7b).
Figure 6: Relationship between actions mentioned in CT-GAP and national priorities (Absolute frequency)
Figure 7a and 7b: Sources of funding to develop capacity for implementing CT-GAP actions (absolute frequency)
3. National capacity development planning
a. Medium term plans for National Statistical Systems (NSSs)
To explore possible synergies between international and national efforts in capacity development,
the survey enquired about the priorities established by the NSS over the medium term. These
priorities provide an assessment on how NSOs engage with different mandates at the national level,
which range from modernising the NSS and improving coordination, to maximising the value
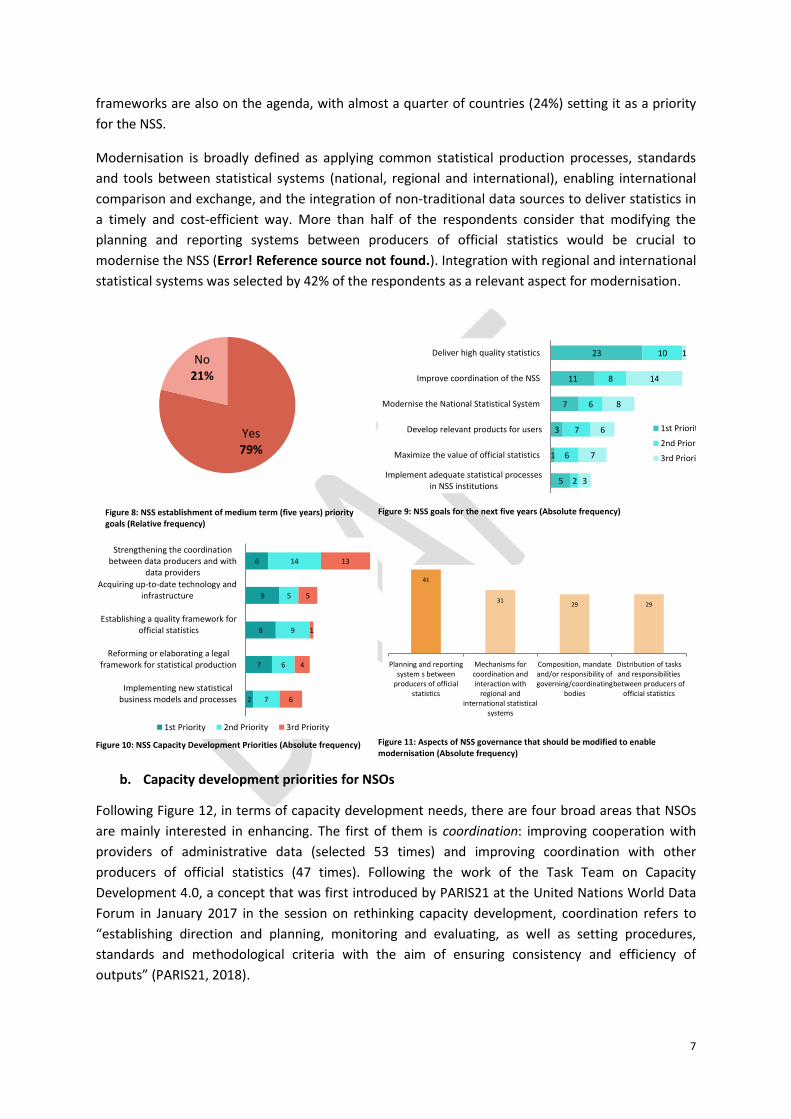
statistics among users. NSO’s strategic planning is an important step in this direction, with 79% of
respondents mentioned having established strategic goals for the next five years (Figure 8).
Delivering quality statistics was selected as the most relevant goal by 31%, followed by improving
the coordination of the NSS (15%) and its modernisation (9%) (Figure 9). Developing relevant
products for users was a less relevant goal for NSOs in their medium-term strategy. This result
suggests NSOs strategies could better align their products to user needs in the future.
The capacity development priorities for NSS seem to focus on coordination, technology upgrading
and quality control (Figure 10). About 44% of respondents point out that strengthening coordination
between data producers and data providers is a priority. Noticeably, a quarter of respondents
highlight infrastructure and technology acquisition as one of their main priorities today. Quality
27
17
25
35
25
69
16 1912
69
15 1711
Coordinate at theregional andinternational
levels
Implement anopen data policy
Applystandardised
structures for theexchange of data
Integrate newdata sources toproduce official
statistics
Expand thesystem of
national accountsand satellite
accounts
68
52
34
14
20
Government funding
Internationalorganisations
Bilateral cooperation
Public-privatepartnerships
Others
161716
6
13
1615
12
6
3
12
9
56
2
6
4
01
3
66
11
4
AfricanAsia & PacificEastern EuropeLatin Americaand Caribbean
Western Europe& Others
Governmentfunding
Internationalorganisations
Bilateralcooperation
Public-privatepartnerships
Others
Action relates to national priorities NSS does not have the capacity to implement NSS will develop capacity in the next 5 years
7
frameworks are also on the agenda, with almost a quarter of countries (24%) setting it as a priority
for the NSS.
Modernisation is broadly defined as applying common statistical production processes, standards
and tools between statistical systems (national, regional and international), enabling international
comparison and exchange, and the integration of non-traditional data sources to deliver statistics in
a timely and cost-efficient way. More than half of the respondents consider that modifying the
planning and reporting systems between producers of official statistics would be crucial to
modernise the NSS (Error! Reference source not found.). Integration with regional and international
statistical systems was selected by 42% of the respondents as a relevant aspect for modernisation.
Figure 8: NSS establishment of medium term (five years) priority goals (Relative frequency)
Figure 9: NSS goals for the next five years (Absolute frequency)
Figure 10: NSS Capacity Development Priorities (Absolute frequency)
Figure 11: Aspects of NSS governance that should be modified to enable modernisation (Absolute frequency)
b. Capacity development priorities for NSOs
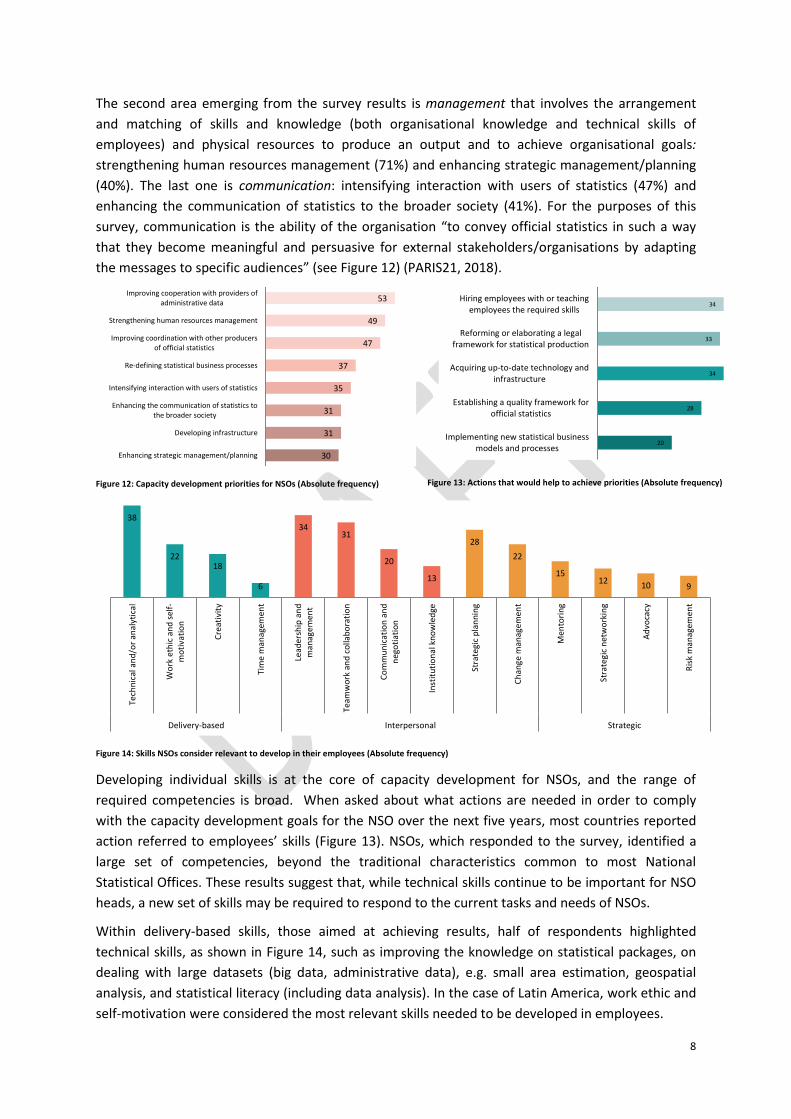
Following Figure 12, in terms of capacity development needs, there are four broad areas that NSOs
are mainly interested in enhancing. The first of them is coordination: improving cooperation with
providers of administrative data (selected 53 times) and improving coordination with other
producers of official statistics (47 times). Following the work of the Task Team on Capacity
Development 4.0, a concept that was first introduced by PARIS21 at the United Nations World Data
Forum in January 2017 in the session on rethinking capacity development, coordination refers to
“establishing direction and planning, monitoring and evaluating, as well as setting procedures,
standards and methodological criteria with the aim of ensuring consistency and efficiency of
outputs” (PARIS21, 2018).
Yes79%
No21%
5
1
3
7
11
23
2
6
7
6
8
10
3
7
6
8
14
1
Implement adequate statistical processesin NSS institutions
Maximize the value of official statistics
Develop relevant products for users
Modernise the National Statistical System
Improve coordination of the NSS
Deliver high quality statistics
1st Priority
2nd Priority
3rd Priority
2
7
8
9
6
7
6
9
5
14
6
4
1
5
13
Implementing new statisticalbusiness models and processes
Reforming or elaborating a legalframework for statistical production
Establishing a quality framework forofficial statistics
Acquiring up-to-date technology andinfrastructure
Strengthening the coordinationbetween data producers and with
data providers
1st Priority 2nd Priority 3rd Priority
41
3129 29
Planning and reportingsystem s between
producers of officialstatistics
Mechanisms forcoordination andinteraction with
regional andinternational statistical
systems
Composition, mandateand/or responsibility ofgoverning/coordinating
bodies
Distribution of tasksand responsibilities
between producers ofofficial statistics
8
The second area emerging from the survey results is management that involves the arrangement
and matching of skills and knowledge (both organisational knowledge and technical skills of
employees) and physical resources to produce an output and to achieve organisational goals:
strengthening human resources management (71%) and enhancing strategic management/planning
(40%). The last one is communication: intensifying interaction with users of statistics (47%) and
enhancing the communication of statistics to the broader society (41%). For the purposes of this
survey, communication is the ability of the organisation “to convey official statistics in such a way
that they become meaningful and persuasive for external stakeholders/organisations by adapting
the messages to specific audiences” (see Figure 12) (PARIS21, 2018).
Figure 12: Capacity development priorities for NSOs (Absolute frequency)
Figure 13: Actions that would help to achieve priorities (Absolute frequency)
Figure 14: Skills NSOs consider relevant to develop in their employees (Absolute frequency)
Developing individual skills is at the core of capacity development for NSOs, and the range of
required competencies is broad. When asked about what actions are needed in order to comply
with the capacity development goals for the NSO over the next five years, most countries reported
action referred to employees’ skills (Figure 13). NSOs, which responded to the survey, identified a
large set of competencies, beyond the traditional characteristics common to most National
Statistical Offices. These results suggest that, while technical skills continue to be important for NSO
heads, a new set of skills may be required to respond to the current tasks and needs of NSOs.
Within delivery-based skills, those aimed at achieving results, half of respondents highlighted
technical skills, as shown in Figure 14, such as improving the knowledge on statistical packages, on
dealing with large datasets (big data, administrative data), e.g. small area estimation, geospatial
analysis, and statistical literacy (including data analysis). In the case of Latin America, work ethic and
self-motivation were considered the most relevant skills needed to be developed in employees.
30
31
31
35
37
47
49
53
Enhancing strategic management/planning
Developing infrastructure
Enhancing the communication of statistics tothe broader society
Intensifying interaction with users of statistics
Re-defining statistical business processes
Improving coordination with other producersof official statistics
Strengthening human resources management
Improving cooperation with providers ofadministrative data
20
28
34
33
34
Implementing new statistical businessmodels and processes
Establishing a quality framework forofficial statistics
Acquiring up-to-date technology andinfrastructure
Reforming or elaborating a legalframework for statistical production
Hiring employees with or teachingemployees the required skills
38
2218
6
3431
20
13
28
22
1512
10 9
Tech
nic
al a
nd
/or
anal
ytic
al
Wo
rk e
thic
an
d s
elf-
mo
tiva
tio
n
Cre
ativ
ity
Tim
e m
anag
emen
t
Lead
ersh
ip a
nd
man
agem
ent
Team
wo
rk a
nd
co
llab
ora
tio
n
Co
mm
un
icat
ion
an
dn
ego
tiat
ion
Inst
itu
tio
nal
kn
ow
led
ge
Stra
tegi
c p
lan
nin
g
Ch
ange
man
agem
ent
Men
tori
ng
Stra
tegi
c n
etw
ork
ing
Ad
voca
cy
Ris
k m
anag
emen
t
Delivery-based Interpersonal Strategic
9
Regarding interpersonal skills, many countries (45%) identified leadership1 and management skills as
relevant to their organisation. Teamwork and collaboration, this is, the ability of a group to work
effectively with common values and norms, are also relevant, with 41% of countries identifying them
as important for their employees’ profile. Remarkably, for Western European countries, teamwork,
together with communication and negotiation are the most relevant interpersonal capacities to
develop in the staff.
Concerning strategic competencies, ‘strategic planning’ is one of the most sought after
characteristics (37% of respondents). It refers to the process by which the organisation defines a
vision, which is followed by a sequence of steps to achieve the vision. In the case of Western Europe
and others, change management topped the list of strategic capacities. Finally, it is also noticeable
that NSOs do not identify advocacy (13%) and risk management skills (12%) as essential to their
organisation. This may reflect NSO Heads do not identify these activities as central to the work of
statistical agencies.
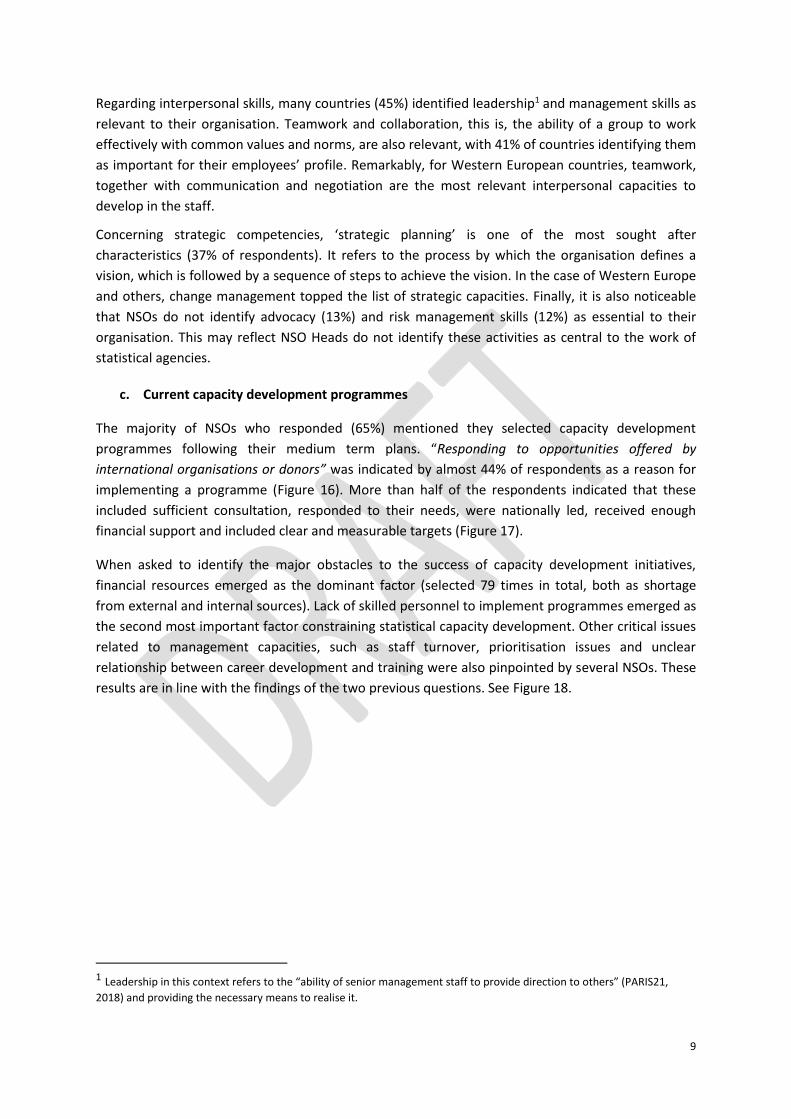
c. Current capacity development programmes
The majority of NSOs who responded (65%) mentioned they selected capacity development
programmes following their medium term plans. “Responding to opportunities offered by
international organisations or donors” was indicated by almost 44% of respondents as a reason for
implementing a programme (Figure 16). More than half of the respondents indicated that these
included sufficient consultation, responded to their needs, were nationally led, received enough
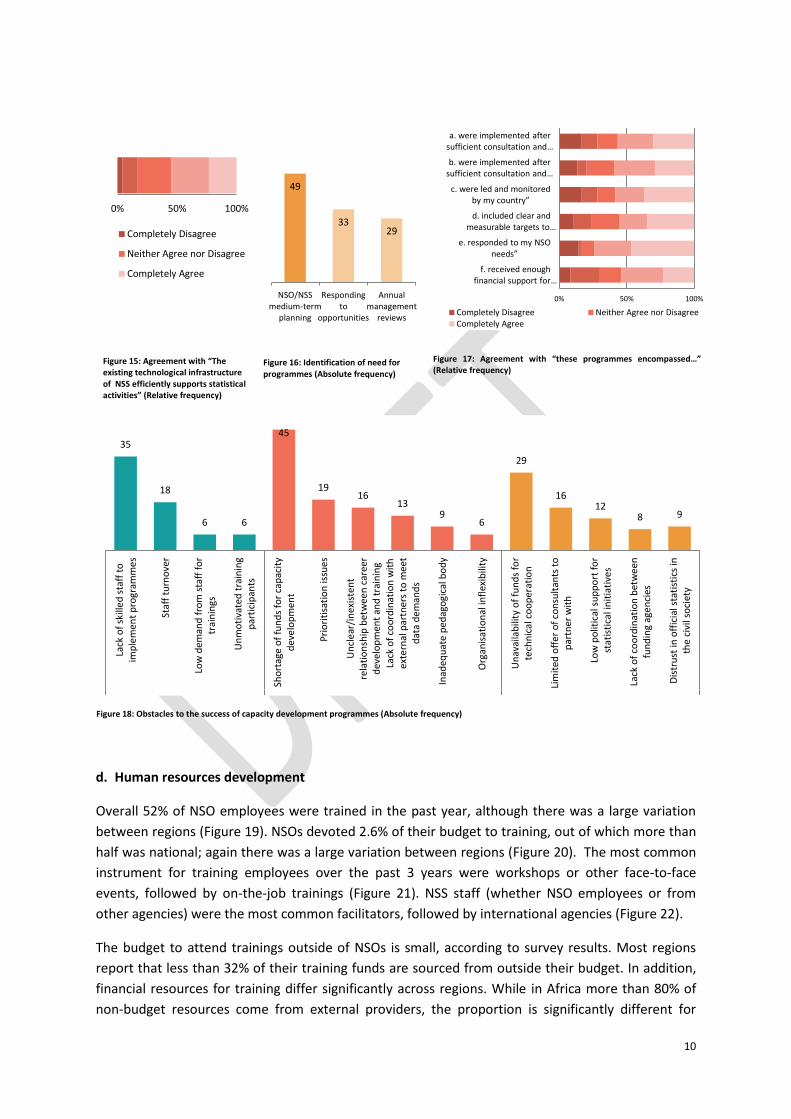
financial support and included clear and measurable targets (Figure 17).
When asked to identify the major obstacles to the success of capacity development initiatives,
financial resources emerged as the dominant factor (selected 79 times in total, both as shortage
from external and internal sources). Lack of skilled personnel to implement programmes emerged as
the second most important factor constraining statistical capacity development. Other critical issues
related to management capacities, such as staff turnover, prioritisation issues and unclear
relationship between career development and training were also pinpointed by several NSOs. These
results are in line with the findings of the two previous questions. See Figure 18.
1 Leadership in this context refers to the “ability of senior management staff to provide direction to others” (PARIS21,
2018) and providing the necessary means to realise it.
10
Figure 15: Agreement with “The existing technological infrastructure of NSS efficiently supports statistical activities” (Relative frequency)
Figure 16: Identification of need for programmes (Absolute frequency)
Figure 17: Agreement with “these programmes encompassed…” (Relative frequency)
Figure 18: Obstacles to the success of capacity development programmes (Absolute frequency)
d. Human resources development
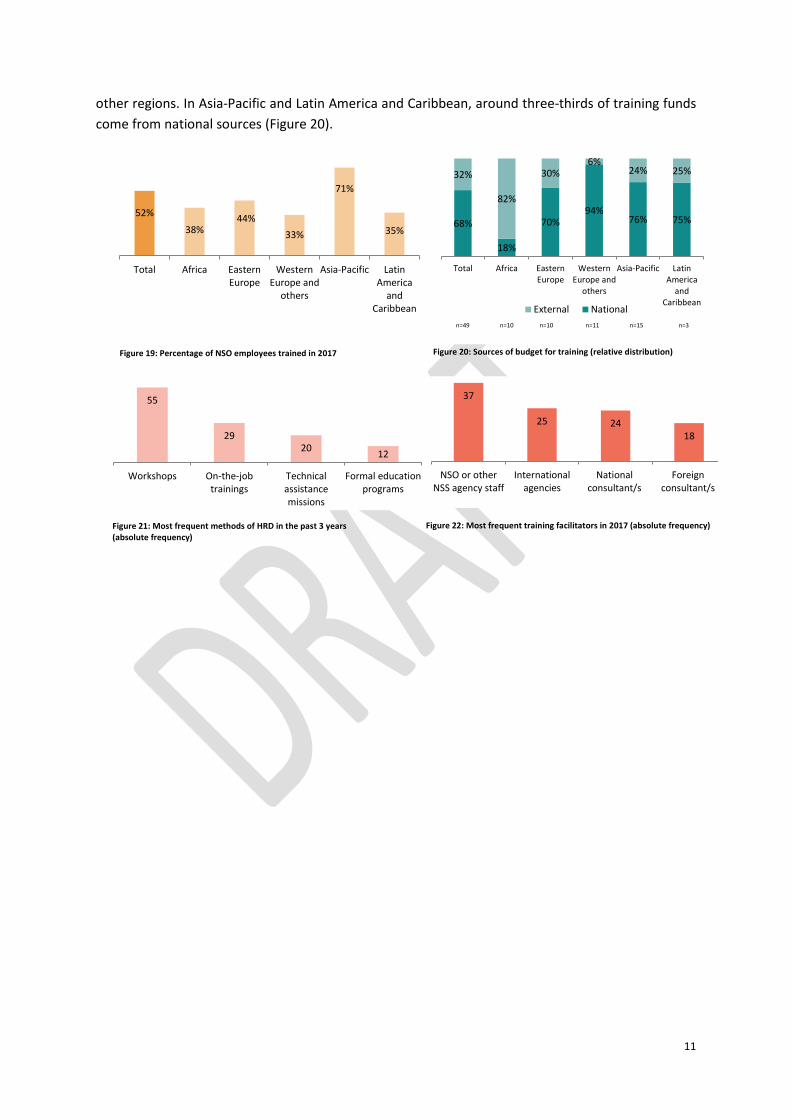
Overall 52% of NSO employees were trained in the past year, although there was a large variation
between regions (Figure 19). NSOs devoted 2.6% of their budget to training, out of which more than
half was national; again there was a large variation between regions (Figure 20). The most common
instrument for training employees over the past 3 years were workshops or other face-to-face
events, followed by on-the-job trainings (Figure 21). NSS staff (whether NSO employees or from
other agencies) were the most common facilitators, followed by international agencies (Figure 22).
The budget to attend trainings outside of NSOs is small, according to survey results. Most regions
report that less than 32% of their training funds are sourced from outside their budget. In addition,
financial resources for training differ significantly across regions. While in Africa more than 80% of
non-budget resources come from external providers, the proportion is significantly different for
0% 50% 100%
Completely Disagree
Neither Agree nor Disagree
Completely Agree
49
3329
NSO/NSSmedium-term
planning
Respondingto
opportunities
Annualmanagement
reviews
0% 50% 100%
a. were implemented after sufficient consultation and …
b. were implemented after sufficient consultation and …
c. were led and monitored by my country”
d. included clear and measurable targets to …
e. responded to my NSO needs”
f. received enough financial support for …
Completely Disagree Neither Agree nor DisagreeCompletely Agree
35
18
6 6
45
1916
139
6
29
1612
8 9
Lack
of
skill
ed
sta
ff t
oim
ple
men
t p
rogr
amm
es
Staf
f tu
rno
ver
Low
dem
and
fro
m s
taff
fo
rtr
ain
ings
Un
mo
tiva
ted
tra
inin
gp
arti
cip
ants
Sho
rtag
e o
f fu
nd
s fo
r ca
pac
ity
dev
elo
pm
ent
Pri
ori
tisa
tio
n is
sues
Un
cle
ar/i
nex
iste
nt
rela
tio
nsh
ip b
etw
een
car
eer
dev
elo
pm
ent
and
tra
inin
g
Lack
of
coo
rdin
atio
n w
ith
exte
rnal
par
tner
s to
mee
td
ata
de
man
ds
Inad
equ
ate
ped
ago
gica
l bo
dy
Org
anis
atio
nal
infl
exib
ility
Un
avai
lab
ility
of
fun
ds
for
tech
nic
al c
oo
per
atio
n
Lim
ited
off
er
of
con
sult
ants
to
par
tner
wit
h
Low
po
litic
al s
up
po
rt f
or
stat
isti
cal i
nit
iati
ves
Lack
of
coo
rdin
atio
n b
etw
een
fun
din
g ag
enci
es
Dis
tru
st in
off
icia
l sta
tist
ics
inth
e c
ivil
soci
ety
Individual Organisational External
11
other regions. In Asia-Pacific and Latin America and Caribbean, around three-thirds of training funds
come from national sources (Figure 20).
Figure 19: Percentage of NSO employees trained in 2017
Figure 20: Sources of budget for training (relative distribution)
Figure 21: Most frequent methods of HRD in the past 3 years (absolute frequency)
Figure 22: Most frequent training facilitators in 2017 (absolute frequency)
52%
38%44%
33%
71%
35%
Total Africa EasternEurope
WesternEurope and
others
Asia-Pacific LatinAmerica
andCaribbean
68%
18%
70%94%
76% 75%
32%
82%
30%6%
24% 25%
Total Africa EasternEurope
WesternEurope and
others
Asia-Pacific LatinAmerica
andCaribbean
External National
n=49 n=10 n=10 n=11 n=15 n=3
55
2920
12
Workshops On-the-jobtrainings
Technicalassistancemissions
Formal educationprograms
37
25 2418
NSO or otherNSS agency staff
Internationalagencies
Nationalconsultant/s
Foreignconsultant/s
12
References:
DESA. (2018). 2017 Voluntary National Reviews Synthesis Report (Rep.). Retrieved from
https://sustainabledevelopment.un.org/content/documents/17109Synthesis_Report_VNRs_2017.p
df.
FAO. (2017, September 4th) Snapshot of Status and Technical Assistance Needs for SDG Monitoring
related to Food and Agriculture sector in the Asia-Pacific region [PowerPoint Presentation] Retrieved
from: http://www.fao.org/asiapacific/events/detail-events/en/c/1439/
UN ECLAC. (2017, January 15th). Institutional Architecture and National Statistical Capacities for the
Production of the Sustainable Development Goals Indicators [PowerPoint Presentation]. Retrieved
from: https://undataforum.org/WorldDataForum/wp-
content/uploads/2017/01/TA1.05_Gerstenfeld.Gerstenfeld-Presentation-WDF-Cooperation-Track-
2017.pdf
UNDP (2009) Capacity Development: a UNDP primer. Retrieved from:
http://www.undp.org/content/dam/aplaws/publication/en/publications/capacity-
development/capacity-development-a-undp-primer/CDG_PrimerReport_final_web.pdf
UNECE. (2017, April) Findings from Survey on NSOs’ strategies and plans related to statistics for
SDGs. [PowerPoint Presentation]. Retrieved from:
https://www.unece.org/fileadmin/DAM/stats/documents/ece/ces/ge.32/2017/mtg1/PDF/EN_EM_1
C1-UNECE-Results_of_Survey_on_NSOs.pdf
UNSD. (2016). Report of the 2015 Big Data Survey (Rep.). Retrieved from
https://unstats.un.org/unsd/statcom/47th-session/documents/BG-2016-6-Report-of-the-2015-Big-
Data-Survey-E.pdf.
OECD. (2014). Competency Framework. OECD Careers. Retrieved from
https://www.oecd.org/careers/competency_framework_en.pdf
OIC/SERIC. (2017) Results of the Tendency Survey on SDG Priorities of OIC Member Countries (Rep.).
Ankara. Retrieved from http://www.comcec.org/en/wp-content/uploads/2017/11/33-IS-SDG-TEND-
v2.pdf
PARIS21 (2018). Framework for Statistical Capacity Development 4.0. Manuscript in preparation.